Rutland, IA Map & Demographics
Rutland Map
Rutland Overview
$35,013
PER CAPITA INCOME
$80,441
AVG FAMILY INCOME
$78,333
AVG HOUSEHOLD INCOME
0.32
INEQUALITY / GINI INDEX
127
TOTAL POPULATION
52
MALE POPULATION
75
FEMALE POPULATION
69.33
MALES / 100 FEMALES
144.23
FEMALES / 100 MALES
33.5
MEDIAN AGE
2.2
AVG FAMILY SIZE
1.9
AVG HOUSEHOLD SIZE
78
LABOR FORCE [ PEOPLE ]
74.3%
PERCENT IN LABOR FORCE
1.3%
UNEMPLOYMENT RATE
Rutland Zip Codes
Rutland Area Codes
Income in Rutland
Income Overview in Rutland
Per Capita Income in Rutland is $35,013, while median incomes of families and households are $80,441 and $78,333 respectively.
| Characteristic | Number | Measure |
| Per Capita Income | 127 | $35,013 |
| Median Family Income | 46 | $80,441 |
| Mean Family Income | 46 | $74,198 |
| Median Household Income | 66 | $78,333 |
| Mean Household Income | 66 | $70,352 |
| Income Deficit | 46 | $0 |
| Wage / Income Gap (%) | 127 | 0.00% |
| Wage / Income Gap ($) | 127 | 100.00¢ per $1 |
| Gini / Inequality Index | 127 | 0.32 |
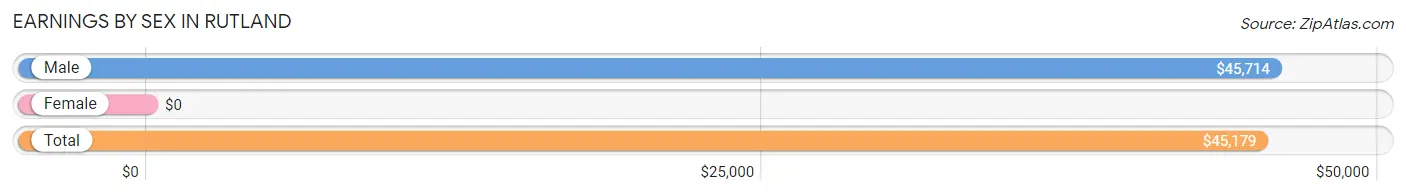
Earnings by Sex in Rutland
| Sex | Number | Average Earnings |
| Male | 36 (45.6%) | $45,714 |
| Female | 43 (54.4%) | $0 |
| Total | 79 (100.0%) | $45,179 |
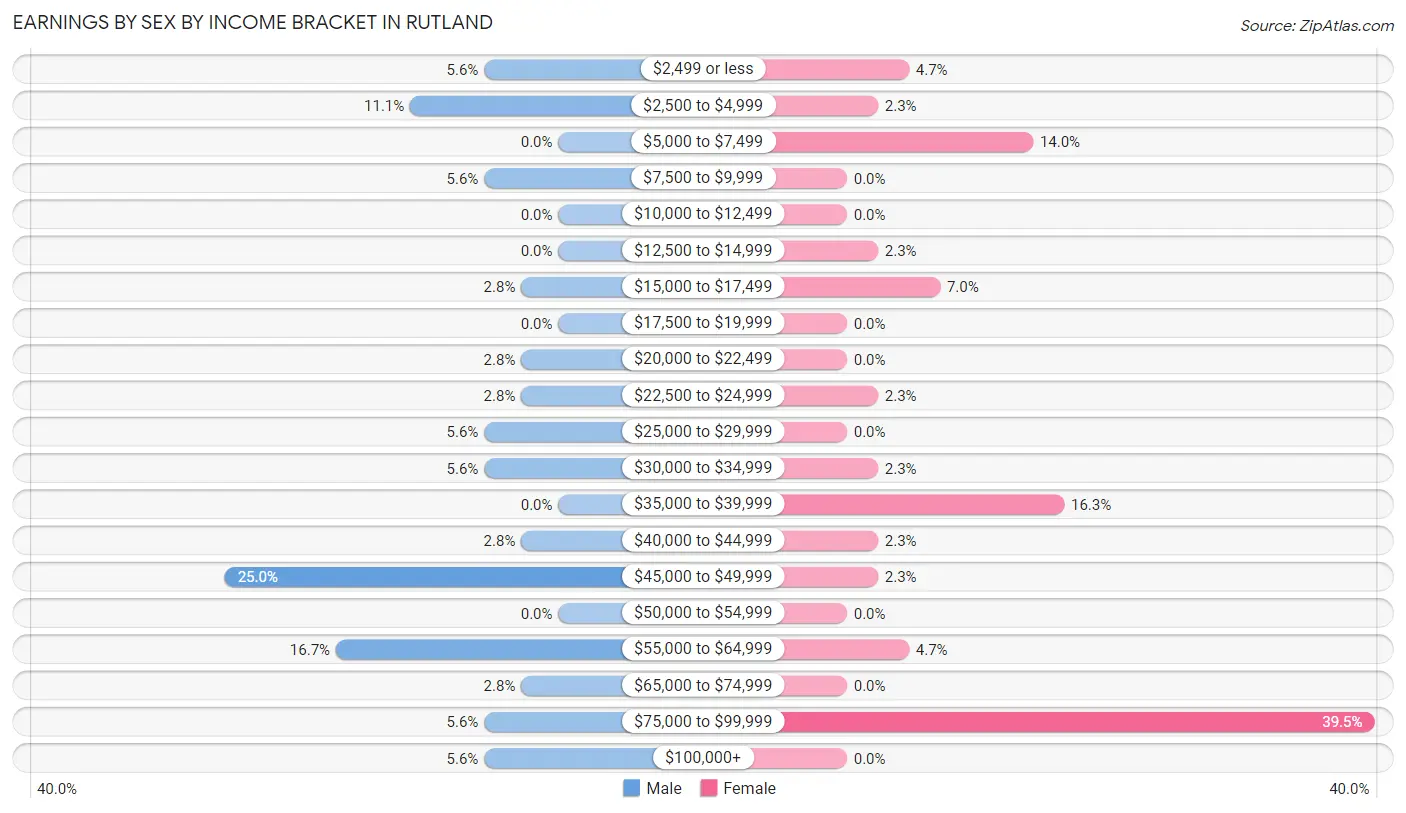
Earnings by Sex by Income Bracket in Rutland
The most common earnings brackets in Rutland are $45,000 to $49,999 for men (9 | 25.0%) and $75,000 to $99,999 for women (17 | 39.5%).
| Income | Male | Female |
| $2,499 or less | 2 (5.6%) | 2 (4.6%) |
| $2,500 to $4,999 | 4 (11.1%) | 1 (2.3%) |
| $5,000 to $7,499 | 0 (0.0%) | 6 (14.0%) |
| $7,500 to $9,999 | 2 (5.6%) | 0 (0.0%) |
| $10,000 to $12,499 | 0 (0.0%) | 0 (0.0%) |
| $12,500 to $14,999 | 0 (0.0%) | 1 (2.3%) |
| $15,000 to $17,499 | 1 (2.8%) | 3 (7.0%) |
| $17,500 to $19,999 | 0 (0.0%) | 0 (0.0%) |
| $20,000 to $22,499 | 1 (2.8%) | 0 (0.0%) |
| $22,500 to $24,999 | 1 (2.8%) | 1 (2.3%) |
| $25,000 to $29,999 | 2 (5.6%) | 0 (0.0%) |
| $30,000 to $34,999 | 2 (5.6%) | 1 (2.3%) |
| $35,000 to $39,999 | 0 (0.0%) | 7 (16.3%) |
| $40,000 to $44,999 | 1 (2.8%) | 1 (2.3%) |
| $45,000 to $49,999 | 9 (25.0%) | 1 (2.3%) |
| $50,000 to $54,999 | 0 (0.0%) | 0 (0.0%) |
| $55,000 to $64,999 | 6 (16.7%) | 2 (4.6%) |
| $65,000 to $74,999 | 1 (2.8%) | 0 (0.0%) |
| $75,000 to $99,999 | 2 (5.6%) | 17 (39.5%) |
| $100,000+ | 2 (5.6%) | 0 (0.0%) |
| Total | 36 (100.0%) | 43 (100.0%) |
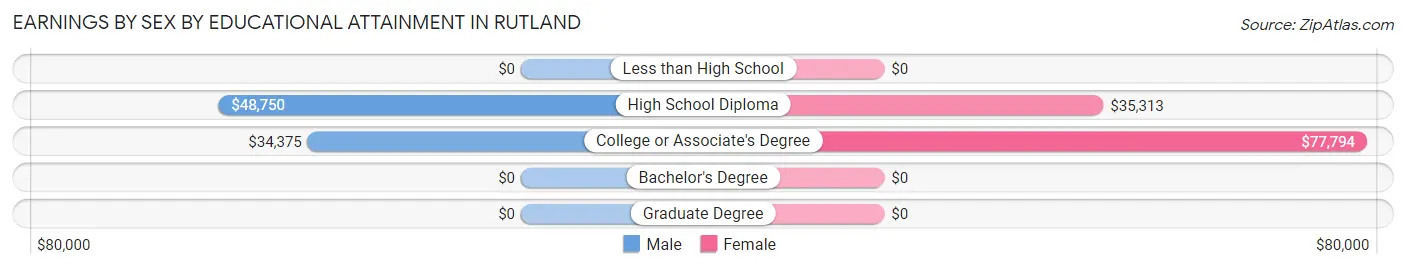
Earnings by Sex by Educational Attainment in Rutland
| Educational Attainment | Male Income | Female Income |
| Less than High School | - | - |
| High School Diploma | $48,750 | $35,313 |
| College or Associate's Degree | $34,375 | $77,794 |
| Bachelor's Degree | - | - |
| Graduate Degree | - | - |
| Total | $47,321 | $0 |
Family Income in Rutland
Family Income Brackets in Rutland
According to the Rutland family income data, there are 26 families falling into the $75,000 to $99,999 income range, which is the most common income bracket and makes up 56.5% of all families.
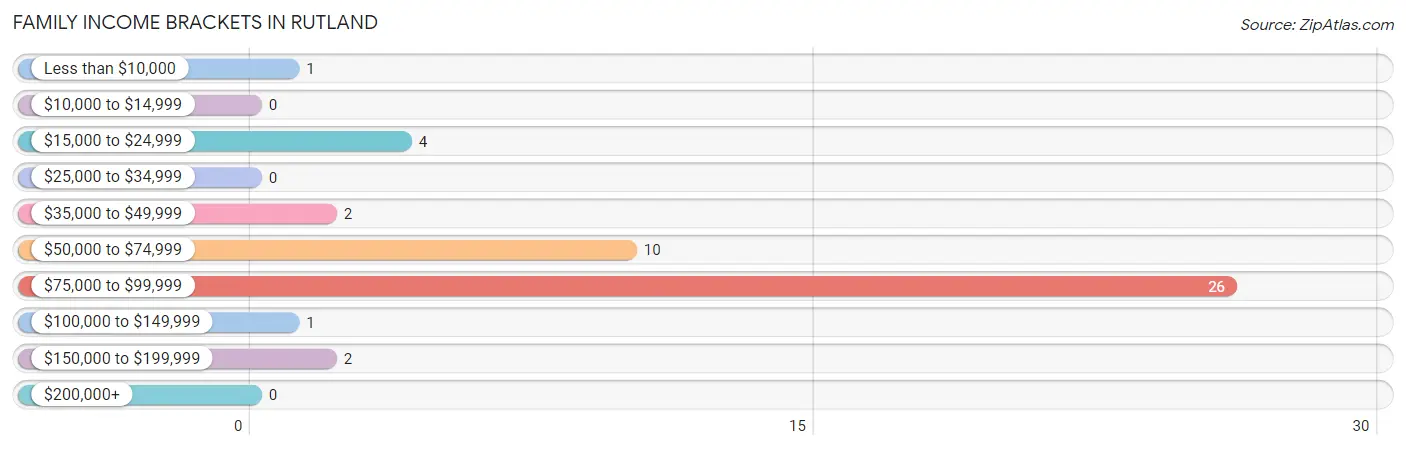
| Income Bracket | # Families | % Families |
| Less than $10,000 | 1 | 2.2% |
| $10,000 to $14,999 | 0 | 0.0% |
| $15,000 to $24,999 | 4 | 8.7% |
| $25,000 to $34,999 | 0 | 0.0% |
| $35,000 to $49,999 | 2 | 4.3% |
| $50,000 to $74,999 | 10 | 21.7% |
| $75,000 to $99,999 | 26 | 56.5% |
| $100,000 to $149,999 | 1 | 2.2% |
| $150,000 to $199,999 | 2 | 4.3% |
| $200,000+ | 0 | 0.0% |
Family Income by Famaliy Size in Rutland
2-person families (37 | 80.4%) account for the highest median family income in Rutland with $80,662 per family, while 2-person families (37 | 80.4%) have the highest median income of $40,331 per family member.
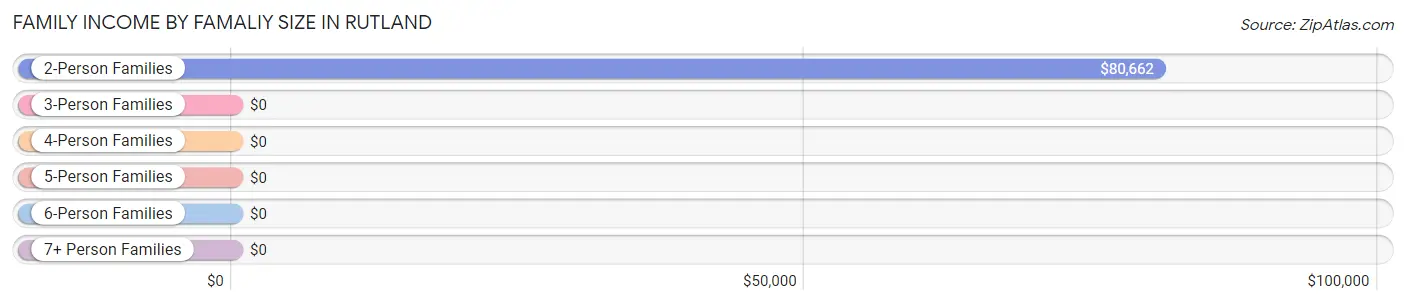
| Income Bracket | # Families | Median Income |
| 2-Person Families | 37 (80.4%) | $80,662 |
| 3-Person Families | 1 (2.2%) | $0 |
| 4-Person Families | 6 (13.0%) | $0 |
| 5-Person Families | 0 (0.0%) | $0 |
| 6-Person Families | 2 (4.3%) | $0 |
| 7+ Person Families | 0 (0.0%) | $0 |
| Total | 46 (100.0%) | $80,441 |
Family Income by Number of Earners in Rutland
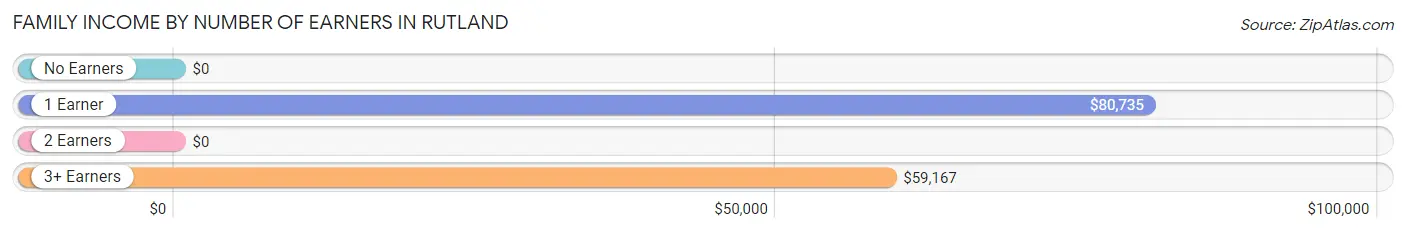
| Number of Earners | # Families | Median Income |
| No Earners | 2 (4.3%) | $0 |
| 1 Earner | 26 (56.5%) | $80,735 |
| 2 Earners | 10 (21.7%) | $0 |
| 3+ Earners | 8 (17.4%) | $59,167 |
| Total | 46 (100.0%) | $80,441 |
Household Income in Rutland
Household Income Brackets in Rutland
With 29 households falling in the category, the $75,000 to $99,999 income range is the most frequent in Rutland, accounting for 43.9% of all households.
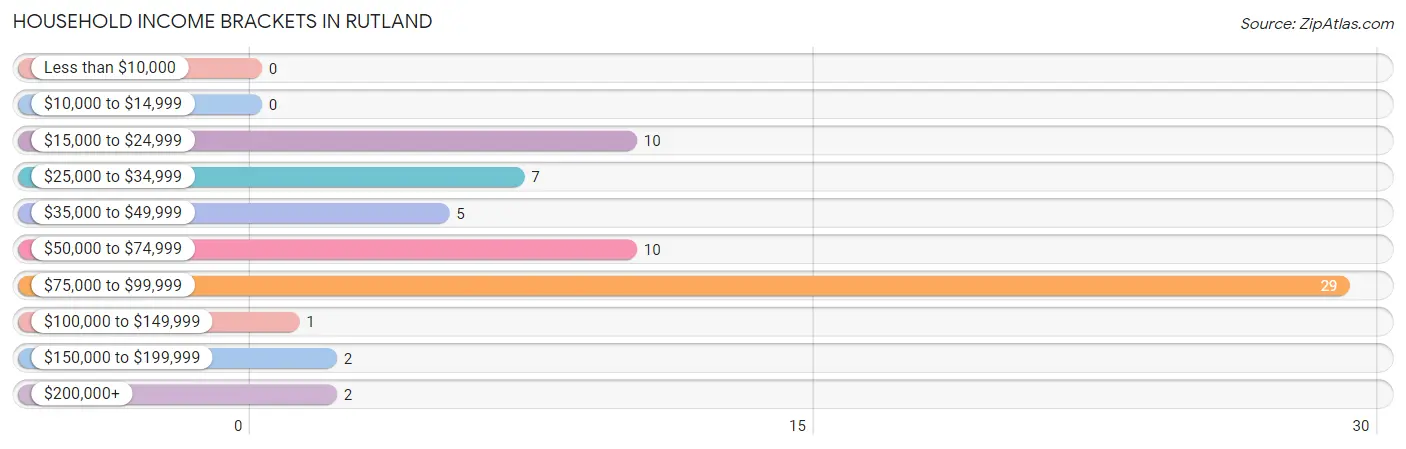
| Income Bracket | # Households | % Households |
| Less than $10,000 | 0 | 0.0% |
| $10,000 to $14,999 | 0 | 0.0% |
| $15,000 to $24,999 | 10 | 15.2% |
| $25,000 to $34,999 | 7 | 10.6% |
| $35,000 to $49,999 | 5 | 7.6% |
| $50,000 to $74,999 | 10 | 15.2% |
| $75,000 to $99,999 | 29 | 43.9% |
| $100,000 to $149,999 | 1 | 1.5% |
| $150,000 to $199,999 | 2 | 3.0% |
| $200,000+ | 2 | 3.0% |
Household Income by Householder Age in Rutland
The median household income in Rutland is $78,333, with the highest median household income of $81,250 found in the 25 to 44 years age bracket for the primary householder. A total of 25 households (37.9%) fall into this category.
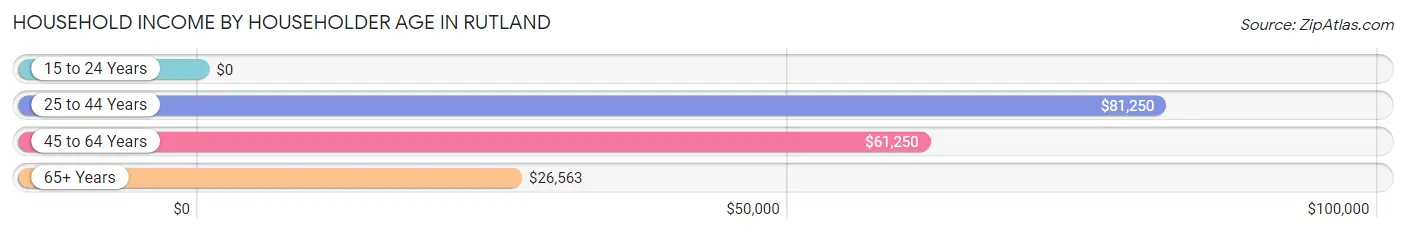
| Income Bracket | # Households | Median Income |
| 15 to 24 Years | 0 (0.0%) | $0 |
| 25 to 44 Years | 25 (37.9%) | $81,250 |
| 45 to 64 Years | 22 (33.3%) | $61,250 |
| 65+ Years | 19 (28.8%) | $26,563 |
| Total | 66 (100.0%) | $78,333 |
Poverty in Rutland
Income Below Poverty by Sex and Age in Rutland
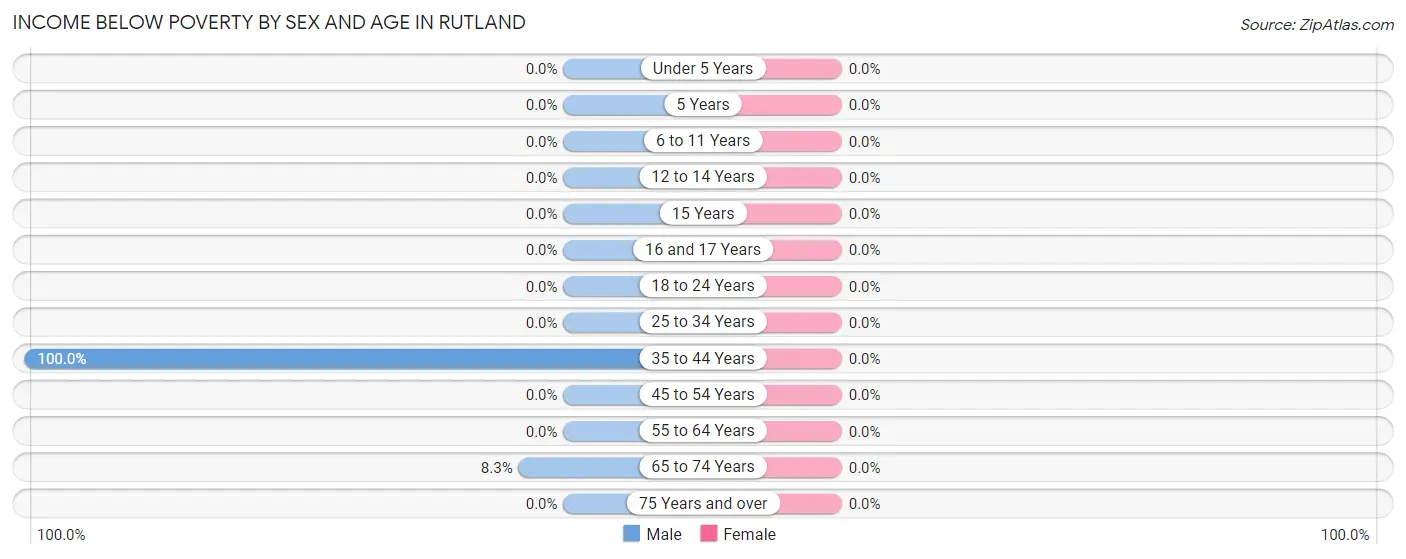
| Age Bracket | Male | Female |
| Under 5 Years | 0 (0.0%) | 0 (0.0%) |
| 5 Years | 0 (0.0%) | 0 (0.0%) |
| 6 to 11 Years | 0 (0.0%) | 0 (0.0%) |
| 12 to 14 Years | 0 (0.0%) | 0 (0.0%) |
| 15 Years | 0 (0.0%) | 0 (0.0%) |
| 16 and 17 Years | 0 (0.0%) | 0 (0.0%) |
| 18 to 24 Years | 0 (0.0%) | 0 (0.0%) |
| 25 to 34 Years | 0 (0.0%) | 0 (0.0%) |
| 35 to 44 Years | 1 (100.0%) | 0 (0.0%) |
| 45 to 54 Years | 0 (0.0%) | 0 (0.0%) |
| 55 to 64 Years | 0 (0.0%) | 0 (0.0%) |
| 65 to 74 Years | 1 (8.3%) | 0 (0.0%) |
| 75 Years and over | 0 (0.0%) | 0 (0.0%) |
| Total | 2 (3.8%) | 0 (0.0%) |
Income Above Poverty by Sex and Age in Rutland
According to the poverty statistics in Rutland, males aged under 5 years and females aged under 5 years are the age groups that are most secure financially, with 100.0% of males and 100.0% of females in these age groups living above the poverty line.
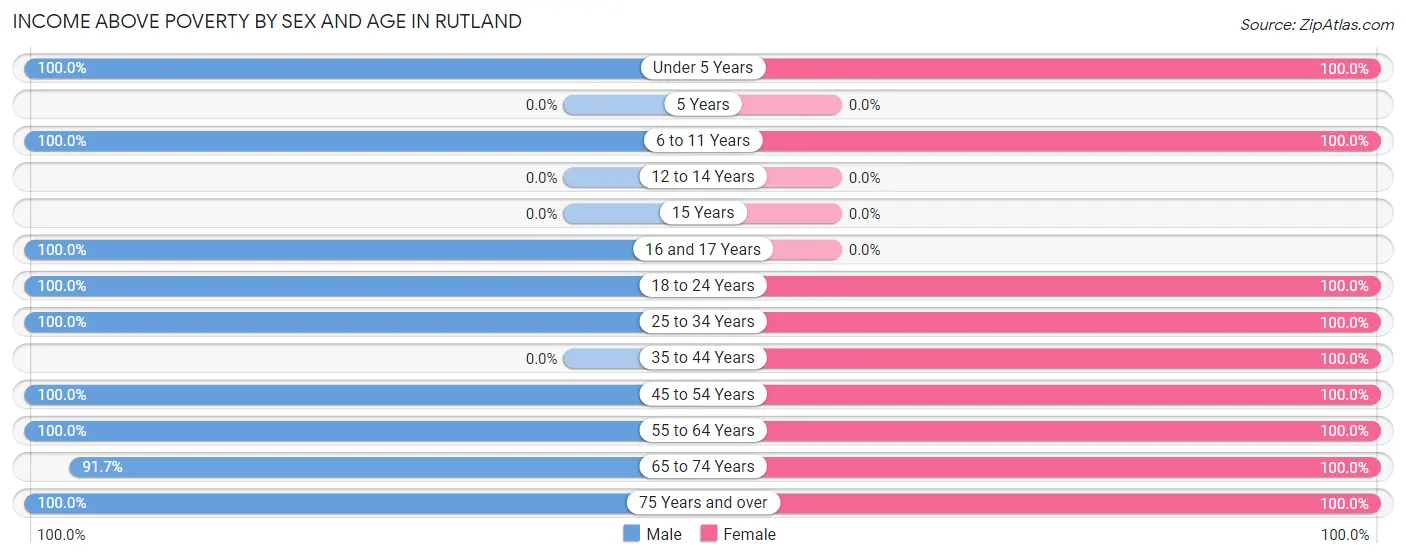
| Age Bracket | Male | Female |
| Under 5 Years | 1 (100.0%) | 11 (100.0%) |
| 5 Years | 0 (0.0%) | 0 (0.0%) |
| 6 to 11 Years | 5 (100.0%) | 5 (100.0%) |
| 12 to 14 Years | 0 (0.0%) | 0 (0.0%) |
| 15 Years | 0 (0.0%) | 0 (0.0%) |
| 16 and 17 Years | 6 (100.0%) | 0 (0.0%) |
| 18 to 24 Years | 3 (100.0%) | 4 (100.0%) |
| 25 to 34 Years | 7 (100.0%) | 23 (100.0%) |
| 35 to 44 Years | 0 (0.0%) | 1 (100.0%) |
| 45 to 54 Years | 14 (100.0%) | 9 (100.0%) |
| 55 to 64 Years | 2 (100.0%) | 7 (100.0%) |
| 65 to 74 Years | 11 (91.7%) | 12 (100.0%) |
| 75 Years and over | 1 (100.0%) | 3 (100.0%) |
| Total | 50 (96.2%) | 75 (100.0%) |
Income Below Poverty Among Married-Couple Families in Rutland
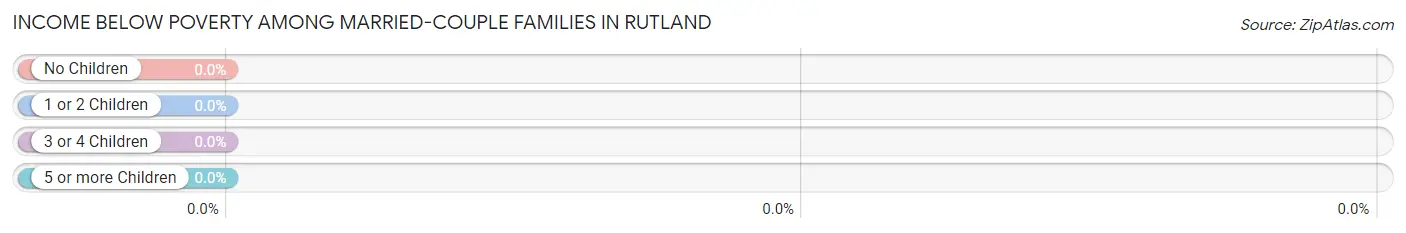
| Children | Above Poverty | Below Poverty |
| No Children | 14 (100.0%) | 0 (0.0%) |
| 1 or 2 Children | 1 (100.0%) | 0 (0.0%) |
| 3 or 4 Children | 1 (100.0%) | 0 (0.0%) |
| 5 or more Children | 0 (0.0%) | 0 (0.0%) |
| Total | 16 (100.0%) | 0 (0.0%) |
Income Below Poverty Among Single-Parent Households in Rutland
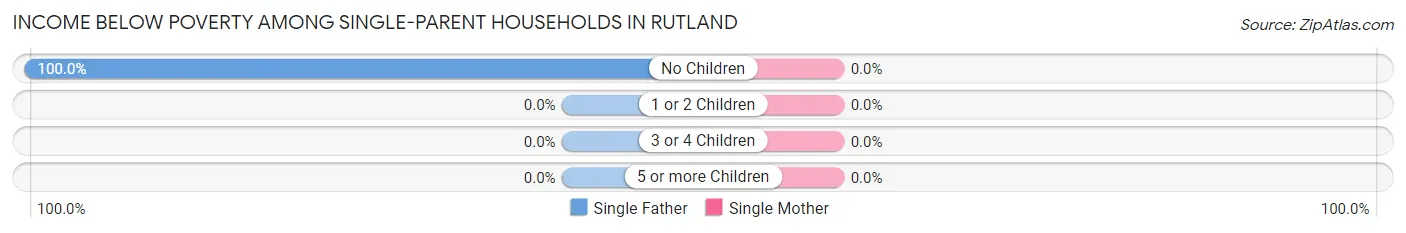
| Children | Single Father | Single Mother |
| No Children | 1 (100.0%) | 0 (0.0%) |
| 1 or 2 Children | 0 (0.0%) | 0 (0.0%) |
| 3 or 4 Children | 0 (0.0%) | 0 (0.0%) |
| 5 or more Children | 0 (0.0%) | 0 (0.0%) |
| Total | 1 (14.3%) | 0 (0.0%) |
Income Below Poverty Among Married-Couple vs Single-Parent Households in Rutland
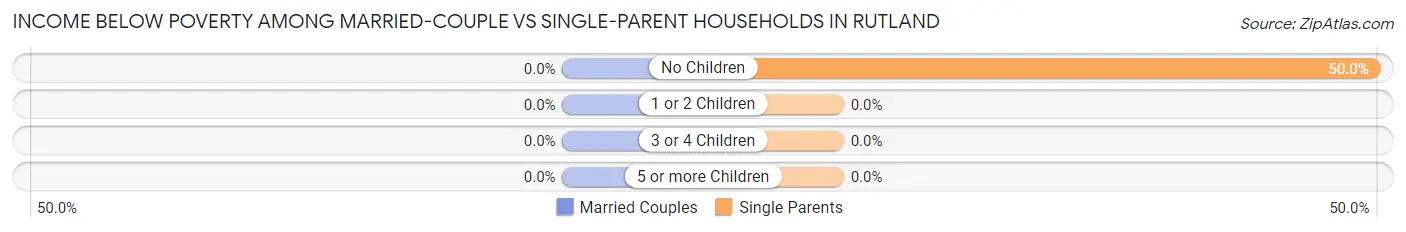
| Children | Married-Couple Families | Single-Parent Households |
| No Children | 0 (0.0%) | 1 (50.0%) |
| 1 or 2 Children | 0 (0.0%) | 0 (0.0%) |
| 3 or 4 Children | 0 (0.0%) | 0 (0.0%) |
| 5 or more Children | 0 (0.0%) | 0 (0.0%) |
| Total | 0 (0.0%) | 1 (3.3%) |
Race in Rutland
The most populous races in Rutland are , and White / Caucasian (127 | 100.0%).
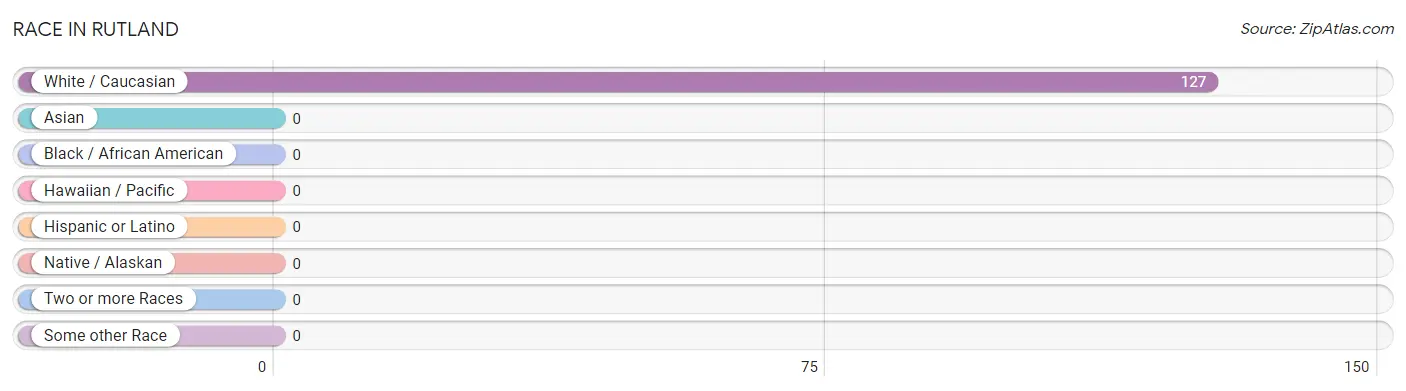
| Race | # Population | % Population |
| Asian | 0 | 0.0% |
| Black / African American | 0 | 0.0% |
| Hawaiian / Pacific | 0 | 0.0% |
| Hispanic or Latino | 0 | 0.0% |
| Native / Alaskan | 0 | 0.0% |
| White / Caucasian | 127 | 100.0% |
| Two or more Races | 0 | 0.0% |
| Some other Race | 0 | 0.0% |
| Total | 127 | 100.0% |
Ancestry in Rutland
The most populous ancestries reported in Rutland are German (42 | 33.1%), Norwegian (32 | 25.2%), Irish (21 | 16.5%), Dutch (5 | 3.9%), and English (5 | 3.9%), together accounting for 82.7% of all Rutland residents.
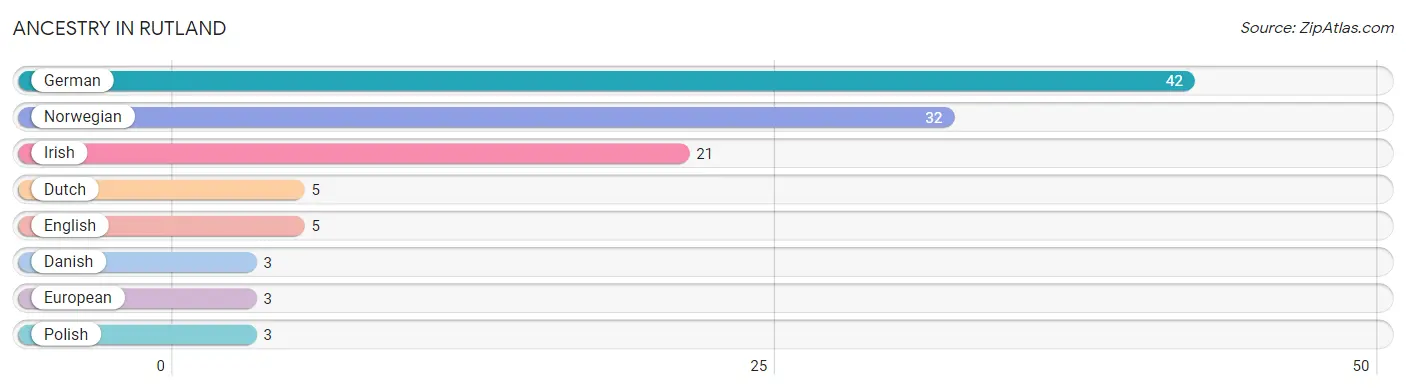
| Ancestry | # Population | % Population |
| Danish | 3 | 2.4% |
| Dutch | 5 | 3.9% |
| English | 5 | 3.9% |
| European | 3 | 2.4% |
| German | 42 | 33.1% |
| Irish | 21 | 16.5% |
| Norwegian | 32 | 25.2% |
| Polish | 3 | 2.4% | View All 8 Rows |
Immigrants in Rutland

| Immigration Origin | # Population | % Population | View All 0 Rows |
Sex and Age in Rutland
Sex and Age in Rutland
The most populous age groups in Rutland are 65 to 69 Years (8 | 15.4%) for men and 30 to 34 Years (19 | 25.3%) for women.
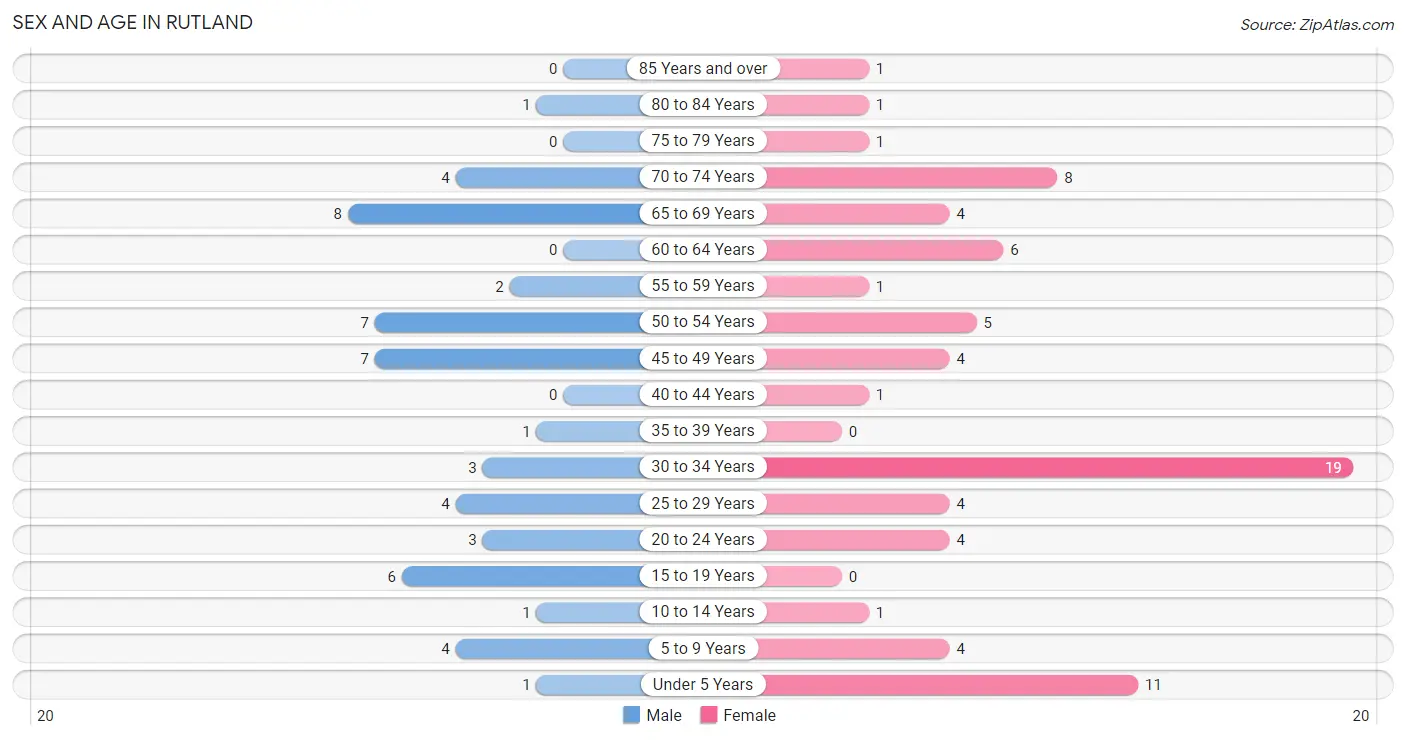
| Age Bracket | Male | Female |
| Under 5 Years | 1 (1.9%) | 11 (14.7%) |
| 5 to 9 Years | 4 (7.7%) | 4 (5.3%) |
| 10 to 14 Years | 1 (1.9%) | 1 (1.3%) |
| 15 to 19 Years | 6 (11.5%) | 0 (0.0%) |
| 20 to 24 Years | 3 (5.8%) | 4 (5.3%) |
| 25 to 29 Years | 4 (7.7%) | 4 (5.3%) |
| 30 to 34 Years | 3 (5.8%) | 19 (25.3%) |
| 35 to 39 Years | 1 (1.9%) | 0 (0.0%) |
| 40 to 44 Years | 0 (0.0%) | 1 (1.3%) |
| 45 to 49 Years | 7 (13.5%) | 4 (5.3%) |
| 50 to 54 Years | 7 (13.5%) | 5 (6.7%) |
| 55 to 59 Years | 2 (3.8%) | 1 (1.3%) |
| 60 to 64 Years | 0 (0.0%) | 6 (8.0%) |
| 65 to 69 Years | 8 (15.4%) | 4 (5.3%) |
| 70 to 74 Years | 4 (7.7%) | 8 (10.7%) |
| 75 to 79 Years | 0 (0.0%) | 1 (1.3%) |
| 80 to 84 Years | 1 (1.9%) | 1 (1.3%) |
| 85 Years and over | 0 (0.0%) | 1 (1.3%) |
| Total | 52 (100.0%) | 75 (100.0%) |
Families and Households in Rutland
Median Family Size in Rutland
The median family size in Rutland is 2.24 persons per family, with married-couple families (16 | 34.8%) accounting for the largest median family size of 2.94 persons per family. On the other hand, single female/mother families (23 | 50.0%) represent the smallest median family size with 1.65 persons per family.
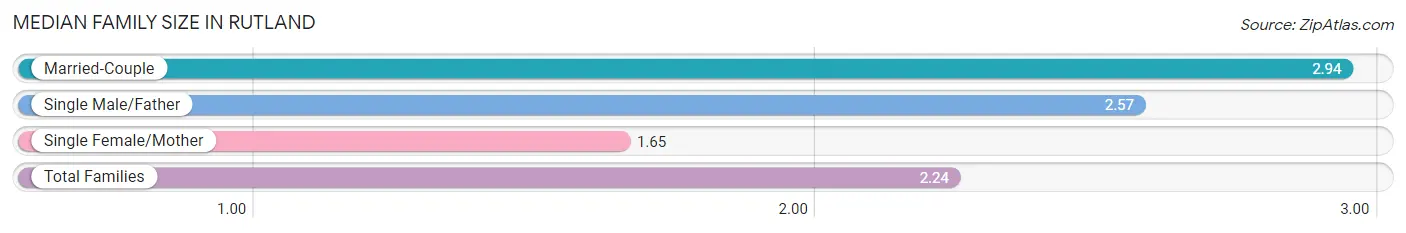
| Family Type | # Families | Family Size |
| Married-Couple | 16 (34.8%) | 2.94 |
| Single Male/Father | 7 (15.2%) | 2.57 |
| Single Female/Mother | 23 (50.0%) | 1.65 |
| Total Families | 46 (100.0%) | 2.24 |
Median Household Size in Rutland
The median household size in Rutland is 1.92 persons per household, with married-couple households (16 | 24.2%) accounting for the largest median household size of 2.94 persons per household. non-family households (20 | 30.3%) represent the smallest median household size with 1.10 persons per household.
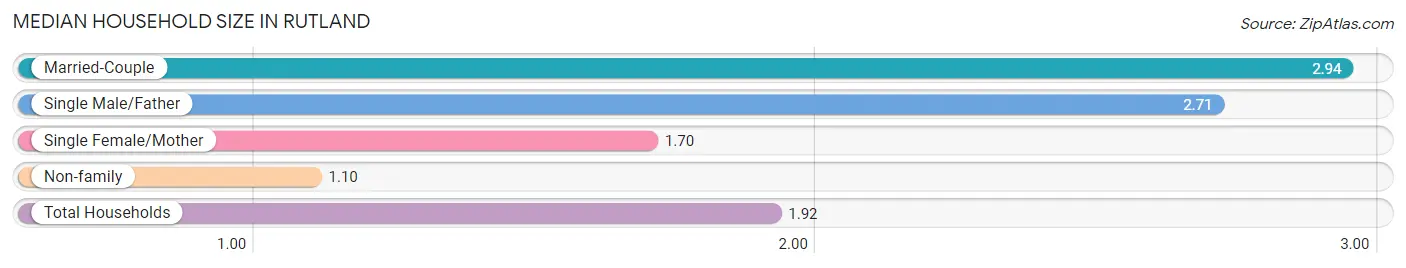
| Household Type | # Households | Household Size |
| Married-Couple | 16 (24.2%) | 2.94 |
| Single Male/Father | 7 (10.6%) | 2.71 |
| Single Female/Mother | 23 (34.8%) | 1.70 |
| Non-family | 20 (30.3%) | 1.10 |
| Total Households | 66 (100.0%) | 1.92 |
Household Size by Marriage Status in Rutland
Out of a total of 66 households in Rutland, 46 (69.7%) are family households, while 20 (30.3%) are nonfamily households. The most numerous type of family households are 2-person households, comprising 34, and the most common type of nonfamily households are 1-person households, comprising 18.
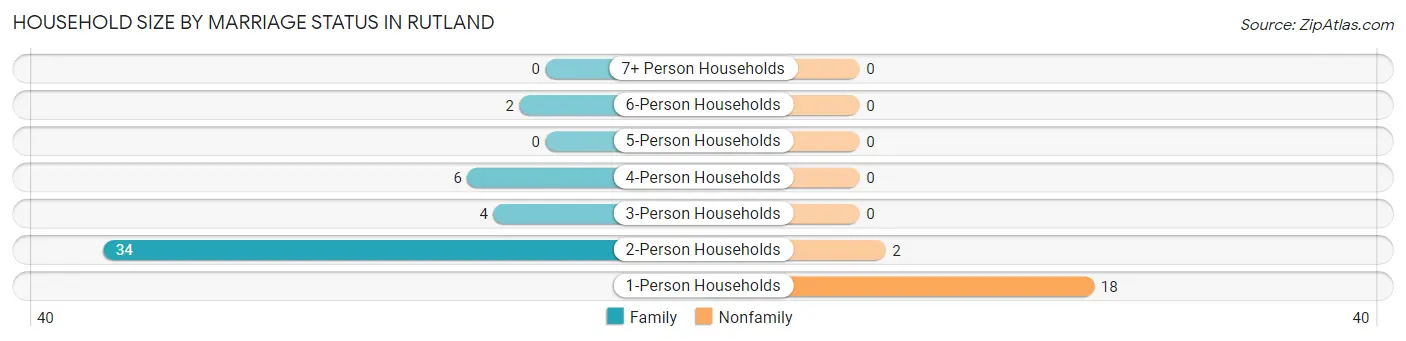
| Household Size | Family Households | Nonfamily Households |
| 1-Person Households | - | 18 (27.3%) |
| 2-Person Households | 34 (51.5%) | 2 (3.0%) |
| 3-Person Households | 4 (6.1%) | 0 (0.0%) |
| 4-Person Households | 6 (9.1%) | 0 (0.0%) |
| 5-Person Households | 0 (0.0%) | 0 (0.0%) |
| 6-Person Households | 2 (3.0%) | 0 (0.0%) |
| 7+ Person Households | 0 (0.0%) | 0 (0.0%) |
| Total | 46 (69.7%) | 20 (30.3%) |
Female Fertility in Rutland
Fertility by Age in Rutland
Average fertility rate in Rutland is 63.0 births per 1,000 women. Women in the age bracket of 20 to 34 years have the highest fertility rate with 74.0 births per 1,000 women. Women in the age bracket of 20 to 34 years acount for 100.0% of all women with births.
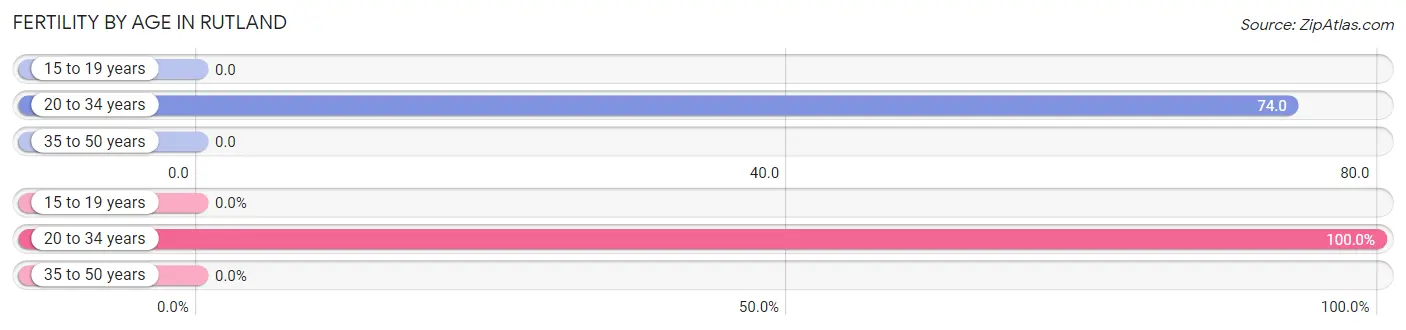
| Age Bracket | Women with Births | Births / 1,000 Women |
| 15 to 19 years | 0 (0.0%) | 0.0 |
| 20 to 34 years | 2 (100.0%) | 74.0 |
| 35 to 50 years | 0 (0.0%) | 0.0 |
| Total | 2 (100.0%) | 63.0 |
Fertility by Age by Marriage Status in Rutland
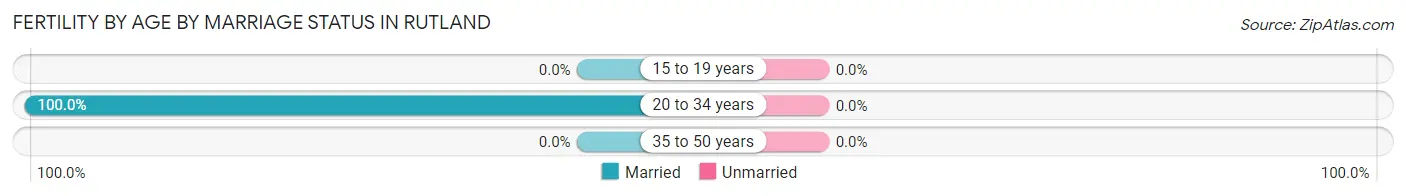
| Age Bracket | Married | Unmarried |
| 15 to 19 years | 0 (0.0%) | 0 (0.0%) |
| 20 to 34 years | 2 (100.0%) | 0 (0.0%) |
| 35 to 50 years | 0 (0.0%) | 0 (0.0%) |
| Total | 2 (100.0%) | 0 (0.0%) |
Fertility by Education in Rutland
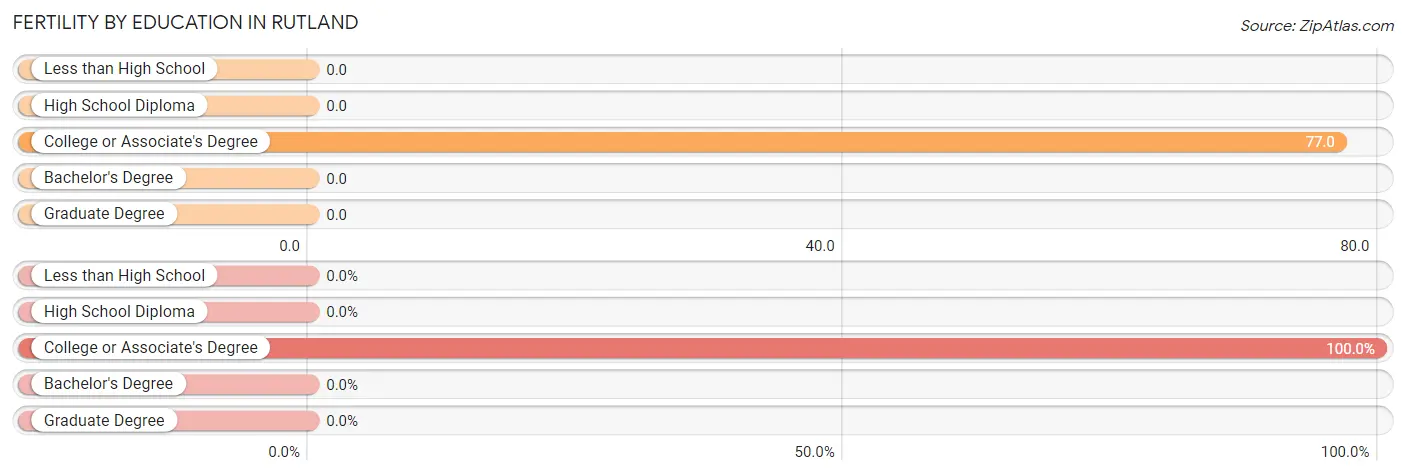
| Educational Attainment | Women with Births | Births / 1,000 Women |
| Less than High School | 0 (0.0%) | 0.0 |
| High School Diploma | 0 (0.0%) | 0.0 |
| College or Associate's Degree | 2 (100.0%) | 77.0 |
| Bachelor's Degree | 0 (0.0%) | 0.0 |
| Graduate Degree | 0 (0.0%) | 0.0 |
| Total | 2 (100.0%) | 63.0 |
Fertility by Education by Marriage Status in Rutland
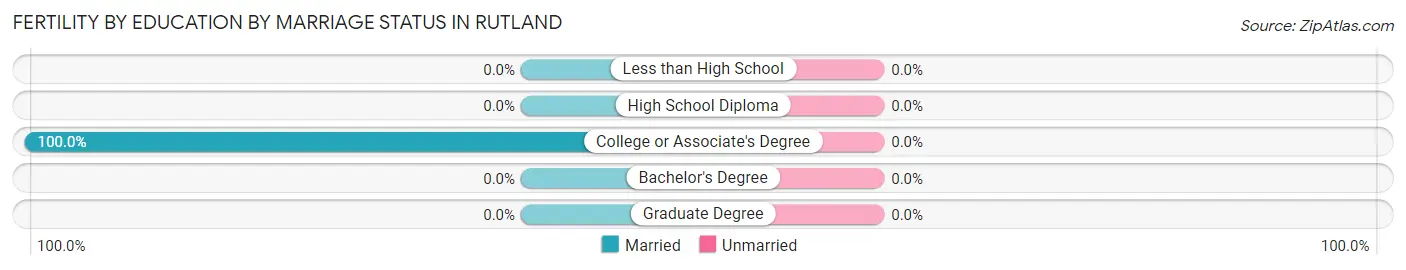
| Educational Attainment | Married | Unmarried |
| Less than High School | 0 (0.0%) | 0 (0.0%) |
| High School Diploma | 0 (0.0%) | 0 (0.0%) |
| College or Associate's Degree | 2 (100.0%) | 0 (0.0%) |
| Bachelor's Degree | 0 (0.0%) | 0 (0.0%) |
| Graduate Degree | 0 (0.0%) | 0 (0.0%) |
| Total | 2 (100.0%) | 0 (0.0%) |
Employment Characteristics in Rutland
Employment by Class of Employer in Rutland
Among the 77 employed individuals in Rutland, private company employees (65 | 84.4%), local government employees (6 | 7.8%), and self-employed (not incorporated) (2 | 2.6%) make up the most common classes of employment.
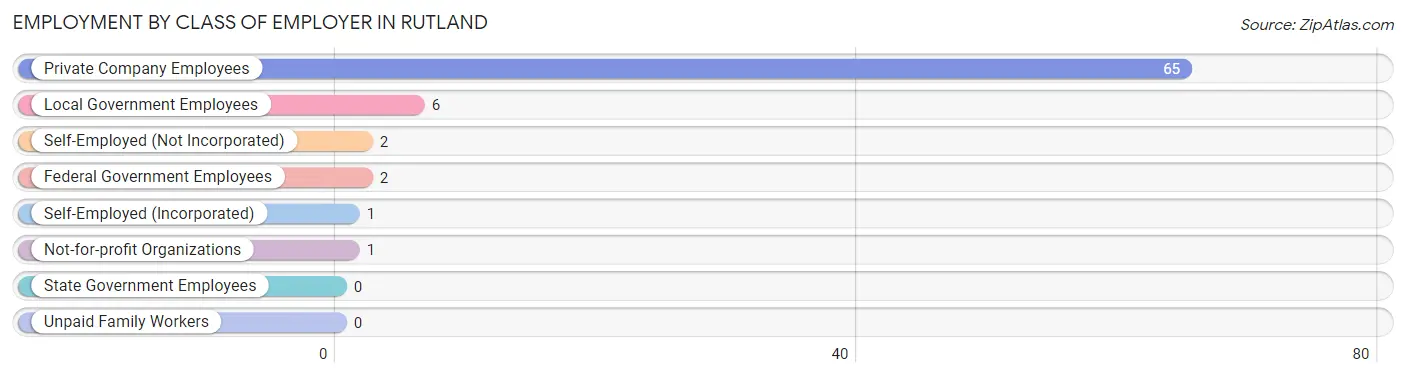
| Employer Class | # Employees | % Employees |
| Private Company Employees | 65 | 84.4% |
| Self-Employed (Incorporated) | 1 | 1.3% |
| Self-Employed (Not Incorporated) | 2 | 2.6% |
| Not-for-profit Organizations | 1 | 1.3% |
| Local Government Employees | 6 | 7.8% |
| State Government Employees | 0 | 0.0% |
| Federal Government Employees | 2 | 2.6% |
| Unpaid Family Workers | 0 | 0.0% |
| Total | 77 | 100.0% |
Employment Status by Age in Rutland
According to the labor force statistics for Rutland, out of the total population over 16 years of age (105), 74.3% or 78 individuals are in the labor force, with 1.3% or 1 of them unemployed. The age group with the highest labor force participation rate is 16 to 19 years, with 100.0% or 6 individuals in the labor force. Within the labor force, the 55 to 59 years age range has the highest percentage of unemployed individuals, with 33.3% or 1 of them being unemployed.
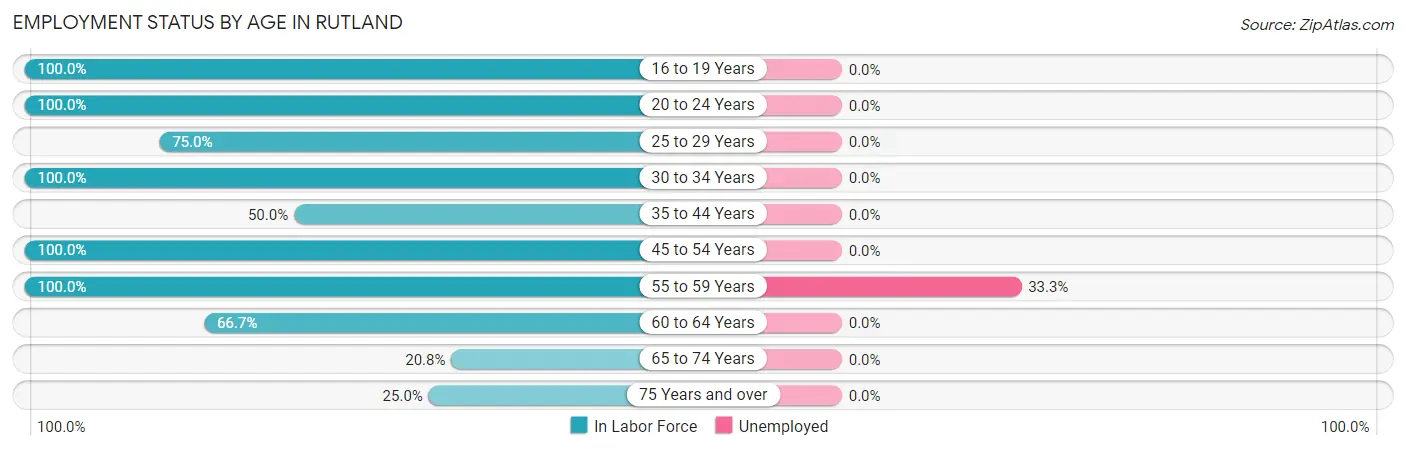
| Age Bracket | In Labor Force | Unemployed |
| 16 to 19 Years | 6 (100.0%) | 0 (0.0%) |
| 20 to 24 Years | 7 (100.0%) | 0 (0.0%) |
| 25 to 29 Years | 6 (75.0%) | 0 (0.0%) |
| 30 to 34 Years | 22 (100.0%) | 0 (0.0%) |
| 35 to 44 Years | 1 (50.0%) | 0 (0.0%) |
| 45 to 54 Years | 23 (100.0%) | 0 (0.0%) |
| 55 to 59 Years | 3 (100.0%) | 1 (33.3%) |
| 60 to 64 Years | 4 (66.7%) | 0 (0.0%) |
| 65 to 74 Years | 5 (20.8%) | 0 (0.0%) |
| 75 Years and over | 1 (25.0%) | 0 (0.0%) |
| Total | 78 (74.3%) | 1 (1.3%) |
Employment Status by Educational Attainment in Rutland
According to labor force statistics for Rutland, 92.2% of individuals (59) out of the total population between 25 and 64 years of age (64) are in the labor force, with 1.7% or 1 of them being unemployed. The group with the highest labor force participation rate are those with the educational attainment of high school diploma, with 96.4% or 27 individuals in the labor force. Within the labor force, individuals with college / associate degree education have the highest percentage of unemployment, with 3.1% or 1 of them being unemployed.
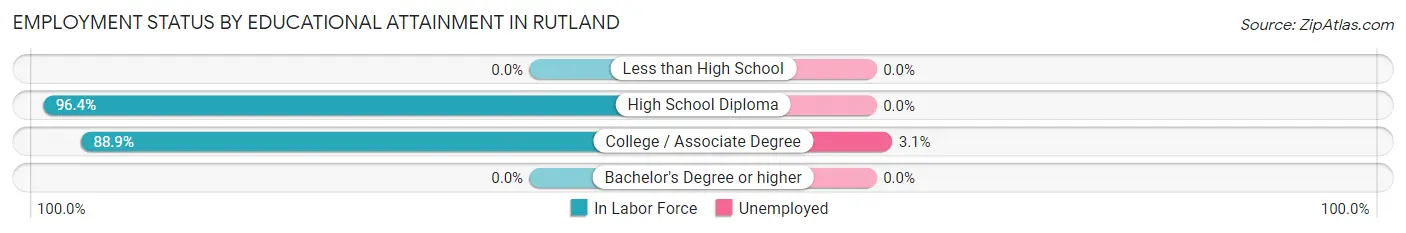
| Educational Attainment | In Labor Force | Unemployed |
| Less than High School | 0 (0.0%) | 0 (0.0%) |
| High School Diploma | 27 (96.4%) | 0 (0.0%) |
| College / Associate Degree | 32 (88.9%) | 1 (3.1%) |
| Bachelor's Degree or higher | 0 (0.0%) | 0 (0.0%) |
| Total | 59 (92.2%) | 1 (1.7%) |
Employment Occupations by Sex in Rutland
Management, Business, Science and Arts Occupations
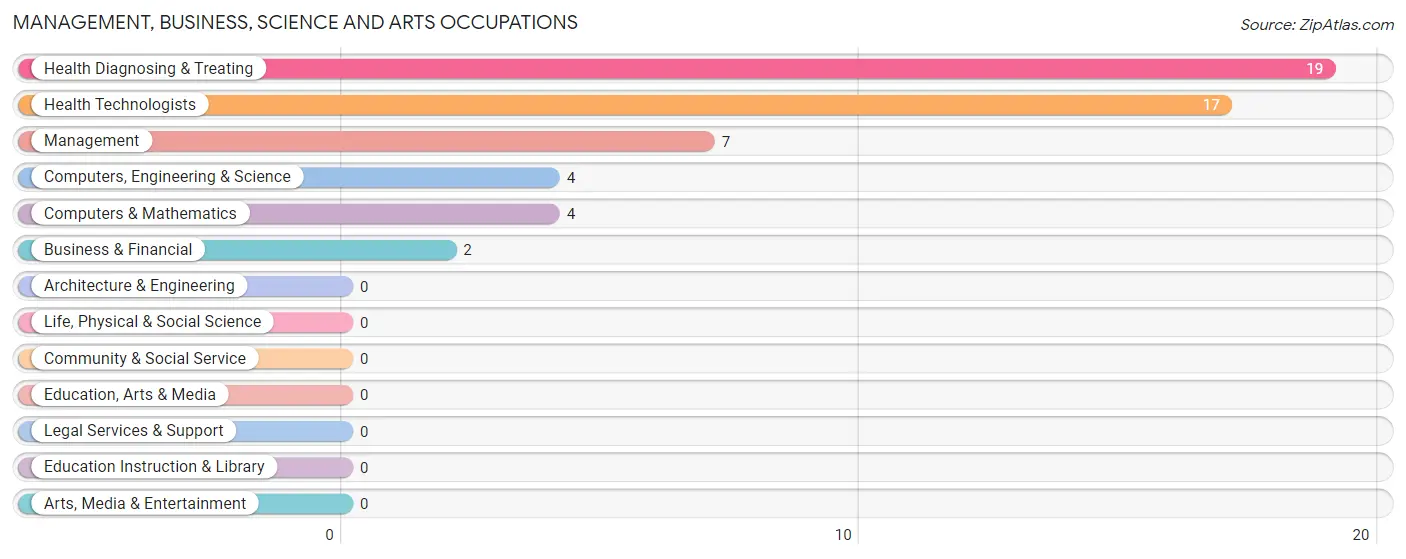
The most common Management, Business, Science and Arts occupations in Rutland are Health Diagnosing & Treating (19 | 24.7%), Health Technologists (17 | 22.1%), Management (7 | 9.1%), Computers, Engineering & Science (4 | 5.2%), and Computers & Mathematics (4 | 5.2%).
Management, Business, Science and Arts Occupations by Sex
Within the Management, Business, Science and Arts occupations in Rutland, the most male-oriented occupations are Computers, Engineering & Science (100.0%), Computers & Mathematics (100.0%), and Management (85.7%), while the most female-oriented occupations are Business & Financial (100.0%), Health Diagnosing & Treating (100.0%), and Health Technologists (100.0%).
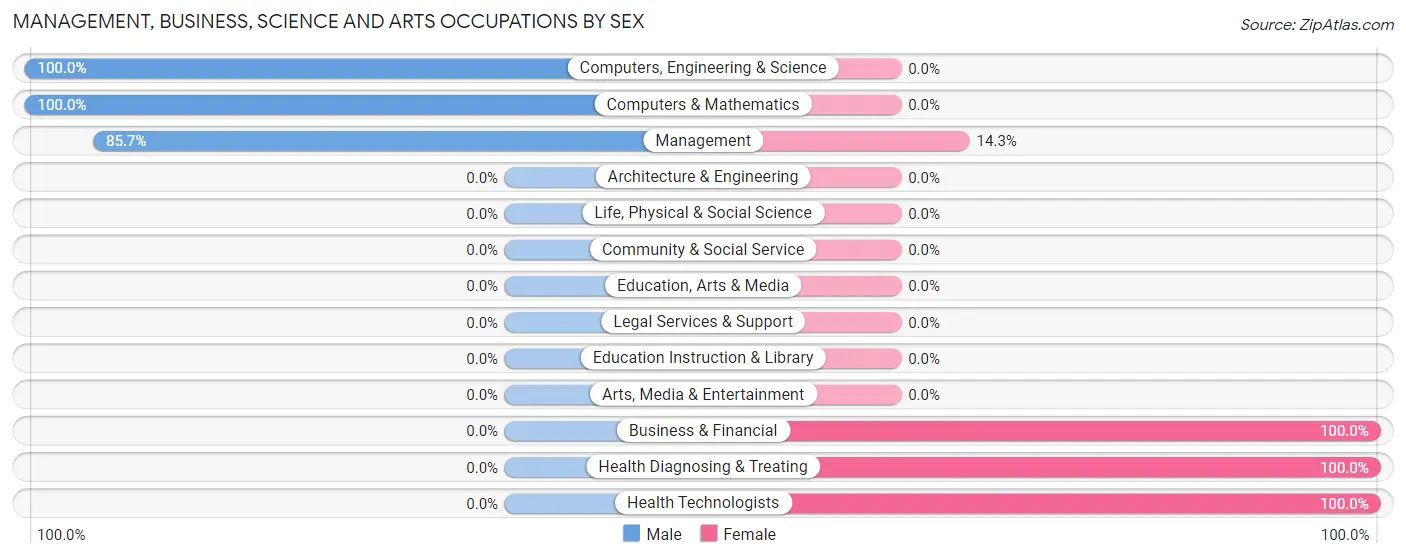
| Occupation | Male | Female |
| Management | 6 (85.7%) | 1 (14.3%) |
| Business & Financial | 0 (0.0%) | 2 (100.0%) |
| Computers, Engineering & Science | 4 (100.0%) | 0 (0.0%) |
| Computers & Mathematics | 4 (100.0%) | 0 (0.0%) |
| Architecture & Engineering | 0 (0.0%) | 0 (0.0%) |
| Life, Physical & Social Science | 0 (0.0%) | 0 (0.0%) |
| Community & Social Service | 0 (0.0%) | 0 (0.0%) |
| Education, Arts & Media | 0 (0.0%) | 0 (0.0%) |
| Legal Services & Support | 0 (0.0%) | 0 (0.0%) |
| Education Instruction & Library | 0 (0.0%) | 0 (0.0%) |
| Arts, Media & Entertainment | 0 (0.0%) | 0 (0.0%) |
| Health Diagnosing & Treating | 0 (0.0%) | 19 (100.0%) |
| Health Technologists | 0 (0.0%) | 17 (100.0%) |
| Total (Category) | 10 (31.2%) | 22 (68.8%) |
| Total (Overall) | 35 (45.5%) | 42 (54.5%) |
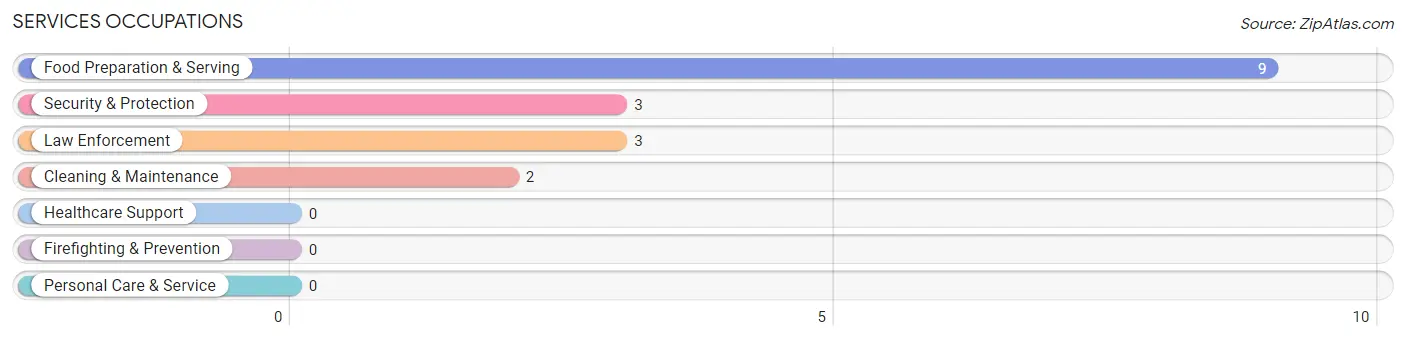
Services Occupations
The most common Services occupations in Rutland are Food Preparation & Serving (9 | 11.7%), Security & Protection (3 | 3.9%), Law Enforcement (3 | 3.9%), and Cleaning & Maintenance (2 | 2.6%).
Services Occupations by Sex
Within the Services occupations in Rutland, the most male-oriented occupations are Food Preparation & Serving (100.0%), and Cleaning & Maintenance (100.0%), while the most female-oriented occupations are Security & Protection (100.0%), and Law Enforcement (100.0%).
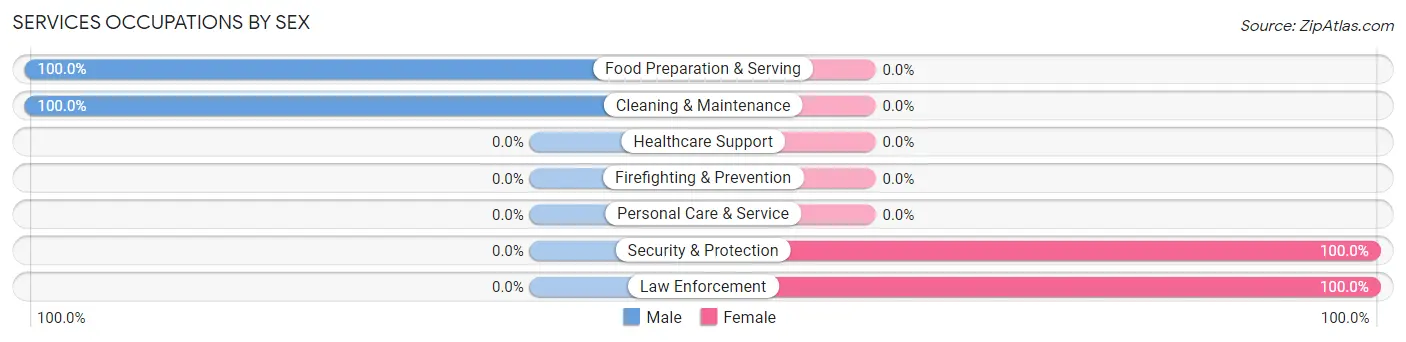
| Occupation | Male | Female |
| Healthcare Support | 0 (0.0%) | 0 (0.0%) |
| Security & Protection | 0 (0.0%) | 3 (100.0%) |
| Firefighting & Prevention | 0 (0.0%) | 0 (0.0%) |
| Law Enforcement | 0 (0.0%) | 3 (100.0%) |
| Food Preparation & Serving | 9 (100.0%) | 0 (0.0%) |
| Cleaning & Maintenance | 2 (100.0%) | 0 (0.0%) |
| Personal Care & Service | 0 (0.0%) | 0 (0.0%) |
| Total (Category) | 11 (78.6%) | 3 (21.4%) |
| Total (Overall) | 35 (45.5%) | 42 (54.5%) |
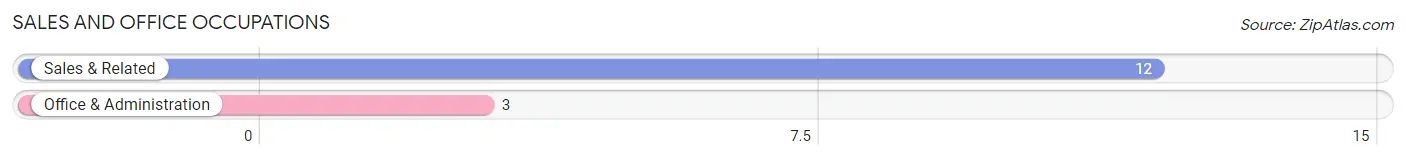
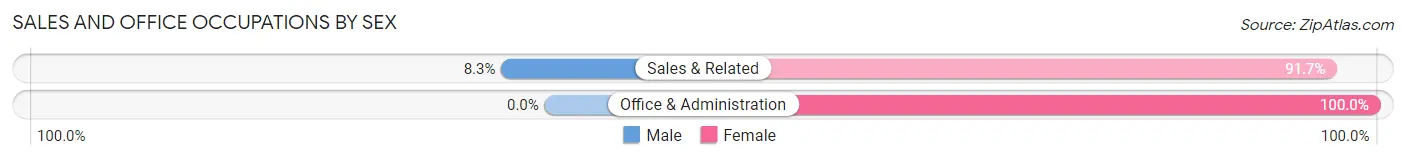
Sales and Office Occupations
The most common Sales and Office occupations in Rutland are Sales & Related (12 | 15.6%), and Office & Administration (3 | 3.9%).
Sales and Office Occupations by Sex
| Occupation | Male | Female |
| Sales & Related | 1 (8.3%) | 11 (91.7%) |
| Office & Administration | 0 (0.0%) | 3 (100.0%) |
| Total (Category) | 1 (6.7%) | 14 (93.3%) |
| Total (Overall) | 35 (45.5%) | 42 (54.5%) |
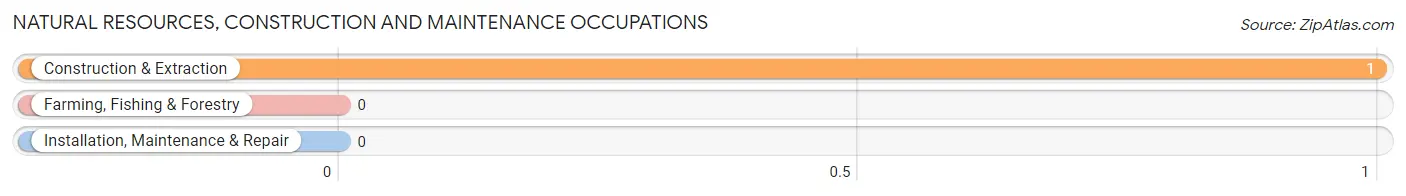
Natural Resources, Construction and Maintenance Occupations
The most common Natural Resources, Construction and Maintenance occupations in Rutland are , and Construction & Extraction (1 | 1.3%).
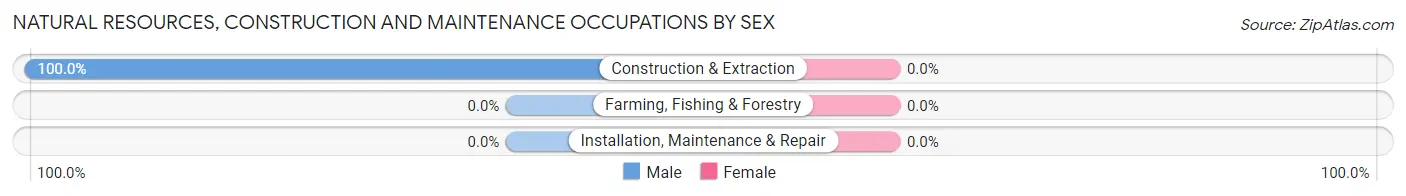
Natural Resources, Construction and Maintenance Occupations by Sex
| Occupation | Male | Female |
| Farming, Fishing & Forestry | 0 (0.0%) | 0 (0.0%) |
| Construction & Extraction | 1 (100.0%) | 0 (0.0%) |
| Installation, Maintenance & Repair | 0 (0.0%) | 0 (0.0%) |
| Total (Category) | 1 (100.0%) | 0 (0.0%) |
| Total (Overall) | 35 (45.5%) | 42 (54.5%) |
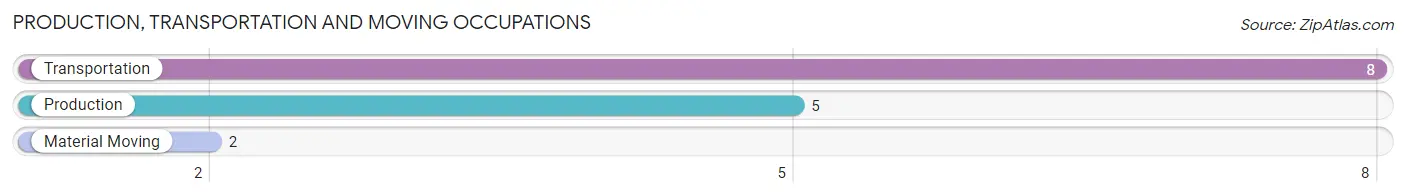
Production, Transportation and Moving Occupations
The most common Production, Transportation and Moving occupations in Rutland are Transportation (8 | 10.4%), Production (5 | 6.5%), and Material Moving (2 | 2.6%).
Production, Transportation and Moving Occupations by Sex
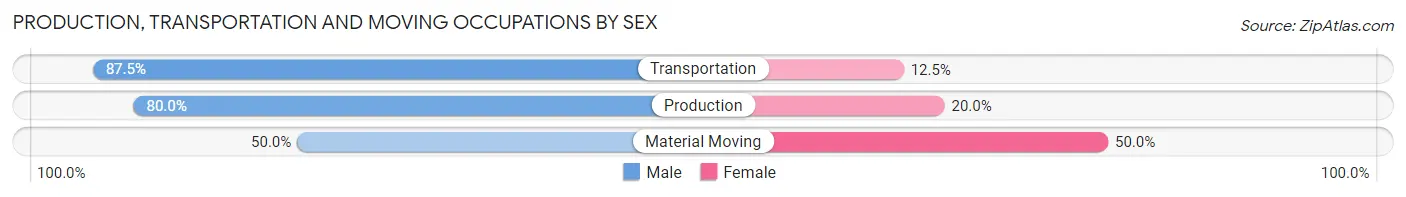
| Occupation | Male | Female |
| Production | 4 (80.0%) | 1 (20.0%) |
| Transportation | 7 (87.5%) | 1 (12.5%) |
| Material Moving | 1 (50.0%) | 1 (50.0%) |
| Total (Category) | 12 (80.0%) | 3 (20.0%) |
| Total (Overall) | 35 (45.5%) | 42 (54.5%) |
Employment Industries by Sex in Rutland
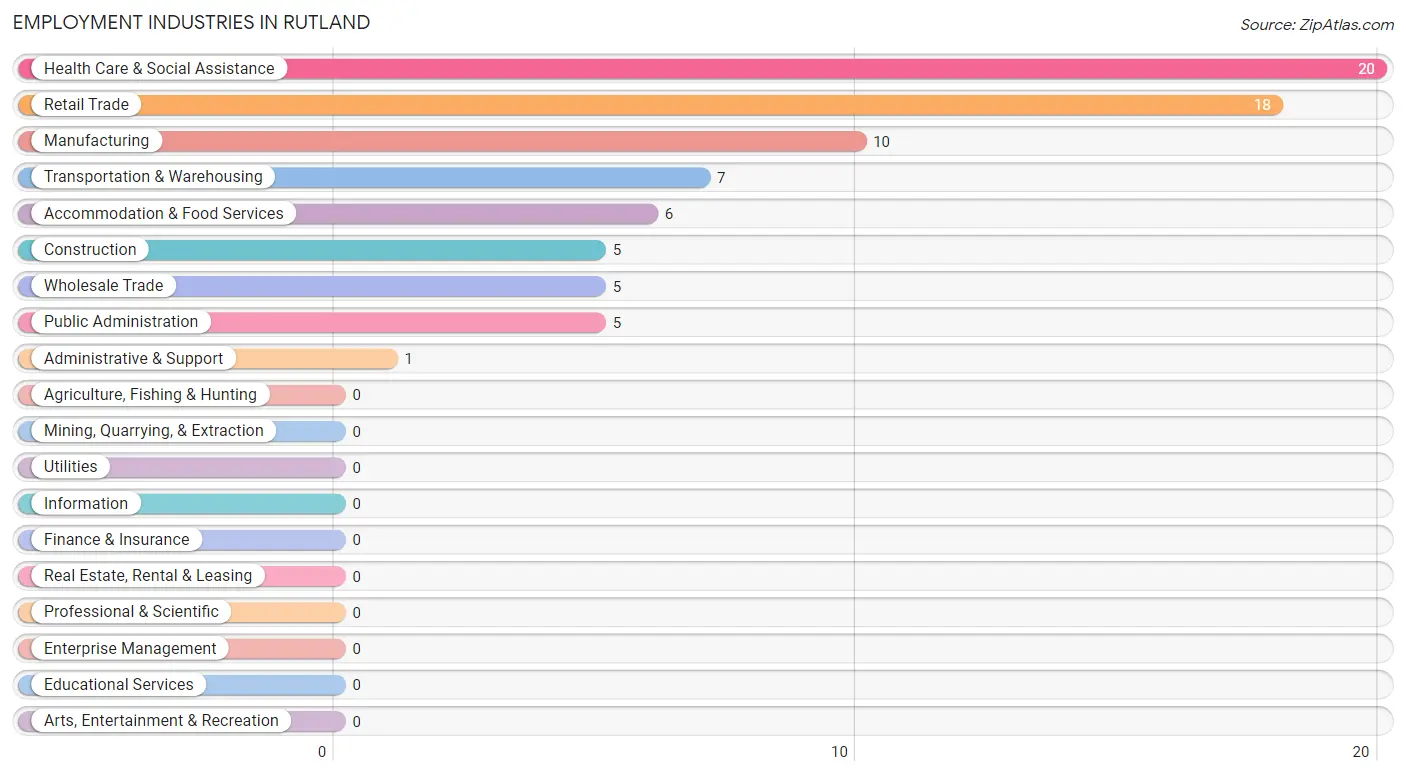
Employment Industries in Rutland
The major employment industries in Rutland include Health Care & Social Assistance (20 | 26.0%), Retail Trade (18 | 23.4%), Manufacturing (10 | 13.0%), Transportation & Warehousing (7 | 9.1%), and Accommodation & Food Services (6 | 7.8%).
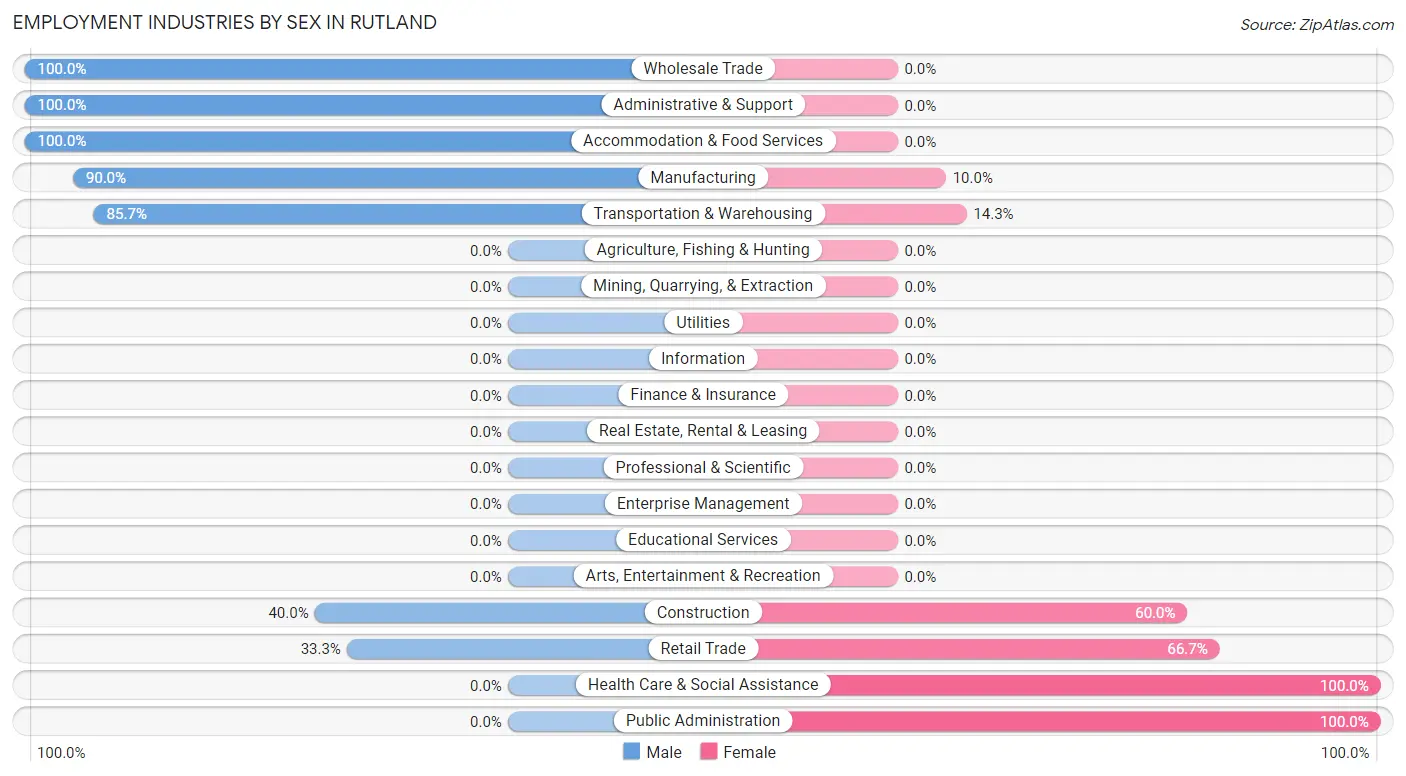
Employment Industries by Sex in Rutland
The Rutland industries that see more men than women are Wholesale Trade (100.0%), Administrative & Support (100.0%), and Accommodation & Food Services (100.0%), whereas the industries that tend to have a higher number of women are Health Care & Social Assistance (100.0%), Public Administration (100.0%), and Retail Trade (66.7%).
| Industry | Male | Female |
| Agriculture, Fishing & Hunting | 0 (0.0%) | 0 (0.0%) |
| Mining, Quarrying, & Extraction | 0 (0.0%) | 0 (0.0%) |
| Construction | 2 (40.0%) | 3 (60.0%) |
| Manufacturing | 9 (90.0%) | 1 (10.0%) |
| Wholesale Trade | 5 (100.0%) | 0 (0.0%) |
| Retail Trade | 6 (33.3%) | 12 (66.7%) |
| Transportation & Warehousing | 6 (85.7%) | 1 (14.3%) |
| Utilities | 0 (0.0%) | 0 (0.0%) |
| Information | 0 (0.0%) | 0 (0.0%) |
| Finance & Insurance | 0 (0.0%) | 0 (0.0%) |
| Real Estate, Rental & Leasing | 0 (0.0%) | 0 (0.0%) |
| Professional & Scientific | 0 (0.0%) | 0 (0.0%) |
| Enterprise Management | 0 (0.0%) | 0 (0.0%) |
| Administrative & Support | 1 (100.0%) | 0 (0.0%) |
| Educational Services | 0 (0.0%) | 0 (0.0%) |
| Health Care & Social Assistance | 0 (0.0%) | 20 (100.0%) |
| Arts, Entertainment & Recreation | 0 (0.0%) | 0 (0.0%) |
| Accommodation & Food Services | 6 (100.0%) | 0 (0.0%) |
| Public Administration | 0 (0.0%) | 5 (100.0%) |
| Total | 35 (45.5%) | 42 (54.5%) |
Education in Rutland
School Enrollment in Rutland
The most common levels of schooling among the 20 students in Rutland are kindergarten (6 | 30.0%), high school (6 | 30.0%), and college / undergraduate (4 | 20.0%).
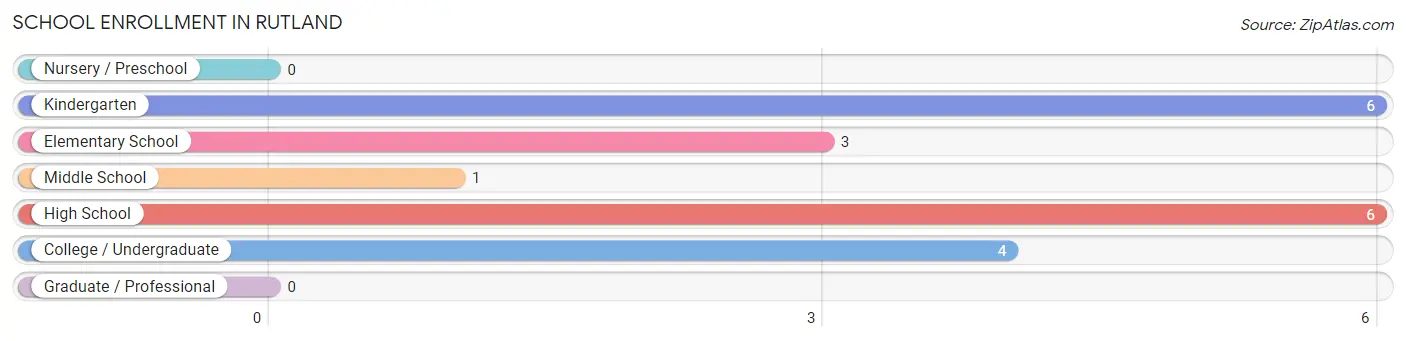
| School Level | # Students | % Students |
| Nursery / Preschool | 0 | 0.0% |
| Kindergarten | 6 | 30.0% |
| Elementary School | 3 | 15.0% |
| Middle School | 1 | 5.0% |
| High School | 6 | 30.0% |
| College / Undergraduate | 4 | 20.0% |
| Graduate / Professional | 0 | 0.0% |
| Total | 20 | 100.0% |
School Enrollment by Age by Funding Source in Rutland
Out of a total of 20 students who are enrolled in schools in Rutland, 4 (20.0%) attend a private institution, while the remaining 16 (80.0%) are enrolled in public schools. The age group of 15 to 17 year olds has the highest likelihood of being enrolled in private schools, with 4 (66.7% in the age bracket) enrolled. Conversely, the age group of 5 to 9 year old has the lowest likelihood of being enrolled in a private school, with 8 (100.0% in the age bracket) attending a public institution.
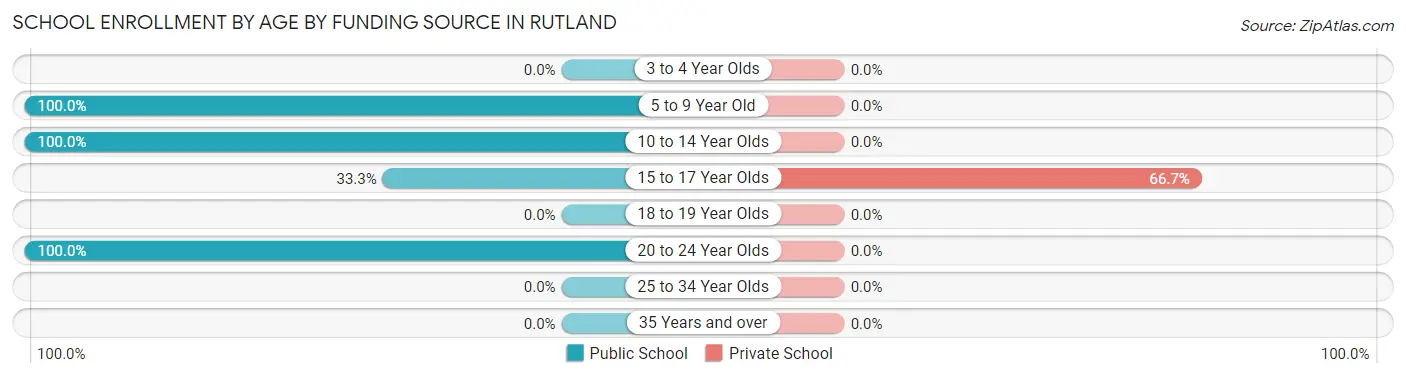
| Age Bracket | Public School | Private School |
| 3 to 4 Year Olds | 0 (0.0%) | 0 (0.0%) |
| 5 to 9 Year Old | 8 (100.0%) | 0 (0.0%) |
| 10 to 14 Year Olds | 2 (100.0%) | 0 (0.0%) |
| 15 to 17 Year Olds | 2 (33.3%) | 4 (66.7%) |
| 18 to 19 Year Olds | 0 (0.0%) | 0 (0.0%) |
| 20 to 24 Year Olds | 4 (100.0%) | 0 (0.0%) |
| 25 to 34 Year Olds | 0 (0.0%) | 0 (0.0%) |
| 35 Years and over | 0 (0.0%) | 0 (0.0%) |
| Total | 16 (80.0%) | 4 (20.0%) |
Educational Attainment by Field of Study in Rutland
| Field of Study | # Graduates | % Graduates |
| Computers & Mathematics | 0 | 0.0% |
| Bio, Nature & Agricultural | 0 | 0.0% |
| Physical & Health Sciences | 0 | 0.0% |
| Psychology | 0 | 0.0% |
| Social Sciences | 0 | 0.0% |
| Engineering | 0 | 0.0% |
| Multidisciplinary Studies | 0 | 0.0% |
| Science & Technology | 0 | 0.0% |
| Business | 0 | 0.0% |
| Education | 0 | 0.0% |
| Literature & Languages | 0 | 0.0% |
| Liberal Arts & History | 0 | 0.0% |
| Visual & Performing Arts | 0 | 0.0% |
| Communications | 0 | 0.0% |
| Arts & Humanities | 0 | 0.0% |
| Total | 0 | 0.0% |
Transportation & Commute in Rutland
Vehicle Availability by Sex in Rutland
The most prevalent vehicle ownership categories in Rutland are males with 2 vehicles (18, accounting for 51.4%) and females with 2 vehicles (31, making up 42.9%).
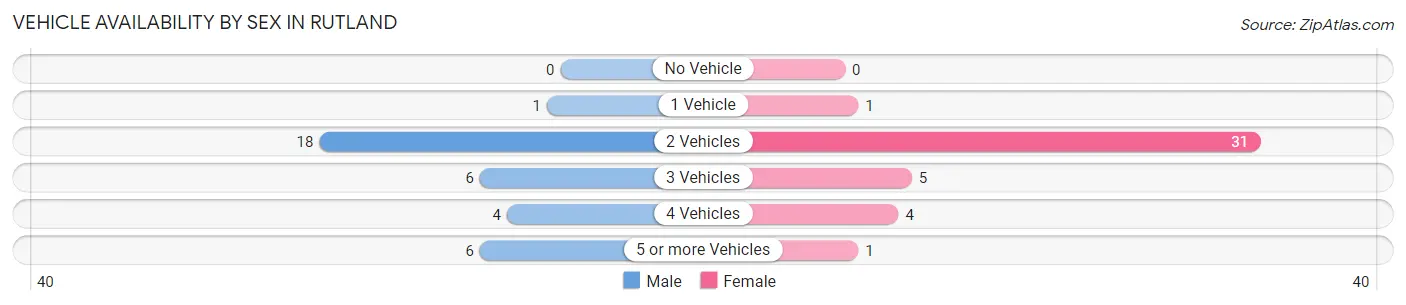
| Vehicles Available | Male | Female |
| No Vehicle | 0 (0.0%) | 0 (0.0%) |
| 1 Vehicle | 1 (2.9%) | 1 (2.4%) |
| 2 Vehicles | 18 (51.4%) | 31 (73.8%) |
| 3 Vehicles | 6 (17.1%) | 5 (11.9%) |
| 4 Vehicles | 4 (11.4%) | 4 (9.5%) |
| 5 or more Vehicles | 6 (17.1%) | 1 (2.4%) |
| Total | 35 (100.0%) | 42 (100.0%) |
Commute Time in Rutland
The most frequently occuring commute durations in Rutland are 40 to 44 minutes (17 commuters, 23.6%), 10 to 14 minutes (15 commuters, 20.8%), and 30 to 34 minutes (11 commuters, 15.3%).
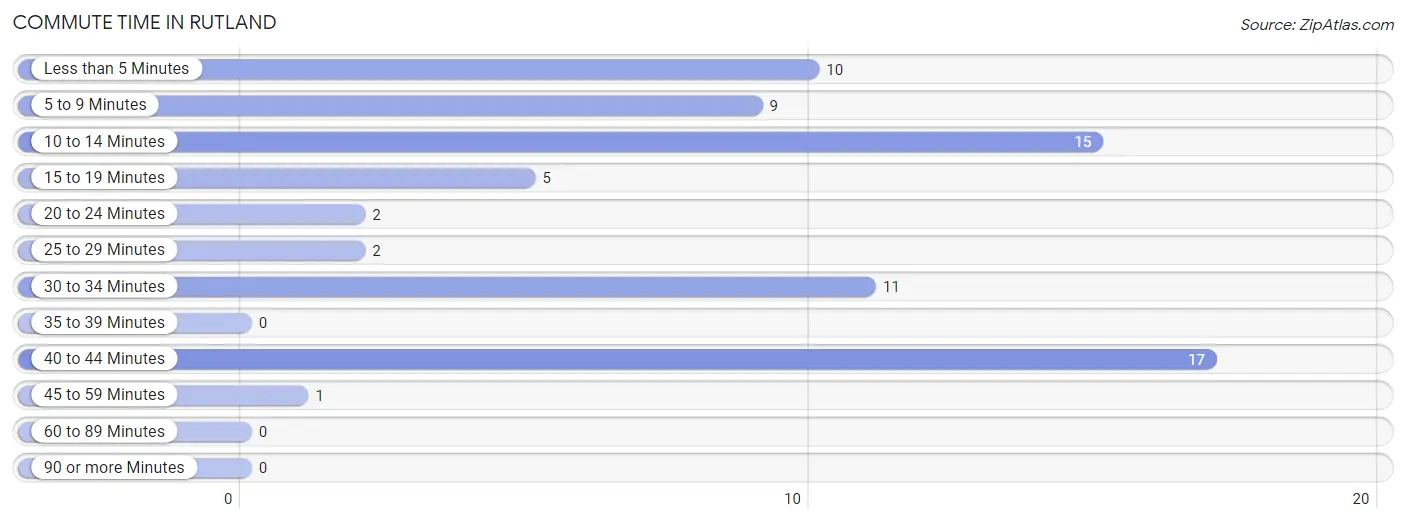
| Commute Time | # Commuters | % Commuters |
| Less than 5 Minutes | 10 | 13.9% |
| 5 to 9 Minutes | 9 | 12.5% |
| 10 to 14 Minutes | 15 | 20.8% |
| 15 to 19 Minutes | 5 | 6.9% |
| 20 to 24 Minutes | 2 | 2.8% |
| 25 to 29 Minutes | 2 | 2.8% |
| 30 to 34 Minutes | 11 | 15.3% |
| 35 to 39 Minutes | 0 | 0.0% |
| 40 to 44 Minutes | 17 | 23.6% |
| 45 to 59 Minutes | 1 | 1.4% |
| 60 to 89 Minutes | 0 | 0.0% |
| 90 or more Minutes | 0 | 0.0% |
Commute Time by Sex in Rutland
The most common commute times in Rutland are less than 5 minutes (7 commuters, 22.6%) for males and 40 to 44 minutes (17 commuters, 41.5%) for females.
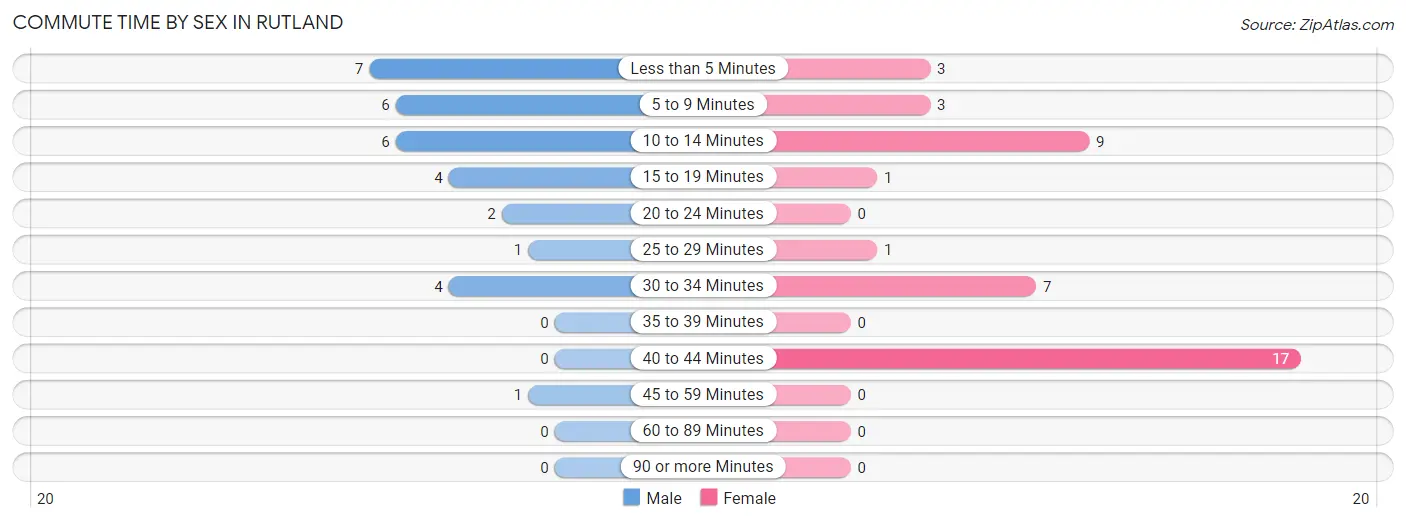
| Commute Time | Male | Female |
| Less than 5 Minutes | 7 (22.6%) | 3 (7.3%) |
| 5 to 9 Minutes | 6 (19.4%) | 3 (7.3%) |
| 10 to 14 Minutes | 6 (19.4%) | 9 (22.0%) |
| 15 to 19 Minutes | 4 (12.9%) | 1 (2.4%) |
| 20 to 24 Minutes | 2 (6.5%) | 0 (0.0%) |
| 25 to 29 Minutes | 1 (3.2%) | 1 (2.4%) |
| 30 to 34 Minutes | 4 (12.9%) | 7 (17.1%) |
| 35 to 39 Minutes | 0 (0.0%) | 0 (0.0%) |
| 40 to 44 Minutes | 0 (0.0%) | 17 (41.5%) |
| 45 to 59 Minutes | 1 (3.2%) | 0 (0.0%) |
| 60 to 89 Minutes | 0 (0.0%) | 0 (0.0%) |
| 90 or more Minutes | 0 (0.0%) | 0 (0.0%) |
Time of Departure to Work by Sex in Rutland
The most frequent times of departure to work in Rutland are 7:00 AM to 7:29 AM (8, 25.8%) for males and 6:00 AM to 6:29 AM (17, 41.5%) for females.
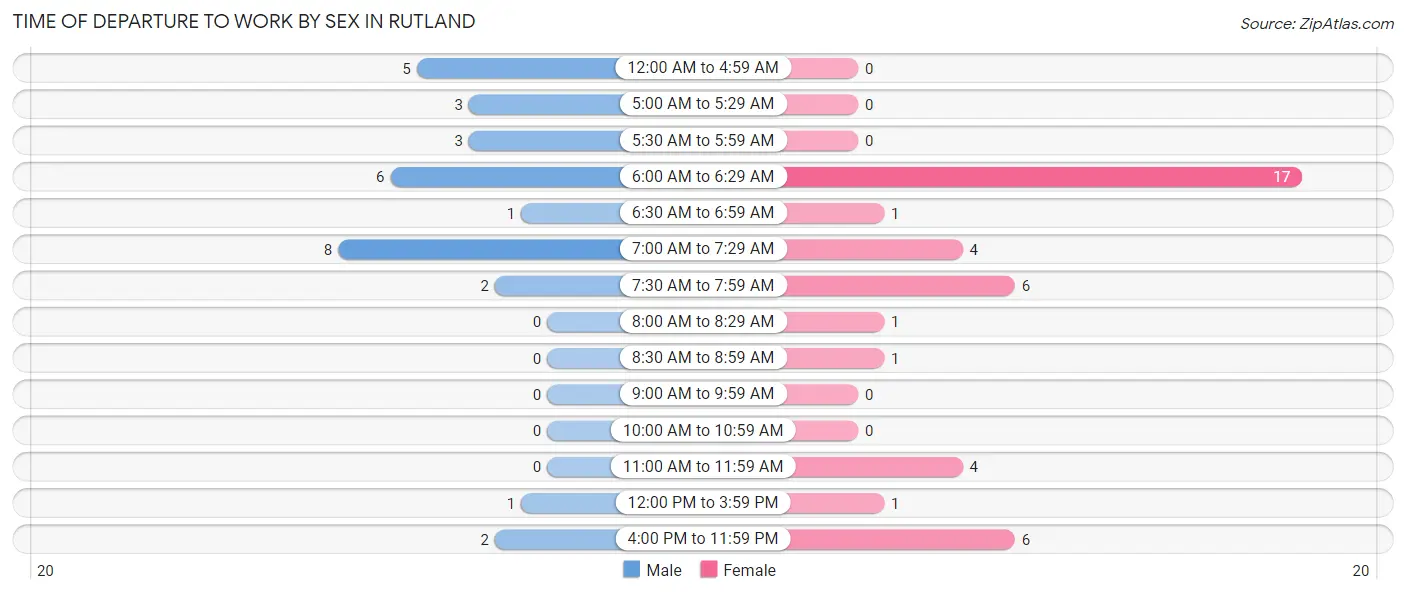
| Time of Departure | Male | Female |
| 12:00 AM to 4:59 AM | 5 (16.1%) | 0 (0.0%) |
| 5:00 AM to 5:29 AM | 3 (9.7%) | 0 (0.0%) |
| 5:30 AM to 5:59 AM | 3 (9.7%) | 0 (0.0%) |
| 6:00 AM to 6:29 AM | 6 (19.4%) | 17 (41.5%) |
| 6:30 AM to 6:59 AM | 1 (3.2%) | 1 (2.4%) |
| 7:00 AM to 7:29 AM | 8 (25.8%) | 4 (9.8%) |
| 7:30 AM to 7:59 AM | 2 (6.5%) | 6 (14.6%) |
| 8:00 AM to 8:29 AM | 0 (0.0%) | 1 (2.4%) |
| 8:30 AM to 8:59 AM | 0 (0.0%) | 1 (2.4%) |
| 9:00 AM to 9:59 AM | 0 (0.0%) | 0 (0.0%) |
| 10:00 AM to 10:59 AM | 0 (0.0%) | 0 (0.0%) |
| 11:00 AM to 11:59 AM | 0 (0.0%) | 4 (9.8%) |
| 12:00 PM to 3:59 PM | 1 (3.2%) | 1 (2.4%) |
| 4:00 PM to 11:59 PM | 2 (6.5%) | 6 (14.6%) |
| Total | 31 (100.0%) | 41 (100.0%) |
Housing Occupancy in Rutland
Occupancy by Ownership in Rutland
Of the total 66 dwellings in Rutland, owner-occupied units account for 57 (86.4%), while renter-occupied units make up 9 (13.6%).
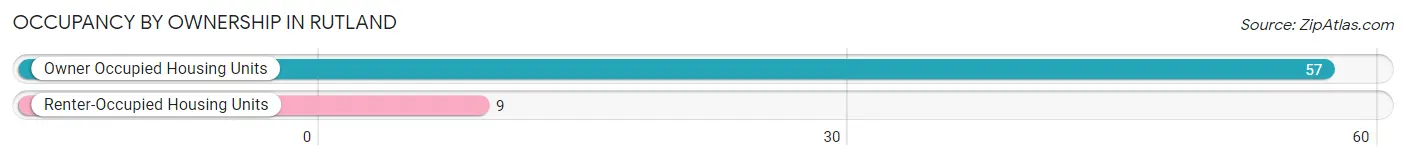
| Occupancy | # Housing Units | % Housing Units |
| Owner Occupied Housing Units | 57 | 86.4% |
| Renter-Occupied Housing Units | 9 | 13.6% |
| Total Occupied Housing Units | 66 | 100.0% |
Occupancy by Household Size in Rutland
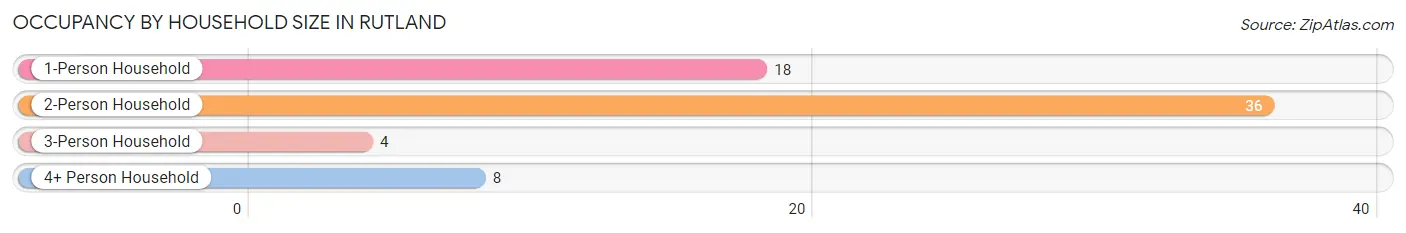
| Household Size | # Housing Units | % Housing Units |
| 1-Person Household | 18 | 27.3% |
| 2-Person Household | 36 | 54.5% |
| 3-Person Household | 4 | 6.1% |
| 4+ Person Household | 8 | 12.1% |
| Total Housing Units | 66 | 100.0% |
Occupancy by Ownership by Household Size in Rutland
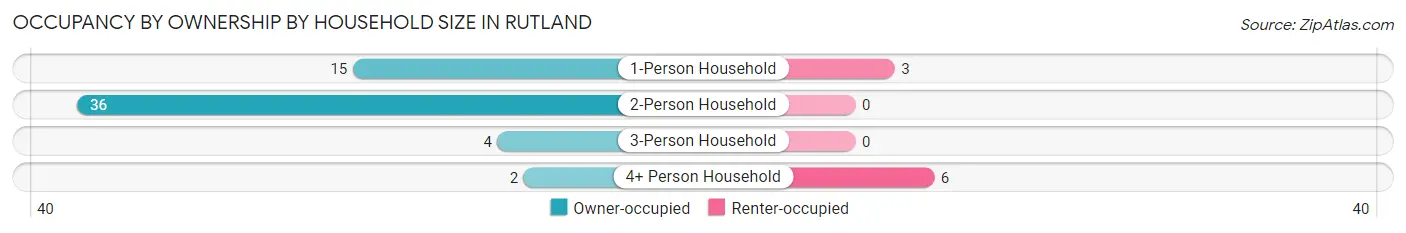
| Household Size | Owner-occupied | Renter-occupied |
| 1-Person Household | 15 (83.3%) | 3 (16.7%) |
| 2-Person Household | 36 (100.0%) | 0 (0.0%) |
| 3-Person Household | 4 (100.0%) | 0 (0.0%) |
| 4+ Person Household | 2 (25.0%) | 6 (75.0%) |
| Total Housing Units | 57 (86.4%) | 9 (13.6%) |
Occupancy by Educational Attainment in Rutland
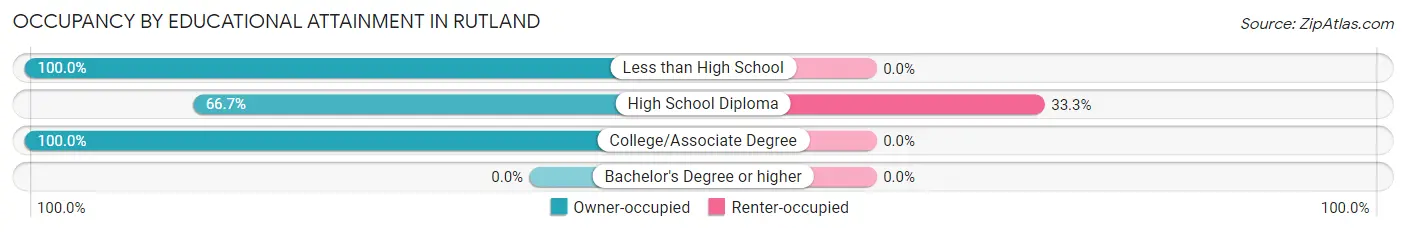
| Household Size | Owner-occupied | Renter-occupied |
| Less than High School | 5 (100.0%) | 0 (0.0%) |
| High School Diploma | 18 (66.7%) | 9 (33.3%) |
| College/Associate Degree | 34 (100.0%) | 0 (0.0%) |
| Bachelor's Degree or higher | 0 (0.0%) | 0 (0.0%) |
Occupancy by Age of Householder in Rutland
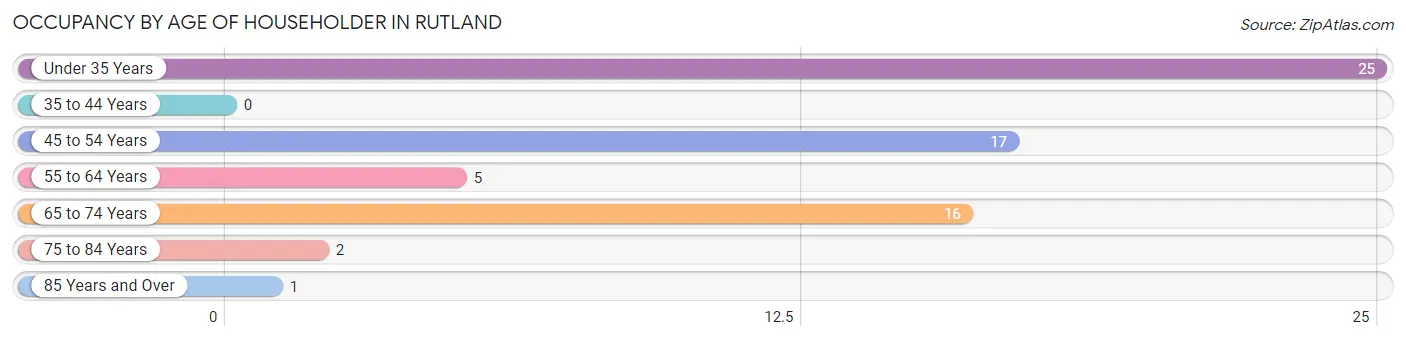
| Age Bracket | # Households | % Households |
| Under 35 Years | 25 | 37.9% |
| 35 to 44 Years | 0 | 0.0% |
| 45 to 54 Years | 17 | 25.8% |
| 55 to 64 Years | 5 | 7.6% |
| 65 to 74 Years | 16 | 24.2% |
| 75 to 84 Years | 2 | 3.0% |
| 85 Years and Over | 1 | 1.5% |
| Total | 66 | 100.0% |
Housing Finances in Rutland
Median Income by Occupancy in Rutland
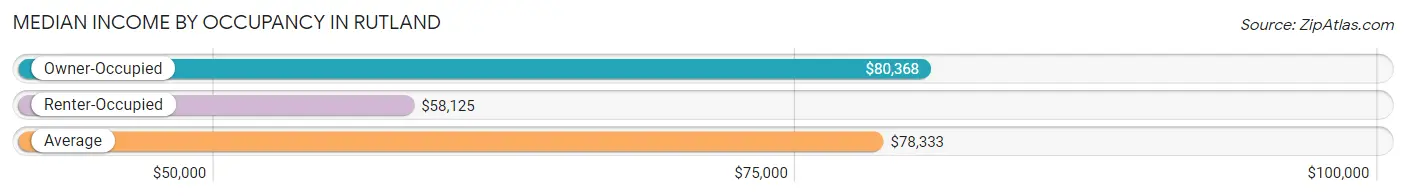
| Occupancy Type | # Households | Median Income |
| Owner-Occupied | 57 (86.4%) | $80,368 |
| Renter-Occupied | 9 (13.6%) | $58,125 |
| Average | 66 (100.0%) | $78,333 |
Occupancy by Householder Income Bracket in Rutland
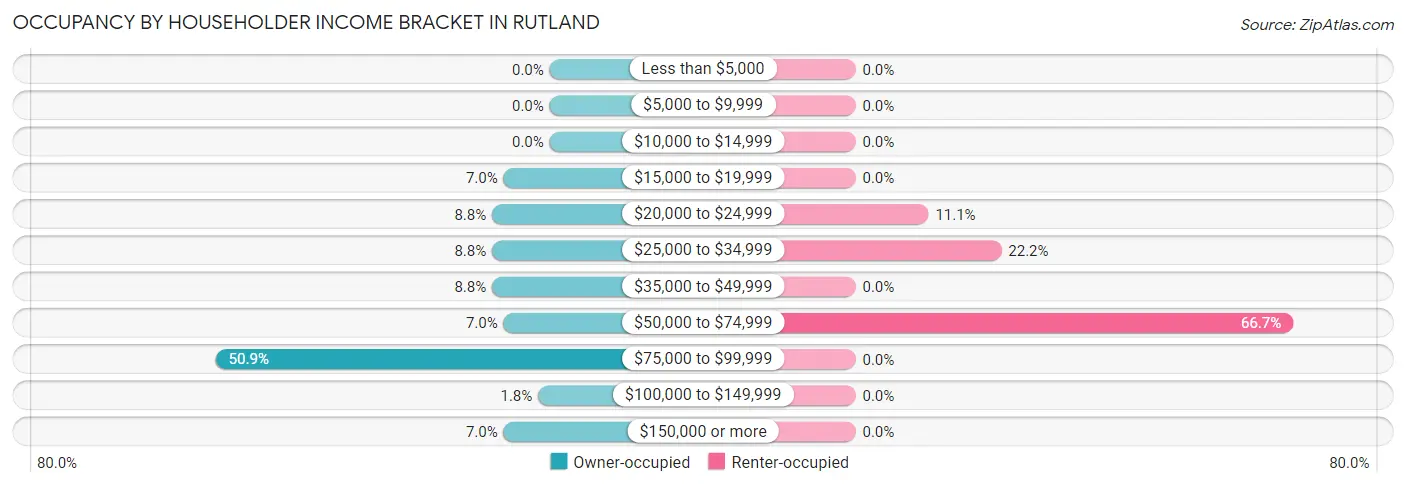
| Income Bracket | Owner-occupied | Renter-occupied |
| Less than $5,000 | 0 (0.0%) | 0 (0.0%) |
| $5,000 to $9,999 | 0 (0.0%) | 0 (0.0%) |
| $10,000 to $14,999 | 0 (0.0%) | 0 (0.0%) |
| $15,000 to $19,999 | 4 (7.0%) | 0 (0.0%) |
| $20,000 to $24,999 | 5 (8.8%) | 1 (11.1%) |
| $25,000 to $34,999 | 5 (8.8%) | 2 (22.2%) |
| $35,000 to $49,999 | 5 (8.8%) | 0 (0.0%) |
| $50,000 to $74,999 | 4 (7.0%) | 6 (66.7%) |
| $75,000 to $99,999 | 29 (50.9%) | 0 (0.0%) |
| $100,000 to $149,999 | 1 (1.8%) | 0 (0.0%) |
| $150,000 or more | 4 (7.0%) | 0 (0.0%) |
| Total | 57 (100.0%) | 9 (100.0%) |
Monthly Housing Cost Tiers in Rutland
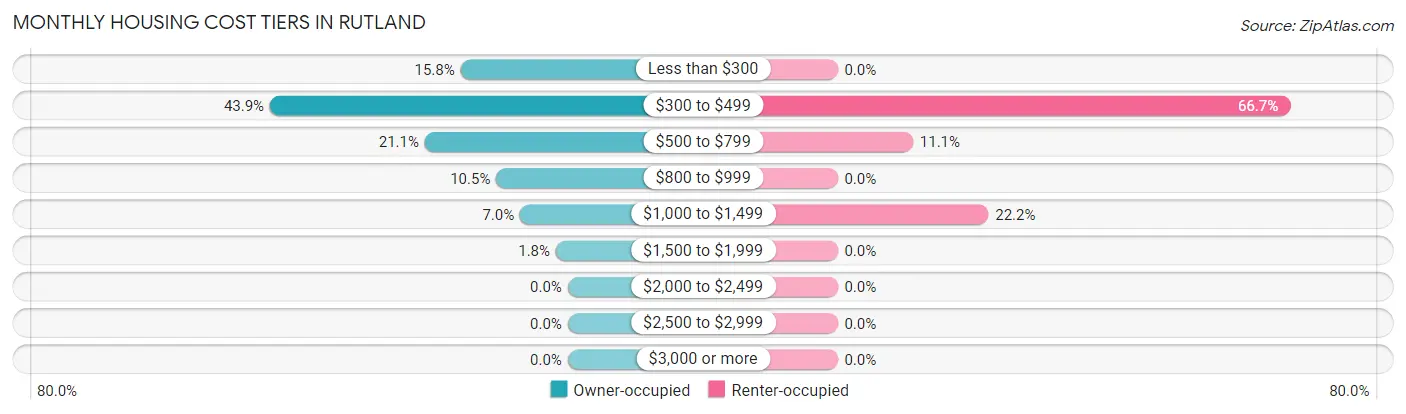
| Monthly Cost | Owner-occupied | Renter-occupied |
| Less than $300 | 9 (15.8%) | 0 (0.0%) |
| $300 to $499 | 25 (43.9%) | 6 (66.7%) |
| $500 to $799 | 12 (21.0%) | 1 (11.1%) |
| $800 to $999 | 6 (10.5%) | 0 (0.0%) |
| $1,000 to $1,499 | 4 (7.0%) | 2 (22.2%) |
| $1,500 to $1,999 | 1 (1.8%) | 0 (0.0%) |
| $2,000 to $2,499 | 0 (0.0%) | 0 (0.0%) |
| $2,500 to $2,999 | 0 (0.0%) | 0 (0.0%) |
| $3,000 or more | 0 (0.0%) | 0 (0.0%) |
| Total | 57 (100.0%) | 9 (100.0%) |
Physical Housing Characteristics in Rutland
Housing Structures in Rutland
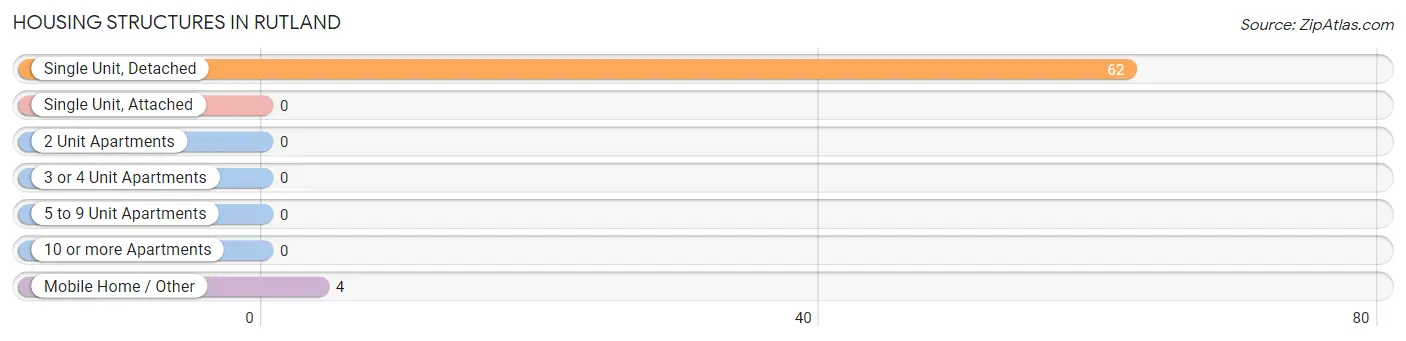
| Structure Type | # Housing Units | % Housing Units |
| Single Unit, Detached | 62 | 93.9% |
| Single Unit, Attached | 0 | 0.0% |
| 2 Unit Apartments | 0 | 0.0% |
| 3 or 4 Unit Apartments | 0 | 0.0% |
| 5 to 9 Unit Apartments | 0 | 0.0% |
| 10 or more Apartments | 0 | 0.0% |
| Mobile Home / Other | 4 | 6.1% |
| Total | 66 | 100.0% |
Housing Structures by Occupancy in Rutland
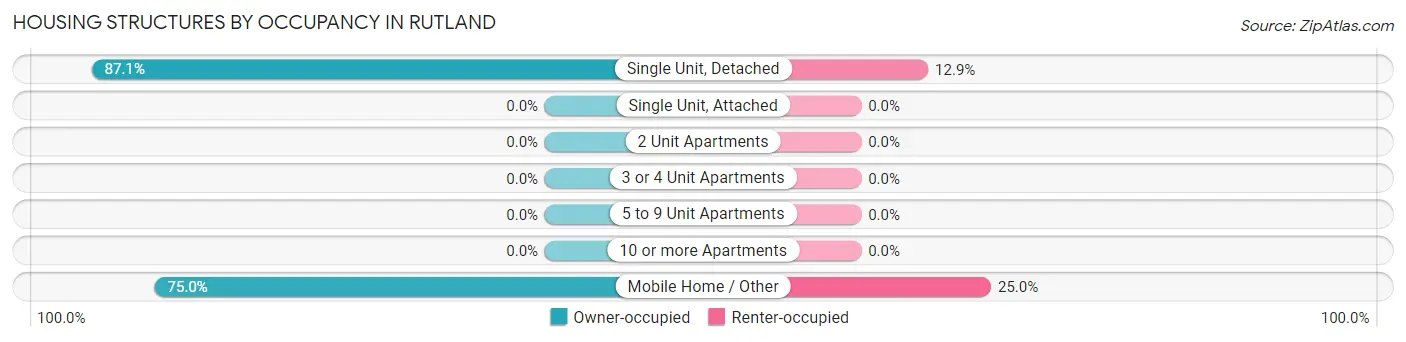
| Structure Type | Owner-occupied | Renter-occupied |
| Single Unit, Detached | 54 (87.1%) | 8 (12.9%) |
| Single Unit, Attached | 0 (0.0%) | 0 (0.0%) |
| 2 Unit Apartments | 0 (0.0%) | 0 (0.0%) |
| 3 or 4 Unit Apartments | 0 (0.0%) | 0 (0.0%) |
| 5 to 9 Unit Apartments | 0 (0.0%) | 0 (0.0%) |
| 10 or more Apartments | 0 (0.0%) | 0 (0.0%) |
| Mobile Home / Other | 3 (75.0%) | 1 (25.0%) |
| Total | 57 (86.4%) | 9 (13.6%) |
Housing Structures by Number of Rooms in Rutland
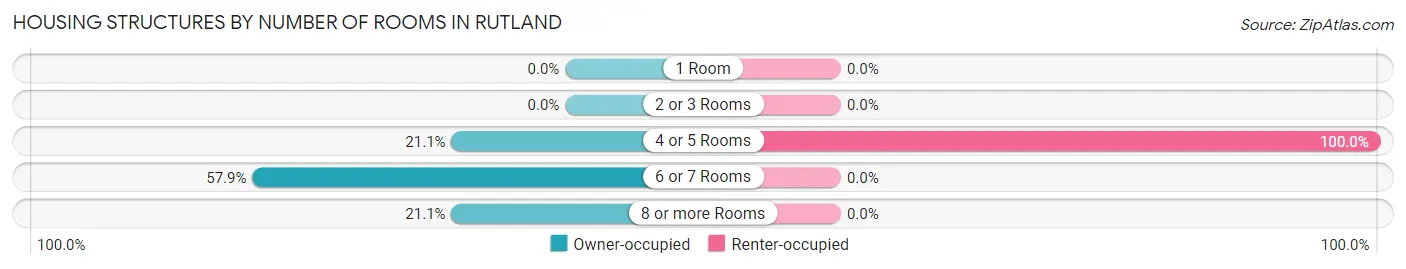
| Number of Rooms | Owner-occupied | Renter-occupied |
| 1 Room | 0 (0.0%) | 0 (0.0%) |
| 2 or 3 Rooms | 0 (0.0%) | 0 (0.0%) |
| 4 or 5 Rooms | 12 (21.0%) | 9 (100.0%) |
| 6 or 7 Rooms | 33 (57.9%) | 0 (0.0%) |
| 8 or more Rooms | 12 (21.0%) | 0 (0.0%) |
| Total | 57 (100.0%) | 9 (100.0%) |
Housing Structure by Heating Type in Rutland
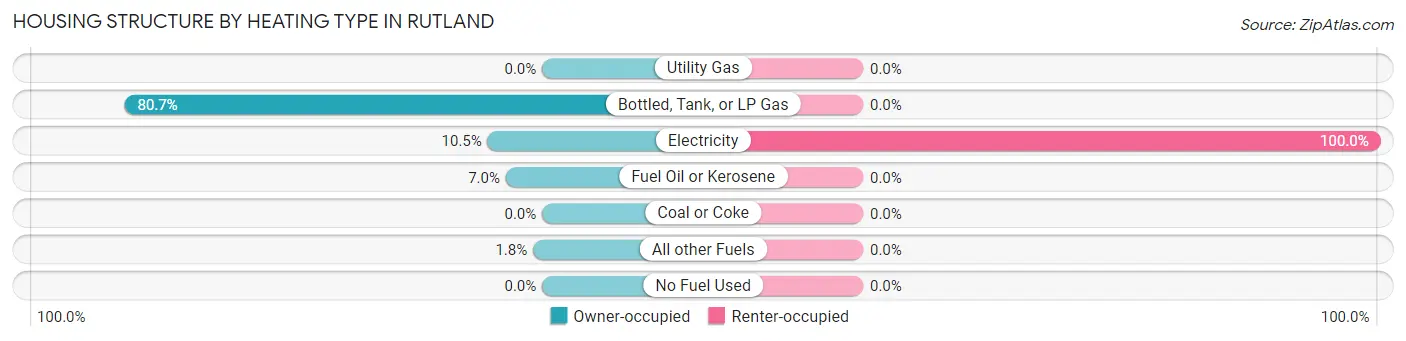
| Heating Type | Owner-occupied | Renter-occupied |
| Utility Gas | 0 (0.0%) | 0 (0.0%) |
| Bottled, Tank, or LP Gas | 46 (80.7%) | 0 (0.0%) |
| Electricity | 6 (10.5%) | 9 (100.0%) |
| Fuel Oil or Kerosene | 4 (7.0%) | 0 (0.0%) |
| Coal or Coke | 0 (0.0%) | 0 (0.0%) |
| All other Fuels | 1 (1.8%) | 0 (0.0%) |
| No Fuel Used | 0 (0.0%) | 0 (0.0%) |
| Total | 57 (100.0%) | 9 (100.0%) |
Household Vehicle Usage in Rutland
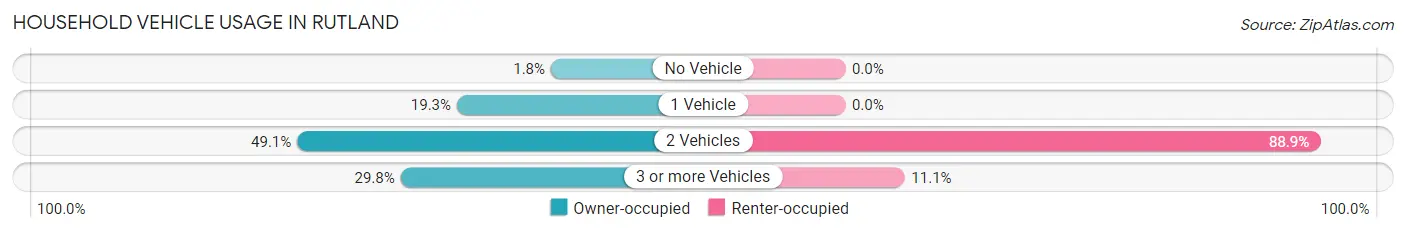
| Vehicles per Household | Owner-occupied | Renter-occupied |
| No Vehicle | 1 (1.8%) | 0 (0.0%) |
| 1 Vehicle | 11 (19.3%) | 0 (0.0%) |
| 2 Vehicles | 28 (49.1%) | 8 (88.9%) |
| 3 or more Vehicles | 17 (29.8%) | 1 (11.1%) |
| Total | 57 (100.0%) | 9 (100.0%) |
Real Estate & Mortgages in Rutland
Real Estate and Mortgage Overview in Rutland
| Characteristic | Without Mortgage | With Mortgage |
| Housing Units | 37 | 20 |
| Median Property Value | $28,000 | $67,500 |
| Median Household Income | $80,221 | $3 |
| Monthly Housing Costs | $323 | $0 |
| Real Estate Taxes | $468 | $0 |
Property Value by Mortgage Status in Rutland
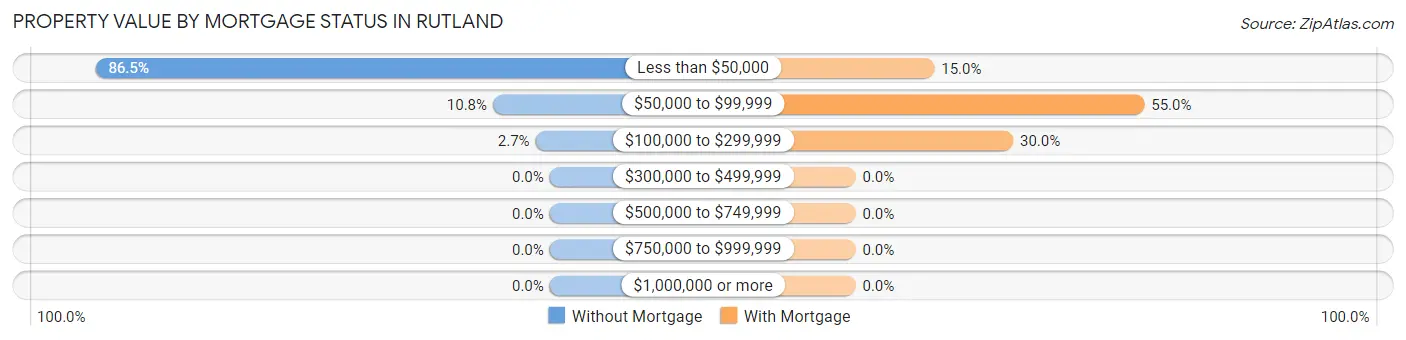
| Property Value | Without Mortgage | With Mortgage |
| Less than $50,000 | 32 (86.5%) | 3 (15.0%) |
| $50,000 to $99,999 | 4 (10.8%) | 11 (55.0%) |
| $100,000 to $299,999 | 1 (2.7%) | 6 (30.0%) |
| $300,000 to $499,999 | 0 (0.0%) | 0 (0.0%) |
| $500,000 to $749,999 | 0 (0.0%) | 0 (0.0%) |
| $750,000 to $999,999 | 0 (0.0%) | 0 (0.0%) |
| $1,000,000 or more | 0 (0.0%) | 0 (0.0%) |
| Total | 37 (100.0%) | 20 (100.0%) |
Household Income by Mortgage Status in Rutland
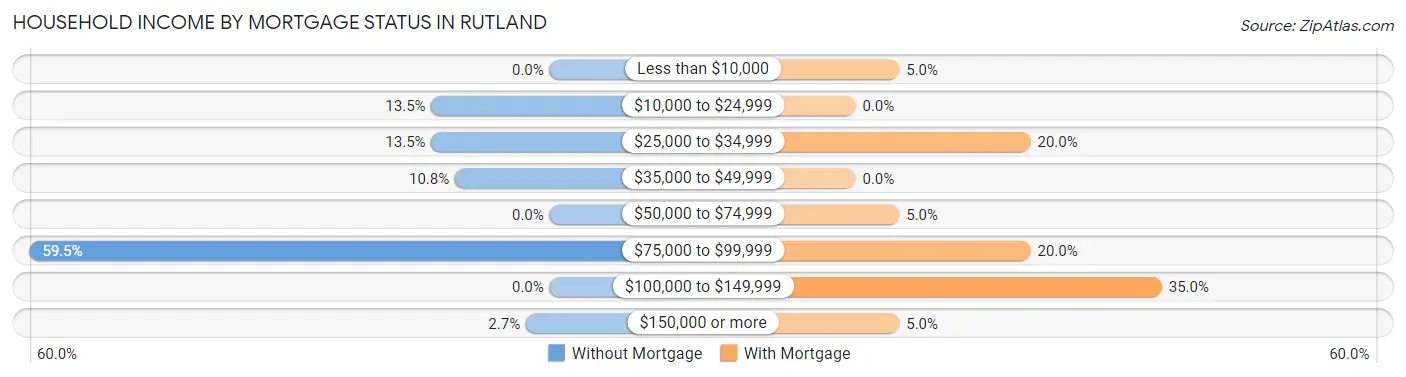
| Household Income | Without Mortgage | With Mortgage |
| Less than $10,000 | 0 (0.0%) | 1 (5.0%) |
| $10,000 to $24,999 | 5 (13.5%) | 0 (0.0%) |
| $25,000 to $34,999 | 5 (13.5%) | 4 (20.0%) |
| $35,000 to $49,999 | 4 (10.8%) | 0 (0.0%) |
| $50,000 to $74,999 | 0 (0.0%) | 1 (5.0%) |
| $75,000 to $99,999 | 22 (59.5%) | 4 (20.0%) |
| $100,000 to $149,999 | 0 (0.0%) | 7 (35.0%) |
| $150,000 or more | 1 (2.7%) | 1 (5.0%) |
| Total | 37 (100.0%) | 20 (100.0%) |
Property Value to Household Income Ratio in Rutland
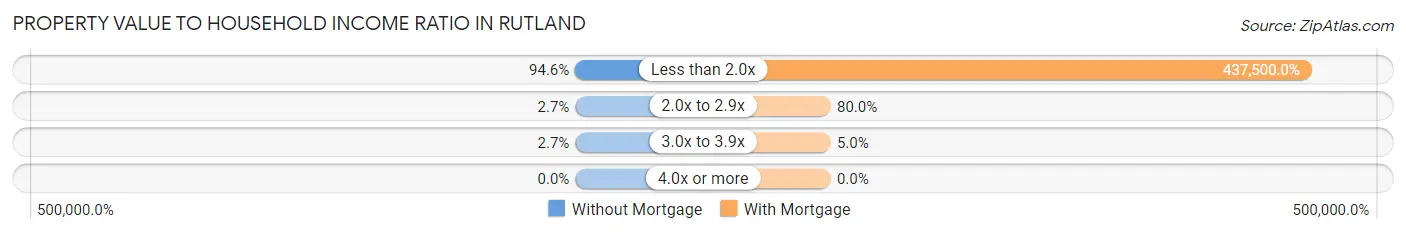
| Value-to-Income Ratio | Without Mortgage | With Mortgage |
| Less than 2.0x | 35 (94.6%) | 87,500 (437,500.0%) |
| 2.0x to 2.9x | 1 (2.7%) | 16 (80.0%) |
| 3.0x to 3.9x | 1 (2.7%) | 1 (5.0%) |
| 4.0x or more | 0 (0.0%) | 0 (0.0%) |
| Total | 37 (100.0%) | 20 (100.0%) |
Real Estate Taxes by Mortgage Status in Rutland
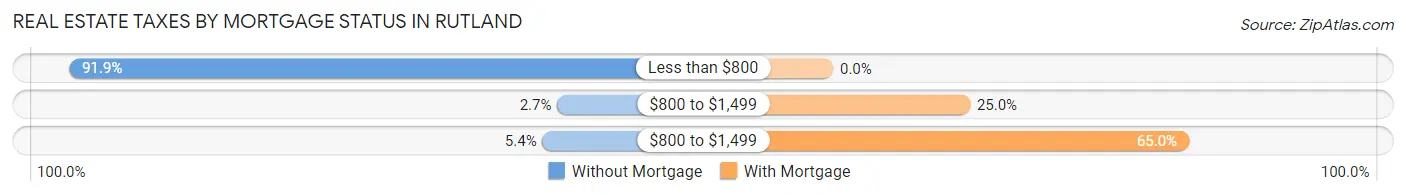
| Property Taxes | Without Mortgage | With Mortgage |
| Less than $800 | 34 (91.9%) | 0 (0.0%) |
| $800 to $1,499 | 1 (2.7%) | 5 (25.0%) |
| $800 to $1,499 | 2 (5.4%) | 13 (65.0%) |
| Total | 37 (100.0%) | 20 (100.0%) |
Health & Disability in Rutland
Health Insurance Coverage by Age in Rutland
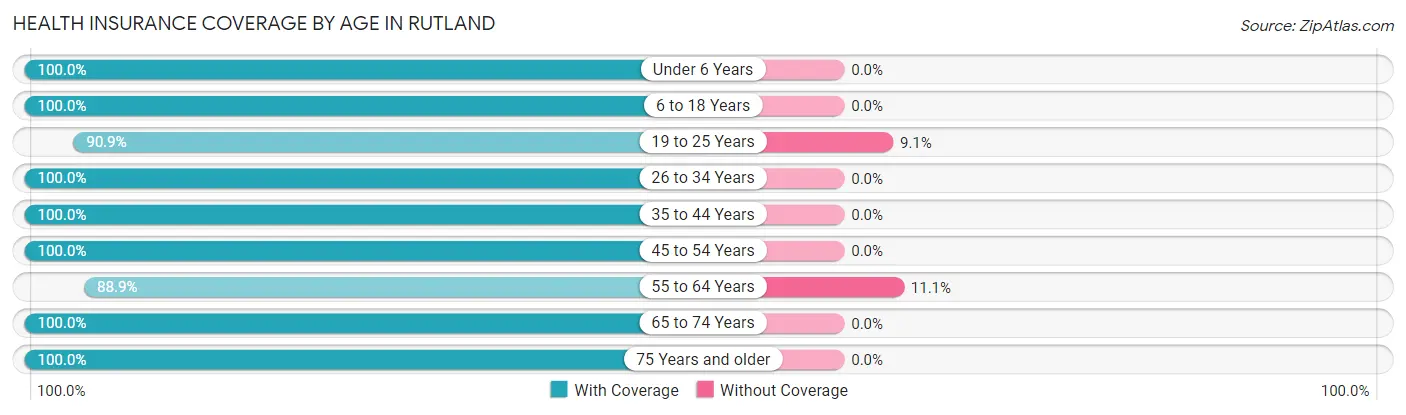
| Age Bracket | With Coverage | Without Coverage |
| Under 6 Years | 12 (100.0%) | 0 (0.0%) |
| 6 to 18 Years | 16 (100.0%) | 0 (0.0%) |
| 19 to 25 Years | 10 (90.9%) | 1 (9.1%) |
| 26 to 34 Years | 26 (100.0%) | 0 (0.0%) |
| 35 to 44 Years | 2 (100.0%) | 0 (0.0%) |
| 45 to 54 Years | 23 (100.0%) | 0 (0.0%) |
| 55 to 64 Years | 8 (88.9%) | 1 (11.1%) |
| 65 to 74 Years | 24 (100.0%) | 0 (0.0%) |
| 75 Years and older | 4 (100.0%) | 0 (0.0%) |
| Total | 125 (98.4%) | 2 (1.6%) |
Health Insurance Coverage by Citizenship Status in Rutland
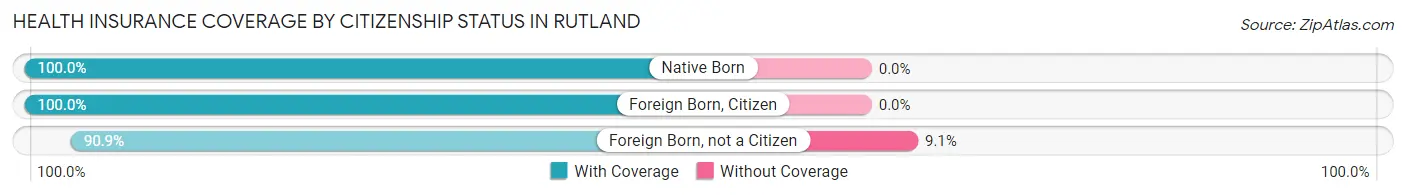
| Citizenship Status | With Coverage | Without Coverage |
| Native Born | 12 (100.0%) | 0 (0.0%) |
| Foreign Born, Citizen | 16 (100.0%) | 0 (0.0%) |
| Foreign Born, not a Citizen | 10 (90.9%) | 1 (9.1%) |
Health Insurance Coverage by Household Income in Rutland
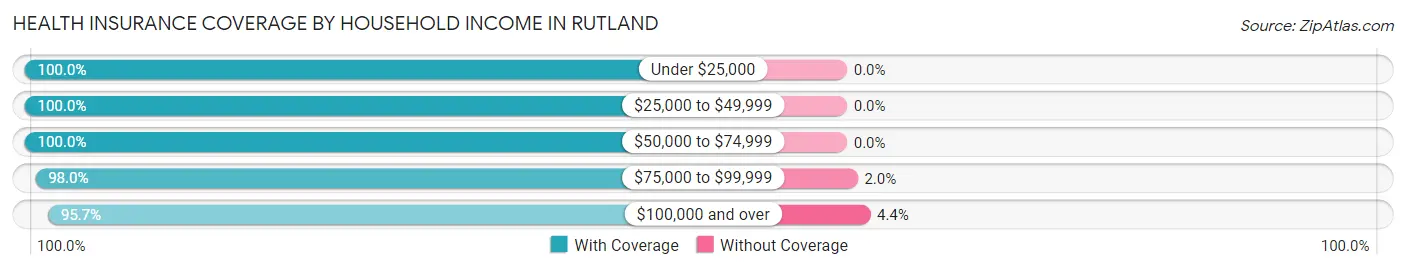
| Household Income | With Coverage | Without Coverage |
| Under $25,000 | 17 (100.0%) | 0 (0.0%) |
| $25,000 to $49,999 | 15 (100.0%) | 0 (0.0%) |
| $50,000 to $74,999 | 22 (100.0%) | 0 (0.0%) |
| $75,000 to $99,999 | 49 (98.0%) | 1 (2.0%) |
| $100,000 and over | 22 (95.7%) | 1 (4.3%) |
Public vs Private Health Insurance Coverage by Age in Rutland
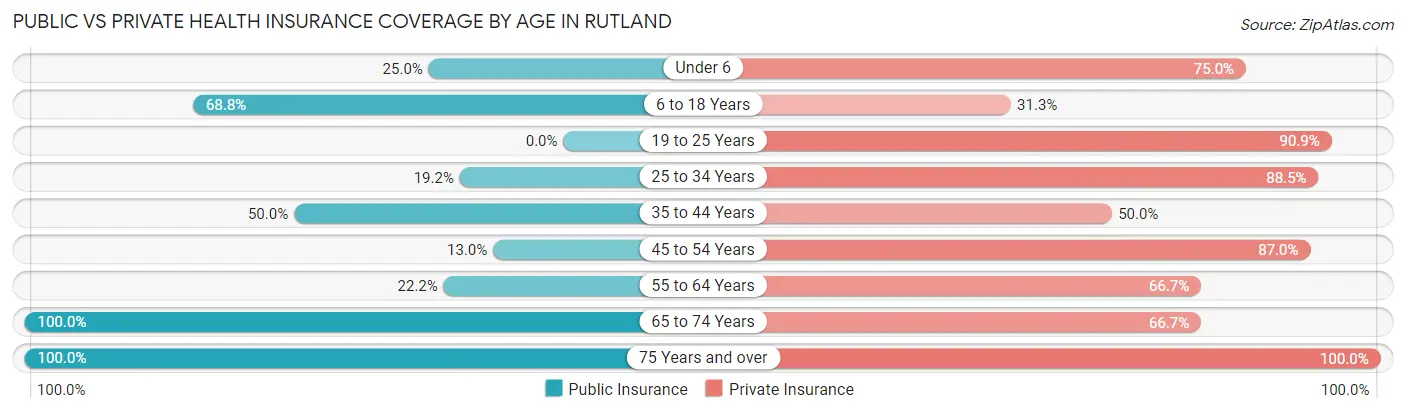
| Age Bracket | Public Insurance | Private Insurance |
| Under 6 | 3 (25.0%) | 9 (75.0%) |
| 6 to 18 Years | 11 (68.8%) | 5 (31.2%) |
| 19 to 25 Years | 0 (0.0%) | 10 (90.9%) |
| 25 to 34 Years | 5 (19.2%) | 23 (88.5%) |
| 35 to 44 Years | 1 (50.0%) | 1 (50.0%) |
| 45 to 54 Years | 3 (13.0%) | 20 (87.0%) |
| 55 to 64 Years | 2 (22.2%) | 6 (66.7%) |
| 65 to 74 Years | 24 (100.0%) | 16 (66.7%) |
| 75 Years and over | 4 (100.0%) | 4 (100.0%) |
| Total | 53 (41.7%) | 94 (74.0%) |
Disability Status by Sex by Age in Rutland
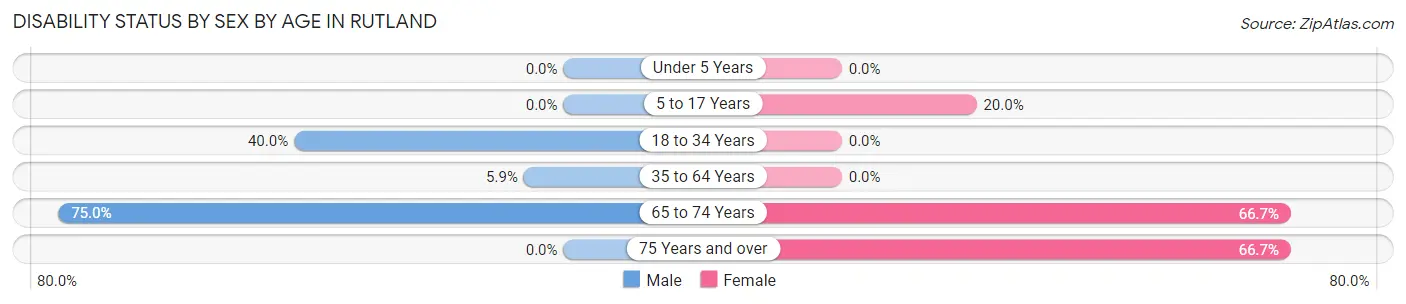
| Age Bracket | Male | Female |
| Under 5 Years | 0 (0.0%) | 0 (0.0%) |
| 5 to 17 Years | 0 (0.0%) | 1 (20.0%) |
| 18 to 34 Years | 4 (40.0%) | 0 (0.0%) |
| 35 to 64 Years | 1 (5.9%) | 0 (0.0%) |
| 65 to 74 Years | 9 (75.0%) | 8 (66.7%) |
| 75 Years and over | 0 (0.0%) | 2 (66.7%) |
Disability Class by Sex by Age in Rutland
Disability Class: Hearing Difficulty
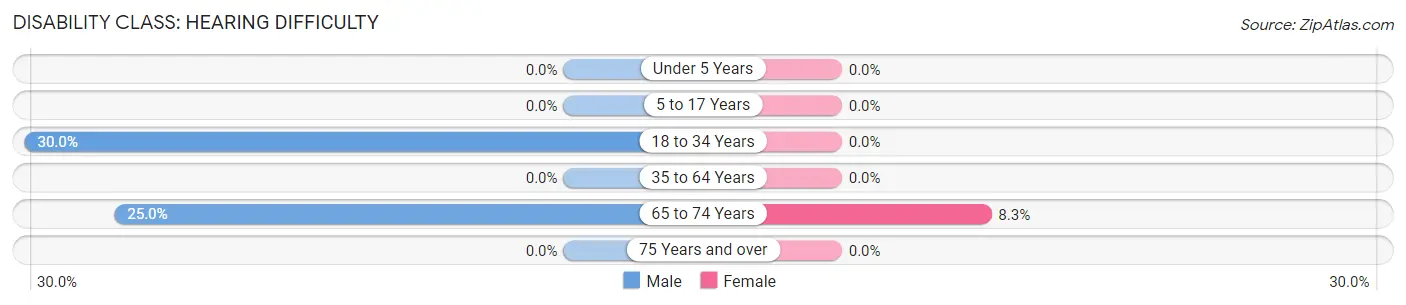
| Age Bracket | Male | Female |
| Under 5 Years | 0 (0.0%) | 0 (0.0%) |
| 5 to 17 Years | 0 (0.0%) | 0 (0.0%) |
| 18 to 34 Years | 3 (30.0%) | 0 (0.0%) |
| 35 to 64 Years | 0 (0.0%) | 0 (0.0%) |
| 65 to 74 Years | 3 (25.0%) | 1 (8.3%) |
| 75 Years and over | 0 (0.0%) | 0 (0.0%) |
Disability Class: Vision Difficulty
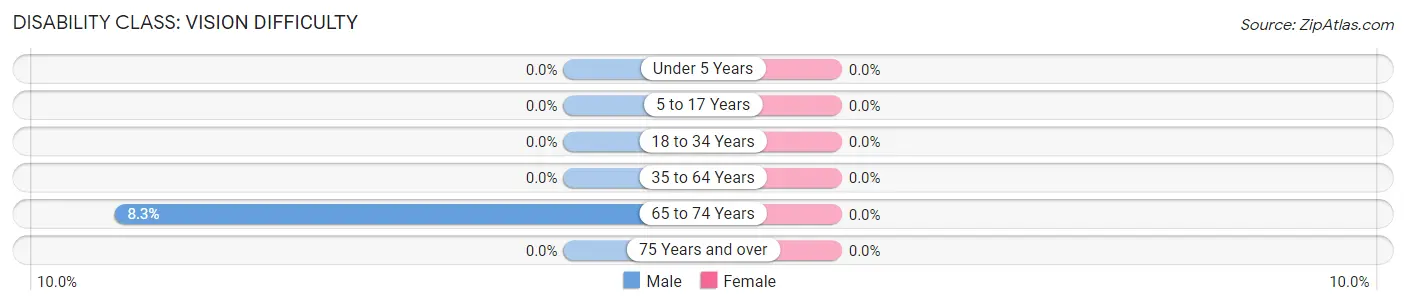
| Age Bracket | Male | Female |
| Under 5 Years | 0 (0.0%) | 0 (0.0%) |
| 5 to 17 Years | 0 (0.0%) | 0 (0.0%) |
| 18 to 34 Years | 0 (0.0%) | 0 (0.0%) |
| 35 to 64 Years | 0 (0.0%) | 0 (0.0%) |
| 65 to 74 Years | 1 (8.3%) | 0 (0.0%) |
| 75 Years and over | 0 (0.0%) | 0 (0.0%) |
Disability Class: Cognitive Difficulty
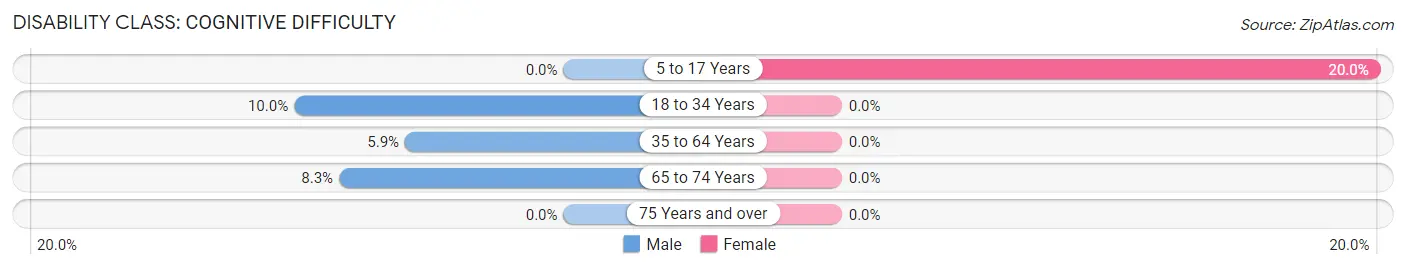
| Age Bracket | Male | Female |
| 5 to 17 Years | 0 (0.0%) | 1 (20.0%) |
| 18 to 34 Years | 1 (10.0%) | 0 (0.0%) |
| 35 to 64 Years | 1 (5.9%) | 0 (0.0%) |
| 65 to 74 Years | 1 (8.3%) | 0 (0.0%) |
| 75 Years and over | 0 (0.0%) | 0 (0.0%) |
Disability Class: Ambulatory Difficulty
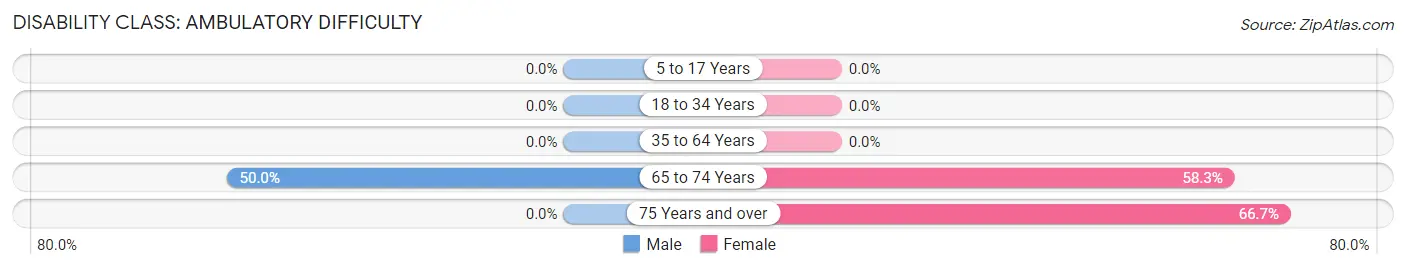
| Age Bracket | Male | Female |
| 5 to 17 Years | 0 (0.0%) | 0 (0.0%) |
| 18 to 34 Years | 0 (0.0%) | 0 (0.0%) |
| 35 to 64 Years | 0 (0.0%) | 0 (0.0%) |
| 65 to 74 Years | 6 (50.0%) | 7 (58.3%) |
| 75 Years and over | 0 (0.0%) | 2 (66.7%) |
Disability Class: Self-Care Difficulty
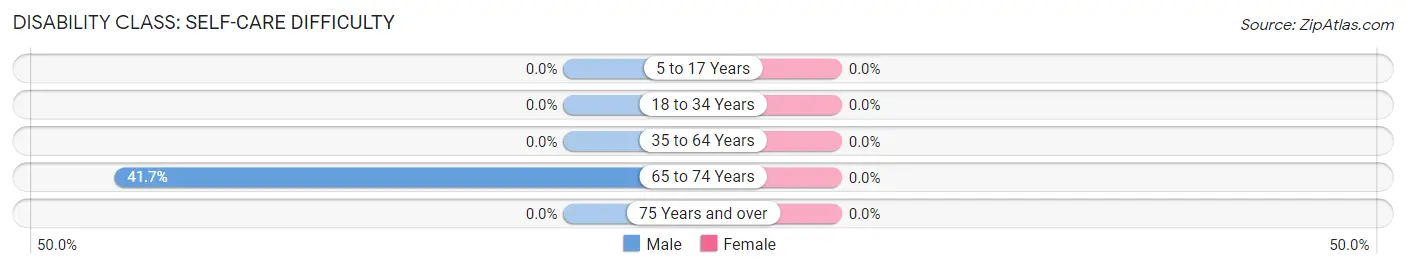
| Age Bracket | Male | Female |
| 5 to 17 Years | 0 (0.0%) | 0 (0.0%) |
| 18 to 34 Years | 0 (0.0%) | 0 (0.0%) |
| 35 to 64 Years | 0 (0.0%) | 0 (0.0%) |
| 65 to 74 Years | 5 (41.7%) | 0 (0.0%) |
| 75 Years and over | 0 (0.0%) | 0 (0.0%) |
Technology Access in Rutland
Computing Device Access in Rutland
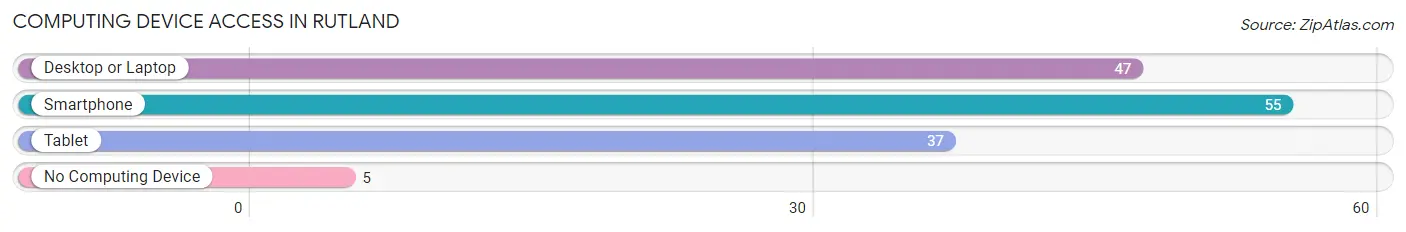
| Device Type | # Households | % Households |
| Desktop or Laptop | 47 | 71.2% |
| Smartphone | 55 | 83.3% |
| Tablet | 37 | 56.1% |
| No Computing Device | 5 | 7.6% |
| Total | 66 | 100.0% |
Internet Access in Rutland
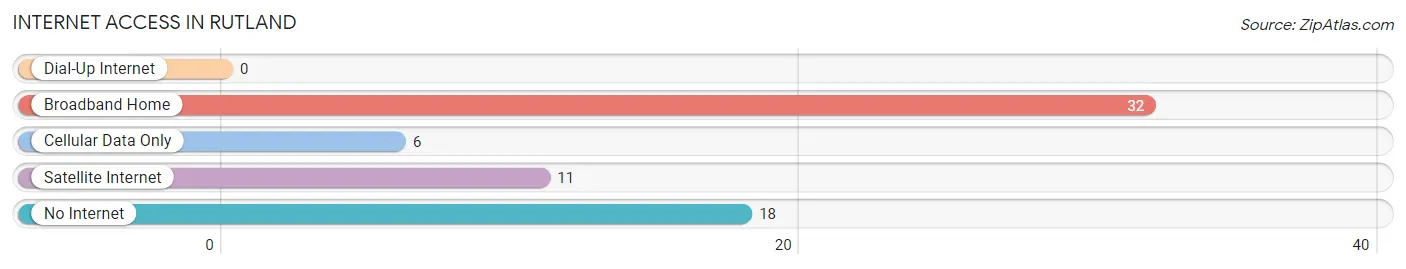
| Internet Type | # Households | % Households |
| Dial-Up Internet | 0 | 0.0% |
| Broadband Home | 32 | 48.5% |
| Cellular Data Only | 6 | 9.1% |
| Satellite Internet | 11 | 16.7% |
| No Internet | 18 | 27.3% |
| Total | 66 | 100.0% |
Rutland Summary
Rutland, Iowa is a small town located in the northwest corner of the state, in the county of Clay. It is situated on the banks of the Little Sioux River, and is surrounded by rolling hills and farmland. The town has a population of just over 500 people, and is known for its small-town charm and friendly atmosphere.
Rutland was founded in 1856 by a group of settlers from Ohio. The town was named after the town of Rutland, Ohio, which was the hometown of the settlers. The town was originally a farming community, and the main crops grown were corn, wheat, and oats. The town also had a sawmill, a gristmill, and a blacksmith shop.
The town grew slowly over the years, and by the turn of the century, it had a population of around 500 people. The town was home to several churches, a school, a post office, and a few stores. The town also had a hotel, a bank, and a newspaper.
In the early 1900s, the town began to experience a decline in population. This was due to the fact that the railroad bypassed the town, and the town was no longer a major stop on the line. The town also experienced a decline in the number of businesses, as many of the businesses had closed or moved away.
In the late 1950s, the town began to experience a resurgence in population. This was due to the fact that the town was chosen as the site of a new state park, which brought in many visitors and tourists. The town also experienced a growth in businesses, as new stores and restaurants opened up.
Today, Rutland is a small town with a population of just over 500 people. The town is still primarily a farming community, and the main crops grown are corn, wheat, and oats. The town also has a few stores, restaurants, and a post office. The town is also home to several churches, a school, and a newspaper.
The economy of Rutland is largely based on agriculture. The town is home to several farms, and the main crops grown are corn, wheat, and oats. The town also has a few businesses, such as a grocery store, a hardware store, and a few restaurants.
The demographics of Rutland are largely white, with a small percentage of African Americans and Hispanics. The median household income is around $40,000, and the median home value is around $90,000. The town has a low unemployment rate, and the crime rate is low.
Rutland is a small town with a lot of charm and a friendly atmosphere. The town is home to several churches, a school, and a newspaper. The town is also home to several farms, and the main crops grown are corn, wheat, and oats. The town also has a few businesses, such as a grocery store, a hardware store, and a few restaurants. The town has a low unemployment rate, and the crime rate is low. The town is a great place to live, and it is a great place to visit.
Common Questions
What is Per Capita Income in Rutland?
Per Capita income in Rutland is $35,013.
What is the Median Family Income in Rutland?
Median Family Income in Rutland is $80,441.
What is the Median Household income in Rutland?
Median Household Income in Rutland is $78,333.
What is Inequality or Gini Index in Rutland?
Inequality or Gini Index in Rutland is 0.32.
What is the Total Population of Rutland?
Total Population of Rutland is 127.
What is the Total Male Population of Rutland?
Total Male Population of Rutland is 52.
What is the Total Female Population of Rutland?
Total Female Population of Rutland is 75.
What is the Ratio of Males per 100 Females in Rutland?
There are 69.33 Males per 100 Females in Rutland.
What is the Ratio of Females per 100 Males in Rutland?
There are 144.23 Females per 100 Males in Rutland.
What is the Median Population Age in Rutland?
Median Population Age in Rutland is 33.5 Years.
What is the Average Family Size in Rutland
Average Family Size in Rutland is 2.2 People.
What is the Average Household Size in Rutland
Average Household Size in Rutland is 1.9 People.
How Large is the Labor Force in Rutland?
There are 78 People in the Labor Forcein in Rutland.
What is the Percentage of People in the Labor Force in Rutland?
74.3% of People are in the Labor Force in Rutland.
What is the Unemployment Rate in Rutland?
Unemployment Rate in Rutland is 1.3%.