Struble, IA Map & Demographics
Struble Map
Struble Overview
$34,654
PER CAPITA INCOME
$93,125
AVG FAMILY INCOME
$93,750
AVG HOUSEHOLD INCOME
22.5%
WAGE / INCOME GAP [ % ]
77.5¢/ $1
WAGE / INCOME GAP [ $ ]
0.24
INEQUALITY / GINI INDEX
84
TOTAL POPULATION
38
MALE POPULATION
46
FEMALE POPULATION
82.61
MALES / 100 FEMALES
121.05
FEMALES / 100 MALES
49.5
MEDIAN AGE
2.5
AVG FAMILY SIZE
2.2
AVG HOUSEHOLD SIZE
51
LABOR FORCE [ PEOPLE ]
71.8%
PERCENT IN LABOR FORCE
Struble Area Codes
Income in Struble
Income Overview in Struble
Per Capita Income in Struble is $34,654, while median incomes of families and households are $93,125 and $93,750 respectively.
| Characteristic | Number | Measure |
| Per Capita Income | 84 | $34,654 |
| Median Family Income | 27 | $93,125 |
| Mean Family Income | 27 | $87,811 |
| Median Household Income | 38 | $93,750 |
| Mean Household Income | 38 | $80,953 |
| Income Deficit | 27 | $0 |
| Wage / Income Gap (%) | 84 | 22.50% |
| Wage / Income Gap ($) | 84 | 77.50¢ per $1 |
| Gini / Inequality Index | 84 | 0.24 |
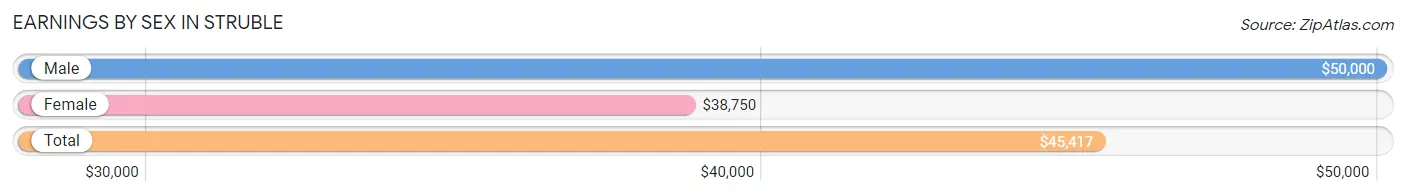
Earnings by Sex in Struble
Average Earnings in Struble are $45,417, $50,000 for men and $38,750 for women, a difference of 22.5%.
| Sex | Number | Average Earnings |
| Male | 28 (50.9%) | $50,000 |
| Female | 27 (49.1%) | $38,750 |
| Total | 55 (100.0%) | $45,417 |
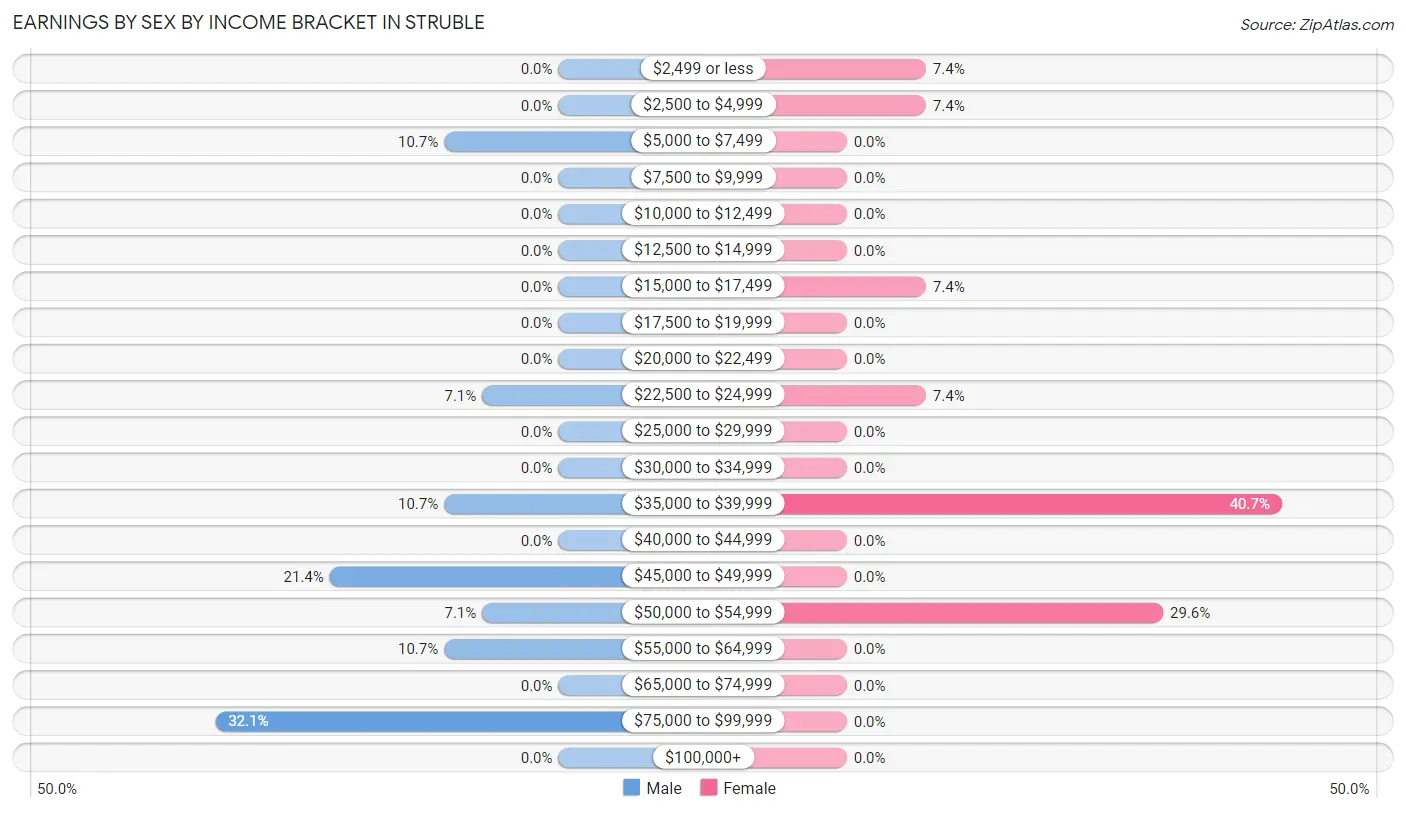
Earnings by Sex by Income Bracket in Struble
The most common earnings brackets in Struble are $75,000 to $99,999 for men (9 | 32.1%) and $35,000 to $39,999 for women (11 | 40.7%).
| Income | Male | Female |
| $2,499 or less | 0 (0.0%) | 2 (7.4%) |
| $2,500 to $4,999 | 0 (0.0%) | 2 (7.4%) |
| $5,000 to $7,499 | 3 (10.7%) | 0 (0.0%) |
| $7,500 to $9,999 | 0 (0.0%) | 0 (0.0%) |
| $10,000 to $12,499 | 0 (0.0%) | 0 (0.0%) |
| $12,500 to $14,999 | 0 (0.0%) | 0 (0.0%) |
| $15,000 to $17,499 | 0 (0.0%) | 2 (7.4%) |
| $17,500 to $19,999 | 0 (0.0%) | 0 (0.0%) |
| $20,000 to $22,499 | 0 (0.0%) | 0 (0.0%) |
| $22,500 to $24,999 | 2 (7.1%) | 2 (7.4%) |
| $25,000 to $29,999 | 0 (0.0%) | 0 (0.0%) |
| $30,000 to $34,999 | 0 (0.0%) | 0 (0.0%) |
| $35,000 to $39,999 | 3 (10.7%) | 11 (40.7%) |
| $40,000 to $44,999 | 0 (0.0%) | 0 (0.0%) |
| $45,000 to $49,999 | 6 (21.4%) | 0 (0.0%) |
| $50,000 to $54,999 | 2 (7.1%) | 8 (29.6%) |
| $55,000 to $64,999 | 3 (10.7%) | 0 (0.0%) |
| $65,000 to $74,999 | 0 (0.0%) | 0 (0.0%) |
| $75,000 to $99,999 | 9 (32.1%) | 0 (0.0%) |
| $100,000+ | 0 (0.0%) | 0 (0.0%) |
| Total | 28 (100.0%) | 27 (100.0%) |
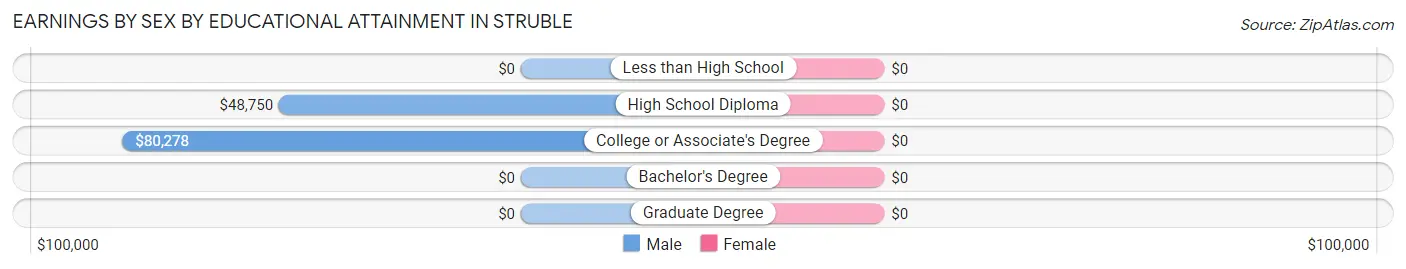
Earnings by Sex by Educational Attainment in Struble
| Educational Attainment | Male Income | Female Income |
| Less than High School | - | - |
| High School Diploma | $48,750 | $0 |
| College or Associate's Degree | $80,278 | $0 |
| Bachelor's Degree | - | - |
| Graduate Degree | - | - |
| Total | $51,250 | $38,068 |
Family Income in Struble
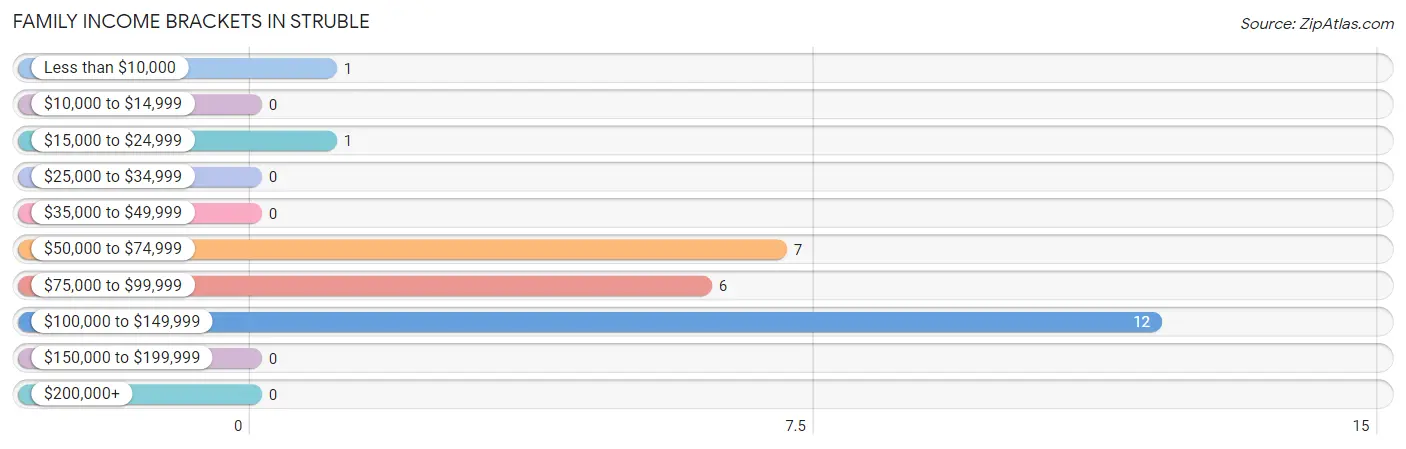
Family Income Brackets in Struble
According to the Struble family income data, there are 12 families falling into the $100,000 to $149,999 income range, which is the most common income bracket and makes up 44.4% of all families.
| Income Bracket | # Families | % Families |
| Less than $10,000 | 1 | 3.7% |
| $10,000 to $14,999 | 0 | 0.0% |
| $15,000 to $24,999 | 1 | 3.7% |
| $25,000 to $34,999 | 0 | 0.0% |
| $35,000 to $49,999 | 0 | 0.0% |
| $50,000 to $74,999 | 7 | 25.9% |
| $75,000 to $99,999 | 6 | 22.2% |
| $100,000 to $149,999 | 12 | 44.4% |
| $150,000 to $199,999 | 0 | 0.0% |
| $200,000+ | 0 | 0.0% |
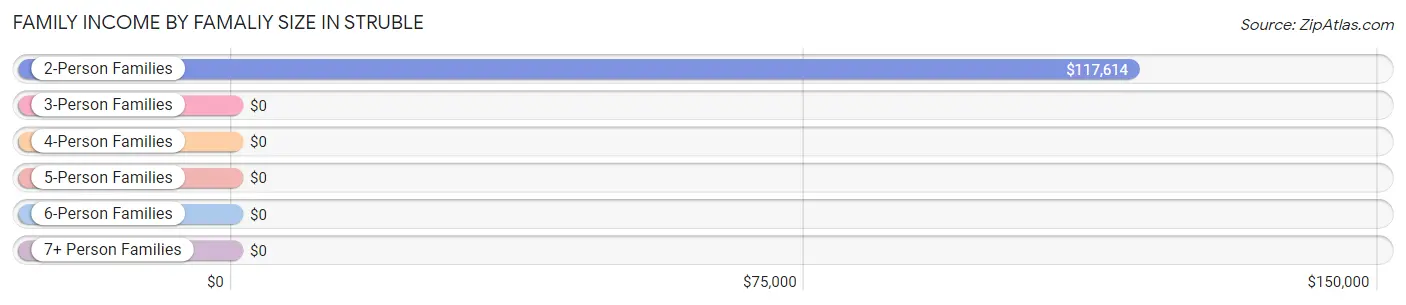
Family Income by Famaliy Size in Struble
2-person families (21 | 77.8%) account for the highest median family income in Struble with $117,614 per family, while 2-person families (21 | 77.8%) have the highest median income of $58,807 per family member.
| Income Bracket | # Families | Median Income |
| 2-Person Families | 21 (77.8%) | $117,614 |
| 3-Person Families | 2 (7.4%) | $0 |
| 4-Person Families | 4 (14.8%) | $0 |
| 5-Person Families | 0 (0.0%) | $0 |
| 6-Person Families | 0 (0.0%) | $0 |
| 7+ Person Families | 0 (0.0%) | $0 |
| Total | 27 (100.0%) | $93,125 |
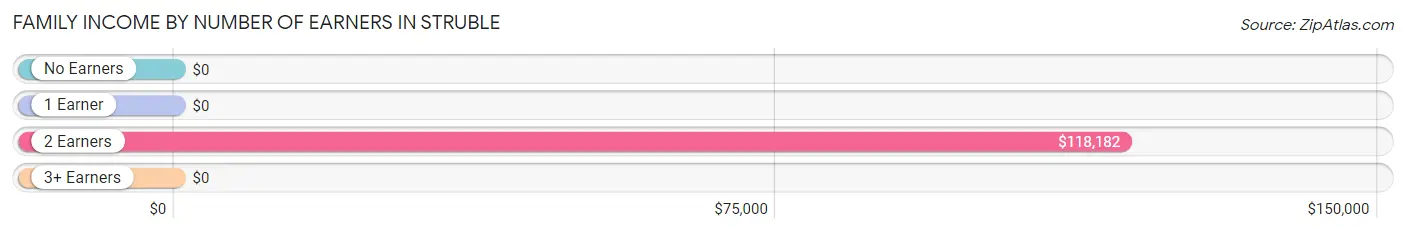
Family Income by Number of Earners in Struble
| Number of Earners | # Families | Median Income |
| No Earners | 4 (14.8%) | $0 |
| 1 Earner | 5 (18.5%) | $0 |
| 2 Earners | 16 (59.3%) | $118,182 |
| 3+ Earners | 2 (7.4%) | $0 |
| Total | 27 (100.0%) | $93,125 |
Household Income in Struble
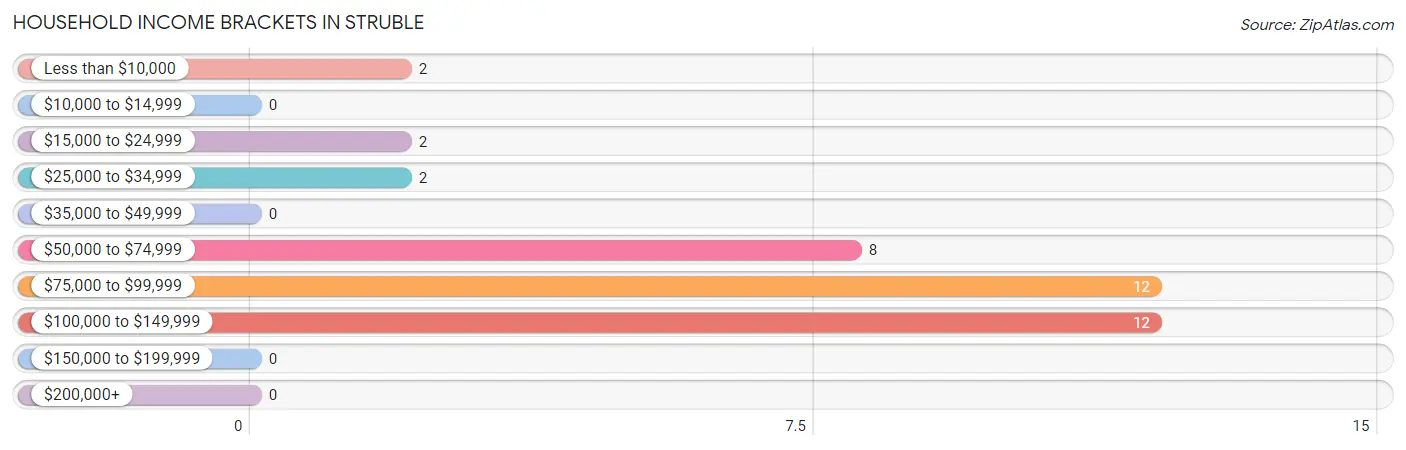
Household Income Brackets in Struble
With 12 households falling in the category, the $75,000 to $99,999 income range is the most frequent in Struble, accounting for 31.6% of all households.
| Income Bracket | # Households | % Households |
| Less than $10,000 | 2 | 5.3% |
| $10,000 to $14,999 | 0 | 0.0% |
| $15,000 to $24,999 | 2 | 5.3% |
| $25,000 to $34,999 | 2 | 5.3% |
| $35,000 to $49,999 | 0 | 0.0% |
| $50,000 to $74,999 | 8 | 21.1% |
| $75,000 to $99,999 | 12 | 31.6% |
| $100,000 to $149,999 | 12 | 31.6% |
| $150,000 to $199,999 | 0 | 0.0% |
| $200,000+ | 0 | 0.0% |
Household Income by Householder Age in Struble
The median household income in Struble is $93,750, with the highest median household income of $118,295 found in the 45 to 64 years age bracket for the primary householder. A total of 15 households (39.5%) fall into this category. Meanwhile, the 15 to 24 years age bracket for the primary householder has the lowest median household income of $0, with 7 households (18.4%) in this group.
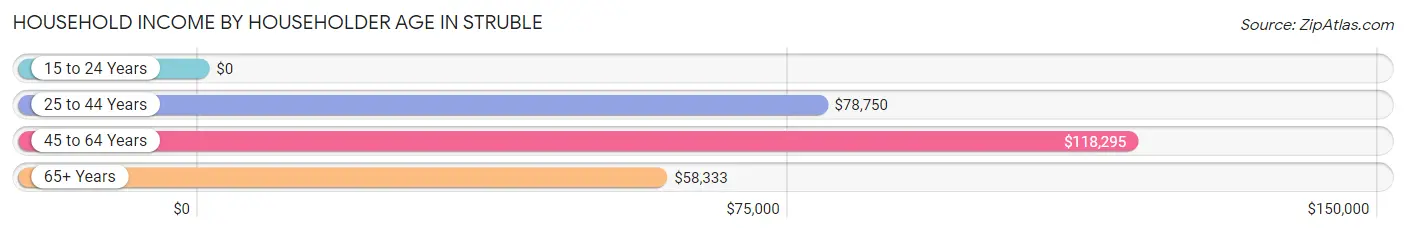
| Income Bracket | # Households | Median Income |
| 15 to 24 Years | 7 (18.4%) | $0 |
| 25 to 44 Years | 6 (15.8%) | $78,750 |
| 45 to 64 Years | 15 (39.5%) | $118,295 |
| 65+ Years | 10 (26.3%) | $58,333 |
| Total | 38 (100.0%) | $93,750 |
Poverty in Struble
Income Below Poverty by Sex and Age in Struble
With 7.9% poverty level for males and 6.8% for females among the residents of Struble, 55 to 64 year old males and 55 to 64 year old females are the most vulnerable to poverty, with 3 males (50.0%) and 1 females (16.7%) in their respective age groups living below the poverty level.
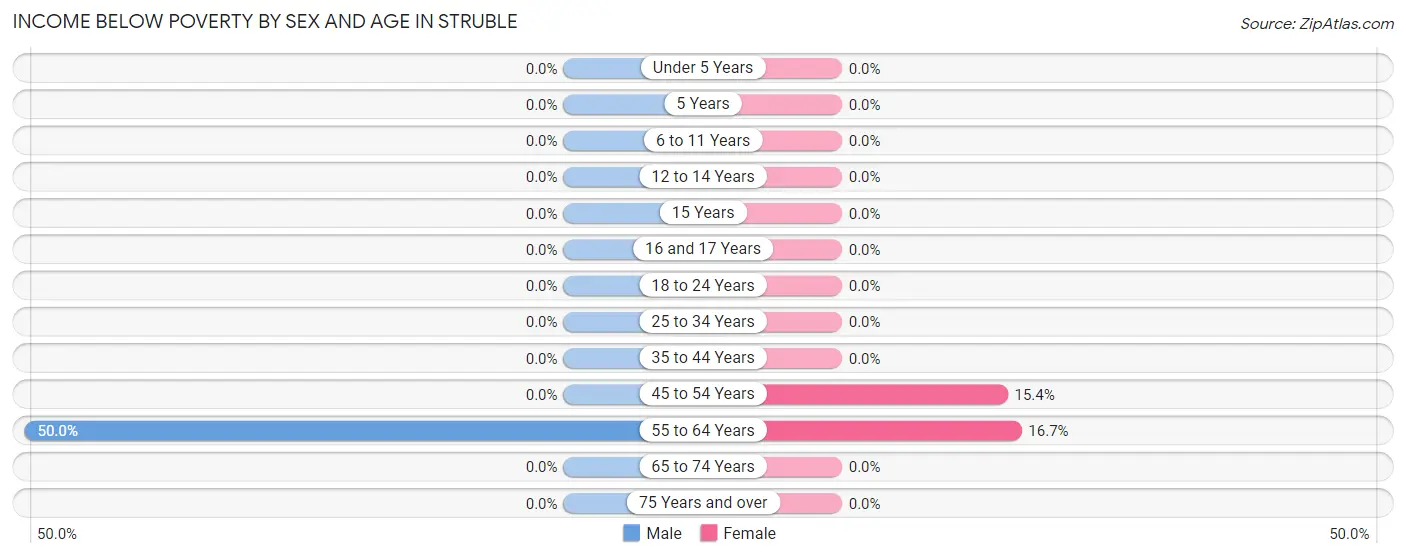
| Age Bracket | Male | Female |
| Under 5 Years | 0 (0.0%) | 0 (0.0%) |
| 5 Years | 0 (0.0%) | 0 (0.0%) |
| 6 to 11 Years | 0 (0.0%) | 0 (0.0%) |
| 12 to 14 Years | 0 (0.0%) | 0 (0.0%) |
| 15 Years | 0 (0.0%) | 0 (0.0%) |
| 16 and 17 Years | 0 (0.0%) | 0 (0.0%) |
| 18 to 24 Years | 0 (0.0%) | 0 (0.0%) |
| 25 to 34 Years | 0 (0.0%) | 0 (0.0%) |
| 35 to 44 Years | 0 (0.0%) | 0 (0.0%) |
| 45 to 54 Years | 0 (0.0%) | 2 (15.4%) |
| 55 to 64 Years | 3 (50.0%) | 1 (16.7%) |
| 65 to 74 Years | 0 (0.0%) | 0 (0.0%) |
| 75 Years and over | 0 (0.0%) | 0 (0.0%) |
| Total | 3 (7.9%) | 3 (6.8%) |
Income Above Poverty by Sex and Age in Struble
According to the poverty statistics in Struble, males aged under 5 years and females aged under 5 years are the age groups that are most secure financially, with 100.0% of males and 100.0% of females in these age groups living above the poverty line.
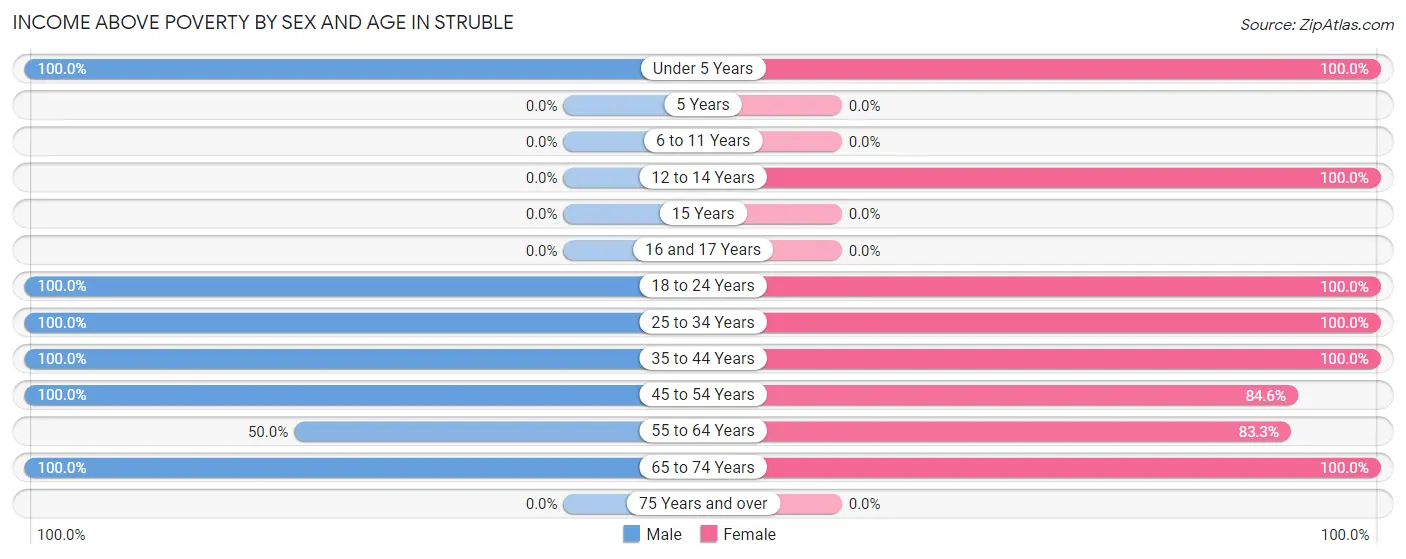
| Age Bracket | Male | Female |
| Under 5 Years | 3 (100.0%) | 5 (100.0%) |
| 5 Years | 0 (0.0%) | 0 (0.0%) |
| 6 to 11 Years | 0 (0.0%) | 0 (0.0%) |
| 12 to 14 Years | 0 (0.0%) | 3 (100.0%) |
| 15 Years | 0 (0.0%) | 0 (0.0%) |
| 16 and 17 Years | 0 (0.0%) | 0 (0.0%) |
| 18 to 24 Years | 3 (100.0%) | 6 (100.0%) |
| 25 to 34 Years | 7 (100.0%) | 4 (100.0%) |
| 35 to 44 Years | 2 (100.0%) | 2 (100.0%) |
| 45 to 54 Years | 9 (100.0%) | 11 (84.6%) |
| 55 to 64 Years | 3 (50.0%) | 5 (83.3%) |
| 65 to 74 Years | 8 (100.0%) | 5 (100.0%) |
| 75 Years and over | 0 (0.0%) | 0 (0.0%) |
| Total | 35 (92.1%) | 41 (93.2%) |
Income Below Poverty Among Married-Couple Families in Struble
The poverty statistics for married-couple families in Struble show that 7.4% or 2 of the total 27 families live below the poverty line. Families with no children have the highest poverty rate of 8.7%, comprising of 2 families. On the other hand, families with 1 or 2 children have the lowest poverty rate of 0.0%, which includes 0 families.
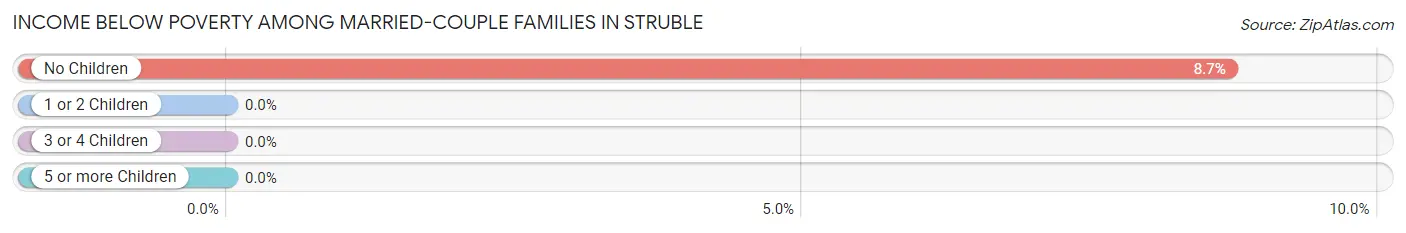
| Children | Above Poverty | Below Poverty |
| No Children | 21 (91.3%) | 2 (8.7%) |
| 1 or 2 Children | 4 (100.0%) | 0 (0.0%) |
| 3 or 4 Children | 0 (0.0%) | 0 (0.0%) |
| 5 or more Children | 0 (0.0%) | 0 (0.0%) |
| Total | 25 (92.6%) | 2 (7.4%) |
Income Below Poverty Among Single-Parent Households in Struble
| Children | Single Father | Single Mother |
| No Children | 0 (0.0%) | 0 (0.0%) |
| 1 or 2 Children | 0 (0.0%) | 0 (0.0%) |
| 3 or 4 Children | 0 (0.0%) | 0 (0.0%) |
| 5 or more Children | 0 (0.0%) | 0 (0.0%) |
| Total | 0 (0.0%) | 0 (0.0%) |
Income Below Poverty Among Married-Couple vs Single-Parent Households in Struble
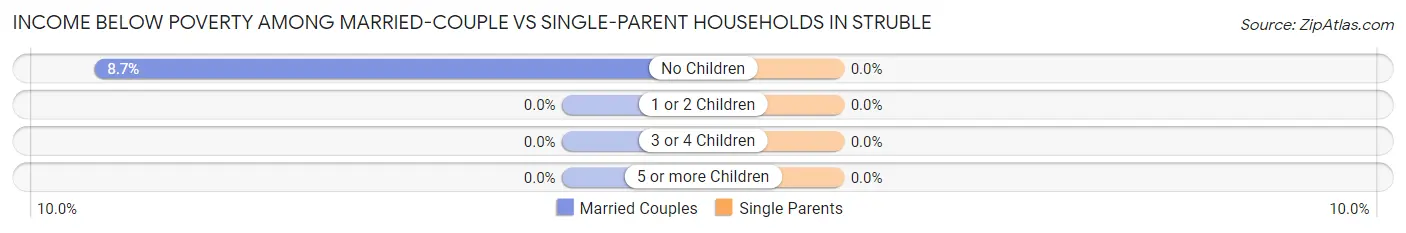
| Children | Married-Couple Families | Single-Parent Households |
| No Children | 2 (8.7%) | 0 (0.0%) |
| 1 or 2 Children | 0 (0.0%) | 0 (0.0%) |
| 3 or 4 Children | 0 (0.0%) | 0 (0.0%) |
| 5 or more Children | 0 (0.0%) | 0 (0.0%) |
| Total | 2 (7.4%) | 0 (0.0%) |
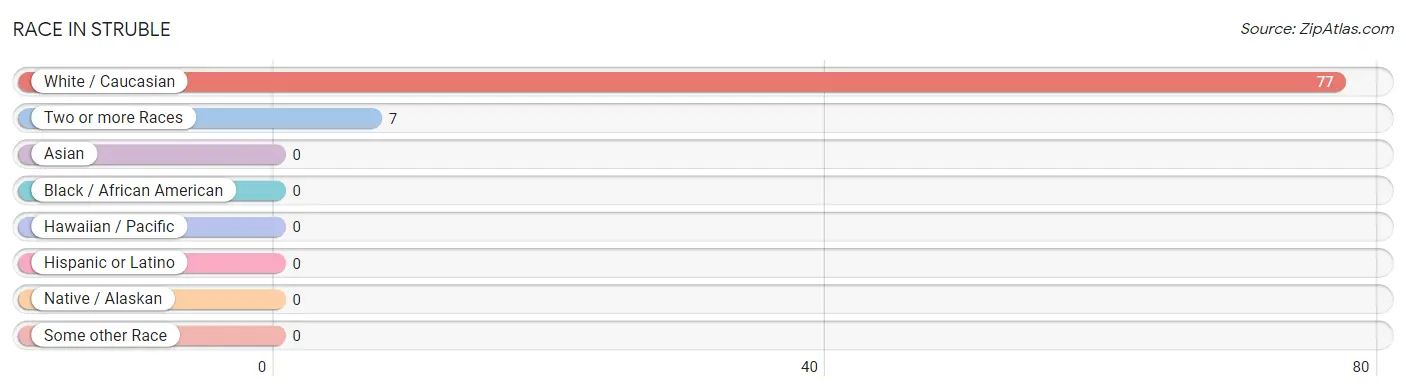
Race in Struble
The most populous races in Struble are White / Caucasian (77 | 91.7%), and Two or more Races (7 | 8.3%).
| Race | # Population | % Population |
| Asian | 0 | 0.0% |
| Black / African American | 0 | 0.0% |
| Hawaiian / Pacific | 0 | 0.0% |
| Hispanic or Latino | 0 | 0.0% |
| Native / Alaskan | 0 | 0.0% |
| White / Caucasian | 77 | 91.7% |
| Two or more Races | 7 | 8.3% |
| Some other Race | 0 | 0.0% |
| Total | 84 | 100.0% |
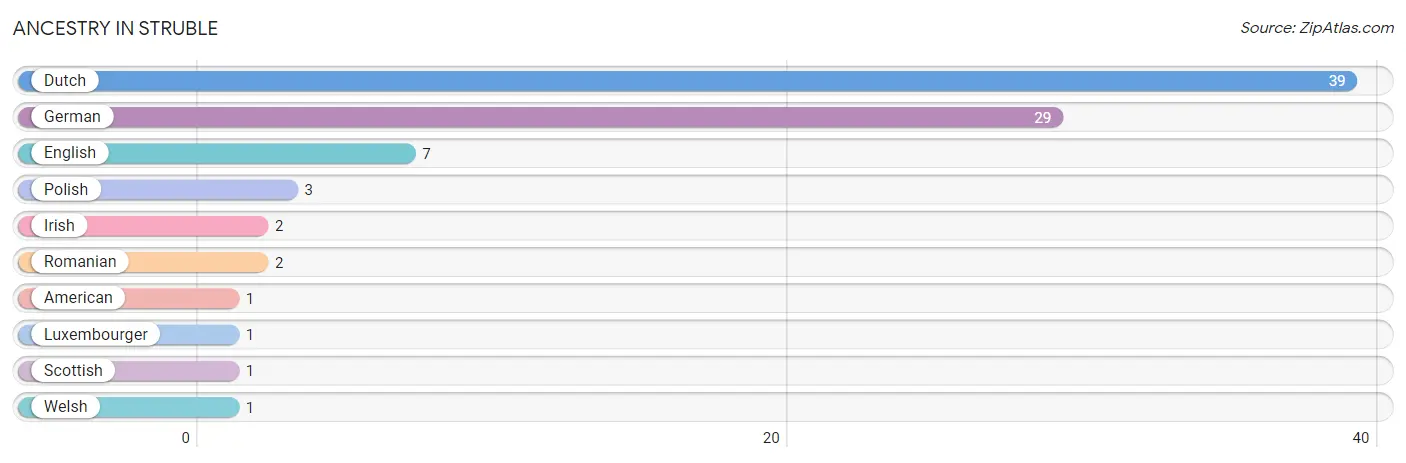
Ancestry in Struble
The most populous ancestries reported in Struble are Dutch (39 | 46.4%), German (29 | 34.5%), English (7 | 8.3%), Polish (3 | 3.6%), and Irish (2 | 2.4%), together accounting for 95.2% of all Struble residents.
| Ancestry | # Population | % Population |
| American | 1 | 1.2% |
| Dutch | 39 | 46.4% |
| English | 7 | 8.3% |
| German | 29 | 34.5% |
| Irish | 2 | 2.4% |
| Luxembourger | 1 | 1.2% |
| Polish | 3 | 3.6% |
| Romanian | 2 | 2.4% |
| Scottish | 1 | 1.2% |
| Welsh | 1 | 1.2% | View All 10 Rows |
Immigrants in Struble

| Immigration Origin | # Population | % Population | View All 0 Rows |
Sex and Age in Struble
Sex and Age in Struble
The most populous age groups in Struble are 50 to 54 Years (9 | 23.7%) for men and 45 to 49 Years (11 | 23.9%) for women.
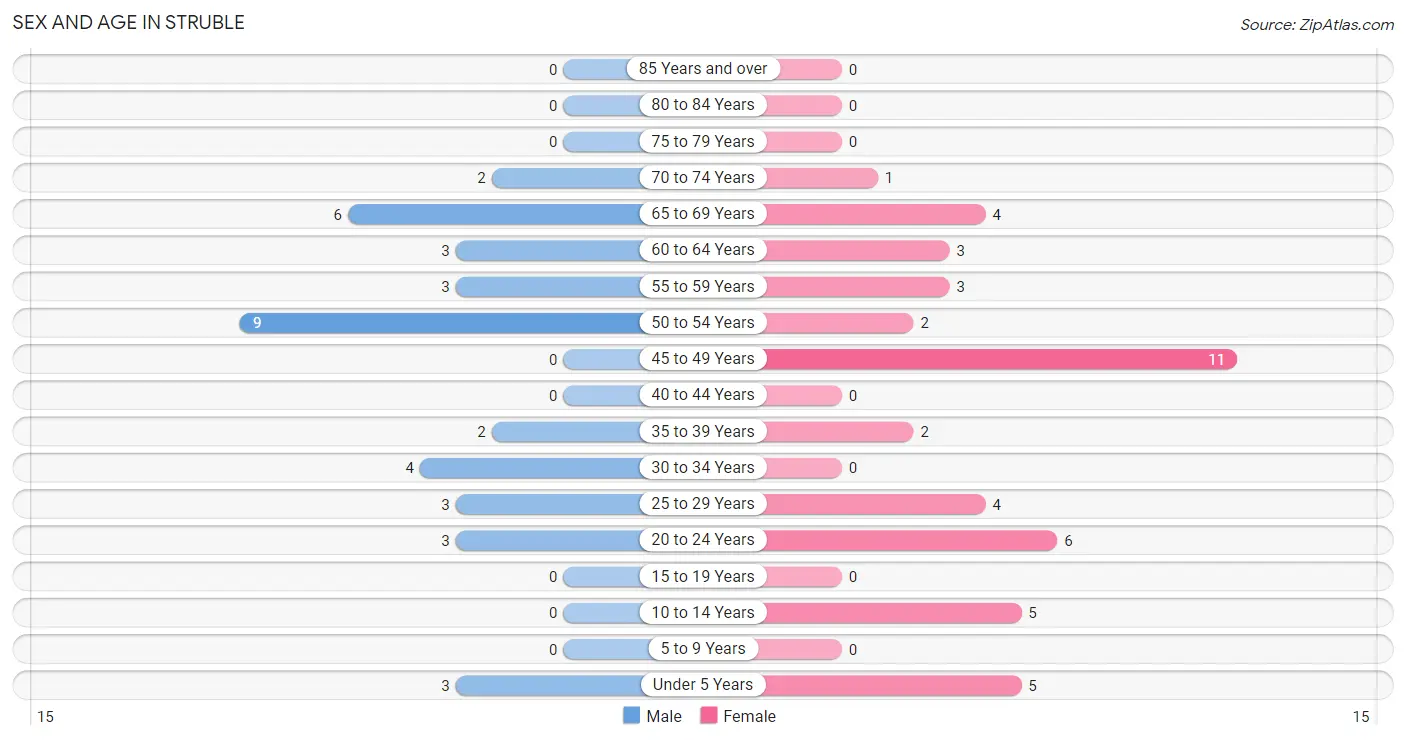
| Age Bracket | Male | Female |
| Under 5 Years | 3 (7.9%) | 5 (10.9%) |
| 5 to 9 Years | 0 (0.0%) | 0 (0.0%) |
| 10 to 14 Years | 0 (0.0%) | 5 (10.9%) |
| 15 to 19 Years | 0 (0.0%) | 0 (0.0%) |
| 20 to 24 Years | 3 (7.9%) | 6 (13.0%) |
| 25 to 29 Years | 3 (7.9%) | 4 (8.7%) |
| 30 to 34 Years | 4 (10.5%) | 0 (0.0%) |
| 35 to 39 Years | 2 (5.3%) | 2 (4.3%) |
| 40 to 44 Years | 0 (0.0%) | 0 (0.0%) |
| 45 to 49 Years | 0 (0.0%) | 11 (23.9%) |
| 50 to 54 Years | 9 (23.7%) | 2 (4.3%) |
| 55 to 59 Years | 3 (7.9%) | 3 (6.5%) |
| 60 to 64 Years | 3 (7.9%) | 3 (6.5%) |
| 65 to 69 Years | 6 (15.8%) | 4 (8.7%) |
| 70 to 74 Years | 2 (5.3%) | 1 (2.2%) |
| 75 to 79 Years | 0 (0.0%) | 0 (0.0%) |
| 80 to 84 Years | 0 (0.0%) | 0 (0.0%) |
| 85 Years and over | 0 (0.0%) | 0 (0.0%) |
| Total | 38 (100.0%) | 46 (100.0%) |
Families and Households in Struble
Median Family Size in Struble
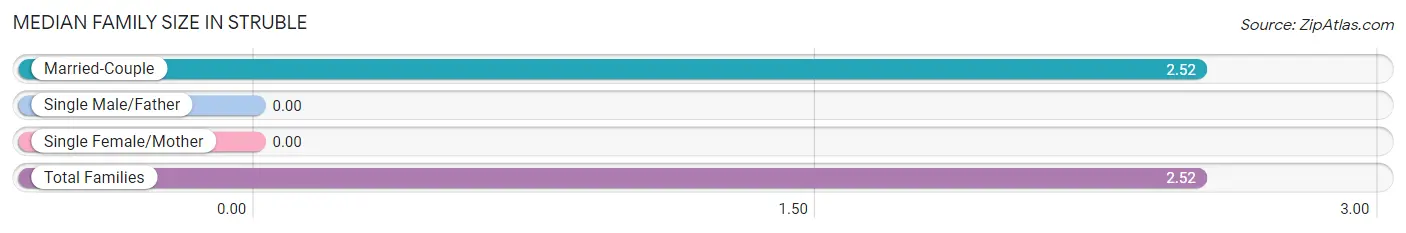
| Family Type | # Families | Family Size |
| Married-Couple | 27 (100.0%) | 2.52 |
| Single Male/Father | 0 (0.0%) | - |
| Single Female/Mother | 0 (0.0%) | - |
| Total Families | 27 (100.0%) | 2.52 |
Median Household Size in Struble
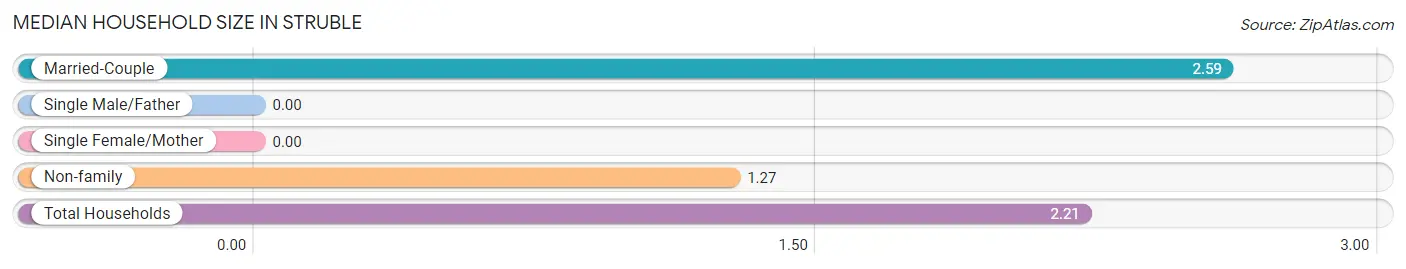
| Household Type | # Households | Household Size |
| Married-Couple | 27 (71.1%) | 2.59 |
| Single Male/Father | 0 (0.0%) | - |
| Single Female/Mother | 0 (0.0%) | - |
| Non-family | 11 (28.9%) | 1.27 |
| Total Households | 38 (100.0%) | 2.21 |
Household Size by Marriage Status in Struble
Out of a total of 38 households in Struble, 27 (71.1%) are family households, while 11 (28.9%) are nonfamily households. The most numerous type of family households are 2-person households, comprising 21, and the most common type of nonfamily households are 2-person households, comprising 6.
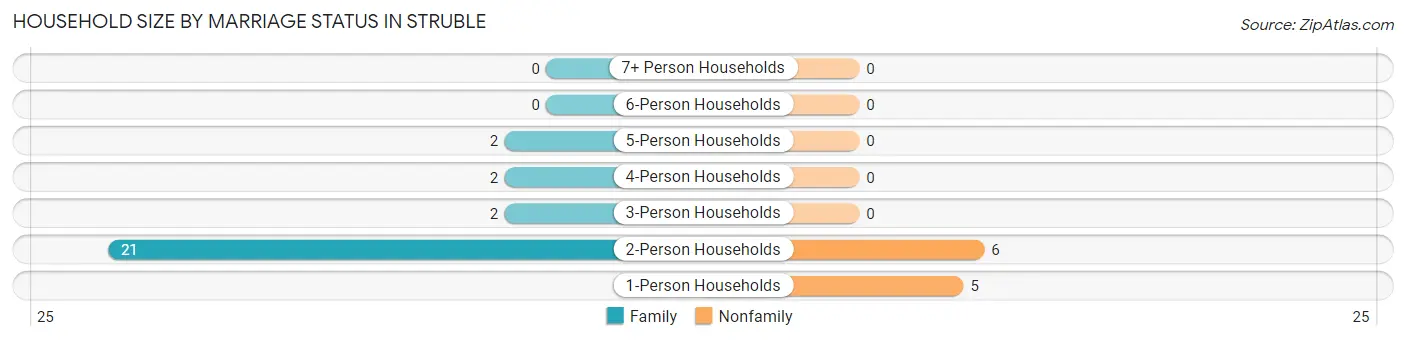
| Household Size | Family Households | Nonfamily Households |
| 1-Person Households | - | 5 (13.2%) |
| 2-Person Households | 21 (55.3%) | 6 (15.8%) |
| 3-Person Households | 2 (5.3%) | 0 (0.0%) |
| 4-Person Households | 2 (5.3%) | 0 (0.0%) |
| 5-Person Households | 2 (5.3%) | 0 (0.0%) |
| 6-Person Households | 0 (0.0%) | 0 (0.0%) |
| 7+ Person Households | 0 (0.0%) | 0 (0.0%) |
| Total | 27 (71.1%) | 11 (28.9%) |
Female Fertility in Struble
Fertility by Age in Struble
| Age Bracket | Women with Births | Births / 1,000 Women |
| 15 to 19 years | 0 (0.0%) | 0.0 |
| 20 to 34 years | 0 (0.0%) | 0.0 |
| 35 to 50 years | 0 (0.0%) | 0.0 |
| Total | 0 (0.0%) | 0.0 |
Fertility by Age by Marriage Status in Struble
| Age Bracket | Married | Unmarried |
| 15 to 19 years | 0 (0.0%) | 0 (0.0%) |
| 20 to 34 years | 0 (0.0%) | 0 (0.0%) |
| 35 to 50 years | 0 (0.0%) | 0 (0.0%) |
| Total | 0 (0.0%) | 0 (0.0%) |
Fertility by Education in Struble
| Educational Attainment | Women with Births | Births / 1,000 Women |
| Less than High School | 0 (0.0%) | 0.0 |
| High School Diploma | 0 (0.0%) | 0.0 |
| College or Associate's Degree | 0 (0.0%) | 0.0 |
| Bachelor's Degree | 0 (0.0%) | 0.0 |
| Graduate Degree | 0 (0.0%) | 0.0 |
| Total | 0 (0.0%) | 0.0 |
Fertility by Education by Marriage Status in Struble
| Educational Attainment | Married | Unmarried |
| Less than High School | 0 (0.0%) | 0 (0.0%) |
| High School Diploma | 0 (0.0%) | 0 (0.0%) |
| College or Associate's Degree | 0 (0.0%) | 0 (0.0%) |
| Bachelor's Degree | 0 (0.0%) | 0 (0.0%) |
| Graduate Degree | 0 (0.0%) | 0 (0.0%) |
| Total | 0 (0.0%) | 0 (0.0%) |
Employment Characteristics in Struble
Employment by Class of Employer in Struble
Among the 50 employed individuals in Struble, private company employees (36 | 72.0%), not-for-profit organizations (11 | 22.0%), and self-employed (not incorporated) (3 | 6.0%) make up the most common classes of employment.
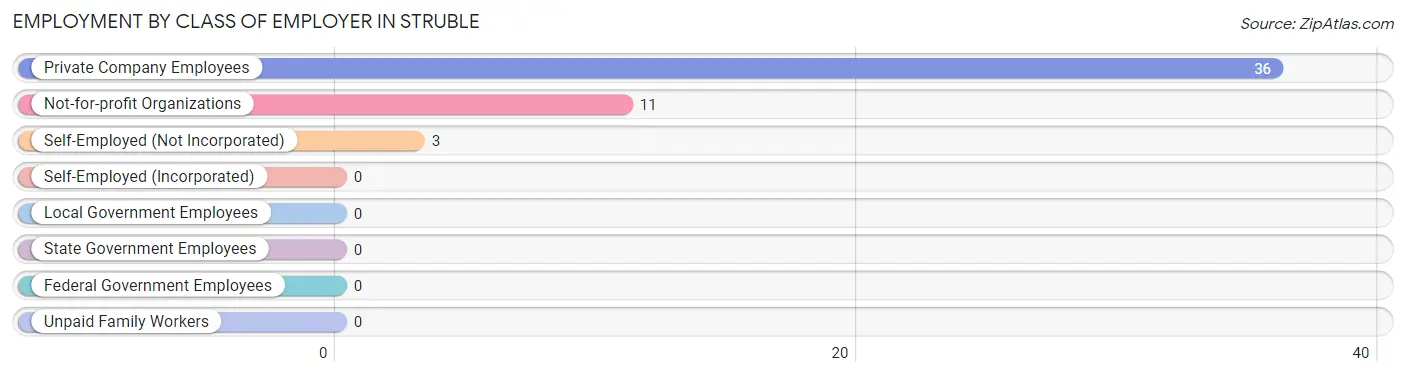
| Employer Class | # Employees | % Employees |
| Private Company Employees | 36 | 72.0% |
| Self-Employed (Incorporated) | 0 | 0.0% |
| Self-Employed (Not Incorporated) | 3 | 6.0% |
| Not-for-profit Organizations | 11 | 22.0% |
| Local Government Employees | 0 | 0.0% |
| State Government Employees | 0 | 0.0% |
| Federal Government Employees | 0 | 0.0% |
| Unpaid Family Workers | 0 | 0.0% |
| Total | 50 | 100.0% |
Employment Status by Age in Struble
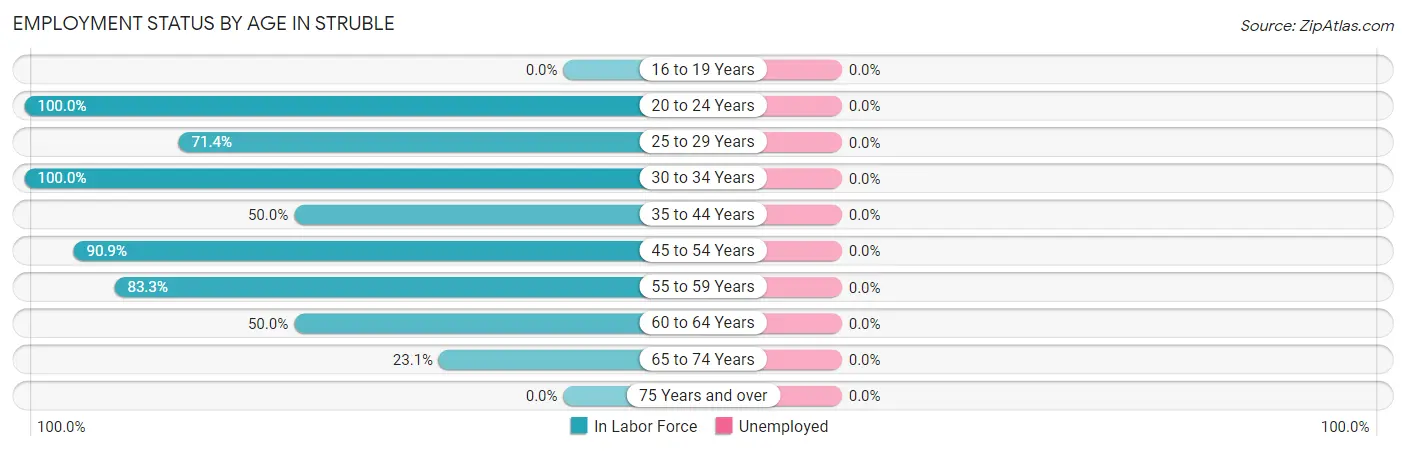
| Age Bracket | In Labor Force | Unemployed |
| 16 to 19 Years | 0 (0.0%) | 0 (0.0%) |
| 20 to 24 Years | 9 (100.0%) | 0 (0.0%) |
| 25 to 29 Years | 5 (71.4%) | 0 (0.0%) |
| 30 to 34 Years | 4 (100.0%) | 0 (0.0%) |
| 35 to 44 Years | 2 (50.0%) | 0 (0.0%) |
| 45 to 54 Years | 20 (90.9%) | 0 (0.0%) |
| 55 to 59 Years | 5 (83.3%) | 0 (0.0%) |
| 60 to 64 Years | 3 (50.0%) | 0 (0.0%) |
| 65 to 74 Years | 3 (23.1%) | 0 (0.0%) |
| 75 Years and over | 0 (0.0%) | 0 (0.0%) |
| Total | 51 (71.8%) | 0 (0.0%) |
Employment Status by Educational Attainment in Struble
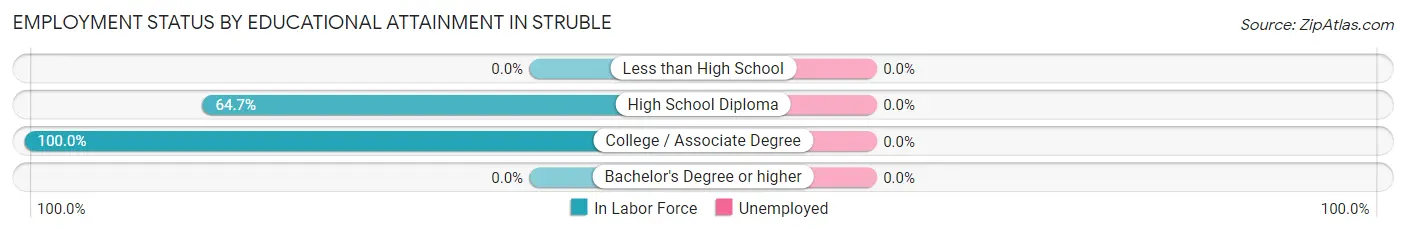
| Educational Attainment | In Labor Force | Unemployed |
| Less than High School | 0 (0.0%) | 0 (0.0%) |
| High School Diploma | 11 (64.7%) | 0 (0.0%) |
| College / Associate Degree | 28 (100.0%) | 0 (0.0%) |
| Bachelor's Degree or higher | 0 (0.0%) | 0 (0.0%) |
| Total | 39 (79.6%) | 0 (0.0%) |
Employment Occupations by Sex in Struble
Management, Business, Science and Arts Occupations
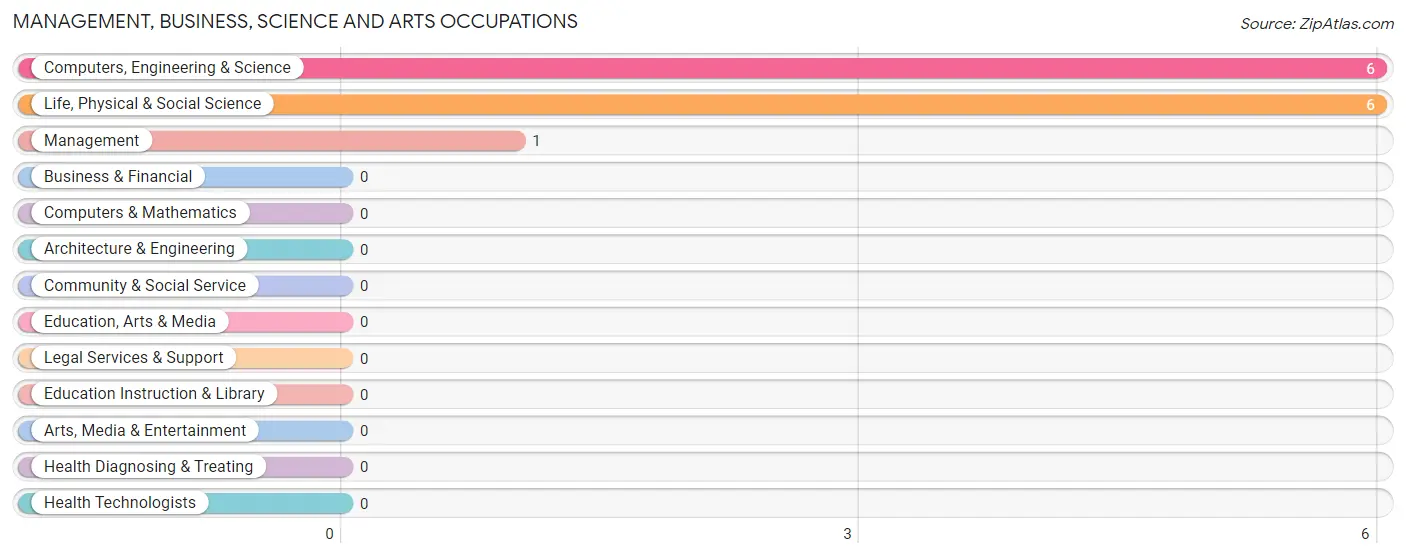
The most common Management, Business, Science and Arts occupations in Struble are Computers, Engineering & Science (6 | 11.8%), Life, Physical & Social Science (6 | 11.8%), and Management (1 | 2.0%).
Management, Business, Science and Arts Occupations by Sex
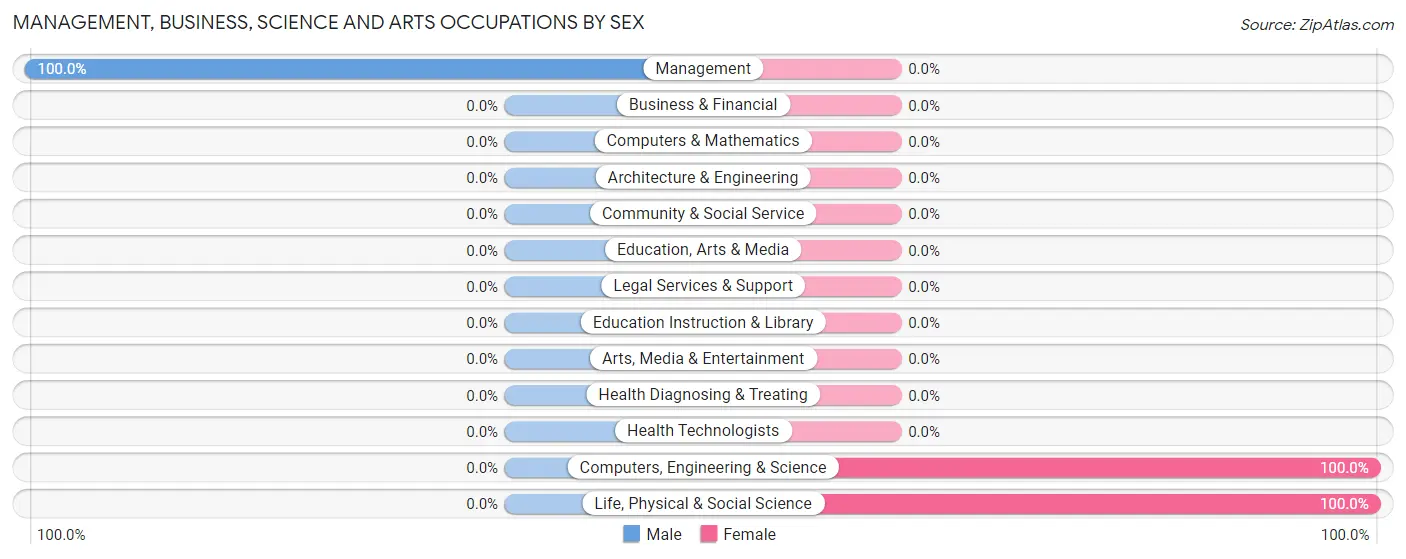
| Occupation | Male | Female |
| Management | 1 (100.0%) | 0 (0.0%) |
| Business & Financial | 0 (0.0%) | 0 (0.0%) |
| Computers, Engineering & Science | 0 (0.0%) | 6 (100.0%) |
| Computers & Mathematics | 0 (0.0%) | 0 (0.0%) |
| Architecture & Engineering | 0 (0.0%) | 0 (0.0%) |
| Life, Physical & Social Science | 0 (0.0%) | 6 (100.0%) |
| Community & Social Service | 0 (0.0%) | 0 (0.0%) |
| Education, Arts & Media | 0 (0.0%) | 0 (0.0%) |
| Legal Services & Support | 0 (0.0%) | 0 (0.0%) |
| Education Instruction & Library | 0 (0.0%) | 0 (0.0%) |
| Arts, Media & Entertainment | 0 (0.0%) | 0 (0.0%) |
| Health Diagnosing & Treating | 0 (0.0%) | 0 (0.0%) |
| Health Technologists | 0 (0.0%) | 0 (0.0%) |
| Total (Category) | 1 (14.3%) | 6 (85.7%) |
| Total (Overall) | 28 (54.9%) | 23 (45.1%) |
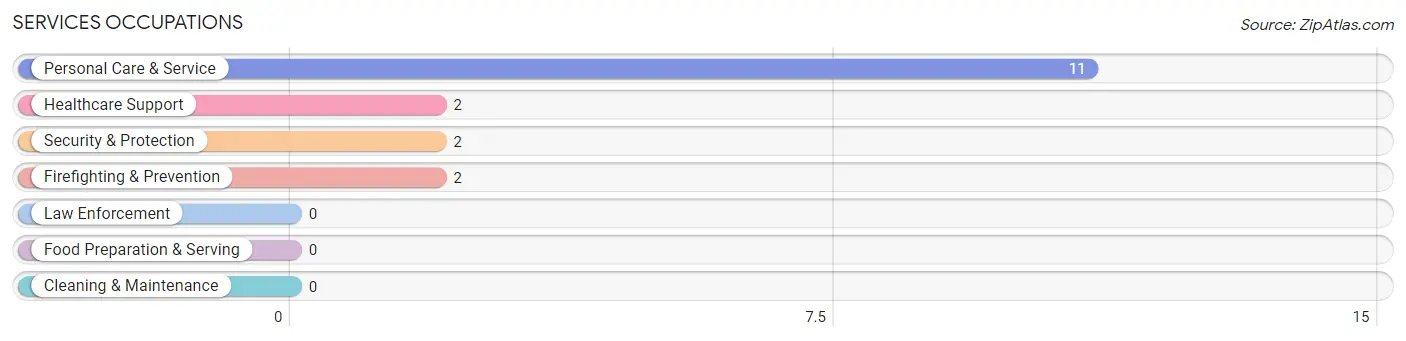
Services Occupations
The most common Services occupations in Struble are Personal Care & Service (11 | 21.6%), Healthcare Support (2 | 3.9%), Security & Protection (2 | 3.9%), and Firefighting & Prevention (2 | 3.9%).
Services Occupations by Sex
Within the Services occupations in Struble, the most male-oriented occupations are Security & Protection (100.0%), and Firefighting & Prevention (100.0%), while the most female-oriented occupations are Healthcare Support (100.0%), and Personal Care & Service (100.0%).
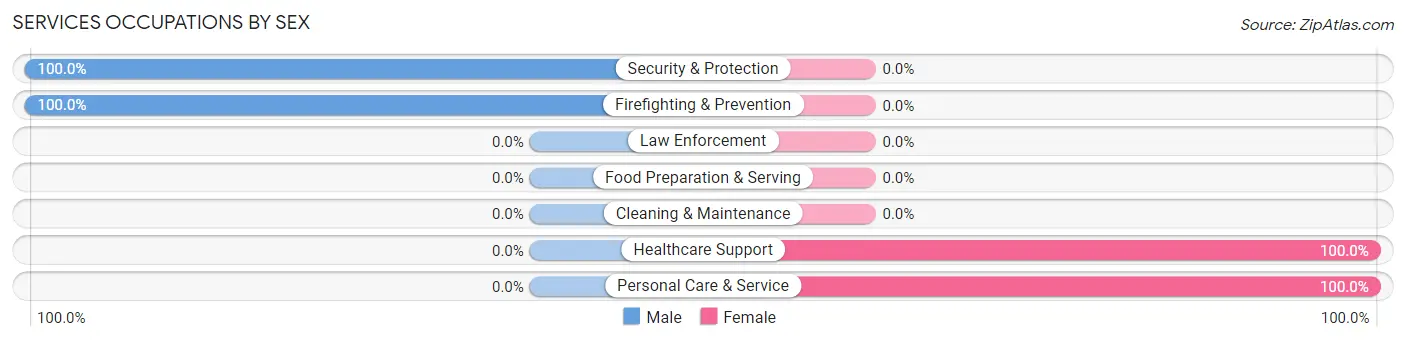
| Occupation | Male | Female |
| Healthcare Support | 0 (0.0%) | 2 (100.0%) |
| Security & Protection | 2 (100.0%) | 0 (0.0%) |
| Firefighting & Prevention | 2 (100.0%) | 0 (0.0%) |
| Law Enforcement | 0 (0.0%) | 0 (0.0%) |
| Food Preparation & Serving | 0 (0.0%) | 0 (0.0%) |
| Cleaning & Maintenance | 0 (0.0%) | 0 (0.0%) |
| Personal Care & Service | 0 (0.0%) | 11 (100.0%) |
| Total (Category) | 2 (13.3%) | 13 (86.7%) |
| Total (Overall) | 28 (54.9%) | 23 (45.1%) |
Sales and Office Occupations
The most common Sales and Office occupations in Struble are , and Office & Administration (2 | 3.9%).
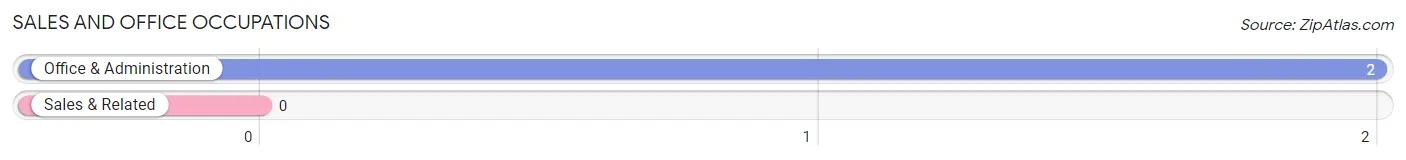
Sales and Office Occupations by Sex
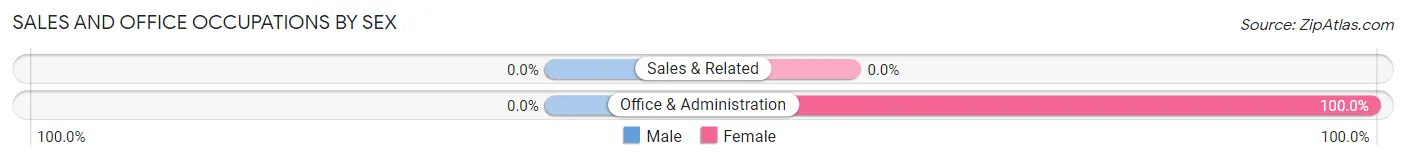
| Occupation | Male | Female |
| Sales & Related | 0 (0.0%) | 0 (0.0%) |
| Office & Administration | 0 (0.0%) | 2 (100.0%) |
| Total (Category) | 0 (0.0%) | 2 (100.0%) |
| Total (Overall) | 28 (54.9%) | 23 (45.1%) |
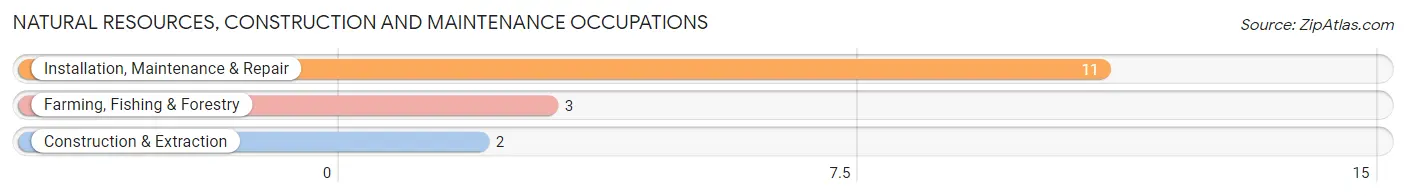
Natural Resources, Construction and Maintenance Occupations
The most common Natural Resources, Construction and Maintenance occupations in Struble are Installation, Maintenance & Repair (11 | 21.6%), Farming, Fishing & Forestry (3 | 5.9%), and Construction & Extraction (2 | 3.9%).
Natural Resources, Construction and Maintenance Occupations by Sex
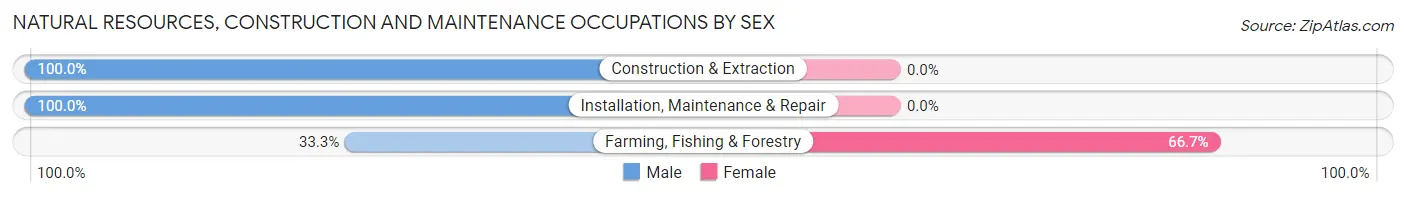
| Occupation | Male | Female |
| Farming, Fishing & Forestry | 1 (33.3%) | 2 (66.7%) |
| Construction & Extraction | 2 (100.0%) | 0 (0.0%) |
| Installation, Maintenance & Repair | 11 (100.0%) | 0 (0.0%) |
| Total (Category) | 14 (87.5%) | 2 (12.5%) |
| Total (Overall) | 28 (54.9%) | 23 (45.1%) |
Production, Transportation and Moving Occupations
The most common Production, Transportation and Moving occupations in Struble are Material Moving (6 | 11.8%), Transportation (3 | 5.9%), and Production (2 | 3.9%).
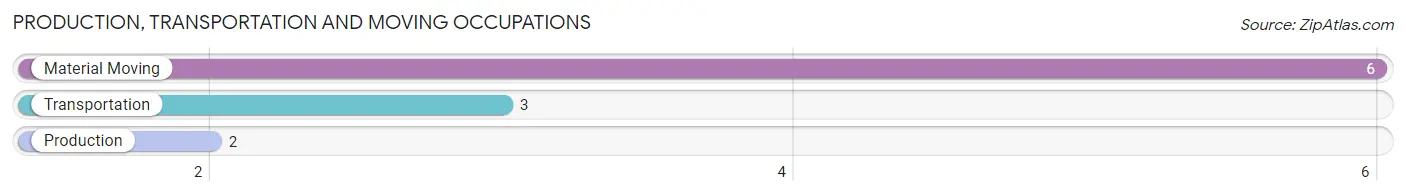
Production, Transportation and Moving Occupations by Sex
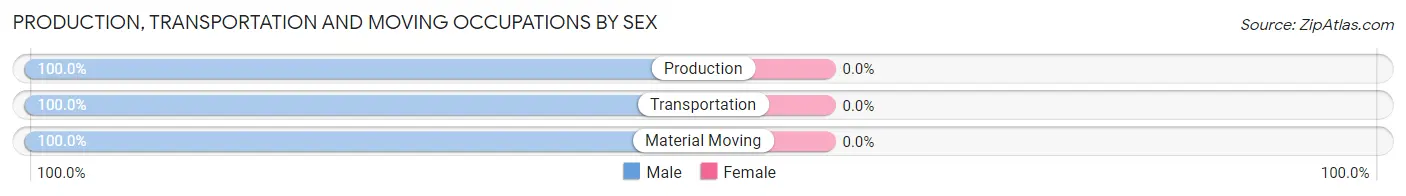
| Occupation | Male | Female |
| Production | 2 (100.0%) | 0 (0.0%) |
| Transportation | 3 (100.0%) | 0 (0.0%) |
| Material Moving | 6 (100.0%) | 0 (0.0%) |
| Total (Category) | 11 (100.0%) | 0 (0.0%) |
| Total (Overall) | 28 (54.9%) | 23 (45.1%) |
Employment Industries by Sex in Struble
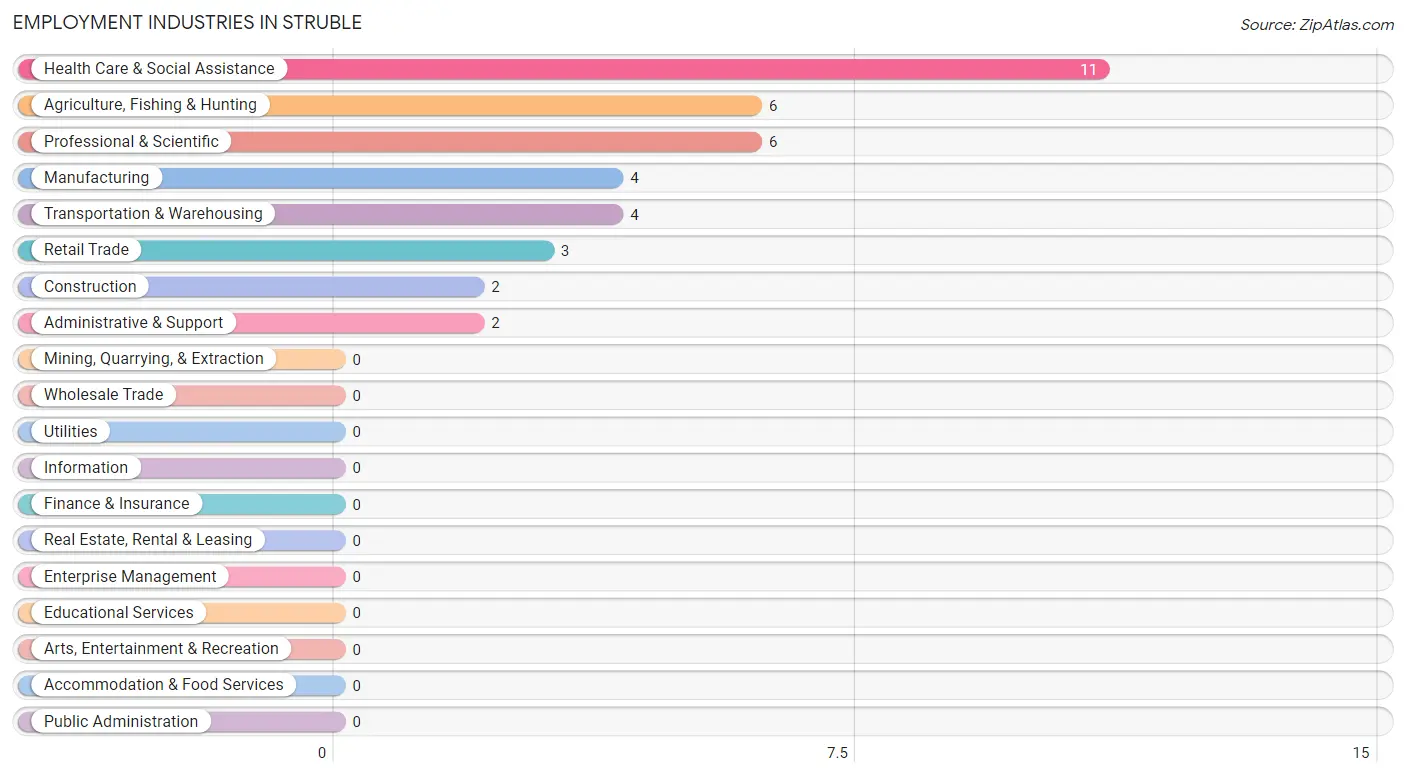
Employment Industries in Struble
The major employment industries in Struble include Health Care & Social Assistance (11 | 21.6%), Agriculture, Fishing & Hunting (6 | 11.8%), Professional & Scientific (6 | 11.8%), Manufacturing (4 | 7.8%), and Transportation & Warehousing (4 | 7.8%).
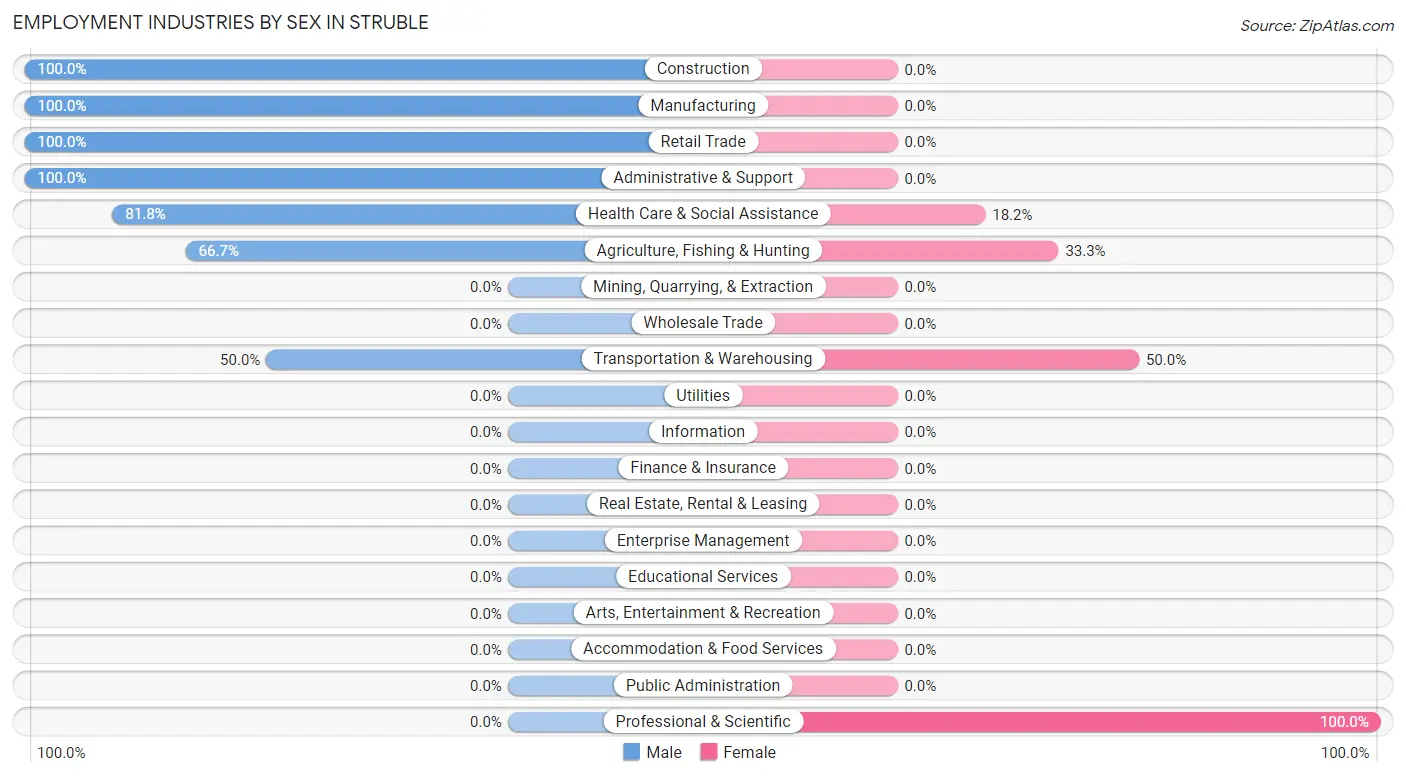
Employment Industries by Sex in Struble
The Struble industries that see more men than women are Construction (100.0%), Manufacturing (100.0%), and Retail Trade (100.0%), whereas the industries that tend to have a higher number of women are Professional & Scientific (100.0%), Transportation & Warehousing (50.0%), and Agriculture, Fishing & Hunting (33.3%).
| Industry | Male | Female |
| Agriculture, Fishing & Hunting | 4 (66.7%) | 2 (33.3%) |
| Mining, Quarrying, & Extraction | 0 (0.0%) | 0 (0.0%) |
| Construction | 2 (100.0%) | 0 (0.0%) |
| Manufacturing | 4 (100.0%) | 0 (0.0%) |
| Wholesale Trade | 0 (0.0%) | 0 (0.0%) |
| Retail Trade | 3 (100.0%) | 0 (0.0%) |
| Transportation & Warehousing | 2 (50.0%) | 2 (50.0%) |
| Utilities | 0 (0.0%) | 0 (0.0%) |
| Information | 0 (0.0%) | 0 (0.0%) |
| Finance & Insurance | 0 (0.0%) | 0 (0.0%) |
| Real Estate, Rental & Leasing | 0 (0.0%) | 0 (0.0%) |
| Professional & Scientific | 0 (0.0%) | 6 (100.0%) |
| Enterprise Management | 0 (0.0%) | 0 (0.0%) |
| Administrative & Support | 2 (100.0%) | 0 (0.0%) |
| Educational Services | 0 (0.0%) | 0 (0.0%) |
| Health Care & Social Assistance | 9 (81.8%) | 2 (18.2%) |
| Arts, Entertainment & Recreation | 0 (0.0%) | 0 (0.0%) |
| Accommodation & Food Services | 0 (0.0%) | 0 (0.0%) |
| Public Administration | 0 (0.0%) | 0 (0.0%) |
| Total | 28 (54.9%) | 23 (45.1%) |
Education in Struble
School Enrollment in Struble
The most common levels of schooling among the 7 students in Struble are middle school (5 | 71.4%), and nursery / preschool (2 | 28.6%).
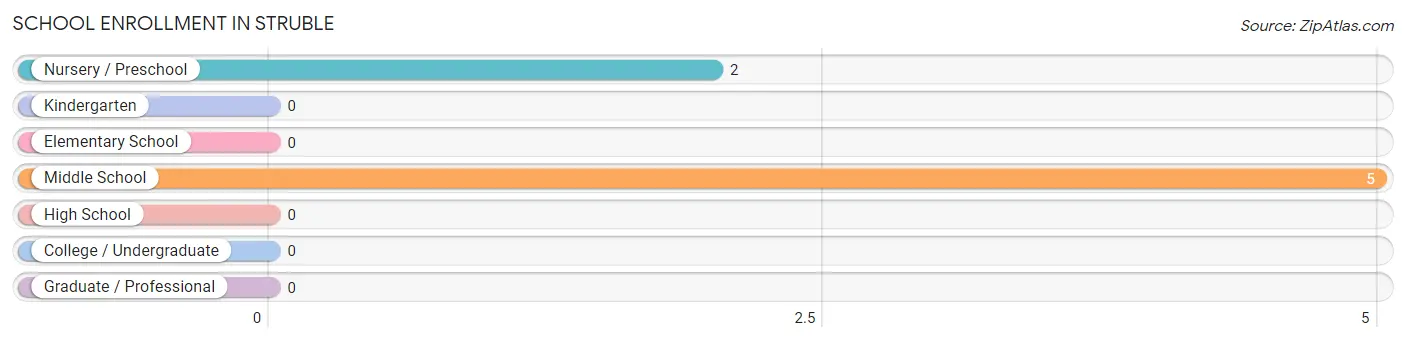
| School Level | # Students | % Students |
| Nursery / Preschool | 2 | 28.6% |
| Kindergarten | 0 | 0.0% |
| Elementary School | 0 | 0.0% |
| Middle School | 5 | 71.4% |
| High School | 0 | 0.0% |
| College / Undergraduate | 0 | 0.0% |
| Graduate / Professional | 0 | 0.0% |
| Total | 7 | 100.0% |
School Enrollment by Age by Funding Source in Struble
Out of a total of 7 students who are enrolled in schools in Struble, 2 (28.6%) attend a private institution, while the remaining 5 (71.4%) are enrolled in public schools. The age group of 3 to 4 year olds has the highest likelihood of being enrolled in private schools, with 2 (100.0% in the age bracket) enrolled. Conversely, the age group of 10 to 14 year olds has the lowest likelihood of being enrolled in a private school, with 5 (100.0% in the age bracket) attending a public institution.
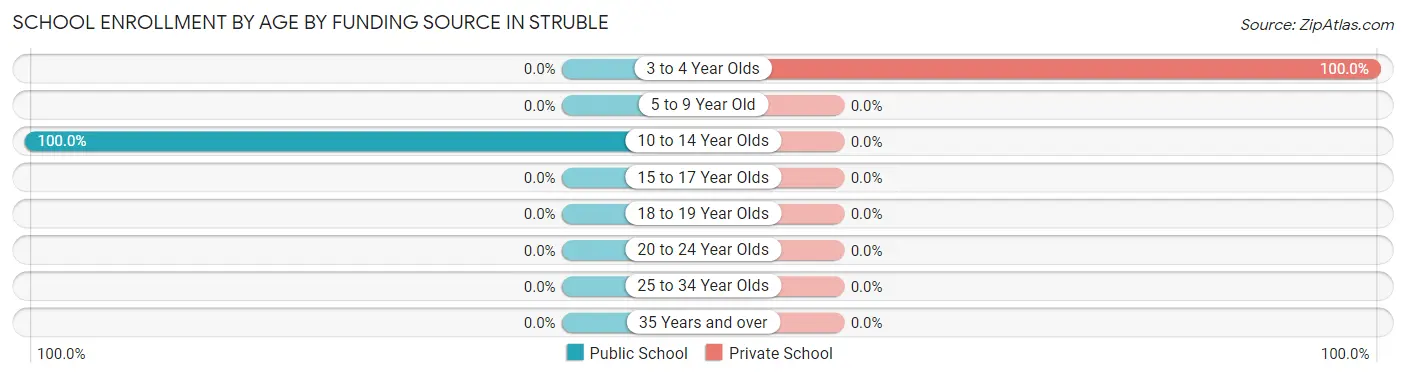
| Age Bracket | Public School | Private School |
| 3 to 4 Year Olds | 0 (0.0%) | 2 (100.0%) |
| 5 to 9 Year Old | 0 (0.0%) | 0 (0.0%) |
| 10 to 14 Year Olds | 5 (100.0%) | 0 (0.0%) |
| 15 to 17 Year Olds | 0 (0.0%) | 0 (0.0%) |
| 18 to 19 Year Olds | 0 (0.0%) | 0 (0.0%) |
| 20 to 24 Year Olds | 0 (0.0%) | 0 (0.0%) |
| 25 to 34 Year Olds | 0 (0.0%) | 0 (0.0%) |
| 35 Years and over | 0 (0.0%) | 0 (0.0%) |
| Total | 5 (71.4%) | 2 (28.6%) |
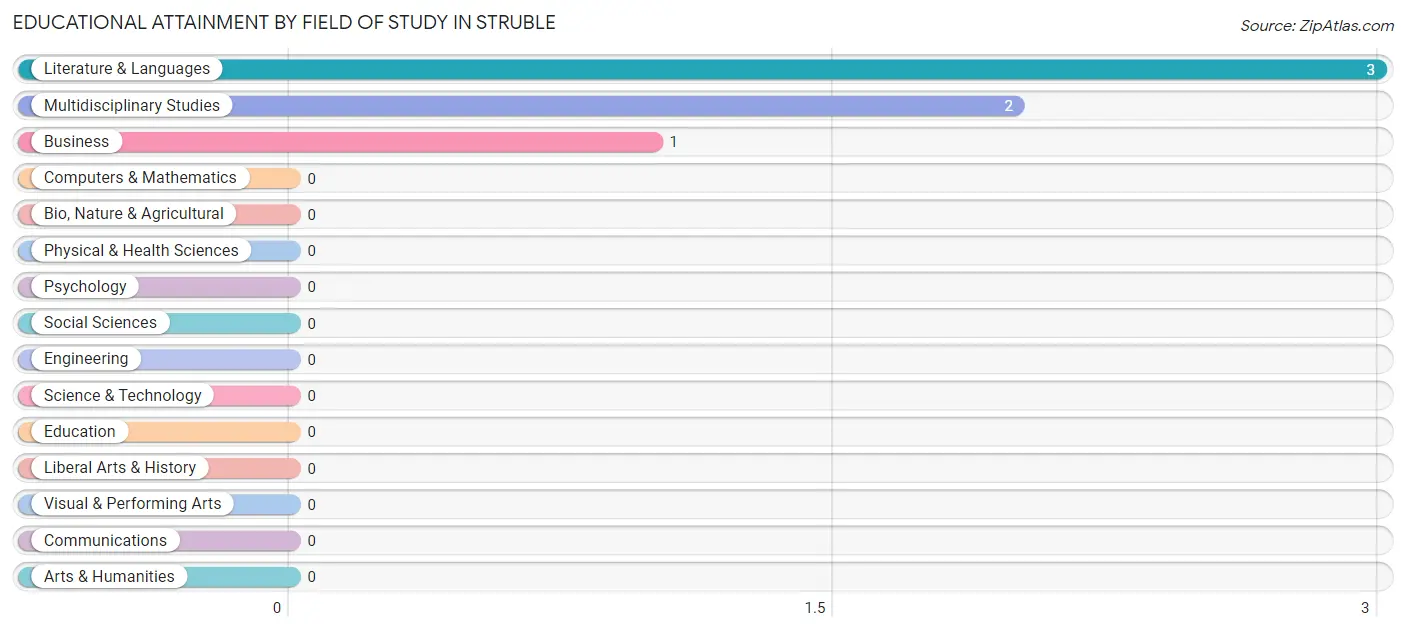
Educational Attainment by Field of Study in Struble
Literature & languages (3 | 50.0%), multidisciplinary studies (2 | 33.3%), and business (1 | 16.7%) are the most common fields of study among 6 individuals in Struble who have obtained a bachelor's degree or higher.
| Field of Study | # Graduates | % Graduates |
| Computers & Mathematics | 0 | 0.0% |
| Bio, Nature & Agricultural | 0 | 0.0% |
| Physical & Health Sciences | 0 | 0.0% |
| Psychology | 0 | 0.0% |
| Social Sciences | 0 | 0.0% |
| Engineering | 0 | 0.0% |
| Multidisciplinary Studies | 2 | 33.3% |
| Science & Technology | 0 | 0.0% |
| Business | 1 | 16.7% |
| Education | 0 | 0.0% |
| Literature & Languages | 3 | 50.0% |
| Liberal Arts & History | 0 | 0.0% |
| Visual & Performing Arts | 0 | 0.0% |
| Communications | 0 | 0.0% |
| Arts & Humanities | 0 | 0.0% |
| Total | 6 | 100.0% |
Transportation & Commute in Struble
Vehicle Availability by Sex in Struble
The most prevalent vehicle ownership categories in Struble are males with 2 vehicles (19, accounting for 70.4%) and females with 2 vehicles (13, making up 82.6%).
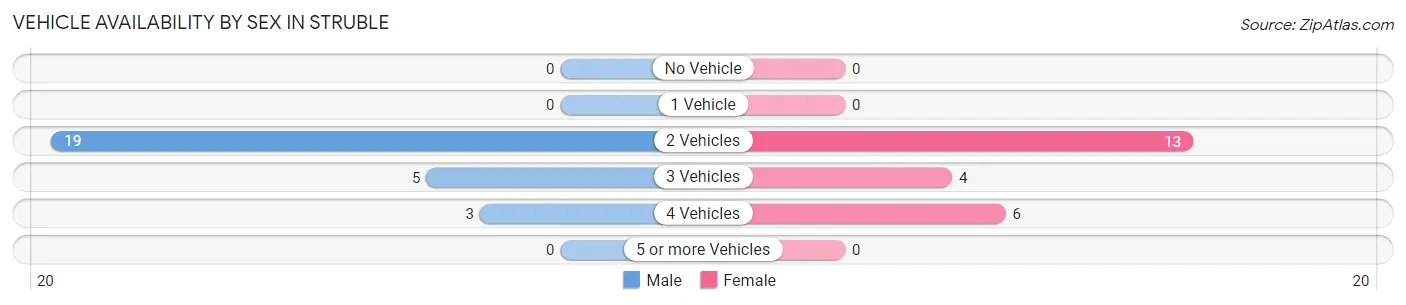
| Vehicles Available | Male | Female |
| No Vehicle | 0 (0.0%) | 0 (0.0%) |
| 1 Vehicle | 0 (0.0%) | 0 (0.0%) |
| 2 Vehicles | 19 (70.4%) | 13 (56.5%) |
| 3 Vehicles | 5 (18.5%) | 4 (17.4%) |
| 4 Vehicles | 3 (11.1%) | 6 (26.1%) |
| 5 or more Vehicles | 0 (0.0%) | 0 (0.0%) |
| Total | 27 (100.0%) | 23 (100.0%) |
Commute Time in Struble
The most frequently occuring commute durations in Struble are 15 to 19 minutes (17 commuters, 35.4%), 45 to 59 minutes (15 commuters, 31.2%), and 10 to 14 minutes (6 commuters, 12.5%).
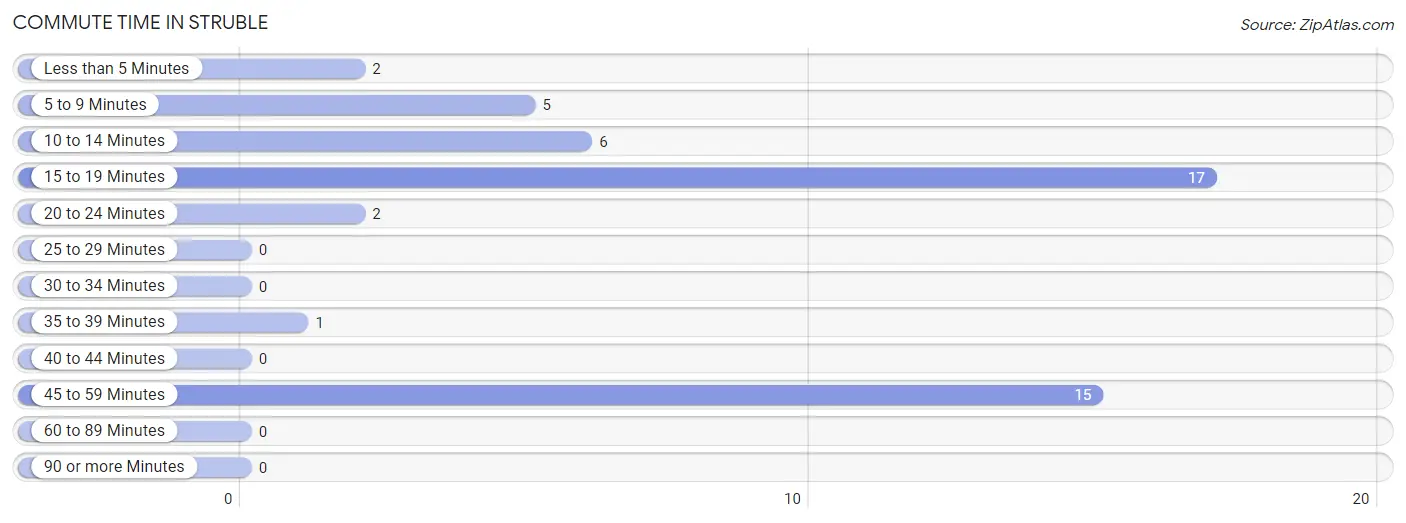
| Commute Time | # Commuters | % Commuters |
| Less than 5 Minutes | 2 | 4.2% |
| 5 to 9 Minutes | 5 | 10.4% |
| 10 to 14 Minutes | 6 | 12.5% |
| 15 to 19 Minutes | 17 | 35.4% |
| 20 to 24 Minutes | 2 | 4.2% |
| 25 to 29 Minutes | 0 | 0.0% |
| 30 to 34 Minutes | 0 | 0.0% |
| 35 to 39 Minutes | 1 | 2.1% |
| 40 to 44 Minutes | 0 | 0.0% |
| 45 to 59 Minutes | 15 | 31.2% |
| 60 to 89 Minutes | 0 | 0.0% |
| 90 or more Minutes | 0 | 0.0% |
Commute Time by Sex in Struble
The most common commute times in Struble are 45 to 59 minutes (9 commuters, 36.0%) for males and 15 to 19 minutes (13 commuters, 56.5%) for females.
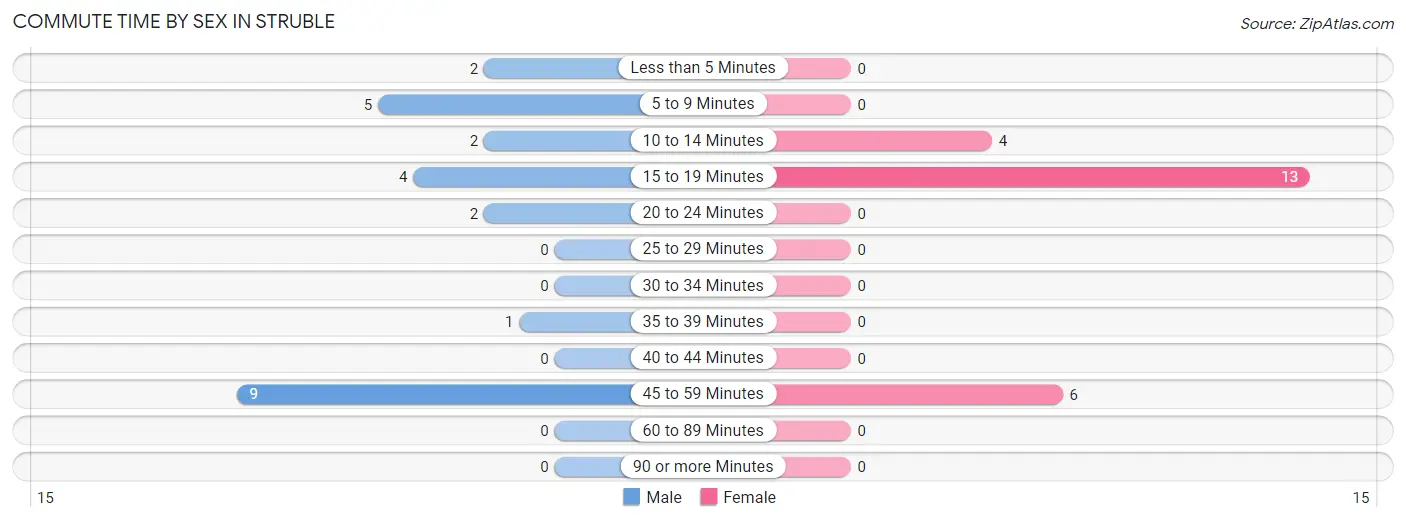
| Commute Time | Male | Female |
| Less than 5 Minutes | 2 (8.0%) | 0 (0.0%) |
| 5 to 9 Minutes | 5 (20.0%) | 0 (0.0%) |
| 10 to 14 Minutes | 2 (8.0%) | 4 (17.4%) |
| 15 to 19 Minutes | 4 (16.0%) | 13 (56.5%) |
| 20 to 24 Minutes | 2 (8.0%) | 0 (0.0%) |
| 25 to 29 Minutes | 0 (0.0%) | 0 (0.0%) |
| 30 to 34 Minutes | 0 (0.0%) | 0 (0.0%) |
| 35 to 39 Minutes | 1 (4.0%) | 0 (0.0%) |
| 40 to 44 Minutes | 0 (0.0%) | 0 (0.0%) |
| 45 to 59 Minutes | 9 (36.0%) | 6 (26.1%) |
| 60 to 89 Minutes | 0 (0.0%) | 0 (0.0%) |
| 90 or more Minutes | 0 (0.0%) | 0 (0.0%) |
Time of Departure to Work by Sex in Struble
The most frequent times of departure to work in Struble are 6:00 AM to 6:29 AM (9, 36.0%) for males and 8:30 AM to 8:59 AM (11, 47.8%) for females.
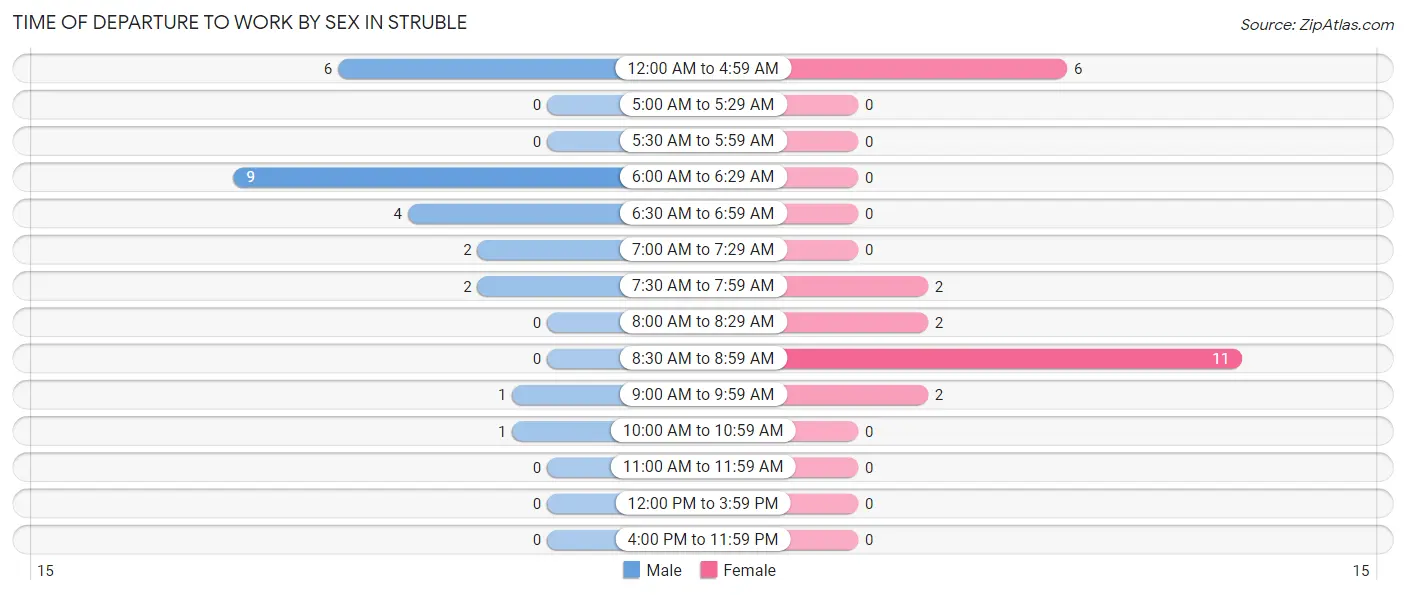
| Time of Departure | Male | Female |
| 12:00 AM to 4:59 AM | 6 (24.0%) | 6 (26.1%) |
| 5:00 AM to 5:29 AM | 0 (0.0%) | 0 (0.0%) |
| 5:30 AM to 5:59 AM | 0 (0.0%) | 0 (0.0%) |
| 6:00 AM to 6:29 AM | 9 (36.0%) | 0 (0.0%) |
| 6:30 AM to 6:59 AM | 4 (16.0%) | 0 (0.0%) |
| 7:00 AM to 7:29 AM | 2 (8.0%) | 0 (0.0%) |
| 7:30 AM to 7:59 AM | 2 (8.0%) | 2 (8.7%) |
| 8:00 AM to 8:29 AM | 0 (0.0%) | 2 (8.7%) |
| 8:30 AM to 8:59 AM | 0 (0.0%) | 11 (47.8%) |
| 9:00 AM to 9:59 AM | 1 (4.0%) | 2 (8.7%) |
| 10:00 AM to 10:59 AM | 1 (4.0%) | 0 (0.0%) |
| 11:00 AM to 11:59 AM | 0 (0.0%) | 0 (0.0%) |
| 12:00 PM to 3:59 PM | 0 (0.0%) | 0 (0.0%) |
| 4:00 PM to 11:59 PM | 0 (0.0%) | 0 (0.0%) |
| Total | 25 (100.0%) | 23 (100.0%) |
Housing Occupancy in Struble
Occupancy by Ownership in Struble
Of the total 38 dwellings in Struble, owner-occupied units account for 36 (94.7%), while renter-occupied units make up 2 (5.3%).
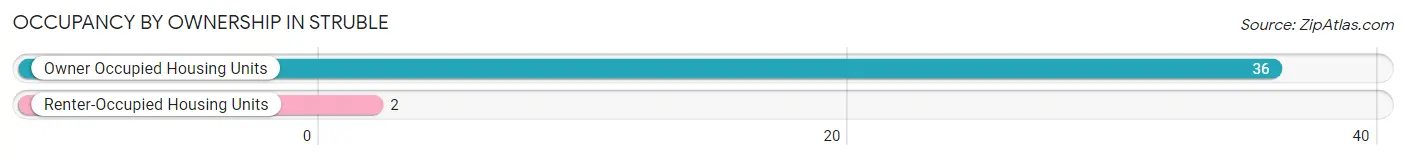
| Occupancy | # Housing Units | % Housing Units |
| Owner Occupied Housing Units | 36 | 94.7% |
| Renter-Occupied Housing Units | 2 | 5.3% |
| Total Occupied Housing Units | 38 | 100.0% |
Occupancy by Household Size in Struble
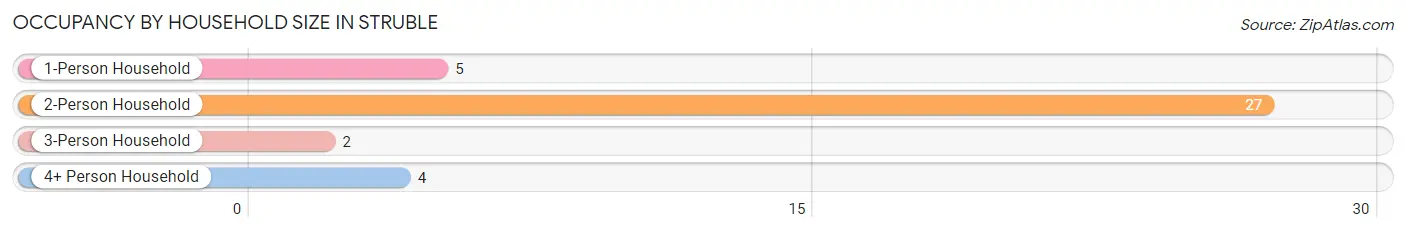
| Household Size | # Housing Units | % Housing Units |
| 1-Person Household | 5 | 13.2% |
| 2-Person Household | 27 | 71.1% |
| 3-Person Household | 2 | 5.3% |
| 4+ Person Household | 4 | 10.5% |
| Total Housing Units | 38 | 100.0% |
Occupancy by Ownership by Household Size in Struble
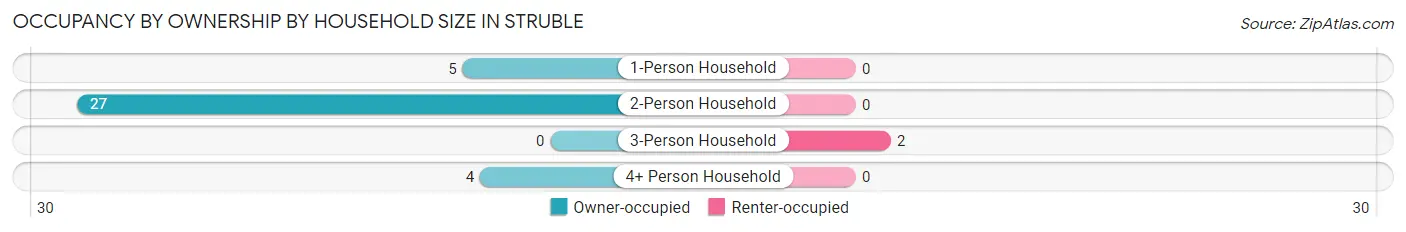
| Household Size | Owner-occupied | Renter-occupied |
| 1-Person Household | 5 (100.0%) | 0 (0.0%) |
| 2-Person Household | 27 (100.0%) | 0 (0.0%) |
| 3-Person Household | 0 (0.0%) | 2 (100.0%) |
| 4+ Person Household | 4 (100.0%) | 0 (0.0%) |
| Total Housing Units | 36 (94.7%) | 2 (5.3%) |
Occupancy by Educational Attainment in Struble
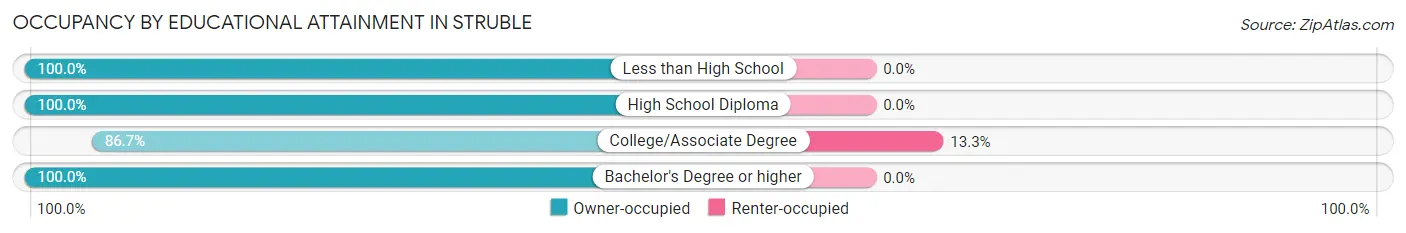
| Household Size | Owner-occupied | Renter-occupied |
| Less than High School | 2 (100.0%) | 0 (0.0%) |
| High School Diploma | 12 (100.0%) | 0 (0.0%) |
| College/Associate Degree | 13 (86.7%) | 2 (13.3%) |
| Bachelor's Degree or higher | 9 (100.0%) | 0 (0.0%) |
Occupancy by Age of Householder in Struble
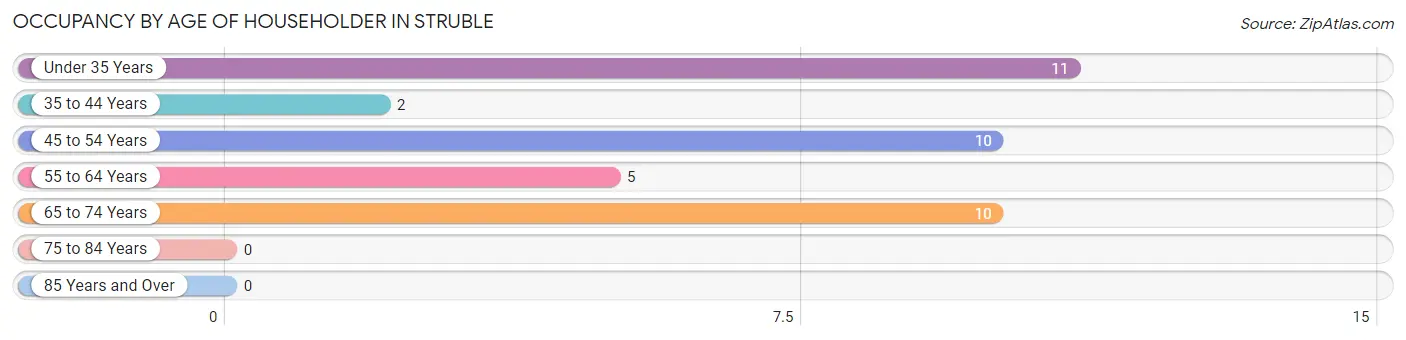
| Age Bracket | # Households | % Households |
| Under 35 Years | 11 | 28.9% |
| 35 to 44 Years | 2 | 5.3% |
| 45 to 54 Years | 10 | 26.3% |
| 55 to 64 Years | 5 | 13.2% |
| 65 to 74 Years | 10 | 26.3% |
| 75 to 84 Years | 0 | 0.0% |
| 85 Years and Over | 0 | 0.0% |
| Total | 38 | 100.0% |
Housing Finances in Struble
Median Income by Occupancy in Struble
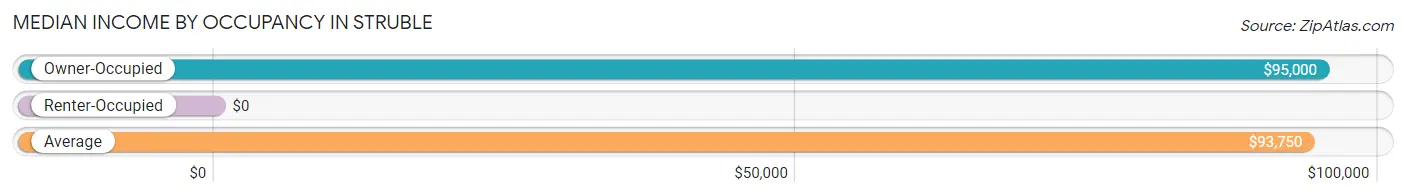
| Occupancy Type | # Households | Median Income |
| Owner-Occupied | 36 (94.7%) | $95,000 |
| Renter-Occupied | 2 (5.3%) | $0 |
| Average | 38 (100.0%) | $93,750 |
Occupancy by Householder Income Bracket in Struble
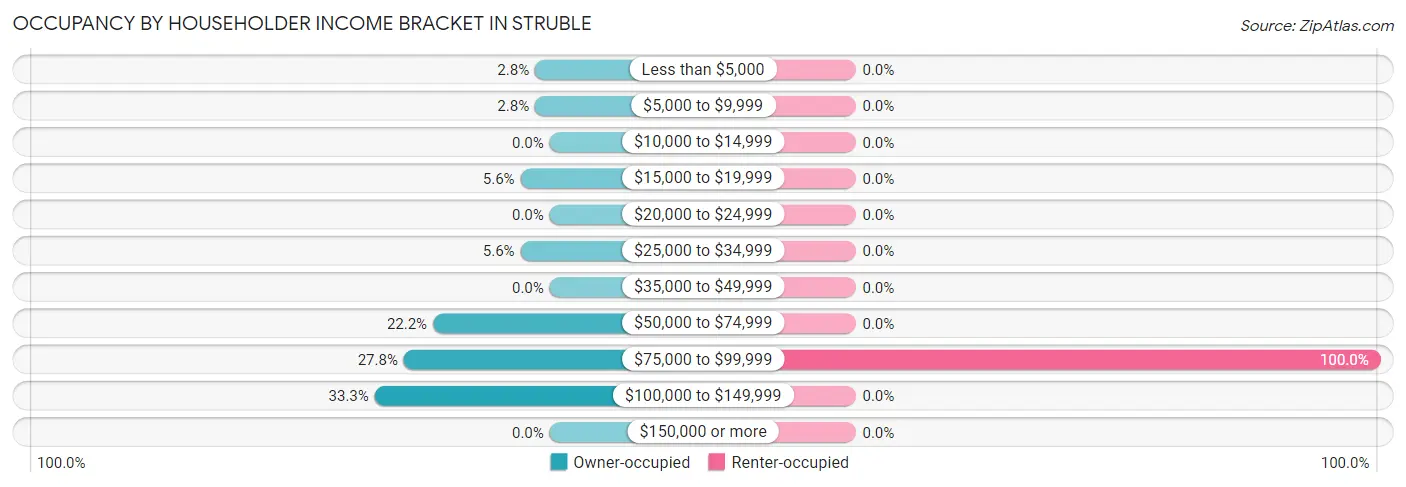
| Income Bracket | Owner-occupied | Renter-occupied |
| Less than $5,000 | 1 (2.8%) | 0 (0.0%) |
| $5,000 to $9,999 | 1 (2.8%) | 0 (0.0%) |
| $10,000 to $14,999 | 0 (0.0%) | 0 (0.0%) |
| $15,000 to $19,999 | 2 (5.6%) | 0 (0.0%) |
| $20,000 to $24,999 | 0 (0.0%) | 0 (0.0%) |
| $25,000 to $34,999 | 2 (5.6%) | 0 (0.0%) |
| $35,000 to $49,999 | 0 (0.0%) | 0 (0.0%) |
| $50,000 to $74,999 | 8 (22.2%) | 0 (0.0%) |
| $75,000 to $99,999 | 10 (27.8%) | 2 (100.0%) |
| $100,000 to $149,999 | 12 (33.3%) | 0 (0.0%) |
| $150,000 or more | 0 (0.0%) | 0 (0.0%) |
| Total | 36 (100.0%) | 2 (100.0%) |
Monthly Housing Cost Tiers in Struble
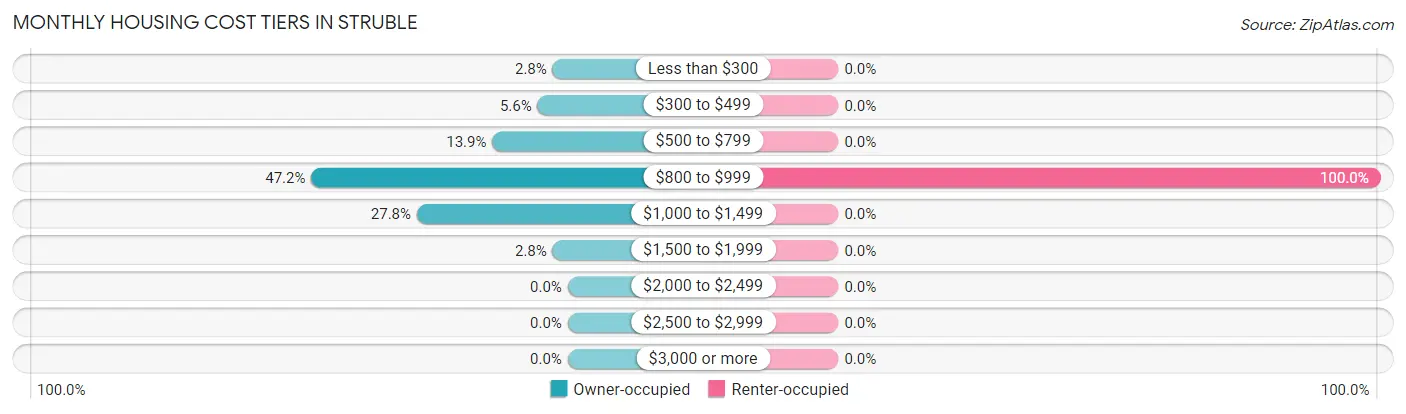
| Monthly Cost | Owner-occupied | Renter-occupied |
| Less than $300 | 1 (2.8%) | 0 (0.0%) |
| $300 to $499 | 2 (5.6%) | 0 (0.0%) |
| $500 to $799 | 5 (13.9%) | 0 (0.0%) |
| $800 to $999 | 17 (47.2%) | 2 (100.0%) |
| $1,000 to $1,499 | 10 (27.8%) | 0 (0.0%) |
| $1,500 to $1,999 | 1 (2.8%) | 0 (0.0%) |
| $2,000 to $2,499 | 0 (0.0%) | 0 (0.0%) |
| $2,500 to $2,999 | 0 (0.0%) | 0 (0.0%) |
| $3,000 or more | 0 (0.0%) | 0 (0.0%) |
| Total | 36 (100.0%) | 2 (100.0%) |
Physical Housing Characteristics in Struble
Housing Structures in Struble
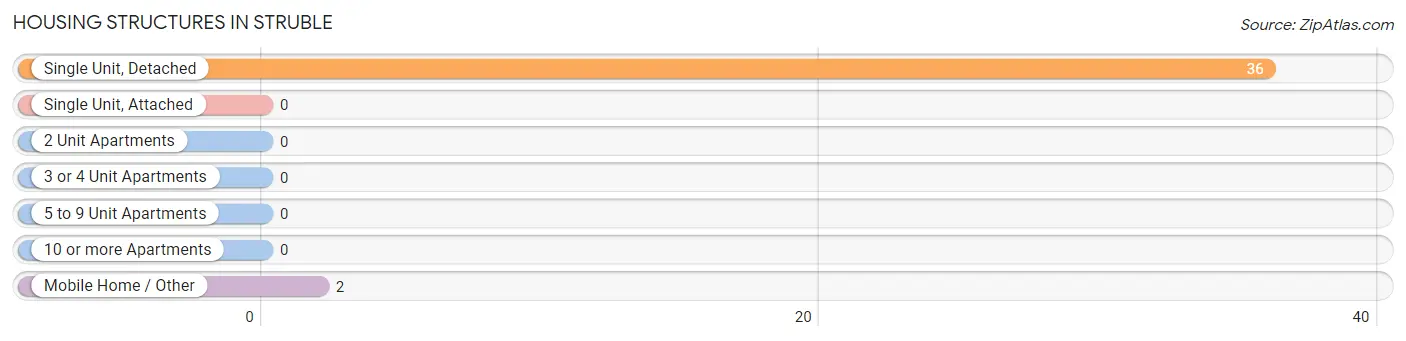
| Structure Type | # Housing Units | % Housing Units |
| Single Unit, Detached | 36 | 94.7% |
| Single Unit, Attached | 0 | 0.0% |
| 2 Unit Apartments | 0 | 0.0% |
| 3 or 4 Unit Apartments | 0 | 0.0% |
| 5 to 9 Unit Apartments | 0 | 0.0% |
| 10 or more Apartments | 0 | 0.0% |
| Mobile Home / Other | 2 | 5.3% |
| Total | 38 | 100.0% |
Housing Structures by Occupancy in Struble
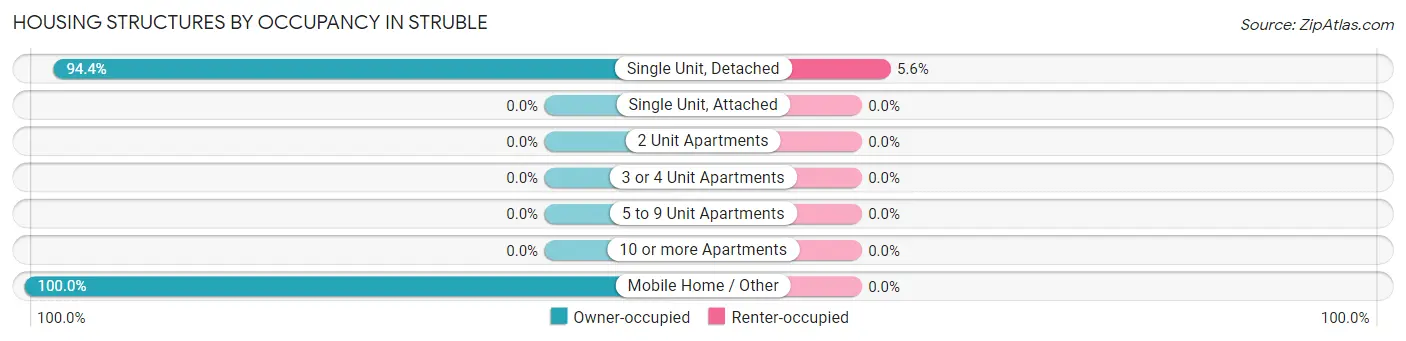
| Structure Type | Owner-occupied | Renter-occupied |
| Single Unit, Detached | 34 (94.4%) | 2 (5.6%) |
| Single Unit, Attached | 0 (0.0%) | 0 (0.0%) |
| 2 Unit Apartments | 0 (0.0%) | 0 (0.0%) |
| 3 or 4 Unit Apartments | 0 (0.0%) | 0 (0.0%) |
| 5 to 9 Unit Apartments | 0 (0.0%) | 0 (0.0%) |
| 10 or more Apartments | 0 (0.0%) | 0 (0.0%) |
| Mobile Home / Other | 2 (100.0%) | 0 (0.0%) |
| Total | 36 (94.7%) | 2 (5.3%) |
Housing Structures by Number of Rooms in Struble
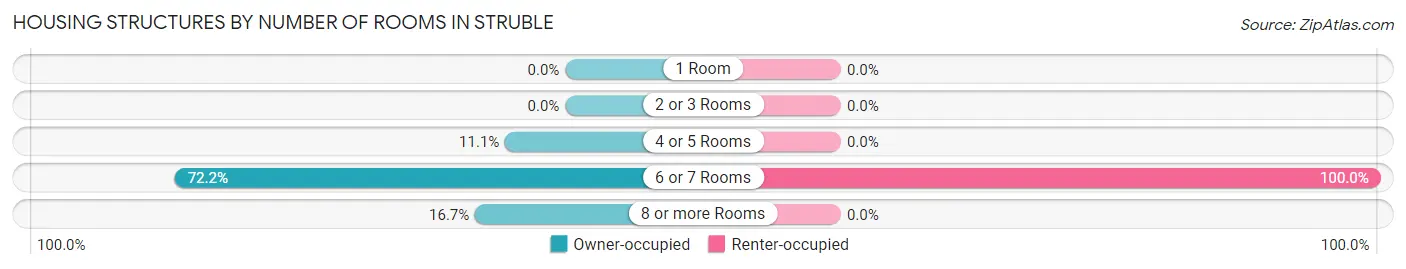
| Number of Rooms | Owner-occupied | Renter-occupied |
| 1 Room | 0 (0.0%) | 0 (0.0%) |
| 2 or 3 Rooms | 0 (0.0%) | 0 (0.0%) |
| 4 or 5 Rooms | 4 (11.1%) | 0 (0.0%) |
| 6 or 7 Rooms | 26 (72.2%) | 2 (100.0%) |
| 8 or more Rooms | 6 (16.7%) | 0 (0.0%) |
| Total | 36 (100.0%) | 2 (100.0%) |
Housing Structure by Heating Type in Struble
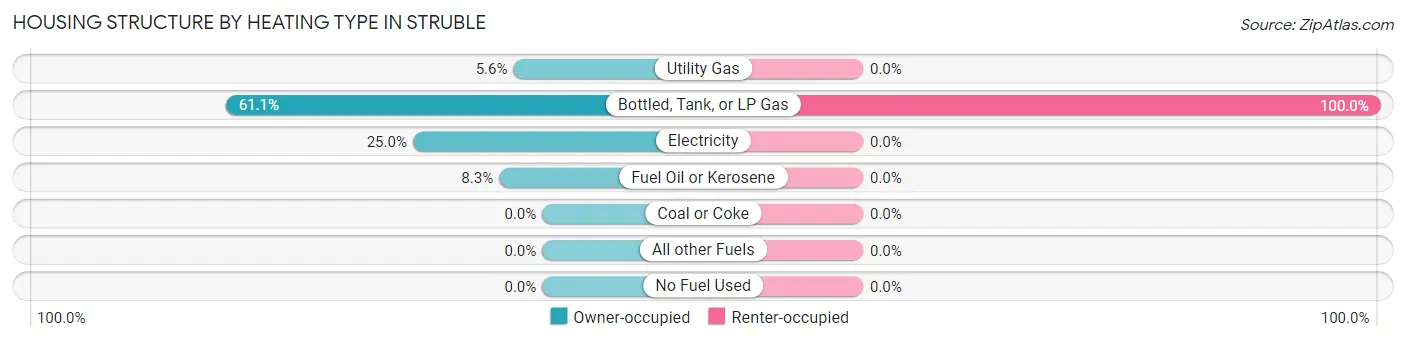
| Heating Type | Owner-occupied | Renter-occupied |
| Utility Gas | 2 (5.6%) | 0 (0.0%) |
| Bottled, Tank, or LP Gas | 22 (61.1%) | 2 (100.0%) |
| Electricity | 9 (25.0%) | 0 (0.0%) |
| Fuel Oil or Kerosene | 3 (8.3%) | 0 (0.0%) |
| Coal or Coke | 0 (0.0%) | 0 (0.0%) |
| All other Fuels | 0 (0.0%) | 0 (0.0%) |
| No Fuel Used | 0 (0.0%) | 0 (0.0%) |
| Total | 36 (100.0%) | 2 (100.0%) |
Household Vehicle Usage in Struble
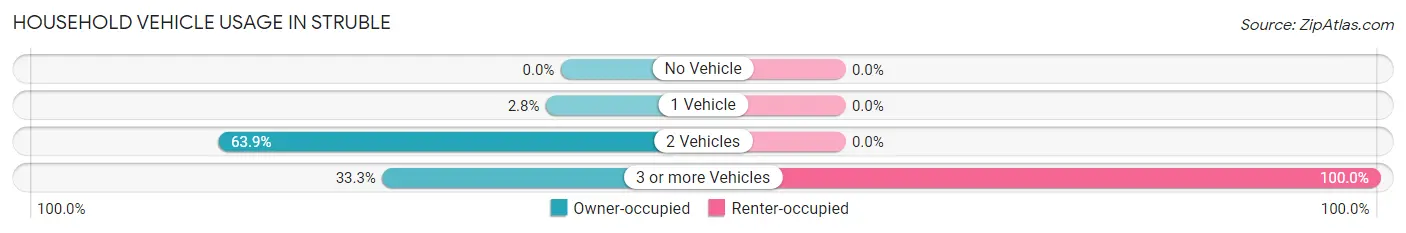
| Vehicles per Household | Owner-occupied | Renter-occupied |
| No Vehicle | 0 (0.0%) | 0 (0.0%) |
| 1 Vehicle | 1 (2.8%) | 0 (0.0%) |
| 2 Vehicles | 23 (63.9%) | 0 (0.0%) |
| 3 or more Vehicles | 12 (33.3%) | 2 (100.0%) |
| Total | 36 (100.0%) | 2 (100.0%) |
Real Estate & Mortgages in Struble
Real Estate and Mortgage Overview in Struble
| Characteristic | Without Mortgage | With Mortgage |
| Housing Units | 8 | 28 |
| Median Property Value | $115,000 | $133,800 |
| Median Household Income | $59,167 | $0 |
| Monthly Housing Costs | $533 | $0 |
| Real Estate Taxes | $1,100 | $0 |
Property Value by Mortgage Status in Struble
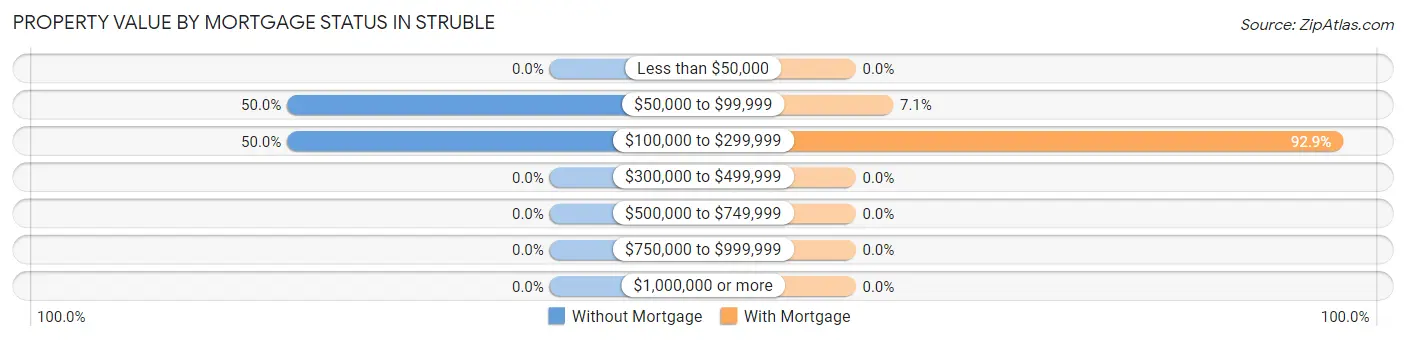
| Property Value | Without Mortgage | With Mortgage |
| Less than $50,000 | 0 (0.0%) | 0 (0.0%) |
| $50,000 to $99,999 | 4 (50.0%) | 2 (7.1%) |
| $100,000 to $299,999 | 4 (50.0%) | 26 (92.9%) |
| $300,000 to $499,999 | 0 (0.0%) | 0 (0.0%) |
| $500,000 to $749,999 | 0 (0.0%) | 0 (0.0%) |
| $750,000 to $999,999 | 0 (0.0%) | 0 (0.0%) |
| $1,000,000 or more | 0 (0.0%) | 0 (0.0%) |
| Total | 8 (100.0%) | 28 (100.0%) |
Household Income by Mortgage Status in Struble
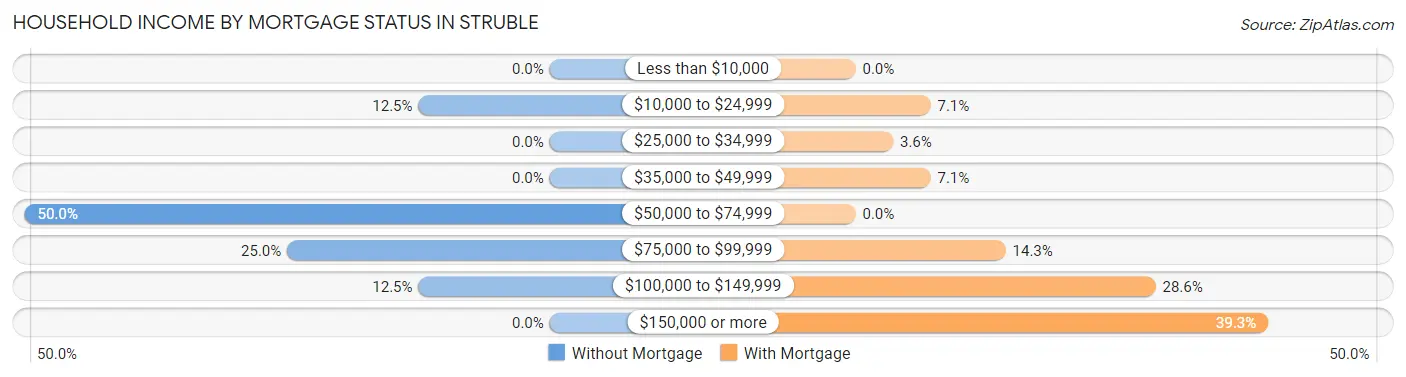
| Household Income | Without Mortgage | With Mortgage |
| Less than $10,000 | 0 (0.0%) | 0 (0.0%) |
| $10,000 to $24,999 | 1 (12.5%) | 2 (7.1%) |
| $25,000 to $34,999 | 0 (0.0%) | 1 (3.6%) |
| $35,000 to $49,999 | 0 (0.0%) | 2 (7.1%) |
| $50,000 to $74,999 | 4 (50.0%) | 0 (0.0%) |
| $75,000 to $99,999 | 2 (25.0%) | 4 (14.3%) |
| $100,000 to $149,999 | 1 (12.5%) | 8 (28.6%) |
| $150,000 or more | 0 (0.0%) | 11 (39.3%) |
| Total | 8 (100.0%) | 28 (100.0%) |
Property Value to Household Income Ratio in Struble
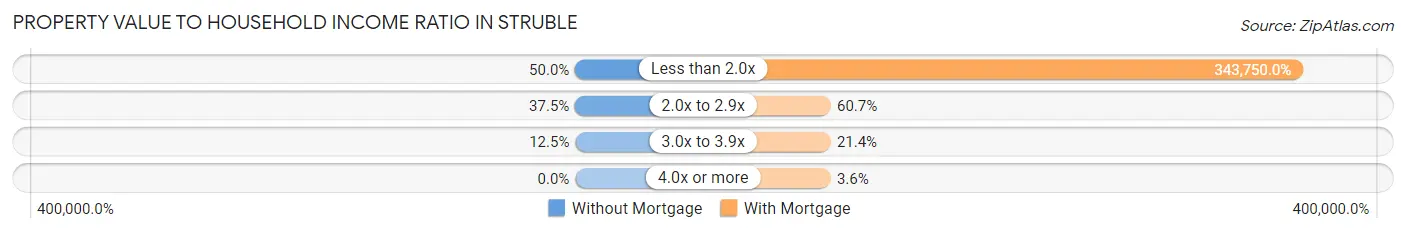
| Value-to-Income Ratio | Without Mortgage | With Mortgage |
| Less than 2.0x | 4 (50.0%) | 96,250 (343,750.0%) |
| 2.0x to 2.9x | 3 (37.5%) | 17 (60.7%) |
| 3.0x to 3.9x | 1 (12.5%) | 6 (21.4%) |
| 4.0x or more | 0 (0.0%) | 1 (3.6%) |
| Total | 8 (100.0%) | 28 (100.0%) |
Real Estate Taxes by Mortgage Status in Struble
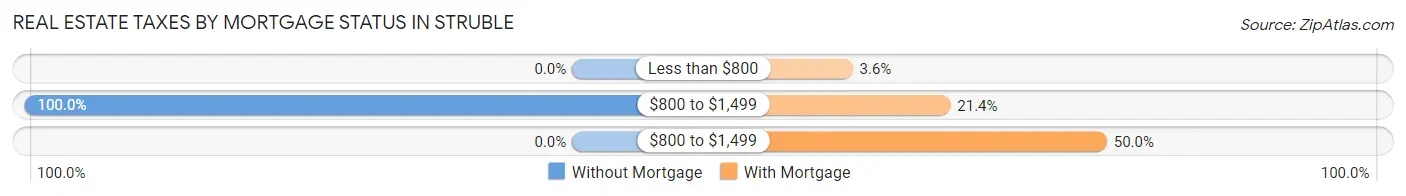
| Property Taxes | Without Mortgage | With Mortgage |
| Less than $800 | 0 (0.0%) | 1 (3.6%) |
| $800 to $1,499 | 8 (100.0%) | 6 (21.4%) |
| $800 to $1,499 | 0 (0.0%) | 14 (50.0%) |
| Total | 8 (100.0%) | 28 (100.0%) |
Health & Disability in Struble
Health Insurance Coverage by Age in Struble
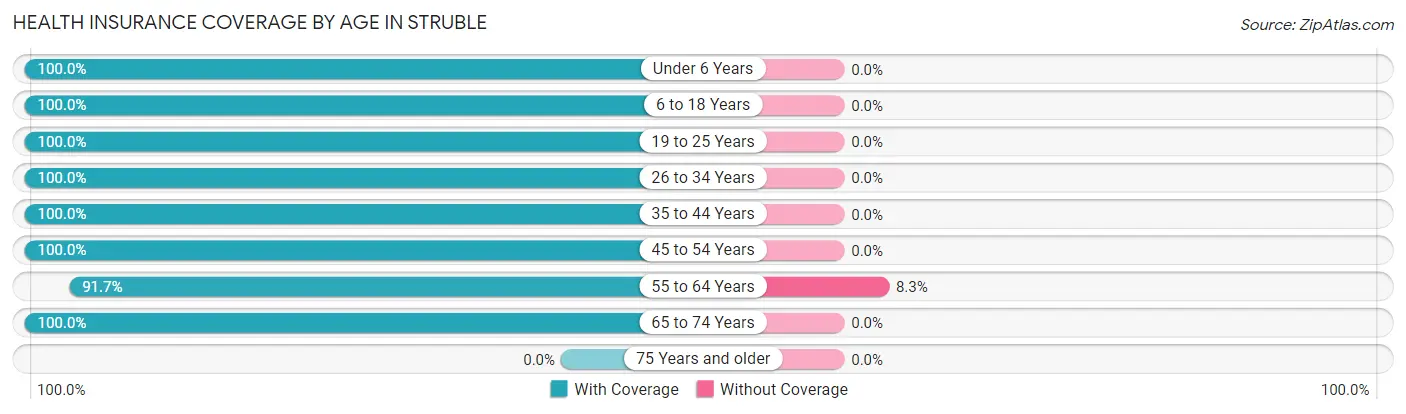
| Age Bracket | With Coverage | Without Coverage |
| Under 6 Years | 8 (100.0%) | 0 (0.0%) |
| 6 to 18 Years | 5 (100.0%) | 0 (0.0%) |
| 19 to 25 Years | 12 (100.0%) | 0 (0.0%) |
| 26 to 34 Years | 8 (100.0%) | 0 (0.0%) |
| 35 to 44 Years | 4 (100.0%) | 0 (0.0%) |
| 45 to 54 Years | 22 (100.0%) | 0 (0.0%) |
| 55 to 64 Years | 11 (91.7%) | 1 (8.3%) |
| 65 to 74 Years | 13 (100.0%) | 0 (0.0%) |
| 75 Years and older | 0 (0.0%) | 0 (0.0%) |
| Total | 83 (98.8%) | 1 (1.2%) |
Health Insurance Coverage by Citizenship Status in Struble
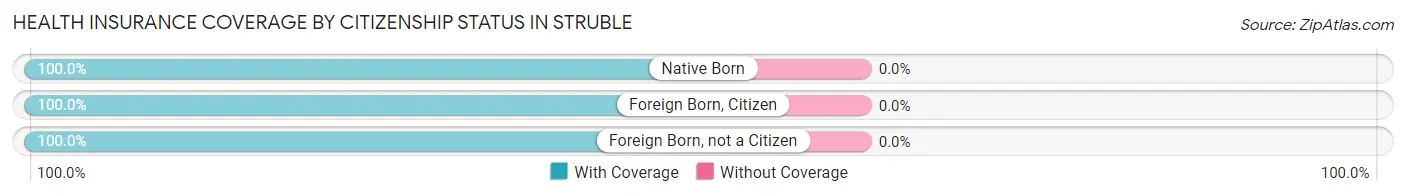
| Citizenship Status | With Coverage | Without Coverage |
| Native Born | 8 (100.0%) | 0 (0.0%) |
| Foreign Born, Citizen | 5 (100.0%) | 0 (0.0%) |
| Foreign Born, not a Citizen | 12 (100.0%) | 0 (0.0%) |
Health Insurance Coverage by Household Income in Struble
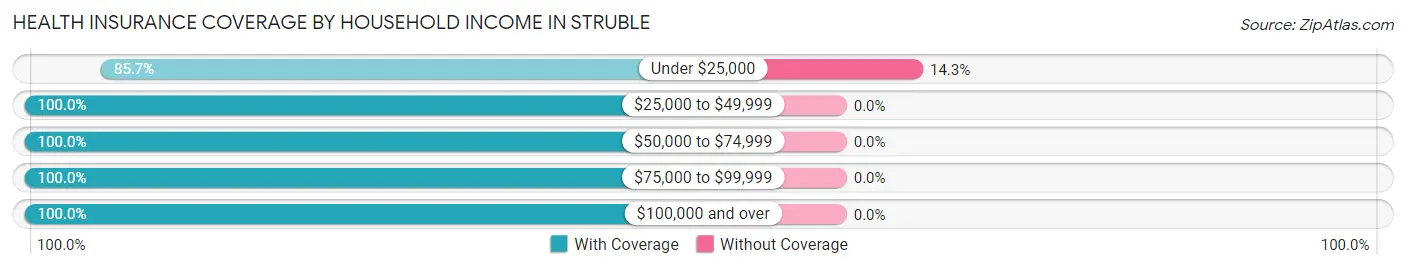
| Household Income | With Coverage | Without Coverage |
| Under $25,000 | 6 (85.7%) | 1 (14.3%) |
| $25,000 to $49,999 | 2 (100.0%) | 0 (0.0%) |
| $50,000 to $74,999 | 19 (100.0%) | 0 (0.0%) |
| $75,000 to $99,999 | 30 (100.0%) | 0 (0.0%) |
| $100,000 and over | 26 (100.0%) | 0 (0.0%) |
Public vs Private Health Insurance Coverage by Age in Struble
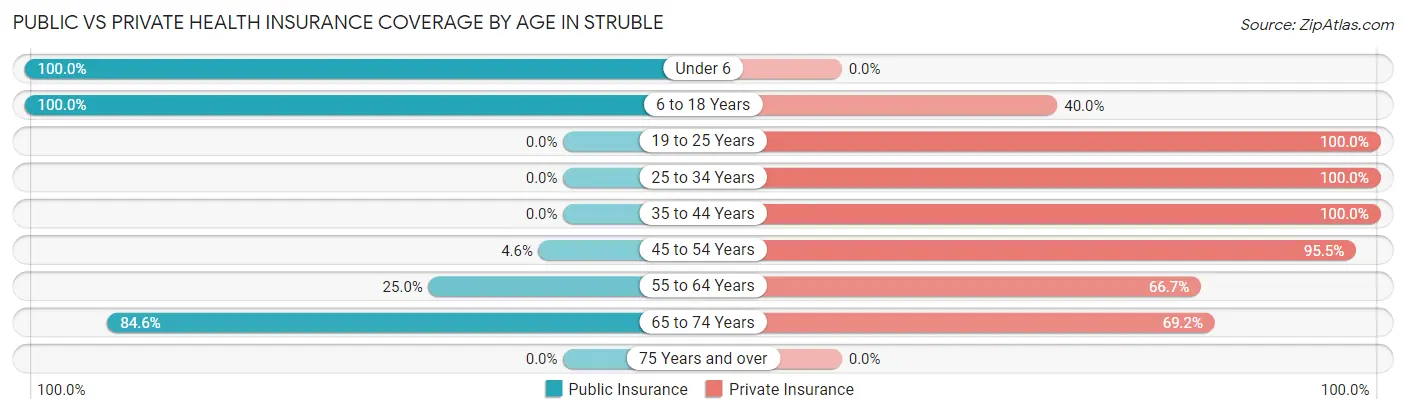
| Age Bracket | Public Insurance | Private Insurance |
| Under 6 | 8 (100.0%) | 0 (0.0%) |
| 6 to 18 Years | 5 (100.0%) | 2 (40.0%) |
| 19 to 25 Years | 0 (0.0%) | 12 (100.0%) |
| 25 to 34 Years | 0 (0.0%) | 8 (100.0%) |
| 35 to 44 Years | 0 (0.0%) | 4 (100.0%) |
| 45 to 54 Years | 1 (4.5%) | 21 (95.5%) |
| 55 to 64 Years | 3 (25.0%) | 8 (66.7%) |
| 65 to 74 Years | 11 (84.6%) | 9 (69.2%) |
| 75 Years and over | 0 (0.0%) | 0 (0.0%) |
| Total | 28 (33.3%) | 64 (76.2%) |
Disability Status by Sex by Age in Struble
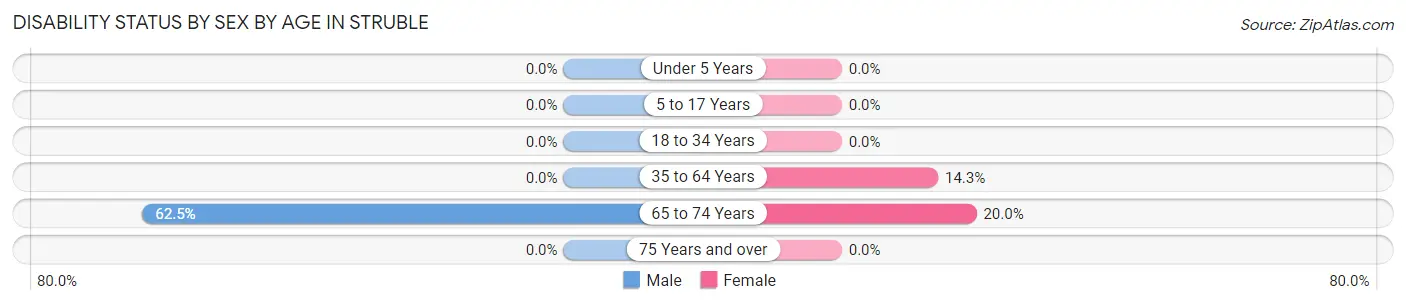
| Age Bracket | Male | Female |
| Under 5 Years | 0 (0.0%) | 0 (0.0%) |
| 5 to 17 Years | 0 (0.0%) | 0 (0.0%) |
| 18 to 34 Years | 0 (0.0%) | 0 (0.0%) |
| 35 to 64 Years | 0 (0.0%) | 3 (14.3%) |
| 65 to 74 Years | 5 (62.5%) | 1 (20.0%) |
| 75 Years and over | 0 (0.0%) | 0 (0.0%) |
Disability Class by Sex by Age in Struble
Disability Class: Hearing Difficulty
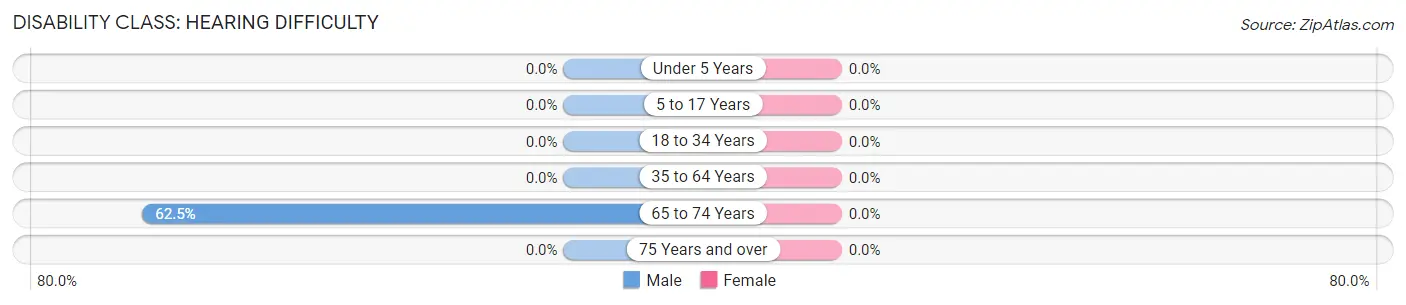
| Age Bracket | Male | Female |
| Under 5 Years | 0 (0.0%) | 0 (0.0%) |
| 5 to 17 Years | 0 (0.0%) | 0 (0.0%) |
| 18 to 34 Years | 0 (0.0%) | 0 (0.0%) |
| 35 to 64 Years | 0 (0.0%) | 0 (0.0%) |
| 65 to 74 Years | 5 (62.5%) | 0 (0.0%) |
| 75 Years and over | 0 (0.0%) | 0 (0.0%) |
Disability Class: Vision Difficulty
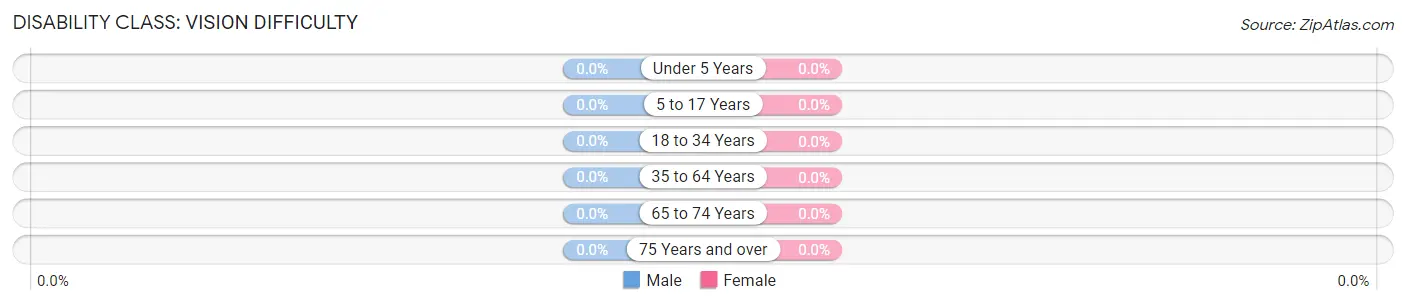
| Age Bracket | Male | Female |
| Under 5 Years | 0 (0.0%) | 0 (0.0%) |
| 5 to 17 Years | 0 (0.0%) | 0 (0.0%) |
| 18 to 34 Years | 0 (0.0%) | 0 (0.0%) |
| 35 to 64 Years | 0 (0.0%) | 0 (0.0%) |
| 65 to 74 Years | 0 (0.0%) | 0 (0.0%) |
| 75 Years and over | 0 (0.0%) | 0 (0.0%) |
Disability Class: Cognitive Difficulty
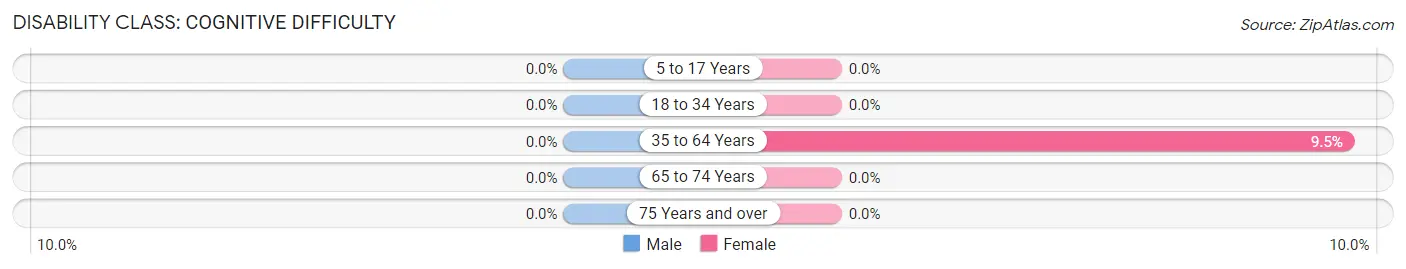
| Age Bracket | Male | Female |
| 5 to 17 Years | 0 (0.0%) | 0 (0.0%) |
| 18 to 34 Years | 0 (0.0%) | 0 (0.0%) |
| 35 to 64 Years | 0 (0.0%) | 2 (9.5%) |
| 65 to 74 Years | 0 (0.0%) | 0 (0.0%) |
| 75 Years and over | 0 (0.0%) | 0 (0.0%) |
Disability Class: Ambulatory Difficulty
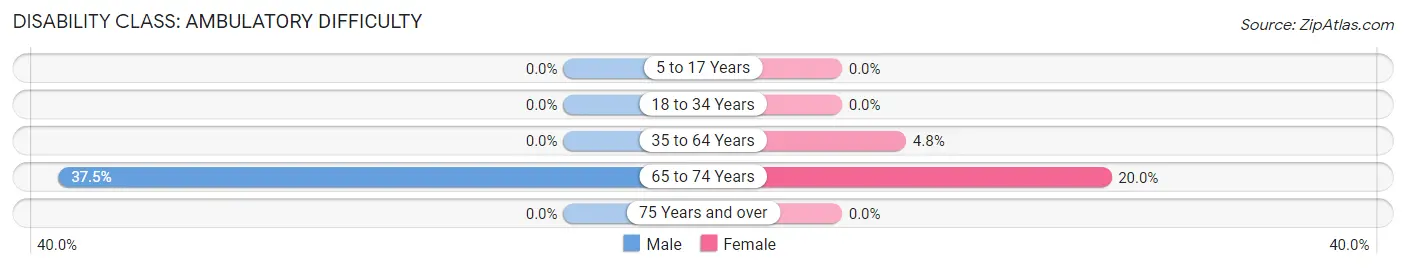
| Age Bracket | Male | Female |
| 5 to 17 Years | 0 (0.0%) | 0 (0.0%) |
| 18 to 34 Years | 0 (0.0%) | 0 (0.0%) |
| 35 to 64 Years | 0 (0.0%) | 1 (4.8%) |
| 65 to 74 Years | 3 (37.5%) | 1 (20.0%) |
| 75 Years and over | 0 (0.0%) | 0 (0.0%) |
Disability Class: Self-Care Difficulty
| Age Bracket | Male | Female |
| 5 to 17 Years | 0 (0.0%) | 0 (0.0%) |
| 18 to 34 Years | 0 (0.0%) | 0 (0.0%) |
| 35 to 64 Years | 0 (0.0%) | 0 (0.0%) |
| 65 to 74 Years | 0 (0.0%) | 0 (0.0%) |
| 75 Years and over | 0 (0.0%) | 0 (0.0%) |
Technology Access in Struble
Computing Device Access in Struble
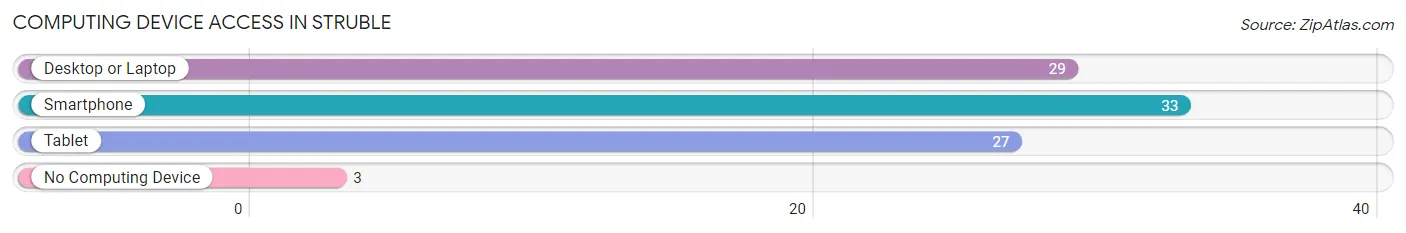
| Device Type | # Households | % Households |
| Desktop or Laptop | 29 | 76.3% |
| Smartphone | 33 | 86.8% |
| Tablet | 27 | 71.1% |
| No Computing Device | 3 | 7.9% |
| Total | 38 | 100.0% |
Internet Access in Struble
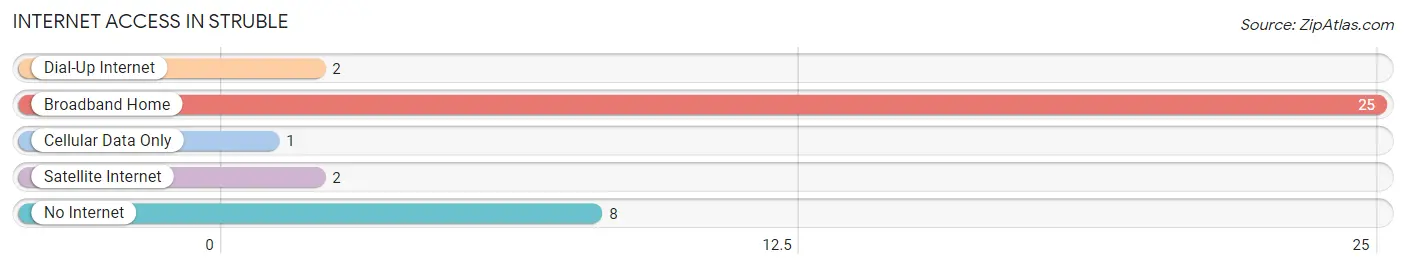
| Internet Type | # Households | % Households |
| Dial-Up Internet | 2 | 5.3% |
| Broadband Home | 25 | 65.8% |
| Cellular Data Only | 1 | 2.6% |
| Satellite Internet | 2 | 5.3% |
| No Internet | 8 | 21.0% |
| Total | 38 | 100.0% |
Struble Summary
Struble is a small unincorporated community located in the northwest corner of Clay County, Iowa. It is situated on the banks of the Little Sioux River, approximately five miles south of the city of Spencer. The town was founded in 1881 by a group of settlers from Wisconsin, and was named after one of the settlers, John Struble.
History
Struble was founded in 1881 by a group of settlers from Wisconsin. The settlers were led by John Struble, who had purchased the land from the government. The town was originally known as Struble's Grove, but the name was changed to Struble in 1883.
The town grew quickly, and by the early 1900s it had a population of over 500 people. The town was home to a variety of businesses, including a general store, a blacksmith shop, a hotel, a bank, a post office, and a school.
The town was also home to a variety of churches, including the Methodist Episcopal Church, the Congregational Church, and the Lutheran Church. The town also had a newspaper, the Struble Times, which was published from 1883 to 1910.
The town was also home to a variety of recreational activities, including baseball, basketball, and swimming. The town also had a movie theater, which opened in 1915 and closed in the 1950s.
Geography
Struble is located in the northwest corner of Clay County, Iowa. It is situated on the banks of the Little Sioux River, approximately five miles south of the city of Spencer. The town is located in a rural area, and is surrounded by farmland.
The town has a total area of 0.3 square miles, all of which is land. The town is located at an elevation of 1,072 feet above sea level.
Economy
The economy of Struble is largely based on agriculture. The town is surrounded by farmland, and many of the residents are involved in farming and related activities.
The town also has a few small businesses, including a general store, a gas station, and a restaurant.
Demographics
As of the 2010 census, the population of Struble was 97. The racial makeup of the town was 97.9% White, 0.0% African American, 0.0% Native American, 0.0% Asian, 0.0% Pacific Islander, 0.0% from other races, and 2.1% from two or more races.
The median household income in Struble was $37,500, and the median family income was $41,250. The per capita income in Struble was $17,818. About 8.3% of the population was below the poverty line.
Conclusion
Struble is a small unincorporated community located in the northwest corner of Clay County, Iowa. It was founded in 1881 by a group of settlers from Wisconsin, and was named after one of the settlers, John Struble. The town has a population of 97, and the economy is largely based on agriculture. The town is also home to a variety of businesses, churches, and recreational activities. Struble is a small, rural community with a rich history and a bright future.
Common Questions
What is Per Capita Income in Struble?
Per Capita income in Struble is $34,654.
What is the Median Family Income in Struble?
Median Family Income in Struble is $93,125.
What is the Median Household income in Struble?
Median Household Income in Struble is $93,750.
What is Income or Wage Gap in Struble?
Income or Wage Gap in Struble is 22.5%.
Women in Struble earn 77.5 cents for every dollar earned by a man.
What is Inequality or Gini Index in Struble?
Inequality or Gini Index in Struble is 0.24.
What is the Total Population of Struble?
Total Population of Struble is 84.
What is the Total Male Population of Struble?
Total Male Population of Struble is 38.
What is the Total Female Population of Struble?
Total Female Population of Struble is 46.
What is the Ratio of Males per 100 Females in Struble?
There are 82.61 Males per 100 Females in Struble.
What is the Ratio of Females per 100 Males in Struble?
There are 121.05 Females per 100 Males in Struble.
What is the Median Population Age in Struble?
Median Population Age in Struble is 49.5 Years.
What is the Average Family Size in Struble
Average Family Size in Struble is 2.5 People.
What is the Average Household Size in Struble
Average Household Size in Struble is 2.2 People.
How Large is the Labor Force in Struble?
There are 51 People in the Labor Forcein in Struble.
What is the Percentage of People in the Labor Force in Struble?
71.8% of People are in the Labor Force in Struble.