Sandyville, IA Map & Demographics
Sandyville Map
Sandyville Overview
$23,357
PER CAPITA INCOME
37.1%
WAGE / INCOME GAP [ % ]
62.9¢/ $1
WAGE / INCOME GAP [ $ ]
0.39
INEQUALITY / GINI INDEX
46
TOTAL POPULATION
26
MALE POPULATION
20
FEMALE POPULATION
130.00
MALES / 100 FEMALES
76.92
FEMALES / 100 MALES
40.5
MEDIAN AGE
3.0
AVG FAMILY SIZE
2.9
AVG HOUSEHOLD SIZE
17
LABOR FORCE [ PEOPLE ]
54.8%
PERCENT IN LABOR FORCE
5.9%
UNEMPLOYMENT RATE
Income in Sandyville
Income Overview in Sandyville
| Characteristic | Number | Measure |
| Per Capita Income | 46 | $23,357 |
| Median Family Income | 15 | $0 |
| Mean Family Income | 15 | $70,993 |
| Median Household Income | 16 | $0 |
| Mean Household Income | 16 | $67,331 |
| Income Deficit | 15 | $0 |
| Wage / Income Gap (%) | 46 | 37.05% |
| Wage / Income Gap ($) | 46 | 62.95¢ per $1 |
| Gini / Inequality Index | 46 | 0.39 |
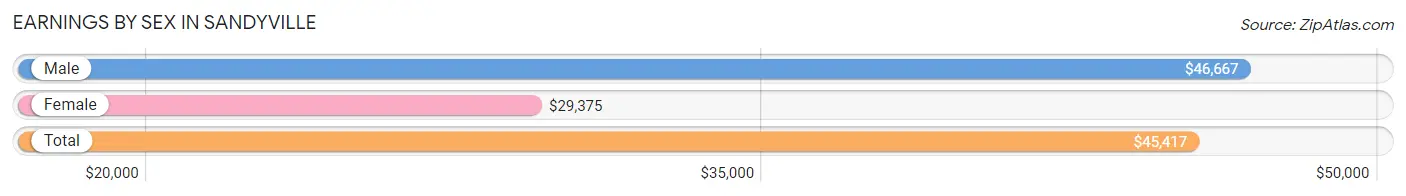
Earnings by Sex in Sandyville
Average Earnings in Sandyville are $45,417, $46,667 for men and $29,375 for women, a difference of 37.0%.
| Sex | Number | Average Earnings |
| Male | 12 (70.6%) | $46,667 |
| Female | 5 (29.4%) | $29,375 |
| Total | 17 (100.0%) | $45,417 |
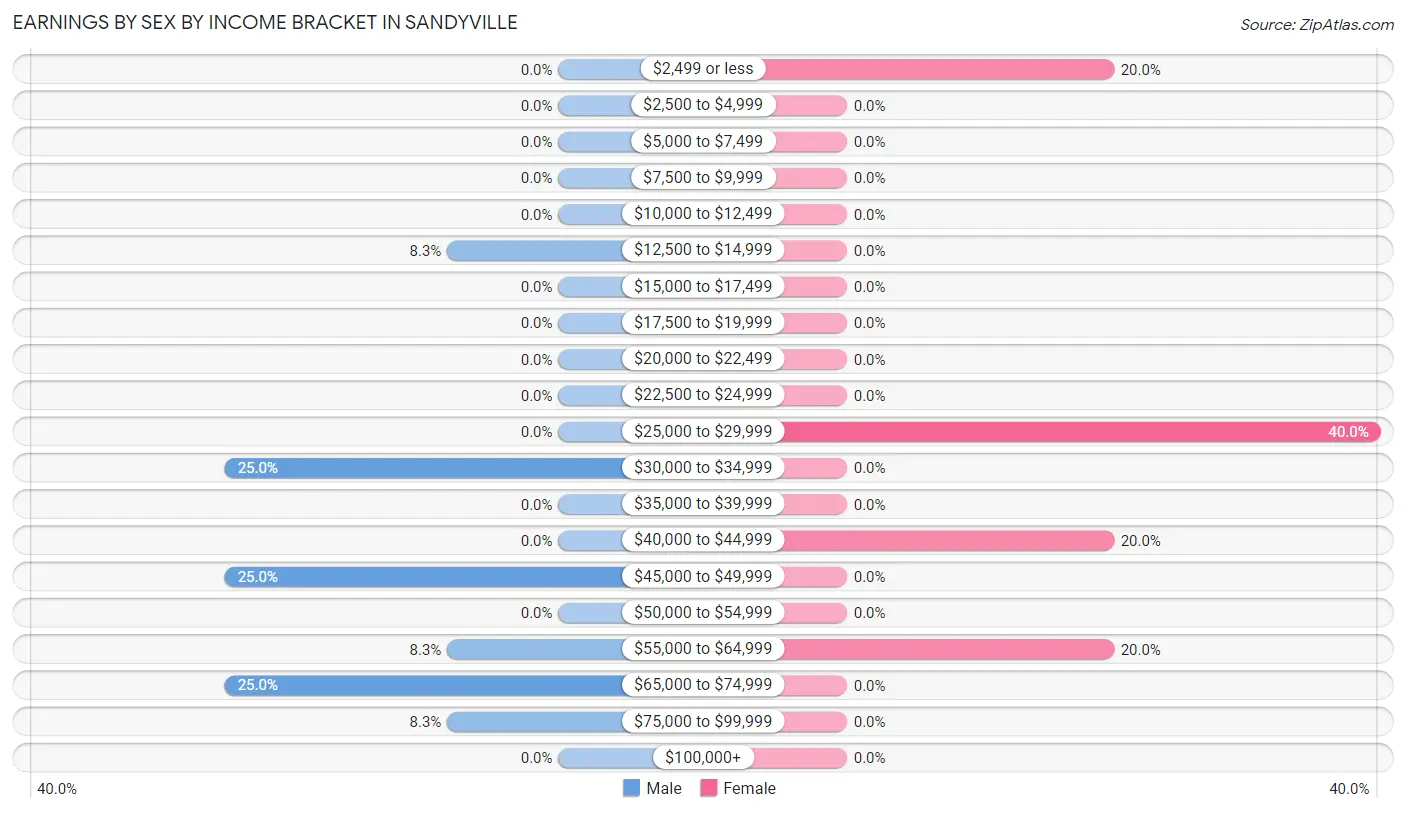
Earnings by Sex by Income Bracket in Sandyville
The most common earnings brackets in Sandyville are $30,000 to $34,999 for men (3 | 25.0%) and $25,000 to $29,999 for women (2 | 40.0%).
| Income | Male | Female |
| $2,499 or less | 0 (0.0%) | 1 (20.0%) |
| $2,500 to $4,999 | 0 (0.0%) | 0 (0.0%) |
| $5,000 to $7,499 | 0 (0.0%) | 0 (0.0%) |
| $7,500 to $9,999 | 0 (0.0%) | 0 (0.0%) |
| $10,000 to $12,499 | 0 (0.0%) | 0 (0.0%) |
| $12,500 to $14,999 | 1 (8.3%) | 0 (0.0%) |
| $15,000 to $17,499 | 0 (0.0%) | 0 (0.0%) |
| $17,500 to $19,999 | 0 (0.0%) | 0 (0.0%) |
| $20,000 to $22,499 | 0 (0.0%) | 0 (0.0%) |
| $22,500 to $24,999 | 0 (0.0%) | 0 (0.0%) |
| $25,000 to $29,999 | 0 (0.0%) | 2 (40.0%) |
| $30,000 to $34,999 | 3 (25.0%) | 0 (0.0%) |
| $35,000 to $39,999 | 0 (0.0%) | 0 (0.0%) |
| $40,000 to $44,999 | 0 (0.0%) | 1 (20.0%) |
| $45,000 to $49,999 | 3 (25.0%) | 0 (0.0%) |
| $50,000 to $54,999 | 0 (0.0%) | 0 (0.0%) |
| $55,000 to $64,999 | 1 (8.3%) | 1 (20.0%) |
| $65,000 to $74,999 | 3 (25.0%) | 0 (0.0%) |
| $75,000 to $99,999 | 1 (8.3%) | 0 (0.0%) |
| $100,000+ | 0 (0.0%) | 0 (0.0%) |
| Total | 12 (100.0%) | 5 (100.0%) |
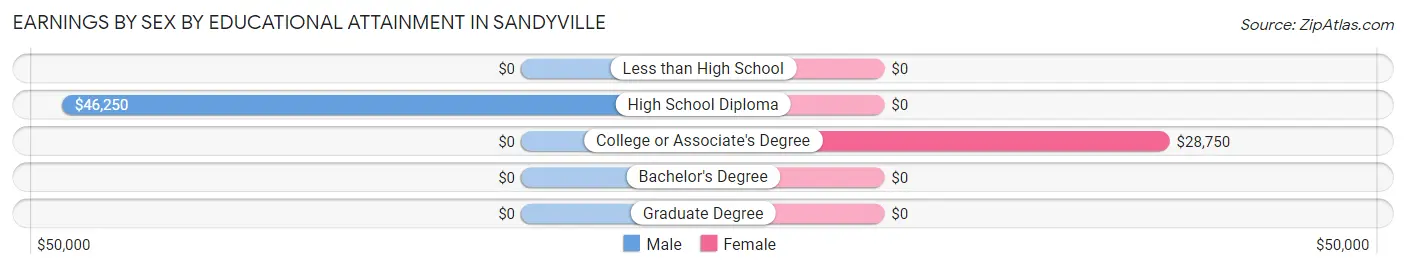
Earnings by Sex by Educational Attainment in Sandyville
Average earnings in Sandyville are $46,667 for men and $29,375 for women, a difference of 37.0%. Men with an educational attainment of high school diploma enjoy the highest average annual earnings of $46,250, while those with high school diploma education earn the least with $46,250. Women with an educational attainment of college or associate's degree earn the most with the average annual earnings of $28,750, while those with college or associate's degree education have the smallest earnings of $28,750.
| Educational Attainment | Male Income | Female Income |
| Less than High School | - | - |
| High School Diploma | $46,250 | $0 |
| College or Associate's Degree | - | - |
| Bachelor's Degree | - | - |
| Graduate Degree | - | - |
| Total | $46,667 | $29,375 |
Family Income in Sandyville
Family Income Brackets in Sandyville
According to the Sandyville family income data, there are 4 families falling into the $25,000 to $34,999 income range, which is the most common income bracket and makes up 26.7% of all families.
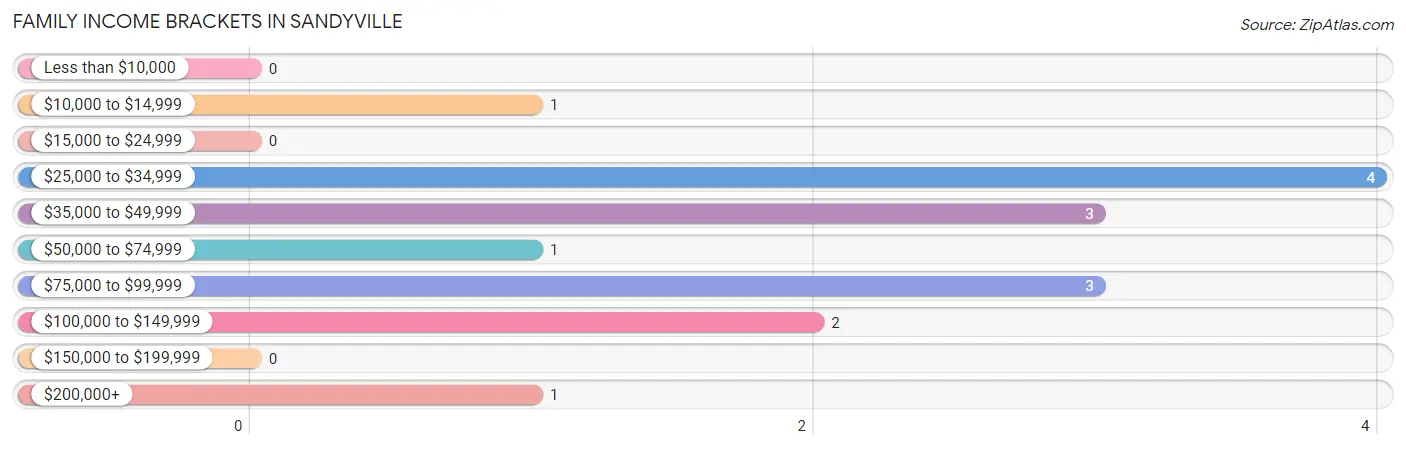
| Income Bracket | # Families | % Families |
| Less than $10,000 | 0 | 0.0% |
| $10,000 to $14,999 | 1 | 6.7% |
| $15,000 to $24,999 | 0 | 0.0% |
| $25,000 to $34,999 | 4 | 26.7% |
| $35,000 to $49,999 | 3 | 20.0% |
| $50,000 to $74,999 | 1 | 6.7% |
| $75,000 to $99,999 | 3 | 20.0% |
| $100,000 to $149,999 | 2 | 13.3% |
| $150,000 to $199,999 | 0 | 0.0% |
| $200,000+ | 1 | 6.7% |
Family Income by Famaliy Size in Sandyville
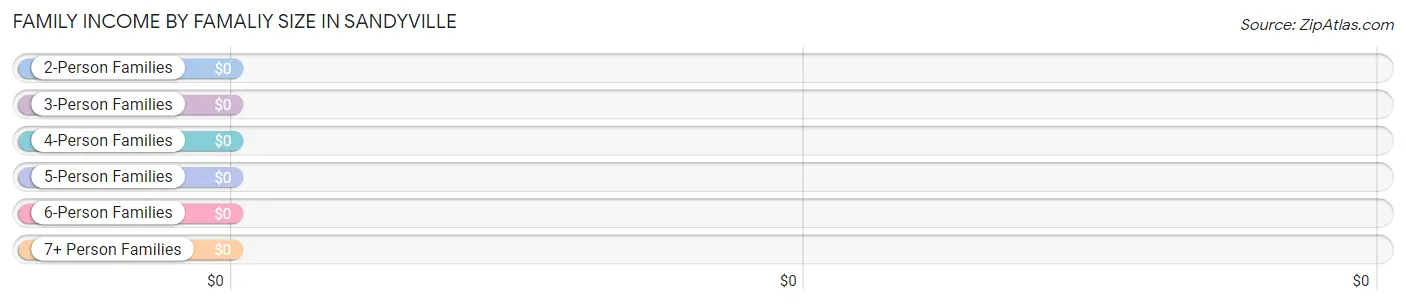
| Income Bracket | # Families | Median Income |
| 2-Person Families | 8 (53.3%) | $0 |
| 3-Person Families | 2 (13.3%) | $0 |
| 4-Person Families | 1 (6.7%) | $0 |
| 5-Person Families | 4 (26.7%) | $0 |
| 6-Person Families | 0 (0.0%) | $0 |
| 7+ Person Families | 0 (0.0%) | $0 |
| Total | 15 (100.0%) | $0 |
Family Income by Number of Earners in Sandyville
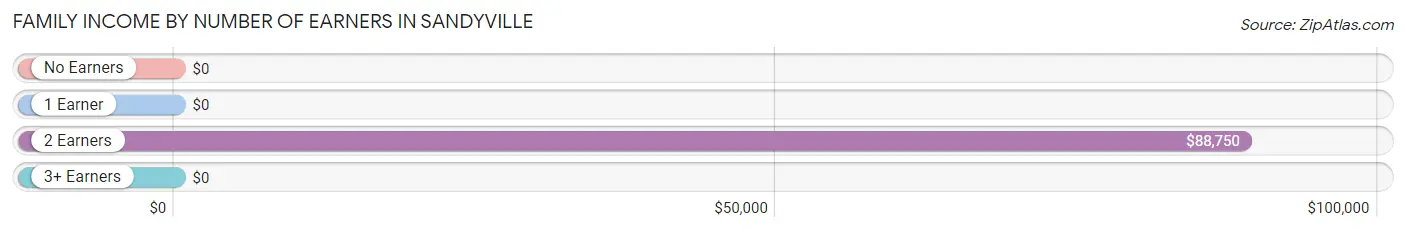
| Number of Earners | # Families | Median Income |
| No Earners | 1 (6.7%) | $0 |
| 1 Earner | 11 (73.3%) | $0 |
| 2 Earners | 3 (20.0%) | $88,750 |
| 3+ Earners | 0 (0.0%) | $0 |
| Total | 15 (100.0%) | $0 |
Household Income in Sandyville
Household Income Brackets in Sandyville
With 4 households falling in the category, the $25,000 to $34,999 income range is the most frequent in Sandyville, accounting for 25.0% of all households.
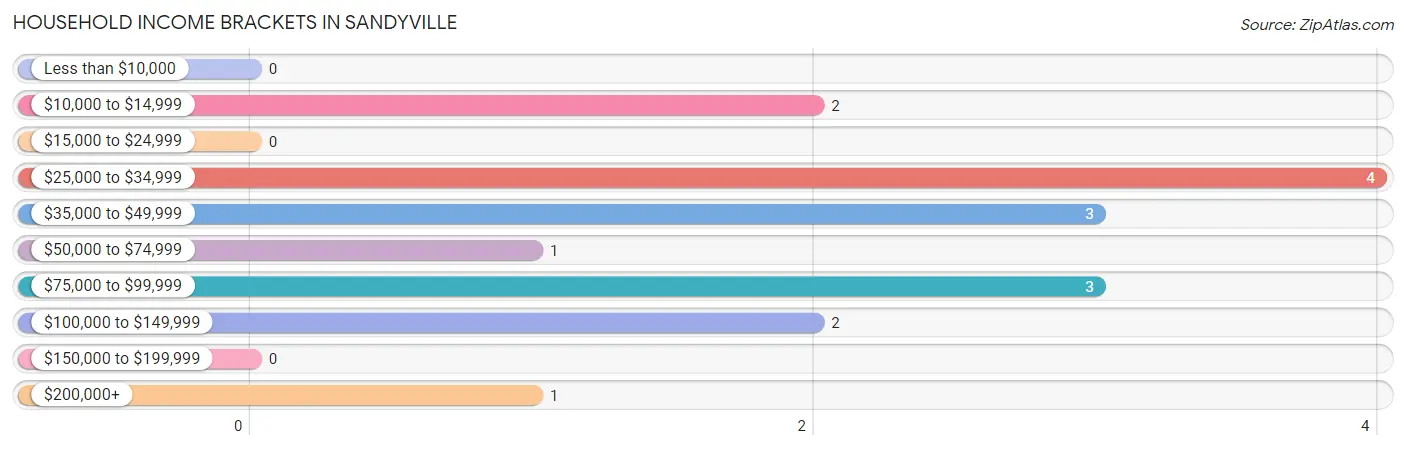
| Income Bracket | # Households | % Households |
| Less than $10,000 | 0 | 0.0% |
| $10,000 to $14,999 | 2 | 12.5% |
| $15,000 to $24,999 | 0 | 0.0% |
| $25,000 to $34,999 | 4 | 25.0% |
| $35,000 to $49,999 | 3 | 18.8% |
| $50,000 to $74,999 | 1 | 6.3% |
| $75,000 to $99,999 | 3 | 18.8% |
| $100,000 to $149,999 | 2 | 12.5% |
| $150,000 to $199,999 | 0 | 0.0% |
| $200,000+ | 1 | 6.3% |
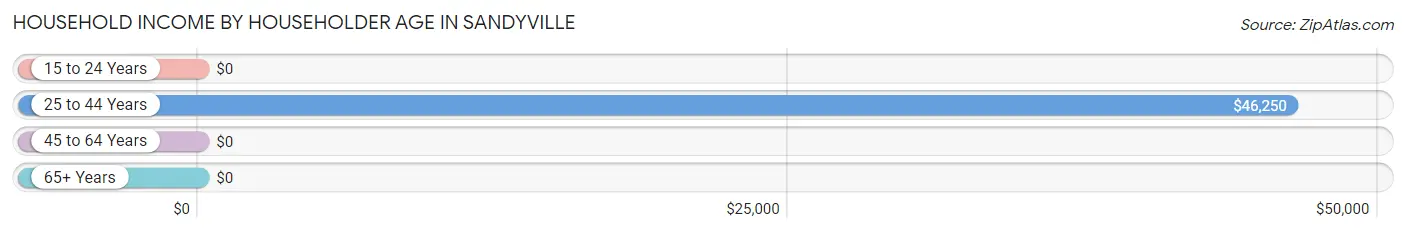
Household Income by Householder Age in Sandyville
The median household income in Sandyville is $0, with the highest median household income of $46,250 found in the 25 to 44 years age bracket for the primary householder. A total of 5 households (31.2%) fall into this category.
| Income Bracket | # Households | Median Income |
| 15 to 24 Years | 0 (0.0%) | $0 |
| 25 to 44 Years | 5 (31.2%) | $46,250 |
| 45 to 64 Years | 7 (43.8%) | $0 |
| 65+ Years | 4 (25.0%) | $0 |
| Total | 16 (100.0%) | $0 |
Poverty in Sandyville
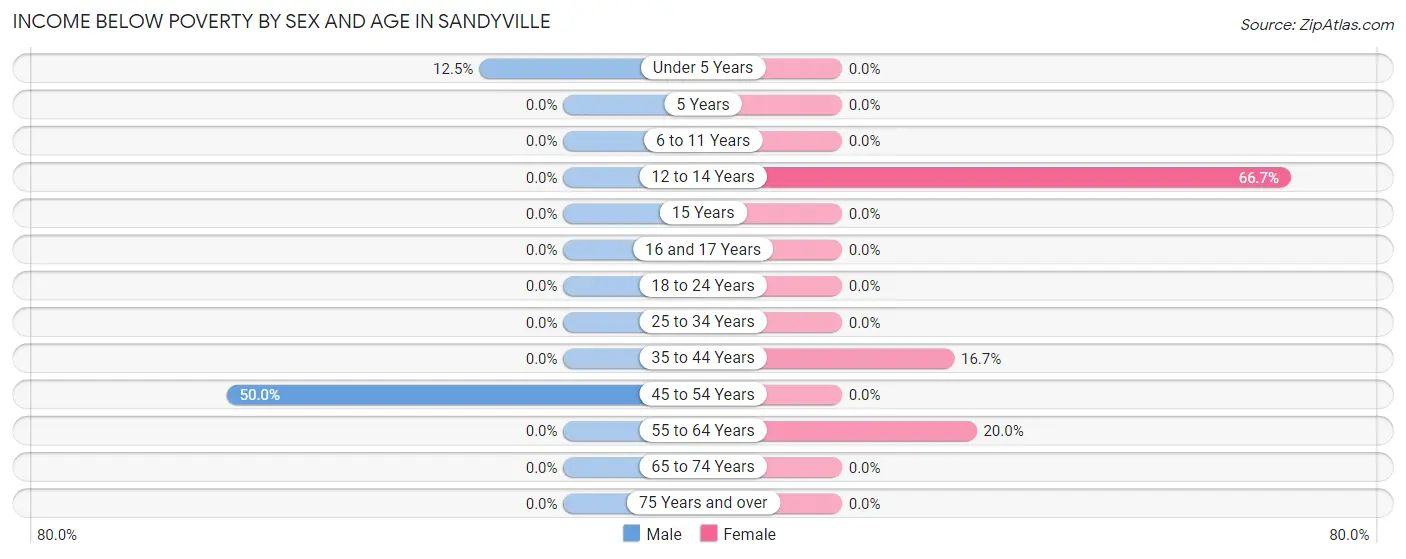
Income Below Poverty by Sex and Age in Sandyville
With 7.7% poverty level for males and 20.0% for females among the residents of Sandyville, 45 to 54 year old males and 12 to 14 year old females are the most vulnerable to poverty, with 1 males (50.0%) and 2 females (66.7%) in their respective age groups living below the poverty level.
| Age Bracket | Male | Female |
| Under 5 Years | 1 (12.5%) | 0 (0.0%) |
| 5 Years | 0 (0.0%) | 0 (0.0%) |
| 6 to 11 Years | 0 (0.0%) | 0 (0.0%) |
| 12 to 14 Years | 0 (0.0%) | 2 (66.7%) |
| 15 Years | 0 (0.0%) | 0 (0.0%) |
| 16 and 17 Years | 0 (0.0%) | 0 (0.0%) |
| 18 to 24 Years | 0 (0.0%) | 0 (0.0%) |
| 25 to 34 Years | 0 (0.0%) | 0 (0.0%) |
| 35 to 44 Years | 0 (0.0%) | 1 (16.7%) |
| 45 to 54 Years | 1 (50.0%) | 0 (0.0%) |
| 55 to 64 Years | 0 (0.0%) | 1 (20.0%) |
| 65 to 74 Years | 0 (0.0%) | 0 (0.0%) |
| 75 Years and over | 0 (0.0%) | 0 (0.0%) |
| Total | 2 (7.7%) | 4 (20.0%) |
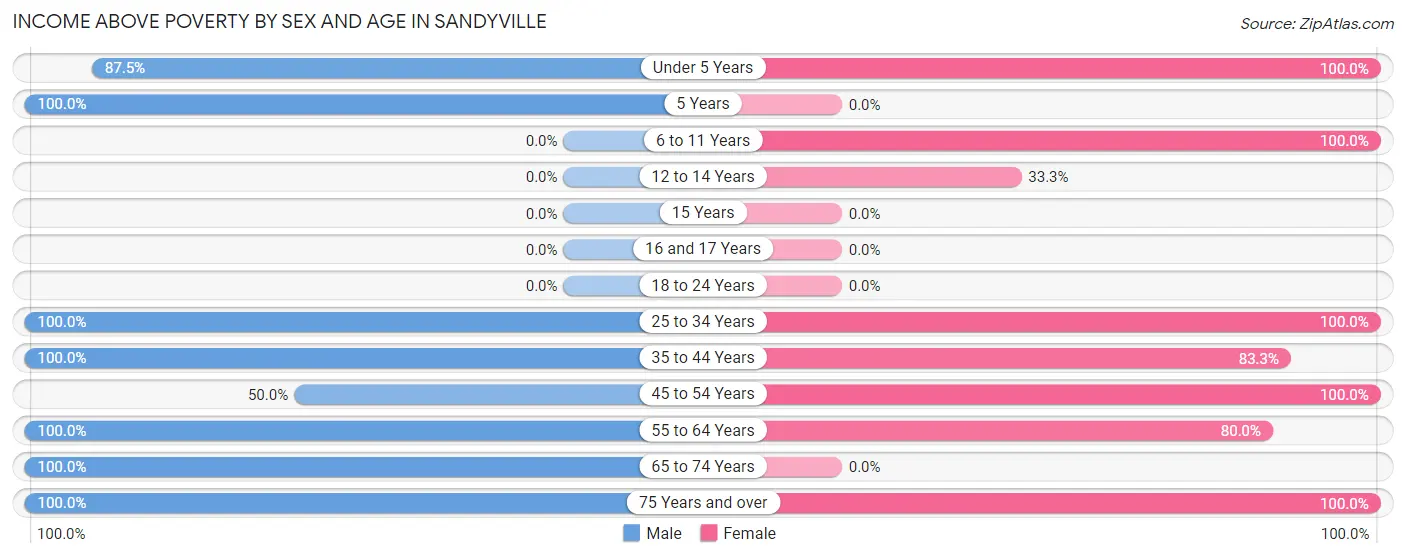
Income Above Poverty by Sex and Age in Sandyville
According to the poverty statistics in Sandyville, males aged 5 years and females aged under 5 years are the age groups that are most secure financially, with 100.0% of males and 100.0% of females in these age groups living above the poverty line.
| Age Bracket | Male | Female |
| Under 5 Years | 7 (87.5%) | 1 (100.0%) |
| 5 Years | 2 (100.0%) | 0 (0.0%) |
| 6 to 11 Years | 0 (0.0%) | 1 (100.0%) |
| 12 to 14 Years | 0 (0.0%) | 1 (33.3%) |
| 15 Years | 0 (0.0%) | 0 (0.0%) |
| 16 and 17 Years | 0 (0.0%) | 0 (0.0%) |
| 18 to 24 Years | 0 (0.0%) | 0 (0.0%) |
| 25 to 34 Years | 1 (100.0%) | 1 (100.0%) |
| 35 to 44 Years | 2 (100.0%) | 5 (83.3%) |
| 45 to 54 Years | 1 (50.0%) | 1 (100.0%) |
| 55 to 64 Years | 7 (100.0%) | 4 (80.0%) |
| 65 to 74 Years | 2 (100.0%) | 0 (0.0%) |
| 75 Years and over | 2 (100.0%) | 2 (100.0%) |
| Total | 24 (92.3%) | 16 (80.0%) |
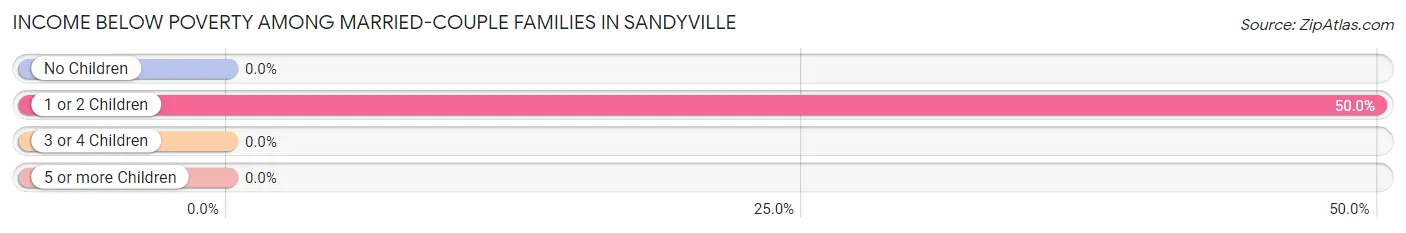
Income Below Poverty Among Married-Couple Families in Sandyville
The poverty statistics for married-couple families in Sandyville show that 6.7% or 1 of the total 15 families live below the poverty line. Families with 1 or 2 children have the highest poverty rate of 50.0%, comprising of 1 families. On the other hand, families with no children have the lowest poverty rate of 0.0%, which includes 0 families.
| Children | Above Poverty | Below Poverty |
| No Children | 9 (100.0%) | 0 (0.0%) |
| 1 or 2 Children | 1 (50.0%) | 1 (50.0%) |
| 3 or 4 Children | 4 (100.0%) | 0 (0.0%) |
| 5 or more Children | 0 (0.0%) | 0 (0.0%) |
| Total | 14 (93.3%) | 1 (6.7%) |
Income Below Poverty Among Single-Parent Households in Sandyville
| Children | Single Father | Single Mother |
| No Children | 0 (0.0%) | 0 (0.0%) |
| 1 or 2 Children | 0 (0.0%) | 0 (0.0%) |
| 3 or 4 Children | 0 (0.0%) | 0 (0.0%) |
| 5 or more Children | 0 (0.0%) | 0 (0.0%) |
| Total | 0 (0.0%) | 0 (0.0%) |
Income Below Poverty Among Married-Couple vs Single-Parent Households in Sandyville
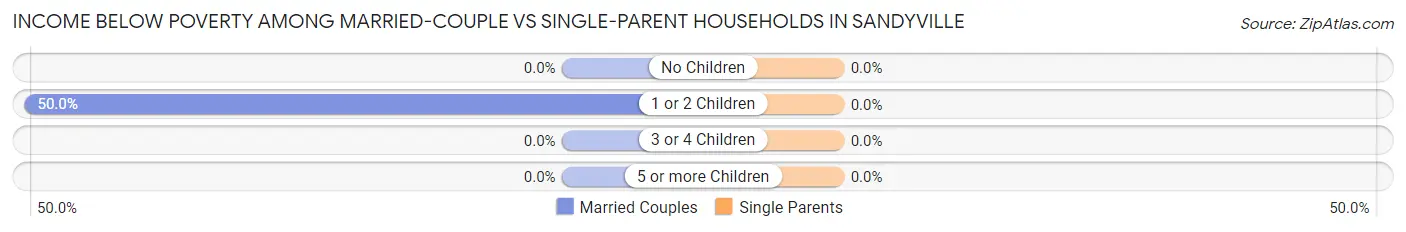
| Children | Married-Couple Families | Single-Parent Households |
| No Children | 0 (0.0%) | 0 (0.0%) |
| 1 or 2 Children | 1 (50.0%) | 0 (0.0%) |
| 3 or 4 Children | 0 (0.0%) | 0 (0.0%) |
| 5 or more Children | 0 (0.0%) | 0 (0.0%) |
| Total | 1 (6.7%) | 0 (0.0%) |
Race in Sandyville
The most populous races in Sandyville are , and White / Caucasian (46 | 100.0%).
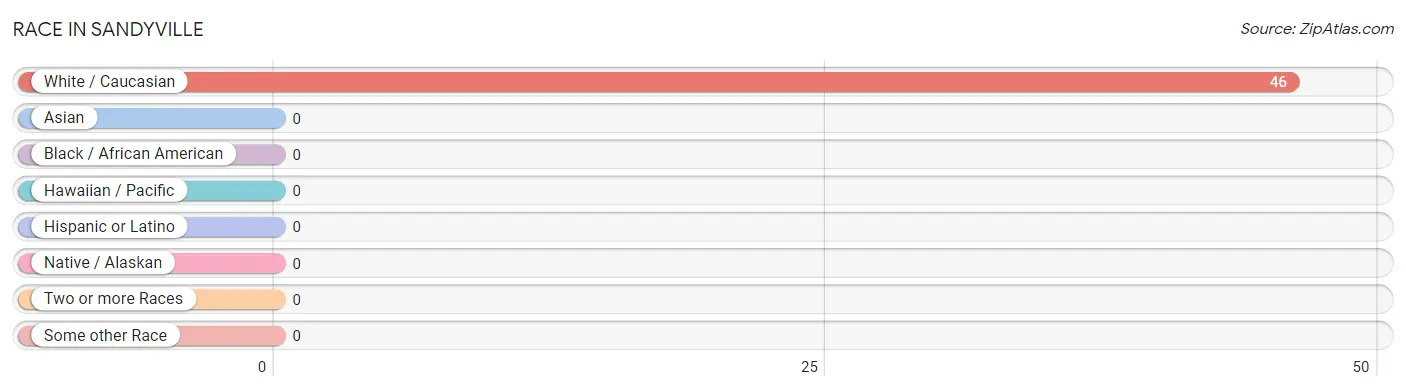
| Race | # Population | % Population |
| Asian | 0 | 0.0% |
| Black / African American | 0 | 0.0% |
| Hawaiian / Pacific | 0 | 0.0% |
| Hispanic or Latino | 0 | 0.0% |
| Native / Alaskan | 0 | 0.0% |
| White / Caucasian | 46 | 100.0% |
| Two or more Races | 0 | 0.0% |
| Some other Race | 0 | 0.0% |
| Total | 46 | 100.0% |
Ancestry in Sandyville
The most populous ancestries reported in Sandyville are American (18 | 39.1%), German (4 | 8.7%), English (3 | 6.5%), French (3 | 6.5%), and Dutch (2 | 4.3%), together accounting for 65.2% of all Sandyville residents.
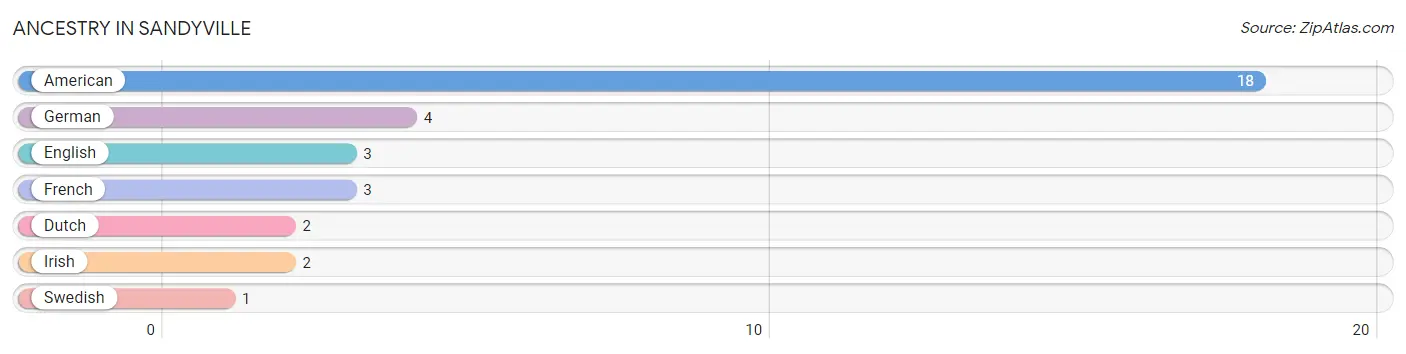
| Ancestry | # Population | % Population |
| American | 18 | 39.1% |
| Dutch | 2 | 4.3% |
| English | 3 | 6.5% |
| French | 3 | 6.5% |
| German | 4 | 8.7% |
| Irish | 2 | 4.3% |
| Swedish | 1 | 2.2% | View All 7 Rows |
Immigrants in Sandyville

| Immigration Origin | # Population | % Population | View All 0 Rows |
Sex and Age in Sandyville
Sex and Age in Sandyville
The most populous age groups in Sandyville are Under 5 Years (8 | 30.8%) for men and 35 to 39 Years (4 | 20.0%) for women.
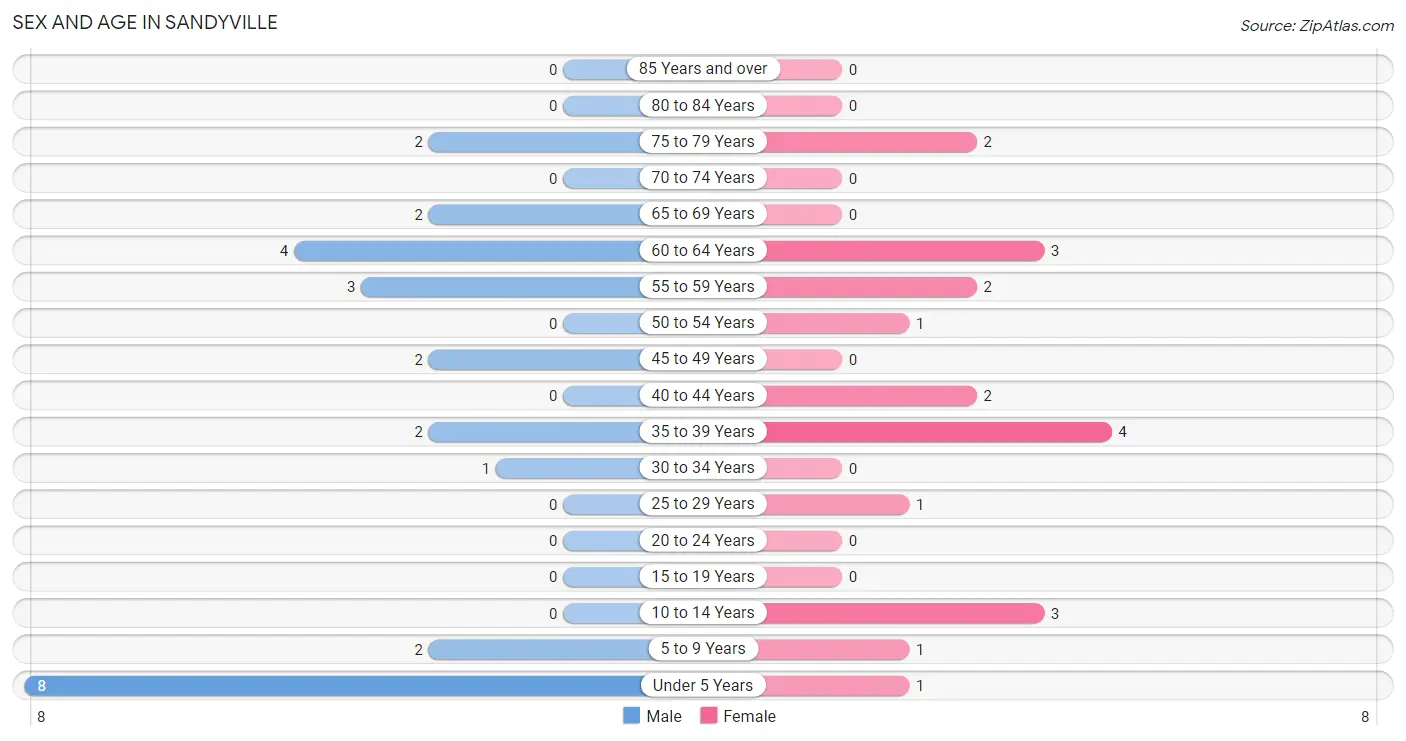
| Age Bracket | Male | Female |
| Under 5 Years | 8 (30.8%) | 1 (5.0%) |
| 5 to 9 Years | 2 (7.7%) | 1 (5.0%) |
| 10 to 14 Years | 0 (0.0%) | 3 (15.0%) |
| 15 to 19 Years | 0 (0.0%) | 0 (0.0%) |
| 20 to 24 Years | 0 (0.0%) | 0 (0.0%) |
| 25 to 29 Years | 0 (0.0%) | 1 (5.0%) |
| 30 to 34 Years | 1 (3.8%) | 0 (0.0%) |
| 35 to 39 Years | 2 (7.7%) | 4 (20.0%) |
| 40 to 44 Years | 0 (0.0%) | 2 (10.0%) |
| 45 to 49 Years | 2 (7.7%) | 0 (0.0%) |
| 50 to 54 Years | 0 (0.0%) | 1 (5.0%) |
| 55 to 59 Years | 3 (11.5%) | 2 (10.0%) |
| 60 to 64 Years | 4 (15.4%) | 3 (15.0%) |
| 65 to 69 Years | 2 (7.7%) | 0 (0.0%) |
| 70 to 74 Years | 0 (0.0%) | 0 (0.0%) |
| 75 to 79 Years | 2 (7.7%) | 2 (10.0%) |
| 80 to 84 Years | 0 (0.0%) | 0 (0.0%) |
| 85 Years and over | 0 (0.0%) | 0 (0.0%) |
| Total | 26 (100.0%) | 20 (100.0%) |
Families and Households in Sandyville
Median Family Size in Sandyville
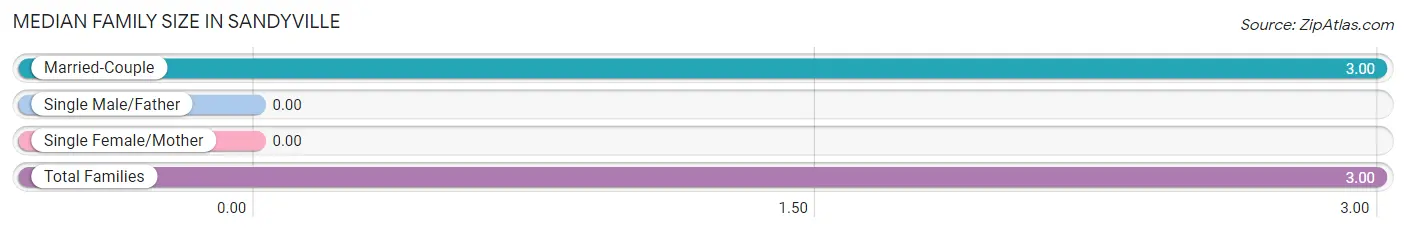
| Family Type | # Families | Family Size |
| Married-Couple | 15 (100.0%) | 3.00 |
| Single Male/Father | 0 (0.0%) | - |
| Single Female/Mother | 0 (0.0%) | - |
| Total Families | 15 (100.0%) | 3.00 |
Median Household Size in Sandyville
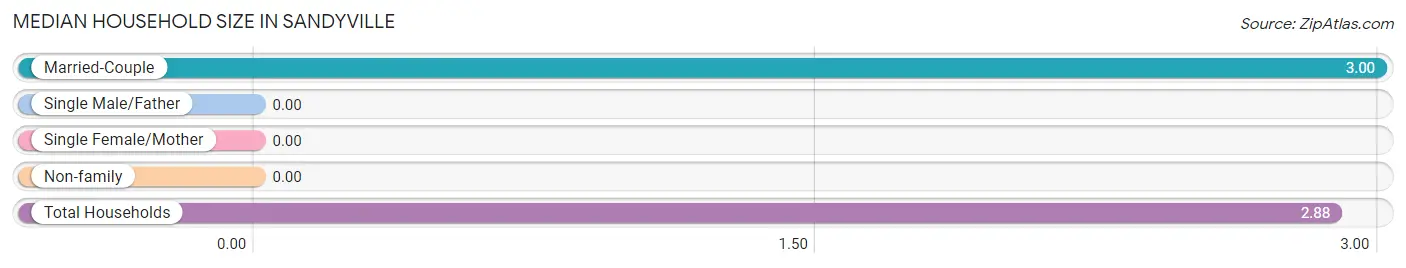
| Household Type | # Households | Household Size |
| Married-Couple | 15 (93.8%) | 3.00 |
| Single Male/Father | 0 (0.0%) | - |
| Single Female/Mother | 0 (0.0%) | - |
| Non-family | 1 (6.2%) | - |
| Total Households | 16 (100.0%) | 2.88 |
Household Size by Marriage Status in Sandyville
Out of a total of 16 households in Sandyville, 15 (93.8%) are family households, while 1 (6.2%) are nonfamily households. The most numerous type of family households are 2-person households, comprising 8, and the most common type of nonfamily households are 1-person households, comprising 1.
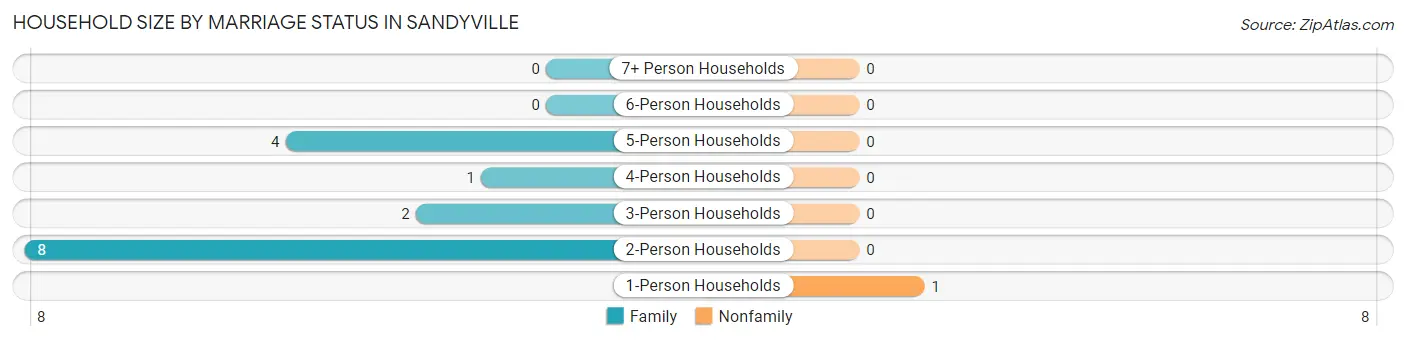
| Household Size | Family Households | Nonfamily Households |
| 1-Person Households | - | 1 (6.2%) |
| 2-Person Households | 8 (50.0%) | 0 (0.0%) |
| 3-Person Households | 2 (12.5%) | 0 (0.0%) |
| 4-Person Households | 1 (6.2%) | 0 (0.0%) |
| 5-Person Households | 4 (25.0%) | 0 (0.0%) |
| 6-Person Households | 0 (0.0%) | 0 (0.0%) |
| 7+ Person Households | 0 (0.0%) | 0 (0.0%) |
| Total | 15 (93.8%) | 1 (6.2%) |
Female Fertility in Sandyville
Fertility by Age in Sandyville
Average fertility rate in Sandyville is 714.0 births per 1,000 women. Women in the age bracket of 20 to 34 years have the highest fertility rate with 1,000.0 births per 1,000 women. Women in the age bracket of 35 to 50 years acount for 80.0% of all women with births.
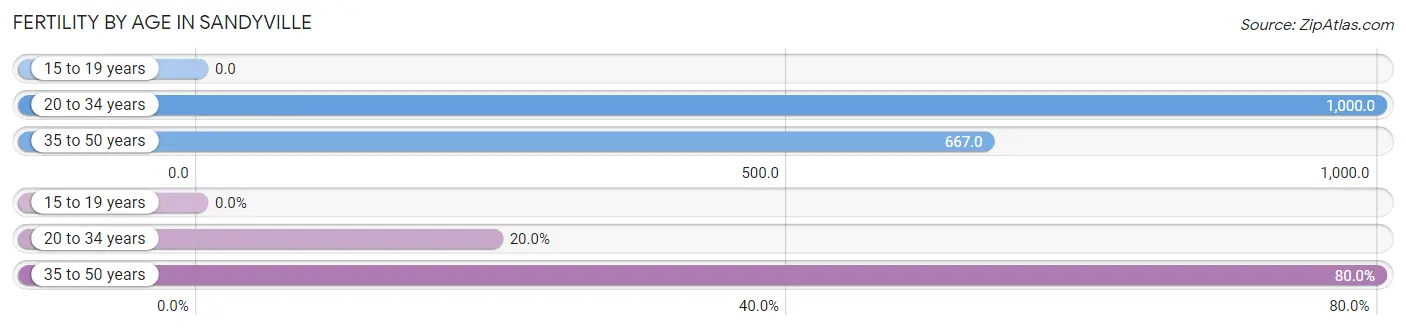
| Age Bracket | Women with Births | Births / 1,000 Women |
| 15 to 19 years | 0 (0.0%) | 0.0 |
| 20 to 34 years | 1 (20.0%) | 1,000.0 |
| 35 to 50 years | 4 (80.0%) | 667.0 |
| Total | 5 (100.0%) | 714.0 |
Fertility by Age by Marriage Status in Sandyville
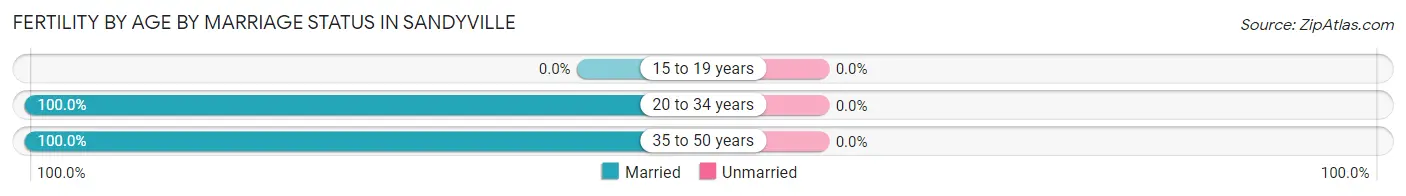
| Age Bracket | Married | Unmarried |
| 15 to 19 years | 0 (0.0%) | 0 (0.0%) |
| 20 to 34 years | 1 (100.0%) | 0 (0.0%) |
| 35 to 50 years | 4 (100.0%) | 0 (0.0%) |
| Total | 5 (100.0%) | 0 (0.0%) |
Fertility by Education in Sandyville
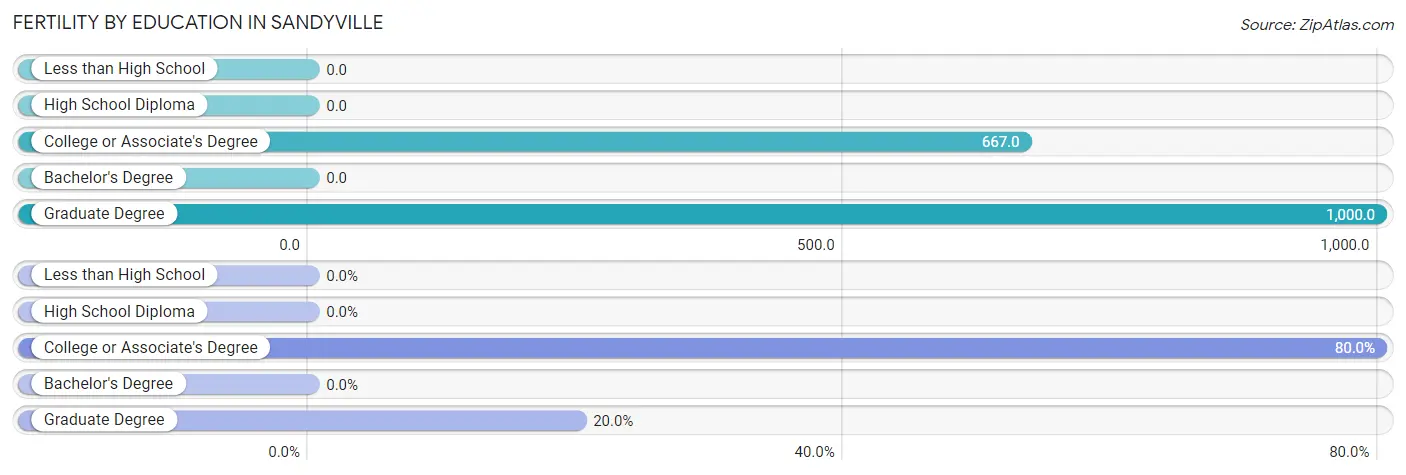
| Educational Attainment | Women with Births | Births / 1,000 Women |
| Less than High School | 0 (0.0%) | 0.0 |
| High School Diploma | 0 (0.0%) | 0.0 |
| College or Associate's Degree | 4 (80.0%) | 667.0 |
| Bachelor's Degree | 0 (0.0%) | 0.0 |
| Graduate Degree | 1 (20.0%) | 1,000.0 |
| Total | 5 (100.0%) | 714.0 |
Fertility by Education by Marriage Status in Sandyville
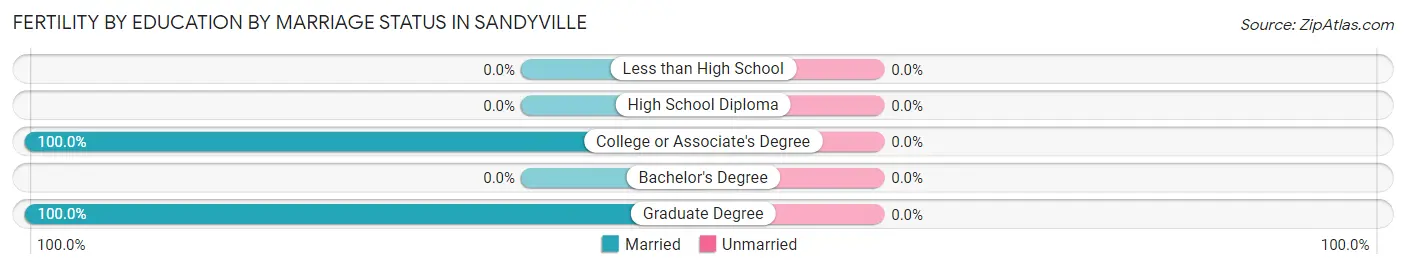
| Educational Attainment | Married | Unmarried |
| Less than High School | 0 (0.0%) | 0 (0.0%) |
| High School Diploma | 0 (0.0%) | 0 (0.0%) |
| College or Associate's Degree | 4 (100.0%) | 0 (0.0%) |
| Bachelor's Degree | 0 (0.0%) | 0 (0.0%) |
| Graduate Degree | 1 (100.0%) | 0 (0.0%) |
| Total | 5 (100.0%) | 0 (0.0%) |
Employment Characteristics in Sandyville
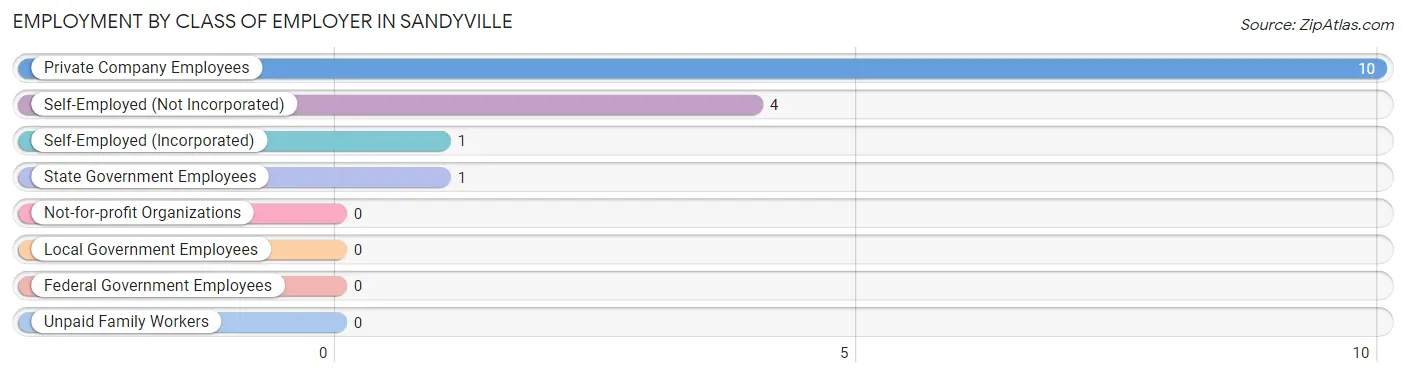
Employment by Class of Employer in Sandyville
Among the 16 employed individuals in Sandyville, private company employees (10 | 62.5%), self-employed (not incorporated) (4 | 25.0%), and self-employed (incorporated) (1 | 6.2%) make up the most common classes of employment.
| Employer Class | # Employees | % Employees |
| Private Company Employees | 10 | 62.5% |
| Self-Employed (Incorporated) | 1 | 6.2% |
| Self-Employed (Not Incorporated) | 4 | 25.0% |
| Not-for-profit Organizations | 0 | 0.0% |
| Local Government Employees | 0 | 0.0% |
| State Government Employees | 1 | 6.2% |
| Federal Government Employees | 0 | 0.0% |
| Unpaid Family Workers | 0 | 0.0% |
| Total | 16 | 100.0% |
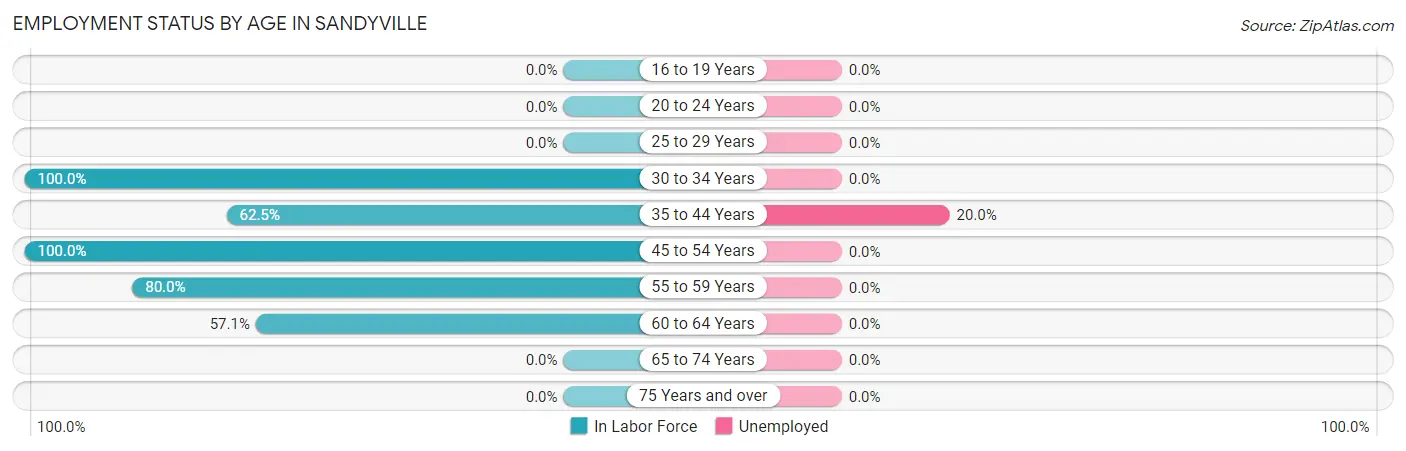
Employment Status by Age in Sandyville
According to the labor force statistics for Sandyville, out of the total population over 16 years of age (31), 54.8% or 17 individuals are in the labor force, with 5.9% or 1 of them unemployed. The age group with the highest labor force participation rate is 30 to 34 years, with 100.0% or 1 individuals in the labor force. Within the labor force, the 35 to 44 years age range has the highest percentage of unemployed individuals, with 20.0% or 1 of them being unemployed.
| Age Bracket | In Labor Force | Unemployed |
| 16 to 19 Years | 0 (0.0%) | 0 (0.0%) |
| 20 to 24 Years | 0 (0.0%) | 0 (0.0%) |
| 25 to 29 Years | 0 (0.0%) | 0 (0.0%) |
| 30 to 34 Years | 1 (100.0%) | 0 (0.0%) |
| 35 to 44 Years | 5 (62.5%) | 1 (20.0%) |
| 45 to 54 Years | 3 (100.0%) | 0 (0.0%) |
| 55 to 59 Years | 4 (80.0%) | 0 (0.0%) |
| 60 to 64 Years | 4 (57.1%) | 0 (0.0%) |
| 65 to 74 Years | 0 (0.0%) | 0 (0.0%) |
| 75 Years and over | 0 (0.0%) | 0 (0.0%) |
| Total | 17 (54.8%) | 1 (5.9%) |
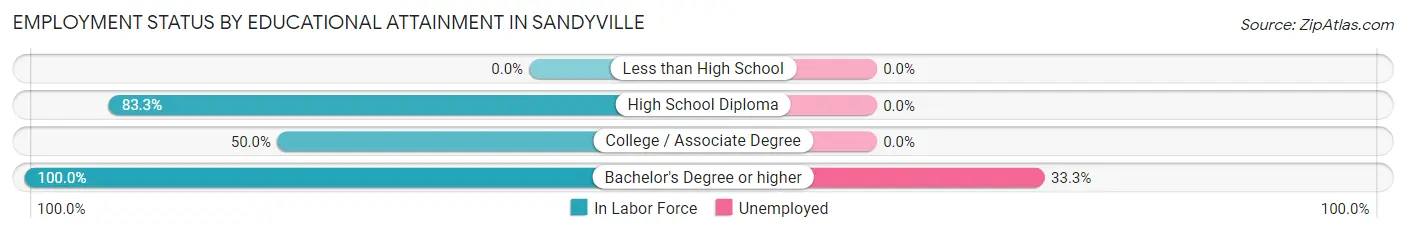
Employment Status by Educational Attainment in Sandyville
According to labor force statistics for Sandyville, 68.0% of individuals (17) out of the total population between 25 and 64 years of age (25) are in the labor force, with 5.9% or 1 of them being unemployed. The group with the highest labor force participation rate are those with the educational attainment of bachelor's degree or higher, with 100.0% or 3 individuals in the labor force. Within the labor force, individuals with bachelor's degree or higher education have the highest percentage of unemployment, with 33.3% or 1 of them being unemployed.
| Educational Attainment | In Labor Force | Unemployed |
| Less than High School | 0 (0.0%) | 0 (0.0%) |
| High School Diploma | 10 (83.3%) | 0 (0.0%) |
| College / Associate Degree | 4 (50.0%) | 0 (0.0%) |
| Bachelor's Degree or higher | 3 (100.0%) | 1 (33.3%) |
| Total | 17 (68.0%) | 1 (5.9%) |
Employment Occupations by Sex in Sandyville
Management, Business, Science and Arts Occupations
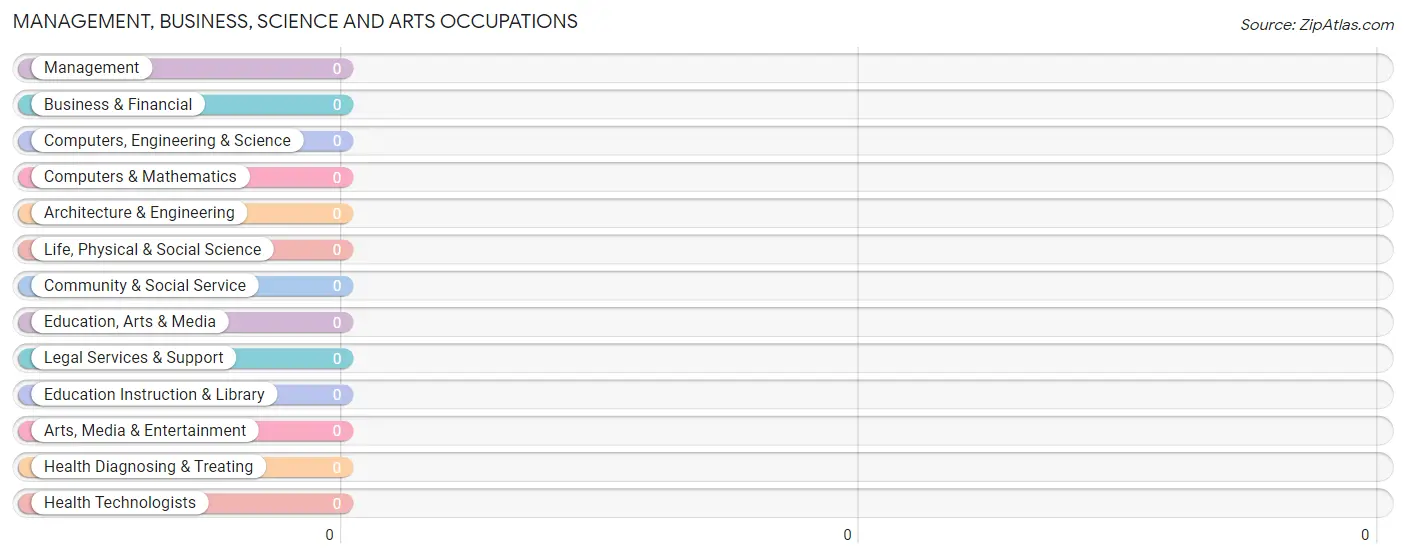
Management, Business, Science and Arts Occupations by Sex
| Occupation | Male | Female |
| Management | 0 (0.0%) | 0 (0.0%) |
| Business & Financial | 0 (0.0%) | 0 (0.0%) |
| Computers, Engineering & Science | 0 (0.0%) | 0 (0.0%) |
| Computers & Mathematics | 0 (0.0%) | 0 (0.0%) |
| Architecture & Engineering | 0 (0.0%) | 0 (0.0%) |
| Life, Physical & Social Science | 0 (0.0%) | 0 (0.0%) |
| Community & Social Service | 0 (0.0%) | 0 (0.0%) |
| Education, Arts & Media | 0 (0.0%) | 0 (0.0%) |
| Legal Services & Support | 0 (0.0%) | 0 (0.0%) |
| Education Instruction & Library | 0 (0.0%) | 0 (0.0%) |
| Arts, Media & Entertainment | 0 (0.0%) | 0 (0.0%) |
| Health Diagnosing & Treating | 0 (0.0%) | 0 (0.0%) |
| Health Technologists | 0 (0.0%) | 0 (0.0%) |
| Total (Category) | 0 (0.0%) | 0 (0.0%) |
| Total (Overall) | 12 (75.0%) | 4 (25.0%) |
Services Occupations
The most common Services occupations in Sandyville are Security & Protection (1 | 6.2%), Law Enforcement (1 | 6.2%), and Personal Care & Service (1 | 6.2%).
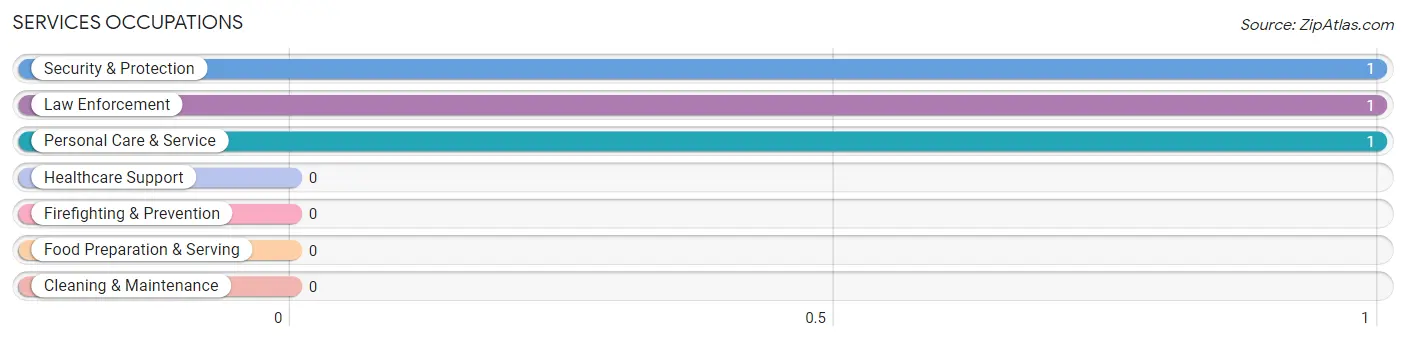
Services Occupations by Sex
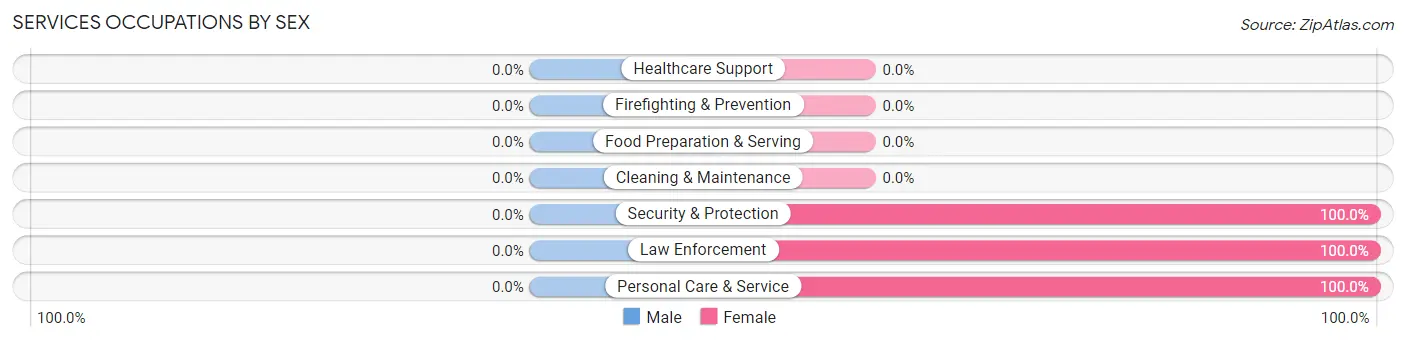
| Occupation | Male | Female |
| Healthcare Support | 0 (0.0%) | 0 (0.0%) |
| Security & Protection | 0 (0.0%) | 1 (100.0%) |
| Firefighting & Prevention | 0 (0.0%) | 0 (0.0%) |
| Law Enforcement | 0 (0.0%) | 1 (100.0%) |
| Food Preparation & Serving | 0 (0.0%) | 0 (0.0%) |
| Cleaning & Maintenance | 0 (0.0%) | 0 (0.0%) |
| Personal Care & Service | 0 (0.0%) | 1 (100.0%) |
| Total (Category) | 0 (0.0%) | 2 (100.0%) |
| Total (Overall) | 12 (75.0%) | 4 (25.0%) |
Sales and Office Occupations
The most common Sales and Office occupations in Sandyville are Sales & Related (2 | 12.5%), and Office & Administration (2 | 12.5%).
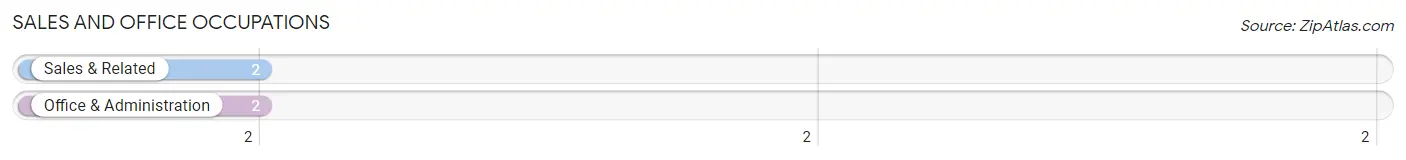
Sales and Office Occupations by Sex
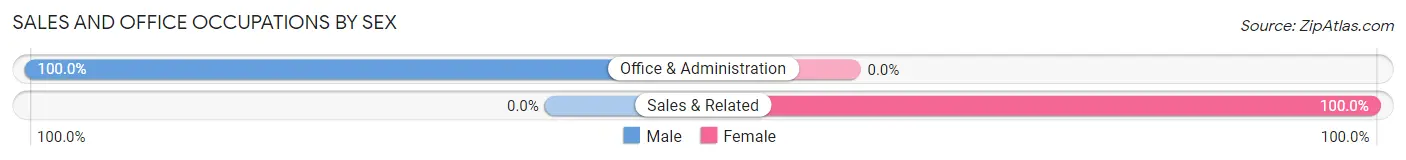
| Occupation | Male | Female |
| Sales & Related | 0 (0.0%) | 2 (100.0%) |
| Office & Administration | 2 (100.0%) | 0 (0.0%) |
| Total (Category) | 2 (50.0%) | 2 (50.0%) |
| Total (Overall) | 12 (75.0%) | 4 (25.0%) |
Natural Resources, Construction and Maintenance Occupations
The most common Natural Resources, Construction and Maintenance occupations in Sandyville are Installation, Maintenance & Repair (2 | 12.5%), and Construction & Extraction (1 | 6.2%).
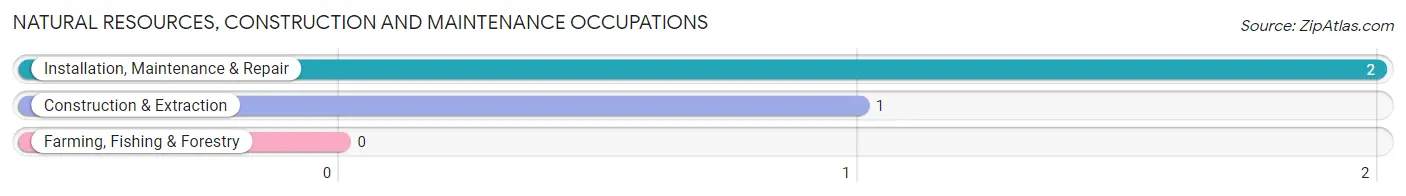
Natural Resources, Construction and Maintenance Occupations by Sex
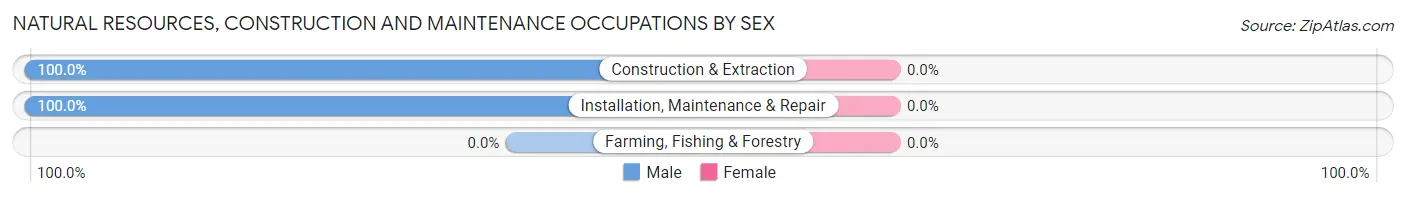
| Occupation | Male | Female |
| Farming, Fishing & Forestry | 0 (0.0%) | 0 (0.0%) |
| Construction & Extraction | 1 (100.0%) | 0 (0.0%) |
| Installation, Maintenance & Repair | 2 (100.0%) | 0 (0.0%) |
| Total (Category) | 3 (100.0%) | 0 (0.0%) |
| Total (Overall) | 12 (75.0%) | 4 (25.0%) |
Production, Transportation and Moving Occupations
The most common Production, Transportation and Moving occupations in Sandyville are Transportation (3 | 18.8%), Material Moving (3 | 18.8%), and Production (1 | 6.2%).
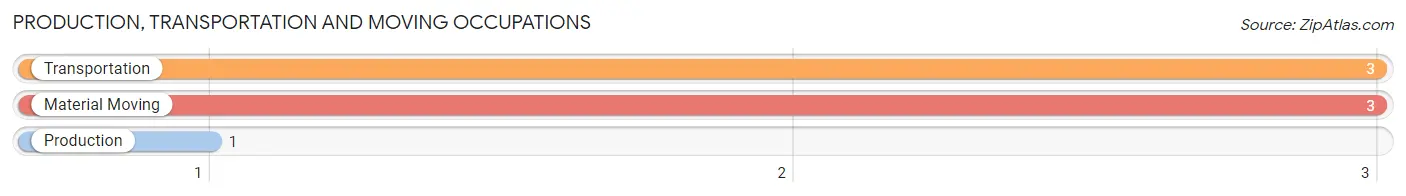
Production, Transportation and Moving Occupations by Sex
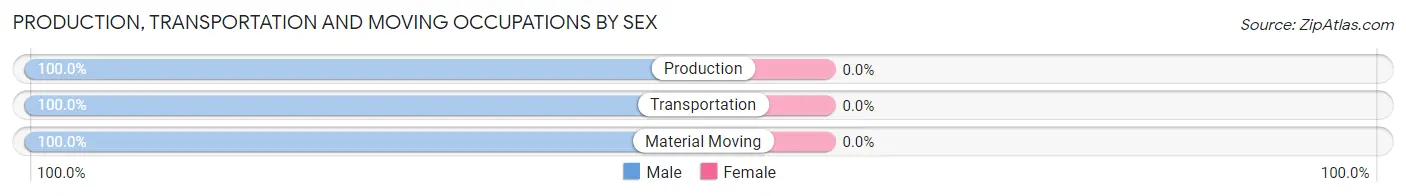
| Occupation | Male | Female |
| Production | 1 (100.0%) | 0 (0.0%) |
| Transportation | 3 (100.0%) | 0 (0.0%) |
| Material Moving | 3 (100.0%) | 0 (0.0%) |
| Total (Category) | 7 (100.0%) | 0 (0.0%) |
| Total (Overall) | 12 (75.0%) | 4 (25.0%) |
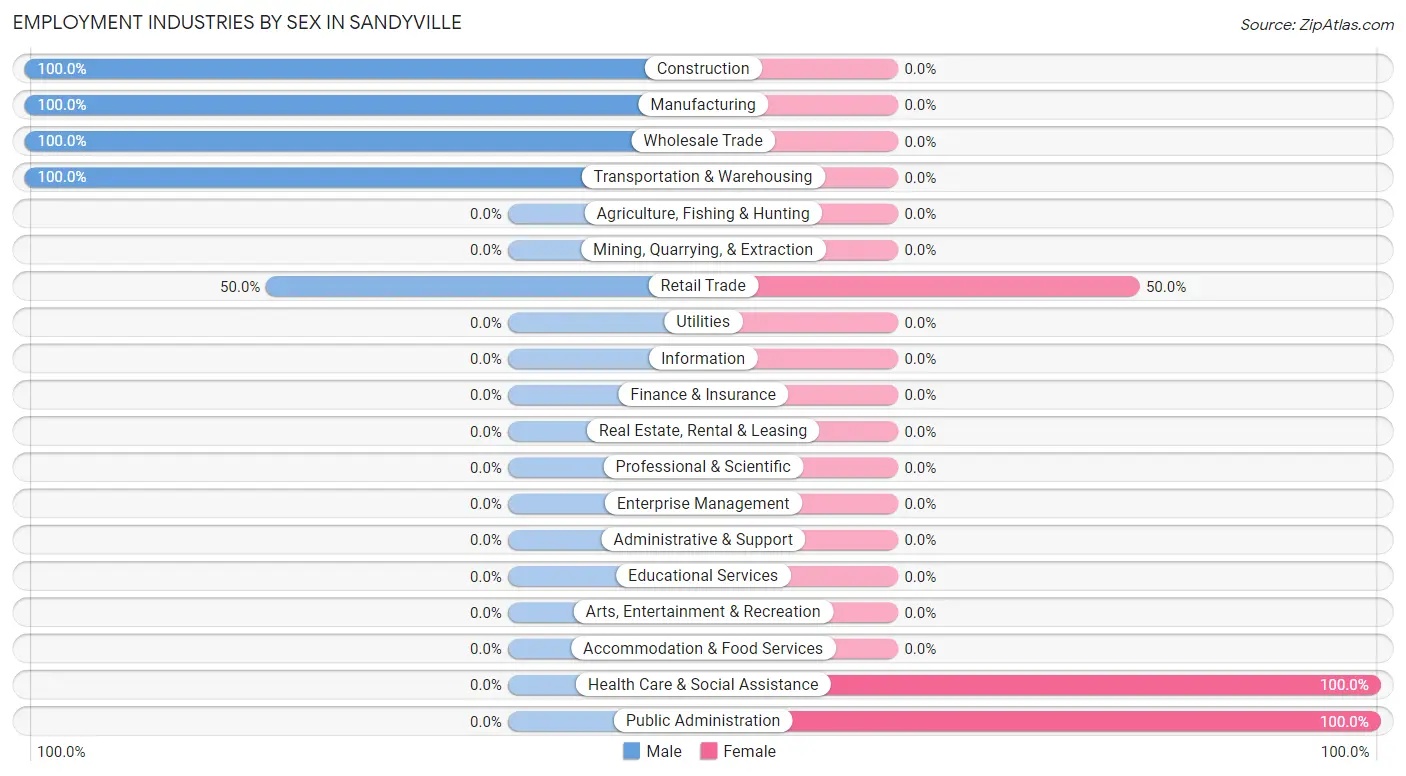
Employment Industries by Sex in Sandyville
Employment Industries in Sandyville
The major employment industries in Sandyville include Wholesale Trade (4 | 25.0%), Retail Trade (4 | 25.0%), Transportation & Warehousing (3 | 18.8%), Manufacturing (2 | 12.5%), and Construction (1 | 6.2%).

Employment Industries by Sex in Sandyville
The Sandyville industries that see more men than women are Construction (100.0%), Manufacturing (100.0%), and Wholesale Trade (100.0%), whereas the industries that tend to have a higher number of women are Health Care & Social Assistance (100.0%), Public Administration (100.0%), and Retail Trade (50.0%).
| Industry | Male | Female |
| Agriculture, Fishing & Hunting | 0 (0.0%) | 0 (0.0%) |
| Mining, Quarrying, & Extraction | 0 (0.0%) | 0 (0.0%) |
| Construction | 1 (100.0%) | 0 (0.0%) |
| Manufacturing | 2 (100.0%) | 0 (0.0%) |
| Wholesale Trade | 4 (100.0%) | 0 (0.0%) |
| Retail Trade | 2 (50.0%) | 2 (50.0%) |
| Transportation & Warehousing | 3 (100.0%) | 0 (0.0%) |
| Utilities | 0 (0.0%) | 0 (0.0%) |
| Information | 0 (0.0%) | 0 (0.0%) |
| Finance & Insurance | 0 (0.0%) | 0 (0.0%) |
| Real Estate, Rental & Leasing | 0 (0.0%) | 0 (0.0%) |
| Professional & Scientific | 0 (0.0%) | 0 (0.0%) |
| Enterprise Management | 0 (0.0%) | 0 (0.0%) |
| Administrative & Support | 0 (0.0%) | 0 (0.0%) |
| Educational Services | 0 (0.0%) | 0 (0.0%) |
| Health Care & Social Assistance | 0 (0.0%) | 1 (100.0%) |
| Arts, Entertainment & Recreation | 0 (0.0%) | 0 (0.0%) |
| Accommodation & Food Services | 0 (0.0%) | 0 (0.0%) |
| Public Administration | 0 (0.0%) | 1 (100.0%) |
| Total | 12 (75.0%) | 4 (25.0%) |
Education in Sandyville
School Enrollment in Sandyville
The most common levels of schooling among the 6 students in Sandyville are elementary school (3 | 50.0%), middle school (2 | 33.3%), and high school (1 | 16.7%).
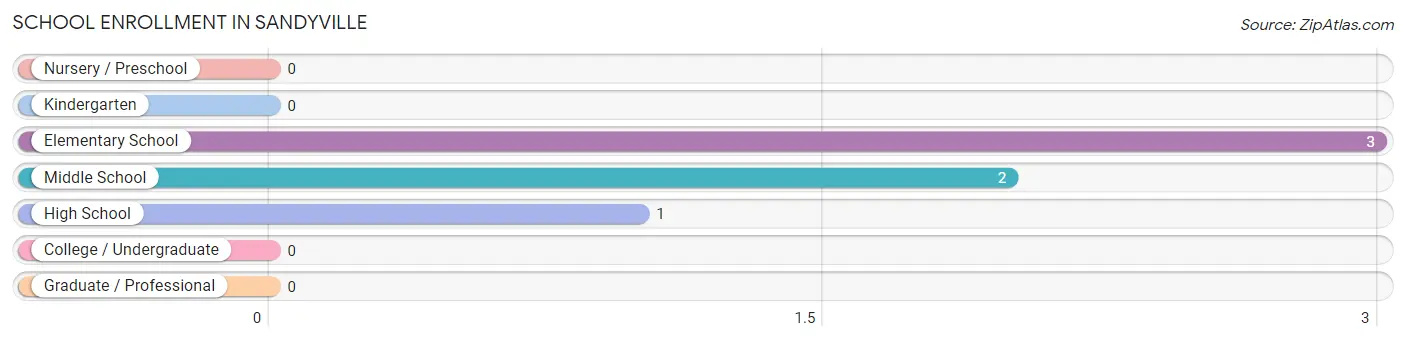
| School Level | # Students | % Students |
| Nursery / Preschool | 0 | 0.0% |
| Kindergarten | 0 | 0.0% |
| Elementary School | 3 | 50.0% |
| Middle School | 2 | 33.3% |
| High School | 1 | 16.7% |
| College / Undergraduate | 0 | 0.0% |
| Graduate / Professional | 0 | 0.0% |
| Total | 6 | 100.0% |
School Enrollment by Age by Funding Source in Sandyville
Out of a total of 6 students who are enrolled in schools in Sandyville, 2 (33.3%) attend a private institution, while the remaining 4 (66.7%) are enrolled in public schools. The age group of 5 to 9 year old has the highest likelihood of being enrolled in private schools, with 2 (66.7% in the age bracket) enrolled. Conversely, the age group of 10 to 14 year olds has the lowest likelihood of being enrolled in a private school, with 3 (100.0% in the age bracket) attending a public institution.
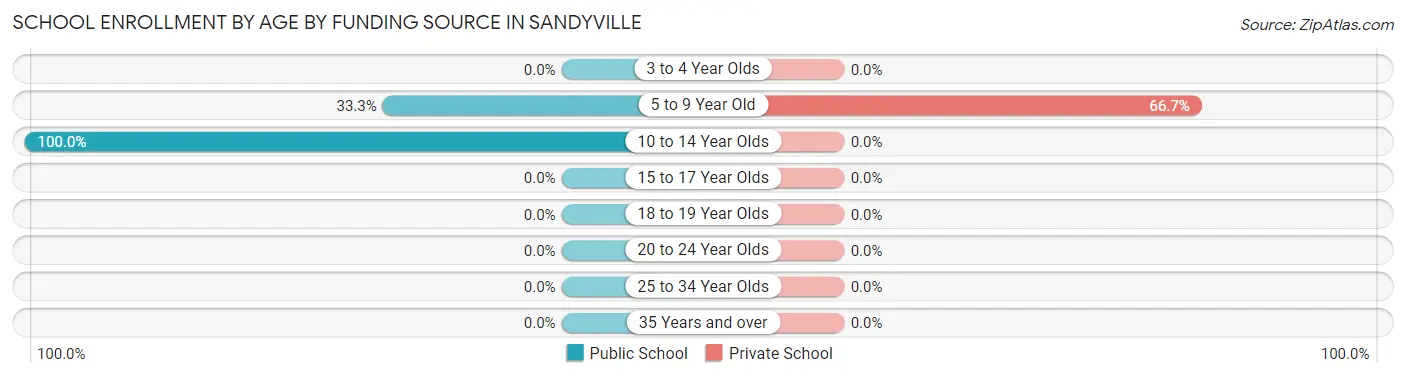
| Age Bracket | Public School | Private School |
| 3 to 4 Year Olds | 0 (0.0%) | 0 (0.0%) |
| 5 to 9 Year Old | 1 (33.3%) | 2 (66.7%) |
| 10 to 14 Year Olds | 3 (100.0%) | 0 (0.0%) |
| 15 to 17 Year Olds | 0 (0.0%) | 0 (0.0%) |
| 18 to 19 Year Olds | 0 (0.0%) | 0 (0.0%) |
| 20 to 24 Year Olds | 0 (0.0%) | 0 (0.0%) |
| 25 to 34 Year Olds | 0 (0.0%) | 0 (0.0%) |
| 35 Years and over | 0 (0.0%) | 0 (0.0%) |
| Total | 4 (66.7%) | 2 (33.3%) |
Educational Attainment by Field of Study in Sandyville
Liberal arts & history (2 | 66.7%), and arts & humanities (1 | 33.3%) are the most common fields of study among 3 individuals in Sandyville who have obtained a bachelor's degree or higher.
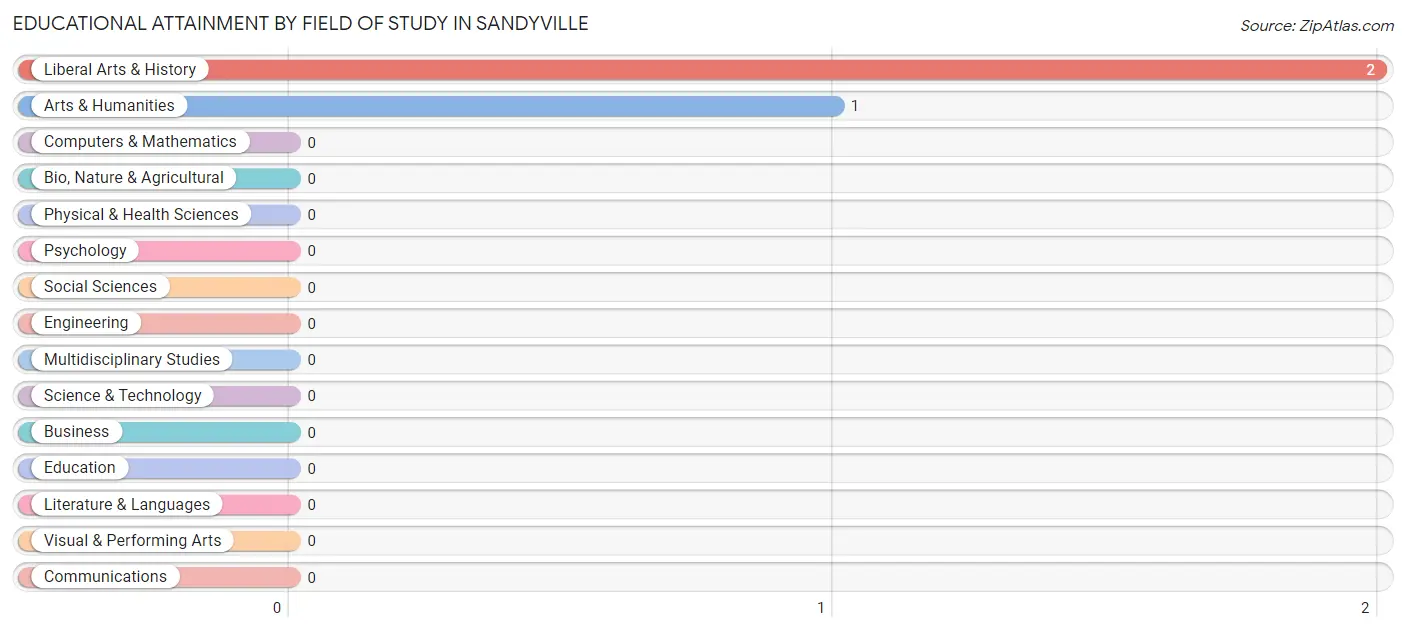
| Field of Study | # Graduates | % Graduates |
| Computers & Mathematics | 0 | 0.0% |
| Bio, Nature & Agricultural | 0 | 0.0% |
| Physical & Health Sciences | 0 | 0.0% |
| Psychology | 0 | 0.0% |
| Social Sciences | 0 | 0.0% |
| Engineering | 0 | 0.0% |
| Multidisciplinary Studies | 0 | 0.0% |
| Science & Technology | 0 | 0.0% |
| Business | 0 | 0.0% |
| Education | 0 | 0.0% |
| Literature & Languages | 0 | 0.0% |
| Liberal Arts & History | 2 | 66.7% |
| Visual & Performing Arts | 0 | 0.0% |
| Communications | 0 | 0.0% |
| Arts & Humanities | 1 | 33.3% |
| Total | 3 | 100.0% |
Transportation & Commute in Sandyville
Vehicle Availability by Sex in Sandyville
The most prevalent vehicle ownership categories in Sandyville are males with 3 vehicles (7, accounting for 58.3%) and females with 3 vehicles (2, making up 175.0%).
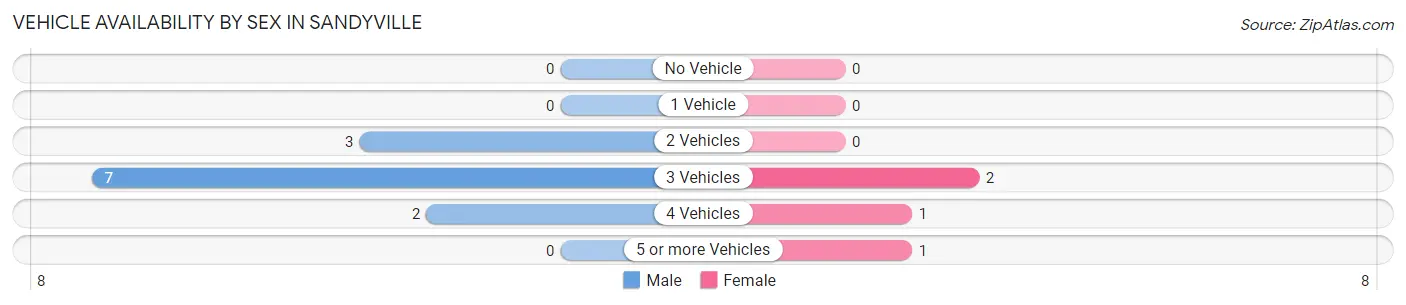
| Vehicles Available | Male | Female |
| No Vehicle | 0 (0.0%) | 0 (0.0%) |
| 1 Vehicle | 0 (0.0%) | 0 (0.0%) |
| 2 Vehicles | 3 (25.0%) | 0 (0.0%) |
| 3 Vehicles | 7 (58.3%) | 2 (50.0%) |
| 4 Vehicles | 2 (16.7%) | 1 (25.0%) |
| 5 or more Vehicles | 0 (0.0%) | 1 (25.0%) |
| Total | 12 (100.0%) | 4 (100.0%) |
Commute Time in Sandyville
The most frequently occuring commute durations in Sandyville are 5 to 9 minutes (4 commuters, 25.0%), 45 to 59 minutes (3 commuters, 18.8%), and 10 to 14 minutes (2 commuters, 12.5%).
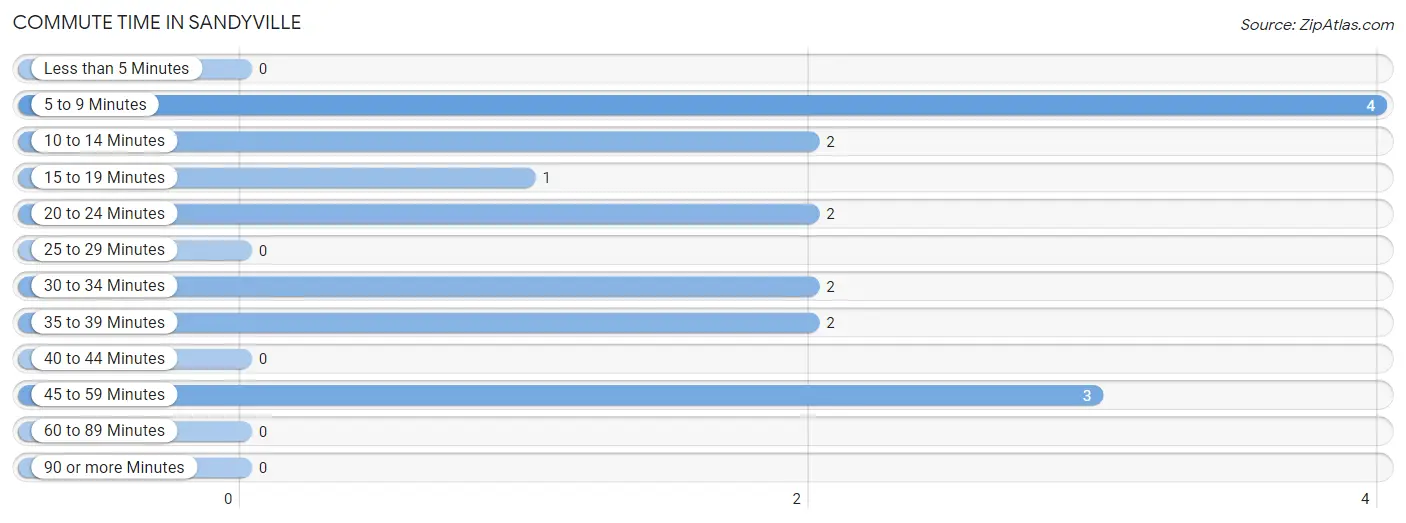
| Commute Time | # Commuters | % Commuters |
| Less than 5 Minutes | 0 | 0.0% |
| 5 to 9 Minutes | 4 | 25.0% |
| 10 to 14 Minutes | 2 | 12.5% |
| 15 to 19 Minutes | 1 | 6.2% |
| 20 to 24 Minutes | 2 | 12.5% |
| 25 to 29 Minutes | 0 | 0.0% |
| 30 to 34 Minutes | 2 | 12.5% |
| 35 to 39 Minutes | 2 | 12.5% |
| 40 to 44 Minutes | 0 | 0.0% |
| 45 to 59 Minutes | 3 | 18.8% |
| 60 to 89 Minutes | 0 | 0.0% |
| 90 or more Minutes | 0 | 0.0% |
Commute Time by Sex in Sandyville
The most common commute times in Sandyville are 5 to 9 minutes (4 commuters, 33.3%) for males and 20 to 24 minutes (2 commuters, 50.0%) for females.
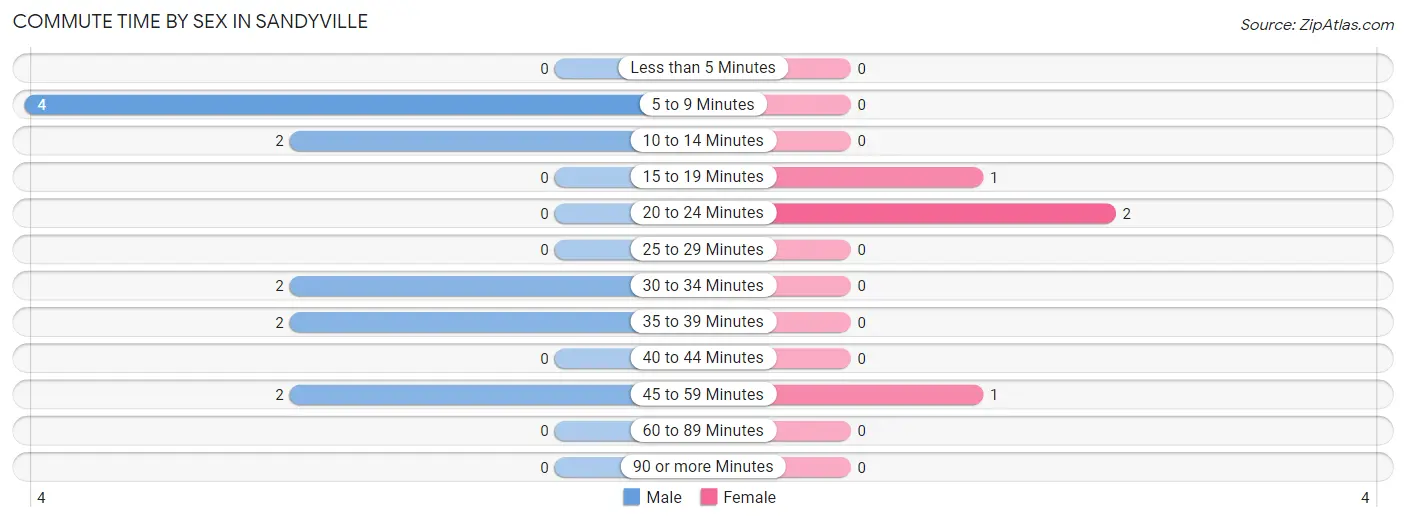
| Commute Time | Male | Female |
| Less than 5 Minutes | 0 (0.0%) | 0 (0.0%) |
| 5 to 9 Minutes | 4 (33.3%) | 0 (0.0%) |
| 10 to 14 Minutes | 2 (16.7%) | 0 (0.0%) |
| 15 to 19 Minutes | 0 (0.0%) | 1 (25.0%) |
| 20 to 24 Minutes | 0 (0.0%) | 2 (50.0%) |
| 25 to 29 Minutes | 0 (0.0%) | 0 (0.0%) |
| 30 to 34 Minutes | 2 (16.7%) | 0 (0.0%) |
| 35 to 39 Minutes | 2 (16.7%) | 0 (0.0%) |
| 40 to 44 Minutes | 0 (0.0%) | 0 (0.0%) |
| 45 to 59 Minutes | 2 (16.7%) | 1 (25.0%) |
| 60 to 89 Minutes | 0 (0.0%) | 0 (0.0%) |
| 90 or more Minutes | 0 (0.0%) | 0 (0.0%) |
Time of Departure to Work by Sex in Sandyville
The most frequent times of departure to work in Sandyville are 8:00 AM to 8:29 AM (4, 33.3%) for males and 7:00 AM to 7:29 AM (2, 50.0%) for females.
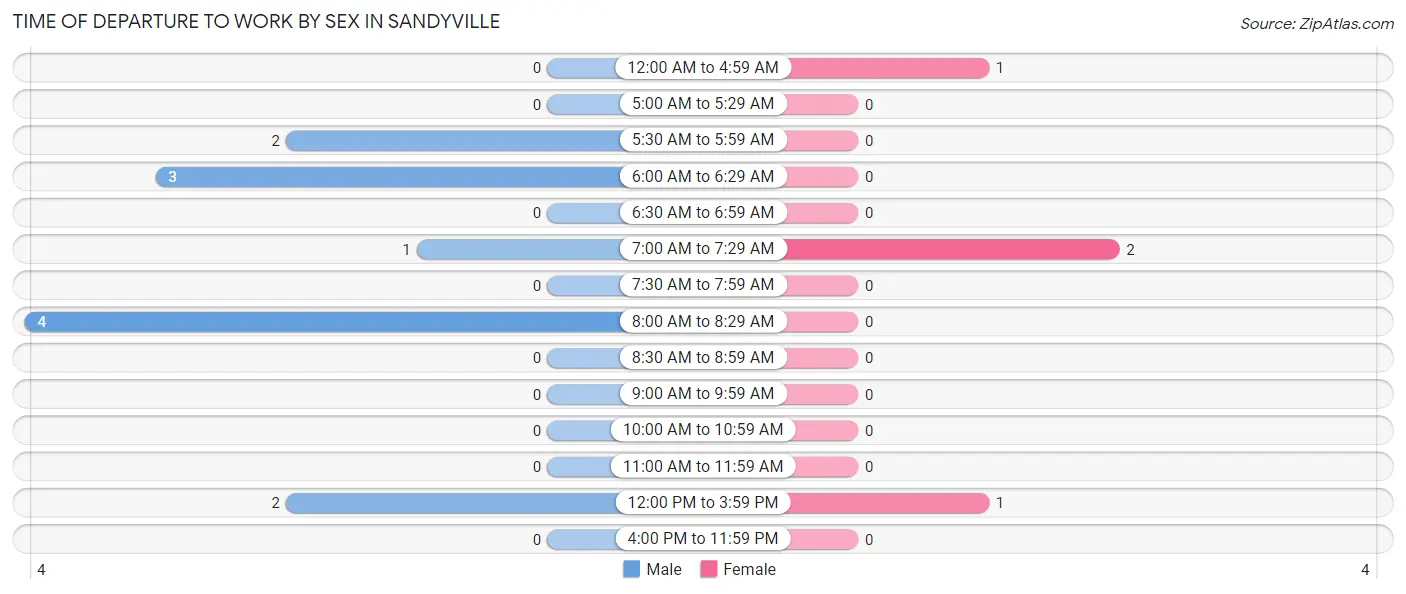
| Time of Departure | Male | Female |
| 12:00 AM to 4:59 AM | 0 (0.0%) | 1 (25.0%) |
| 5:00 AM to 5:29 AM | 0 (0.0%) | 0 (0.0%) |
| 5:30 AM to 5:59 AM | 2 (16.7%) | 0 (0.0%) |
| 6:00 AM to 6:29 AM | 3 (25.0%) | 0 (0.0%) |
| 6:30 AM to 6:59 AM | 0 (0.0%) | 0 (0.0%) |
| 7:00 AM to 7:29 AM | 1 (8.3%) | 2 (50.0%) |
| 7:30 AM to 7:59 AM | 0 (0.0%) | 0 (0.0%) |
| 8:00 AM to 8:29 AM | 4 (33.3%) | 0 (0.0%) |
| 8:30 AM to 8:59 AM | 0 (0.0%) | 0 (0.0%) |
| 9:00 AM to 9:59 AM | 0 (0.0%) | 0 (0.0%) |
| 10:00 AM to 10:59 AM | 0 (0.0%) | 0 (0.0%) |
| 11:00 AM to 11:59 AM | 0 (0.0%) | 0 (0.0%) |
| 12:00 PM to 3:59 PM | 2 (16.7%) | 1 (25.0%) |
| 4:00 PM to 11:59 PM | 0 (0.0%) | 0 (0.0%) |
| Total | 12 (100.0%) | 4 (100.0%) |
Housing Occupancy in Sandyville
Occupancy by Ownership in Sandyville
Of the total 16 dwellings in Sandyville, owner-occupied units account for 16 (100.0%), while renter-occupied units make up 0 (0.0%).
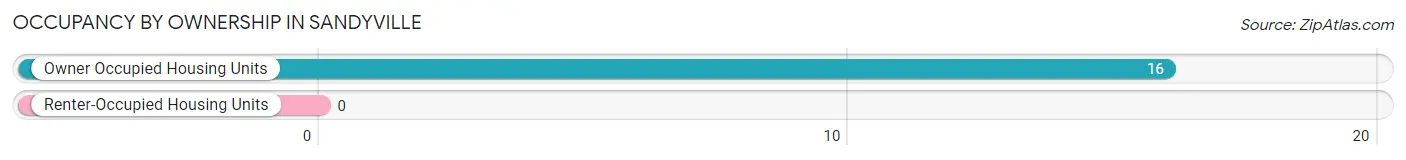
| Occupancy | # Housing Units | % Housing Units |
| Owner Occupied Housing Units | 16 | 100.0% |
| Renter-Occupied Housing Units | 0 | 0.0% |
| Total Occupied Housing Units | 16 | 100.0% |
Occupancy by Household Size in Sandyville
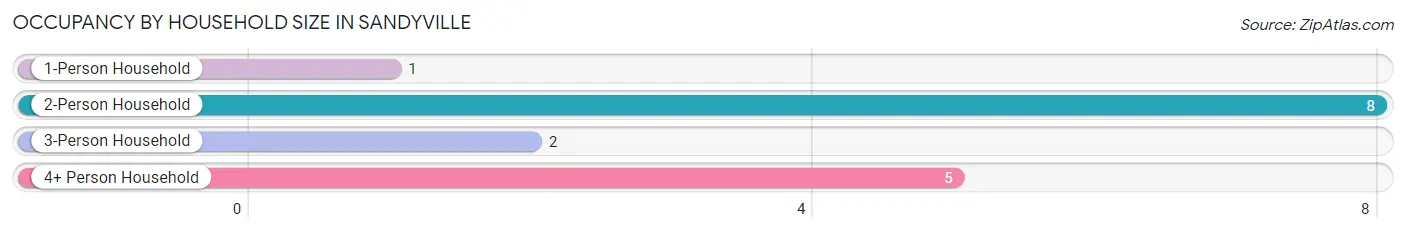
| Household Size | # Housing Units | % Housing Units |
| 1-Person Household | 1 | 6.2% |
| 2-Person Household | 8 | 50.0% |
| 3-Person Household | 2 | 12.5% |
| 4+ Person Household | 5 | 31.2% |
| Total Housing Units | 16 | 100.0% |
Occupancy by Ownership by Household Size in Sandyville
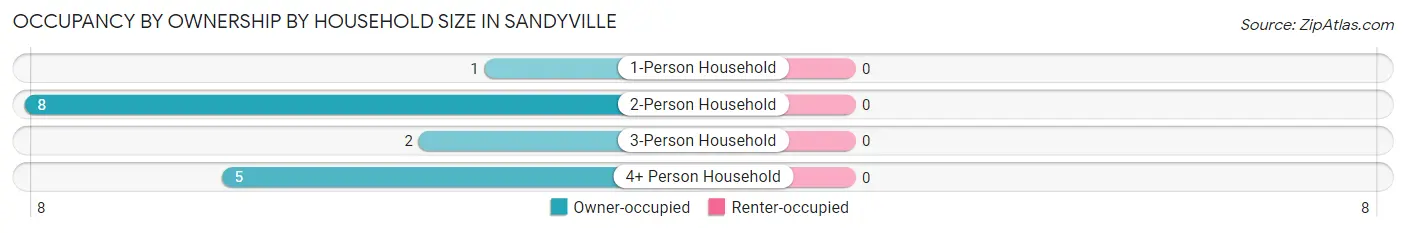
| Household Size | Owner-occupied | Renter-occupied |
| 1-Person Household | 1 (100.0%) | 0 (0.0%) |
| 2-Person Household | 8 (100.0%) | 0 (0.0%) |
| 3-Person Household | 2 (100.0%) | 0 (0.0%) |
| 4+ Person Household | 5 (100.0%) | 0 (0.0%) |
| Total Housing Units | 16 (100.0%) | 0 (0.0%) |
Occupancy by Educational Attainment in Sandyville
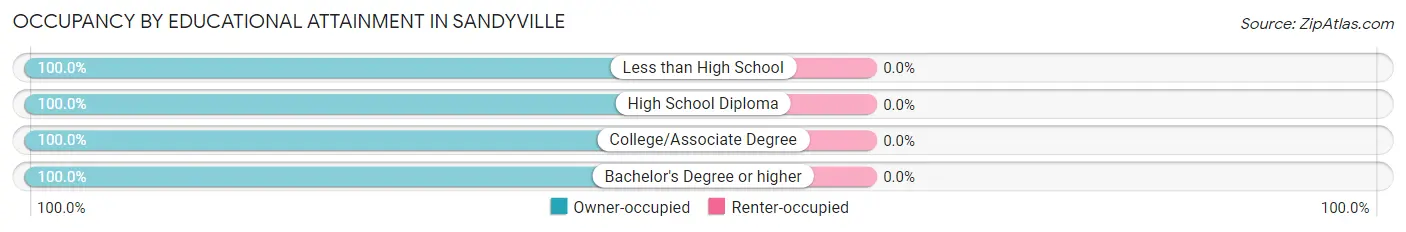
| Household Size | Owner-occupied | Renter-occupied |
| Less than High School | 1 (100.0%) | 0 (0.0%) |
| High School Diploma | 9 (100.0%) | 0 (0.0%) |
| College/Associate Degree | 5 (100.0%) | 0 (0.0%) |
| Bachelor's Degree or higher | 1 (100.0%) | 0 (0.0%) |
Occupancy by Age of Householder in Sandyville
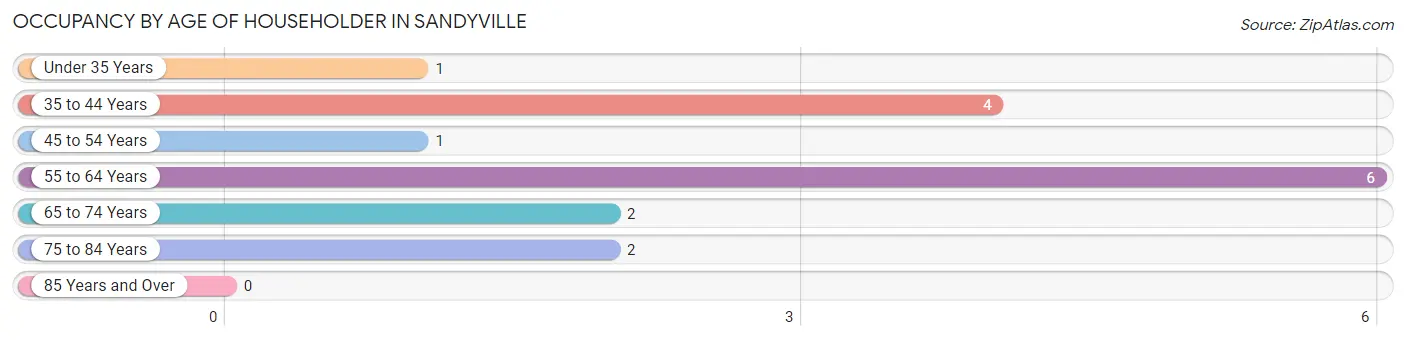
| Age Bracket | # Households | % Households |
| Under 35 Years | 1 | 6.2% |
| 35 to 44 Years | 4 | 25.0% |
| 45 to 54 Years | 1 | 6.2% |
| 55 to 64 Years | 6 | 37.5% |
| 65 to 74 Years | 2 | 12.5% |
| 75 to 84 Years | 2 | 12.5% |
| 85 Years and Over | 0 | 0.0% |
| Total | 16 | 100.0% |
Housing Finances in Sandyville
Median Income by Occupancy in Sandyville
| Occupancy Type | # Households | Median Income |
| Owner-Occupied | 16 (100.0%) | $0 |
| Renter-Occupied | 0 (0.0%) | $0 |
| Average | 16 (100.0%) | $0 |
Occupancy by Householder Income Bracket in Sandyville
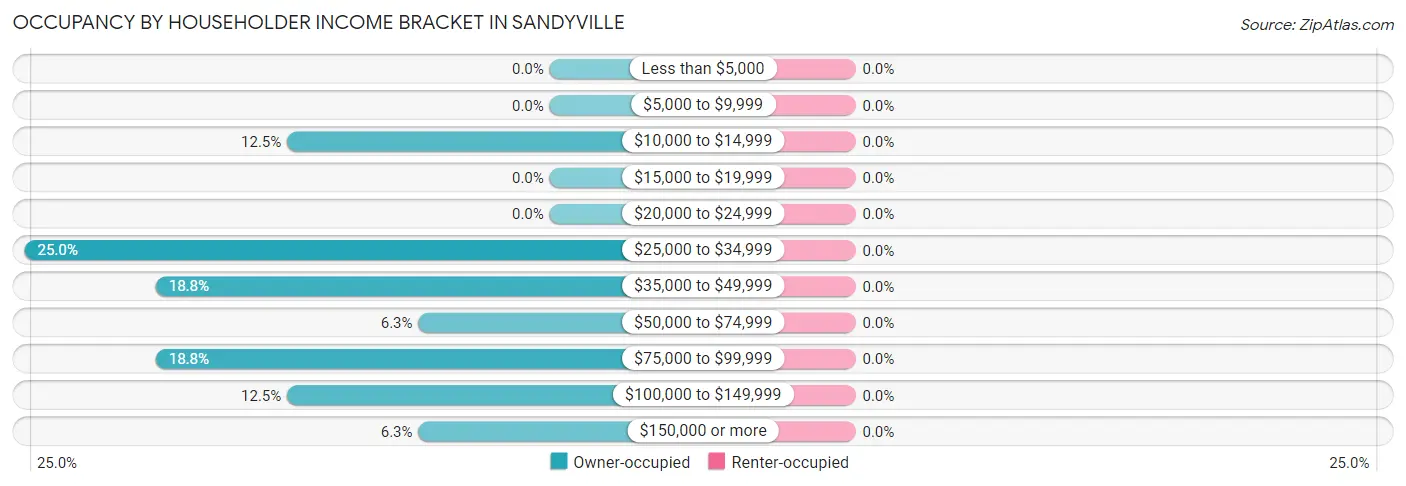
| Income Bracket | Owner-occupied | Renter-occupied |
| Less than $5,000 | 0 (0.0%) | 0 (0.0%) |
| $5,000 to $9,999 | 0 (0.0%) | 0 (0.0%) |
| $10,000 to $14,999 | 2 (12.5%) | 0 (0.0%) |
| $15,000 to $19,999 | 0 (0.0%) | 0 (0.0%) |
| $20,000 to $24,999 | 0 (0.0%) | 0 (0.0%) |
| $25,000 to $34,999 | 4 (25.0%) | 0 (0.0%) |
| $35,000 to $49,999 | 3 (18.8%) | 0 (0.0%) |
| $50,000 to $74,999 | 1 (6.2%) | 0 (0.0%) |
| $75,000 to $99,999 | 3 (18.8%) | 0 (0.0%) |
| $100,000 to $149,999 | 2 (12.5%) | 0 (0.0%) |
| $150,000 or more | 1 (6.2%) | 0 (0.0%) |
| Total | 16 (100.0%) | 0 (0.0%) |
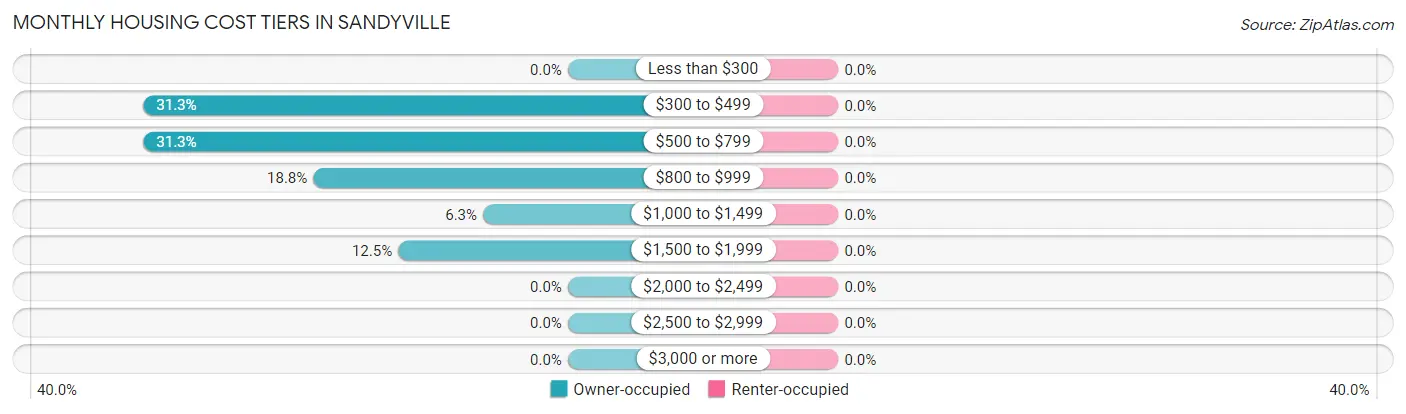
Monthly Housing Cost Tiers in Sandyville
| Monthly Cost | Owner-occupied | Renter-occupied |
| Less than $300 | 0 (0.0%) | 0 (0.0%) |
| $300 to $499 | 5 (31.2%) | 0 (0.0%) |
| $500 to $799 | 5 (31.2%) | 0 (0.0%) |
| $800 to $999 | 3 (18.8%) | 0 (0.0%) |
| $1,000 to $1,499 | 1 (6.2%) | 0 (0.0%) |
| $1,500 to $1,999 | 2 (12.5%) | 0 (0.0%) |
| $2,000 to $2,499 | 0 (0.0%) | 0 (0.0%) |
| $2,500 to $2,999 | 0 (0.0%) | 0 (0.0%) |
| $3,000 or more | 0 (0.0%) | 0 (0.0%) |
| Total | 16 (100.0%) | 0 (0.0%) |
Physical Housing Characteristics in Sandyville
Housing Structures in Sandyville
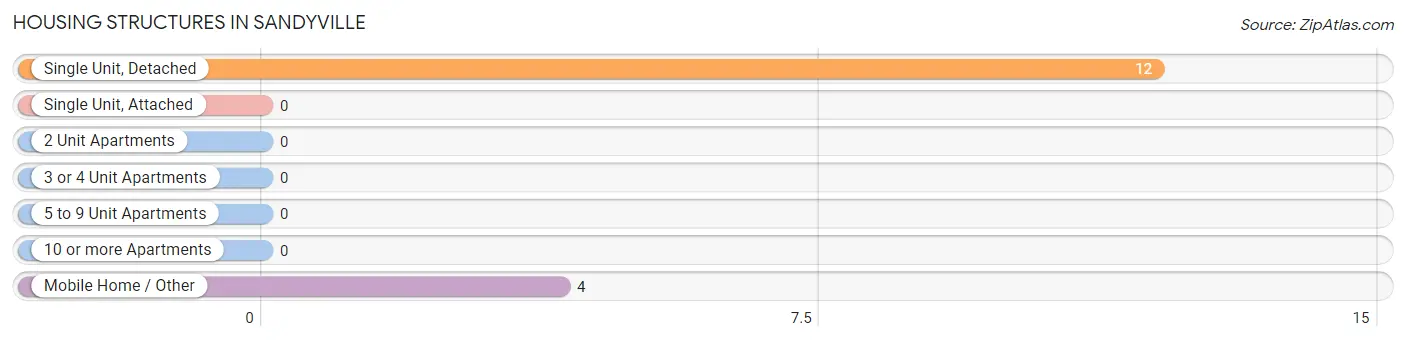
| Structure Type | # Housing Units | % Housing Units |
| Single Unit, Detached | 12 | 75.0% |
| Single Unit, Attached | 0 | 0.0% |
| 2 Unit Apartments | 0 | 0.0% |
| 3 or 4 Unit Apartments | 0 | 0.0% |
| 5 to 9 Unit Apartments | 0 | 0.0% |
| 10 or more Apartments | 0 | 0.0% |
| Mobile Home / Other | 4 | 25.0% |
| Total | 16 | 100.0% |
Housing Structures by Occupancy in Sandyville
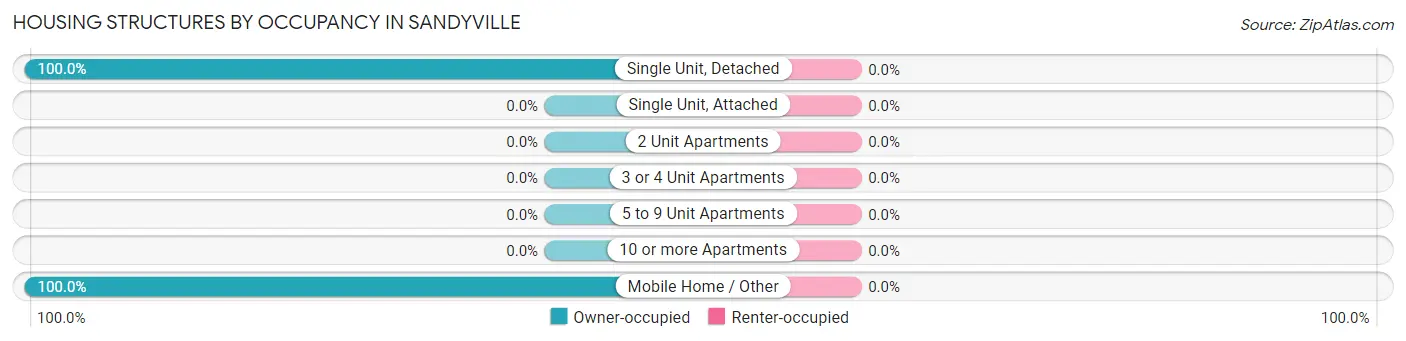
| Structure Type | Owner-occupied | Renter-occupied |
| Single Unit, Detached | 12 (100.0%) | 0 (0.0%) |
| Single Unit, Attached | 0 (0.0%) | 0 (0.0%) |
| 2 Unit Apartments | 0 (0.0%) | 0 (0.0%) |
| 3 or 4 Unit Apartments | 0 (0.0%) | 0 (0.0%) |
| 5 to 9 Unit Apartments | 0 (0.0%) | 0 (0.0%) |
| 10 or more Apartments | 0 (0.0%) | 0 (0.0%) |
| Mobile Home / Other | 4 (100.0%) | 0 (0.0%) |
| Total | 16 (100.0%) | 0 (0.0%) |
Housing Structures by Number of Rooms in Sandyville
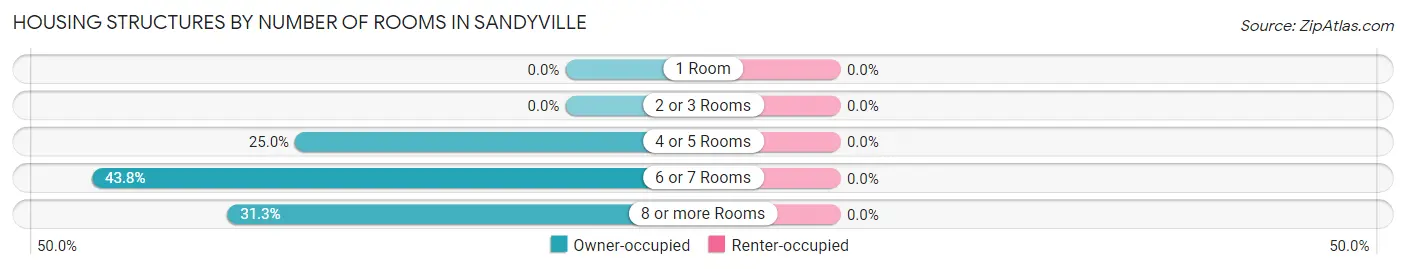
| Number of Rooms | Owner-occupied | Renter-occupied |
| 1 Room | 0 (0.0%) | 0 (0.0%) |
| 2 or 3 Rooms | 0 (0.0%) | 0 (0.0%) |
| 4 or 5 Rooms | 4 (25.0%) | 0 (0.0%) |
| 6 or 7 Rooms | 7 (43.8%) | 0 (0.0%) |
| 8 or more Rooms | 5 (31.2%) | 0 (0.0%) |
| Total | 16 (100.0%) | 0 (0.0%) |
Housing Structure by Heating Type in Sandyville
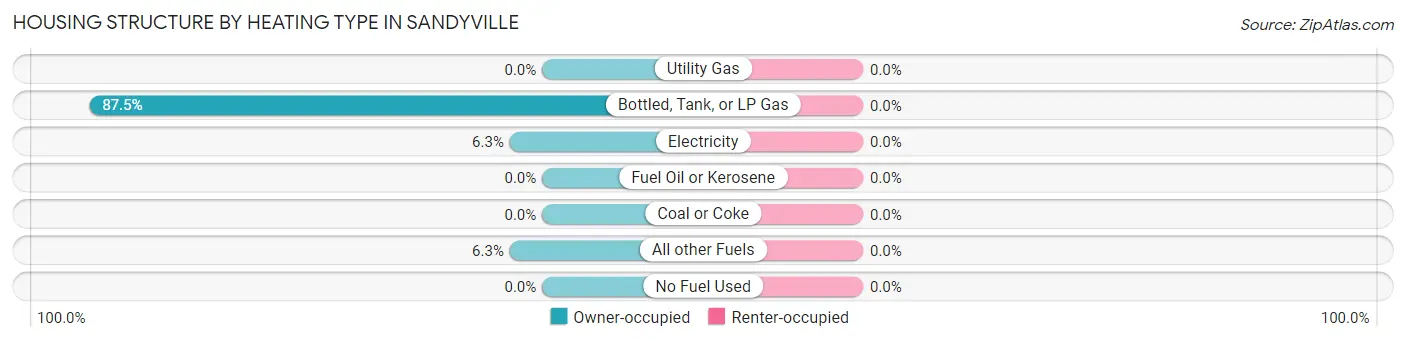
| Heating Type | Owner-occupied | Renter-occupied |
| Utility Gas | 0 (0.0%) | 0 (0.0%) |
| Bottled, Tank, or LP Gas | 14 (87.5%) | 0 (0.0%) |
| Electricity | 1 (6.2%) | 0 (0.0%) |
| Fuel Oil or Kerosene | 0 (0.0%) | 0 (0.0%) |
| Coal or Coke | 0 (0.0%) | 0 (0.0%) |
| All other Fuels | 1 (6.2%) | 0 (0.0%) |
| No Fuel Used | 0 (0.0%) | 0 (0.0%) |
| Total | 16 (100.0%) | 0 (0.0%) |
Household Vehicle Usage in Sandyville
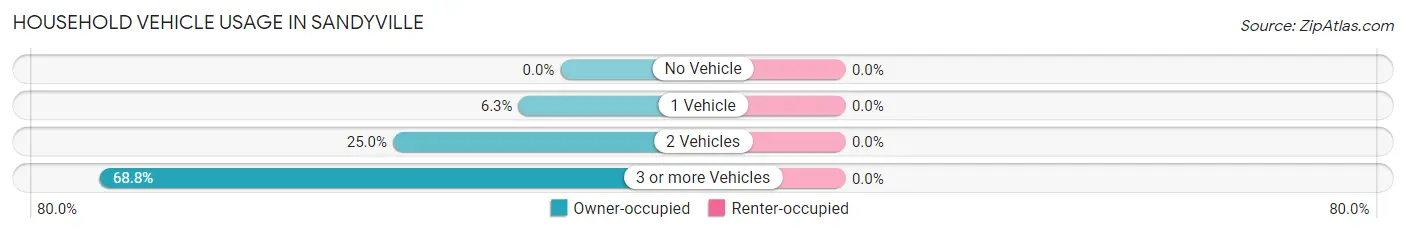
| Vehicles per Household | Owner-occupied | Renter-occupied |
| No Vehicle | 0 (0.0%) | 0 (0.0%) |
| 1 Vehicle | 1 (6.2%) | 0 (0.0%) |
| 2 Vehicles | 4 (25.0%) | 0 (0.0%) |
| 3 or more Vehicles | 11 (68.8%) | 0 (0.0%) |
| Total | 16 (100.0%) | 0 (0.0%) |
Real Estate & Mortgages in Sandyville
Real Estate and Mortgage Overview in Sandyville
| Characteristic | Without Mortgage | With Mortgage |
| Housing Units | 10 | 6 |
| Median Property Value | $168,800 | $0 |
| Median Household Income | - | - |
| Monthly Housing Costs | $500 | $0 |
| Real Estate Taxes | $1,500 | $0 |
Property Value by Mortgage Status in Sandyville
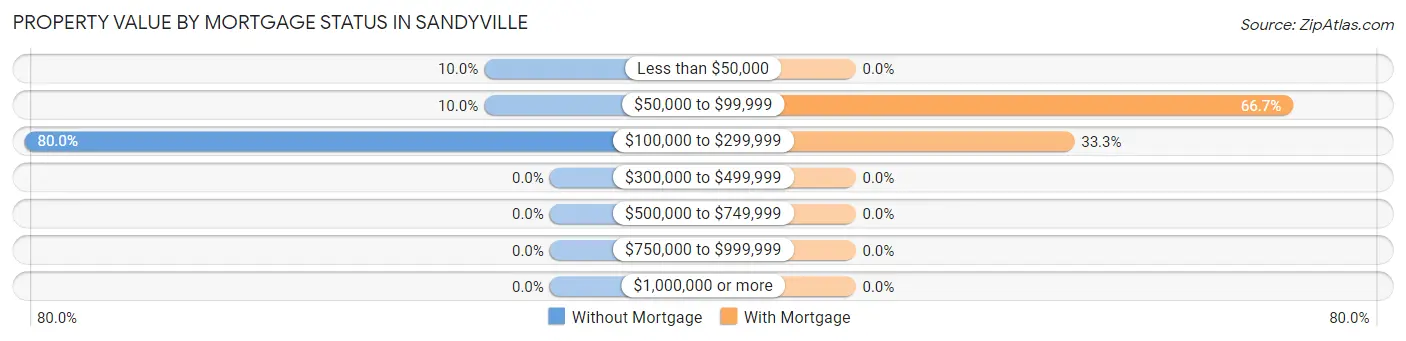
| Property Value | Without Mortgage | With Mortgage |
| Less than $50,000 | 1 (10.0%) | 0 (0.0%) |
| $50,000 to $99,999 | 1 (10.0%) | 4 (66.7%) |
| $100,000 to $299,999 | 8 (80.0%) | 2 (33.3%) |
| $300,000 to $499,999 | 0 (0.0%) | 0 (0.0%) |
| $500,000 to $749,999 | 0 (0.0%) | 0 (0.0%) |
| $750,000 to $999,999 | 0 (0.0%) | 0 (0.0%) |
| $1,000,000 or more | 0 (0.0%) | 0 (0.0%) |
| Total | 10 (100.0%) | 6 (100.0%) |
Household Income by Mortgage Status in Sandyville
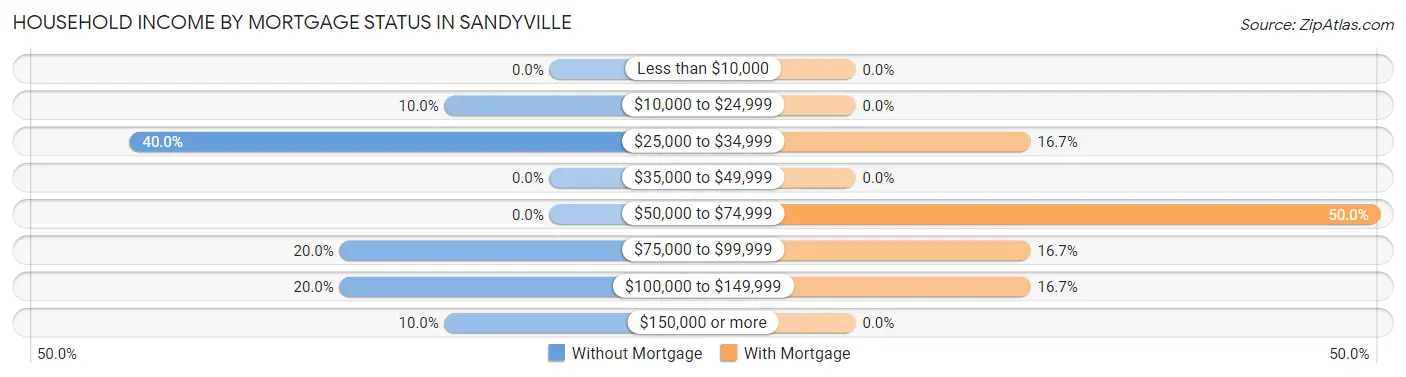
| Household Income | Without Mortgage | With Mortgage |
| Less than $10,000 | 0 (0.0%) | 0 (0.0%) |
| $10,000 to $24,999 | 1 (10.0%) | 0 (0.0%) |
| $25,000 to $34,999 | 4 (40.0%) | 1 (16.7%) |
| $35,000 to $49,999 | 0 (0.0%) | 0 (0.0%) |
| $50,000 to $74,999 | 0 (0.0%) | 3 (50.0%) |
| $75,000 to $99,999 | 2 (20.0%) | 1 (16.7%) |
| $100,000 to $149,999 | 2 (20.0%) | 1 (16.7%) |
| $150,000 or more | 1 (10.0%) | 0 (0.0%) |
| Total | 10 (100.0%) | 6 (100.0%) |
Property Value to Household Income Ratio in Sandyville
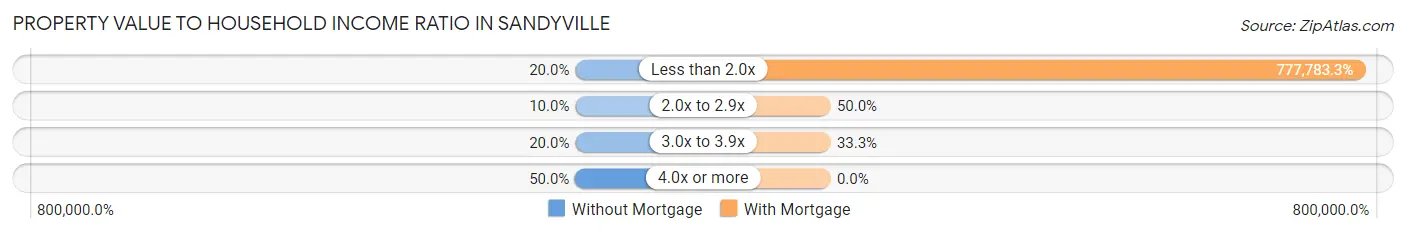
| Value-to-Income Ratio | Without Mortgage | With Mortgage |
| Less than 2.0x | 2 (20.0%) | 46,667 (777,783.3%) |
| 2.0x to 2.9x | 1 (10.0%) | 3 (50.0%) |
| 3.0x to 3.9x | 2 (20.0%) | 2 (33.3%) |
| 4.0x or more | 5 (50.0%) | 0 (0.0%) |
| Total | 10 (100.0%) | 6 (100.0%) |
Real Estate Taxes by Mortgage Status in Sandyville
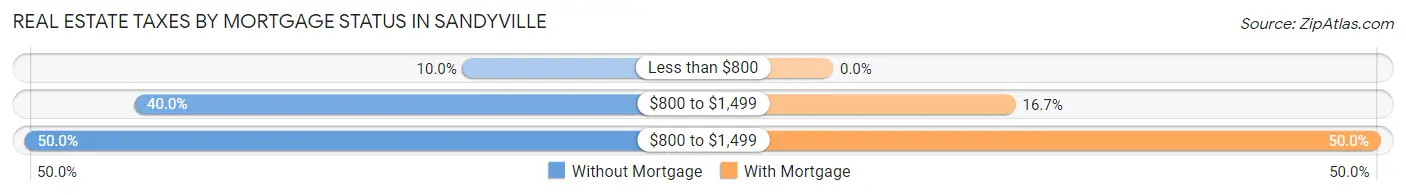
| Property Taxes | Without Mortgage | With Mortgage |
| Less than $800 | 1 (10.0%) | 0 (0.0%) |
| $800 to $1,499 | 4 (40.0%) | 1 (16.7%) |
| $800 to $1,499 | 5 (50.0%) | 3 (50.0%) |
| Total | 10 (100.0%) | 6 (100.0%) |
Health & Disability in Sandyville
Health Insurance Coverage by Age in Sandyville
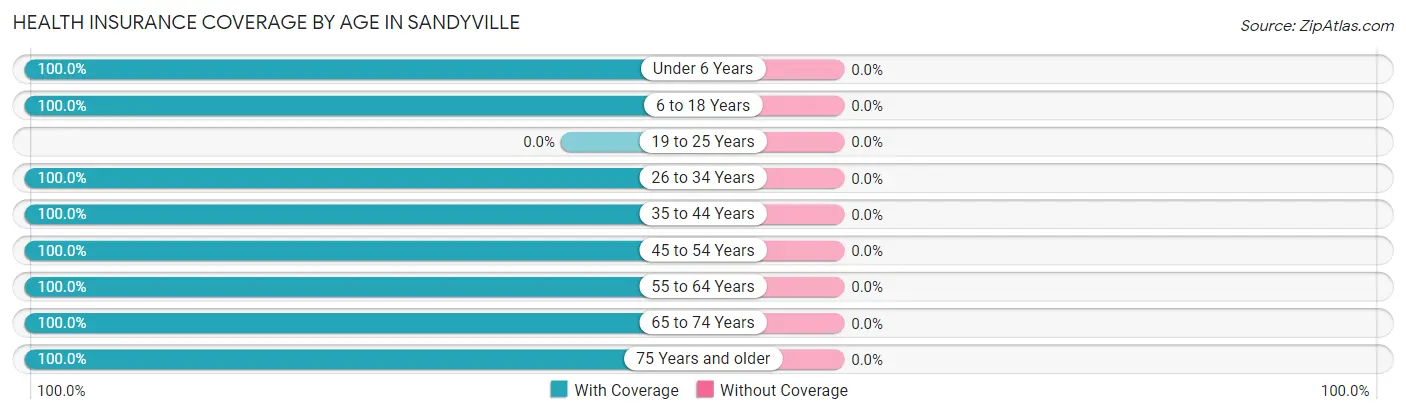
| Age Bracket | With Coverage | Without Coverage |
| Under 6 Years | 11 (100.0%) | 0 (0.0%) |
| 6 to 18 Years | 4 (100.0%) | 0 (0.0%) |
| 19 to 25 Years | 0 (0.0%) | 0 (0.0%) |
| 26 to 34 Years | 2 (100.0%) | 0 (0.0%) |
| 35 to 44 Years | 8 (100.0%) | 0 (0.0%) |
| 45 to 54 Years | 3 (100.0%) | 0 (0.0%) |
| 55 to 64 Years | 12 (100.0%) | 0 (0.0%) |
| 65 to 74 Years | 2 (100.0%) | 0 (0.0%) |
| 75 Years and older | 4 (100.0%) | 0 (0.0%) |
| Total | 46 (100.0%) | 0 (0.0%) |
Health Insurance Coverage by Citizenship Status in Sandyville
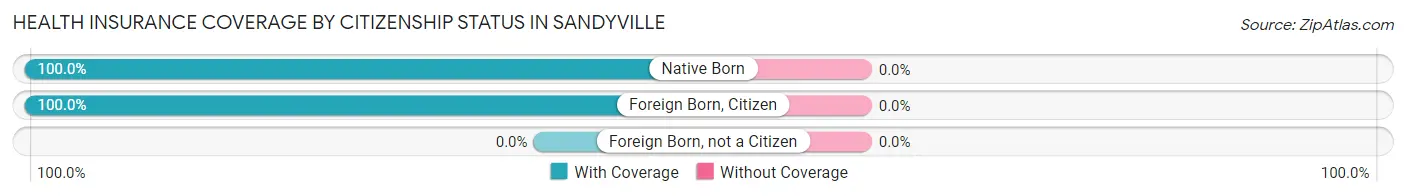
| Citizenship Status | With Coverage | Without Coverage |
| Native Born | 11 (100.0%) | 0 (0.0%) |
| Foreign Born, Citizen | 4 (100.0%) | 0 (0.0%) |
| Foreign Born, not a Citizen | 0 (0.0%) | 0 (0.0%) |
Health Insurance Coverage by Household Income in Sandyville
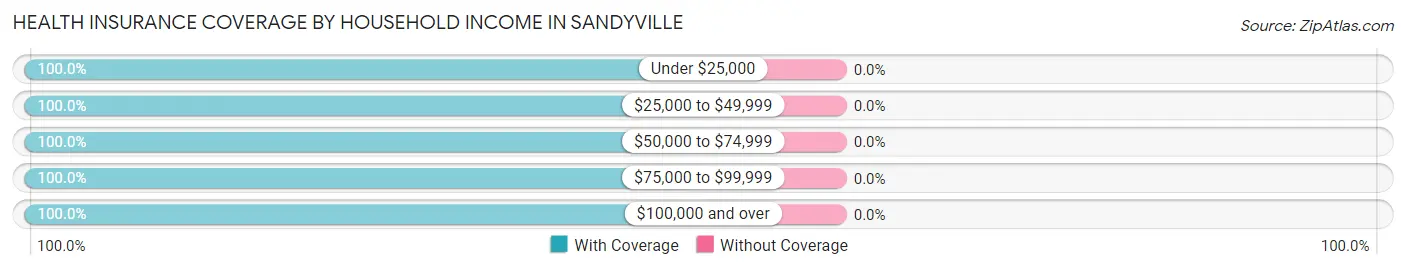
| Household Income | With Coverage | Without Coverage |
| Under $25,000 | 6 (100.0%) | 0 (0.0%) |
| $25,000 to $49,999 | 20 (100.0%) | 0 (0.0%) |
| $50,000 to $74,999 | 5 (100.0%) | 0 (0.0%) |
| $75,000 to $99,999 | 7 (100.0%) | 0 (0.0%) |
| $100,000 and over | 8 (100.0%) | 0 (0.0%) |
Public vs Private Health Insurance Coverage by Age in Sandyville
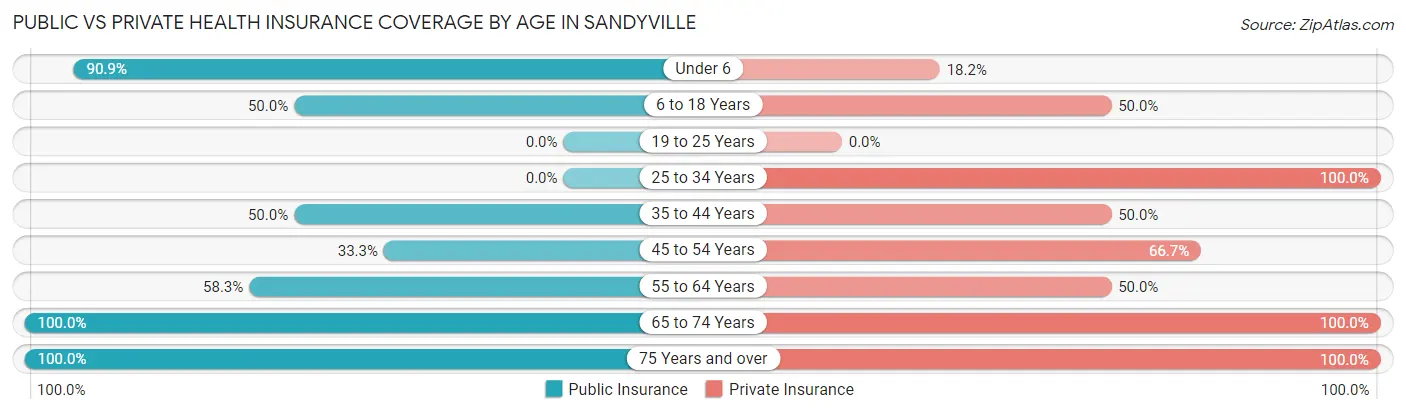
| Age Bracket | Public Insurance | Private Insurance |
| Under 6 | 10 (90.9%) | 2 (18.2%) |
| 6 to 18 Years | 2 (50.0%) | 2 (50.0%) |
| 19 to 25 Years | 0 (0.0%) | 0 (0.0%) |
| 25 to 34 Years | 0 (0.0%) | 2 (100.0%) |
| 35 to 44 Years | 4 (50.0%) | 4 (50.0%) |
| 45 to 54 Years | 1 (33.3%) | 2 (66.7%) |
| 55 to 64 Years | 7 (58.3%) | 6 (50.0%) |
| 65 to 74 Years | 2 (100.0%) | 2 (100.0%) |
| 75 Years and over | 4 (100.0%) | 4 (100.0%) |
| Total | 30 (65.2%) | 24 (52.2%) |
Disability Status by Sex by Age in Sandyville
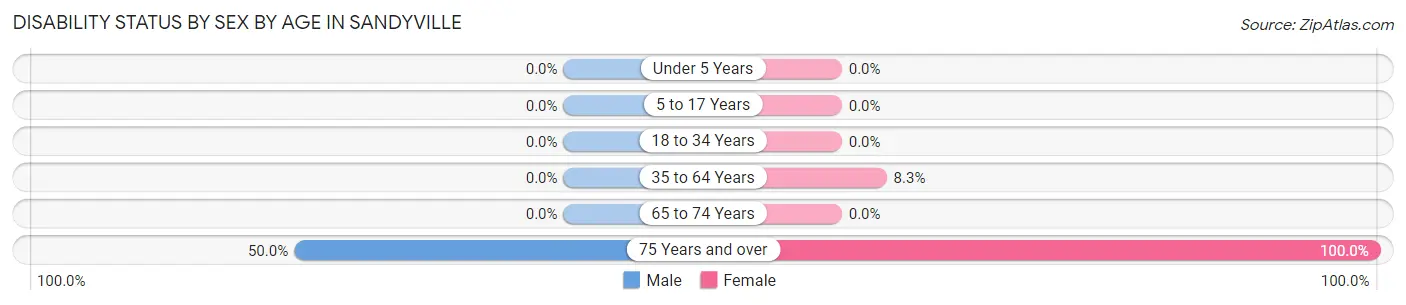
| Age Bracket | Male | Female |
| Under 5 Years | 0 (0.0%) | 0 (0.0%) |
| 5 to 17 Years | 0 (0.0%) | 0 (0.0%) |
| 18 to 34 Years | 0 (0.0%) | 0 (0.0%) |
| 35 to 64 Years | 0 (0.0%) | 1 (8.3%) |
| 65 to 74 Years | 0 (0.0%) | 0 (0.0%) |
| 75 Years and over | 1 (50.0%) | 2 (100.0%) |
Disability Class by Sex by Age in Sandyville
Disability Class: Hearing Difficulty
| Age Bracket | Male | Female |
| Under 5 Years | 0 (0.0%) | 0 (0.0%) |
| 5 to 17 Years | 0 (0.0%) | 0 (0.0%) |
| 18 to 34 Years | 0 (0.0%) | 0 (0.0%) |
| 35 to 64 Years | 0 (0.0%) | 0 (0.0%) |
| 65 to 74 Years | 0 (0.0%) | 0 (0.0%) |
| 75 Years and over | 0 (0.0%) | 0 (0.0%) |
Disability Class: Vision Difficulty
| Age Bracket | Male | Female |
| Under 5 Years | 0 (0.0%) | 0 (0.0%) |
| 5 to 17 Years | 0 (0.0%) | 0 (0.0%) |
| 18 to 34 Years | 0 (0.0%) | 0 (0.0%) |
| 35 to 64 Years | 0 (0.0%) | 0 (0.0%) |
| 65 to 74 Years | 0 (0.0%) | 0 (0.0%) |
| 75 Years and over | 0 (0.0%) | 0 (0.0%) |
Disability Class: Cognitive Difficulty
| Age Bracket | Male | Female |
| 5 to 17 Years | 0 (0.0%) | 0 (0.0%) |
| 18 to 34 Years | 0 (0.0%) | 0 (0.0%) |
| 35 to 64 Years | 0 (0.0%) | 1 (8.3%) |
| 65 to 74 Years | 0 (0.0%) | 0 (0.0%) |
| 75 Years and over | 0 (0.0%) | 0 (0.0%) |
Disability Class: Ambulatory Difficulty
| Age Bracket | Male | Female |
| 5 to 17 Years | 0 (0.0%) | 0 (0.0%) |
| 18 to 34 Years | 0 (0.0%) | 0 (0.0%) |
| 35 to 64 Years | 0 (0.0%) | 0 (0.0%) |
| 65 to 74 Years | 0 (0.0%) | 0 (0.0%) |
| 75 Years and over | 1 (50.0%) | 2 (100.0%) |
Disability Class: Self-Care Difficulty
| Age Bracket | Male | Female |
| 5 to 17 Years | 0 (0.0%) | 0 (0.0%) |
| 18 to 34 Years | 0 (0.0%) | 0 (0.0%) |
| 35 to 64 Years | 0 (0.0%) | 0 (0.0%) |
| 65 to 74 Years | 0 (0.0%) | 0 (0.0%) |
| 75 Years and over | 0 (0.0%) | 0 (0.0%) |
Technology Access in Sandyville
Computing Device Access in Sandyville
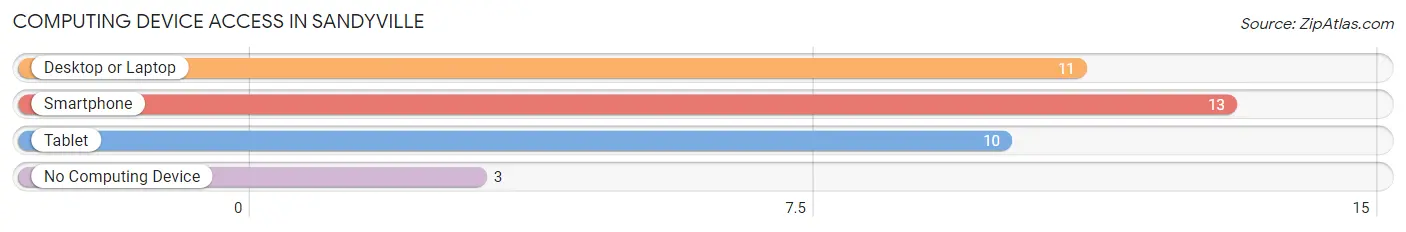
| Device Type | # Households | % Households |
| Desktop or Laptop | 11 | 68.8% |
| Smartphone | 13 | 81.2% |
| Tablet | 10 | 62.5% |
| No Computing Device | 3 | 18.8% |
| Total | 16 | 100.0% |
Internet Access in Sandyville
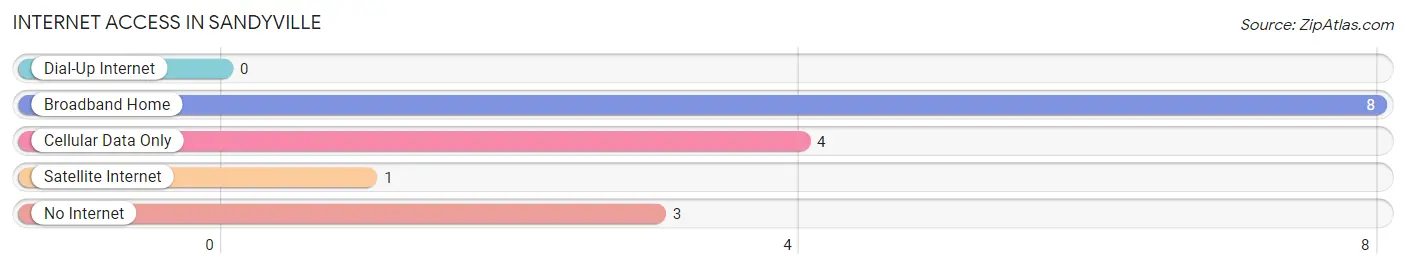
| Internet Type | # Households | % Households |
| Dial-Up Internet | 0 | 0.0% |
| Broadband Home | 8 | 50.0% |
| Cellular Data Only | 4 | 25.0% |
| Satellite Internet | 1 | 6.2% |
| No Internet | 3 | 18.8% |
| Total | 16 | 100.0% |
Sandyville Summary
Sandyville, Iowa is a small town located in the southeastern corner of the state. It is situated in the rolling hills of the Loess Hills region, and is surrounded by farmland and small towns. The town has a population of just over 1,000 people, and is the county seat of Appanoose County.
History
Sandyville was founded in 1854 by a group of settlers from Ohio. The town was named after the nearby Sandy Creek, which was named for the sandy soil in the area. The town was originally a farming community, and the first settlers built a grist mill and a sawmill. The town grew slowly, and by the late 19th century, it had become a center for trade and commerce.
In the early 20th century, Sandyville began to experience a period of growth. The town was incorporated in 1910, and the first mayor was elected in 1911. The town was connected to the railroad in 1912, and this allowed for the growth of industry and commerce. The town also became a center for education, with the establishment of a high school in 1915.
Geography
Sandyville is located in the southeastern corner of Iowa, in Appanoose County. The town is situated in the rolling hills of the Loess Hills region, and is surrounded by farmland and small towns. The town is located at the intersection of two major highways, US Route 34 and Iowa Highway 5. The town is located about 30 miles from the state capital of Des Moines.
The climate in Sandyville is typical of the Midwest, with hot summers and cold winters. The average temperature in the summer is around 75 degrees Fahrenheit, and the average temperature in the winter is around 25 degrees Fahrenheit. The town receives an average of 40 inches of precipitation per year.
Economy
Sandyville’s economy is largely based on agriculture and manufacturing. The town is home to several large farms, and the surrounding area is known for its production of corn, soybeans, and hogs. The town is also home to several manufacturing companies, including a furniture factory, a plastics factory, and a metal fabrication plant.
The town is also home to several small businesses, including restaurants, retail stores, and service providers. The town is also home to a branch of the Appanoose County Bank, which provides banking services to the local community.
Demographics
As of the 2010 census, the population of Sandyville was 1,072. The town is predominantly white, with 92.3% of the population identifying as white. The town also has a small Hispanic population, with 4.2% of the population identifying as Hispanic or Latino. The median household income in the town is $41,250, and the median home value is $90,000.
Sandyville is a small town with a rich history and a strong sense of community. The town is home to a diverse population, and the economy is largely based on agriculture and manufacturing. The town is a great place to live, work, and raise a family.
Common Questions
What is Per Capita Income in Sandyville?
Per Capita income in Sandyville is $23,357.
What is Income or Wage Gap in Sandyville?
Income or Wage Gap in Sandyville is 37.1%.
Women in Sandyville earn 62.9 cents for every dollar earned by a man.
What is Inequality or Gini Index in Sandyville?
Inequality or Gini Index in Sandyville is 0.39.
What is the Total Population of Sandyville?
Total Population of Sandyville is 46.
What is the Total Male Population of Sandyville?
Total Male Population of Sandyville is 26.
What is the Total Female Population of Sandyville?
Total Female Population of Sandyville is 20.
What is the Ratio of Males per 100 Females in Sandyville?
There are 130.00 Males per 100 Females in Sandyville.
What is the Ratio of Females per 100 Males in Sandyville?
There are 76.92 Females per 100 Males in Sandyville.
What is the Median Population Age in Sandyville?
Median Population Age in Sandyville is 40.5 Years.
What is the Average Family Size in Sandyville
Average Family Size in Sandyville is 3.0 People.
What is the Average Household Size in Sandyville
Average Household Size in Sandyville is 2.9 People.
How Large is the Labor Force in Sandyville?
There are 17 People in the Labor Forcein in Sandyville.
What is the Percentage of People in the Labor Force in Sandyville?
54.8% of People are in the Labor Force in Sandyville.
What is the Unemployment Rate in Sandyville?
Unemployment Rate in Sandyville is 5.9%.