Union City, MI Map & Demographics
Union City Map
Union City Overview
$23,845
PER CAPITA INCOME
$59,583
AVG FAMILY INCOME
$53,229
AVG HOUSEHOLD INCOME
49.3%
WAGE / INCOME GAP [ % ]
50.7¢/ $1
WAGE / INCOME GAP [ $ ]
0.37
INEQUALITY / GINI INDEX
1,826
TOTAL POPULATION
791
MALE POPULATION
1,035
FEMALE POPULATION
76.43
MALES / 100 FEMALES
130.85
FEMALES / 100 MALES
32.1
MEDIAN AGE
3.2
AVG FAMILY SIZE
2.6
AVG HOUSEHOLD SIZE
892
LABOR FORCE [ PEOPLE ]
63.0%
PERCENT IN LABOR FORCE
6.2%
UNEMPLOYMENT RATE
Union City Zip Codes
Union City Area Codes
Income in Union City
Income Overview in Union City
Per Capita Income in Union City is $23,845, while median incomes of families and households are $59,583 and $53,229 respectively.
| Characteristic | Number | Measure |
| Per Capita Income | 1,826 | $23,845 |
| Median Family Income | 451 | $59,583 |
| Mean Family Income | 451 | $70,244 |
| Median Household Income | 689 | $53,229 |
| Mean Household Income | 689 | $62,694 |
| Income Deficit | 451 | $0 |
| Wage / Income Gap (%) | 1,826 | 49.33% |
| Wage / Income Gap ($) | 1,826 | 50.67¢ per $1 |
| Gini / Inequality Index | 1,826 | 0.37 |
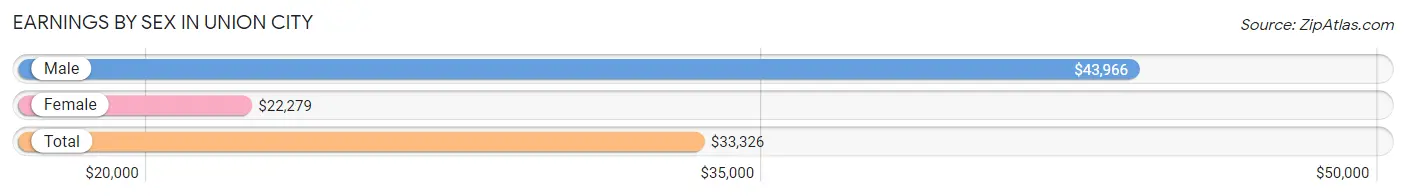
Earnings by Sex in Union City
Average Earnings in Union City are $33,326, $43,966 for men and $22,279 for women, a difference of 49.3%.
| Sex | Number | Average Earnings |
| Male | 382 (41.8%) | $43,966 |
| Female | 531 (58.2%) | $22,279 |
| Total | 913 (100.0%) | $33,326 |
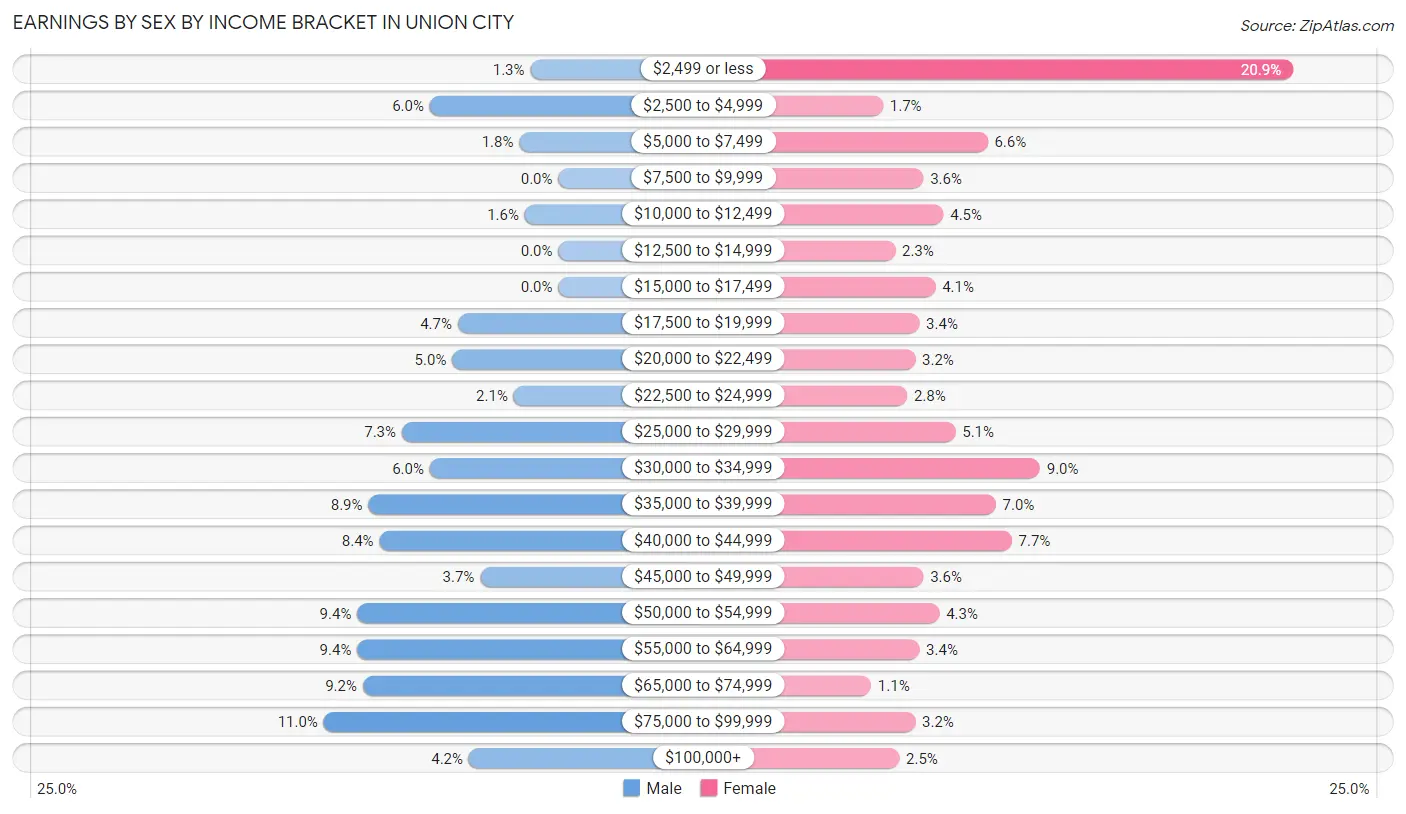
Earnings by Sex by Income Bracket in Union City
The most common earnings brackets in Union City are $75,000 to $99,999 for men (42 | 11.0%) and $2,499 or less for women (111 | 20.9%).
| Income | Male | Female |
| $2,499 or less | 5 (1.3%) | 111 (20.9%) |
| $2,500 to $4,999 | 23 (6.0%) | 9 (1.7%) |
| $5,000 to $7,499 | 7 (1.8%) | 35 (6.6%) |
| $7,500 to $9,999 | 0 (0.0%) | 19 (3.6%) |
| $10,000 to $12,499 | 6 (1.6%) | 24 (4.5%) |
| $12,500 to $14,999 | 0 (0.0%) | 12 (2.3%) |
| $15,000 to $17,499 | 0 (0.0%) | 22 (4.1%) |
| $17,500 to $19,999 | 18 (4.7%) | 18 (3.4%) |
| $20,000 to $22,499 | 19 (5.0%) | 17 (3.2%) |
| $22,500 to $24,999 | 8 (2.1%) | 15 (2.8%) |
| $25,000 to $29,999 | 28 (7.3%) | 27 (5.1%) |
| $30,000 to $34,999 | 23 (6.0%) | 48 (9.0%) |
| $35,000 to $39,999 | 34 (8.9%) | 37 (7.0%) |
| $40,000 to $44,999 | 32 (8.4%) | 41 (7.7%) |
| $45,000 to $49,999 | 14 (3.7%) | 19 (3.6%) |
| $50,000 to $54,999 | 36 (9.4%) | 23 (4.3%) |
| $55,000 to $64,999 | 36 (9.4%) | 18 (3.4%) |
| $65,000 to $74,999 | 35 (9.2%) | 6 (1.1%) |
| $75,000 to $99,999 | 42 (11.0%) | 17 (3.2%) |
| $100,000+ | 16 (4.2%) | 13 (2.5%) |
| Total | 382 (100.0%) | 531 (100.0%) |
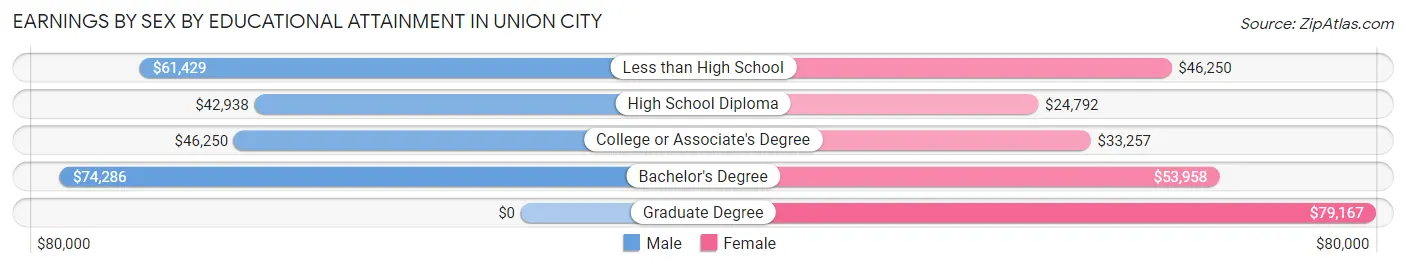
Earnings by Sex by Educational Attainment in Union City
Average earnings in Union City are $50,185 for men and $34,010 for women, a difference of 32.2%. Men with an educational attainment of bachelor's degree enjoy the highest average annual earnings of $74,286, while those with high school diploma education earn the least with $42,938. Women with an educational attainment of graduate degree earn the most with the average annual earnings of $79,167, while those with high school diploma education have the smallest earnings of $24,792.
| Educational Attainment | Male Income | Female Income |
| Less than High School | $61,429 | $46,250 |
| High School Diploma | $42,938 | $24,792 |
| College or Associate's Degree | $46,250 | $33,257 |
| Bachelor's Degree | $74,286 | $53,958 |
| Graduate Degree | - | - |
| Total | $50,185 | $34,010 |
Family Income in Union City
Family Income Brackets in Union City
According to the Union City family income data, there are 118 families falling into the $35,000 to $49,999 income range, which is the most common income bracket and makes up 26.2% of all families. Conversely, the $200,000+ income bracket is the least frequent group with only 9 families (2.0%) belonging to this category.
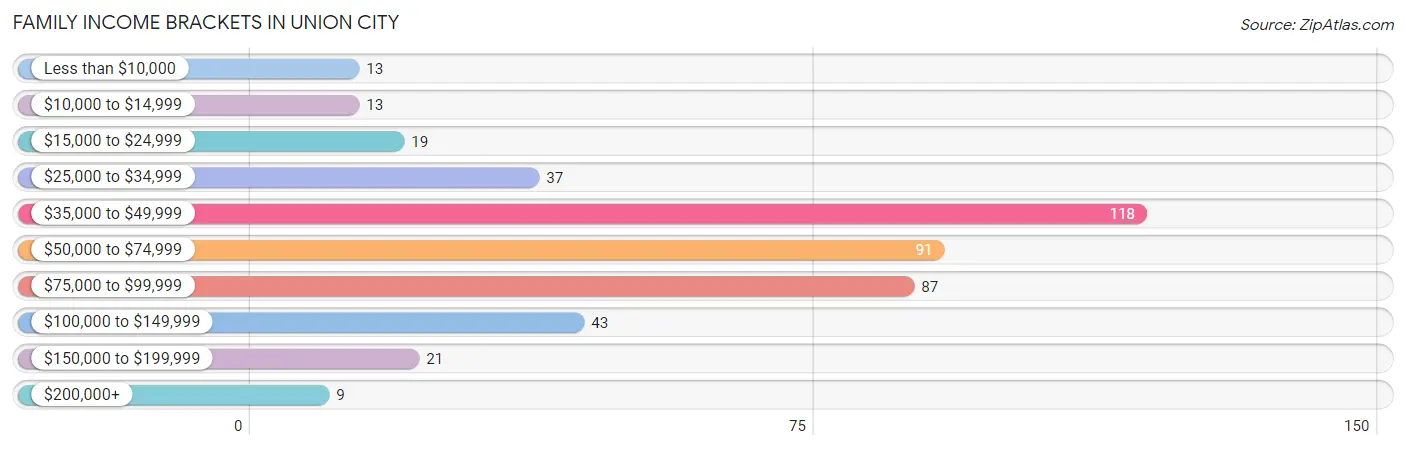
| Income Bracket | # Families | % Families |
| Less than $10,000 | 13 | 2.9% |
| $10,000 to $14,999 | 13 | 2.9% |
| $15,000 to $24,999 | 19 | 4.2% |
| $25,000 to $34,999 | 37 | 8.2% |
| $35,000 to $49,999 | 118 | 26.2% |
| $50,000 to $74,999 | 91 | 20.2% |
| $75,000 to $99,999 | 87 | 19.3% |
| $100,000 to $149,999 | 43 | 9.5% |
| $150,000 to $199,999 | 21 | 4.7% |
| $200,000+ | 9 | 2.0% |
Family Income by Famaliy Size in Union City
5-person families (21 | 4.7%) account for the highest median family income in Union City with $73,125 per family, while 2-person families (212 | 47.0%) have the highest median income of $33,810 per family member.
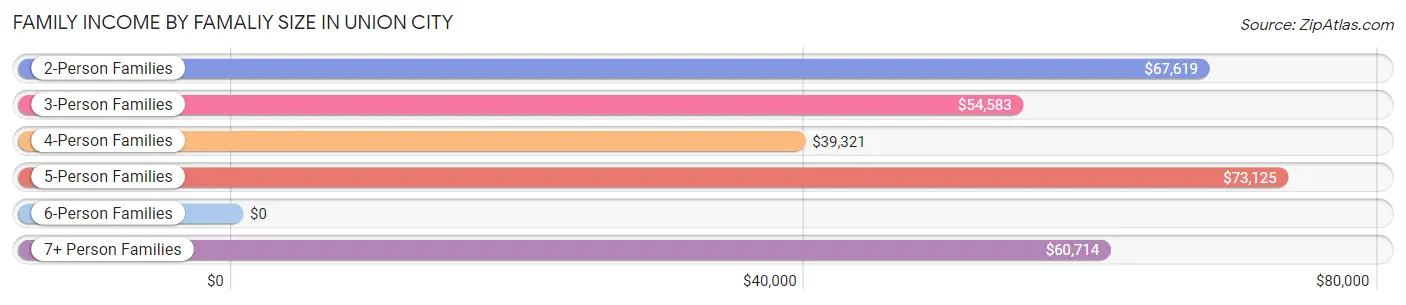
| Income Bracket | # Families | Median Income |
| 2-Person Families | 212 (47.0%) | $67,619 |
| 3-Person Families | 99 (22.0%) | $54,583 |
| 4-Person Families | 89 (19.7%) | $39,321 |
| 5-Person Families | 21 (4.7%) | $73,125 |
| 6-Person Families | 10 (2.2%) | $0 |
| 7+ Person Families | 20 (4.4%) | $60,714 |
| Total | 451 (100.0%) | $59,583 |
Family Income by Number of Earners in Union City
The median family income in Union City is $59,583, with families comprising 3+ earners (32) having the highest median family income of $79,500, while families with 1 earner (197) have the lowest median family income of $47,596, accounting for 7.1% and 43.7% of families, respectively.
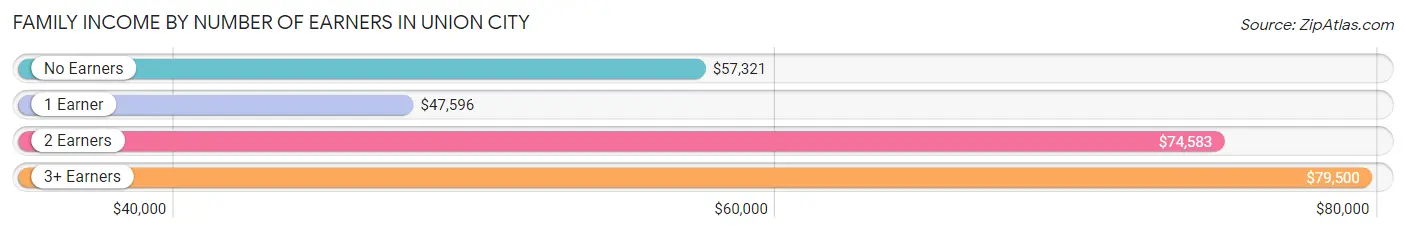
| Number of Earners | # Families | Median Income |
| No Earners | 55 (12.2%) | $57,321 |
| 1 Earner | 197 (43.7%) | $47,596 |
| 2 Earners | 167 (37.0%) | $74,583 |
| 3+ Earners | 32 (7.1%) | $79,500 |
| Total | 451 (100.0%) | $59,583 |
Household Income in Union City
Household Income Brackets in Union City
With 163 households falling in the category, the $35,000 to $49,999 income range is the most frequent in Union City, accounting for 23.7% of all households. In contrast, only 9 households (1.3%) fall into the $200,000+ income bracket, making it the least populous group.
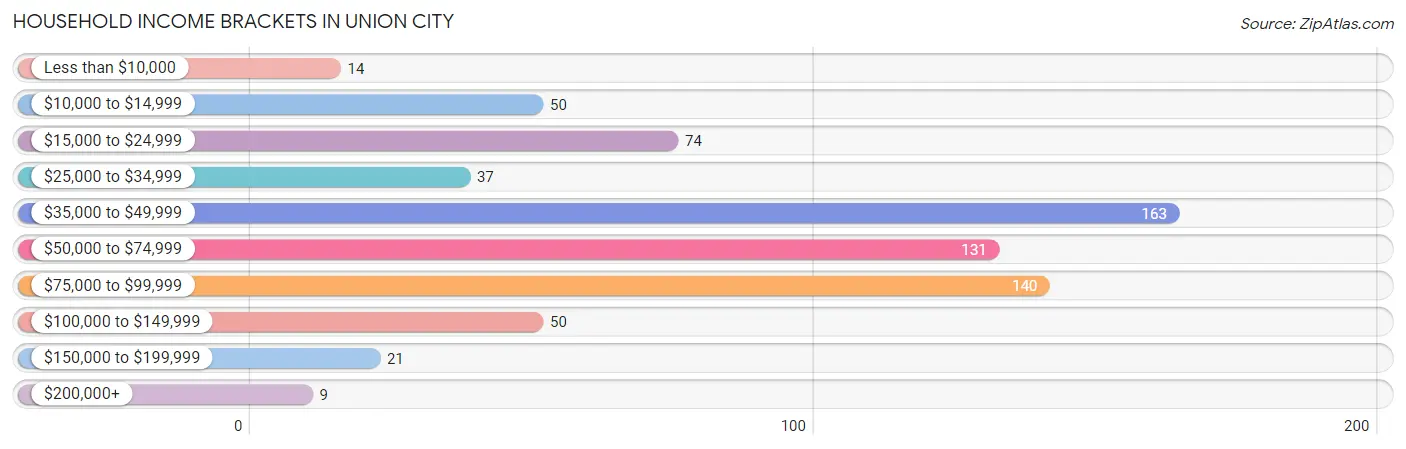
| Income Bracket | # Households | % Households |
| Less than $10,000 | 14 | 2.0% |
| $10,000 to $14,999 | 50 | 7.3% |
| $15,000 to $24,999 | 74 | 10.7% |
| $25,000 to $34,999 | 37 | 5.4% |
| $35,000 to $49,999 | 163 | 23.7% |
| $50,000 to $74,999 | 131 | 19.0% |
| $75,000 to $99,999 | 140 | 20.3% |
| $100,000 to $149,999 | 50 | 7.3% |
| $150,000 to $199,999 | 21 | 3.0% |
| $200,000+ | 9 | 1.3% |
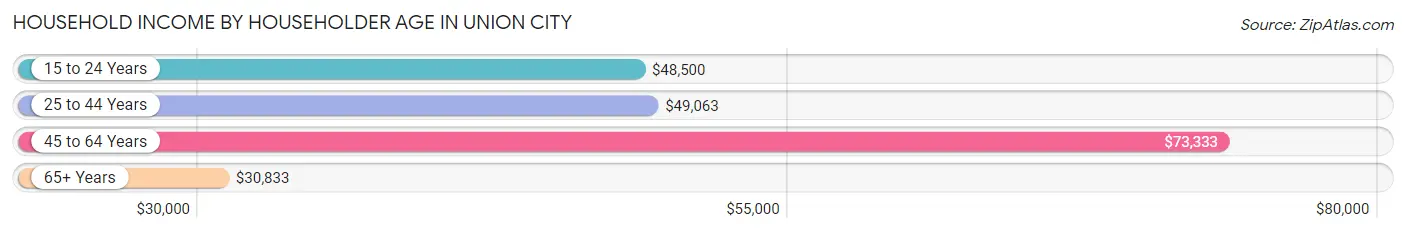
Household Income by Householder Age in Union City
The median household income in Union City is $53,229, with the highest median household income of $73,333 found in the 45 to 64 years age bracket for the primary householder. A total of 254 households (36.9%) fall into this category. Meanwhile, the 65+ years age bracket for the primary householder has the lowest median household income of $30,833, with 152 households (22.1%) in this group.
| Income Bracket | # Households | Median Income |
| 15 to 24 Years | 38 (5.5%) | $48,500 |
| 25 to 44 Years | 245 (35.6%) | $49,063 |
| 45 to 64 Years | 254 (36.9%) | $73,333 |
| 65+ Years | 152 (22.1%) | $30,833 |
| Total | 689 (100.0%) | $53,229 |
Poverty in Union City
Income Below Poverty by Sex and Age in Union City
With 8.2% poverty level for males and 15.2% for females among the residents of Union City, 18 to 24 year old males and 6 to 11 year old females are the most vulnerable to poverty, with 22 males (23.7%) and 40 females (50.6%) in their respective age groups living below the poverty level.
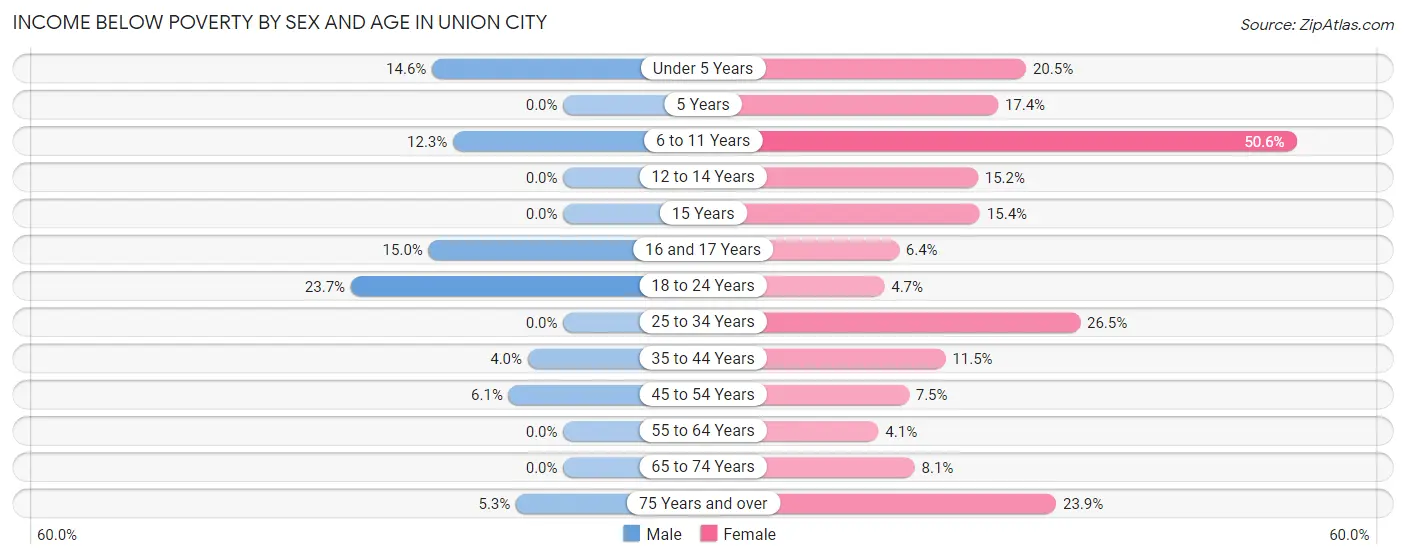
| Age Bracket | Male | Female |
| Under 5 Years | 13 (14.6%) | 8 (20.5%) |
| 5 Years | 0 (0.0%) | 4 (17.4%) |
| 6 to 11 Years | 7 (12.3%) | 40 (50.6%) |
| 12 to 14 Years | 0 (0.0%) | 5 (15.1%) |
| 15 Years | 0 (0.0%) | 10 (15.4%) |
| 16 and 17 Years | 9 (15.0%) | 4 (6.4%) |
| 18 to 24 Years | 22 (23.7%) | 7 (4.7%) |
| 25 to 34 Years | 0 (0.0%) | 26 (26.5%) |
| 35 to 44 Years | 3 (4.0%) | 15 (11.5%) |
| 45 to 54 Years | 9 (6.1%) | 10 (7.5%) |
| 55 to 64 Years | 0 (0.0%) | 4 (4.1%) |
| 65 to 74 Years | 0 (0.0%) | 3 (8.1%) |
| 75 Years and over | 2 (5.3%) | 21 (23.9%) |
| Total | 65 (8.2%) | 157 (15.2%) |
Income Above Poverty by Sex and Age in Union City
According to the poverty statistics in Union City, males aged 12 to 14 years and females aged 55 to 64 years are the age groups that are most secure financially, with 100.0% of males and 95.9% of females in these age groups living above the poverty line.
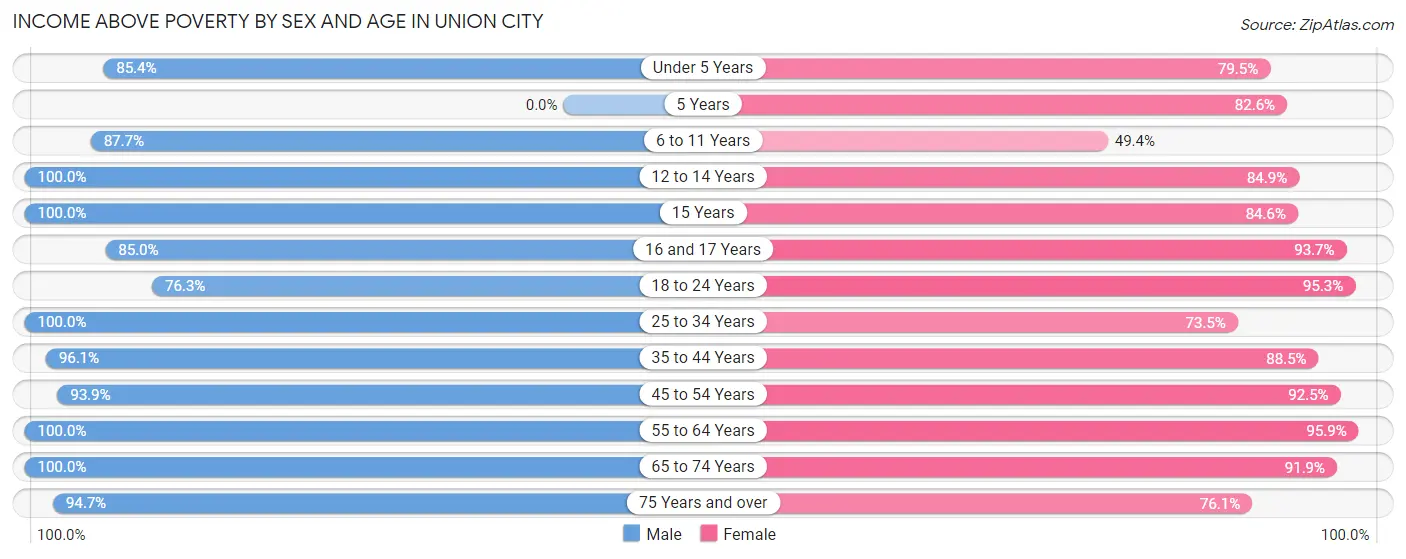
| Age Bracket | Male | Female |
| Under 5 Years | 76 (85.4%) | 31 (79.5%) |
| 5 Years | 0 (0.0%) | 19 (82.6%) |
| 6 to 11 Years | 50 (87.7%) | 39 (49.4%) |
| 12 to 14 Years | 14 (100.0%) | 28 (84.9%) |
| 15 Years | 11 (100.0%) | 55 (84.6%) |
| 16 and 17 Years | 51 (85.0%) | 59 (93.6%) |
| 18 to 24 Years | 71 (76.3%) | 141 (95.3%) |
| 25 to 34 Years | 103 (100.0%) | 72 (73.5%) |
| 35 to 44 Years | 73 (96.1%) | 115 (88.5%) |
| 45 to 54 Years | 139 (93.9%) | 124 (92.5%) |
| 55 to 64 Years | 56 (100.0%) | 94 (95.9%) |
| 65 to 74 Years | 46 (100.0%) | 34 (91.9%) |
| 75 Years and over | 36 (94.7%) | 67 (76.1%) |
| Total | 726 (91.8%) | 878 (84.8%) |
Income Below Poverty Among Married-Couple Families in Union City
The poverty statistics for married-couple families in Union City show that 0.8% or 2 of the total 253 families live below the poverty line. Families with no children have the highest poverty rate of 1.3%, comprising of 2 families. On the other hand, families with 1 or 2 children have the lowest poverty rate of 0.0%, which includes 0 families.
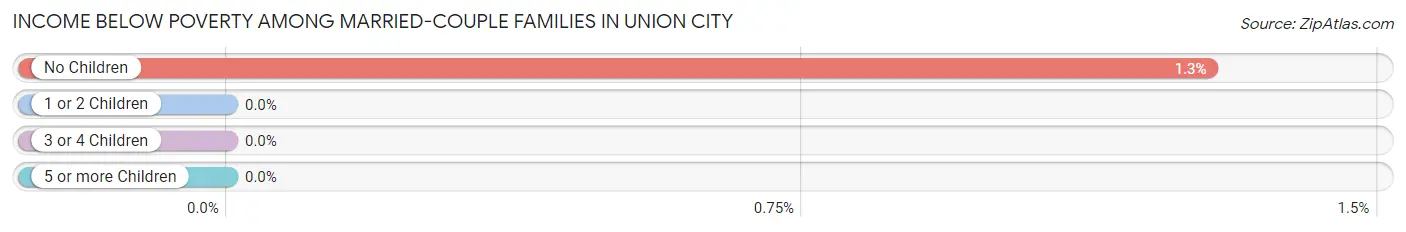
| Children | Above Poverty | Below Poverty |
| No Children | 154 (98.7%) | 2 (1.3%) |
| 1 or 2 Children | 54 (100.0%) | 0 (0.0%) |
| 3 or 4 Children | 29 (100.0%) | 0 (0.0%) |
| 5 or more Children | 14 (100.0%) | 0 (0.0%) |
| Total | 251 (99.2%) | 2 (0.8%) |
Income Below Poverty Among Single-Parent Households in Union City
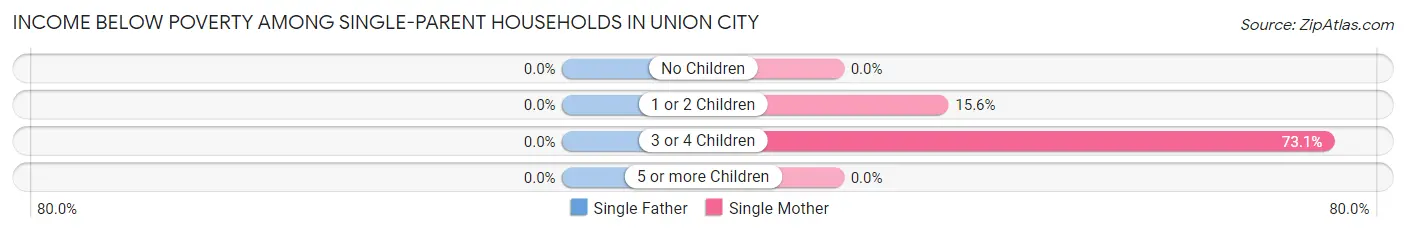
| Children | Single Father | Single Mother |
| No Children | 0 (0.0%) | 0 (0.0%) |
| 1 or 2 Children | 0 (0.0%) | 17 (15.6%) |
| 3 or 4 Children | 0 (0.0%) | 19 (73.1%) |
| 5 or more Children | 0 (0.0%) | 0 (0.0%) |
| Total | 0 (0.0%) | 36 (23.1%) |
Income Below Poverty Among Married-Couple vs Single-Parent Households in Union City
The poverty data for Union City shows that 2 of the married-couple family households (0.8%) and 36 of the single-parent households (18.2%) are living below the poverty level. Within the married-couple family households, those with no children have the highest poverty rate, with 2 households (1.3%) falling below the poverty line. Among the single-parent households, those with 3 or 4 children have the highest poverty rate, with 19 household (65.5%) living below poverty.
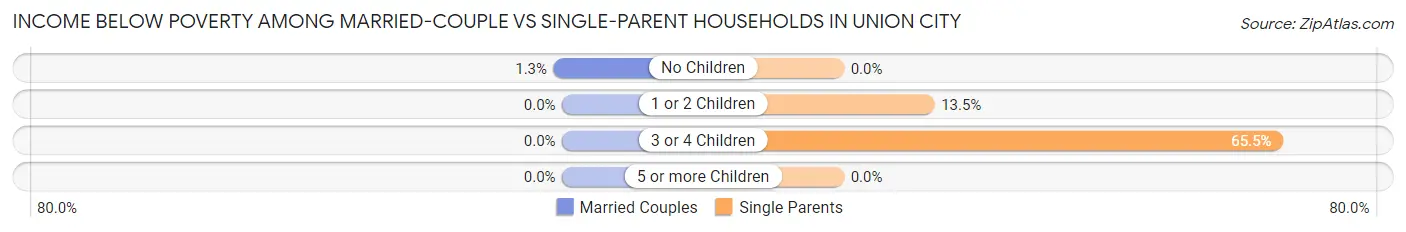
| Children | Married-Couple Families | Single-Parent Households |
| No Children | 2 (1.3%) | 0 (0.0%) |
| 1 or 2 Children | 0 (0.0%) | 17 (13.5%) |
| 3 or 4 Children | 0 (0.0%) | 19 (65.5%) |
| 5 or more Children | 0 (0.0%) | 0 (0.0%) |
| Total | 2 (0.8%) | 36 (18.2%) |
Race in Union City
The most populous races in Union City are White / Caucasian (1,484 | 81.3%), Two or more Races (328 | 18.0%), and Hispanic or Latino (28 | 1.5%).
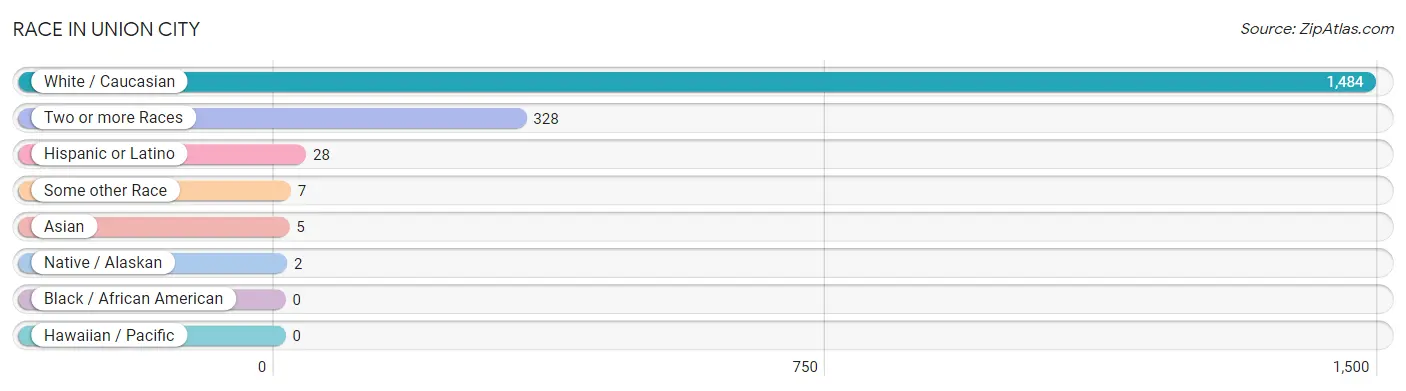
| Race | # Population | % Population |
| Asian | 5 | 0.3% |
| Black / African American | 0 | 0.0% |
| Hawaiian / Pacific | 0 | 0.0% |
| Hispanic or Latino | 28 | 1.5% |
| Native / Alaskan | 2 | 0.1% |
| White / Caucasian | 1,484 | 81.3% |
| Two or more Races | 328 | 18.0% |
| Some other Race | 7 | 0.4% |
| Total | 1,826 | 100.0% |
Ancestry in Union City
The most populous ancestries reported in Union City are German (614 | 33.6%), English (322 | 17.6%), Irish (206 | 11.3%), Bhutanese (139 | 7.6%), and American (114 | 6.2%), together accounting for 76.4% of all Union City residents.
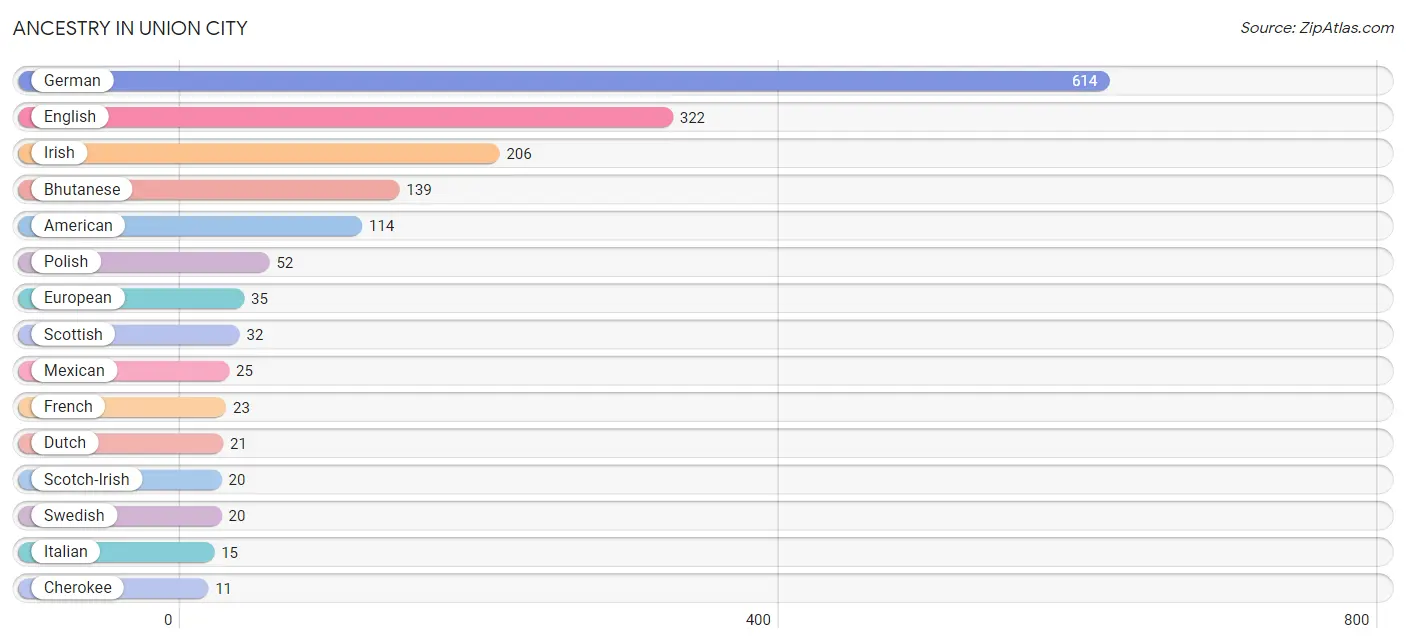
| Ancestry | # Population | % Population |
| American | 114 | 6.2% |
| Bhutanese | 139 | 7.6% |
| Celtic | 3 | 0.2% |
| Cherokee | 11 | 0.6% |
| Chippewa | 2 | 0.1% |
| Czech | 8 | 0.4% |
| Danish | 4 | 0.2% |
| Dutch | 21 | 1.1% |
| English | 322 | 17.6% |
| European | 35 | 1.9% |
| Finnish | 6 | 0.3% |
| French | 23 | 1.3% |
| French Canadian | 2 | 0.1% |
| German | 614 | 33.6% |
| Indian (Asian) | 5 | 0.3% |
| Irish | 206 | 11.3% |
| Italian | 15 | 0.8% |
| Mexican | 25 | 1.4% |
| Pennsylvania German | 2 | 0.1% |
| Polish | 52 | 2.9% |
| Scandinavian | 3 | 0.2% |
| Scotch-Irish | 20 | 1.1% |
| Scottish | 32 | 1.8% |
| Swedish | 20 | 1.1% |
| Swiss | 3 | 0.2% |
| Welsh | 3 | 0.2% | View All 26 Rows |
Immigrants in Union City
The most numerous immigrant groups reported in Union City came from Europe (6 | 0.3%), Northern Europe (6 | 0.3%), Asia (5 | 0.3%), Singapore (5 | 0.3%), and South Eastern Asia (5 | 0.3%), together accounting for 1.5% of all Union City residents.
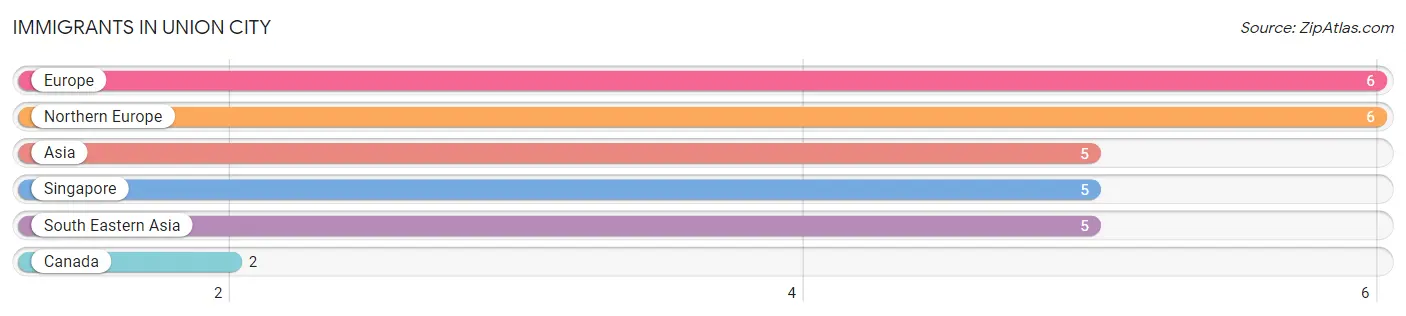
| Immigration Origin | # Population | % Population |
| Asia | 5 | 0.3% |
| Canada | 2 | 0.1% |
| Europe | 6 | 0.3% |
| Northern Europe | 6 | 0.3% |
| Singapore | 5 | 0.3% |
| South Eastern Asia | 5 | 0.3% | View All 6 Rows |
Sex and Age in Union City
Sex and Age in Union City
The most populous age groups in Union City are 15 to 19 Years (122 | 15.4%) for men and 15 to 19 Years (233 | 22.5%) for women.
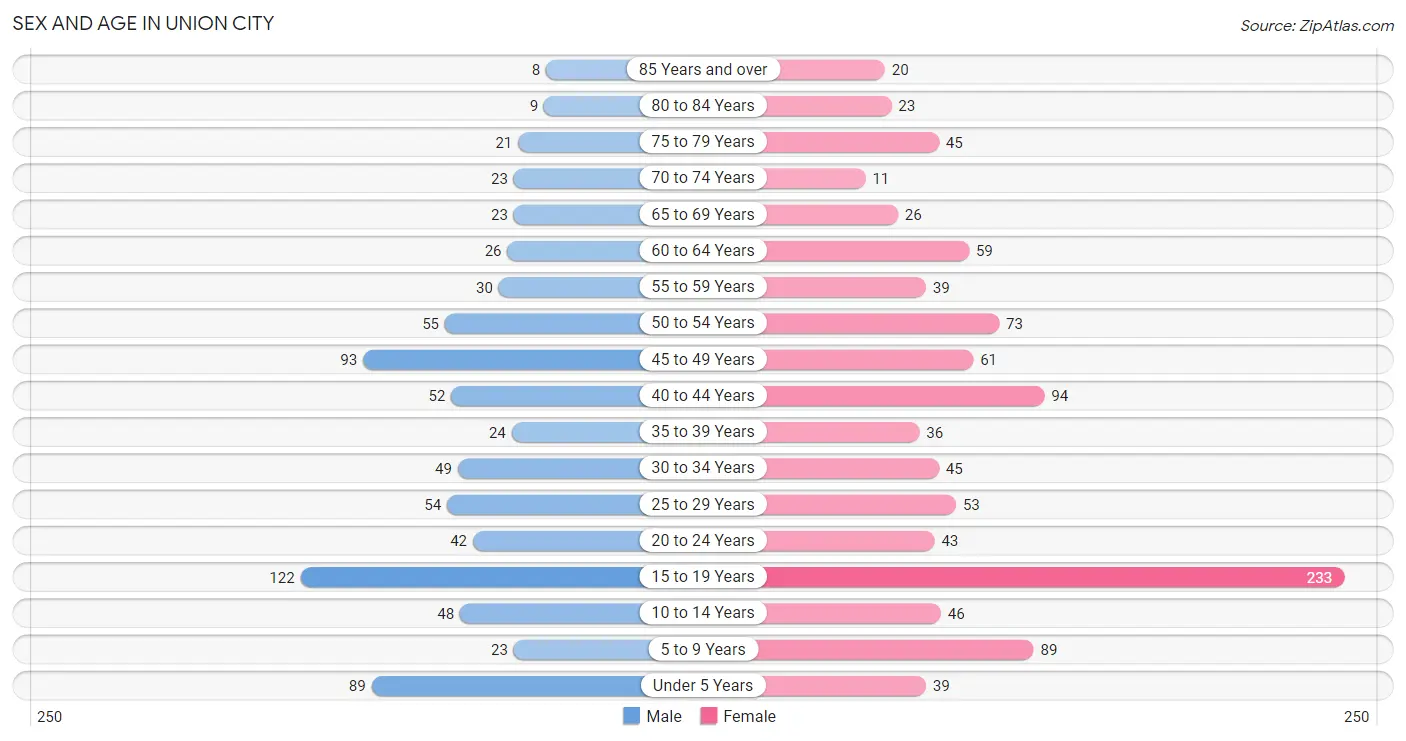
| Age Bracket | Male | Female |
| Under 5 Years | 89 (11.3%) | 39 (3.8%) |
| 5 to 9 Years | 23 (2.9%) | 89 (8.6%) |
| 10 to 14 Years | 48 (6.1%) | 46 (4.4%) |
| 15 to 19 Years | 122 (15.4%) | 233 (22.5%) |
| 20 to 24 Years | 42 (5.3%) | 43 (4.2%) |
| 25 to 29 Years | 54 (6.8%) | 53 (5.1%) |
| 30 to 34 Years | 49 (6.2%) | 45 (4.3%) |
| 35 to 39 Years | 24 (3.0%) | 36 (3.5%) |
| 40 to 44 Years | 52 (6.6%) | 94 (9.1%) |
| 45 to 49 Years | 93 (11.8%) | 61 (5.9%) |
| 50 to 54 Years | 55 (7.0%) | 73 (7.0%) |
| 55 to 59 Years | 30 (3.8%) | 39 (3.8%) |
| 60 to 64 Years | 26 (3.3%) | 59 (5.7%) |
| 65 to 69 Years | 23 (2.9%) | 26 (2.5%) |
| 70 to 74 Years | 23 (2.9%) | 11 (1.1%) |
| 75 to 79 Years | 21 (2.6%) | 45 (4.3%) |
| 80 to 84 Years | 9 (1.1%) | 23 (2.2%) |
| 85 Years and over | 8 (1.0%) | 20 (1.9%) |
| Total | 791 (100.0%) | 1,035 (100.0%) |
Families and Households in Union City
Median Family Size in Union City
The median family size in Union City is 3.21 persons per family, with single female/mother families (156 | 34.6%) accounting for the largest median family size of 3.52 persons per family. On the other hand, single male/father families (42 | 9.3%) represent the smallest median family size with 2.36 persons per family.
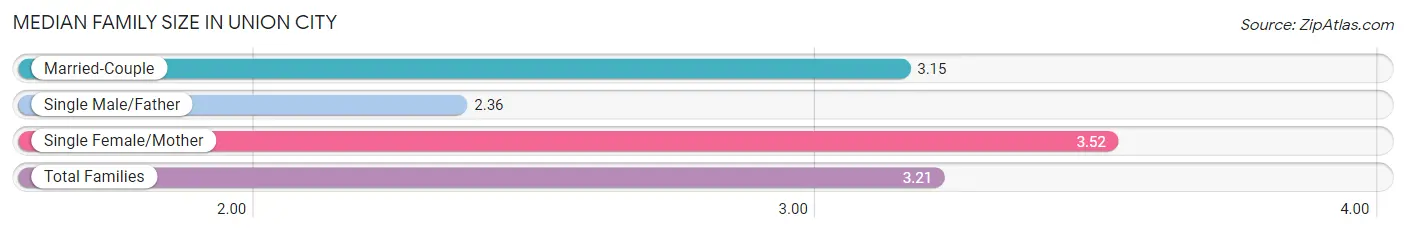
| Family Type | # Families | Family Size |
| Married-Couple | 253 (56.1%) | 3.15 |
| Single Male/Father | 42 (9.3%) | 2.36 |
| Single Female/Mother | 156 (34.6%) | 3.52 |
| Total Families | 451 (100.0%) | 3.21 |
Median Household Size in Union City
The median household size in Union City is 2.65 persons per household, with single female/mother households (156 | 22.6%) accounting for the largest median household size of 3.72 persons per household. non-family households (238 | 34.5%) represent the smallest median household size with 1.30 persons per household.
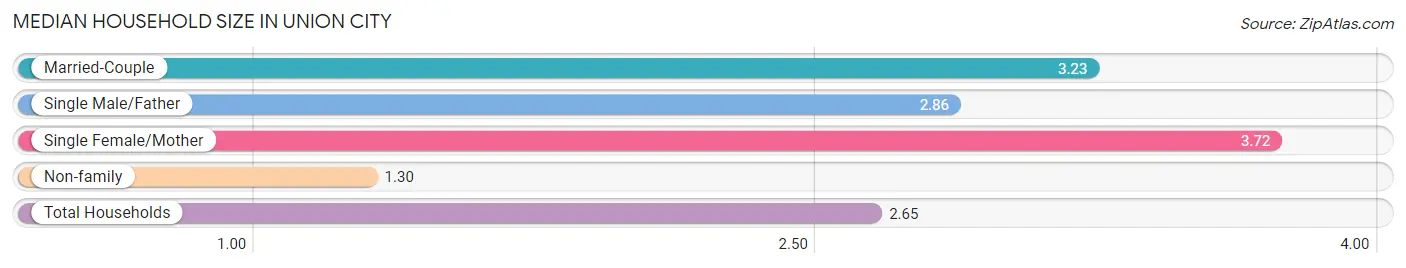
| Household Type | # Households | Household Size |
| Married-Couple | 253 (36.7%) | 3.23 |
| Single Male/Father | 42 (6.1%) | 2.86 |
| Single Female/Mother | 156 (22.6%) | 3.72 |
| Non-family | 238 (34.5%) | 1.30 |
| Total Households | 689 (100.0%) | 2.65 |
Household Size by Marriage Status in Union City
Out of a total of 689 households in Union City, 451 (65.5%) are family households, while 238 (34.5%) are nonfamily households. The most numerous type of family households are 2-person households, comprising 186, and the most common type of nonfamily households are 1-person households, comprising 169.
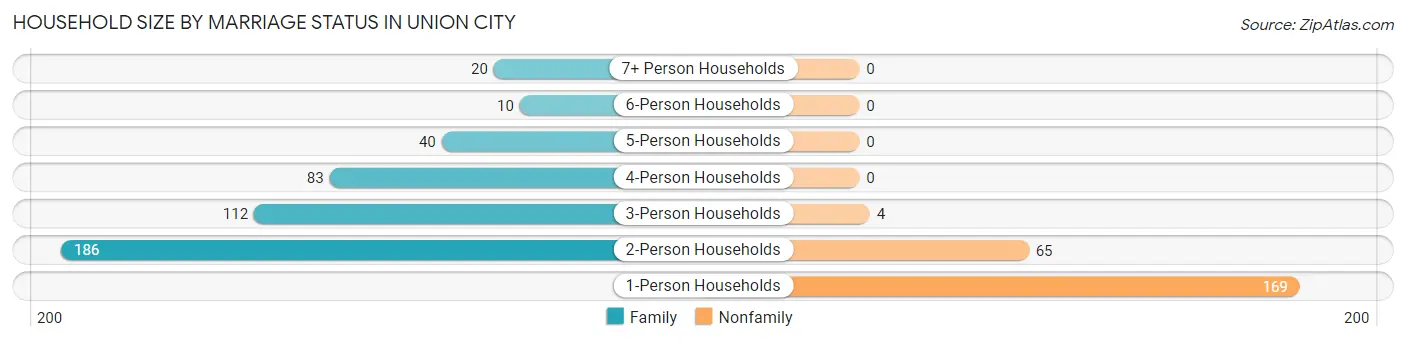
| Household Size | Family Households | Nonfamily Households |
| 1-Person Households | - | 169 (24.5%) |
| 2-Person Households | 186 (27.0%) | 65 (9.4%) |
| 3-Person Households | 112 (16.3%) | 4 (0.6%) |
| 4-Person Households | 83 (12.0%) | 0 (0.0%) |
| 5-Person Households | 40 (5.8%) | 0 (0.0%) |
| 6-Person Households | 10 (1.5%) | 0 (0.0%) |
| 7+ Person Households | 20 (2.9%) | 0 (0.0%) |
| Total | 451 (65.5%) | 238 (34.5%) |
Female Fertility in Union City
Fertility by Age in Union City
Average fertility rate in Union City is 59.0 births per 1,000 women. Women in the age bracket of 20 to 34 years have the highest fertility rate with 227.0 births per 1,000 women. Women in the age bracket of 20 to 34 years acount for 94.1% of all women with births.
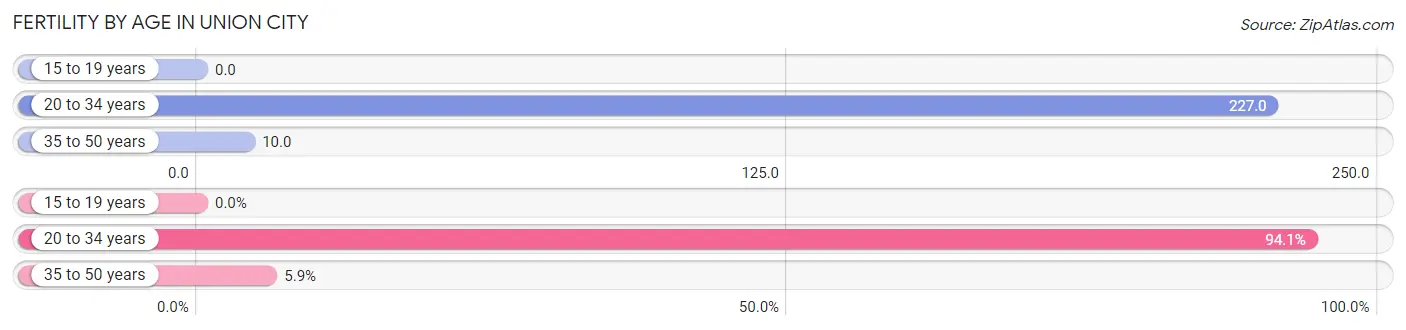
| Age Bracket | Women with Births | Births / 1,000 Women |
| 15 to 19 years | 0 (0.0%) | 0.0 |
| 20 to 34 years | 32 (94.1%) | 227.0 |
| 35 to 50 years | 2 (5.9%) | 10.0 |
| Total | 34 (100.0%) | 59.0 |
Fertility by Age by Marriage Status in Union City
67.6% of women with births (34) in Union City are married. The highest percentage of unmarried women with births falls into 20 to 34 years age bracket with 34.4% of them unmarried at the time of birth, while the lowest percentage of unmarried women with births belong to 35 to 50 years age bracket with 0.0% of them unmarried.
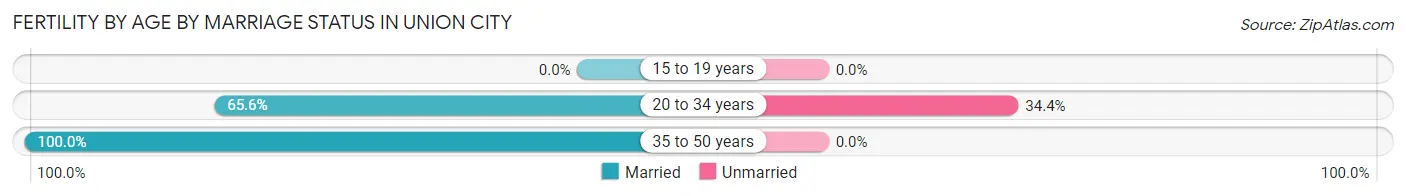
| Age Bracket | Married | Unmarried |
| 15 to 19 years | 0 (0.0%) | 0 (0.0%) |
| 20 to 34 years | 21 (65.6%) | 11 (34.4%) |
| 35 to 50 years | 2 (100.0%) | 0 (0.0%) |
| Total | 23 (67.6%) | 11 (32.4%) |
Fertility by Education in Union City
Average fertility rate in Union City is 59.0 births per 1,000 women. Women with the education attainment of graduate degree have the highest fertility rate of 167.0 births per 1,000 women, while women with the education attainment of less than high school have the lowest fertility at 18.0 births per 1,000 women. Women with the education attainment of college or associate's degree represent 61.8% of all women with births.
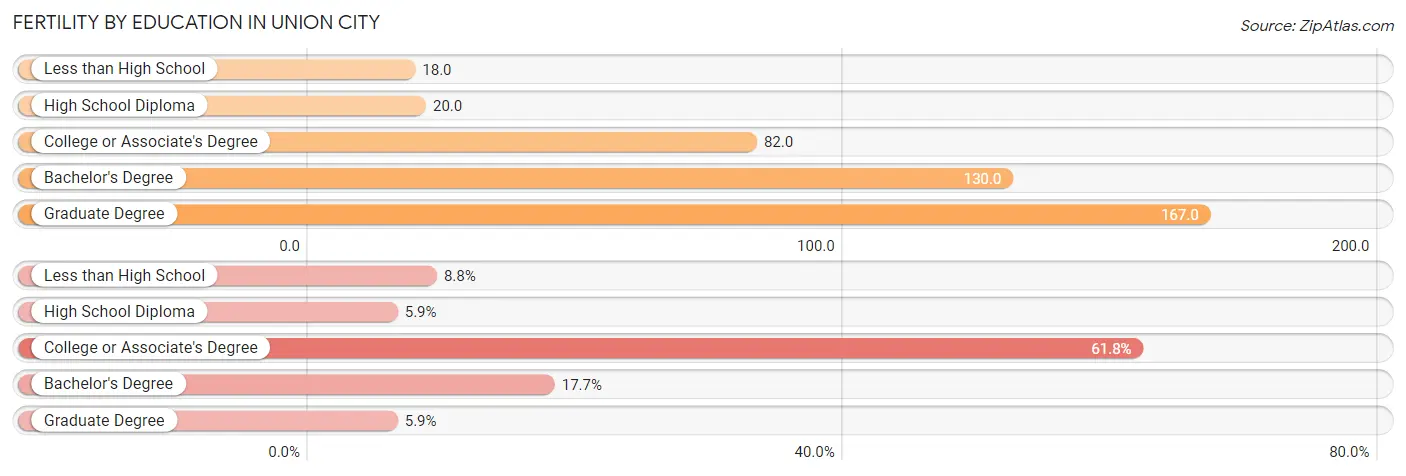
| Educational Attainment | Women with Births | Births / 1,000 Women |
| Less than High School | 3 (8.8%) | 18.0 |
| High School Diploma | 2 (5.9%) | 20.0 |
| College or Associate's Degree | 21 (61.8%) | 82.0 |
| Bachelor's Degree | 6 (17.6%) | 130.0 |
| Graduate Degree | 2 (5.9%) | 167.0 |
| Total | 34 (100.0%) | 59.0 |
Fertility by Education by Marriage Status in Union City
32.4% of women with births in Union City are unmarried. Women with the educational attainment of high school diploma are most likely to be married with 100.0% of them married at childbirth, while women with the educational attainment of less than high school are least likely to be married with 100.0% of them unmarried at childbirth.
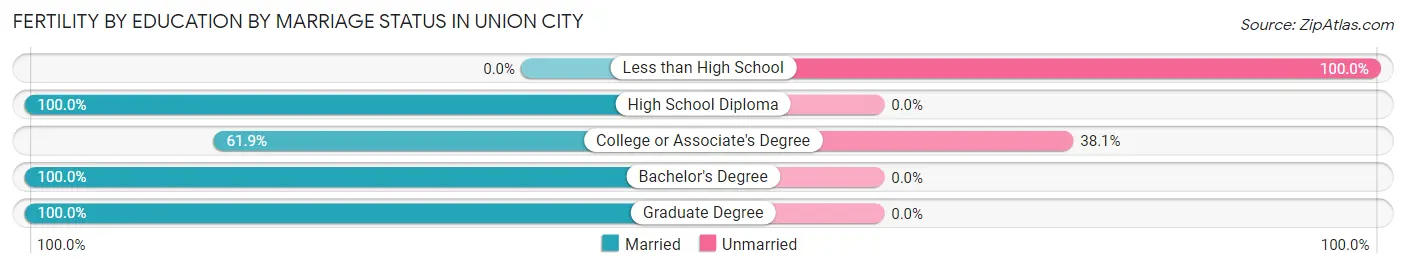
| Educational Attainment | Married | Unmarried |
| Less than High School | 0 (0.0%) | 3 (100.0%) |
| High School Diploma | 2 (100.0%) | 0 (0.0%) |
| College or Associate's Degree | 13 (61.9%) | 8 (38.1%) |
| Bachelor's Degree | 6 (100.0%) | 0 (0.0%) |
| Graduate Degree | 2 (100.0%) | 0 (0.0%) |
| Total | 23 (67.6%) | 11 (32.4%) |
Employment Characteristics in Union City
Employment by Class of Employer in Union City
Among the 811 employed individuals in Union City, private company employees (568 | 70.0%), not-for-profit organizations (112 | 13.8%), and self-employed (not incorporated) (39 | 4.8%) make up the most common classes of employment.
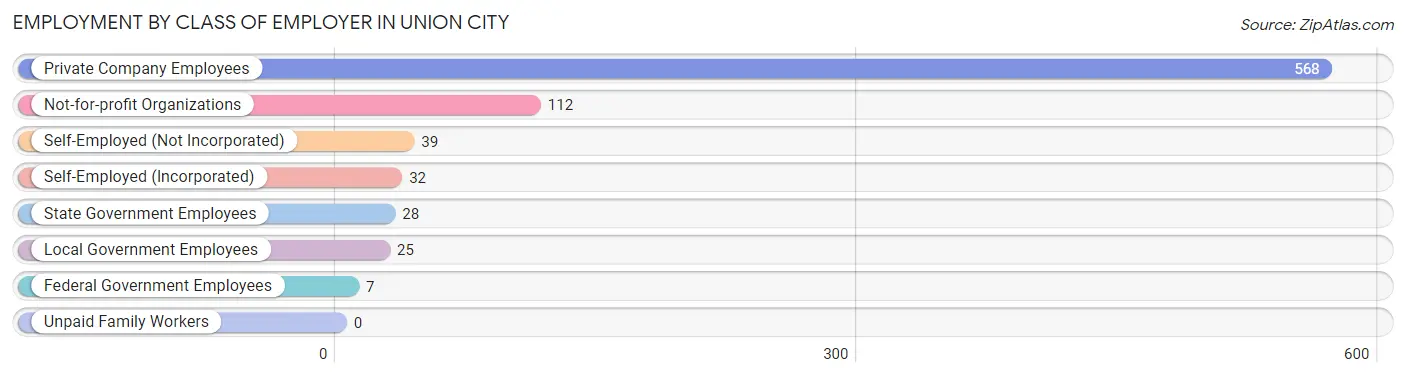
| Employer Class | # Employees | % Employees |
| Private Company Employees | 568 | 70.0% |
| Self-Employed (Incorporated) | 32 | 4.0% |
| Self-Employed (Not Incorporated) | 39 | 4.8% |
| Not-for-profit Organizations | 112 | 13.8% |
| Local Government Employees | 25 | 3.1% |
| State Government Employees | 28 | 3.5% |
| Federal Government Employees | 7 | 0.9% |
| Unpaid Family Workers | 0 | 0.0% |
| Total | 811 | 100.0% |
Employment Status by Age in Union City
According to the labor force statistics for Union City, out of the total population over 16 years of age (1,416), 63.0% or 892 individuals are in the labor force, with 6.2% or 55 of them unemployed. The age group with the highest labor force participation rate is 30 to 34 years, with 93.6% or 88 individuals in the labor force. Within the labor force, the 20 to 24 years age range has the highest percentage of unemployed individuals, with 23.4% or 18 of them being unemployed.
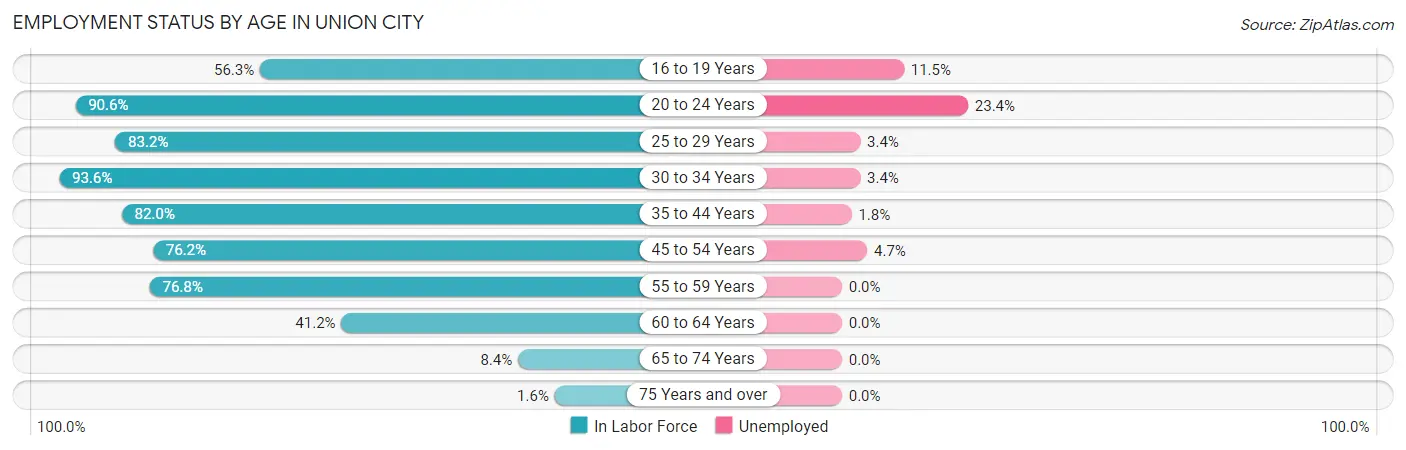
| Age Bracket | In Labor Force | Unemployed |
| 16 to 19 Years | 157 (56.3%) | 18 (11.5%) |
| 20 to 24 Years | 77 (90.6%) | 18 (23.4%) |
| 25 to 29 Years | 89 (83.2%) | 3 (3.4%) |
| 30 to 34 Years | 88 (93.6%) | 3 (3.4%) |
| 35 to 44 Years | 169 (82.0%) | 3 (1.8%) |
| 45 to 54 Years | 215 (76.2%) | 10 (4.7%) |
| 55 to 59 Years | 53 (76.8%) | 0 (0.0%) |
| 60 to 64 Years | 35 (41.2%) | 0 (0.0%) |
| 65 to 74 Years | 7 (8.4%) | 0 (0.0%) |
| 75 Years and over | 2 (1.6%) | 0 (0.0%) |
| Total | 892 (63.0%) | 55 (6.2%) |
Employment Status by Educational Attainment in Union City
According to labor force statistics for Union City, 77.0% of individuals (649) out of the total population between 25 and 64 years of age (843) are in the labor force, with 2.9% or 19 of them being unemployed. The group with the highest labor force participation rate are those with the educational attainment of bachelor's degree or higher, with 92.1% or 129 individuals in the labor force. Within the labor force, individuals with high school diploma education have the highest percentage of unemployment, with 4.6% or 10 of them being unemployed.
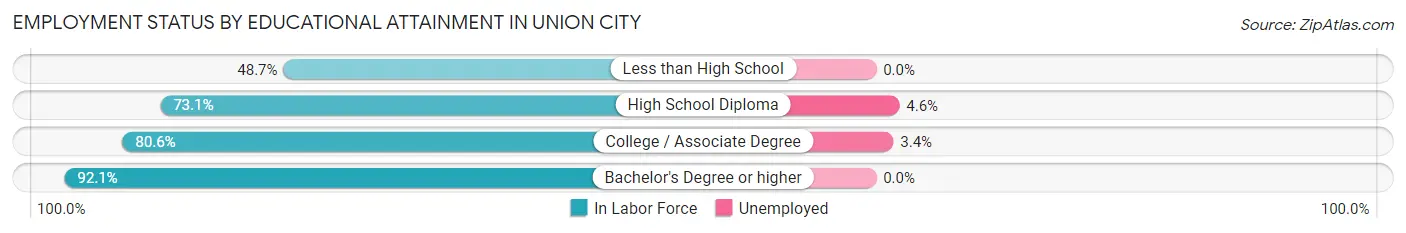
| Educational Attainment | In Labor Force | Unemployed |
| Less than High School | 37 (48.7%) | 0 (0.0%) |
| High School Diploma | 217 (73.1%) | 14 (4.6%) |
| College / Associate Degree | 266 (80.6%) | 11 (3.4%) |
| Bachelor's Degree or higher | 129 (92.1%) | 0 (0.0%) |
| Total | 649 (77.0%) | 24 (2.9%) |
Employment Occupations by Sex in Union City
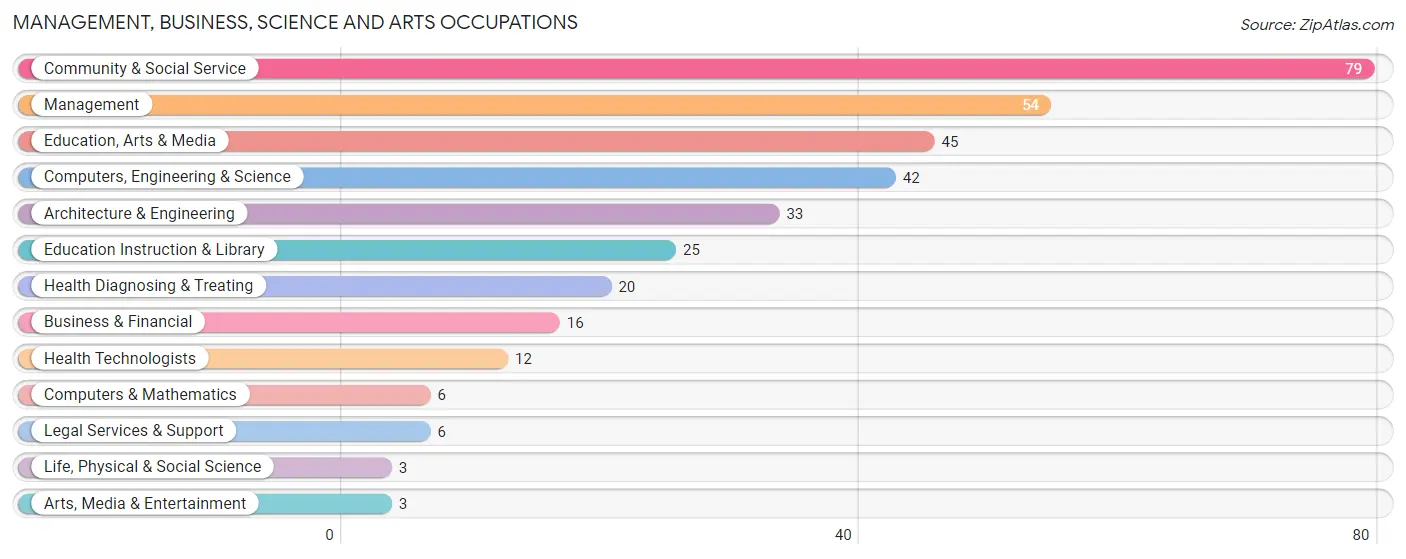
Management, Business, Science and Arts Occupations
The most common Management, Business, Science and Arts occupations in Union City are Community & Social Service (79 | 9.4%), Management (54 | 6.5%), Education, Arts & Media (45 | 5.4%), Computers, Engineering & Science (42 | 5.0%), and Architecture & Engineering (33 | 3.9%).
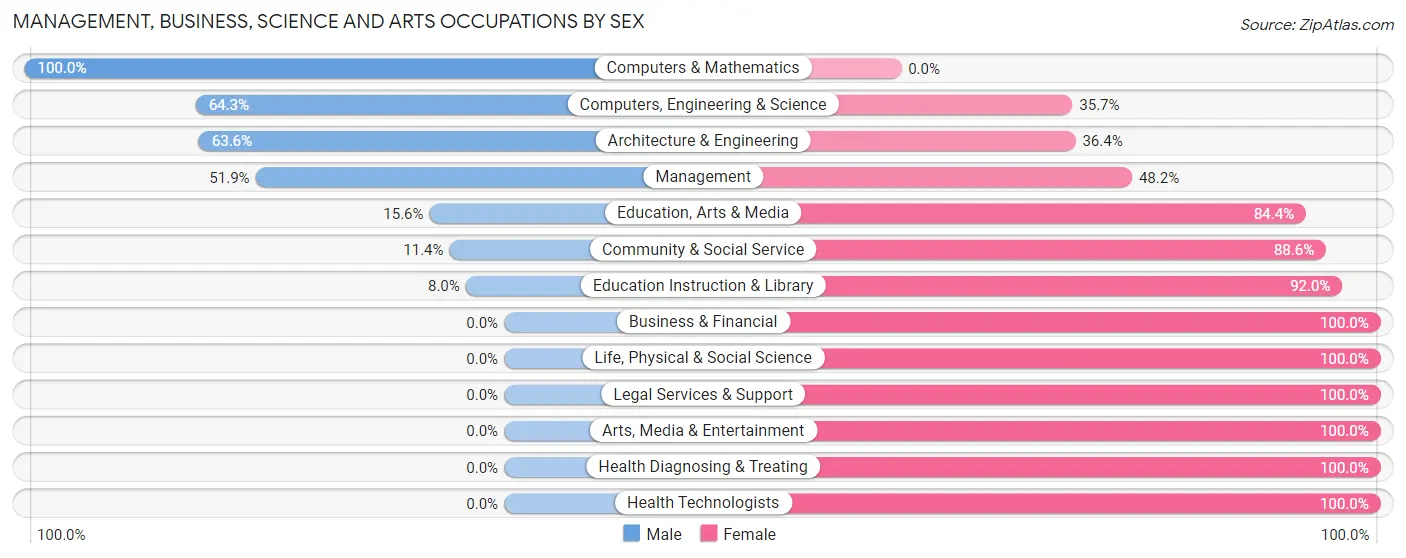
Management, Business, Science and Arts Occupations by Sex
Within the Management, Business, Science and Arts occupations in Union City, the most male-oriented occupations are Computers & Mathematics (100.0%), Computers, Engineering & Science (64.3%), and Architecture & Engineering (63.6%), while the most female-oriented occupations are Business & Financial (100.0%), Life, Physical & Social Science (100.0%), and Legal Services & Support (100.0%).
| Occupation | Male | Female |
| Management | 28 (51.8%) | 26 (48.1%) |
| Business & Financial | 0 (0.0%) | 16 (100.0%) |
| Computers, Engineering & Science | 27 (64.3%) | 15 (35.7%) |
| Computers & Mathematics | 6 (100.0%) | 0 (0.0%) |
| Architecture & Engineering | 21 (63.6%) | 12 (36.4%) |
| Life, Physical & Social Science | 0 (0.0%) | 3 (100.0%) |
| Community & Social Service | 9 (11.4%) | 70 (88.6%) |
| Education, Arts & Media | 7 (15.6%) | 38 (84.4%) |
| Legal Services & Support | 0 (0.0%) | 6 (100.0%) |
| Education Instruction & Library | 2 (8.0%) | 23 (92.0%) |
| Arts, Media & Entertainment | 0 (0.0%) | 3 (100.0%) |
| Health Diagnosing & Treating | 0 (0.0%) | 20 (100.0%) |
| Health Technologists | 0 (0.0%) | 12 (100.0%) |
| Total (Category) | 64 (30.3%) | 147 (69.7%) |
| Total (Overall) | 345 (41.2%) | 492 (58.8%) |
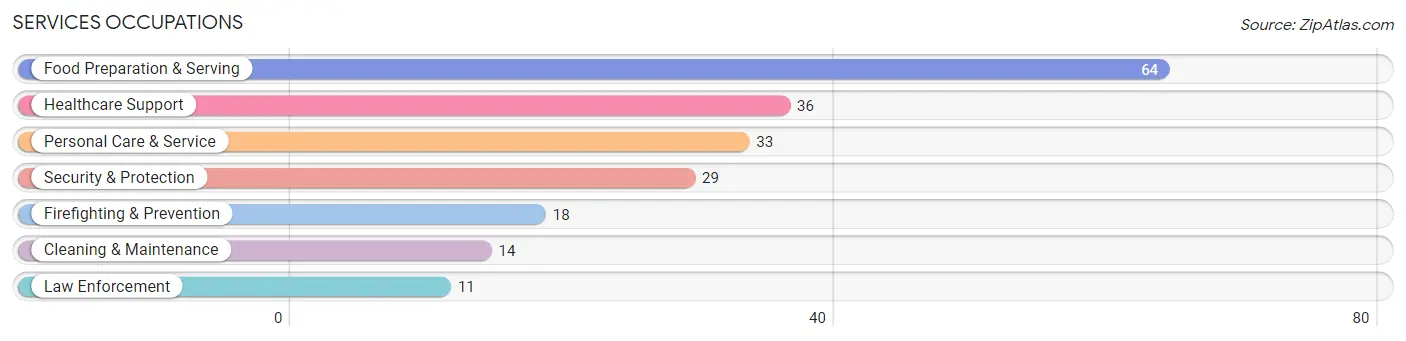
Services Occupations
The most common Services occupations in Union City are Food Preparation & Serving (64 | 7.6%), Healthcare Support (36 | 4.3%), Personal Care & Service (33 | 3.9%), Security & Protection (29 | 3.5%), and Firefighting & Prevention (18 | 2.1%).
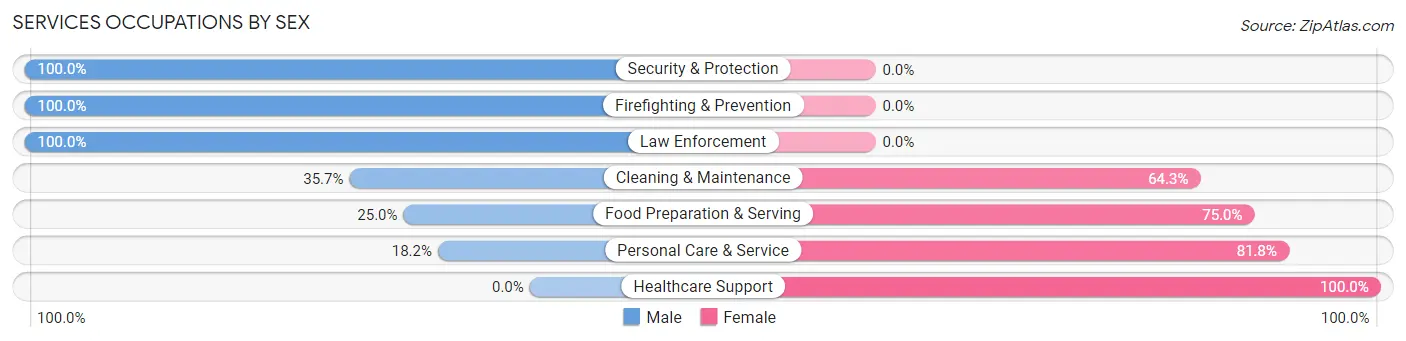
Services Occupations by Sex
Within the Services occupations in Union City, the most male-oriented occupations are Security & Protection (100.0%), Firefighting & Prevention (100.0%), and Law Enforcement (100.0%), while the most female-oriented occupations are Healthcare Support (100.0%), Personal Care & Service (81.8%), and Food Preparation & Serving (75.0%).
| Occupation | Male | Female |
| Healthcare Support | 0 (0.0%) | 36 (100.0%) |
| Security & Protection | 29 (100.0%) | 0 (0.0%) |
| Firefighting & Prevention | 18 (100.0%) | 0 (0.0%) |
| Law Enforcement | 11 (100.0%) | 0 (0.0%) |
| Food Preparation & Serving | 16 (25.0%) | 48 (75.0%) |
| Cleaning & Maintenance | 5 (35.7%) | 9 (64.3%) |
| Personal Care & Service | 6 (18.2%) | 27 (81.8%) |
| Total (Category) | 56 (31.8%) | 120 (68.2%) |
| Total (Overall) | 345 (41.2%) | 492 (58.8%) |
Sales and Office Occupations
The most common Sales and Office occupations in Union City are Sales & Related (171 | 20.4%), and Office & Administration (59 | 7.0%).
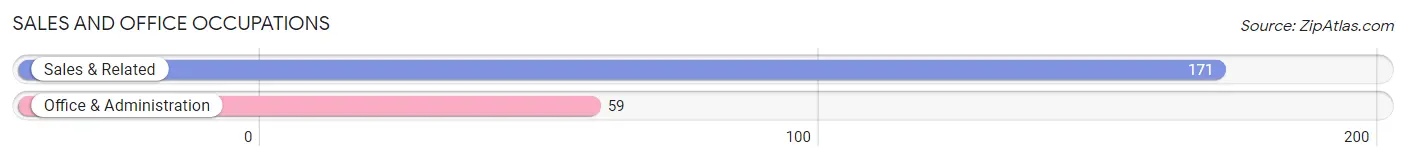
Sales and Office Occupations by Sex
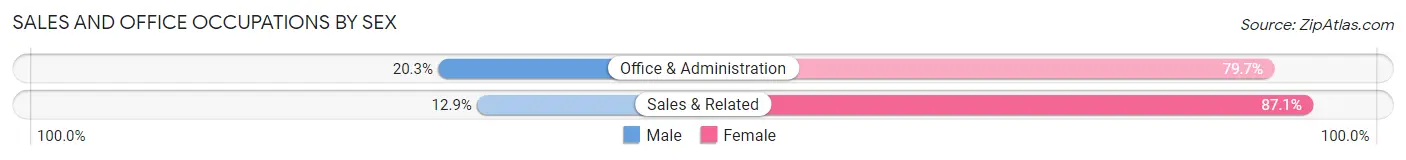
| Occupation | Male | Female |
| Sales & Related | 22 (12.9%) | 149 (87.1%) |
| Office & Administration | 12 (20.3%) | 47 (79.7%) |
| Total (Category) | 34 (14.8%) | 196 (85.2%) |
| Total (Overall) | 345 (41.2%) | 492 (58.8%) |
Natural Resources, Construction and Maintenance Occupations
The most common Natural Resources, Construction and Maintenance occupations in Union City are Installation, Maintenance & Repair (33 | 3.9%), and Construction & Extraction (27 | 3.2%).
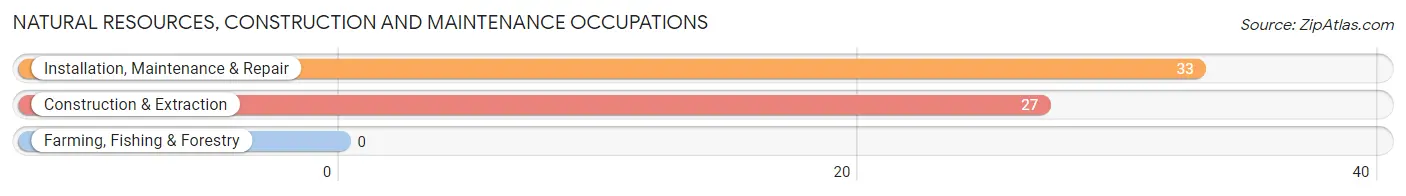
Natural Resources, Construction and Maintenance Occupations by Sex
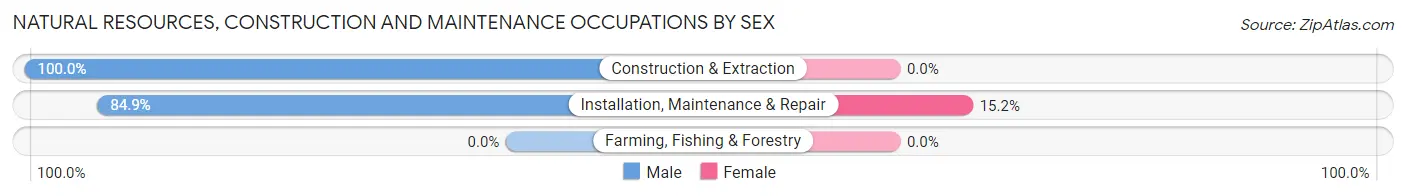
| Occupation | Male | Female |
| Farming, Fishing & Forestry | 0 (0.0%) | 0 (0.0%) |
| Construction & Extraction | 27 (100.0%) | 0 (0.0%) |
| Installation, Maintenance & Repair | 28 (84.9%) | 5 (15.1%) |
| Total (Category) | 55 (91.7%) | 5 (8.3%) |
| Total (Overall) | 345 (41.2%) | 492 (58.8%) |
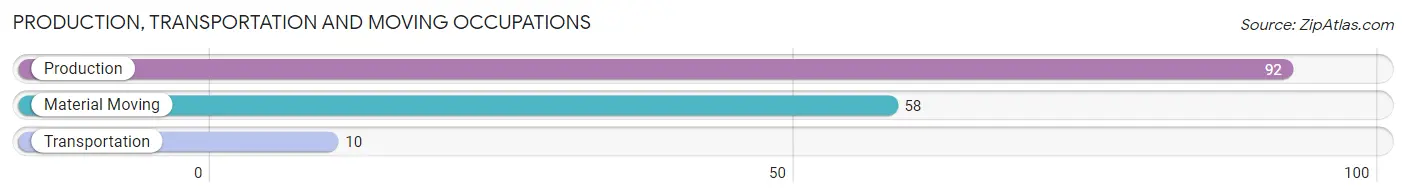
Production, Transportation and Moving Occupations
The most common Production, Transportation and Moving occupations in Union City are Production (92 | 11.0%), Material Moving (58 | 6.9%), and Transportation (10 | 1.2%).
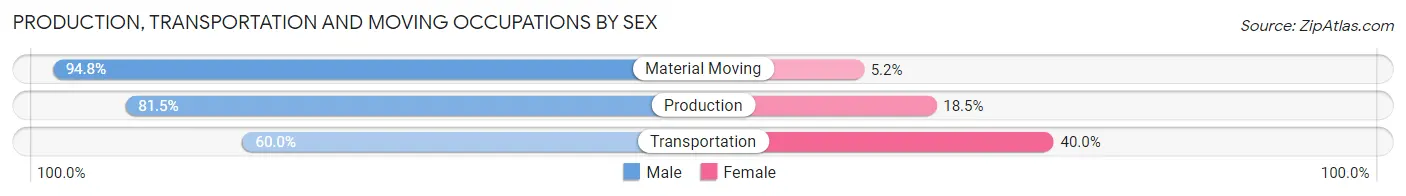
Production, Transportation and Moving Occupations by Sex
| Occupation | Male | Female |
| Production | 75 (81.5%) | 17 (18.5%) |
| Transportation | 6 (60.0%) | 4 (40.0%) |
| Material Moving | 55 (94.8%) | 3 (5.2%) |
| Total (Category) | 136 (85.0%) | 24 (15.0%) |
| Total (Overall) | 345 (41.2%) | 492 (58.8%) |
Employment Industries by Sex in Union City
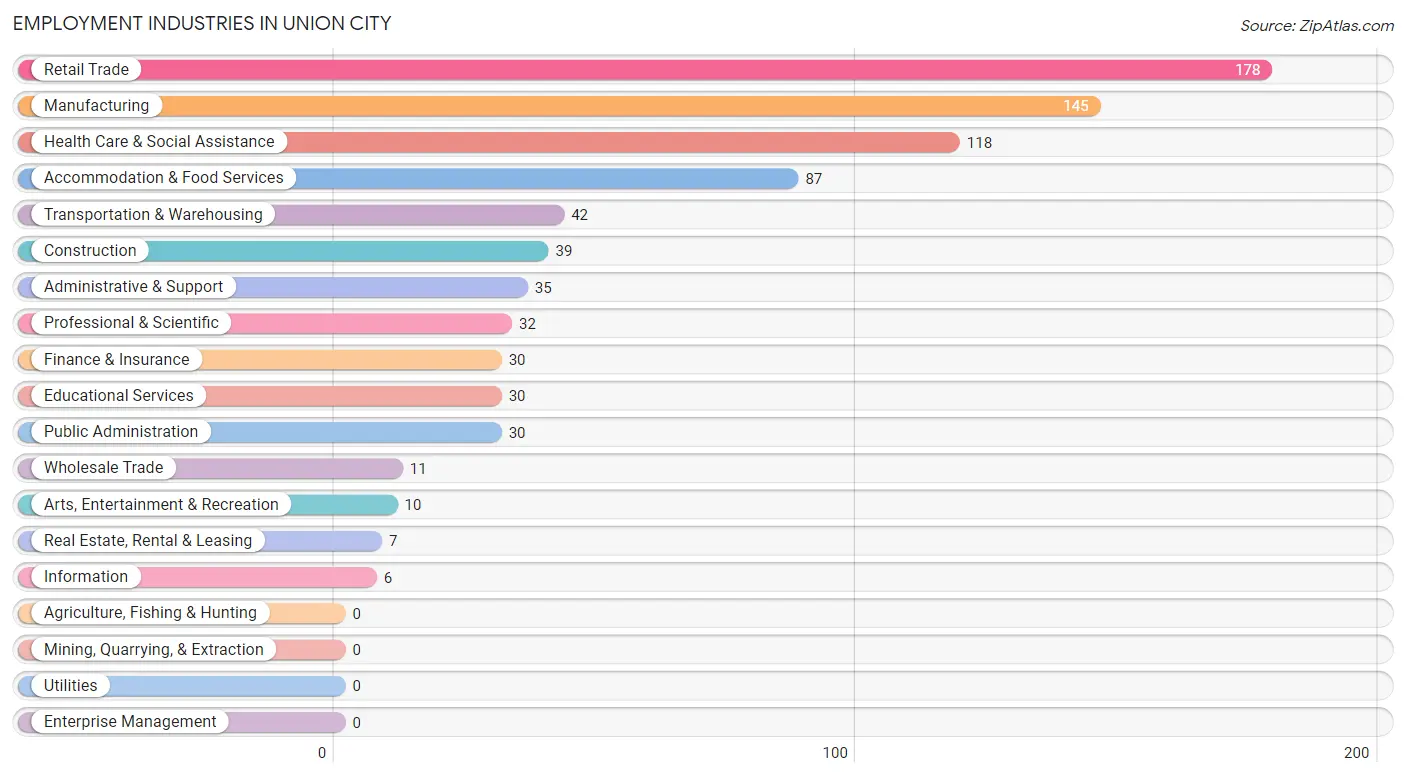
Employment Industries in Union City
The major employment industries in Union City include Retail Trade (178 | 21.3%), Manufacturing (145 | 17.3%), Health Care & Social Assistance (118 | 14.1%), Accommodation & Food Services (87 | 10.4%), and Transportation & Warehousing (42 | 5.0%).
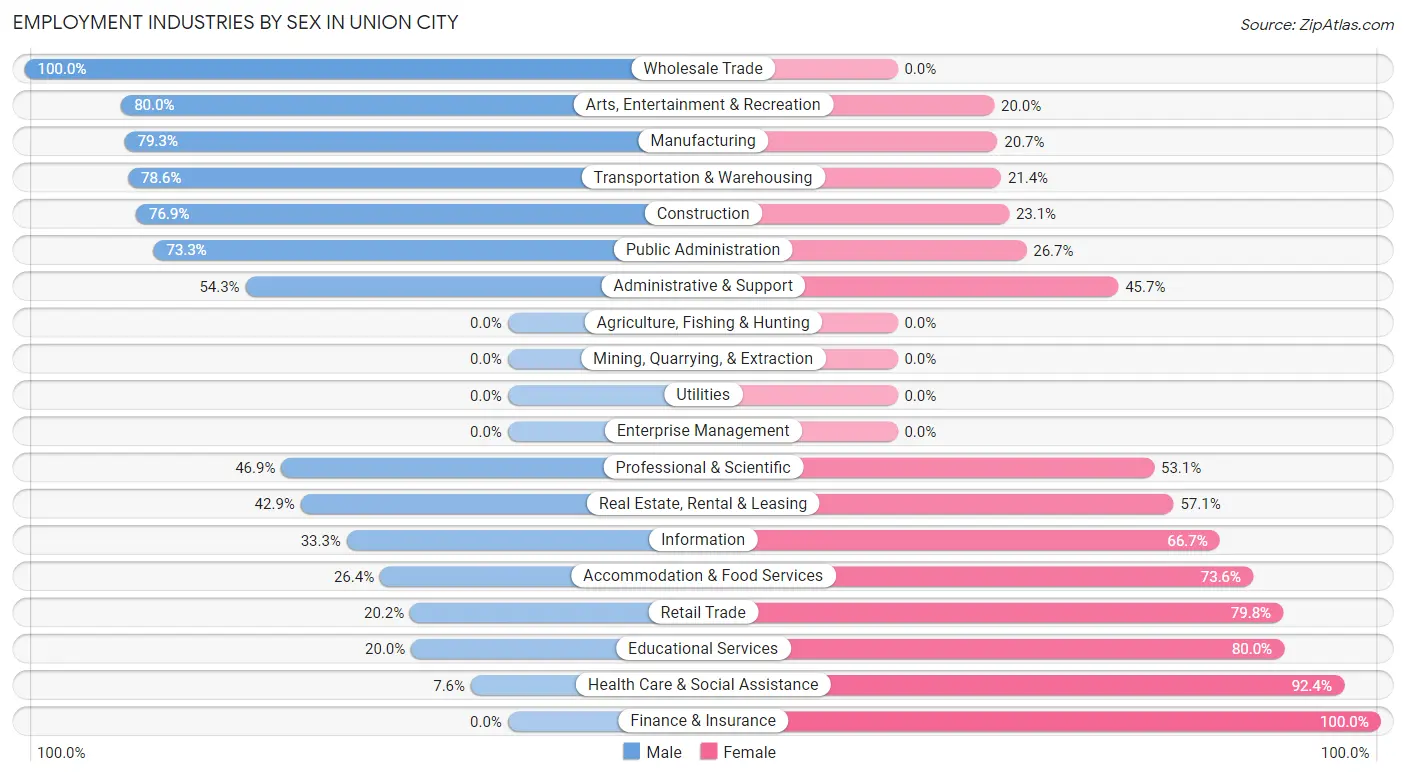
Employment Industries by Sex in Union City
The Union City industries that see more men than women are Wholesale Trade (100.0%), Arts, Entertainment & Recreation (80.0%), and Manufacturing (79.3%), whereas the industries that tend to have a higher number of women are Finance & Insurance (100.0%), Health Care & Social Assistance (92.4%), and Educational Services (80.0%).
| Industry | Male | Female |
| Agriculture, Fishing & Hunting | 0 (0.0%) | 0 (0.0%) |
| Mining, Quarrying, & Extraction | 0 (0.0%) | 0 (0.0%) |
| Construction | 30 (76.9%) | 9 (23.1%) |
| Manufacturing | 115 (79.3%) | 30 (20.7%) |
| Wholesale Trade | 11 (100.0%) | 0 (0.0%) |
| Retail Trade | 36 (20.2%) | 142 (79.8%) |
| Transportation & Warehousing | 33 (78.6%) | 9 (21.4%) |
| Utilities | 0 (0.0%) | 0 (0.0%) |
| Information | 2 (33.3%) | 4 (66.7%) |
| Finance & Insurance | 0 (0.0%) | 30 (100.0%) |
| Real Estate, Rental & Leasing | 3 (42.9%) | 4 (57.1%) |
| Professional & Scientific | 15 (46.9%) | 17 (53.1%) |
| Enterprise Management | 0 (0.0%) | 0 (0.0%) |
| Administrative & Support | 19 (54.3%) | 16 (45.7%) |
| Educational Services | 6 (20.0%) | 24 (80.0%) |
| Health Care & Social Assistance | 9 (7.6%) | 109 (92.4%) |
| Arts, Entertainment & Recreation | 8 (80.0%) | 2 (20.0%) |
| Accommodation & Food Services | 23 (26.4%) | 64 (73.6%) |
| Public Administration | 22 (73.3%) | 8 (26.7%) |
| Total | 345 (41.2%) | 492 (58.8%) |
Education in Union City
School Enrollment in Union City
The most common levels of schooling among the 527 students in Union City are high school (216 | 41.0%), college / undergraduate (113 | 21.4%), and elementary school (83 | 15.8%).
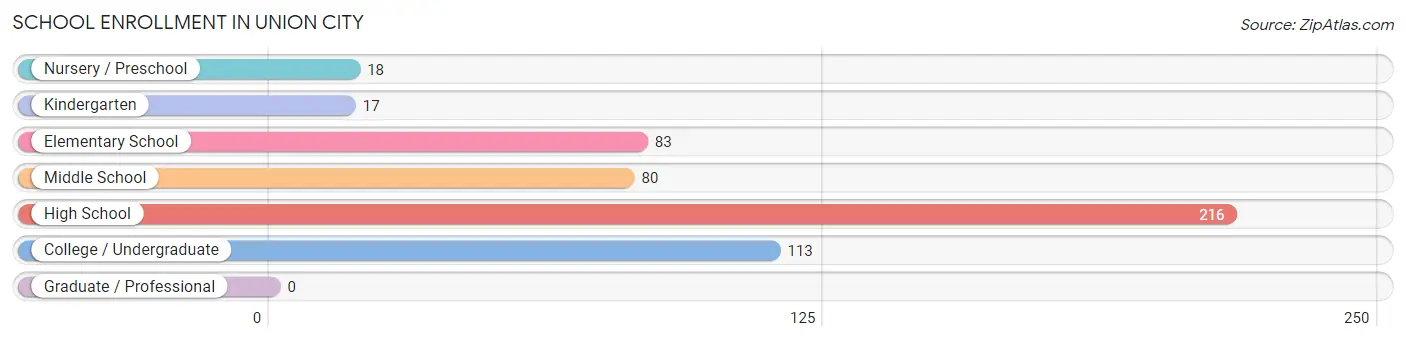
| School Level | # Students | % Students |
| Nursery / Preschool | 18 | 3.4% |
| Kindergarten | 17 | 3.2% |
| Elementary School | 83 | 15.8% |
| Middle School | 80 | 15.2% |
| High School | 216 | 41.0% |
| College / Undergraduate | 113 | 21.4% |
| Graduate / Professional | 0 | 0.0% |
| Total | 527 | 100.0% |
School Enrollment by Age by Funding Source in Union City
Out of a total of 527 students who are enrolled in schools in Union City, 45 (8.5%) attend a private institution, while the remaining 482 (91.5%) are enrolled in public schools. The age group of 25 to 34 year olds has the highest likelihood of being enrolled in private schools, with 3 (100.0% in the age bracket) enrolled. Conversely, the age group of 3 to 4 year olds has the lowest likelihood of being enrolled in a private school, with 6 (100.0% in the age bracket) attending a public institution.
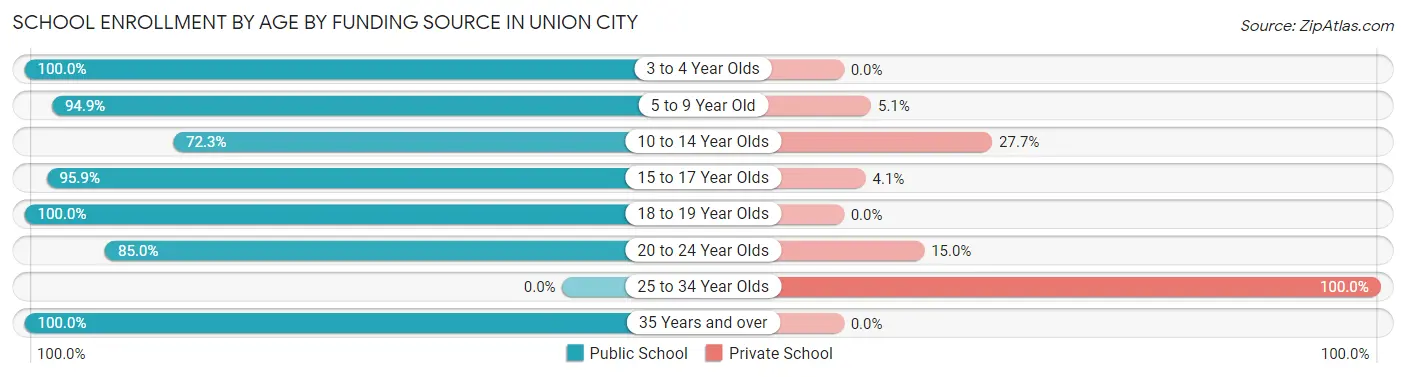
| Age Bracket | Public School | Private School |
| 3 to 4 Year Olds | 6 (100.0%) | 0 (0.0%) |
| 5 to 9 Year Old | 93 (94.9%) | 5 (5.1%) |
| 10 to 14 Year Olds | 68 (72.3%) | 26 (27.7%) |
| 15 to 17 Year Olds | 188 (95.9%) | 8 (4.1%) |
| 18 to 19 Year Olds | 108 (100.0%) | 0 (0.0%) |
| 20 to 24 Year Olds | 17 (85.0%) | 3 (15.0%) |
| 25 to 34 Year Olds | 0 (0.0%) | 3 (100.0%) |
| 35 Years and over | 2 (100.0%) | 0 (0.0%) |
| Total | 482 (91.5%) | 45 (8.5%) |
Educational Attainment by Field of Study in Union City
Business (52 | 27.8%), education (32 | 17.1%), arts & humanities (15 | 8.0%), computers & mathematics (14 | 7.5%), and social sciences (14 | 7.5%) are the most common fields of study among 187 individuals in Union City who have obtained a bachelor's degree or higher.
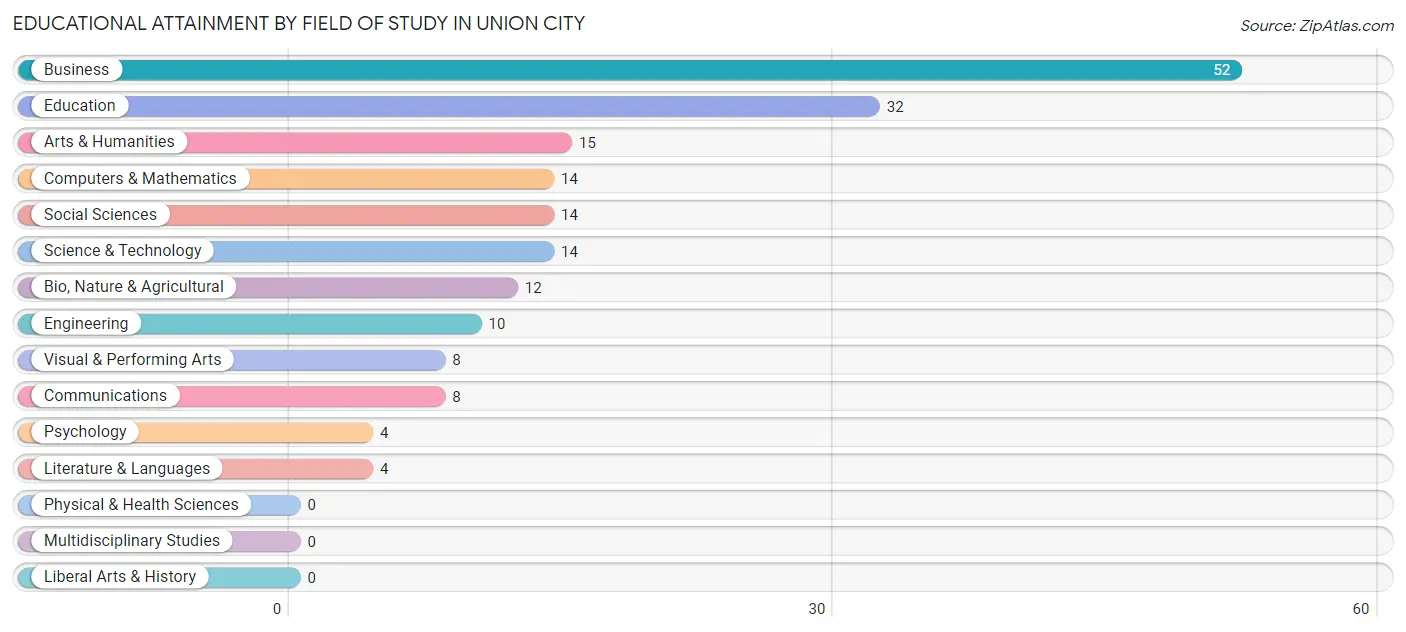
| Field of Study | # Graduates | % Graduates |
| Computers & Mathematics | 14 | 7.5% |
| Bio, Nature & Agricultural | 12 | 6.4% |
| Physical & Health Sciences | 0 | 0.0% |
| Psychology | 4 | 2.1% |
| Social Sciences | 14 | 7.5% |
| Engineering | 10 | 5.3% |
| Multidisciplinary Studies | 0 | 0.0% |
| Science & Technology | 14 | 7.5% |
| Business | 52 | 27.8% |
| Education | 32 | 17.1% |
| Literature & Languages | 4 | 2.1% |
| Liberal Arts & History | 0 | 0.0% |
| Visual & Performing Arts | 8 | 4.3% |
| Communications | 8 | 4.3% |
| Arts & Humanities | 15 | 8.0% |
| Total | 187 | 100.0% |
Transportation & Commute in Union City
Vehicle Availability by Sex in Union City
The most prevalent vehicle ownership categories in Union City are males with 2 vehicles (161, accounting for 47.5%) and females with 2 vehicles (169, making up 34.1%).
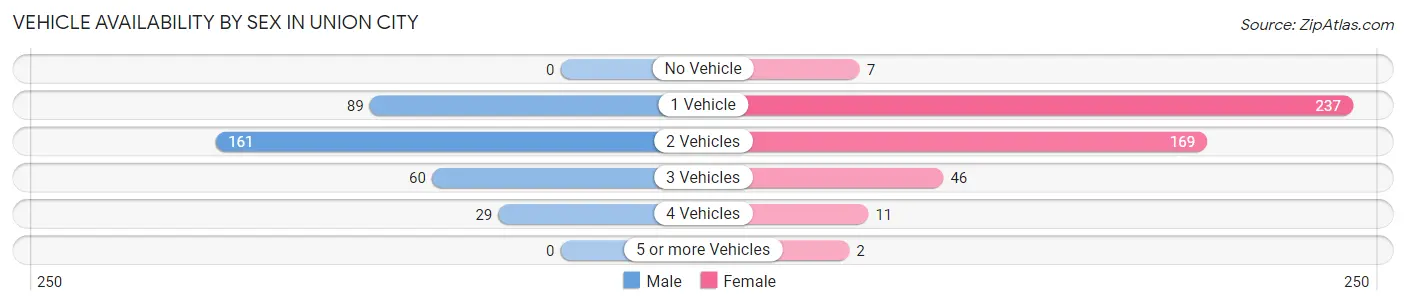
| Vehicles Available | Male | Female |
| No Vehicle | 0 (0.0%) | 7 (1.5%) |
| 1 Vehicle | 89 (26.3%) | 237 (50.2%) |
| 2 Vehicles | 161 (47.5%) | 169 (35.8%) |
| 3 Vehicles | 60 (17.7%) | 46 (9.8%) |
| 4 Vehicles | 29 (8.6%) | 11 (2.3%) |
| 5 or more Vehicles | 0 (0.0%) | 2 (0.4%) |
| Total | 339 (100.0%) | 472 (100.0%) |
Commute Time in Union City
The most frequently occuring commute durations in Union City are 30 to 34 minutes (177 commuters, 23.1%), 20 to 24 minutes (140 commuters, 18.3%), and 25 to 29 minutes (80 commuters, 10.5%).
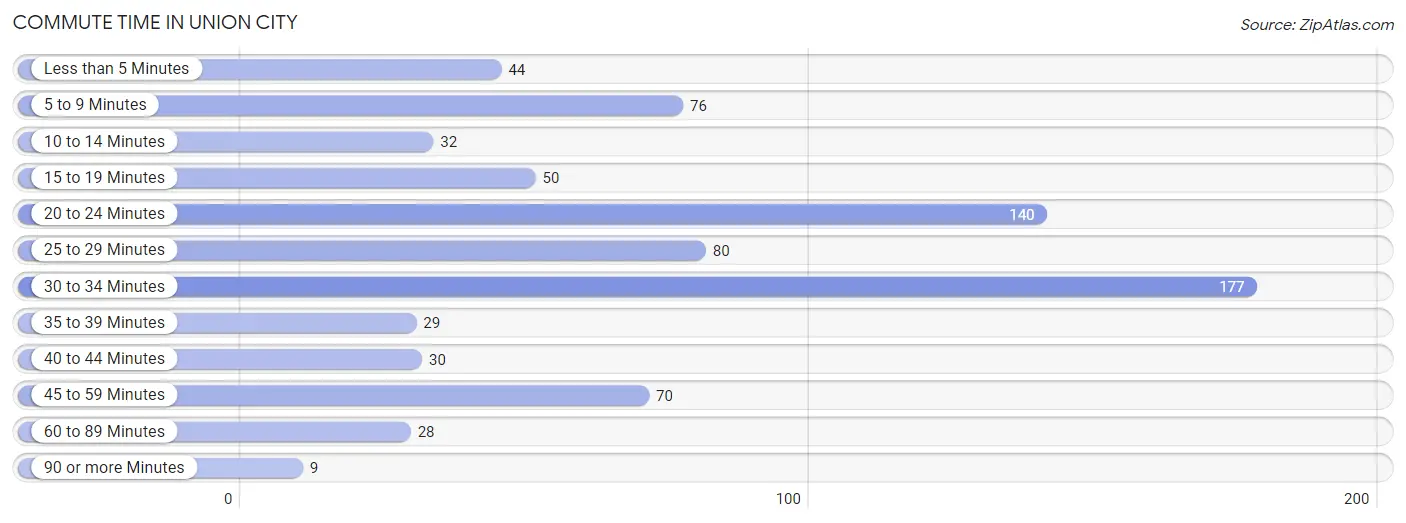
| Commute Time | # Commuters | % Commuters |
| Less than 5 Minutes | 44 | 5.8% |
| 5 to 9 Minutes | 76 | 9.9% |
| 10 to 14 Minutes | 32 | 4.2% |
| 15 to 19 Minutes | 50 | 6.5% |
| 20 to 24 Minutes | 140 | 18.3% |
| 25 to 29 Minutes | 80 | 10.5% |
| 30 to 34 Minutes | 177 | 23.1% |
| 35 to 39 Minutes | 29 | 3.8% |
| 40 to 44 Minutes | 30 | 3.9% |
| 45 to 59 Minutes | 70 | 9.1% |
| 60 to 89 Minutes | 28 | 3.7% |
| 90 or more Minutes | 9 | 1.2% |
Commute Time by Sex in Union City
The most common commute times in Union City are 20 to 24 minutes (62 commuters, 18.3%) for males and 30 to 34 minutes (127 commuters, 29.8%) for females.
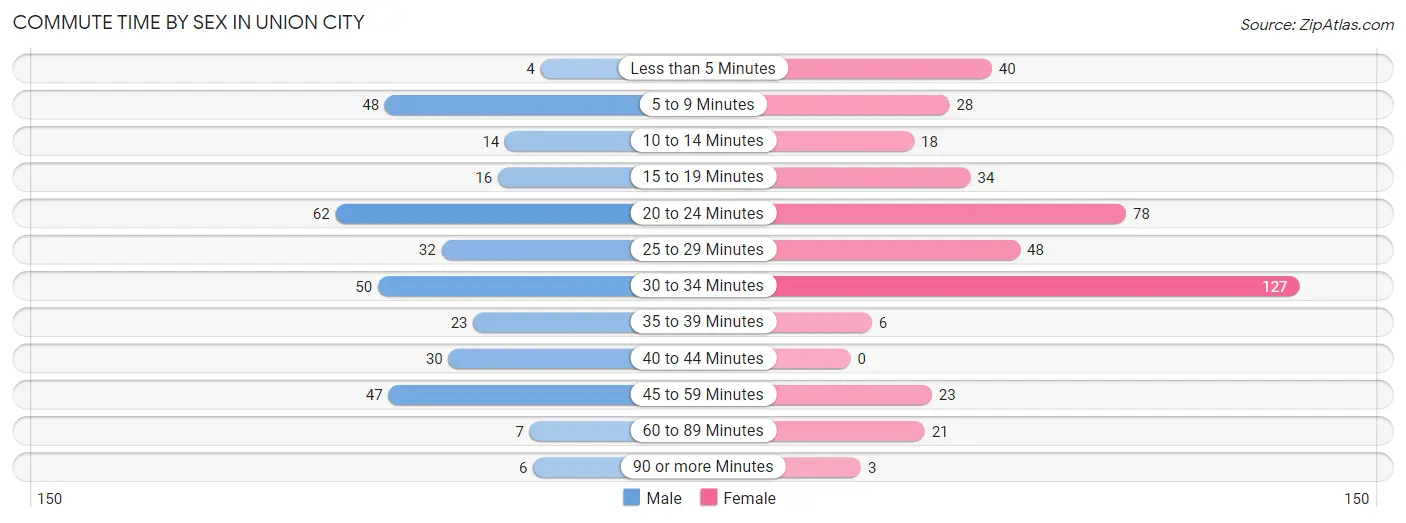
| Commute Time | Male | Female |
| Less than 5 Minutes | 4 (1.2%) | 40 (9.4%) |
| 5 to 9 Minutes | 48 (14.2%) | 28 (6.6%) |
| 10 to 14 Minutes | 14 (4.1%) | 18 (4.2%) |
| 15 to 19 Minutes | 16 (4.7%) | 34 (8.0%) |
| 20 to 24 Minutes | 62 (18.3%) | 78 (18.3%) |
| 25 to 29 Minutes | 32 (9.4%) | 48 (11.3%) |
| 30 to 34 Minutes | 50 (14.7%) | 127 (29.8%) |
| 35 to 39 Minutes | 23 (6.8%) | 6 (1.4%) |
| 40 to 44 Minutes | 30 (8.8%) | 0 (0.0%) |
| 45 to 59 Minutes | 47 (13.9%) | 23 (5.4%) |
| 60 to 89 Minutes | 7 (2.1%) | 21 (4.9%) |
| 90 or more Minutes | 6 (1.8%) | 3 (0.7%) |
Time of Departure to Work by Sex in Union City
The most frequent times of departure to work in Union City are 12:00 PM to 3:59 PM (58, 17.1%) for males and 12:00 PM to 3:59 PM (129, 30.3%) for females.
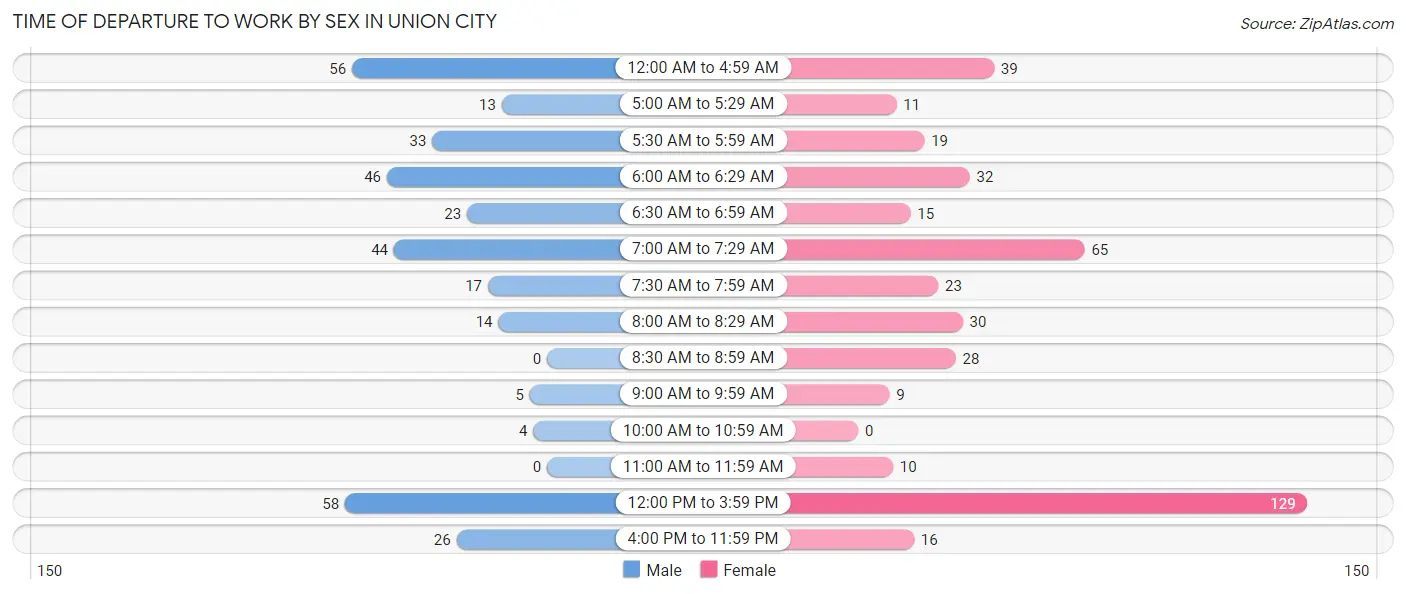
| Time of Departure | Male | Female |
| 12:00 AM to 4:59 AM | 56 (16.5%) | 39 (9.1%) |
| 5:00 AM to 5:29 AM | 13 (3.8%) | 11 (2.6%) |
| 5:30 AM to 5:59 AM | 33 (9.7%) | 19 (4.5%) |
| 6:00 AM to 6:29 AM | 46 (13.6%) | 32 (7.5%) |
| 6:30 AM to 6:59 AM | 23 (6.8%) | 15 (3.5%) |
| 7:00 AM to 7:29 AM | 44 (13.0%) | 65 (15.3%) |
| 7:30 AM to 7:59 AM | 17 (5.0%) | 23 (5.4%) |
| 8:00 AM to 8:29 AM | 14 (4.1%) | 30 (7.0%) |
| 8:30 AM to 8:59 AM | 0 (0.0%) | 28 (6.6%) |
| 9:00 AM to 9:59 AM | 5 (1.5%) | 9 (2.1%) |
| 10:00 AM to 10:59 AM | 4 (1.2%) | 0 (0.0%) |
| 11:00 AM to 11:59 AM | 0 (0.0%) | 10 (2.4%) |
| 12:00 PM to 3:59 PM | 58 (17.1%) | 129 (30.3%) |
| 4:00 PM to 11:59 PM | 26 (7.7%) | 16 (3.8%) |
| Total | 339 (100.0%) | 426 (100.0%) |
Housing Occupancy in Union City
Occupancy by Ownership in Union City
Of the total 689 dwellings in Union City, owner-occupied units account for 413 (59.9%), while renter-occupied units make up 276 (40.1%).
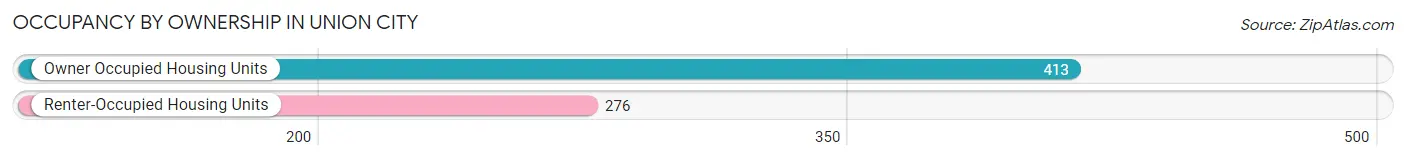
| Occupancy | # Housing Units | % Housing Units |
| Owner Occupied Housing Units | 413 | 59.9% |
| Renter-Occupied Housing Units | 276 | 40.1% |
| Total Occupied Housing Units | 689 | 100.0% |
Occupancy by Household Size in Union City
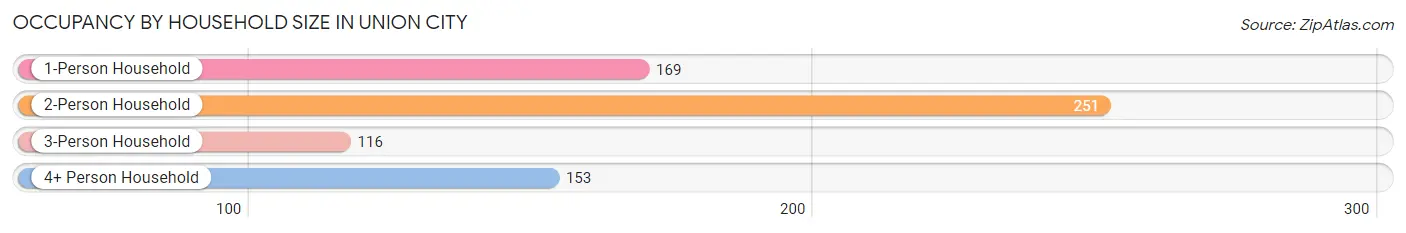
| Household Size | # Housing Units | % Housing Units |
| 1-Person Household | 169 | 24.5% |
| 2-Person Household | 251 | 36.4% |
| 3-Person Household | 116 | 16.8% |
| 4+ Person Household | 153 | 22.2% |
| Total Housing Units | 689 | 100.0% |
Occupancy by Ownership by Household Size in Union City
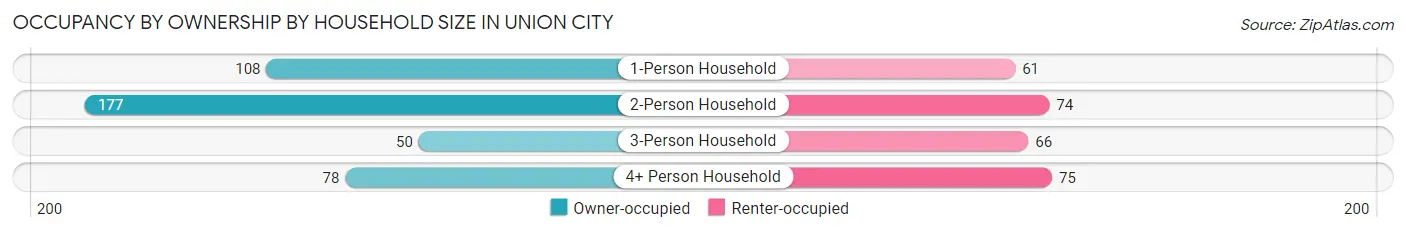
| Household Size | Owner-occupied | Renter-occupied |
| 1-Person Household | 108 (63.9%) | 61 (36.1%) |
| 2-Person Household | 177 (70.5%) | 74 (29.5%) |
| 3-Person Household | 50 (43.1%) | 66 (56.9%) |
| 4+ Person Household | 78 (51.0%) | 75 (49.0%) |
| Total Housing Units | 413 (59.9%) | 276 (40.1%) |
Occupancy by Educational Attainment in Union City
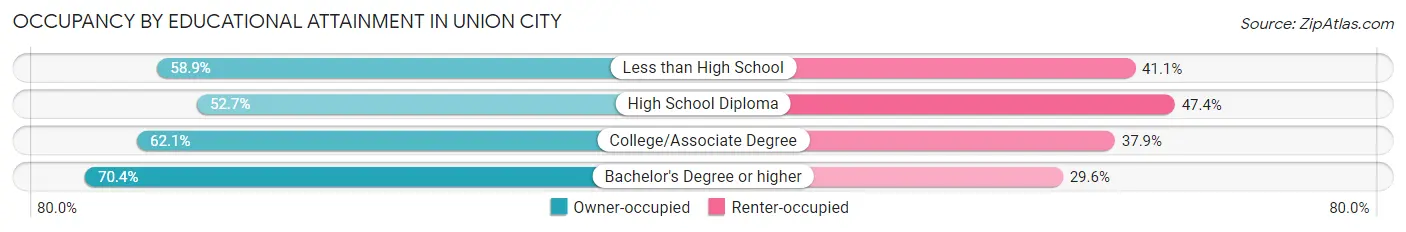
| Household Size | Owner-occupied | Renter-occupied |
| Less than High School | 33 (58.9%) | 23 (41.1%) |
| High School Diploma | 119 (52.6%) | 107 (47.3%) |
| College/Associate Degree | 192 (62.1%) | 117 (37.9%) |
| Bachelor's Degree or higher | 69 (70.4%) | 29 (29.6%) |
Occupancy by Age of Householder in Union City
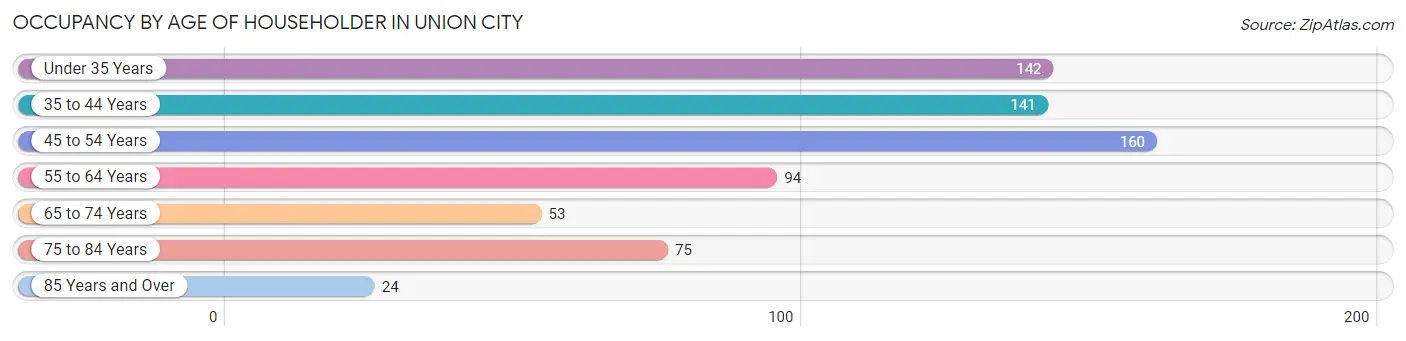
| Age Bracket | # Households | % Households |
| Under 35 Years | 142 | 20.6% |
| 35 to 44 Years | 141 | 20.5% |
| 45 to 54 Years | 160 | 23.2% |
| 55 to 64 Years | 94 | 13.6% |
| 65 to 74 Years | 53 | 7.7% |
| 75 to 84 Years | 75 | 10.9% |
| 85 Years and Over | 24 | 3.5% |
| Total | 689 | 100.0% |
Housing Finances in Union City
Median Income by Occupancy in Union City
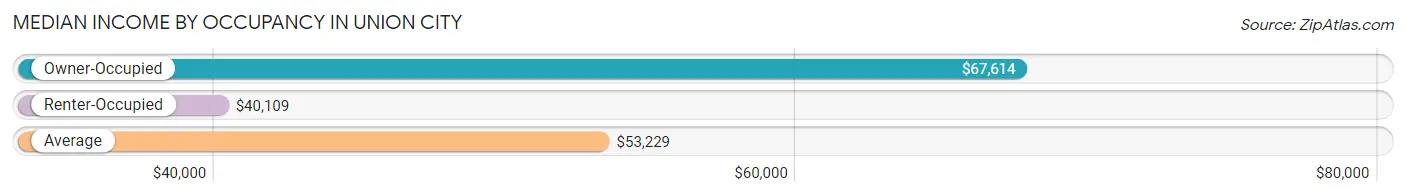
| Occupancy Type | # Households | Median Income |
| Owner-Occupied | 413 (59.9%) | $67,614 |
| Renter-Occupied | 276 (40.1%) | $40,109 |
| Average | 689 (100.0%) | $53,229 |
Occupancy by Householder Income Bracket in Union City
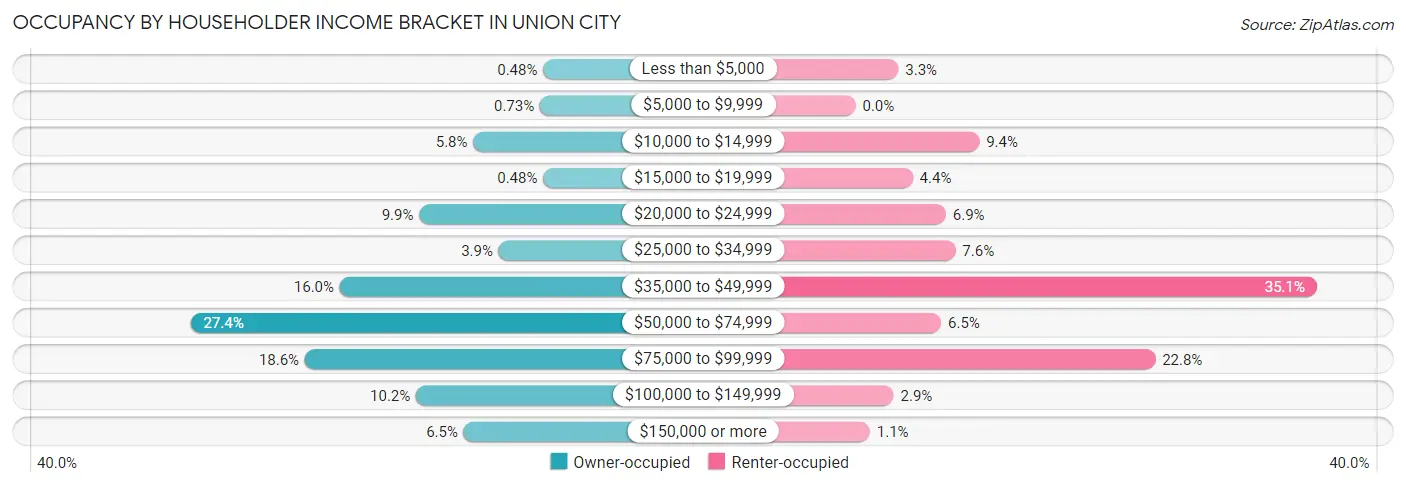
| Income Bracket | Owner-occupied | Renter-occupied |
| Less than $5,000 | 2 (0.5%) | 9 (3.3%) |
| $5,000 to $9,999 | 3 (0.7%) | 0 (0.0%) |
| $10,000 to $14,999 | 24 (5.8%) | 26 (9.4%) |
| $15,000 to $19,999 | 2 (0.5%) | 12 (4.3%) |
| $20,000 to $24,999 | 41 (9.9%) | 19 (6.9%) |
| $25,000 to $34,999 | 16 (3.9%) | 21 (7.6%) |
| $35,000 to $49,999 | 66 (16.0%) | 97 (35.1%) |
| $50,000 to $74,999 | 113 (27.4%) | 18 (6.5%) |
| $75,000 to $99,999 | 77 (18.6%) | 63 (22.8%) |
| $100,000 to $149,999 | 42 (10.2%) | 8 (2.9%) |
| $150,000 or more | 27 (6.5%) | 3 (1.1%) |
| Total | 413 (100.0%) | 276 (100.0%) |
Monthly Housing Cost Tiers in Union City
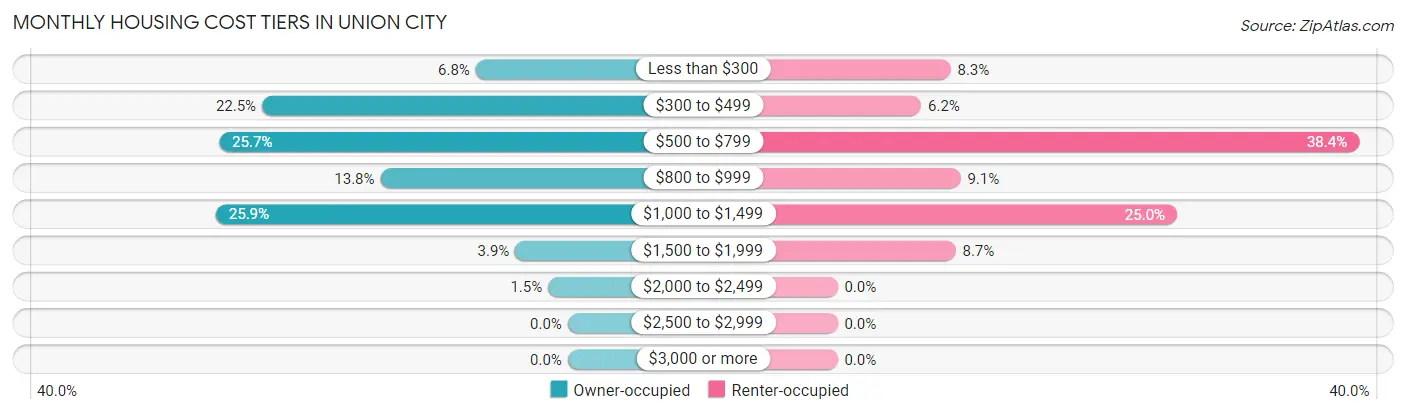
| Monthly Cost | Owner-occupied | Renter-occupied |
| Less than $300 | 28 (6.8%) | 23 (8.3%) |
| $300 to $499 | 93 (22.5%) | 17 (6.2%) |
| $500 to $799 | 106 (25.7%) | 106 (38.4%) |
| $800 to $999 | 57 (13.8%) | 25 (9.1%) |
| $1,000 to $1,499 | 107 (25.9%) | 69 (25.0%) |
| $1,500 to $1,999 | 16 (3.9%) | 24 (8.7%) |
| $2,000 to $2,499 | 6 (1.5%) | 0 (0.0%) |
| $2,500 to $2,999 | 0 (0.0%) | 0 (0.0%) |
| $3,000 or more | 0 (0.0%) | 0 (0.0%) |
| Total | 413 (100.0%) | 276 (100.0%) |
Physical Housing Characteristics in Union City
Housing Structures in Union City
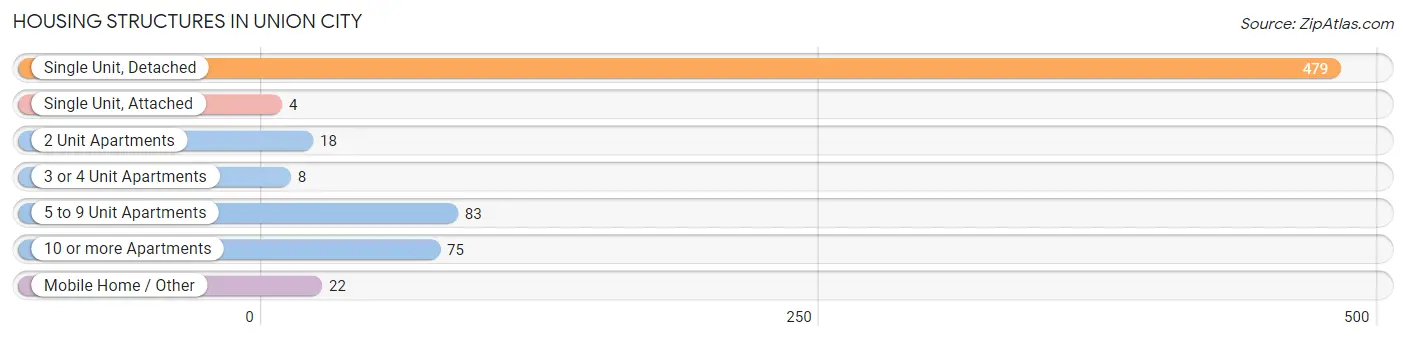
| Structure Type | # Housing Units | % Housing Units |
| Single Unit, Detached | 479 | 69.5% |
| Single Unit, Attached | 4 | 0.6% |
| 2 Unit Apartments | 18 | 2.6% |
| 3 or 4 Unit Apartments | 8 | 1.2% |
| 5 to 9 Unit Apartments | 83 | 12.0% |
| 10 or more Apartments | 75 | 10.9% |
| Mobile Home / Other | 22 | 3.2% |
| Total | 689 | 100.0% |
Housing Structures by Occupancy in Union City
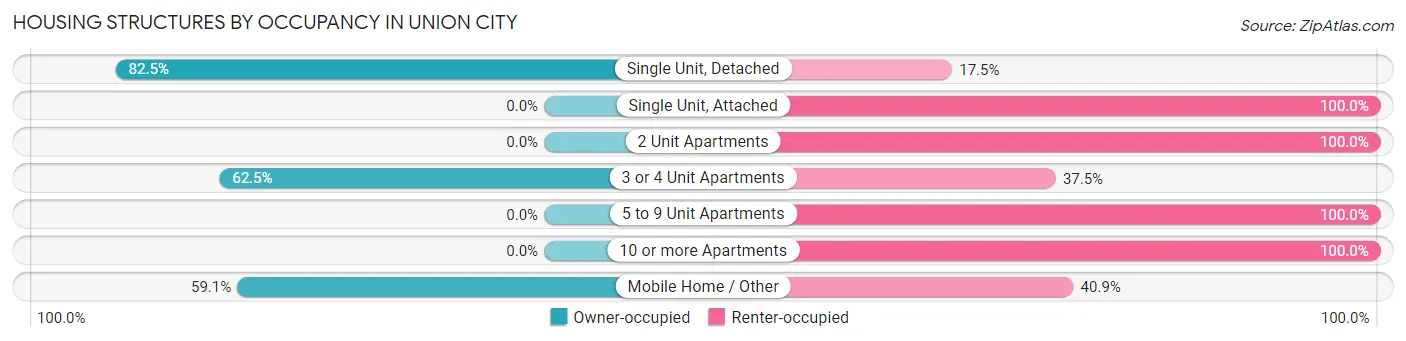
| Structure Type | Owner-occupied | Renter-occupied |
| Single Unit, Detached | 395 (82.5%) | 84 (17.5%) |
| Single Unit, Attached | 0 (0.0%) | 4 (100.0%) |
| 2 Unit Apartments | 0 (0.0%) | 18 (100.0%) |
| 3 or 4 Unit Apartments | 5 (62.5%) | 3 (37.5%) |
| 5 to 9 Unit Apartments | 0 (0.0%) | 83 (100.0%) |
| 10 or more Apartments | 0 (0.0%) | 75 (100.0%) |
| Mobile Home / Other | 13 (59.1%) | 9 (40.9%) |
| Total | 413 (59.9%) | 276 (40.1%) |
Housing Structures by Number of Rooms in Union City
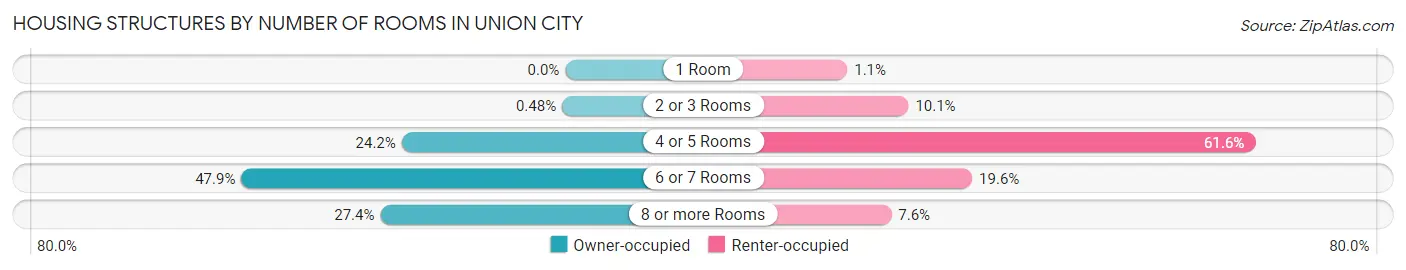
| Number of Rooms | Owner-occupied | Renter-occupied |
| 1 Room | 0 (0.0%) | 3 (1.1%) |
| 2 or 3 Rooms | 2 (0.5%) | 28 (10.1%) |
| 4 or 5 Rooms | 100 (24.2%) | 170 (61.6%) |
| 6 or 7 Rooms | 198 (47.9%) | 54 (19.6%) |
| 8 or more Rooms | 113 (27.4%) | 21 (7.6%) |
| Total | 413 (100.0%) | 276 (100.0%) |
Housing Structure by Heating Type in Union City
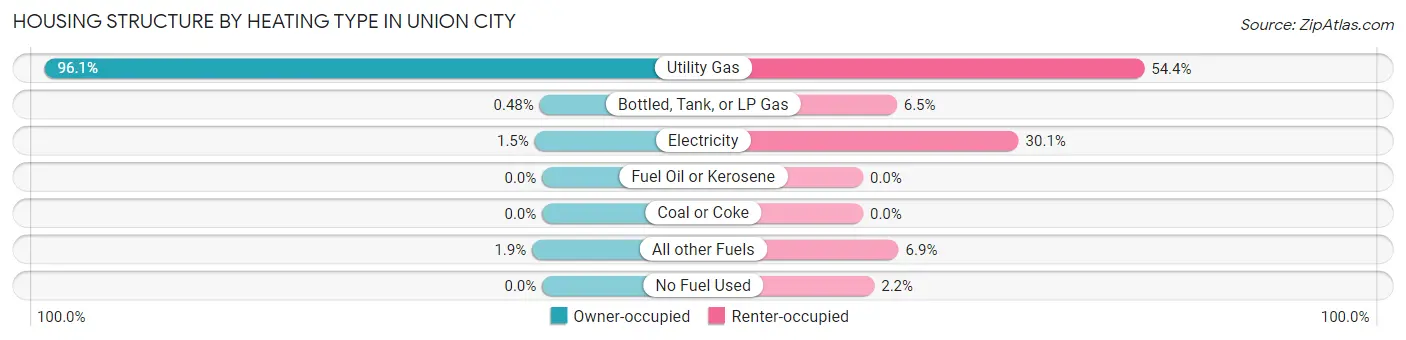
| Heating Type | Owner-occupied | Renter-occupied |
| Utility Gas | 397 (96.1%) | 150 (54.3%) |
| Bottled, Tank, or LP Gas | 2 (0.5%) | 18 (6.5%) |
| Electricity | 6 (1.5%) | 83 (30.1%) |
| Fuel Oil or Kerosene | 0 (0.0%) | 0 (0.0%) |
| Coal or Coke | 0 (0.0%) | 0 (0.0%) |
| All other Fuels | 8 (1.9%) | 19 (6.9%) |
| No Fuel Used | 0 (0.0%) | 6 (2.2%) |
| Total | 413 (100.0%) | 276 (100.0%) |
Household Vehicle Usage in Union City
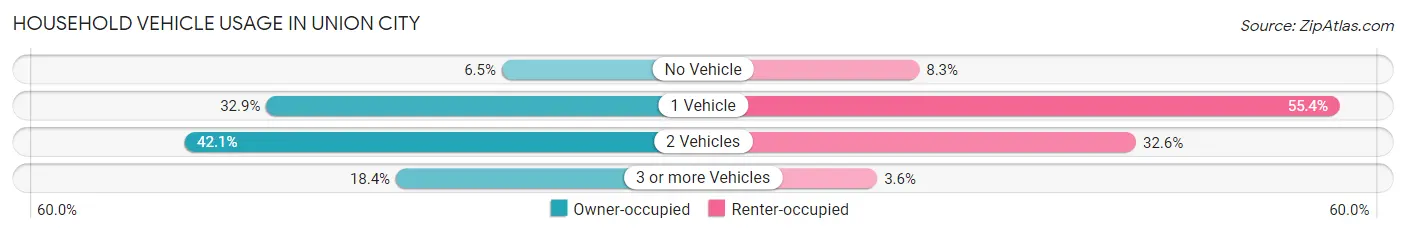
| Vehicles per Household | Owner-occupied | Renter-occupied |
| No Vehicle | 27 (6.5%) | 23 (8.3%) |
| 1 Vehicle | 136 (32.9%) | 153 (55.4%) |
| 2 Vehicles | 174 (42.1%) | 90 (32.6%) |
| 3 or more Vehicles | 76 (18.4%) | 10 (3.6%) |
| Total | 413 (100.0%) | 276 (100.0%) |
Real Estate & Mortgages in Union City
Real Estate and Mortgage Overview in Union City
| Characteristic | Without Mortgage | With Mortgage |
| Housing Units | 203 | 210 |
| Median Property Value | $87,900 | $113,200 |
| Median Household Income | $47,708 | $23 |
| Monthly Housing Costs | $468 | $0 |
| Real Estate Taxes | $1,408 | $10 |
Property Value by Mortgage Status in Union City
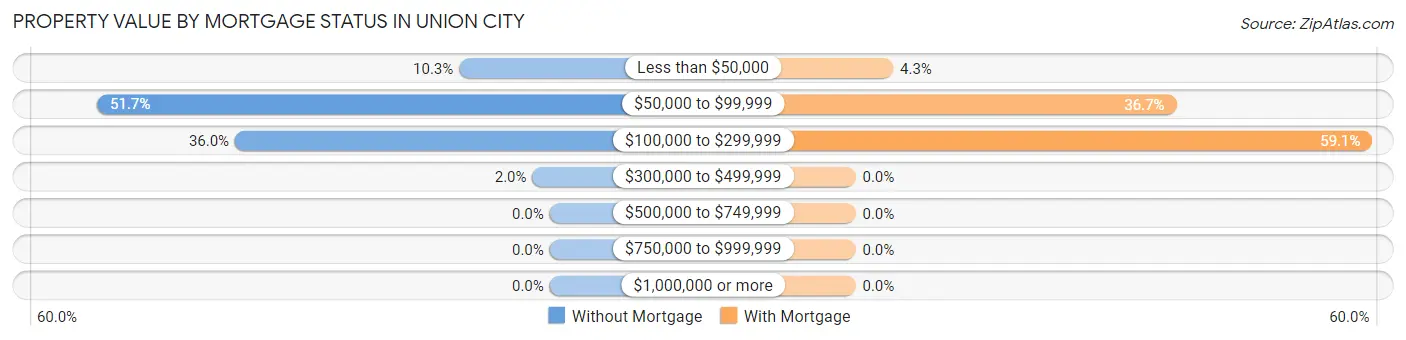
| Property Value | Without Mortgage | With Mortgage |
| Less than $50,000 | 21 (10.3%) | 9 (4.3%) |
| $50,000 to $99,999 | 105 (51.7%) | 77 (36.7%) |
| $100,000 to $299,999 | 73 (36.0%) | 124 (59.1%) |
| $300,000 to $499,999 | 4 (2.0%) | 0 (0.0%) |
| $500,000 to $749,999 | 0 (0.0%) | 0 (0.0%) |
| $750,000 to $999,999 | 0 (0.0%) | 0 (0.0%) |
| $1,000,000 or more | 0 (0.0%) | 0 (0.0%) |
| Total | 203 (100.0%) | 210 (100.0%) |
Household Income by Mortgage Status in Union City
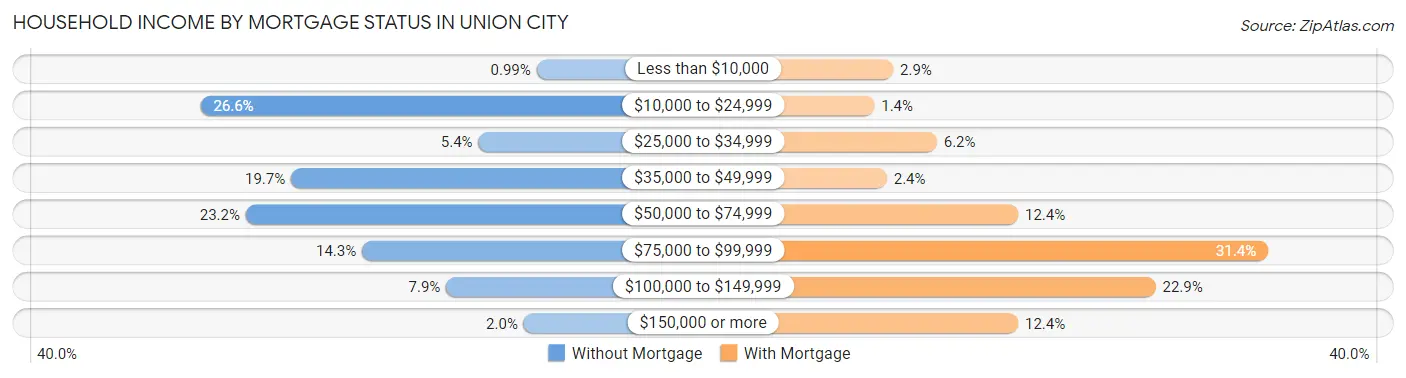
| Household Income | Without Mortgage | With Mortgage |
| Less than $10,000 | 2 (1.0%) | 6 (2.9%) |
| $10,000 to $24,999 | 54 (26.6%) | 3 (1.4%) |
| $25,000 to $34,999 | 11 (5.4%) | 13 (6.2%) |
| $35,000 to $49,999 | 40 (19.7%) | 5 (2.4%) |
| $50,000 to $74,999 | 47 (23.2%) | 26 (12.4%) |
| $75,000 to $99,999 | 29 (14.3%) | 66 (31.4%) |
| $100,000 to $149,999 | 16 (7.9%) | 48 (22.9%) |
| $150,000 or more | 4 (2.0%) | 26 (12.4%) |
| Total | 203 (100.0%) | 210 (100.0%) |
Property Value to Household Income Ratio in Union City
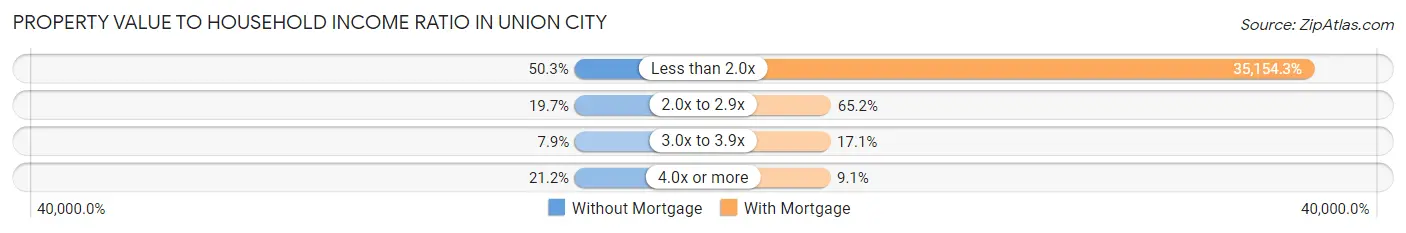
| Value-to-Income Ratio | Without Mortgage | With Mortgage |
| Less than 2.0x | 102 (50.2%) | 73,824 (35,154.3%) |
| 2.0x to 2.9x | 40 (19.7%) | 137 (65.2%) |
| 3.0x to 3.9x | 16 (7.9%) | 36 (17.1%) |
| 4.0x or more | 43 (21.2%) | 19 (9.0%) |
| Total | 203 (100.0%) | 210 (100.0%) |
Real Estate Taxes by Mortgage Status in Union City
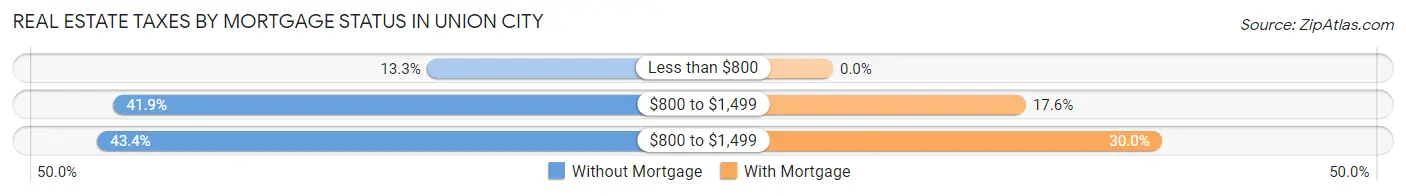
| Property Taxes | Without Mortgage | With Mortgage |
| Less than $800 | 27 (13.3%) | 0 (0.0%) |
| $800 to $1,499 | 85 (41.9%) | 37 (17.6%) |
| $800 to $1,499 | 88 (43.3%) | 63 (30.0%) |
| Total | 203 (100.0%) | 210 (100.0%) |
Health & Disability in Union City
Health Insurance Coverage by Age in Union City
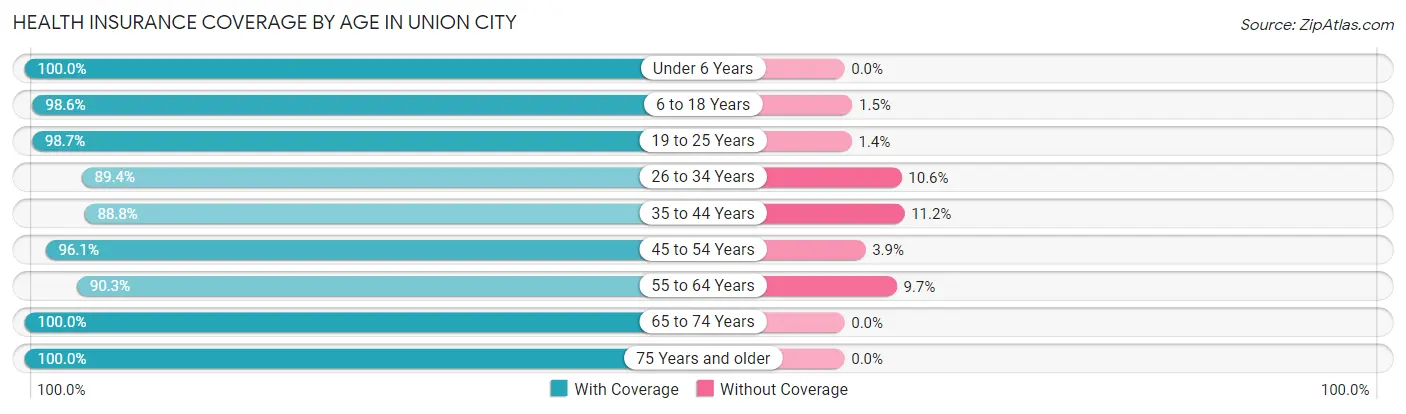
| Age Bracket | With Coverage | Without Coverage |
| Under 6 Years | 151 (100.0%) | 0 (0.0%) |
| 6 to 18 Years | 408 (98.6%) | 6 (1.5%) |
| 19 to 25 Years | 219 (98.7%) | 3 (1.3%) |
| 26 to 34 Years | 168 (89.4%) | 20 (10.6%) |
| 35 to 44 Years | 183 (88.8%) | 23 (11.2%) |
| 45 to 54 Years | 271 (96.1%) | 11 (3.9%) |
| 55 to 64 Years | 139 (90.3%) | 15 (9.7%) |
| 65 to 74 Years | 83 (100.0%) | 0 (0.0%) |
| 75 Years and older | 126 (100.0%) | 0 (0.0%) |
| Total | 1,748 (95.7%) | 78 (4.3%) |
Health Insurance Coverage by Citizenship Status in Union City
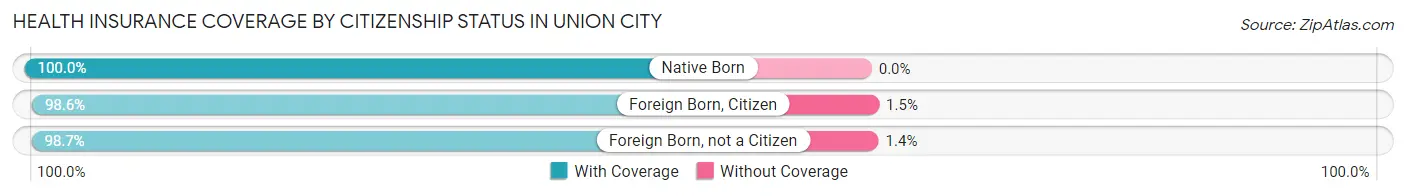
| Citizenship Status | With Coverage | Without Coverage |
| Native Born | 151 (100.0%) | 0 (0.0%) |
| Foreign Born, Citizen | 408 (98.6%) | 6 (1.5%) |
| Foreign Born, not a Citizen | 219 (98.7%) | 3 (1.3%) |
Health Insurance Coverage by Household Income in Union City
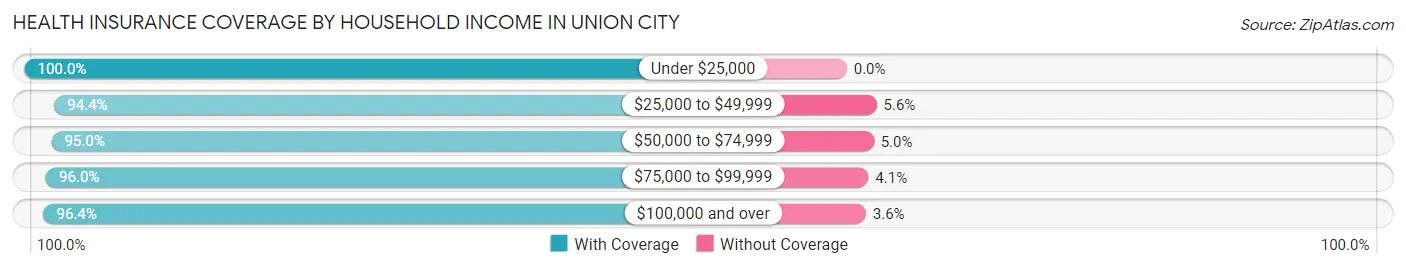
| Household Income | With Coverage | Without Coverage |
| Under $25,000 | 200 (100.0%) | 0 (0.0%) |
| $25,000 to $49,999 | 540 (94.4%) | 32 (5.6%) |
| $50,000 to $74,999 | 433 (95.0%) | 23 (5.0%) |
| $75,000 to $99,999 | 332 (96.0%) | 14 (4.1%) |
| $100,000 and over | 243 (96.4%) | 9 (3.6%) |
Public vs Private Health Insurance Coverage by Age in Union City
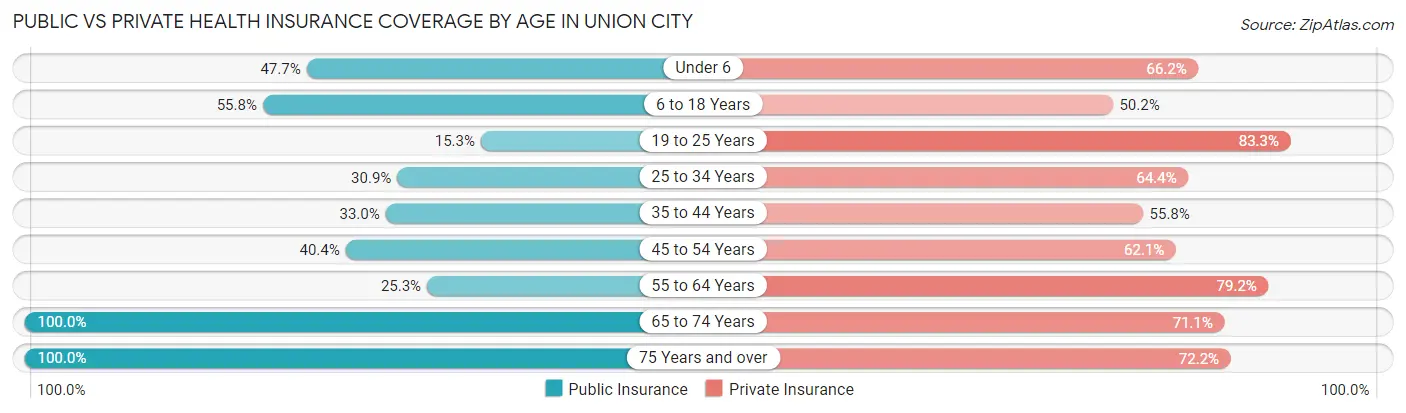
| Age Bracket | Public Insurance | Private Insurance |
| Under 6 | 72 (47.7%) | 100 (66.2%) |
| 6 to 18 Years | 231 (55.8%) | 208 (50.2%) |
| 19 to 25 Years | 34 (15.3%) | 185 (83.3%) |
| 25 to 34 Years | 58 (30.8%) | 121 (64.4%) |
| 35 to 44 Years | 68 (33.0%) | 115 (55.8%) |
| 45 to 54 Years | 114 (40.4%) | 175 (62.1%) |
| 55 to 64 Years | 39 (25.3%) | 122 (79.2%) |
| 65 to 74 Years | 83 (100.0%) | 59 (71.1%) |
| 75 Years and over | 126 (100.0%) | 91 (72.2%) |
| Total | 825 (45.2%) | 1,176 (64.4%) |
Disability Status by Sex by Age in Union City
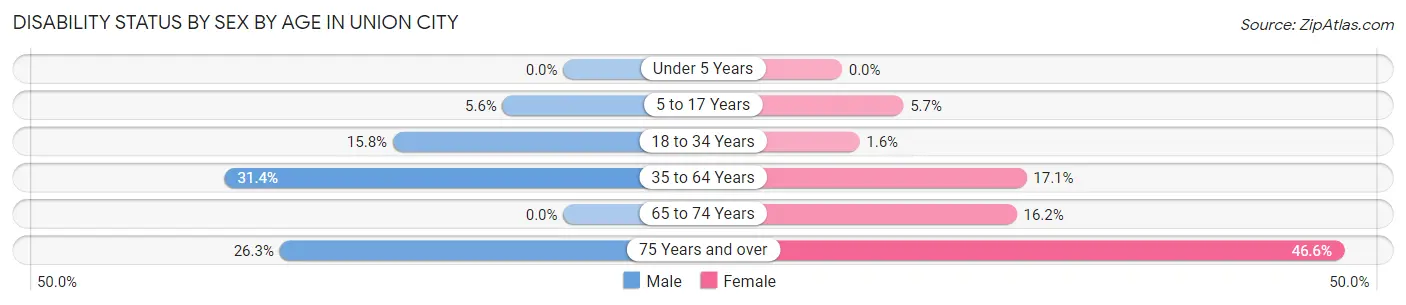
| Age Bracket | Male | Female |
| Under 5 Years | 0 (0.0%) | 0 (0.0%) |
| 5 to 17 Years | 8 (5.6%) | 15 (5.7%) |
| 18 to 34 Years | 31 (15.8%) | 4 (1.6%) |
| 35 to 64 Years | 88 (31.4%) | 62 (17.1%) |
| 65 to 74 Years | 0 (0.0%) | 6 (16.2%) |
| 75 Years and over | 10 (26.3%) | 41 (46.6%) |
Disability Class by Sex by Age in Union City
Disability Class: Hearing Difficulty
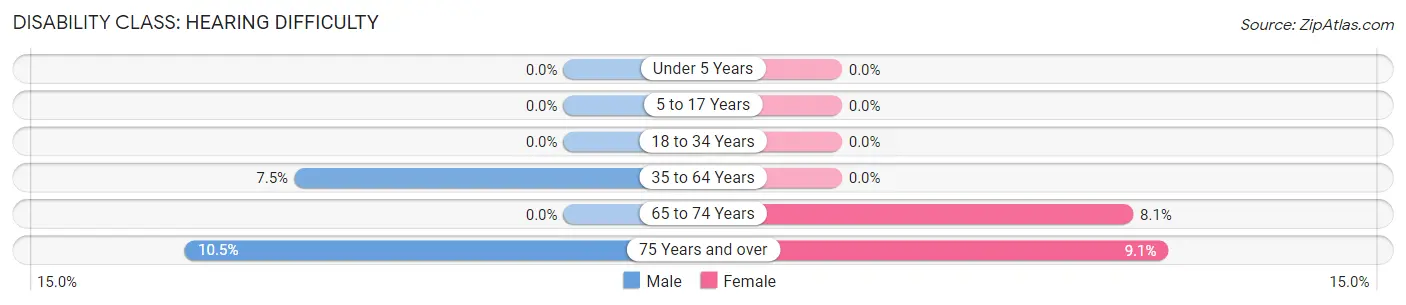
| Age Bracket | Male | Female |
| Under 5 Years | 0 (0.0%) | 0 (0.0%) |
| 5 to 17 Years | 0 (0.0%) | 0 (0.0%) |
| 18 to 34 Years | 0 (0.0%) | 0 (0.0%) |
| 35 to 64 Years | 21 (7.5%) | 0 (0.0%) |
| 65 to 74 Years | 0 (0.0%) | 3 (8.1%) |
| 75 Years and over | 4 (10.5%) | 8 (9.1%) |
Disability Class: Vision Difficulty
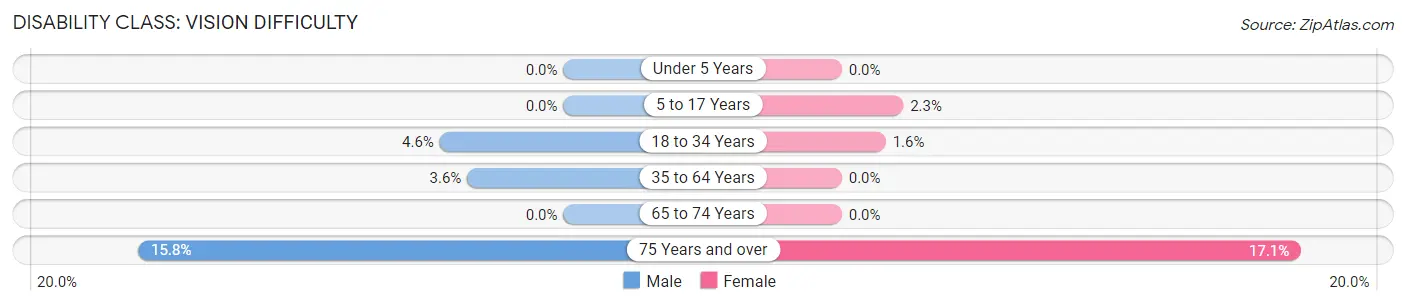
| Age Bracket | Male | Female |
| Under 5 Years | 0 (0.0%) | 0 (0.0%) |
| 5 to 17 Years | 0 (0.0%) | 6 (2.3%) |
| 18 to 34 Years | 9 (4.6%) | 4 (1.6%) |
| 35 to 64 Years | 10 (3.6%) | 0 (0.0%) |
| 65 to 74 Years | 0 (0.0%) | 0 (0.0%) |
| 75 Years and over | 6 (15.8%) | 15 (17.1%) |
Disability Class: Cognitive Difficulty
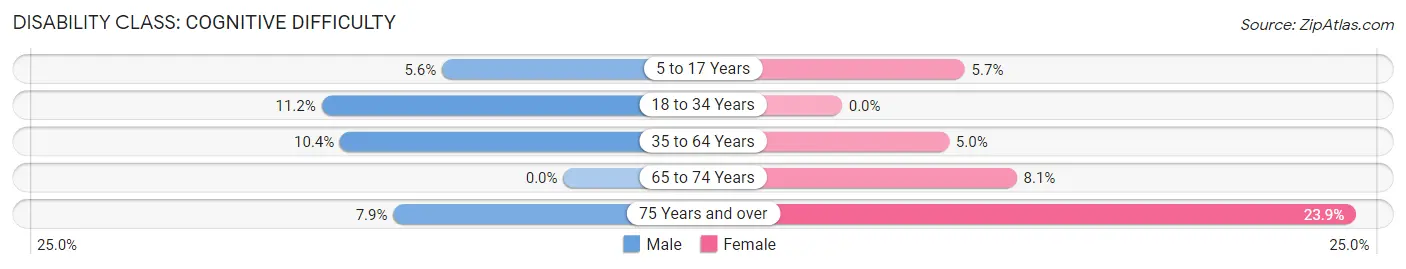
| Age Bracket | Male | Female |
| 5 to 17 Years | 8 (5.6%) | 15 (5.7%) |
| 18 to 34 Years | 22 (11.2%) | 0 (0.0%) |
| 35 to 64 Years | 29 (10.4%) | 18 (5.0%) |
| 65 to 74 Years | 0 (0.0%) | 3 (8.1%) |
| 75 Years and over | 3 (7.9%) | 21 (23.9%) |
Disability Class: Ambulatory Difficulty
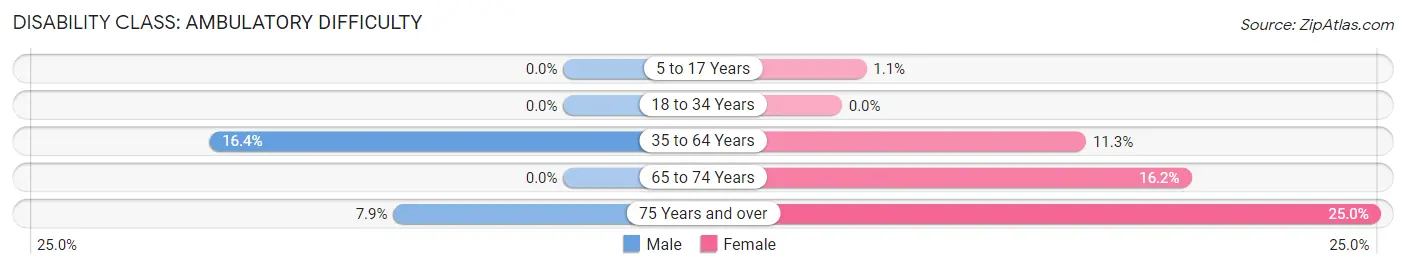
| Age Bracket | Male | Female |
| 5 to 17 Years | 0 (0.0%) | 3 (1.1%) |
| 18 to 34 Years | 0 (0.0%) | 0 (0.0%) |
| 35 to 64 Years | 46 (16.4%) | 41 (11.3%) |
| 65 to 74 Years | 0 (0.0%) | 6 (16.2%) |
| 75 Years and over | 3 (7.9%) | 22 (25.0%) |
Disability Class: Self-Care Difficulty
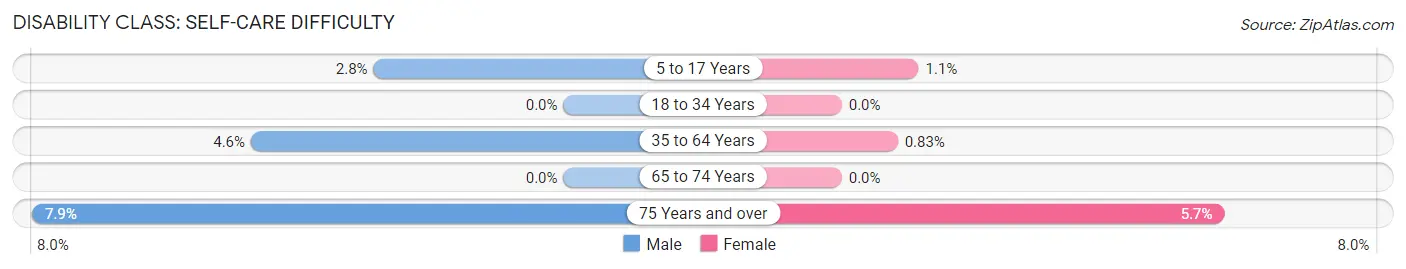
| Age Bracket | Male | Female |
| 5 to 17 Years | 4 (2.8%) | 3 (1.1%) |
| 18 to 34 Years | 0 (0.0%) | 0 (0.0%) |
| 35 to 64 Years | 13 (4.6%) | 3 (0.8%) |
| 65 to 74 Years | 0 (0.0%) | 0 (0.0%) |
| 75 Years and over | 3 (7.9%) | 5 (5.7%) |
Technology Access in Union City
Computing Device Access in Union City
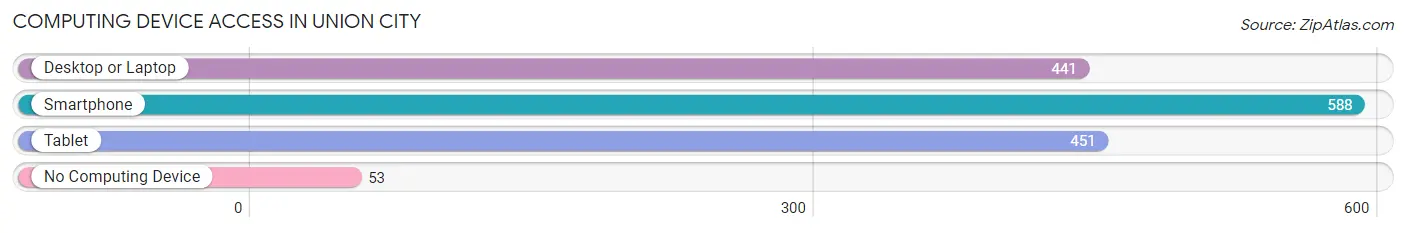
| Device Type | # Households | % Households |
| Desktop or Laptop | 441 | 64.0% |
| Smartphone | 588 | 85.3% |
| Tablet | 451 | 65.5% |
| No Computing Device | 53 | 7.7% |
| Total | 689 | 100.0% |
Internet Access in Union City
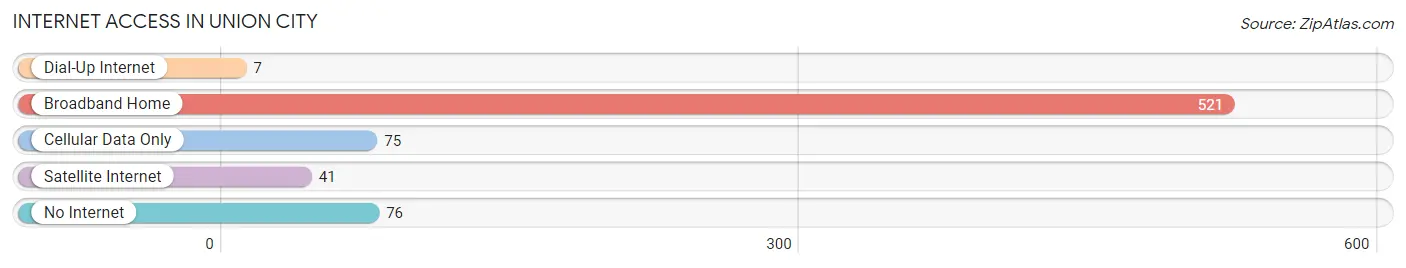
| Internet Type | # Households | % Households |
| Dial-Up Internet | 7 | 1.0% |
| Broadband Home | 521 | 75.6% |
| Cellular Data Only | 75 | 10.9% |
| Satellite Internet | 41 | 5.9% |
| No Internet | 76 | 11.0% |
| Total | 689 | 100.0% |
Union City Summary
History
Union City is a small village located in Branch County, Michigan. It is situated on the banks of the St. Joseph River and is home to a population of approximately 1,500 people. The village was first settled in 1836 by a group of settlers from New York. The settlers named the village Union City because of the union of the two rivers, the St. Joseph and the Kalamazoo.
The village was incorporated in 1867 and was a thriving agricultural community. The village was home to several mills, including a sawmill, a gristmill, and a woolen mill. The village also had a blacksmith shop, a general store, and a post office.
In the late 1800s, Union City began to experience a period of growth and prosperity. The village was home to several factories, including a furniture factory, a canning factory, and a cigar factory. The village also had a railroad station, which connected it to other towns in the area.
The village continued to grow and prosper until the Great Depression. During this time, many of the factories and businesses in the village closed. The population of the village declined and many of the buildings were abandoned.
In the 1950s, Union City began to experience a period of revitalization. The village was home to several new businesses, including a grocery store, a hardware store, and a restaurant. The village also had a new school and a new library.
Geography
Union City is located in Branch County, Michigan. It is situated on the banks of the St. Joseph River and is surrounded by rolling hills and farmland. The village is located approximately 30 miles south of Kalamazoo and 40 miles north of Battle Creek.
The village is located in a rural area and is home to a variety of wildlife, including deer, foxes, and wild turkeys. The village is also home to several parks, including Union City Park and Union City Nature Preserve.
Economy
Union City is a small village with a population of approximately 1,500 people. The village is home to several small businesses, including a grocery store, a hardware store, and a restaurant. The village also has a post office and a library.
The village is home to several manufacturing companies, including a furniture factory, a canning factory, and a cigar factory. The village also has a railroad station, which connects it to other towns in the area.
The village is home to several farms, which produce a variety of crops, including corn, soybeans, and wheat. The village also has several wineries, which produce a variety of wines.
Demographics
As of the 2010 census, the population of Union City was 1,521. The racial makeup of the village was 97.3% White, 0.7% African American, 0.2% Native American, 0.2% Asian, 0.2% from other races, and 1.6% from two or more races. Hispanic or Latino of any race were 1.2% of the population.
The median income for a household in the village was $37,500 and the median income for a family was $45,000. The per capita income for the village was $18,000. About 10.3% of families and 13.2% of the population were below the poverty line, including 16.2% of those under age 18 and 8.3% of those age 65 or over.
Common Questions
What is Per Capita Income in Union City?
Per Capita income in Union City is $23,845.
What is the Median Family Income in Union City?
Median Family Income in Union City is $59,583.
What is the Median Household income in Union City?
Median Household Income in Union City is $53,229.
What is Income or Wage Gap in Union City?
Income or Wage Gap in Union City is 49.3%.
Women in Union City earn 50.7 cents for every dollar earned by a man.
What is Inequality or Gini Index in Union City?
Inequality or Gini Index in Union City is 0.37.
What is the Total Population of Union City?
Total Population of Union City is 1,826.
What is the Total Male Population of Union City?
Total Male Population of Union City is 791.
What is the Total Female Population of Union City?
Total Female Population of Union City is 1,035.
What is the Ratio of Males per 100 Females in Union City?
There are 76.43 Males per 100 Females in Union City.
What is the Ratio of Females per 100 Males in Union City?
There are 130.85 Females per 100 Males in Union City.
What is the Median Population Age in Union City?
Median Population Age in Union City is 32.1 Years.
What is the Average Family Size in Union City
Average Family Size in Union City is 3.2 People.
What is the Average Household Size in Union City
Average Household Size in Union City is 2.6 People.
How Large is the Labor Force in Union City?
There are 892 People in the Labor Forcein in Union City.
What is the Percentage of People in the Labor Force in Union City?
63.0% of People are in the Labor Force in Union City.
What is the Unemployment Rate in Union City?
Unemployment Rate in Union City is 6.2%.