Dundee, OR Map & Demographics
Dundee Map
Dundee Overview
$38,635
PER CAPITA INCOME
$123,523
AVG FAMILY INCOME
$98,152
AVG HOUSEHOLD INCOME
36.7%
WAGE / INCOME GAP [ % ]
63.3¢/ $1
WAGE / INCOME GAP [ $ ]
0.37
INEQUALITY / GINI INDEX
3,224
TOTAL POPULATION
1,627
MALE POPULATION
1,597
FEMALE POPULATION
101.88
MALES / 100 FEMALES
98.16
FEMALES / 100 MALES
39.2
MEDIAN AGE
3.6
AVG FAMILY SIZE
3.0
AVG HOUSEHOLD SIZE
1,716
LABOR FORCE [ PEOPLE ]
69.2%
PERCENT IN LABOR FORCE
5.7%
UNEMPLOYMENT RATE
Dundee Zip Codes
Dundee Area Codes
Income in Dundee
Income Overview in Dundee
Per Capita Income in Dundee is $38,635, while median incomes of families and households are $123,523 and $98,152 respectively.
| Characteristic | Number | Measure |
| Per Capita Income | 3,224 | $38,635 |
| Median Family Income | 769 | $123,523 |
| Mean Family Income | 769 | $131,529 |
| Median Household Income | 1,080 | $98,152 |
| Mean Household Income | 1,080 | $113,713 |
| Income Deficit | 769 | $0 |
| Wage / Income Gap (%) | 3,224 | 36.75% |
| Wage / Income Gap ($) | 3,224 | 63.25¢ per $1 |
| Gini / Inequality Index | 3,224 | 0.37 |
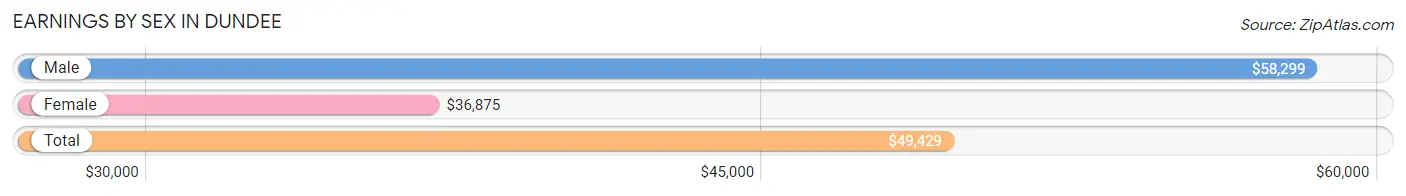
Earnings by Sex in Dundee
Average Earnings in Dundee are $49,429, $58,299 for men and $36,875 for women, a difference of 36.7%.
| Sex | Number | Average Earnings |
| Male | 987 (55.8%) | $58,299 |
| Female | 782 (44.2%) | $36,875 |
| Total | 1,769 (100.0%) | $49,429 |
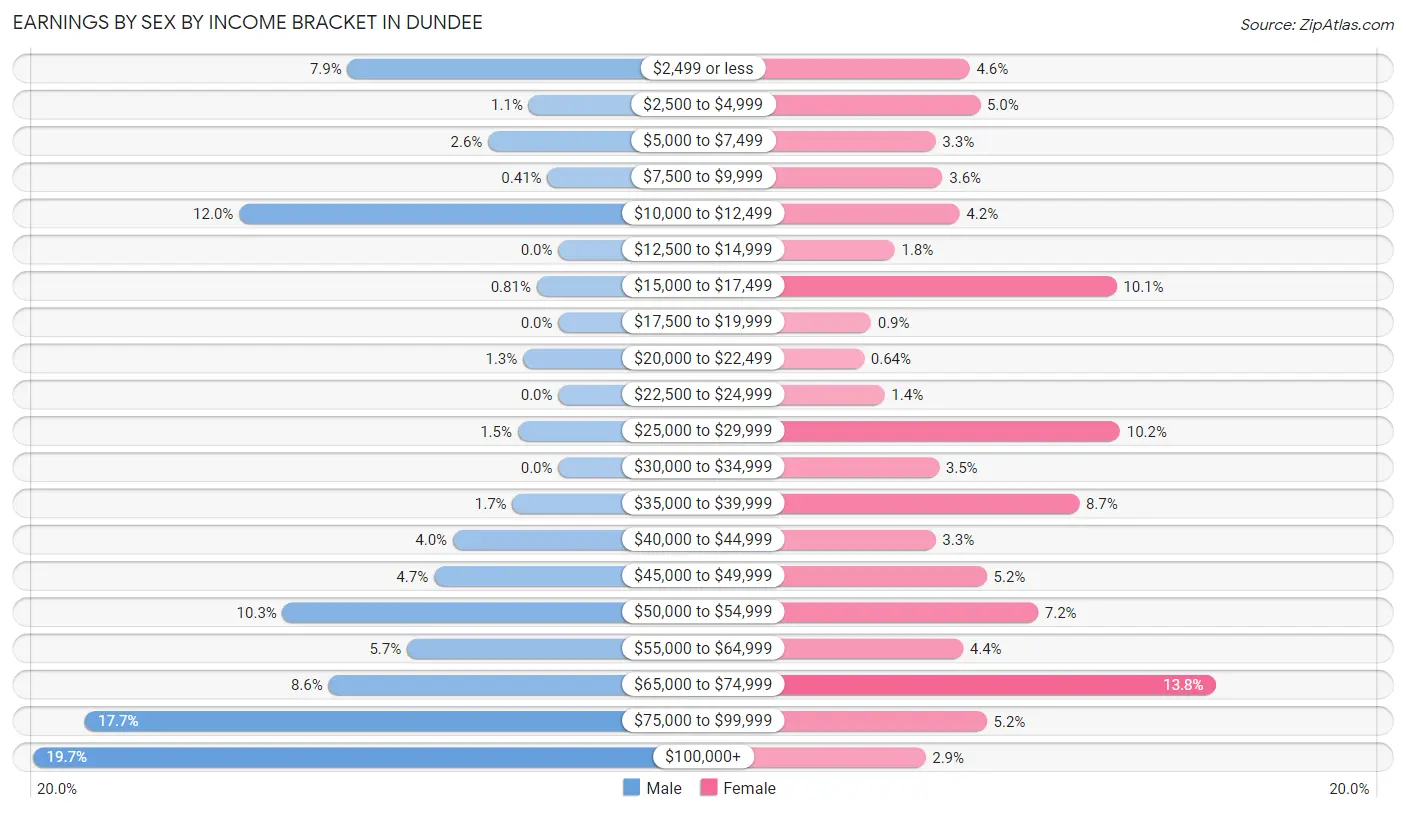
Earnings by Sex by Income Bracket in Dundee
The most common earnings brackets in Dundee are $100,000+ for men (194 | 19.7%) and $65,000 to $74,999 for women (108 | 13.8%).
| Income | Male | Female |
| $2,499 or less | 78 (7.9%) | 36 (4.6%) |
| $2,500 to $4,999 | 11 (1.1%) | 39 (5.0%) |
| $5,000 to $7,499 | 26 (2.6%) | 26 (3.3%) |
| $7,500 to $9,999 | 4 (0.4%) | 28 (3.6%) |
| $10,000 to $12,499 | 118 (12.0%) | 33 (4.2%) |
| $12,500 to $14,999 | 0 (0.0%) | 14 (1.8%) |
| $15,000 to $17,499 | 8 (0.8%) | 79 (10.1%) |
| $17,500 to $19,999 | 0 (0.0%) | 7 (0.9%) |
| $20,000 to $22,499 | 13 (1.3%) | 5 (0.6%) |
| $22,500 to $24,999 | 0 (0.0%) | 11 (1.4%) |
| $25,000 to $29,999 | 15 (1.5%) | 80 (10.2%) |
| $30,000 to $34,999 | 0 (0.0%) | 27 (3.5%) |
| $35,000 to $39,999 | 17 (1.7%) | 68 (8.7%) |
| $40,000 to $44,999 | 39 (4.0%) | 26 (3.3%) |
| $45,000 to $49,999 | 46 (4.7%) | 41 (5.2%) |
| $50,000 to $54,999 | 102 (10.3%) | 56 (7.2%) |
| $55,000 to $64,999 | 56 (5.7%) | 34 (4.3%) |
| $65,000 to $74,999 | 85 (8.6%) | 108 (13.8%) |
| $75,000 to $99,999 | 175 (17.7%) | 41 (5.2%) |
| $100,000+ | 194 (19.7%) | 23 (2.9%) |
| Total | 987 (100.0%) | 782 (100.0%) |
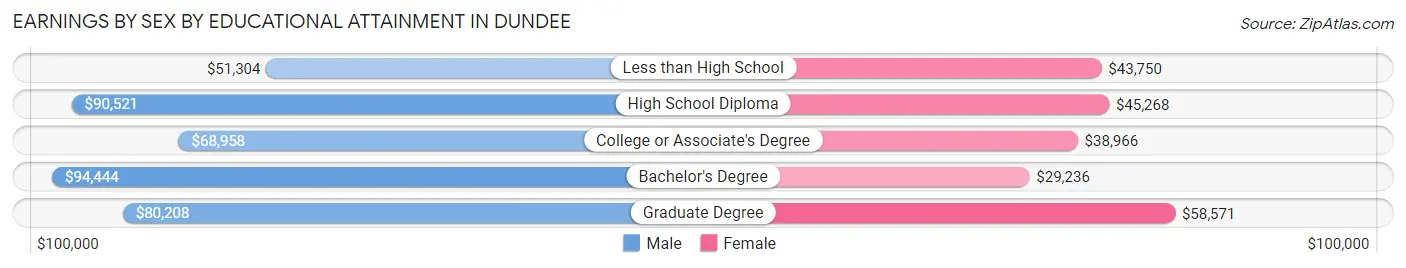
Earnings by Sex by Educational Attainment in Dundee
Average earnings in Dundee are $78,750 for men and $39,396 for women, a difference of 50.0%. Men with an educational attainment of bachelor's degree enjoy the highest average annual earnings of $94,444, while those with less than high school education earn the least with $51,304. Women with an educational attainment of graduate degree earn the most with the average annual earnings of $58,571, while those with bachelor's degree education have the smallest earnings of $29,236.
| Educational Attainment | Male Income | Female Income |
| Less than High School | $51,304 | $43,750 |
| High School Diploma | $90,521 | $45,268 |
| College or Associate's Degree | $68,958 | $38,966 |
| Bachelor's Degree | $94,444 | $29,236 |
| Graduate Degree | $80,208 | $58,571 |
| Total | $78,750 | $39,396 |
Family Income in Dundee
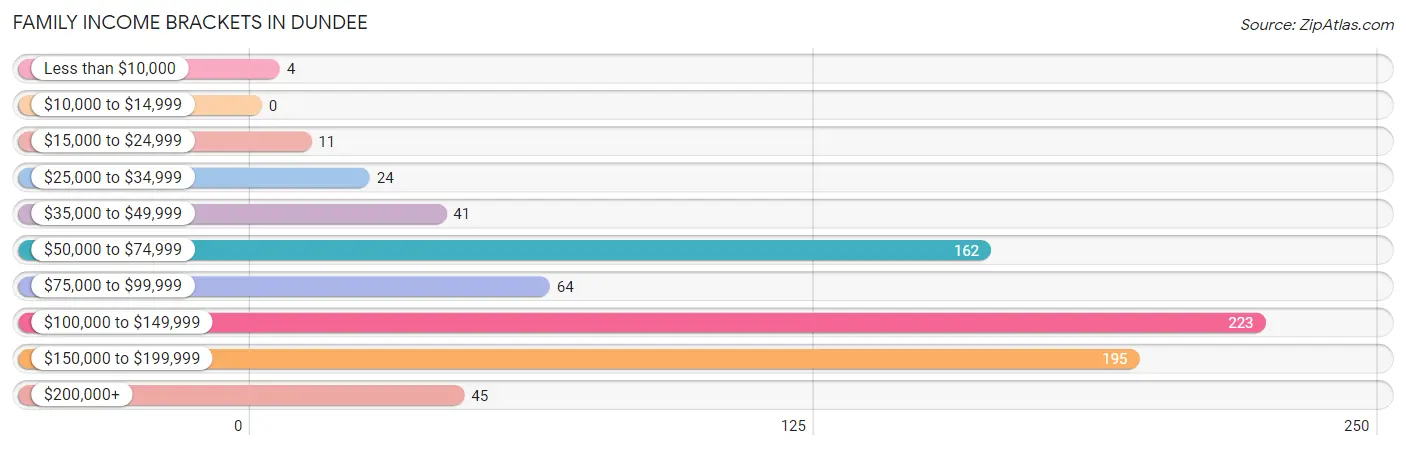
Family Income Brackets in Dundee
According to the Dundee family income data, there are 223 families falling into the $100,000 to $149,999 income range, which is the most common income bracket and makes up 29.0% of all families.
| Income Bracket | # Families | % Families |
| Less than $10,000 | 4 | 0.5% |
| $10,000 to $14,999 | 0 | 0.0% |
| $15,000 to $24,999 | 11 | 1.4% |
| $25,000 to $34,999 | 24 | 3.1% |
| $35,000 to $49,999 | 41 | 5.3% |
| $50,000 to $74,999 | 162 | 21.1% |
| $75,000 to $99,999 | 64 | 8.3% |
| $100,000 to $149,999 | 223 | 29.0% |
| $150,000 to $199,999 | 195 | 25.4% |
| $200,000+ | 45 | 5.9% |
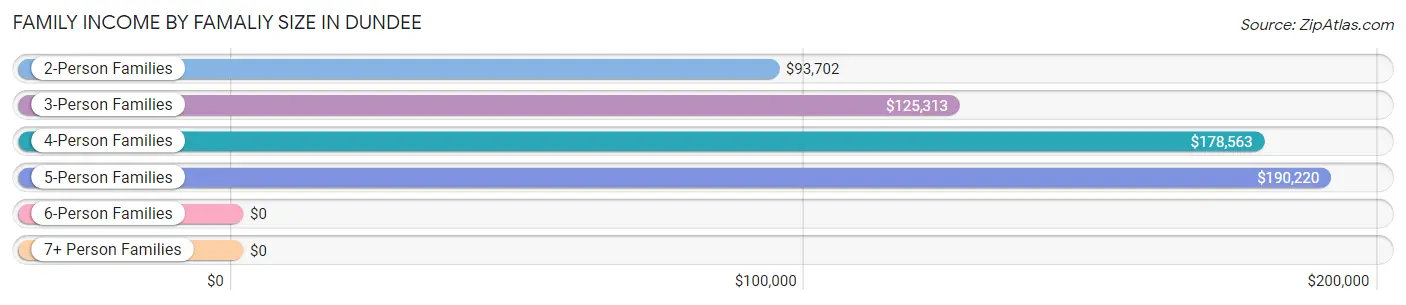
Family Income by Famaliy Size in Dundee
5-person families (135 | 17.6%) account for the highest median family income in Dundee with $190,220 per family, while 2-person families (333 | 43.3%) have the highest median income of $46,851 per family member.
| Income Bracket | # Families | Median Income |
| 2-Person Families | 333 (43.3%) | $93,702 |
| 3-Person Families | 161 (20.9%) | $125,313 |
| 4-Person Families | 125 (16.3%) | $178,563 |
| 5-Person Families | 135 (17.6%) | $190,220 |
| 6-Person Families | 10 (1.3%) | $0 |
| 7+ Person Families | 5 (0.6%) | $0 |
| Total | 769 (100.0%) | $123,523 |
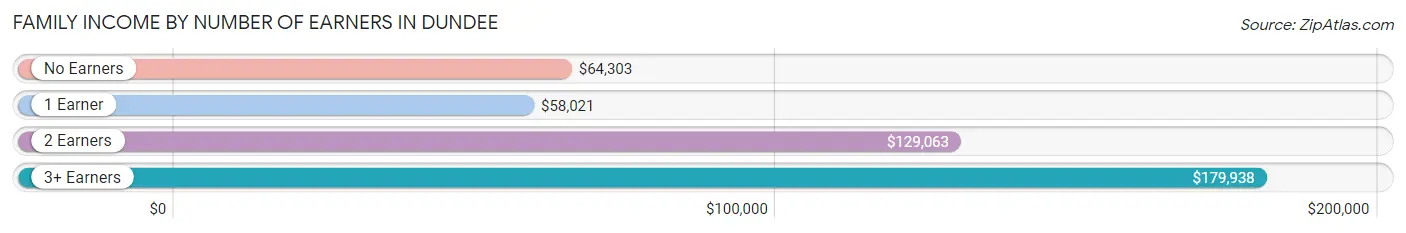
Family Income by Number of Earners in Dundee
The median family income in Dundee is $123,523, with families comprising 3+ earners (173) having the highest median family income of $179,938, while families with 1 earner (157) have the lowest median family income of $58,021, accounting for 22.5% and 20.4% of families, respectively.
| Number of Earners | # Families | Median Income |
| No Earners | 132 (17.2%) | $64,303 |
| 1 Earner | 157 (20.4%) | $58,021 |
| 2 Earners | 307 (39.9%) | $129,063 |
| 3+ Earners | 173 (22.5%) | $179,938 |
| Total | 769 (100.0%) | $123,523 |
Household Income in Dundee
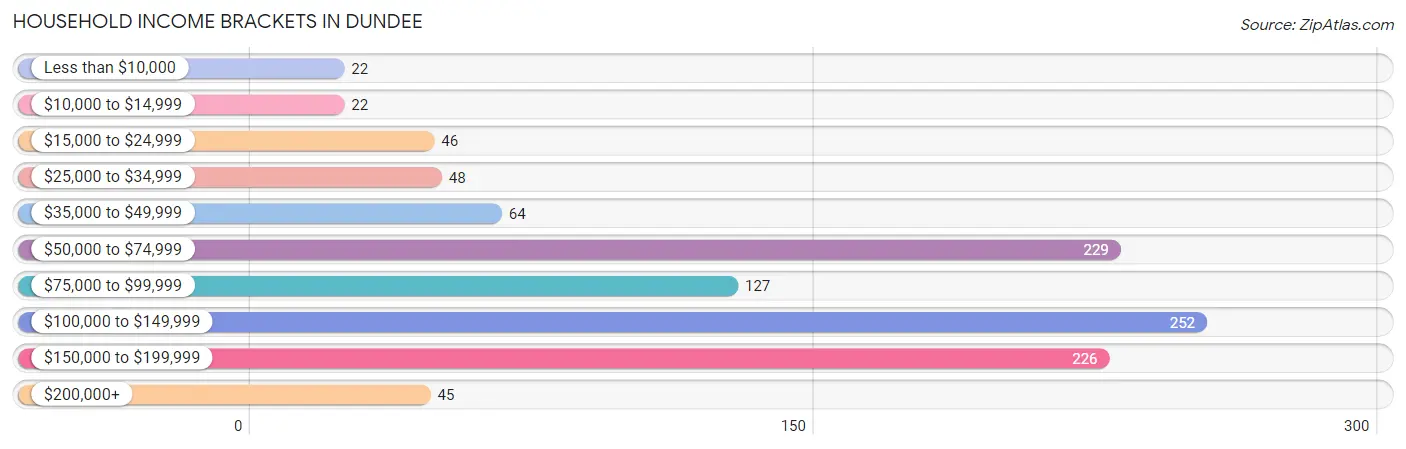
Household Income Brackets in Dundee
With 252 households falling in the category, the $100,000 to $149,999 income range is the most frequent in Dundee, accounting for 23.3% of all households. In contrast, only 22 households (2.0%) fall into the less than $10,000 income bracket, making it the least populous group.
| Income Bracket | # Households | % Households |
| Less than $10,000 | 22 | 2.0% |
| $10,000 to $14,999 | 22 | 2.0% |
| $15,000 to $24,999 | 46 | 4.3% |
| $25,000 to $34,999 | 48 | 4.4% |
| $35,000 to $49,999 | 64 | 5.9% |
| $50,000 to $74,999 | 229 | 21.2% |
| $75,000 to $99,999 | 127 | 11.8% |
| $100,000 to $149,999 | 252 | 23.3% |
| $150,000 to $199,999 | 226 | 20.9% |
| $200,000+ | 45 | 4.2% |
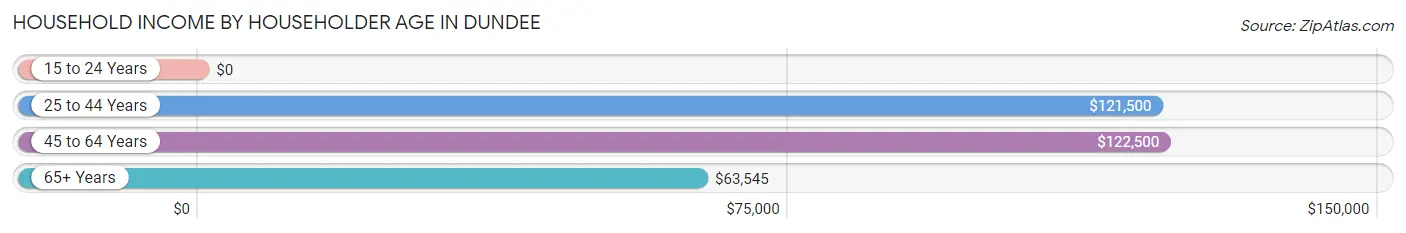
Household Income by Householder Age in Dundee
The median household income in Dundee is $98,152, with the highest median household income of $122,500 found in the 45 to 64 years age bracket for the primary householder. A total of 444 households (41.1%) fall into this category. Meanwhile, the 15 to 24 years age bracket for the primary householder has the lowest median household income of $0, with 19 households (1.8%) in this group.
| Income Bracket | # Households | Median Income |
| 15 to 24 Years | 19 (1.8%) | $0 |
| 25 to 44 Years | 300 (27.8%) | $121,500 |
| 45 to 64 Years | 444 (41.1%) | $122,500 |
| 65+ Years | 317 (29.3%) | $63,545 |
| Total | 1,080 (100.0%) | $98,152 |
Poverty in Dundee
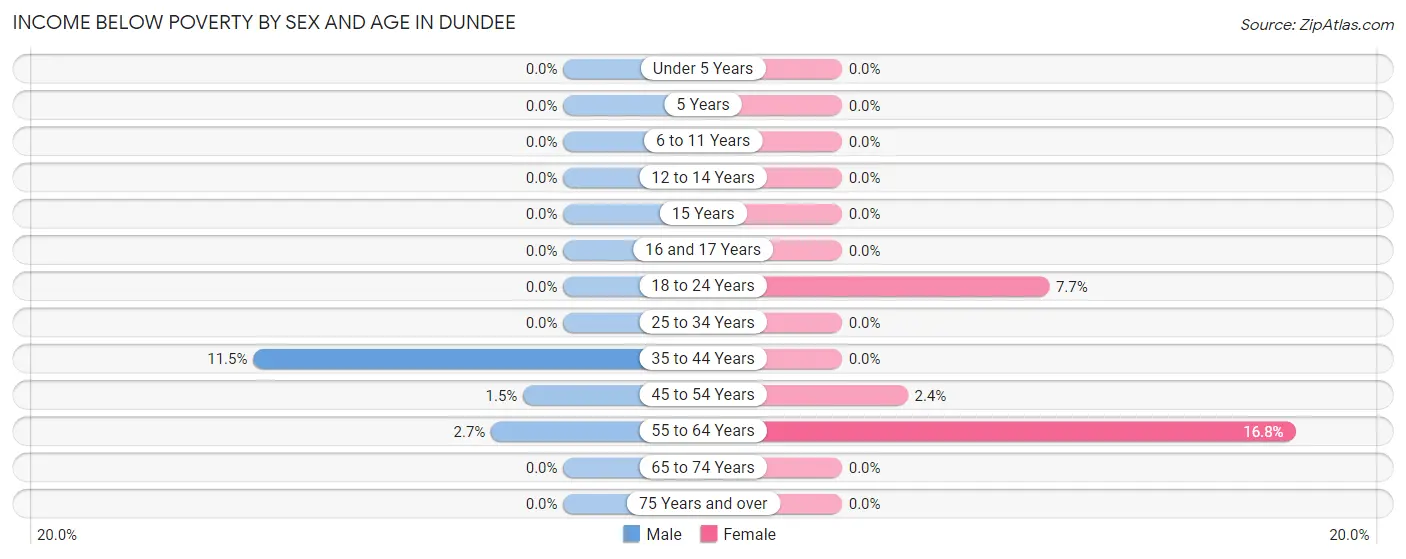
Income Below Poverty by Sex and Age in Dundee
With 2.3% poverty level for males and 2.9% for females among the residents of Dundee, 35 to 44 year old males and 55 to 64 year old females are the most vulnerable to poverty, with 29 males (11.5%) and 33 females (16.8%) in their respective age groups living below the poverty level.
| Age Bracket | Male | Female |
| Under 5 Years | 0 (0.0%) | 0 (0.0%) |
| 5 Years | 0 (0.0%) | 0 (0.0%) |
| 6 to 11 Years | 0 (0.0%) | 0 (0.0%) |
| 12 to 14 Years | 0 (0.0%) | 0 (0.0%) |
| 15 Years | 0 (0.0%) | 0 (0.0%) |
| 16 and 17 Years | 0 (0.0%) | 0 (0.0%) |
| 18 to 24 Years | 0 (0.0%) | 8 (7.7%) |
| 25 to 34 Years | 0 (0.0%) | 0 (0.0%) |
| 35 to 44 Years | 29 (11.5%) | 0 (0.0%) |
| 45 to 54 Years | 4 (1.5%) | 6 (2.4%) |
| 55 to 64 Years | 4 (2.7%) | 33 (16.8%) |
| 65 to 74 Years | 0 (0.0%) | 0 (0.0%) |
| 75 Years and over | 0 (0.0%) | 0 (0.0%) |
| Total | 37 (2.3%) | 47 (2.9%) |
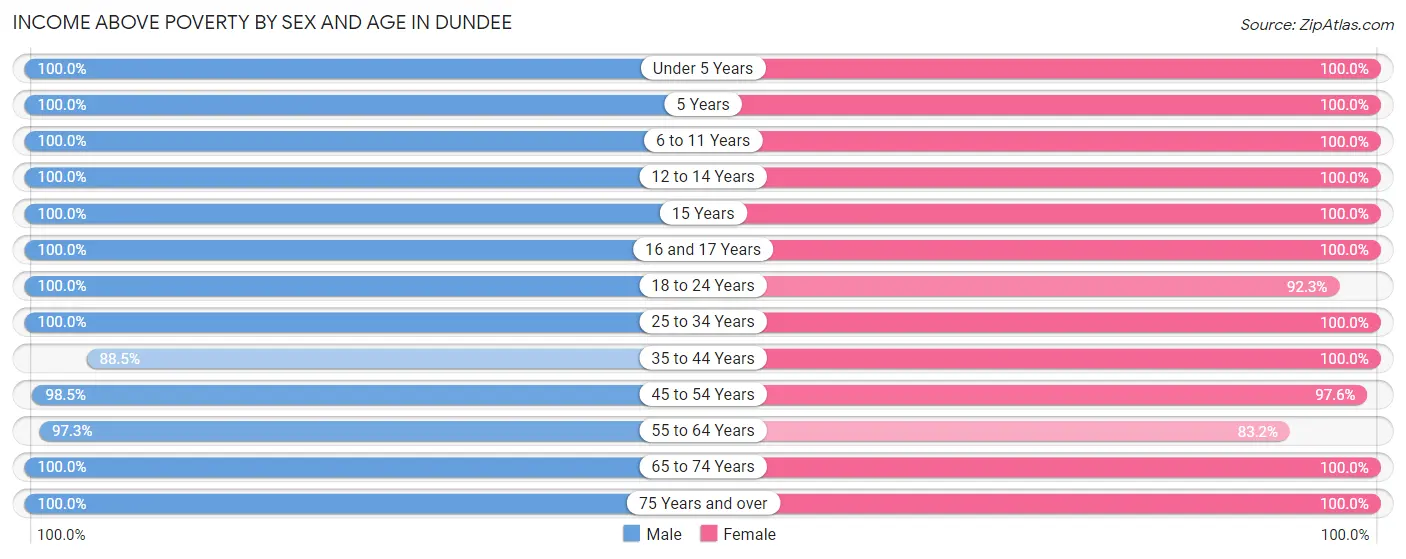
Income Above Poverty by Sex and Age in Dundee
According to the poverty statistics in Dundee, males aged under 5 years and females aged under 5 years are the age groups that are most secure financially, with 100.0% of males and 100.0% of females in these age groups living above the poverty line.
| Age Bracket | Male | Female |
| Under 5 Years | 135 (100.0%) | 13 (100.0%) |
| 5 Years | 14 (100.0%) | 7 (100.0%) |
| 6 to 11 Years | 96 (100.0%) | 324 (100.0%) |
| 12 to 14 Years | 64 (100.0%) | 33 (100.0%) |
| 15 Years | 42 (100.0%) | 16 (100.0%) |
| 16 and 17 Years | 91 (100.0%) | 69 (100.0%) |
| 18 to 24 Years | 208 (100.0%) | 96 (92.3%) |
| 25 to 34 Years | 75 (100.0%) | 129 (100.0%) |
| 35 to 44 Years | 223 (88.5%) | 186 (100.0%) |
| 45 to 54 Years | 265 (98.5%) | 240 (97.6%) |
| 55 to 64 Years | 145 (97.3%) | 163 (83.2%) |
| 65 to 74 Years | 117 (100.0%) | 156 (100.0%) |
| 75 Years and over | 115 (100.0%) | 118 (100.0%) |
| Total | 1,590 (97.7%) | 1,550 (97.1%) |
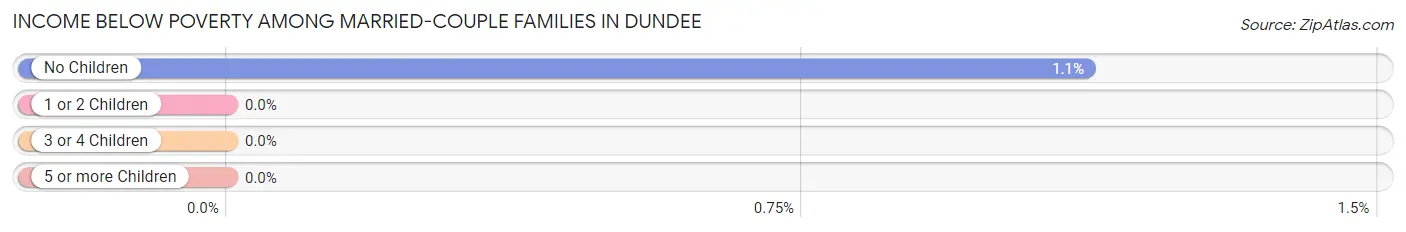
Income Below Poverty Among Married-Couple Families in Dundee
The poverty statistics for married-couple families in Dundee show that 0.6% or 4 of the total 681 families live below the poverty line. Families with no children have the highest poverty rate of 1.1%, comprising of 4 families. On the other hand, families with 1 or 2 children have the lowest poverty rate of 0.0%, which includes 0 families.
| Children | Above Poverty | Below Poverty |
| No Children | 352 (98.9%) | 4 (1.1%) |
| 1 or 2 Children | 263 (100.0%) | 0 (0.0%) |
| 3 or 4 Children | 59 (100.0%) | 0 (0.0%) |
| 5 or more Children | 3 (100.0%) | 0 (0.0%) |
| Total | 677 (99.4%) | 4 (0.6%) |
Income Below Poverty Among Single-Parent Households in Dundee
| Children | Single Father | Single Mother |
| No Children | 0 (0.0%) | 0 (0.0%) |
| 1 or 2 Children | 0 (0.0%) | 0 (0.0%) |
| 3 or 4 Children | 0 (0.0%) | 0 (0.0%) |
| 5 or more Children | 0 (0.0%) | 0 (0.0%) |
| Total | 0 (0.0%) | 0 (0.0%) |
Income Below Poverty Among Married-Couple vs Single-Parent Households in Dundee
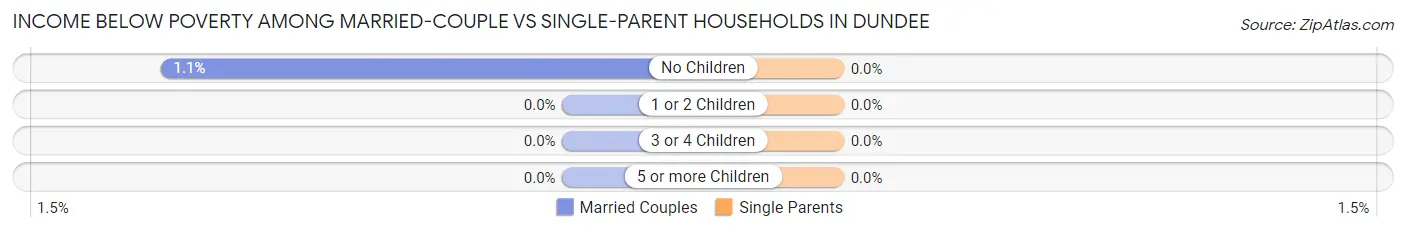
| Children | Married-Couple Families | Single-Parent Households |
| No Children | 4 (1.1%) | 0 (0.0%) |
| 1 or 2 Children | 0 (0.0%) | 0 (0.0%) |
| 3 or 4 Children | 0 (0.0%) | 0 (0.0%) |
| 5 or more Children | 0 (0.0%) | 0 (0.0%) |
| Total | 4 (0.6%) | 0 (0.0%) |
Race in Dundee
The most populous races in Dundee are White / Caucasian (2,680 | 83.1%), Hispanic or Latino (561 | 17.4%), and Two or more Races (318 | 9.9%).
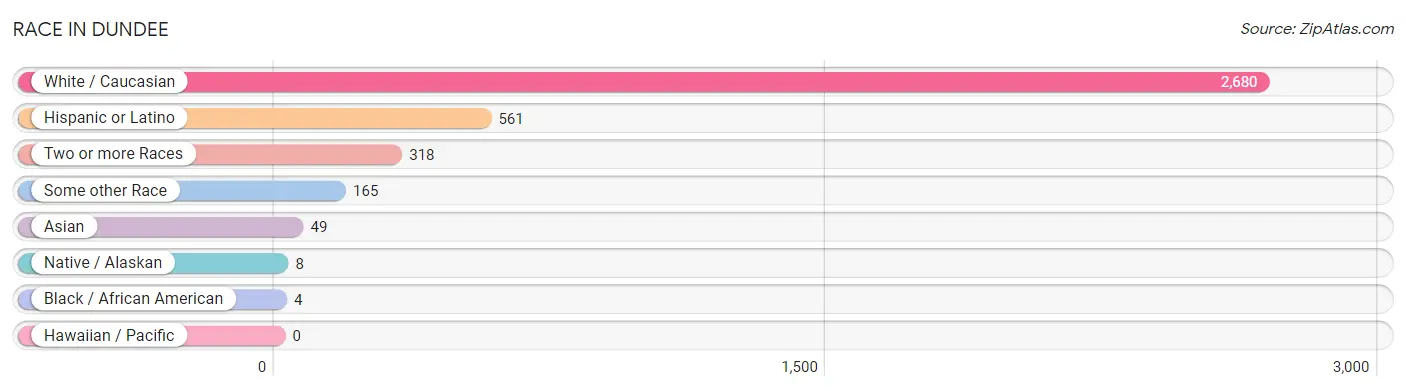
| Race | # Population | % Population |
| Asian | 49 | 1.5% |
| Black / African American | 4 | 0.1% |
| Hawaiian / Pacific | 0 | 0.0% |
| Hispanic or Latino | 561 | 17.4% |
| Native / Alaskan | 8 | 0.3% |
| White / Caucasian | 2,680 | 83.1% |
| Two or more Races | 318 | 9.9% |
| Some other Race | 165 | 5.1% |
| Total | 3,224 | 100.0% |
Ancestry in Dundee
The most populous ancestries reported in Dundee are German (559 | 17.3%), Irish (332 | 10.3%), English (307 | 9.5%), American (281 | 8.7%), and Mexican (214 | 6.6%), together accounting for 52.5% of all Dundee residents.
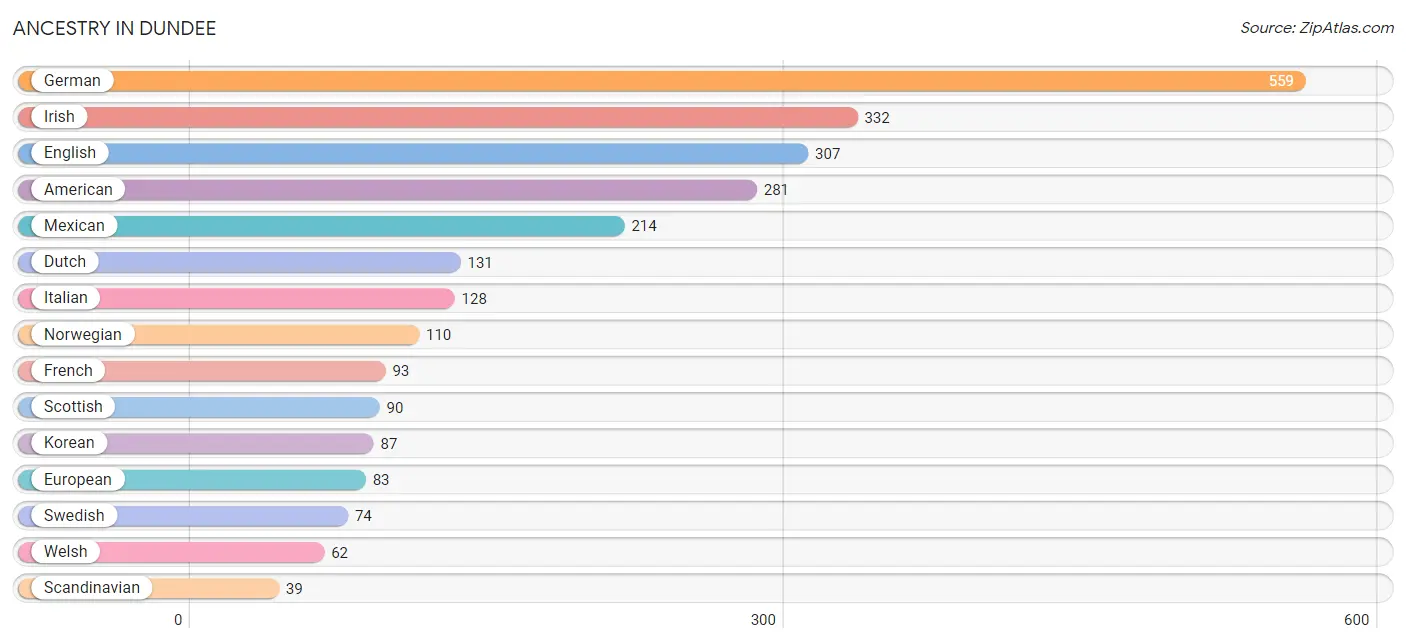
| Ancestry | # Population | % Population |
| African | 4 | 0.1% |
| American | 281 | 8.7% |
| Arab | 6 | 0.2% |
| Austrian | 4 | 0.1% |
| Belgian | 5 | 0.2% |
| British | 27 | 0.8% |
| Burmese | 28 | 0.9% |
| Central American | 25 | 0.8% |
| Cherokee | 29 | 0.9% |
| Choctaw | 19 | 0.6% |
| Czech | 31 | 1.0% |
| Czechoslovakian | 5 | 0.2% |
| Danish | 5 | 0.2% |
| Dutch | 131 | 4.1% |
| English | 307 | 9.5% |
| European | 83 | 2.6% |
| Finnish | 11 | 0.3% |
| French | 93 | 2.9% |
| French Canadian | 20 | 0.6% |
| German | 559 | 17.3% |
| Greek | 8 | 0.3% |
| Hungarian | 5 | 0.2% |
| Indian (Asian) | 9 | 0.3% |
| Irish | 332 | 10.3% |
| Italian | 128 | 4.0% |
| Korean | 87 | 2.7% |
| Laotian | 6 | 0.2% |
| Lebanese | 6 | 0.2% |
| Mexican | 214 | 6.6% |
| Northern European | 10 | 0.3% |
| Norwegian | 110 | 3.4% |
| Pennsylvania German | 4 | 0.1% |
| Polish | 31 | 1.0% |
| Portuguese | 5 | 0.2% |
| Romanian | 3 | 0.1% |
| Russian | 31 | 1.0% |
| Salvadoran | 25 | 0.8% |
| Scandinavian | 39 | 1.2% |
| Scotch-Irish | 21 | 0.6% |
| Scottish | 90 | 2.8% |
| Slovene | 4 | 0.1% |
| South African | 14 | 0.4% |
| Spaniard | 11 | 0.3% |
| Sri Lankan | 4 | 0.1% |
| Subsaharan African | 18 | 0.6% |
| Swedish | 74 | 2.3% |
| Swiss | 37 | 1.1% |
| Thai | 8 | 0.3% |
| Ukrainian | 12 | 0.4% |
| Welsh | 62 | 1.9% | View All 50 Rows |
Immigrants in Dundee
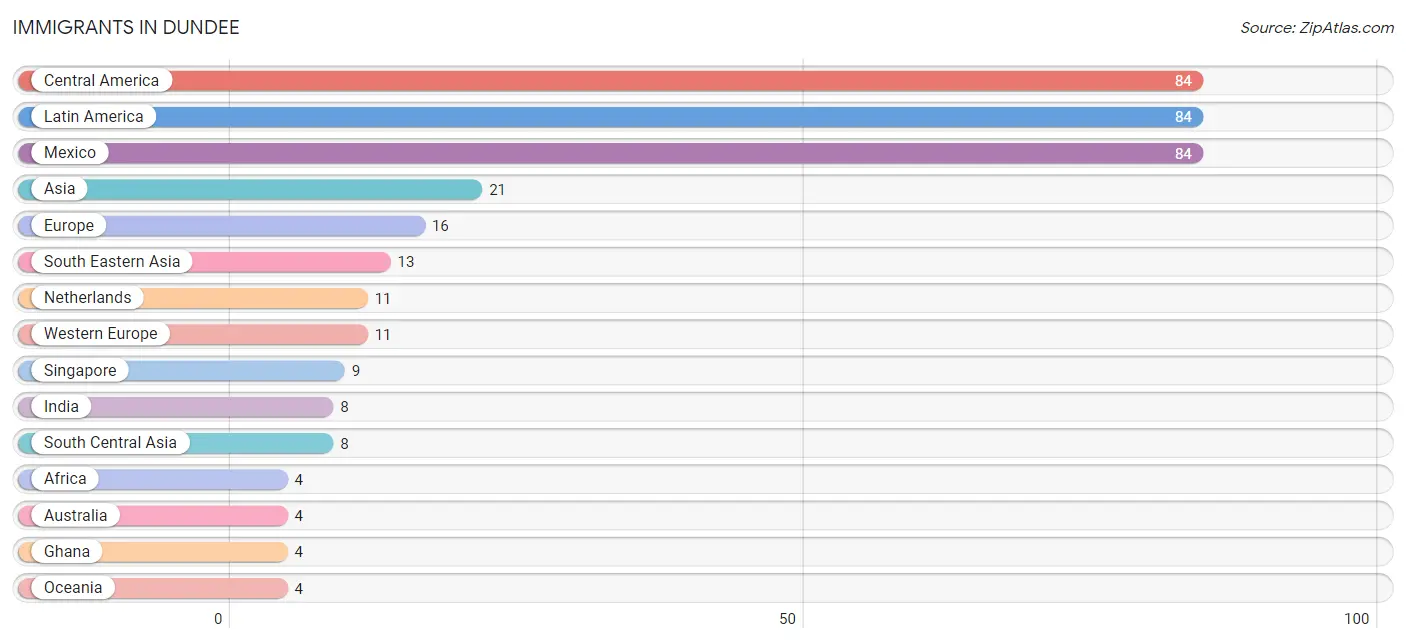
The most numerous immigrant groups reported in Dundee came from Central America (84 | 2.6%), Latin America (84 | 2.6%), Mexico (84 | 2.6%), Asia (21 | 0.6%), and Europe (16 | 0.5%), together accounting for 9.0% of all Dundee residents.
| Immigration Origin | # Population | % Population |
| Africa | 4 | 0.1% |
| Asia | 21 | 0.6% |
| Australia | 4 | 0.1% |
| Canada | 3 | 0.1% |
| Central America | 84 | 2.6% |
| Eastern Europe | 3 | 0.1% |
| England | 2 | 0.1% |
| Europe | 16 | 0.5% |
| Ghana | 4 | 0.1% |
| India | 8 | 0.3% |
| Latin America | 84 | 2.6% |
| Mexico | 84 | 2.6% |
| Netherlands | 11 | 0.3% |
| Northern Europe | 2 | 0.1% |
| Oceania | 4 | 0.1% |
| Poland | 3 | 0.1% |
| Singapore | 9 | 0.3% |
| South Central Asia | 8 | 0.3% |
| South Eastern Asia | 13 | 0.4% |
| Vietnam | 4 | 0.1% |
| Western Africa | 4 | 0.1% |
| Western Europe | 11 | 0.3% | View All 22 Rows |
Sex and Age in Dundee
Sex and Age in Dundee
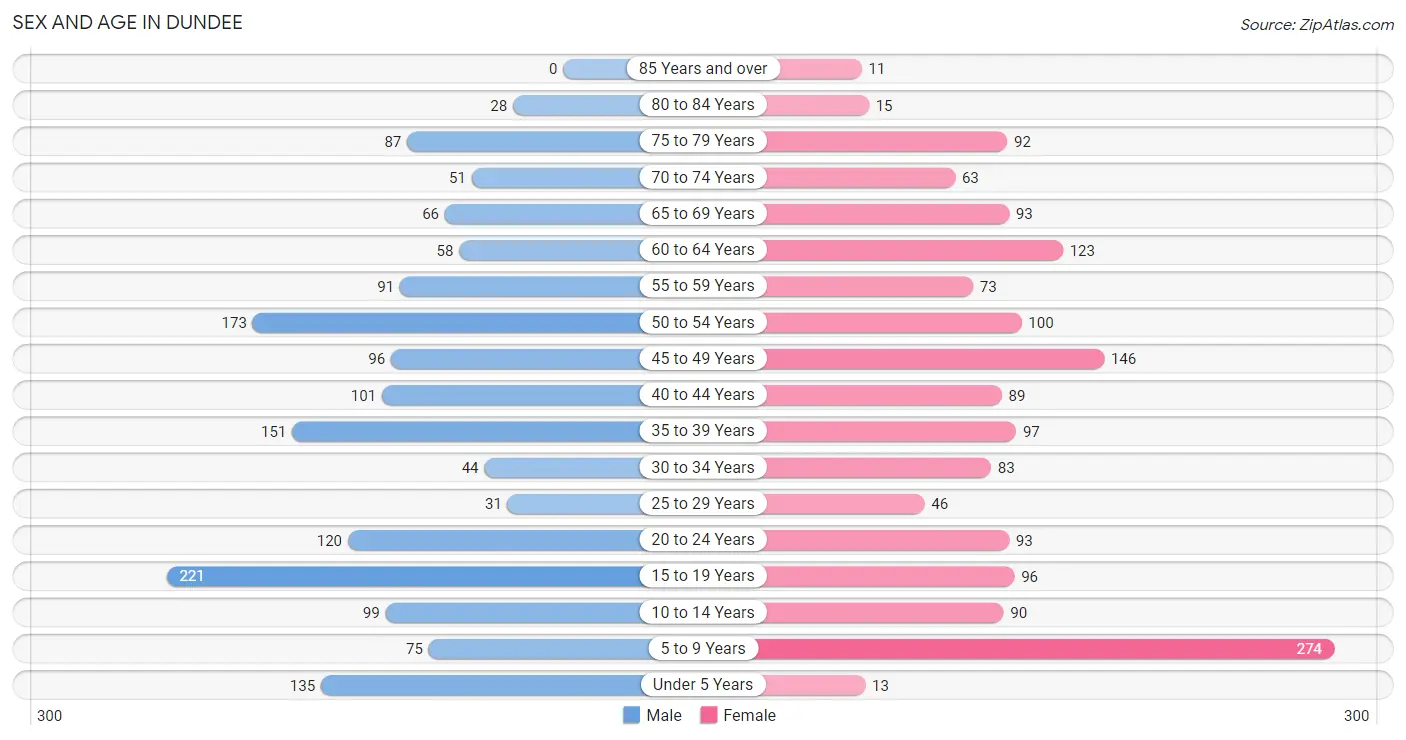
The most populous age groups in Dundee are 15 to 19 Years (221 | 13.6%) for men and 5 to 9 Years (274 | 17.2%) for women.
| Age Bracket | Male | Female |
| Under 5 Years | 135 (8.3%) | 13 (0.8%) |
| 5 to 9 Years | 75 (4.6%) | 274 (17.2%) |
| 10 to 14 Years | 99 (6.1%) | 90 (5.6%) |
| 15 to 19 Years | 221 (13.6%) | 96 (6.0%) |
| 20 to 24 Years | 120 (7.4%) | 93 (5.8%) |
| 25 to 29 Years | 31 (1.9%) | 46 (2.9%) |
| 30 to 34 Years | 44 (2.7%) | 83 (5.2%) |
| 35 to 39 Years | 151 (9.3%) | 97 (6.1%) |
| 40 to 44 Years | 101 (6.2%) | 89 (5.6%) |
| 45 to 49 Years | 96 (5.9%) | 146 (9.1%) |
| 50 to 54 Years | 173 (10.6%) | 100 (6.3%) |
| 55 to 59 Years | 91 (5.6%) | 73 (4.6%) |
| 60 to 64 Years | 58 (3.6%) | 123 (7.7%) |
| 65 to 69 Years | 66 (4.1%) | 93 (5.8%) |
| 70 to 74 Years | 51 (3.1%) | 63 (3.9%) |
| 75 to 79 Years | 87 (5.3%) | 92 (5.8%) |
| 80 to 84 Years | 28 (1.7%) | 15 (0.9%) |
| 85 Years and over | 0 (0.0%) | 11 (0.7%) |
| Total | 1,627 (100.0%) | 1,597 (100.0%) |
Families and Households in Dundee
Median Family Size in Dundee
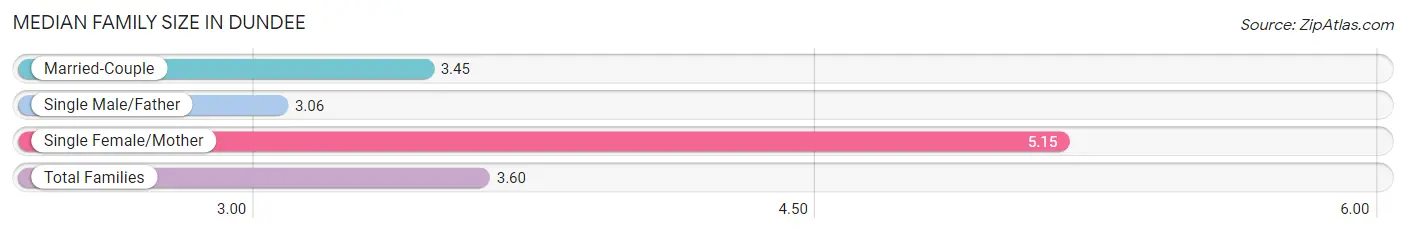
The median family size in Dundee is 3.60 persons per family, with single female/mother families (71 | 9.2%) accounting for the largest median family size of 5.15 persons per family. On the other hand, single male/father families (17 | 2.2%) represent the smallest median family size with 3.06 persons per family.
| Family Type | # Families | Family Size |
| Married-Couple | 681 (88.6%) | 3.45 |
| Single Male/Father | 17 (2.2%) | 3.06 |
| Single Female/Mother | 71 (9.2%) | 5.15 |
| Total Families | 769 (100.0%) | 3.60 |
Median Household Size in Dundee
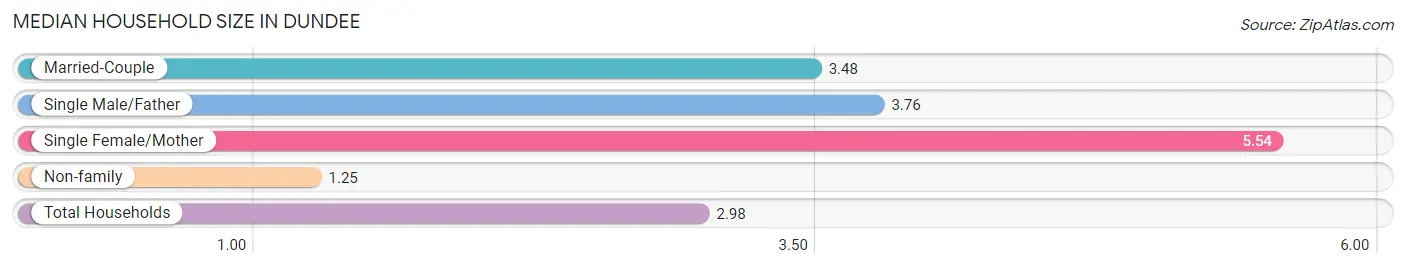
The median household size in Dundee is 2.98 persons per household, with single female/mother households (71 | 6.6%) accounting for the largest median household size of 5.54 persons per household. non-family households (311 | 28.8%) represent the smallest median household size with 1.25 persons per household.
| Household Type | # Households | Household Size |
| Married-Couple | 681 (63.1%) | 3.48 |
| Single Male/Father | 17 (1.6%) | 3.76 |
| Single Female/Mother | 71 (6.6%) | 5.54 |
| Non-family | 311 (28.8%) | 1.25 |
| Total Households | 1,080 (100.0%) | 2.98 |
Household Size by Marriage Status in Dundee
Out of a total of 1,080 households in Dundee, 769 (71.2%) are family households, while 311 (28.8%) are nonfamily households. The most numerous type of family households are 2-person households, comprising 312, and the most common type of nonfamily households are 1-person households, comprising 243.
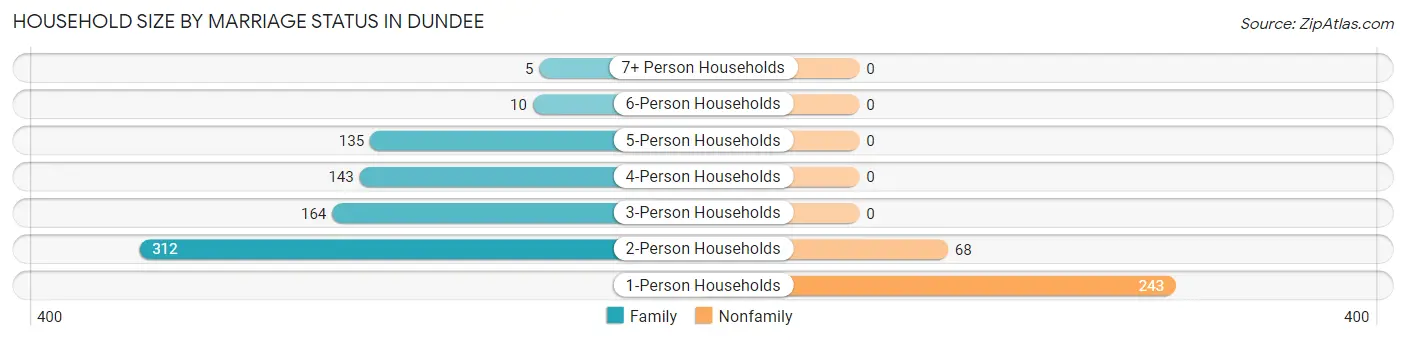
| Household Size | Family Households | Nonfamily Households |
| 1-Person Households | - | 243 (22.5%) |
| 2-Person Households | 312 (28.9%) | 68 (6.3%) |
| 3-Person Households | 164 (15.2%) | 0 (0.0%) |
| 4-Person Households | 143 (13.2%) | 0 (0.0%) |
| 5-Person Households | 135 (12.5%) | 0 (0.0%) |
| 6-Person Households | 10 (0.9%) | 0 (0.0%) |
| 7+ Person Households | 5 (0.5%) | 0 (0.0%) |
| Total | 769 (71.2%) | 311 (28.8%) |
Female Fertility in Dundee
Fertility by Age in Dundee
Average fertility rate in Dundee is 9.0 births per 1,000 women. Women in the age bracket of 20 to 34 years have the highest fertility rate with 27.0 births per 1,000 women. Women in the age bracket of 20 to 34 years acount for 100.0% of all women with births.
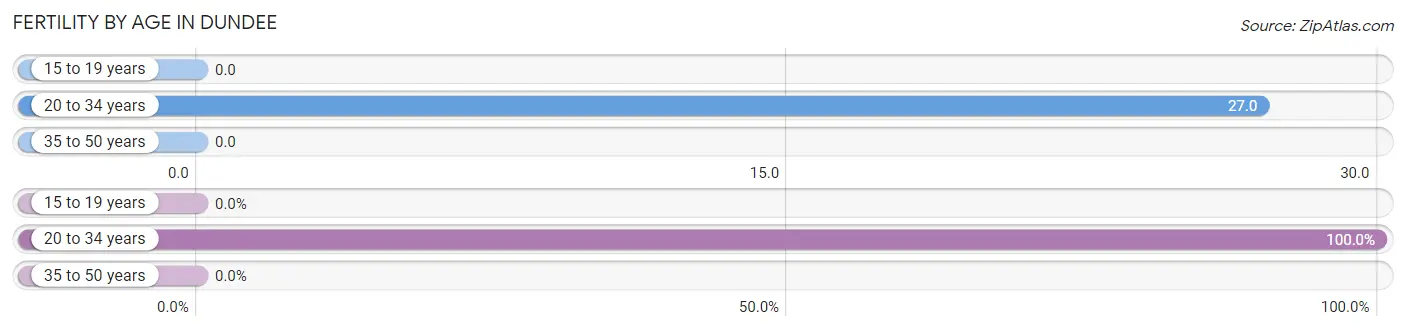
| Age Bracket | Women with Births | Births / 1,000 Women |
| 15 to 19 years | 0 (0.0%) | 0.0 |
| 20 to 34 years | 6 (100.0%) | 27.0 |
| 35 to 50 years | 0 (0.0%) | 0.0 |
| Total | 6 (100.0%) | 9.0 |
Fertility by Age by Marriage Status in Dundee
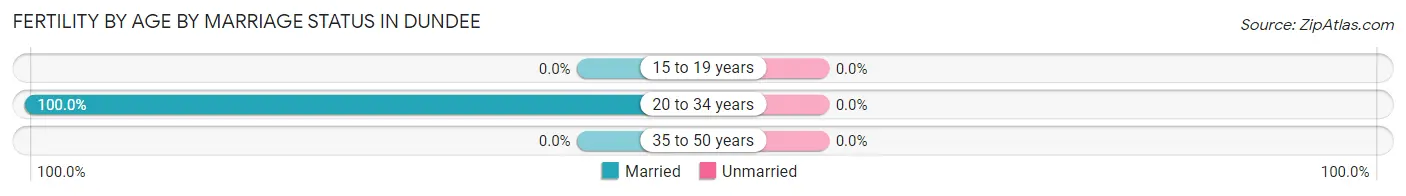
| Age Bracket | Married | Unmarried |
| 15 to 19 years | 0 (0.0%) | 0 (0.0%) |
| 20 to 34 years | 6 (100.0%) | 0 (0.0%) |
| 35 to 50 years | 0 (0.0%) | 0 (0.0%) |
| Total | 6 (100.0%) | 0 (0.0%) |
Fertility by Education in Dundee
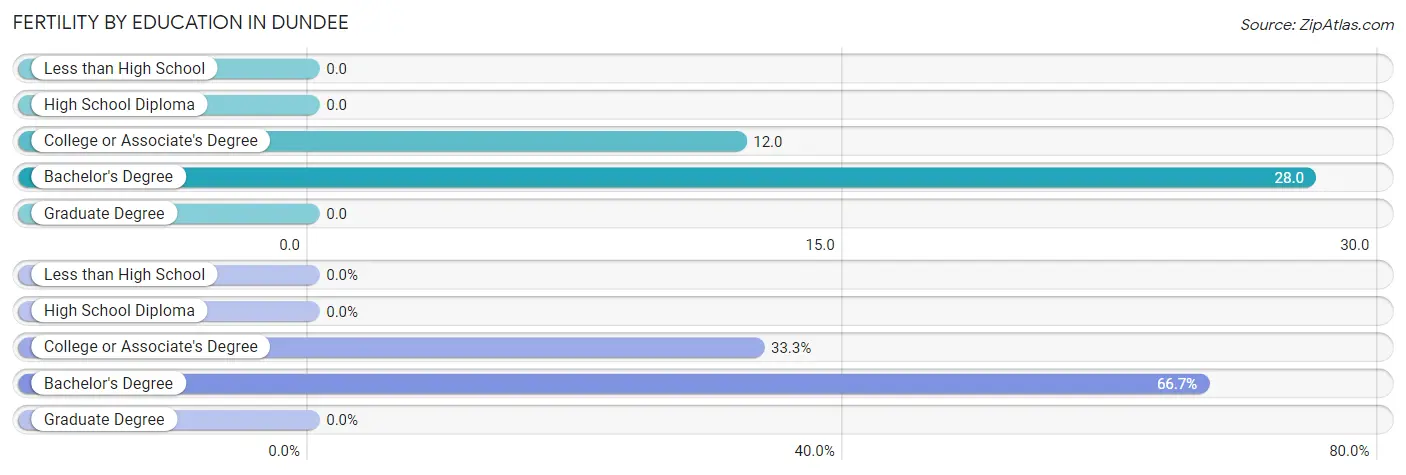
| Educational Attainment | Women with Births | Births / 1,000 Women |
| Less than High School | 0 (0.0%) | 0.0 |
| High School Diploma | 0 (0.0%) | 0.0 |
| College or Associate's Degree | 2 (33.3%) | 12.0 |
| Bachelor's Degree | 4 (66.7%) | 28.0 |
| Graduate Degree | 0 (0.0%) | 0.0 |
| Total | 6 (100.0%) | 9.0 |
Fertility by Education by Marriage Status in Dundee
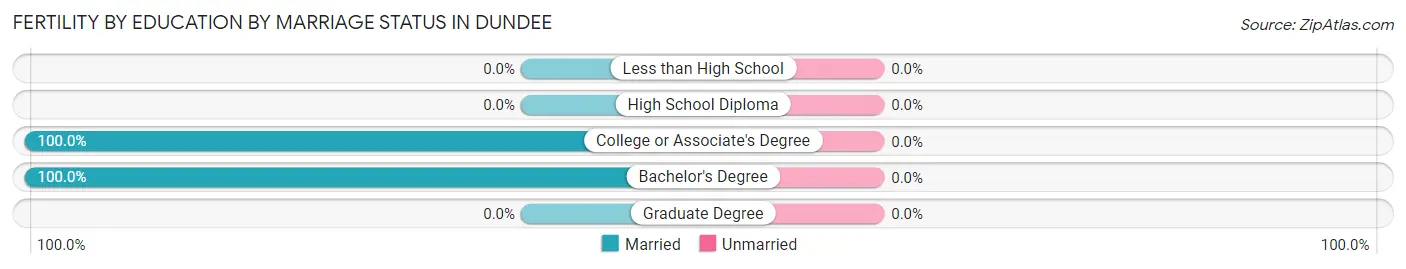
| Educational Attainment | Married | Unmarried |
| Less than High School | 0 (0.0%) | 0 (0.0%) |
| High School Diploma | 0 (0.0%) | 0 (0.0%) |
| College or Associate's Degree | 2 (100.0%) | 0 (0.0%) |
| Bachelor's Degree | 4 (100.0%) | 0 (0.0%) |
| Graduate Degree | 0 (0.0%) | 0 (0.0%) |
| Total | 6 (100.0%) | 0 (0.0%) |
Employment Characteristics in Dundee
Employment by Class of Employer in Dundee
Among the 1,554 employed individuals in Dundee, private company employees (919 | 59.1%), not-for-profit organizations (190 | 12.2%), and local government employees (143 | 9.2%) make up the most common classes of employment.
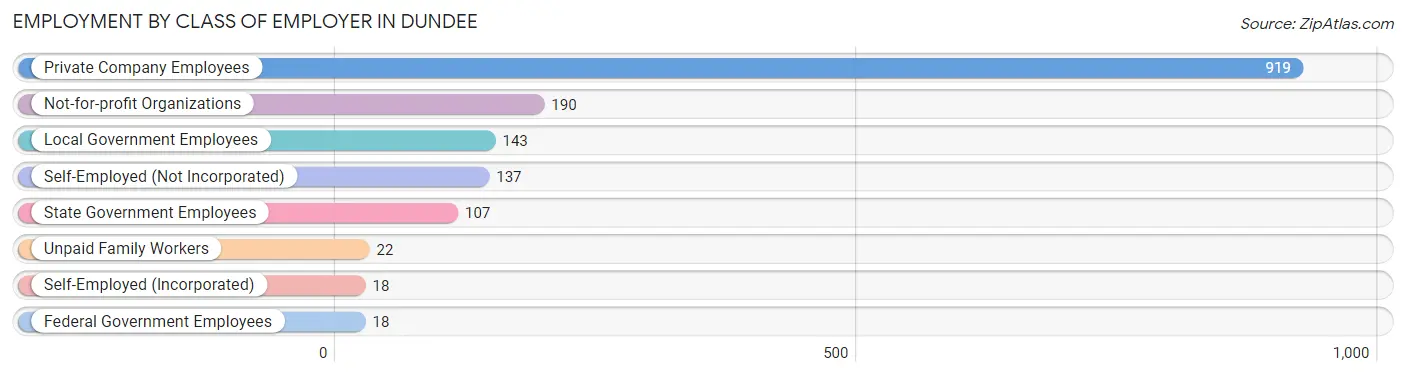
| Employer Class | # Employees | % Employees |
| Private Company Employees | 919 | 59.1% |
| Self-Employed (Incorporated) | 18 | 1.2% |
| Self-Employed (Not Incorporated) | 137 | 8.8% |
| Not-for-profit Organizations | 190 | 12.2% |
| Local Government Employees | 143 | 9.2% |
| State Government Employees | 107 | 6.9% |
| Federal Government Employees | 18 | 1.2% |
| Unpaid Family Workers | 22 | 1.4% |
| Total | 1,554 | 100.0% |
Employment Status by Age in Dundee
According to the labor force statistics for Dundee, out of the total population over 16 years of age (2,480), 69.2% or 1,716 individuals are in the labor force, with 5.7% or 98 of them unemployed. The age group with the highest labor force participation rate is 25 to 29 years, with 100.0% or 77 individuals in the labor force. Within the labor force, the 20 to 24 years age range has the highest percentage of unemployed individuals, with 25.6% or 53 of them being unemployed.
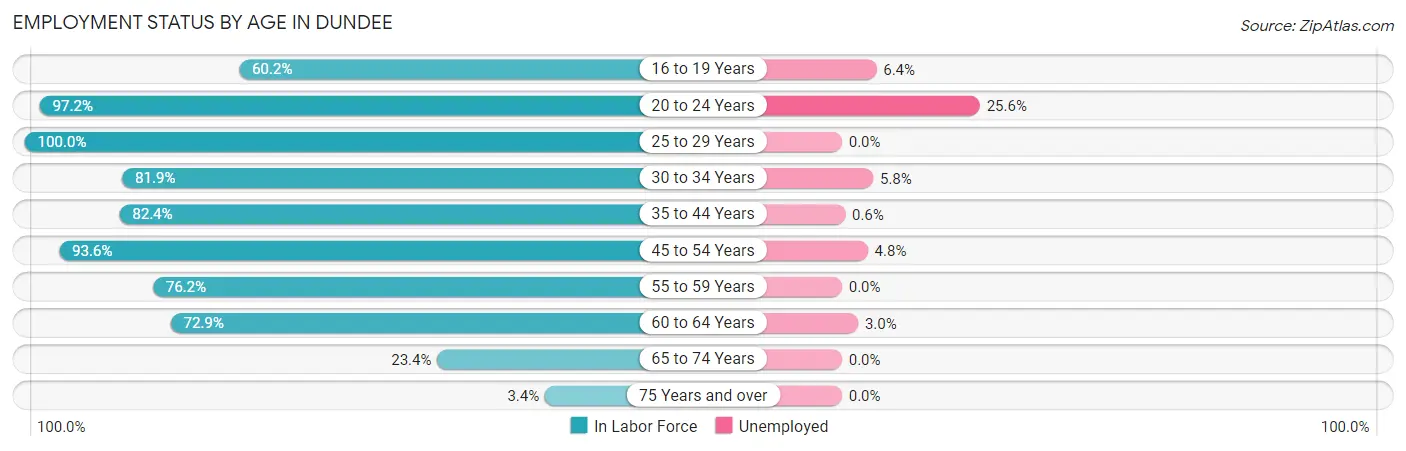
| Age Bracket | In Labor Force | Unemployed |
| 16 to 19 Years | 156 (60.2%) | 10 (6.4%) |
| 20 to 24 Years | 207 (97.2%) | 53 (25.6%) |
| 25 to 29 Years | 77 (100.0%) | 0 (0.0%) |
| 30 to 34 Years | 104 (81.9%) | 6 (5.8%) |
| 35 to 44 Years | 361 (82.4%) | 2 (0.6%) |
| 45 to 54 Years | 482 (93.6%) | 23 (4.8%) |
| 55 to 59 Years | 125 (76.2%) | 0 (0.0%) |
| 60 to 64 Years | 132 (72.9%) | 4 (3.0%) |
| 65 to 74 Years | 64 (23.4%) | 0 (0.0%) |
| 75 Years and over | 8 (3.4%) | 0 (0.0%) |
| Total | 1,716 (69.2%) | 98 (5.7%) |
Employment Status by Educational Attainment in Dundee
According to labor force statistics for Dundee, 85.3% of individuals (1,281) out of the total population between 25 and 64 years of age (1,502) are in the labor force, with 2.7% or 35 of them being unemployed. The group with the highest labor force participation rate are those with the educational attainment of bachelor's degree or higher, with 96.2% or 502 individuals in the labor force. Within the labor force, individuals with college / associate degree education have the highest percentage of unemployment, with 4.0% or 14 of them being unemployed.
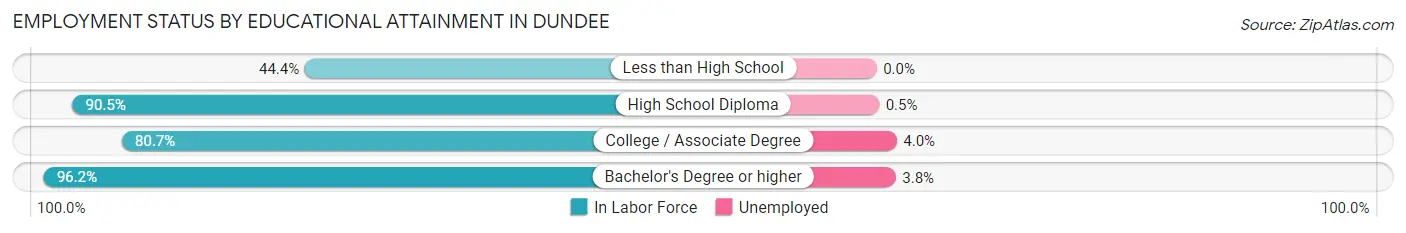
| Educational Attainment | In Labor Force | Unemployed |
| Less than High School | 63 (44.4%) | 0 (0.0%) |
| High School Diploma | 364 (90.5%) | 2 (0.5%) |
| College / Associate Degree | 352 (80.7%) | 17 (4.0%) |
| Bachelor's Degree or higher | 502 (96.2%) | 20 (3.8%) |
| Total | 1,281 (85.3%) | 41 (2.7%) |
Employment Occupations by Sex in Dundee
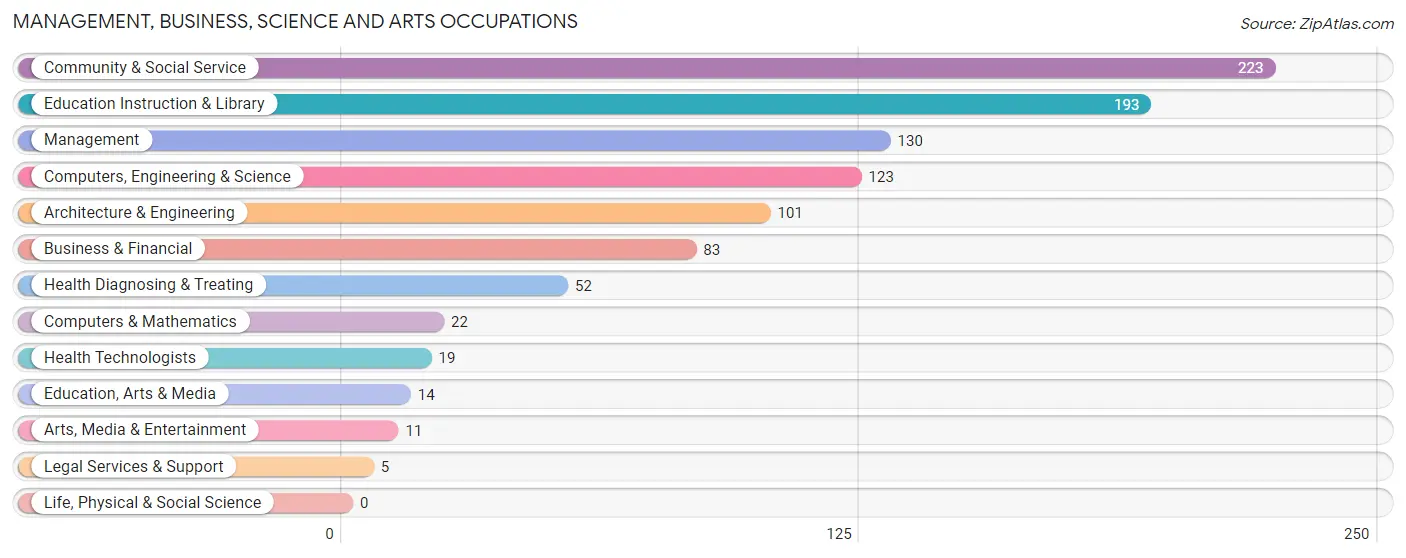
Management, Business, Science and Arts Occupations
The most common Management, Business, Science and Arts occupations in Dundee are Community & Social Service (223 | 13.8%), Education Instruction & Library (193 | 11.9%), Management (130 | 8.0%), Computers, Engineering & Science (123 | 7.6%), and Architecture & Engineering (101 | 6.2%).
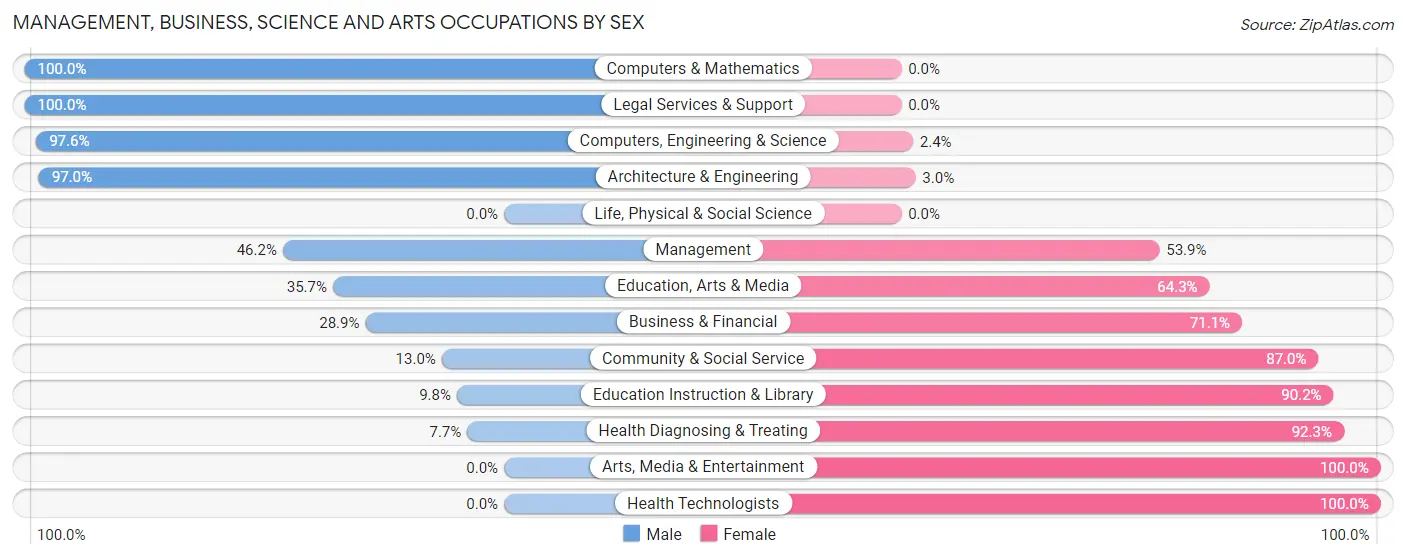
Management, Business, Science and Arts Occupations by Sex
Within the Management, Business, Science and Arts occupations in Dundee, the most male-oriented occupations are Computers & Mathematics (100.0%), Legal Services & Support (100.0%), and Computers, Engineering & Science (97.6%), while the most female-oriented occupations are Arts, Media & Entertainment (100.0%), Health Technologists (100.0%), and Health Diagnosing & Treating (92.3%).
| Occupation | Male | Female |
| Management | 60 (46.2%) | 70 (53.8%) |
| Business & Financial | 24 (28.9%) | 59 (71.1%) |
| Computers, Engineering & Science | 120 (97.6%) | 3 (2.4%) |
| Computers & Mathematics | 22 (100.0%) | 0 (0.0%) |
| Architecture & Engineering | 98 (97.0%) | 3 (3.0%) |
| Life, Physical & Social Science | 0 (0.0%) | 0 (0.0%) |
| Community & Social Service | 29 (13.0%) | 194 (87.0%) |
| Education, Arts & Media | 5 (35.7%) | 9 (64.3%) |
| Legal Services & Support | 5 (100.0%) | 0 (0.0%) |
| Education Instruction & Library | 19 (9.8%) | 174 (90.2%) |
| Arts, Media & Entertainment | 0 (0.0%) | 11 (100.0%) |
| Health Diagnosing & Treating | 4 (7.7%) | 48 (92.3%) |
| Health Technologists | 0 (0.0%) | 19 (100.0%) |
| Total (Category) | 237 (38.8%) | 374 (61.2%) |
| Total (Overall) | 938 (58.0%) | 680 (42.0%) |
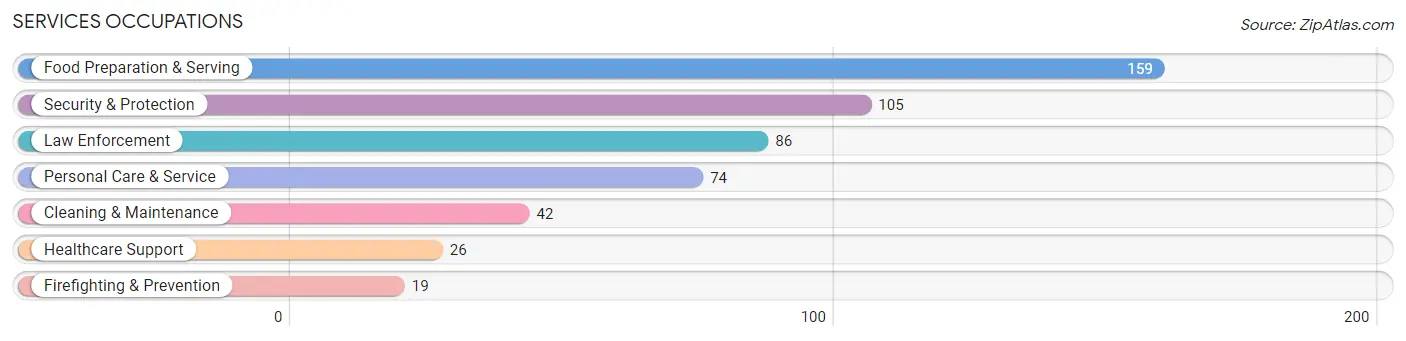
Services Occupations
The most common Services occupations in Dundee are Food Preparation & Serving (159 | 9.8%), Security & Protection (105 | 6.5%), Law Enforcement (86 | 5.3%), Personal Care & Service (74 | 4.6%), and Cleaning & Maintenance (42 | 2.6%).
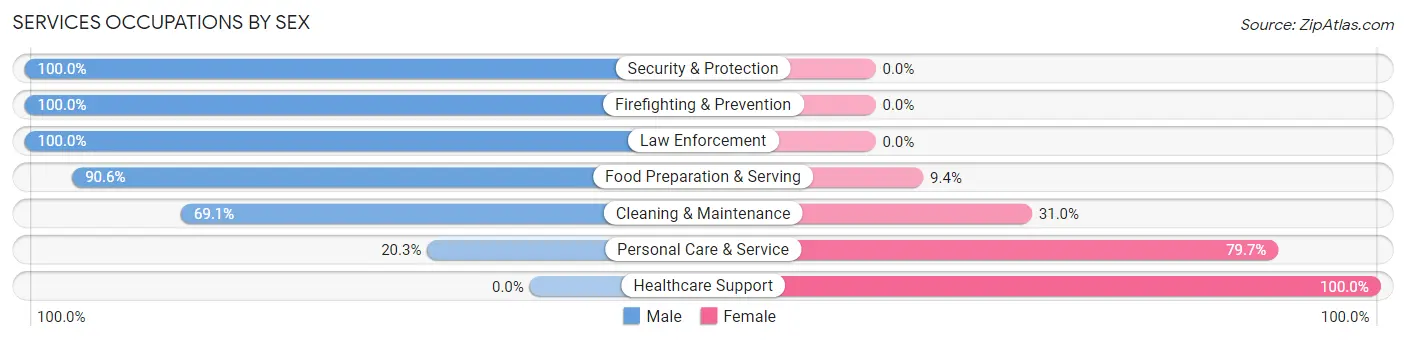
Services Occupations by Sex
Within the Services occupations in Dundee, the most male-oriented occupations are Security & Protection (100.0%), Firefighting & Prevention (100.0%), and Law Enforcement (100.0%), while the most female-oriented occupations are Healthcare Support (100.0%), Personal Care & Service (79.7%), and Cleaning & Maintenance (30.9%).
| Occupation | Male | Female |
| Healthcare Support | 0 (0.0%) | 26 (100.0%) |
| Security & Protection | 105 (100.0%) | 0 (0.0%) |
| Firefighting & Prevention | 19 (100.0%) | 0 (0.0%) |
| Law Enforcement | 86 (100.0%) | 0 (0.0%) |
| Food Preparation & Serving | 144 (90.6%) | 15 (9.4%) |
| Cleaning & Maintenance | 29 (69.1%) | 13 (30.9%) |
| Personal Care & Service | 15 (20.3%) | 59 (79.7%) |
| Total (Category) | 293 (72.2%) | 113 (27.8%) |
| Total (Overall) | 938 (58.0%) | 680 (42.0%) |
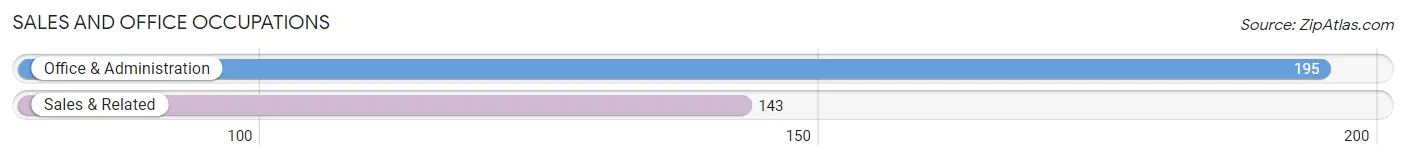
Sales and Office Occupations
The most common Sales and Office occupations in Dundee are Office & Administration (195 | 12.0%), and Sales & Related (143 | 8.8%).
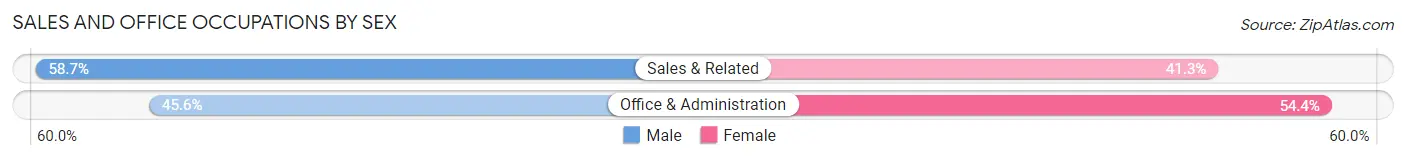
Sales and Office Occupations by Sex
| Occupation | Male | Female |
| Sales & Related | 84 (58.7%) | 59 (41.3%) |
| Office & Administration | 89 (45.6%) | 106 (54.4%) |
| Total (Category) | 173 (51.2%) | 165 (48.8%) |
| Total (Overall) | 938 (58.0%) | 680 (42.0%) |
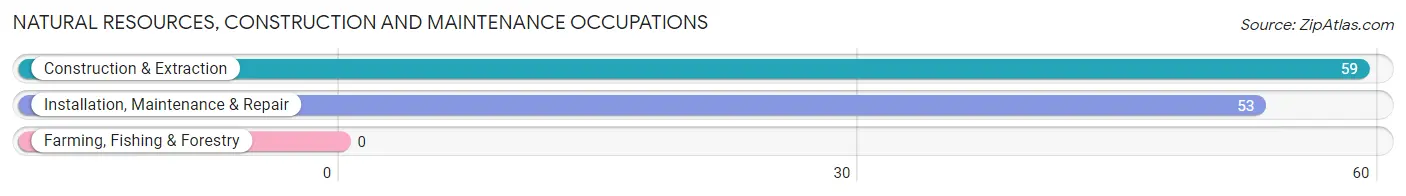
Natural Resources, Construction and Maintenance Occupations
The most common Natural Resources, Construction and Maintenance occupations in Dundee are Construction & Extraction (59 | 3.6%), and Installation, Maintenance & Repair (53 | 3.3%).
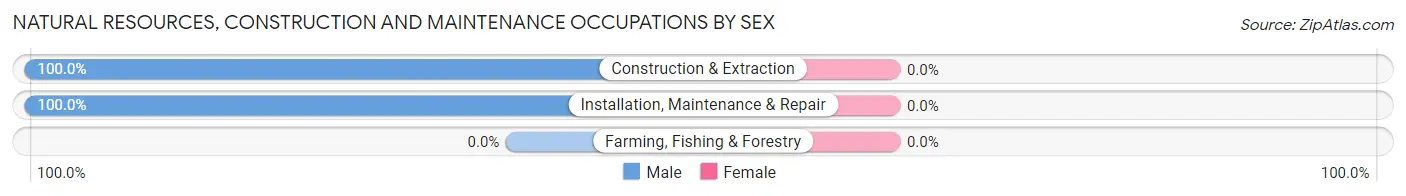
Natural Resources, Construction and Maintenance Occupations by Sex
| Occupation | Male | Female |
| Farming, Fishing & Forestry | 0 (0.0%) | 0 (0.0%) |
| Construction & Extraction | 59 (100.0%) | 0 (0.0%) |
| Installation, Maintenance & Repair | 53 (100.0%) | 0 (0.0%) |
| Total (Category) | 112 (100.0%) | 0 (0.0%) |
| Total (Overall) | 938 (58.0%) | 680 (42.0%) |
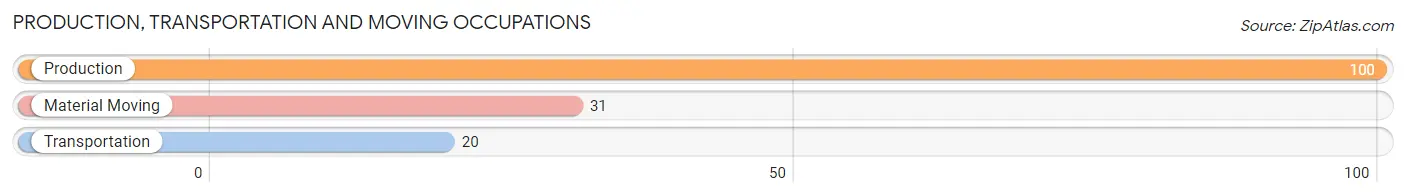
Production, Transportation and Moving Occupations
The most common Production, Transportation and Moving occupations in Dundee are Production (100 | 6.2%), Material Moving (31 | 1.9%), and Transportation (20 | 1.2%).
Production, Transportation and Moving Occupations by Sex
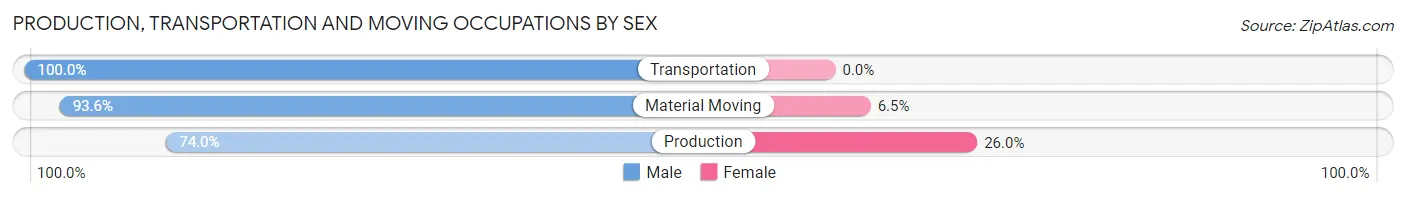
| Occupation | Male | Female |
| Production | 74 (74.0%) | 26 (26.0%) |
| Transportation | 20 (100.0%) | 0 (0.0%) |
| Material Moving | 29 (93.5%) | 2 (6.5%) |
| Total (Category) | 123 (81.5%) | 28 (18.5%) |
| Total (Overall) | 938 (58.0%) | 680 (42.0%) |
Employment Industries by Sex in Dundee
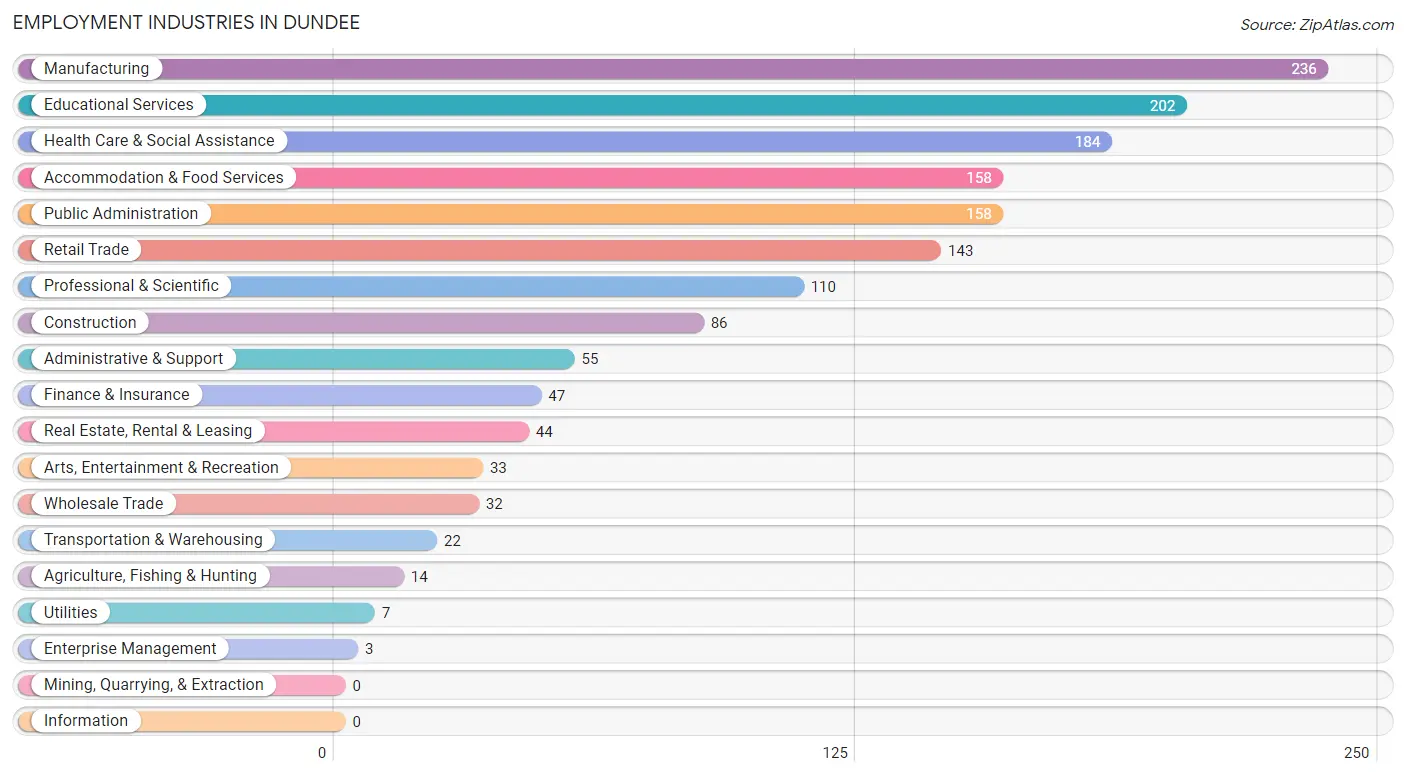
Employment Industries in Dundee
The major employment industries in Dundee include Manufacturing (236 | 14.6%), Educational Services (202 | 12.5%), Health Care & Social Assistance (184 | 11.4%), Accommodation & Food Services (158 | 9.8%), and Public Administration (158 | 9.8%).
Employment Industries by Sex in Dundee
The Dundee industries that see more men than women are Wholesale Trade (100.0%), Transportation & Warehousing (100.0%), and Utilities (100.0%), whereas the industries that tend to have a higher number of women are Educational Services (90.1%), Agriculture, Fishing & Hunting (78.6%), and Finance & Insurance (76.6%).
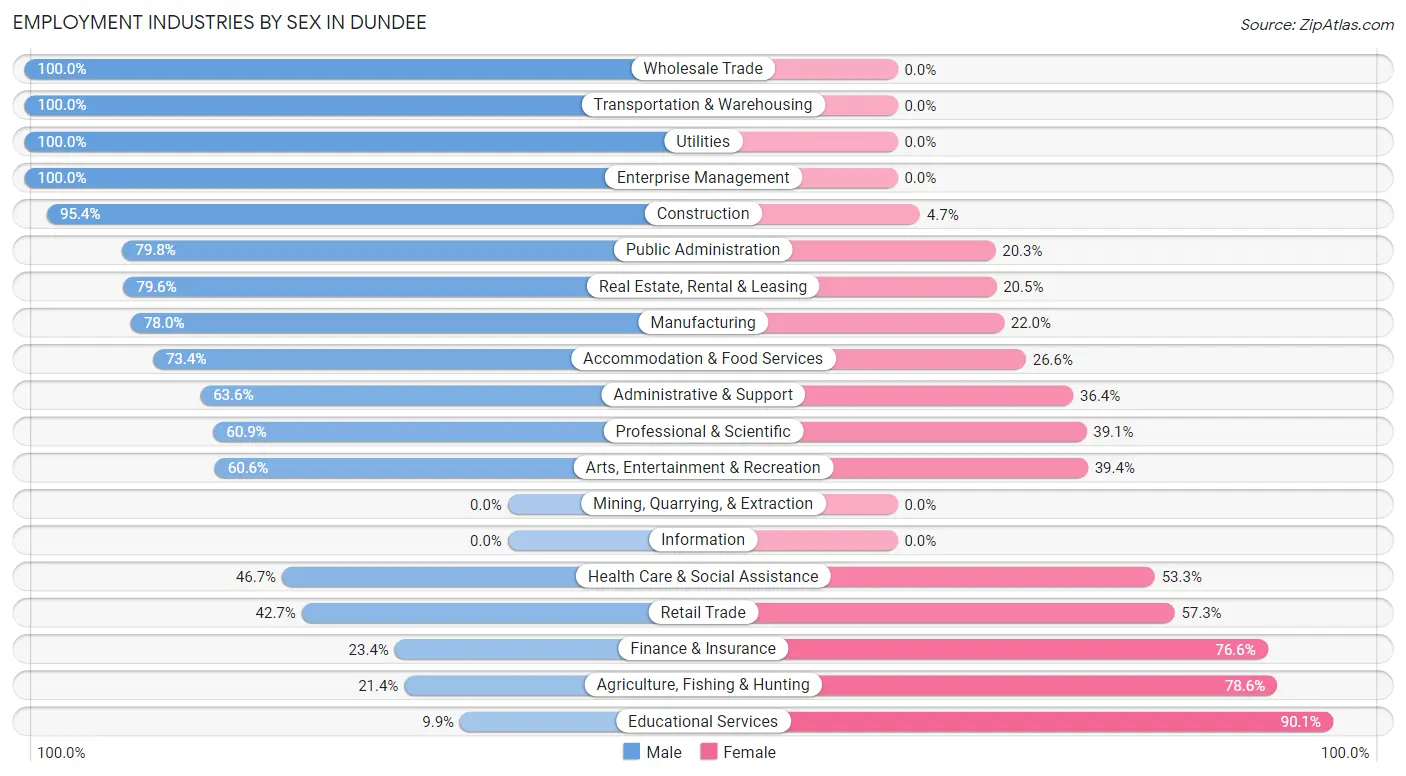
| Industry | Male | Female |
| Agriculture, Fishing & Hunting | 3 (21.4%) | 11 (78.6%) |
| Mining, Quarrying, & Extraction | 0 (0.0%) | 0 (0.0%) |
| Construction | 82 (95.4%) | 4 (4.6%) |
| Manufacturing | 184 (78.0%) | 52 (22.0%) |
| Wholesale Trade | 32 (100.0%) | 0 (0.0%) |
| Retail Trade | 61 (42.7%) | 82 (57.3%) |
| Transportation & Warehousing | 22 (100.0%) | 0 (0.0%) |
| Utilities | 7 (100.0%) | 0 (0.0%) |
| Information | 0 (0.0%) | 0 (0.0%) |
| Finance & Insurance | 11 (23.4%) | 36 (76.6%) |
| Real Estate, Rental & Leasing | 35 (79.5%) | 9 (20.4%) |
| Professional & Scientific | 67 (60.9%) | 43 (39.1%) |
| Enterprise Management | 3 (100.0%) | 0 (0.0%) |
| Administrative & Support | 35 (63.6%) | 20 (36.4%) |
| Educational Services | 20 (9.9%) | 182 (90.1%) |
| Health Care & Social Assistance | 86 (46.7%) | 98 (53.3%) |
| Arts, Entertainment & Recreation | 20 (60.6%) | 13 (39.4%) |
| Accommodation & Food Services | 116 (73.4%) | 42 (26.6%) |
| Public Administration | 126 (79.7%) | 32 (20.3%) |
| Total | 938 (58.0%) | 680 (42.0%) |
Education in Dundee
School Enrollment in Dundee
The most common levels of schooling among the 854 students in Dundee are elementary school (262 | 30.7%), high school (233 | 27.3%), and middle school (161 | 18.9%).
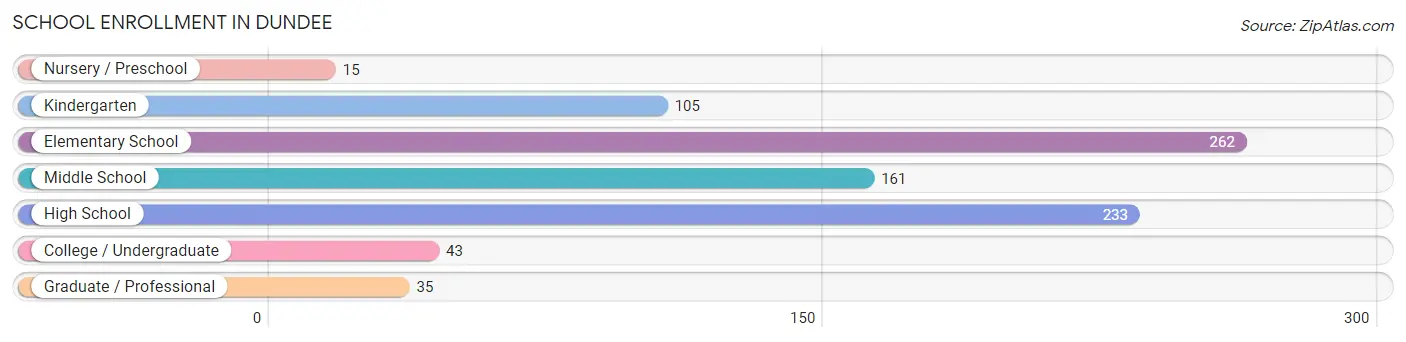
| School Level | # Students | % Students |
| Nursery / Preschool | 15 | 1.8% |
| Kindergarten | 105 | 12.3% |
| Elementary School | 262 | 30.7% |
| Middle School | 161 | 18.9% |
| High School | 233 | 27.3% |
| College / Undergraduate | 43 | 5.0% |
| Graduate / Professional | 35 | 4.1% |
| Total | 854 | 100.0% |
School Enrollment by Age by Funding Source in Dundee
Out of a total of 854 students who are enrolled in schools in Dundee, 131 (15.3%) attend a private institution, while the remaining 723 (84.7%) are enrolled in public schools. The age group of 3 to 4 year olds has the highest likelihood of being enrolled in private schools, with 3 (100.0% in the age bracket) enrolled. Conversely, the age group of 18 to 19 year olds has the lowest likelihood of being enrolled in a private school, with 8 (100.0% in the age bracket) attending a public institution.
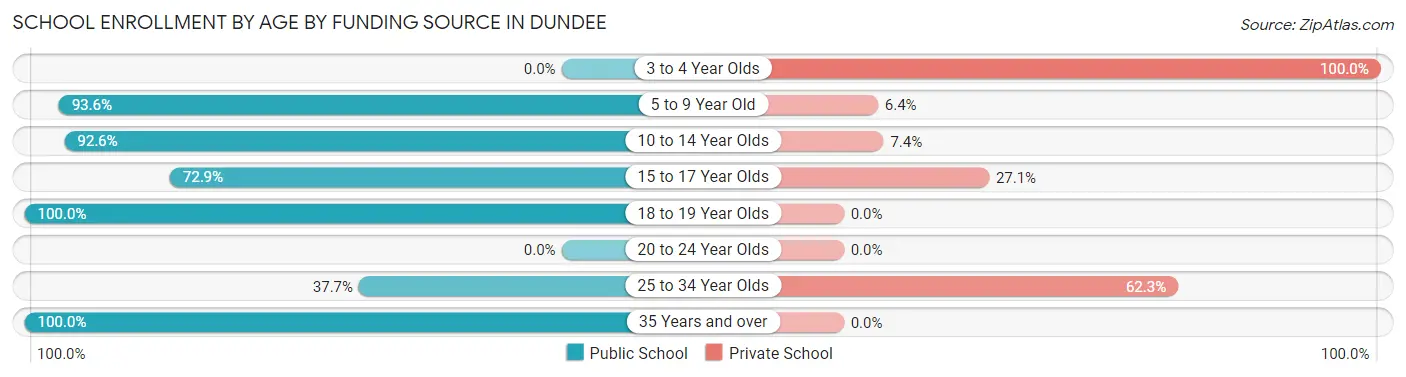
| Age Bracket | Public School | Private School |
| 3 to 4 Year Olds | 0 (0.0%) | 3 (100.0%) |
| 5 to 9 Year Old | 324 (93.6%) | 22 (6.4%) |
| 10 to 14 Year Olds | 175 (92.6%) | 14 (7.4%) |
| 15 to 17 Year Olds | 159 (72.9%) | 59 (27.1%) |
| 18 to 19 Year Olds | 8 (100.0%) | 0 (0.0%) |
| 20 to 24 Year Olds | 0 (0.0%) | 0 (0.0%) |
| 25 to 34 Year Olds | 20 (37.7%) | 33 (62.3%) |
| 35 Years and over | 37 (100.0%) | 0 (0.0%) |
| Total | 723 (84.7%) | 131 (15.3%) |
Educational Attainment by Field of Study in Dundee
Bio, nature & agricultural (136 | 15.5%), business (126 | 14.4%), science & technology (114 | 13.0%), liberal arts & history (78 | 8.9%), and education (74 | 8.5%) are the most common fields of study among 875 individuals in Dundee who have obtained a bachelor's degree or higher.
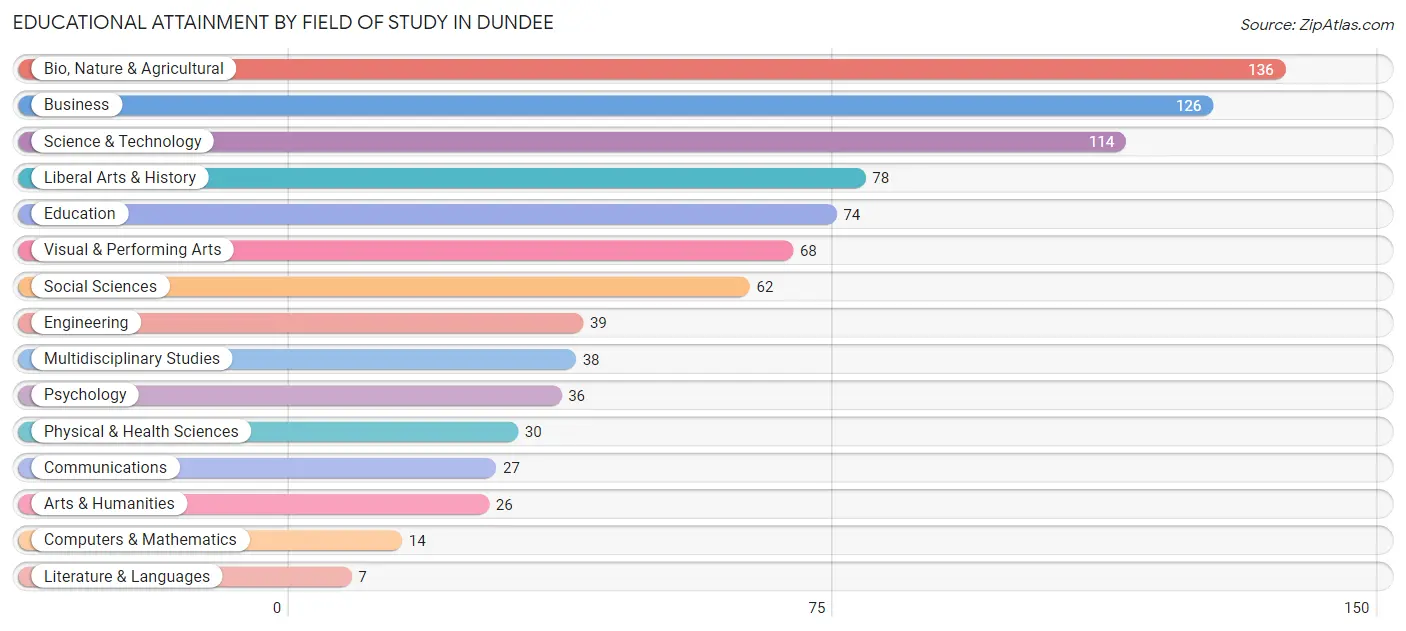
| Field of Study | # Graduates | % Graduates |
| Computers & Mathematics | 14 | 1.6% |
| Bio, Nature & Agricultural | 136 | 15.5% |
| Physical & Health Sciences | 30 | 3.4% |
| Psychology | 36 | 4.1% |
| Social Sciences | 62 | 7.1% |
| Engineering | 39 | 4.5% |
| Multidisciplinary Studies | 38 | 4.3% |
| Science & Technology | 114 | 13.0% |
| Business | 126 | 14.4% |
| Education | 74 | 8.5% |
| Literature & Languages | 7 | 0.8% |
| Liberal Arts & History | 78 | 8.9% |
| Visual & Performing Arts | 68 | 7.8% |
| Communications | 27 | 3.1% |
| Arts & Humanities | 26 | 3.0% |
| Total | 875 | 100.0% |
Transportation & Commute in Dundee
Vehicle Availability by Sex in Dundee
The most prevalent vehicle ownership categories in Dundee are males with 3 vehicles (281, accounting for 30.7%) and females with 3 vehicles (289, making up 44.0%).
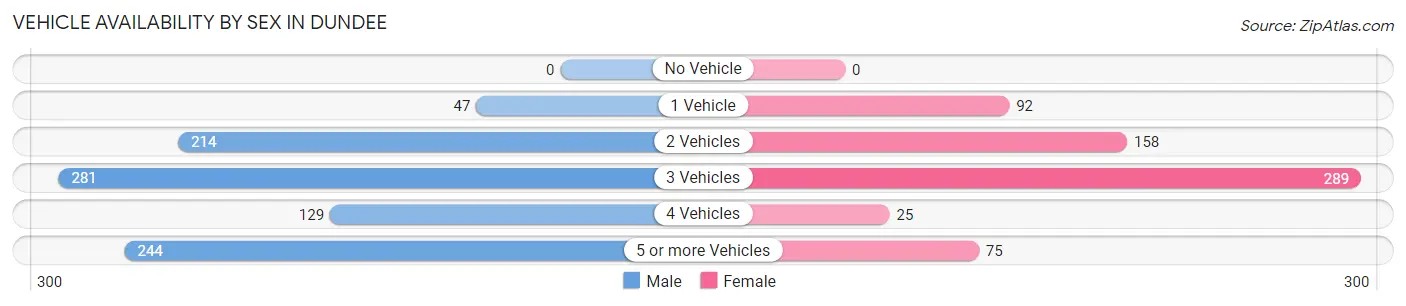
| Vehicles Available | Male | Female |
| No Vehicle | 0 (0.0%) | 0 (0.0%) |
| 1 Vehicle | 47 (5.1%) | 92 (14.4%) |
| 2 Vehicles | 214 (23.4%) | 158 (24.7%) |
| 3 Vehicles | 281 (30.7%) | 289 (45.2%) |
| 4 Vehicles | 129 (14.1%) | 25 (3.9%) |
| 5 or more Vehicles | 244 (26.7%) | 75 (11.7%) |
| Total | 915 (100.0%) | 639 (100.0%) |
Commute Time in Dundee
The most frequently occuring commute durations in Dundee are 10 to 14 minutes (349 commuters, 25.3%), less than 5 minutes (182 commuters, 13.2%), and 15 to 19 minutes (180 commuters, 13.0%).
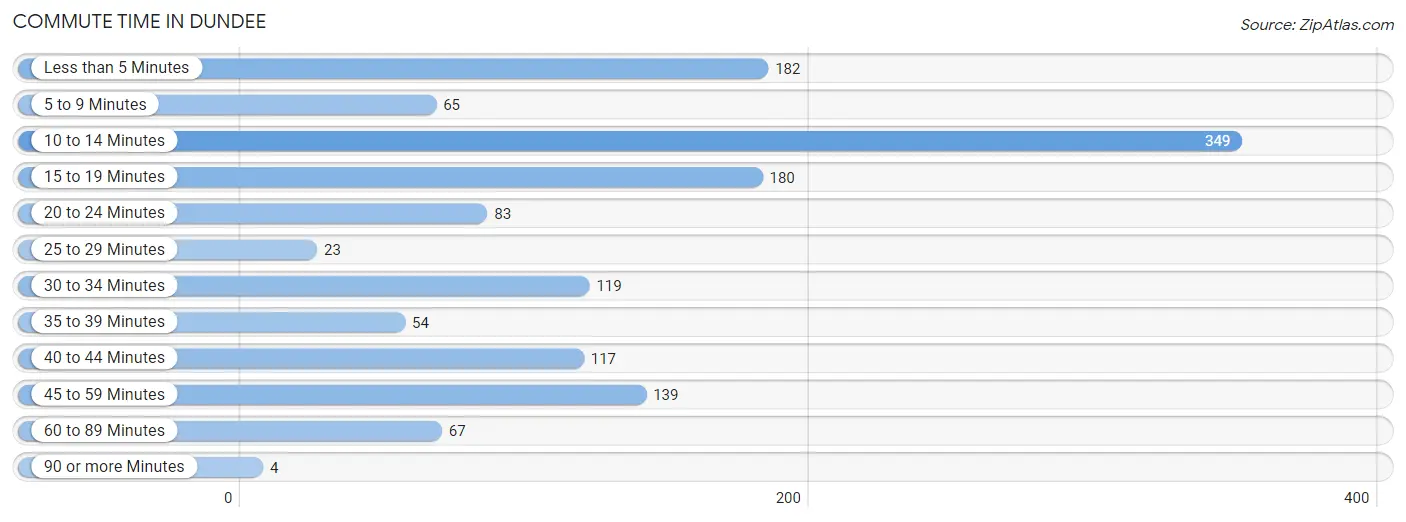
| Commute Time | # Commuters | % Commuters |
| Less than 5 Minutes | 182 | 13.2% |
| 5 to 9 Minutes | 65 | 4.7% |
| 10 to 14 Minutes | 349 | 25.3% |
| 15 to 19 Minutes | 180 | 13.0% |
| 20 to 24 Minutes | 83 | 6.0% |
| 25 to 29 Minutes | 23 | 1.7% |
| 30 to 34 Minutes | 119 | 8.6% |
| 35 to 39 Minutes | 54 | 3.9% |
| 40 to 44 Minutes | 117 | 8.5% |
| 45 to 59 Minutes | 139 | 10.1% |
| 60 to 89 Minutes | 67 | 4.9% |
| 90 or more Minutes | 4 | 0.3% |
Commute Time by Sex in Dundee
The most common commute times in Dundee are 10 to 14 minutes (277 commuters, 32.9%) for males and 15 to 19 minutes (147 commuters, 27.3%) for females.
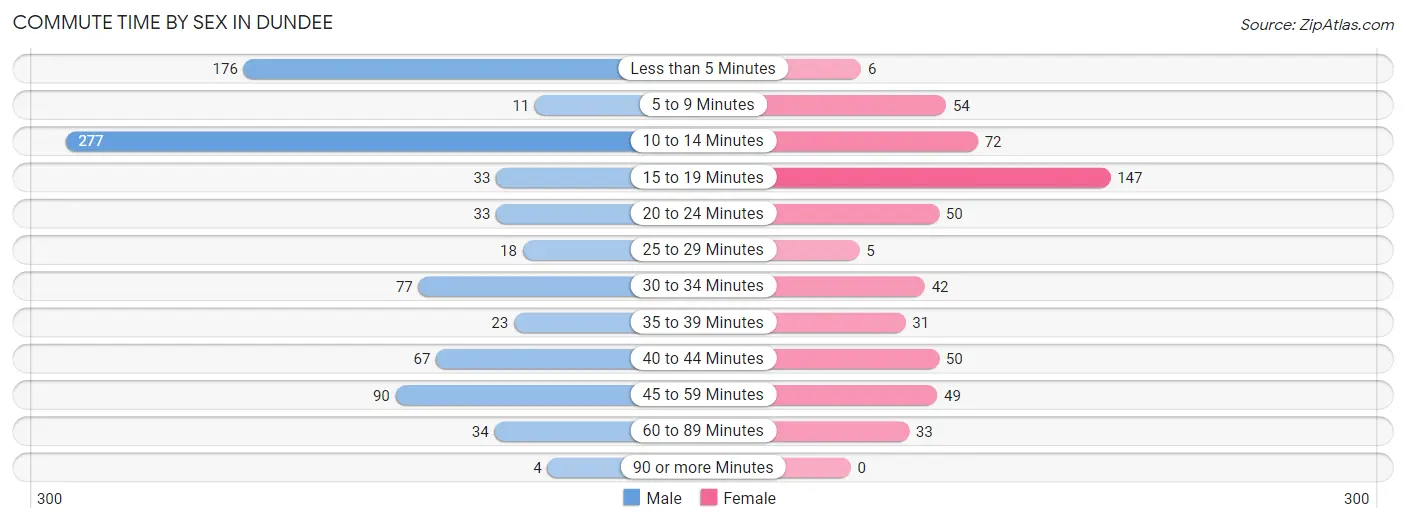
| Commute Time | Male | Female |
| Less than 5 Minutes | 176 (20.9%) | 6 (1.1%) |
| 5 to 9 Minutes | 11 (1.3%) | 54 (10.0%) |
| 10 to 14 Minutes | 277 (32.9%) | 72 (13.4%) |
| 15 to 19 Minutes | 33 (3.9%) | 147 (27.3%) |
| 20 to 24 Minutes | 33 (3.9%) | 50 (9.3%) |
| 25 to 29 Minutes | 18 (2.1%) | 5 (0.9%) |
| 30 to 34 Minutes | 77 (9.1%) | 42 (7.8%) |
| 35 to 39 Minutes | 23 (2.7%) | 31 (5.8%) |
| 40 to 44 Minutes | 67 (8.0%) | 50 (9.3%) |
| 45 to 59 Minutes | 90 (10.7%) | 49 (9.1%) |
| 60 to 89 Minutes | 34 (4.0%) | 33 (6.1%) |
| 90 or more Minutes | 4 (0.5%) | 0 (0.0%) |
Time of Departure to Work by Sex in Dundee
The most frequent times of departure to work in Dundee are 10:00 AM to 10:59 AM (162, 19.2%) for males and 12:00 PM to 3:59 PM (113, 21.0%) for females.
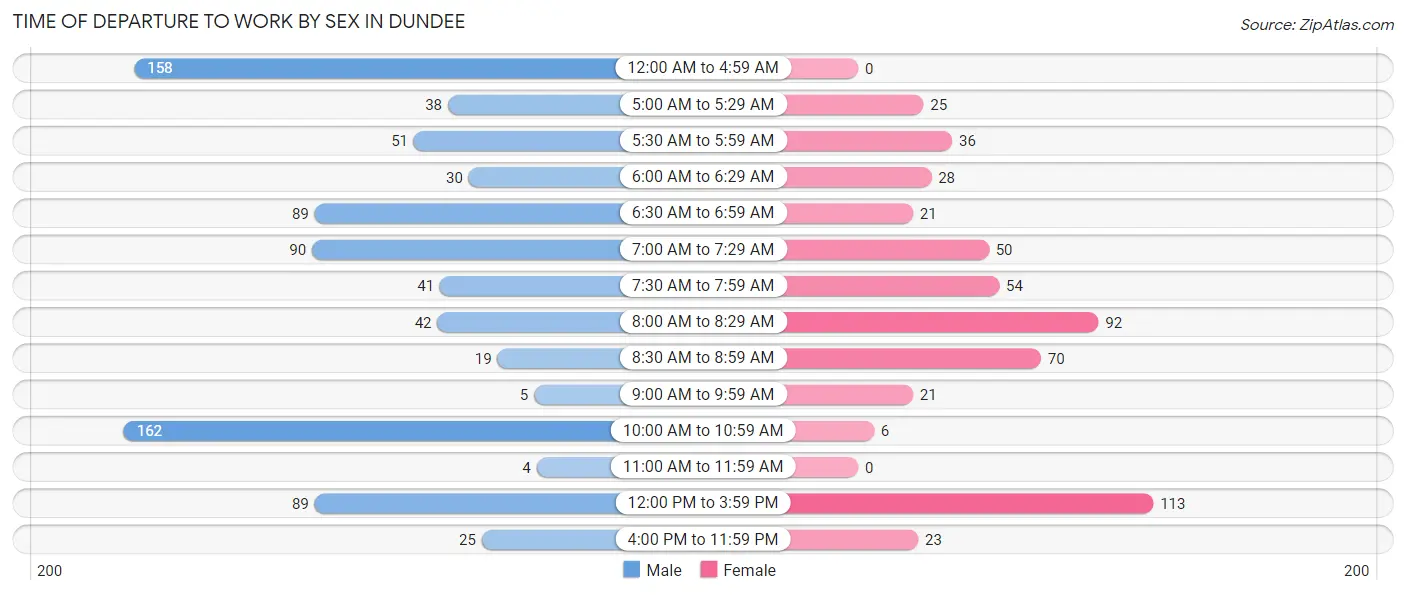
| Time of Departure | Male | Female |
| 12:00 AM to 4:59 AM | 158 (18.7%) | 0 (0.0%) |
| 5:00 AM to 5:29 AM | 38 (4.5%) | 25 (4.6%) |
| 5:30 AM to 5:59 AM | 51 (6.0%) | 36 (6.7%) |
| 6:00 AM to 6:29 AM | 30 (3.6%) | 28 (5.2%) |
| 6:30 AM to 6:59 AM | 89 (10.6%) | 21 (3.9%) |
| 7:00 AM to 7:29 AM | 90 (10.7%) | 50 (9.3%) |
| 7:30 AM to 7:59 AM | 41 (4.9%) | 54 (10.0%) |
| 8:00 AM to 8:29 AM | 42 (5.0%) | 92 (17.1%) |
| 8:30 AM to 8:59 AM | 19 (2.2%) | 70 (13.0%) |
| 9:00 AM to 9:59 AM | 5 (0.6%) | 21 (3.9%) |
| 10:00 AM to 10:59 AM | 162 (19.2%) | 6 (1.1%) |
| 11:00 AM to 11:59 AM | 4 (0.5%) | 0 (0.0%) |
| 12:00 PM to 3:59 PM | 89 (10.6%) | 113 (21.0%) |
| 4:00 PM to 11:59 PM | 25 (3.0%) | 23 (4.3%) |
| Total | 843 (100.0%) | 539 (100.0%) |
Housing Occupancy in Dundee
Occupancy by Ownership in Dundee
Of the total 1,080 dwellings in Dundee, owner-occupied units account for 966 (89.4%), while renter-occupied units make up 114 (10.6%).
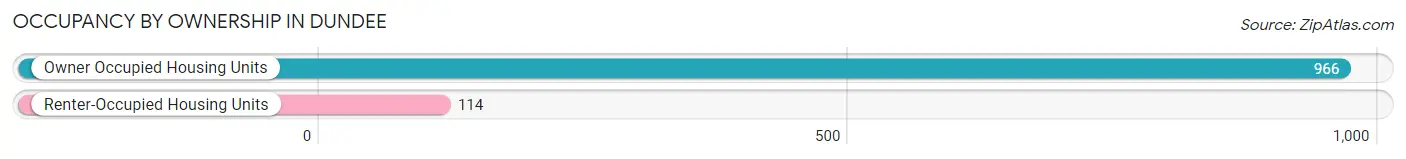
| Occupancy | # Housing Units | % Housing Units |
| Owner Occupied Housing Units | 966 | 89.4% |
| Renter-Occupied Housing Units | 114 | 10.6% |
| Total Occupied Housing Units | 1,080 | 100.0% |
Occupancy by Household Size in Dundee
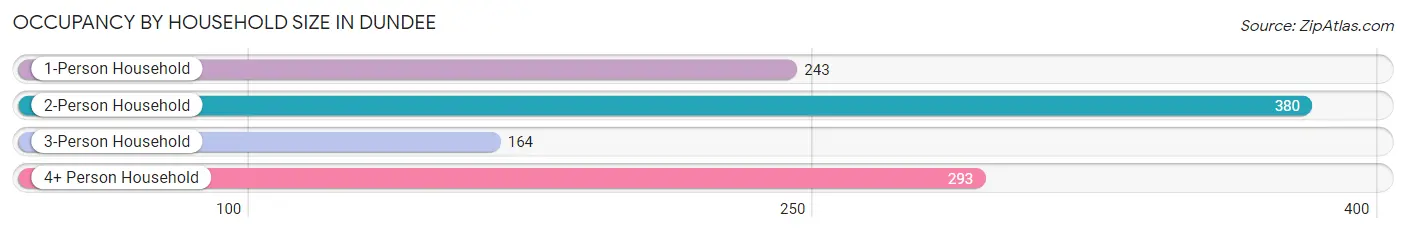
| Household Size | # Housing Units | % Housing Units |
| 1-Person Household | 243 | 22.5% |
| 2-Person Household | 380 | 35.2% |
| 3-Person Household | 164 | 15.2% |
| 4+ Person Household | 293 | 27.1% |
| Total Housing Units | 1,080 | 100.0% |
Occupancy by Ownership by Household Size in Dundee
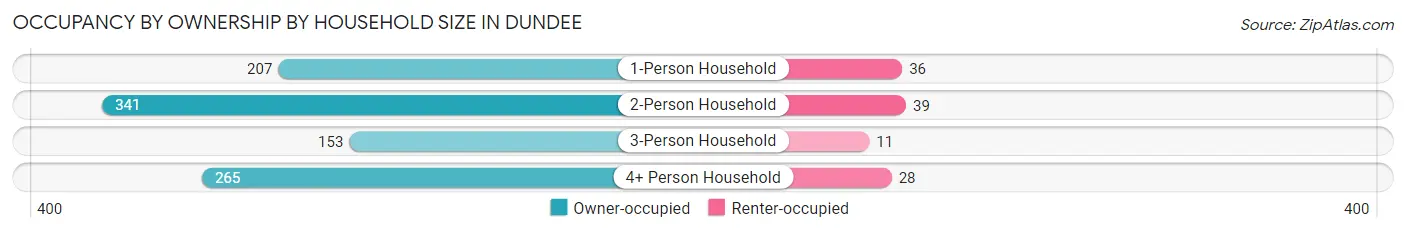
| Household Size | Owner-occupied | Renter-occupied |
| 1-Person Household | 207 (85.2%) | 36 (14.8%) |
| 2-Person Household | 341 (89.7%) | 39 (10.3%) |
| 3-Person Household | 153 (93.3%) | 11 (6.7%) |
| 4+ Person Household | 265 (90.4%) | 28 (9.6%) |
| Total Housing Units | 966 (89.4%) | 114 (10.6%) |
Occupancy by Educational Attainment in Dundee
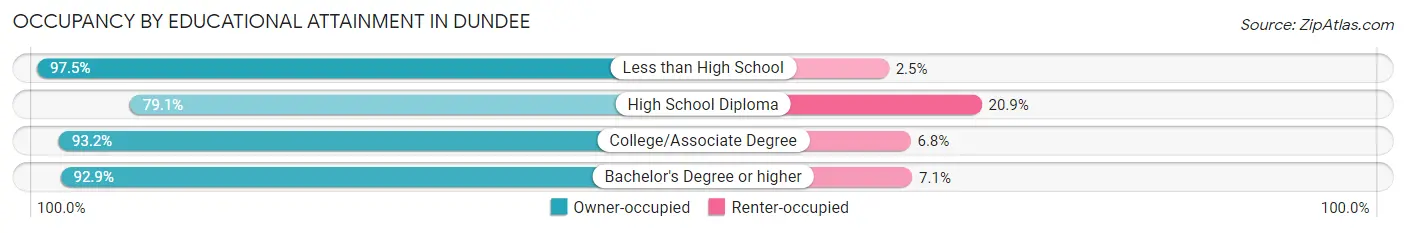
| Household Size | Owner-occupied | Renter-occupied |
| Less than High School | 118 (97.5%) | 3 (2.5%) |
| High School Diploma | 250 (79.1%) | 66 (20.9%) |
| College/Associate Degree | 260 (93.2%) | 19 (6.8%) |
| Bachelor's Degree or higher | 338 (92.9%) | 26 (7.1%) |
Occupancy by Age of Householder in Dundee
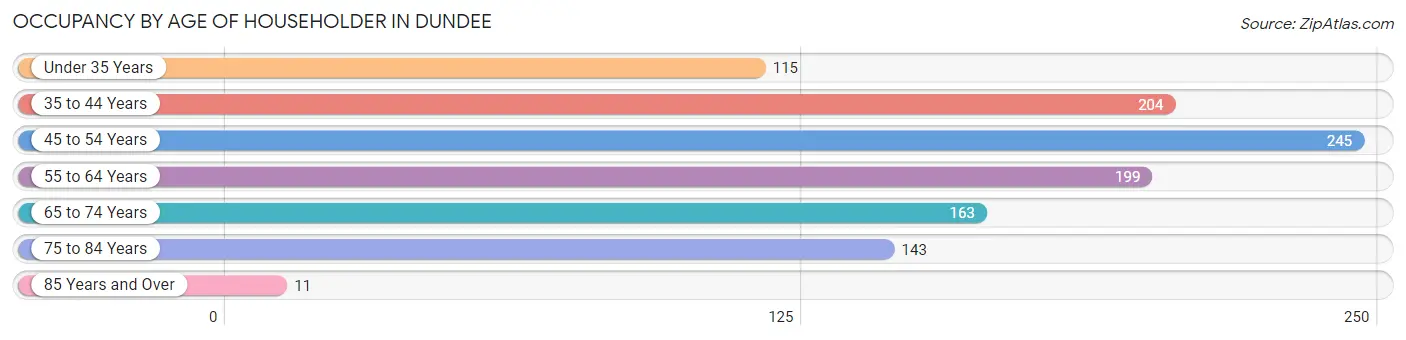
| Age Bracket | # Households | % Households |
| Under 35 Years | 115 | 10.6% |
| 35 to 44 Years | 204 | 18.9% |
| 45 to 54 Years | 245 | 22.7% |
| 55 to 64 Years | 199 | 18.4% |
| 65 to 74 Years | 163 | 15.1% |
| 75 to 84 Years | 143 | 13.2% |
| 85 Years and Over | 11 | 1.0% |
| Total | 1,080 | 100.0% |
Housing Finances in Dundee
Median Income by Occupancy in Dundee
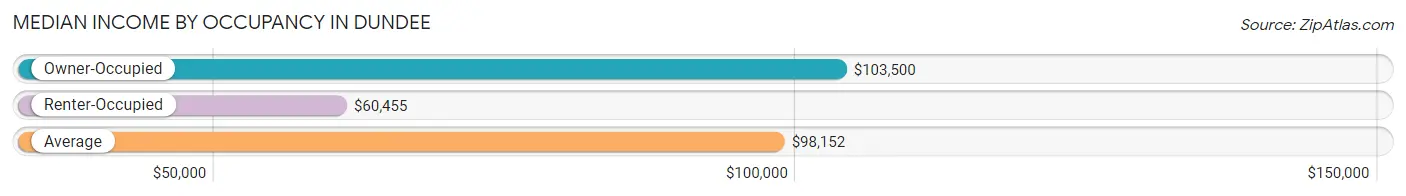
| Occupancy Type | # Households | Median Income |
| Owner-Occupied | 966 (89.4%) | $103,500 |
| Renter-Occupied | 114 (10.6%) | $60,455 |
| Average | 1,080 (100.0%) | $98,152 |
Occupancy by Householder Income Bracket in Dundee
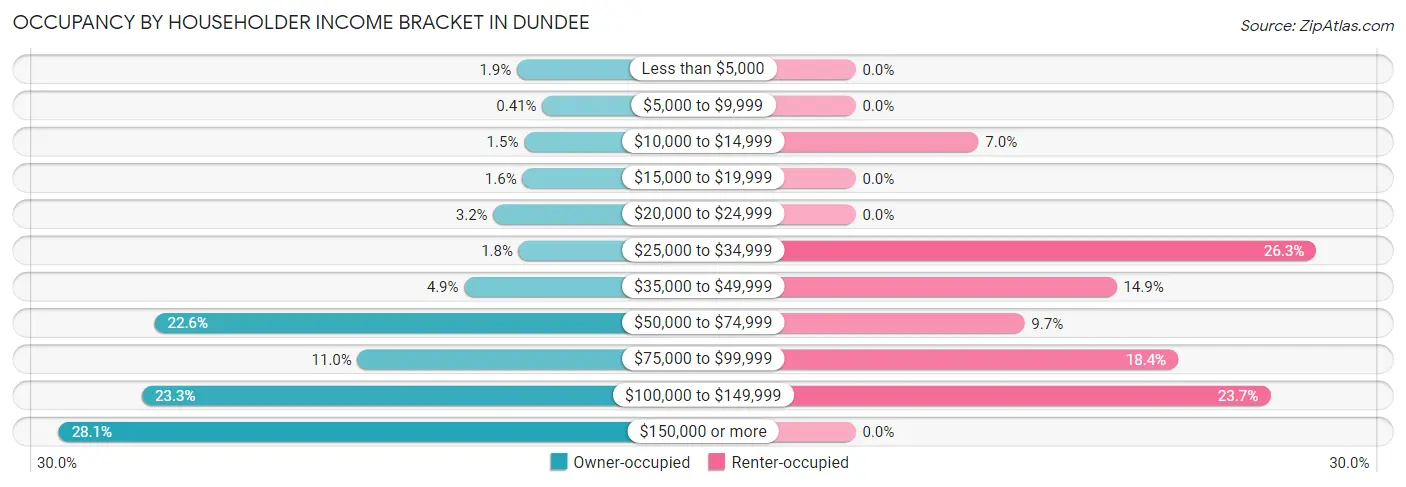
| Income Bracket | Owner-occupied | Renter-occupied |
| Less than $5,000 | 18 (1.9%) | 0 (0.0%) |
| $5,000 to $9,999 | 4 (0.4%) | 0 (0.0%) |
| $10,000 to $14,999 | 14 (1.5%) | 8 (7.0%) |
| $15,000 to $19,999 | 15 (1.5%) | 0 (0.0%) |
| $20,000 to $24,999 | 31 (3.2%) | 0 (0.0%) |
| $25,000 to $34,999 | 17 (1.8%) | 30 (26.3%) |
| $35,000 to $49,999 | 47 (4.9%) | 17 (14.9%) |
| $50,000 to $74,999 | 218 (22.6%) | 11 (9.7%) |
| $75,000 to $99,999 | 106 (11.0%) | 21 (18.4%) |
| $100,000 to $149,999 | 225 (23.3%) | 27 (23.7%) |
| $150,000 or more | 271 (28.1%) | 0 (0.0%) |
| Total | 966 (100.0%) | 114 (100.0%) |
Monthly Housing Cost Tiers in Dundee
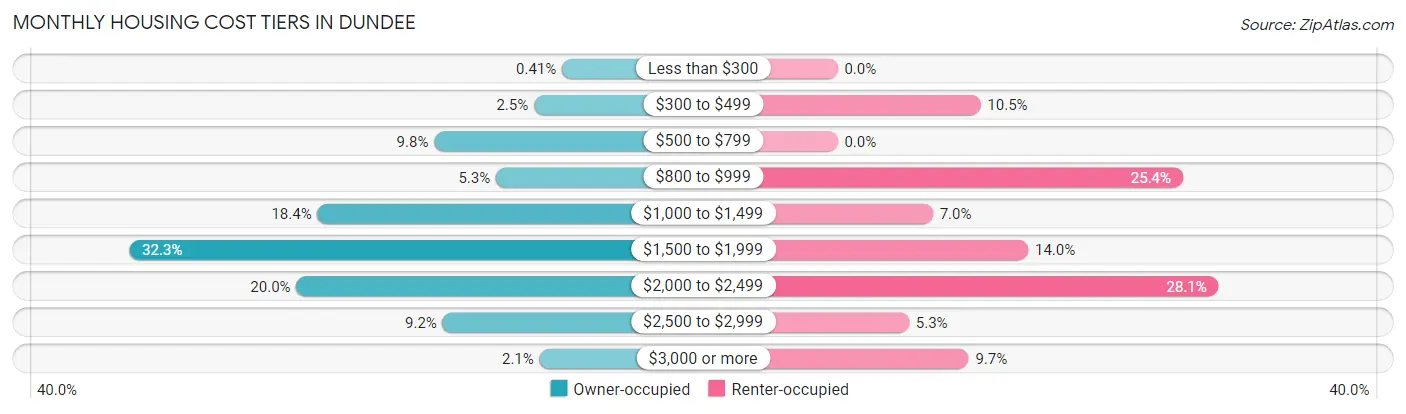
| Monthly Cost | Owner-occupied | Renter-occupied |
| Less than $300 | 4 (0.4%) | 0 (0.0%) |
| $300 to $499 | 24 (2.5%) | 12 (10.5%) |
| $500 to $799 | 95 (9.8%) | 0 (0.0%) |
| $800 to $999 | 51 (5.3%) | 29 (25.4%) |
| $1,000 to $1,499 | 178 (18.4%) | 8 (7.0%) |
| $1,500 to $1,999 | 312 (32.3%) | 16 (14.0%) |
| $2,000 to $2,499 | 193 (20.0%) | 32 (28.1%) |
| $2,500 to $2,999 | 89 (9.2%) | 6 (5.3%) |
| $3,000 or more | 20 (2.1%) | 11 (9.7%) |
| Total | 966 (100.0%) | 114 (100.0%) |
Physical Housing Characteristics in Dundee
Housing Structures in Dundee
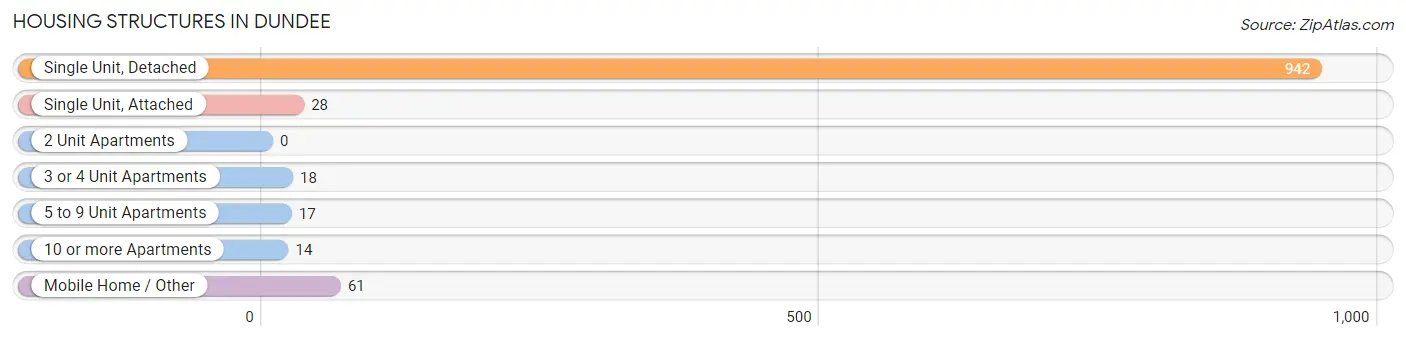
| Structure Type | # Housing Units | % Housing Units |
| Single Unit, Detached | 942 | 87.2% |
| Single Unit, Attached | 28 | 2.6% |
| 2 Unit Apartments | 0 | 0.0% |
| 3 or 4 Unit Apartments | 18 | 1.7% |
| 5 to 9 Unit Apartments | 17 | 1.6% |
| 10 or more Apartments | 14 | 1.3% |
| Mobile Home / Other | 61 | 5.7% |
| Total | 1,080 | 100.0% |
Housing Structures by Occupancy in Dundee
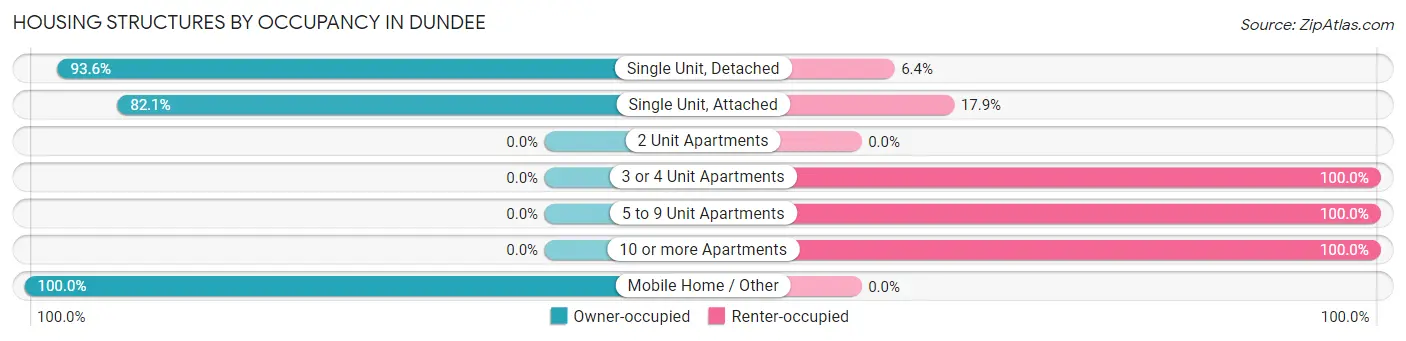
| Structure Type | Owner-occupied | Renter-occupied |
| Single Unit, Detached | 882 (93.6%) | 60 (6.4%) |
| Single Unit, Attached | 23 (82.1%) | 5 (17.9%) |
| 2 Unit Apartments | 0 (0.0%) | 0 (0.0%) |
| 3 or 4 Unit Apartments | 0 (0.0%) | 18 (100.0%) |
| 5 to 9 Unit Apartments | 0 (0.0%) | 17 (100.0%) |
| 10 or more Apartments | 0 (0.0%) | 14 (100.0%) |
| Mobile Home / Other | 61 (100.0%) | 0 (0.0%) |
| Total | 966 (89.4%) | 114 (10.6%) |
Housing Structures by Number of Rooms in Dundee
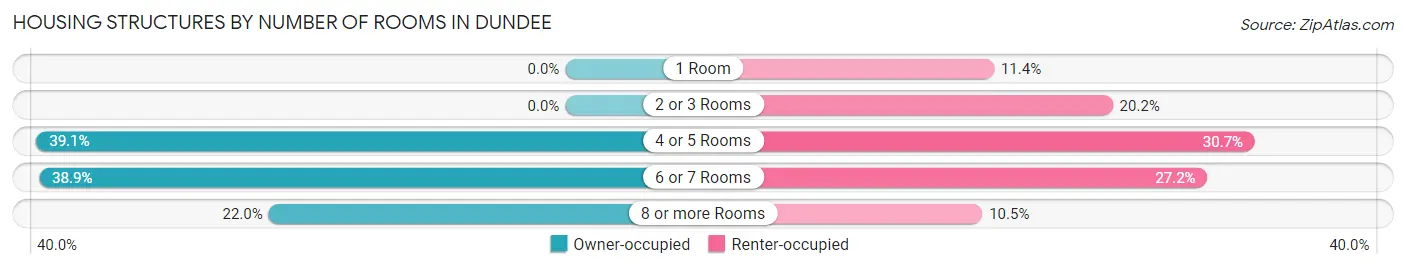
| Number of Rooms | Owner-occupied | Renter-occupied |
| 1 Room | 0 (0.0%) | 13 (11.4%) |
| 2 or 3 Rooms | 0 (0.0%) | 23 (20.2%) |
| 4 or 5 Rooms | 378 (39.1%) | 35 (30.7%) |
| 6 or 7 Rooms | 376 (38.9%) | 31 (27.2%) |
| 8 or more Rooms | 212 (22.0%) | 12 (10.5%) |
| Total | 966 (100.0%) | 114 (100.0%) |
Housing Structure by Heating Type in Dundee
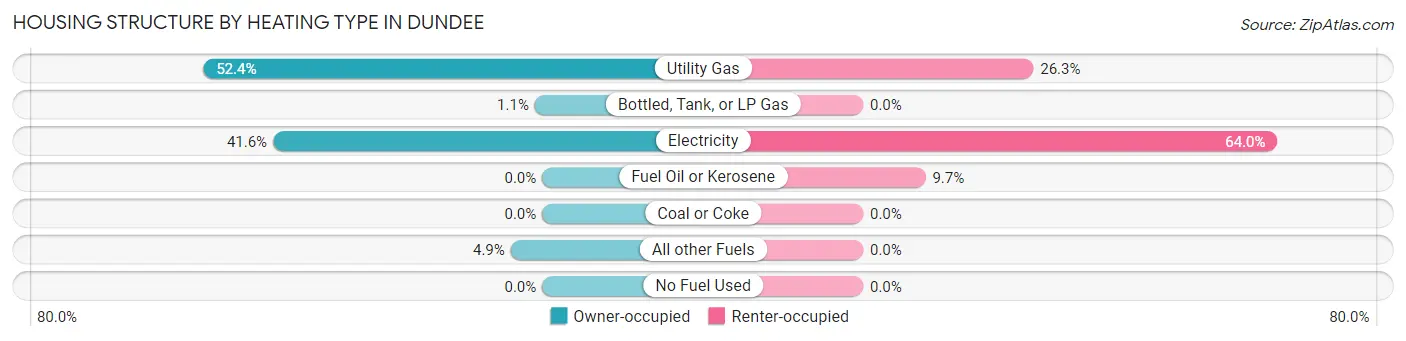
| Heating Type | Owner-occupied | Renter-occupied |
| Utility Gas | 506 (52.4%) | 30 (26.3%) |
| Bottled, Tank, or LP Gas | 11 (1.1%) | 0 (0.0%) |
| Electricity | 402 (41.6%) | 73 (64.0%) |
| Fuel Oil or Kerosene | 0 (0.0%) | 11 (9.7%) |
| Coal or Coke | 0 (0.0%) | 0 (0.0%) |
| All other Fuels | 47 (4.9%) | 0 (0.0%) |
| No Fuel Used | 0 (0.0%) | 0 (0.0%) |
| Total | 966 (100.0%) | 114 (100.0%) |
Household Vehicle Usage in Dundee
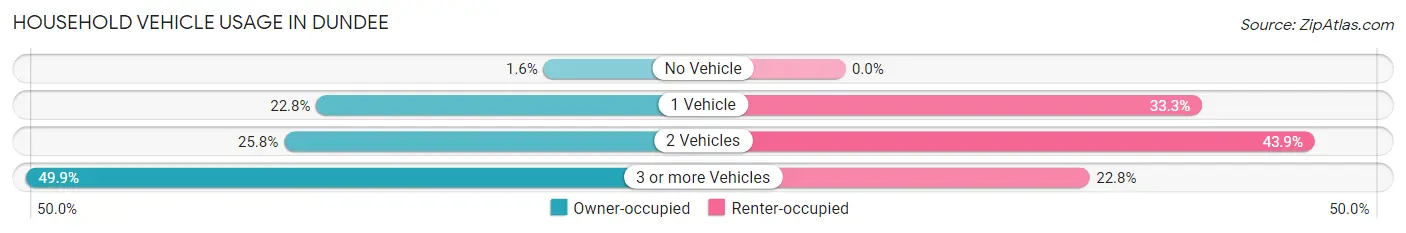
| Vehicles per Household | Owner-occupied | Renter-occupied |
| No Vehicle | 15 (1.5%) | 0 (0.0%) |
| 1 Vehicle | 220 (22.8%) | 38 (33.3%) |
| 2 Vehicles | 249 (25.8%) | 50 (43.9%) |
| 3 or more Vehicles | 482 (49.9%) | 26 (22.8%) |
| Total | 966 (100.0%) | 114 (100.0%) |
Real Estate & Mortgages in Dundee
Real Estate and Mortgage Overview in Dundee
| Characteristic | Without Mortgage | With Mortgage |
| Housing Units | 233 | 733 |
| Median Property Value | $446,200 | $431,900 |
| Median Household Income | $81,103 | $254 |
| Monthly Housing Costs | $785 | $20 |
| Real Estate Taxes | $3,783 | $5 |
Property Value by Mortgage Status in Dundee
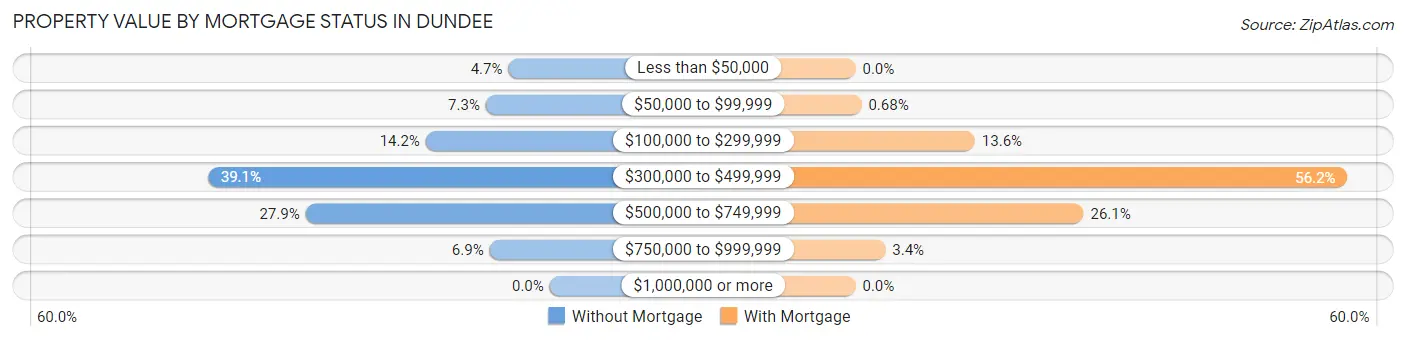
| Property Value | Without Mortgage | With Mortgage |
| Less than $50,000 | 11 (4.7%) | 0 (0.0%) |
| $50,000 to $99,999 | 17 (7.3%) | 5 (0.7%) |
| $100,000 to $299,999 | 33 (14.2%) | 100 (13.6%) |
| $300,000 to $499,999 | 91 (39.1%) | 412 (56.2%) |
| $500,000 to $749,999 | 65 (27.9%) | 191 (26.1%) |
| $750,000 to $999,999 | 16 (6.9%) | 25 (3.4%) |
| $1,000,000 or more | 0 (0.0%) | 0 (0.0%) |
| Total | 233 (100.0%) | 733 (100.0%) |
Household Income by Mortgage Status in Dundee
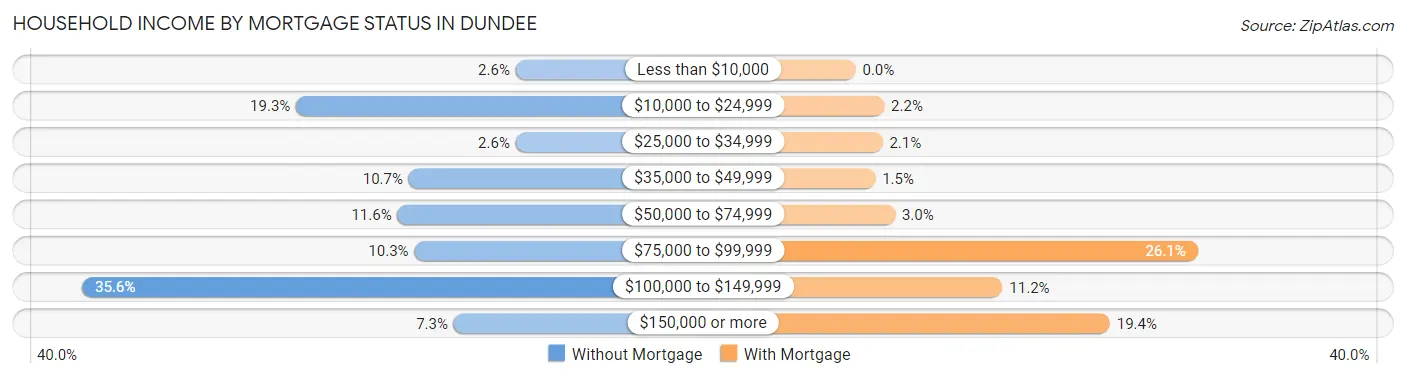
| Household Income | Without Mortgage | With Mortgage |
| Less than $10,000 | 6 (2.6%) | 0 (0.0%) |
| $10,000 to $24,999 | 45 (19.3%) | 16 (2.2%) |
| $25,000 to $34,999 | 6 (2.6%) | 15 (2.1%) |
| $35,000 to $49,999 | 25 (10.7%) | 11 (1.5%) |
| $50,000 to $74,999 | 27 (11.6%) | 22 (3.0%) |
| $75,000 to $99,999 | 24 (10.3%) | 191 (26.1%) |
| $100,000 to $149,999 | 83 (35.6%) | 82 (11.2%) |
| $150,000 or more | 17 (7.3%) | 142 (19.4%) |
| Total | 233 (100.0%) | 733 (100.0%) |
Property Value to Household Income Ratio in Dundee
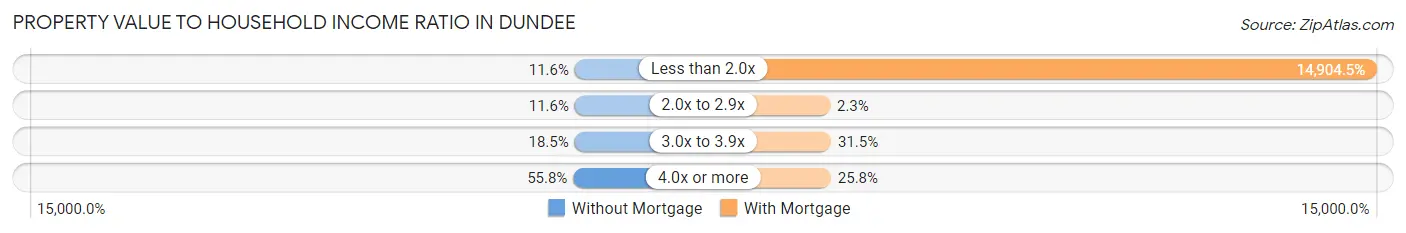
| Value-to-Income Ratio | Without Mortgage | With Mortgage |
| Less than 2.0x | 27 (11.6%) | 109,250 (14,904.5%) |
| 2.0x to 2.9x | 27 (11.6%) | 17 (2.3%) |
| 3.0x to 3.9x | 43 (18.4%) | 231 (31.5%) |
| 4.0x or more | 130 (55.8%) | 189 (25.8%) |
| Total | 233 (100.0%) | 733 (100.0%) |
Real Estate Taxes by Mortgage Status in Dundee
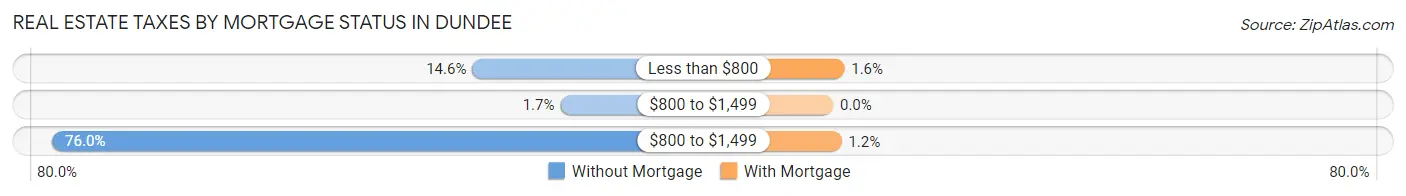
| Property Taxes | Without Mortgage | With Mortgage |
| Less than $800 | 34 (14.6%) | 12 (1.6%) |
| $800 to $1,499 | 4 (1.7%) | 0 (0.0%) |
| $800 to $1,499 | 177 (76.0%) | 9 (1.2%) |
| Total | 233 (100.0%) | 733 (100.0%) |
Health & Disability in Dundee
Health Insurance Coverage by Age in Dundee
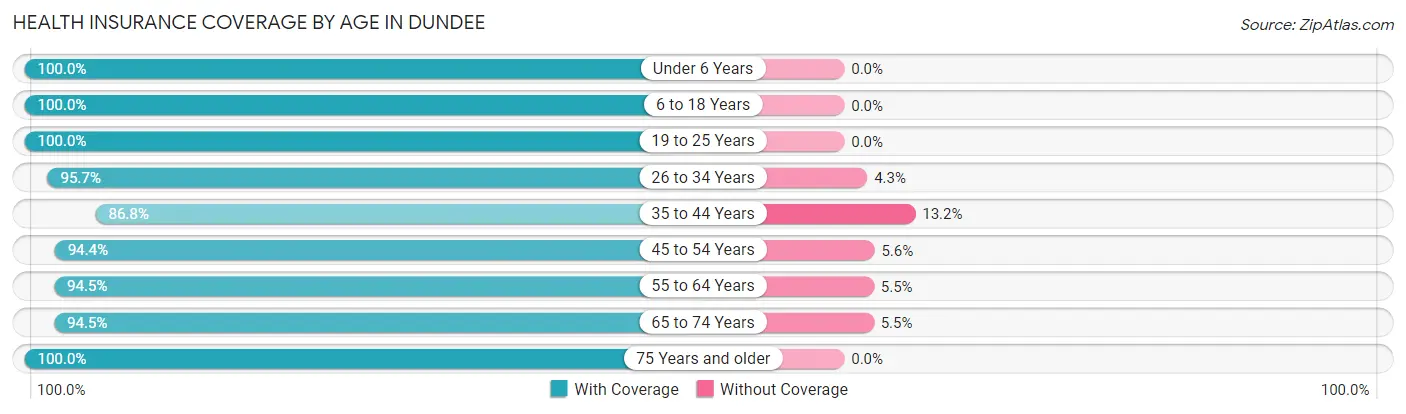
| Age Bracket | With Coverage | Without Coverage |
| Under 6 Years | 169 (100.0%) | 0 (0.0%) |
| 6 to 18 Years | 828 (100.0%) | 0 (0.0%) |
| 19 to 25 Years | 236 (100.0%) | 0 (0.0%) |
| 26 to 34 Years | 179 (95.7%) | 8 (4.3%) |
| 35 to 44 Years | 380 (86.8%) | 58 (13.2%) |
| 45 to 54 Years | 486 (94.4%) | 29 (5.6%) |
| 55 to 64 Years | 326 (94.5%) | 19 (5.5%) |
| 65 to 74 Years | 258 (94.5%) | 15 (5.5%) |
| 75 Years and older | 233 (100.0%) | 0 (0.0%) |
| Total | 3,095 (96.0%) | 129 (4.0%) |
Health Insurance Coverage by Citizenship Status in Dundee
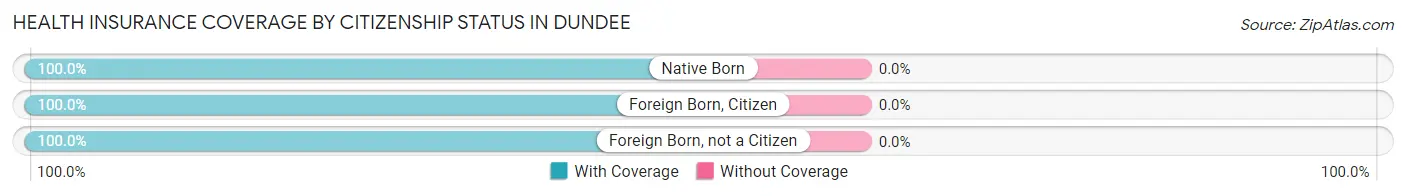
| Citizenship Status | With Coverage | Without Coverage |
| Native Born | 169 (100.0%) | 0 (0.0%) |
| Foreign Born, Citizen | 828 (100.0%) | 0 (0.0%) |
| Foreign Born, not a Citizen | 236 (100.0%) | 0 (0.0%) |
Health Insurance Coverage by Household Income in Dundee
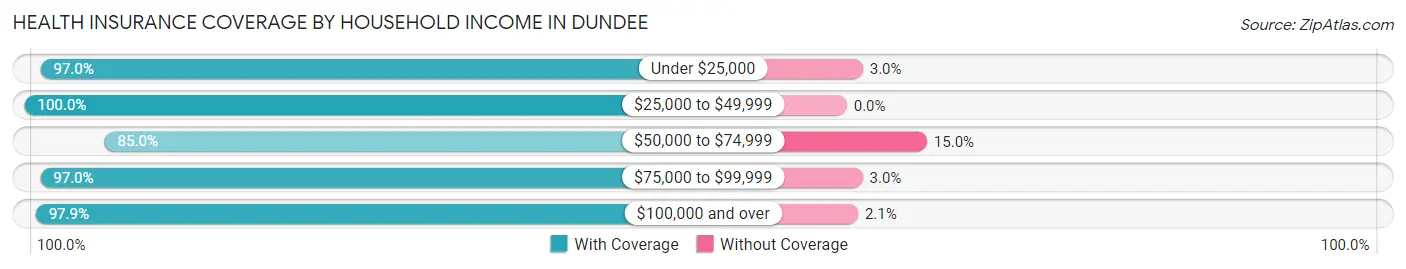
| Household Income | With Coverage | Without Coverage |
| Under $25,000 | 97 (97.0%) | 3 (3.0%) |
| $25,000 to $49,999 | 260 (100.0%) | 0 (0.0%) |
| $50,000 to $74,999 | 419 (85.0%) | 74 (15.0%) |
| $75,000 to $99,999 | 295 (97.0%) | 9 (3.0%) |
| $100,000 and over | 2,013 (97.9%) | 43 (2.1%) |
Public vs Private Health Insurance Coverage by Age in Dundee
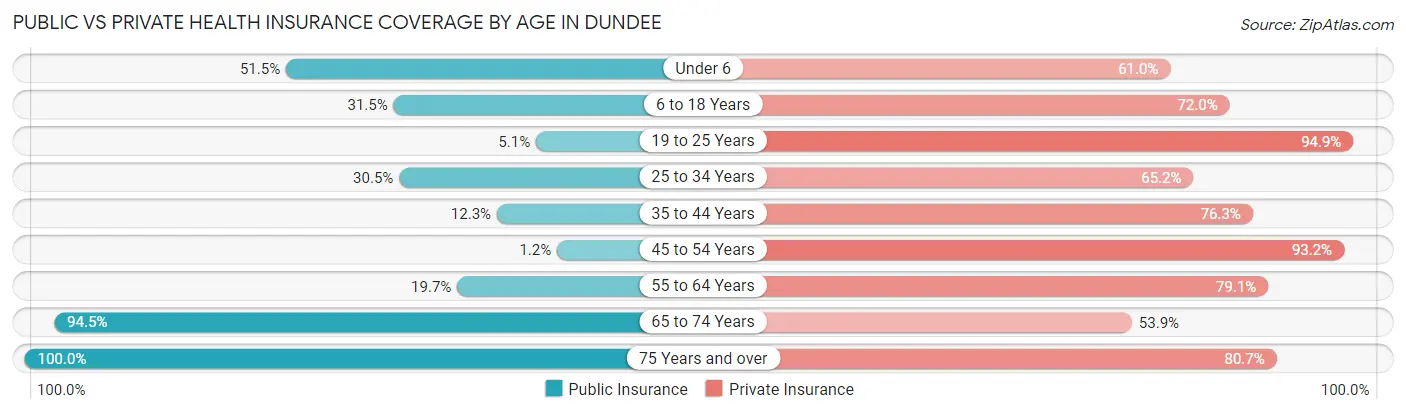
| Age Bracket | Public Insurance | Private Insurance |
| Under 6 | 87 (51.5%) | 103 (61.0%) |
| 6 to 18 Years | 261 (31.5%) | 596 (72.0%) |
| 19 to 25 Years | 12 (5.1%) | 224 (94.9%) |
| 25 to 34 Years | 57 (30.5%) | 122 (65.2%) |
| 35 to 44 Years | 54 (12.3%) | 334 (76.3%) |
| 45 to 54 Years | 6 (1.2%) | 480 (93.2%) |
| 55 to 64 Years | 68 (19.7%) | 273 (79.1%) |
| 65 to 74 Years | 258 (94.5%) | 147 (53.8%) |
| 75 Years and over | 233 (100.0%) | 188 (80.7%) |
| Total | 1,036 (32.1%) | 2,467 (76.5%) |
Disability Status by Sex by Age in Dundee
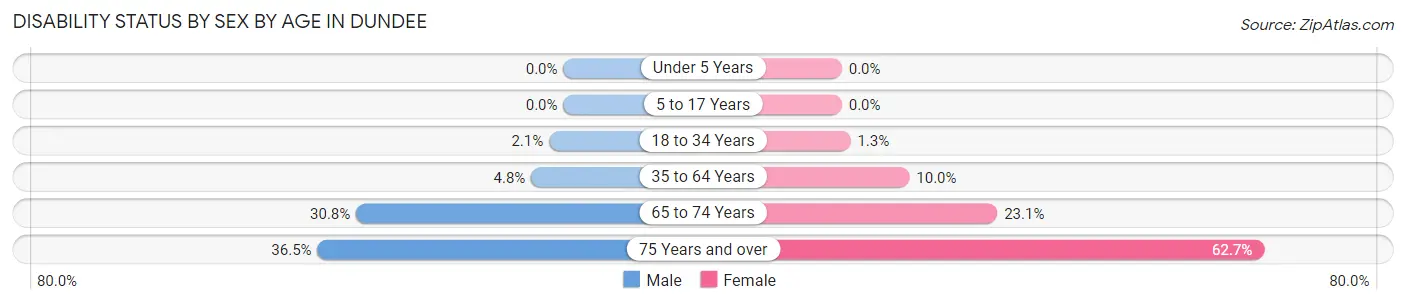
| Age Bracket | Male | Female |
| Under 5 Years | 0 (0.0%) | 0 (0.0%) |
| 5 to 17 Years | 0 (0.0%) | 0 (0.0%) |
| 18 to 34 Years | 6 (2.1%) | 3 (1.3%) |
| 35 to 64 Years | 32 (4.8%) | 63 (10.0%) |
| 65 to 74 Years | 36 (30.8%) | 36 (23.1%) |
| 75 Years and over | 42 (36.5%) | 74 (62.7%) |
Disability Class by Sex by Age in Dundee
Disability Class: Hearing Difficulty
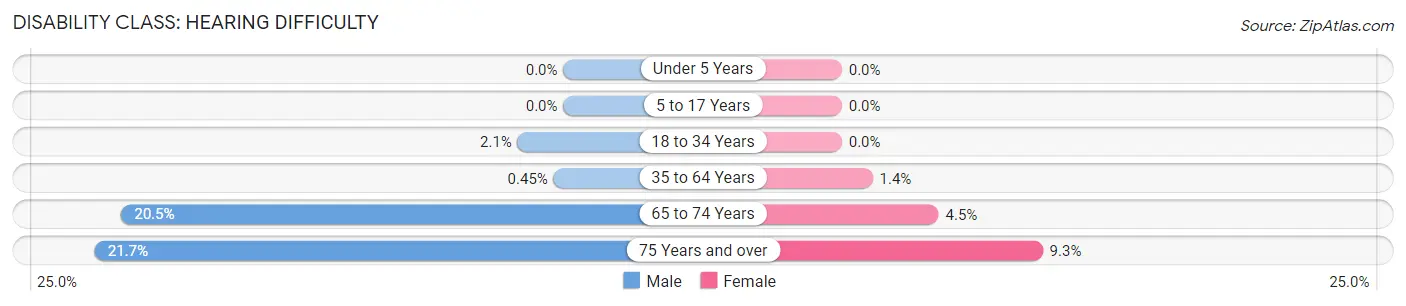
| Age Bracket | Male | Female |
| Under 5 Years | 0 (0.0%) | 0 (0.0%) |
| 5 to 17 Years | 0 (0.0%) | 0 (0.0%) |
| 18 to 34 Years | 6 (2.1%) | 0 (0.0%) |
| 35 to 64 Years | 3 (0.4%) | 9 (1.4%) |
| 65 to 74 Years | 24 (20.5%) | 7 (4.5%) |
| 75 Years and over | 25 (21.7%) | 11 (9.3%) |
Disability Class: Vision Difficulty
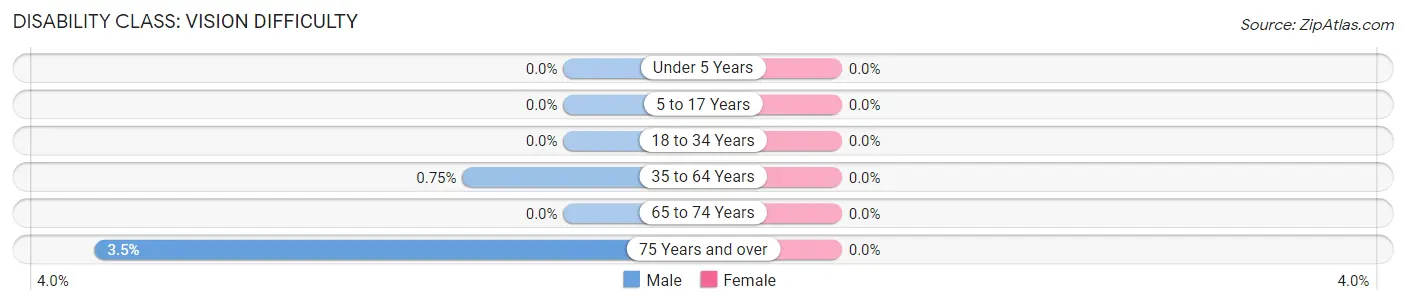
| Age Bracket | Male | Female |
| Under 5 Years | 0 (0.0%) | 0 (0.0%) |
| 5 to 17 Years | 0 (0.0%) | 0 (0.0%) |
| 18 to 34 Years | 0 (0.0%) | 0 (0.0%) |
| 35 to 64 Years | 5 (0.7%) | 0 (0.0%) |
| 65 to 74 Years | 0 (0.0%) | 0 (0.0%) |
| 75 Years and over | 4 (3.5%) | 0 (0.0%) |
Disability Class: Cognitive Difficulty
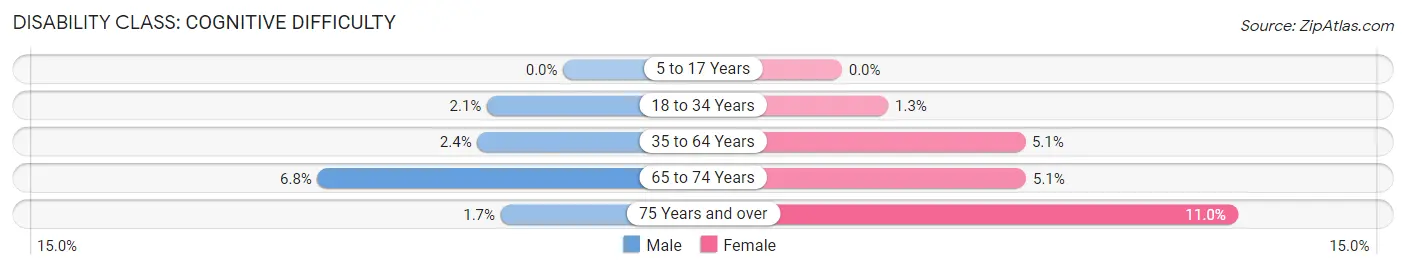
| Age Bracket | Male | Female |
| 5 to 17 Years | 0 (0.0%) | 0 (0.0%) |
| 18 to 34 Years | 6 (2.1%) | 3 (1.3%) |
| 35 to 64 Years | 16 (2.4%) | 32 (5.1%) |
| 65 to 74 Years | 8 (6.8%) | 8 (5.1%) |
| 75 Years and over | 2 (1.7%) | 13 (11.0%) |
Disability Class: Ambulatory Difficulty
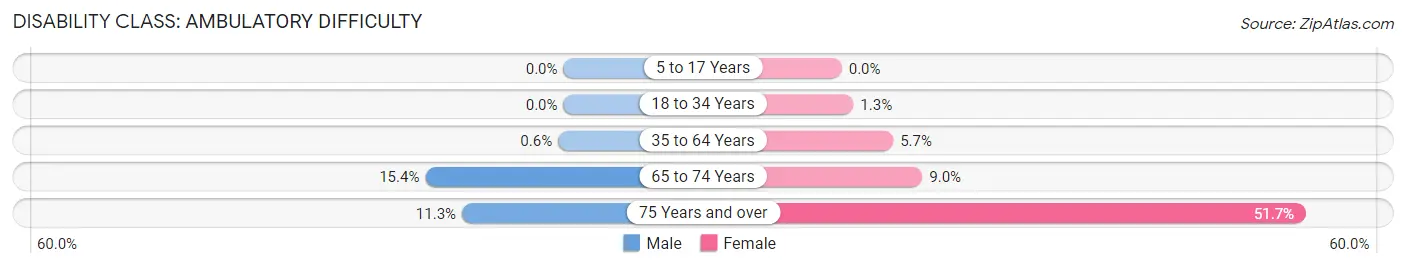
| Age Bracket | Male | Female |
| 5 to 17 Years | 0 (0.0%) | 0 (0.0%) |
| 18 to 34 Years | 0 (0.0%) | 3 (1.3%) |
| 35 to 64 Years | 4 (0.6%) | 36 (5.7%) |
| 65 to 74 Years | 18 (15.4%) | 14 (9.0%) |
| 75 Years and over | 13 (11.3%) | 61 (51.7%) |
Disability Class: Self-Care Difficulty
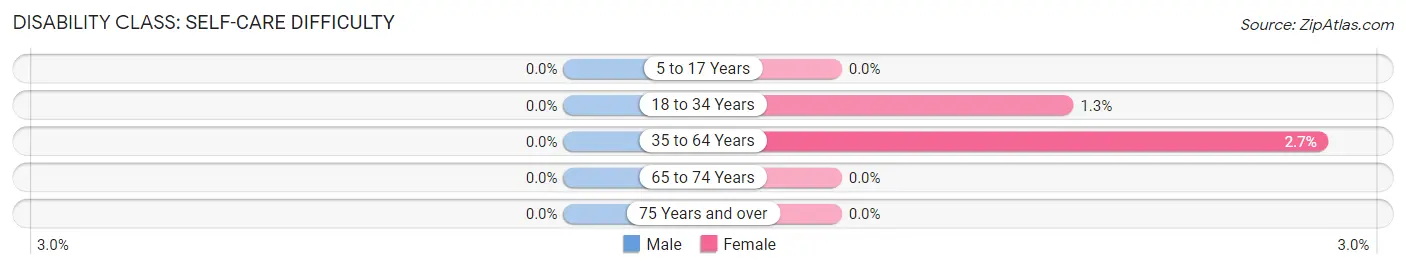
| Age Bracket | Male | Female |
| 5 to 17 Years | 0 (0.0%) | 0 (0.0%) |
| 18 to 34 Years | 0 (0.0%) | 3 (1.3%) |
| 35 to 64 Years | 0 (0.0%) | 17 (2.7%) |
| 65 to 74 Years | 0 (0.0%) | 0 (0.0%) |
| 75 Years and over | 0 (0.0%) | 0 (0.0%) |
Technology Access in Dundee
Computing Device Access in Dundee
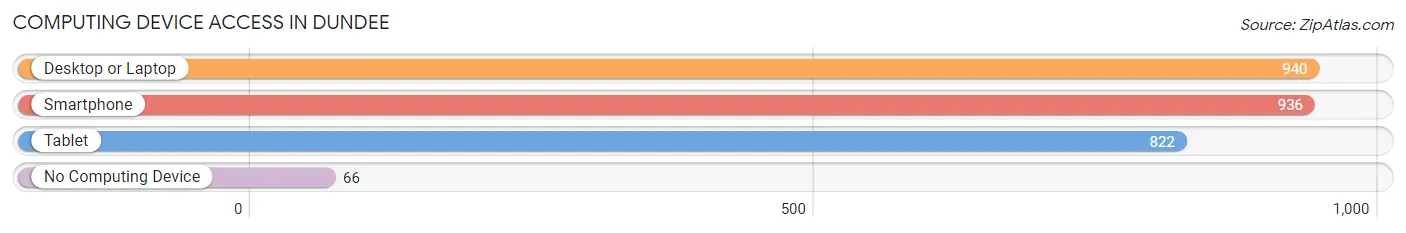
| Device Type | # Households | % Households |
| Desktop or Laptop | 940 | 87.0% |
| Smartphone | 936 | 86.7% |
| Tablet | 822 | 76.1% |
| No Computing Device | 66 | 6.1% |
| Total | 1,080 | 100.0% |
Internet Access in Dundee
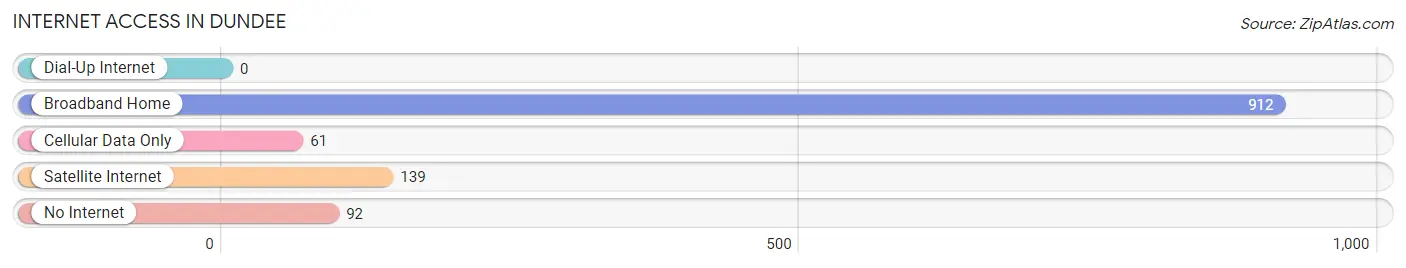
| Internet Type | # Households | % Households |
| Dial-Up Internet | 0 | 0.0% |
| Broadband Home | 912 | 84.4% |
| Cellular Data Only | 61 | 5.7% |
| Satellite Internet | 139 | 12.9% |
| No Internet | 92 | 8.5% |
| Total | 1,080 | 100.0% |
Dundee Summary
Dundee, Oregon is a small city located in Yamhill County, Oregon, United States. It is situated on the banks of the Willamette River, approximately 25 miles southwest of Portland. The city has a population of approximately 2,500 people and is part of the Portland metropolitan area.
History
The area that is now Dundee was originally inhabited by the Kalapuya Native American tribe. The first European settlers arrived in the area in the early 1800s, and the town of Dundee was officially established in 1851. The town was named after the Scottish city of Dundee, and the first post office was established in 1854.
In the late 1800s, Dundee became a popular destination for tourists, and the town was known for its wineries and vineyards. The town was also home to a number of hotels and resorts, and the area was a popular destination for fishing and hunting.
In the early 1900s, Dundee began to experience a decline in population as many of the town’s residents moved away to larger cities. The town was also affected by the Great Depression, and many of the businesses in the area closed.
In the 1950s, Dundee began to experience a resurgence in population as the town became a popular destination for retirees. The town also experienced a boom in the wine industry, and many of the wineries in the area are still in operation today.
Geography
Dundee is located in the northern part of Yamhill County, Oregon, and is situated on the banks of the Willamette River. The city is located approximately 25 miles southwest of Portland, and is part of the Portland metropolitan area.
The city has a total area of 1.3 square miles, all of which is land. The city is located at an elevation of approximately 200 feet above sea level.
Economy
The economy of Dundee is largely based on the wine industry. The city is home to a number of wineries and vineyards, and the area is known for its production of Pinot Noir. The city is also home to a number of restaurants, shops, and other businesses.
Demographics
As of the 2010 census, the population of Dundee was 2,500. The racial makeup of the city was 94.2% White, 0.8% African American, 0.4% Native American, 0.8% Asian, 0.1% Pacific Islander, 1.2% from other races, and 2.5% from two or more races. Hispanic or Latino of any race were 4.2% of the population.
The median household income in Dundee was $50,000, and the median family income was $54,000. The per capita income for the city was $25,000. Approximately 10.3% of the population was below the poverty line.
Common Questions
What is Per Capita Income in Dundee?
Per Capita income in Dundee is $38,635.
What is the Median Family Income in Dundee?
Median Family Income in Dundee is $123,523.
What is the Median Household income in Dundee?
Median Household Income in Dundee is $98,152.
What is Income or Wage Gap in Dundee?
Income or Wage Gap in Dundee is 36.7%.
Women in Dundee earn 63.3 cents for every dollar earned by a man.
What is Inequality or Gini Index in Dundee?
Inequality or Gini Index in Dundee is 0.37.
What is the Total Population of Dundee?
Total Population of Dundee is 3,224.
What is the Total Male Population of Dundee?
Total Male Population of Dundee is 1,627.
What is the Total Female Population of Dundee?
Total Female Population of Dundee is 1,597.
What is the Ratio of Males per 100 Females in Dundee?
There are 101.88 Males per 100 Females in Dundee.
What is the Ratio of Females per 100 Males in Dundee?
There are 98.16 Females per 100 Males in Dundee.
What is the Median Population Age in Dundee?
Median Population Age in Dundee is 39.2 Years.
What is the Average Family Size in Dundee
Average Family Size in Dundee is 3.6 People.
What is the Average Household Size in Dundee
Average Household Size in Dundee is 3.0 People.
How Large is the Labor Force in Dundee?
There are 1,716 People in the Labor Forcein in Dundee.
What is the Percentage of People in the Labor Force in Dundee?
69.2% of People are in the Labor Force in Dundee.
What is the Unemployment Rate in Dundee?
Unemployment Rate in Dundee is 5.7%.