Mill Neck, NY Map & Demographics
Mill Neck Map
Mill Neck Overview
$145,188
PER CAPITA INCOME
$250,001
AVG FAMILY INCOME
$250,001
AVG HOUSEHOLD INCOME
55.3%
WAGE / INCOME GAP [ % ]
44.7¢/ $1
WAGE / INCOME GAP [ $ ]
0.51
INEQUALITY / GINI INDEX
1,108
TOTAL POPULATION
577
MALE POPULATION
531
FEMALE POPULATION
108.66
MALES / 100 FEMALES
92.03
FEMALES / 100 MALES
51.5
MEDIAN AGE
3.1
AVG FAMILY SIZE
2.8
AVG HOUSEHOLD SIZE
522
LABOR FORCE [ PEOPLE ]
59.9%
PERCENT IN LABOR FORCE
4.6%
UNEMPLOYMENT RATE
Mill Neck Zip Codes
Mill Neck Area Codes
Income in Mill Neck
Income Overview in Mill Neck
Per Capita Income in Mill Neck is $145,188, while median incomes of families and households are $250,001 and $250,001 respectively.
| Characteristic | Number | Measure |
| Per Capita Income | 1,108 | $145,188 |
| Median Family Income | 330 | $250,001 |
| Mean Family Income | 330 | $444,608 |
| Median Household Income | 398 | $250,001 |
| Mean Household Income | 398 | $404,917 |
| Income Deficit | 330 | $0 |
| Wage / Income Gap (%) | 1,108 | 55.30% |
| Wage / Income Gap ($) | 1,108 | 44.70¢ per $1 |
| Gini / Inequality Index | 1,108 | 0.51 |
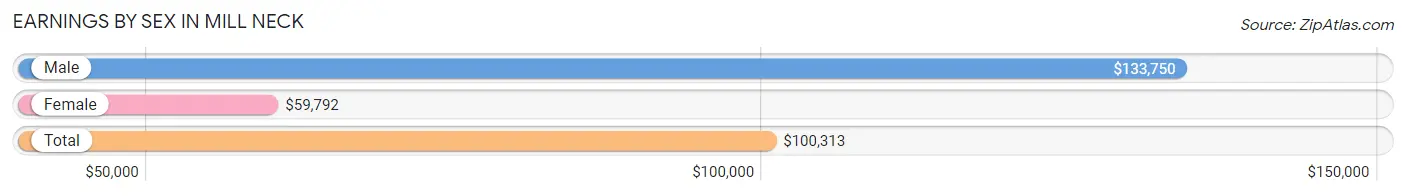
Earnings by Sex in Mill Neck
Average Earnings in Mill Neck are $100,313, $133,750 for men and $59,792 for women, a difference of 55.3%.
| Sex | Number | Average Earnings |
| Male | 324 (61.0%) | $133,750 |
| Female | 207 (39.0%) | $59,792 |
| Total | 531 (100.0%) | $100,313 |
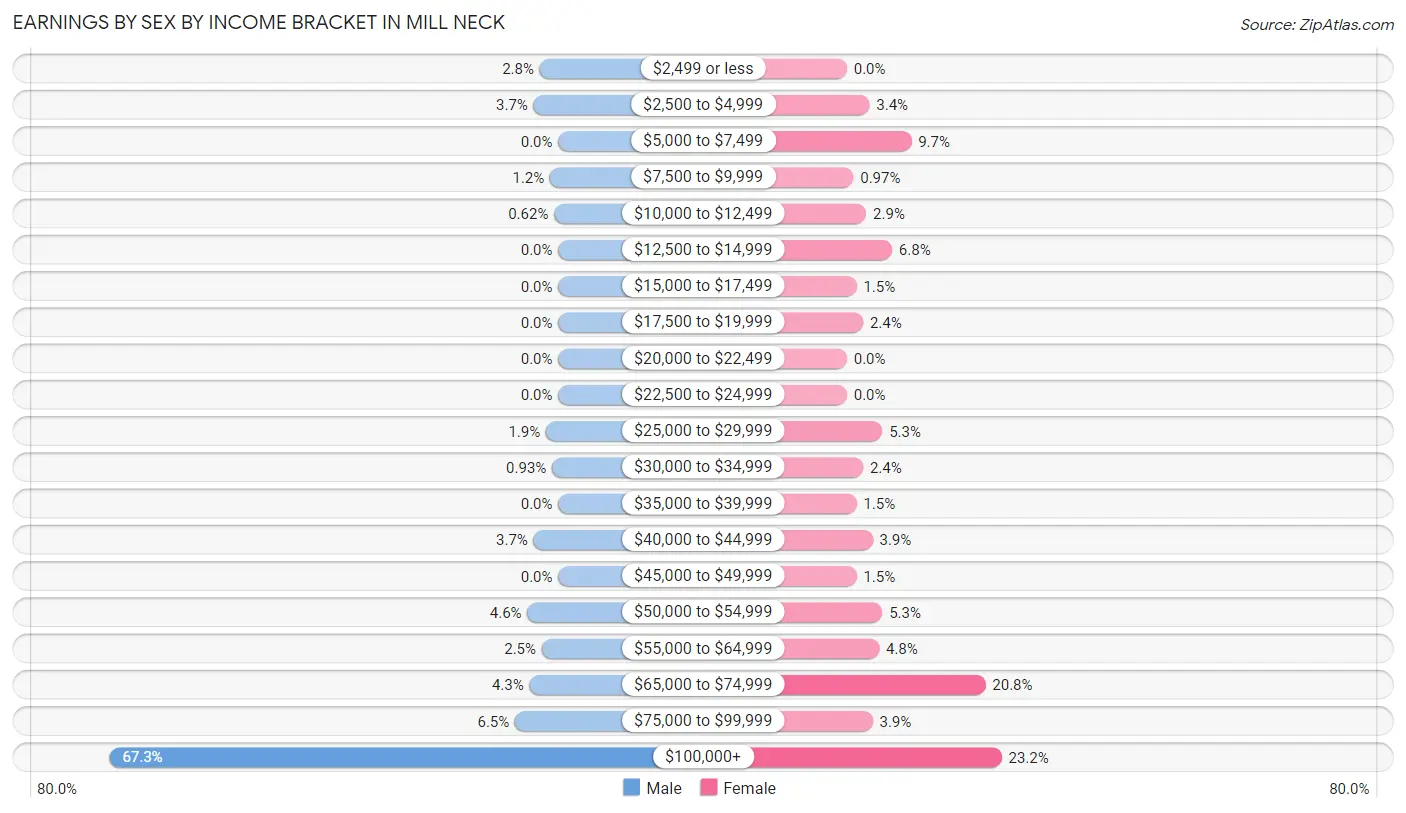
Earnings by Sex by Income Bracket in Mill Neck
The most common earnings brackets in Mill Neck are $100,000+ for men (218 | 67.3%) and $100,000+ for women (48 | 23.2%).
| Income | Male | Female |
| $2,499 or less | 9 (2.8%) | 0 (0.0%) |
| $2,500 to $4,999 | 12 (3.7%) | 7 (3.4%) |
| $5,000 to $7,499 | 0 (0.0%) | 20 (9.7%) |
| $7,500 to $9,999 | 4 (1.2%) | 2 (1.0%) |
| $10,000 to $12,499 | 2 (0.6%) | 6 (2.9%) |
| $12,500 to $14,999 | 0 (0.0%) | 14 (6.8%) |
| $15,000 to $17,499 | 0 (0.0%) | 3 (1.5%) |
| $17,500 to $19,999 | 0 (0.0%) | 5 (2.4%) |
| $20,000 to $22,499 | 0 (0.0%) | 0 (0.0%) |
| $22,500 to $24,999 | 0 (0.0%) | 0 (0.0%) |
| $25,000 to $29,999 | 6 (1.8%) | 11 (5.3%) |
| $30,000 to $34,999 | 3 (0.9%) | 5 (2.4%) |
| $35,000 to $39,999 | 0 (0.0%) | 3 (1.5%) |
| $40,000 to $44,999 | 12 (3.7%) | 8 (3.9%) |
| $45,000 to $49,999 | 0 (0.0%) | 3 (1.5%) |
| $50,000 to $54,999 | 15 (4.6%) | 11 (5.3%) |
| $55,000 to $64,999 | 8 (2.5%) | 10 (4.8%) |
| $65,000 to $74,999 | 14 (4.3%) | 43 (20.8%) |
| $75,000 to $99,999 | 21 (6.5%) | 8 (3.9%) |
| $100,000+ | 218 (67.3%) | 48 (23.2%) |
| Total | 324 (100.0%) | 207 (100.0%) |
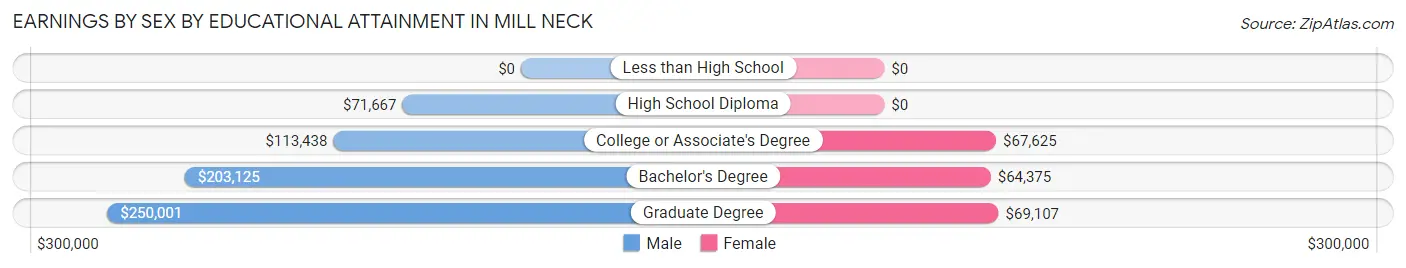
Earnings by Sex by Educational Attainment in Mill Neck
Average earnings in Mill Neck are $171,250 for men and $68,148 for women, a difference of 60.2%. Men with an educational attainment of graduate degree enjoy the highest average annual earnings of $250,001, while those with high school diploma education earn the least with $71,667. Women with an educational attainment of graduate degree earn the most with the average annual earnings of $69,107, while those with bachelor's degree education have the smallest earnings of $64,375.
| Educational Attainment | Male Income | Female Income |
| Less than High School | - | - |
| High School Diploma | $71,667 | $0 |
| College or Associate's Degree | $113,438 | $67,625 |
| Bachelor's Degree | $203,125 | $64,375 |
| Graduate Degree | $250,001 | $69,107 |
| Total | $171,250 | $68,148 |
Family Income in Mill Neck
Family Income Brackets in Mill Neck
According to the Mill Neck family income data, there are 191 families falling into the $200,000+ income range, which is the most common income bracket and makes up 57.9% of all families.
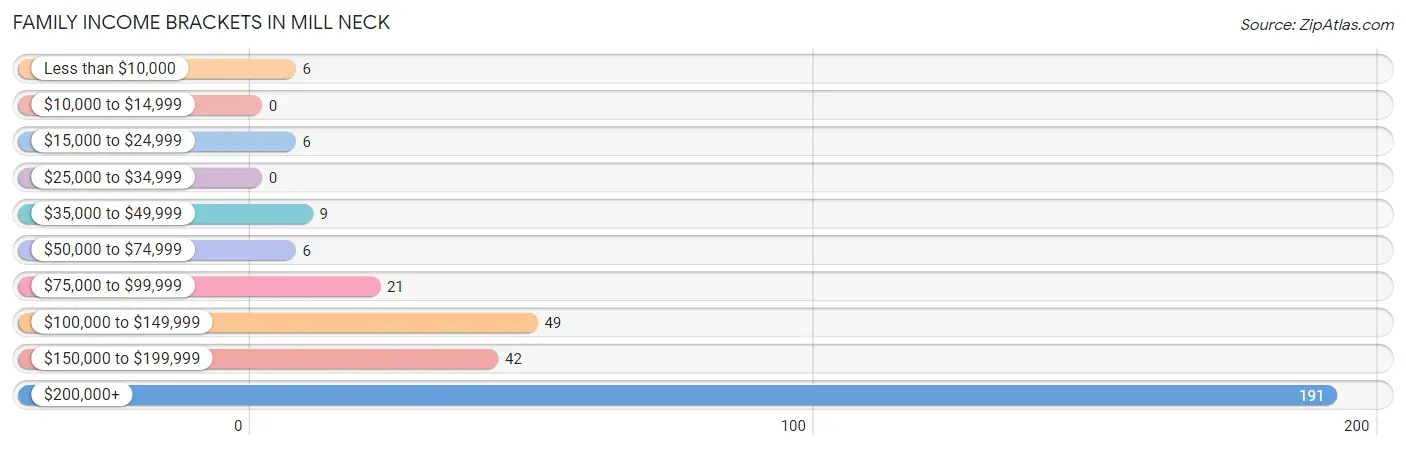
| Income Bracket | # Families | % Families |
| Less than $10,000 | 6 | 1.8% |
| $10,000 to $14,999 | 0 | 0.0% |
| $15,000 to $24,999 | 6 | 1.8% |
| $25,000 to $34,999 | 0 | 0.0% |
| $35,000 to $49,999 | 9 | 2.7% |
| $50,000 to $74,999 | 6 | 1.8% |
| $75,000 to $99,999 | 21 | 6.4% |
| $100,000 to $149,999 | 49 | 14.8% |
| $150,000 to $199,999 | 42 | 12.7% |
| $200,000+ | 191 | 57.9% |
Family Income by Famaliy Size in Mill Neck
3-person families (76 | 23.0%) account for the highest median family income in Mill Neck with $250,001 per family, while 2-person families (164 | 49.7%) have the highest median income of $102,188 per family member.
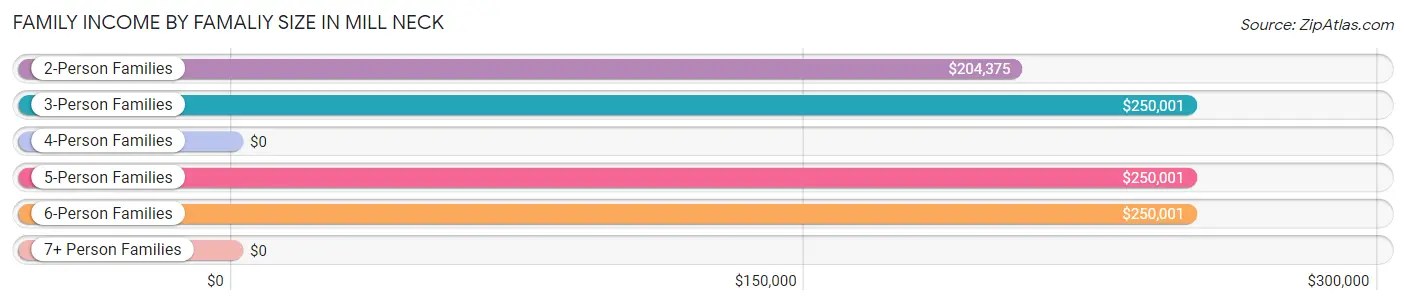
| Income Bracket | # Families | Median Income |
| 2-Person Families | 164 (49.7%) | $204,375 |
| 3-Person Families | 76 (23.0%) | $250,001 |
| 4-Person Families | 25 (7.6%) | $0 |
| 5-Person Families | 35 (10.6%) | $250,001 |
| 6-Person Families | 28 (8.5%) | $250,001 |
| 7+ Person Families | 2 (0.6%) | $0 |
| Total | 330 (100.0%) | $250,001 |
Family Income by Number of Earners in Mill Neck
The median family income in Mill Neck is $250,001, with families comprising 1 earner (104) having the highest median family income of $250,001, while families with no earners (55) have the lowest median family income of $126,875, accounting for 31.5% and 16.7% of families, respectively.
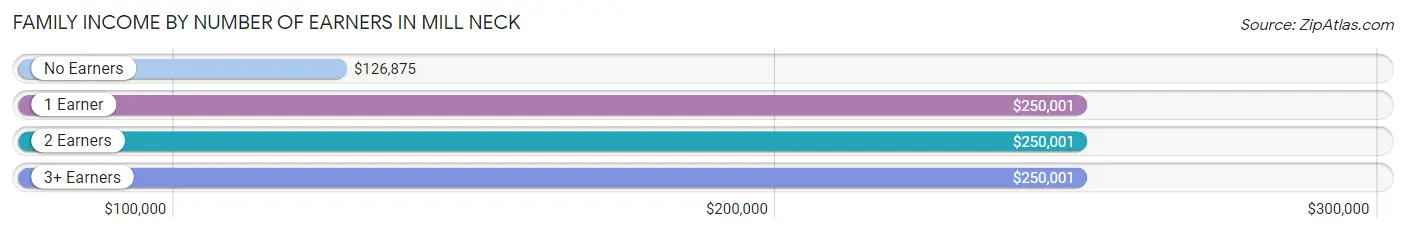
| Number of Earners | # Families | Median Income |
| No Earners | 55 (16.7%) | $126,875 |
| 1 Earner | 104 (31.5%) | $250,001 |
| 2 Earners | 155 (47.0%) | $250,001 |
| 3+ Earners | 16 (4.9%) | $250,001 |
| Total | 330 (100.0%) | $250,001 |
Household Income in Mill Neck
Household Income Brackets in Mill Neck
With 216 households falling in the category, the $200,000+ income range is the most frequent in Mill Neck, accounting for 54.3% of all households.
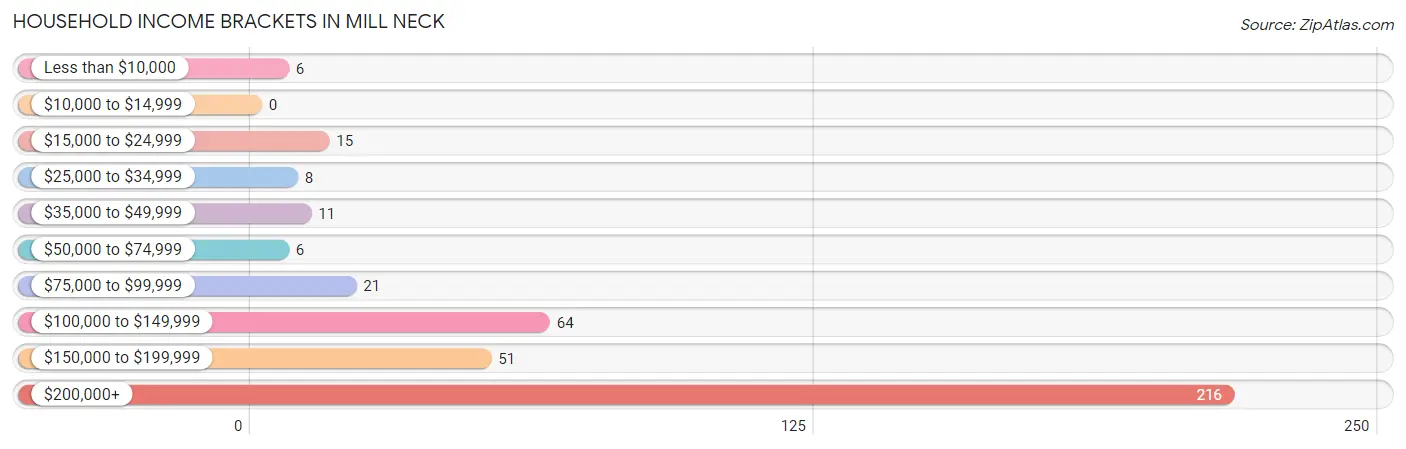
| Income Bracket | # Households | % Households |
| Less than $10,000 | 6 | 1.5% |
| $10,000 to $14,999 | 0 | 0.0% |
| $15,000 to $24,999 | 15 | 3.8% |
| $25,000 to $34,999 | 8 | 2.0% |
| $35,000 to $49,999 | 11 | 2.8% |
| $50,000 to $74,999 | 6 | 1.5% |
| $75,000 to $99,999 | 21 | 5.3% |
| $100,000 to $149,999 | 64 | 16.1% |
| $150,000 to $199,999 | 51 | 12.8% |
| $200,000+ | 216 | 54.3% |
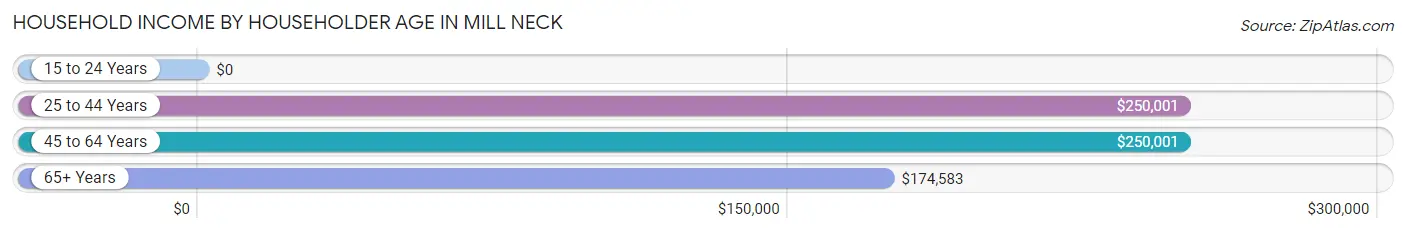
Household Income by Householder Age in Mill Neck
The median household income in Mill Neck is $250,001, with the highest median household income of $250,001 found in the 25 to 44 years age bracket for the primary householder. A total of 36 households (9.0%) fall into this category.
| Income Bracket | # Households | Median Income |
| 15 to 24 Years | 0 (0.0%) | $0 |
| 25 to 44 Years | 36 (9.0%) | $250,001 |
| 45 to 64 Years | 191 (48.0%) | $250,001 |
| 65+ Years | 171 (43.0%) | $174,583 |
| Total | 398 (100.0%) | $250,001 |
Poverty in Mill Neck
Income Below Poverty by Sex and Age in Mill Neck
With 3.5% poverty level for males and 2.8% for females among the residents of Mill Neck, 75 year old and over males and 6 to 11 year old females are the most vulnerable to poverty, with 8 males (18.6%) and 3 females (12.0%) in their respective age groups living below the poverty level.
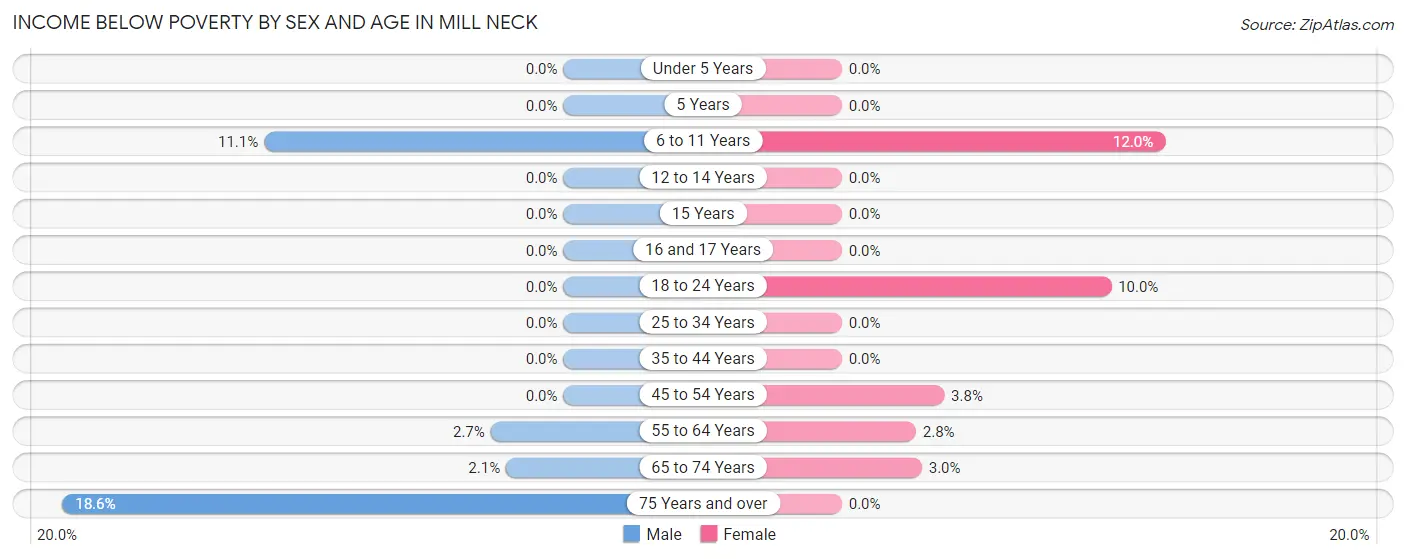
| Age Bracket | Male | Female |
| Under 5 Years | 0 (0.0%) | 0 (0.0%) |
| 5 Years | 0 (0.0%) | 0 (0.0%) |
| 6 to 11 Years | 7 (11.1%) | 3 (12.0%) |
| 12 to 14 Years | 0 (0.0%) | 0 (0.0%) |
| 15 Years | 0 (0.0%) | 0 (0.0%) |
| 16 and 17 Years | 0 (0.0%) | 0 (0.0%) |
| 18 to 24 Years | 0 (0.0%) | 3 (10.0%) |
| 25 to 34 Years | 0 (0.0%) | 0 (0.0%) |
| 35 to 44 Years | 0 (0.0%) | 0 (0.0%) |
| 45 to 54 Years | 0 (0.0%) | 3 (3.8%) |
| 55 to 64 Years | 2 (2.7%) | 3 (2.8%) |
| 65 to 74 Years | 3 (2.1%) | 3 (3.0%) |
| 75 Years and over | 8 (18.6%) | 0 (0.0%) |
| Total | 20 (3.5%) | 15 (2.8%) |
Income Above Poverty by Sex and Age in Mill Neck
According to the poverty statistics in Mill Neck, males aged under 5 years and females aged under 5 years are the age groups that are most secure financially, with 100.0% of males and 100.0% of females in these age groups living above the poverty line.
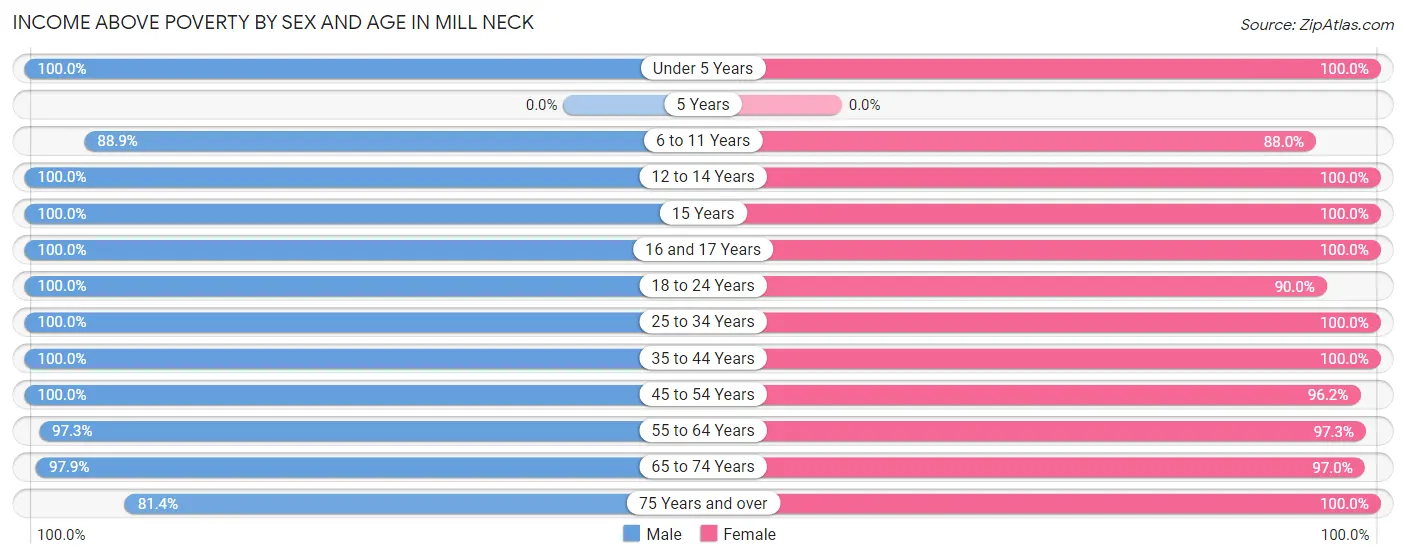
| Age Bracket | Male | Female |
| Under 5 Years | 49 (100.0%) | 25 (100.0%) |
| 5 Years | 0 (0.0%) | 0 (0.0%) |
| 6 to 11 Years | 56 (88.9%) | 22 (88.0%) |
| 12 to 14 Years | 26 (100.0%) | 28 (100.0%) |
| 15 Years | 4 (100.0%) | 16 (100.0%) |
| 16 and 17 Years | 9 (100.0%) | 14 (100.0%) |
| 18 to 24 Years | 31 (100.0%) | 27 (90.0%) |
| 25 to 34 Years | 27 (100.0%) | 32 (100.0%) |
| 35 to 44 Years | 39 (100.0%) | 52 (100.0%) |
| 45 to 54 Years | 71 (100.0%) | 76 (96.2%) |
| 55 to 64 Years | 72 (97.3%) | 106 (97.3%) |
| 65 to 74 Years | 138 (97.9%) | 98 (97.0%) |
| 75 Years and over | 35 (81.4%) | 20 (100.0%) |
| Total | 557 (96.5%) | 516 (97.2%) |
Income Below Poverty Among Married-Couple Families in Mill Neck
The poverty statistics for married-couple families in Mill Neck show that 1.9% or 6 of the total 316 families live below the poverty line. Families with no children have the highest poverty rate of 3.0%, comprising of 6 families. On the other hand, families with 1 or 2 children have the lowest poverty rate of 0.0%, which includes 0 families.
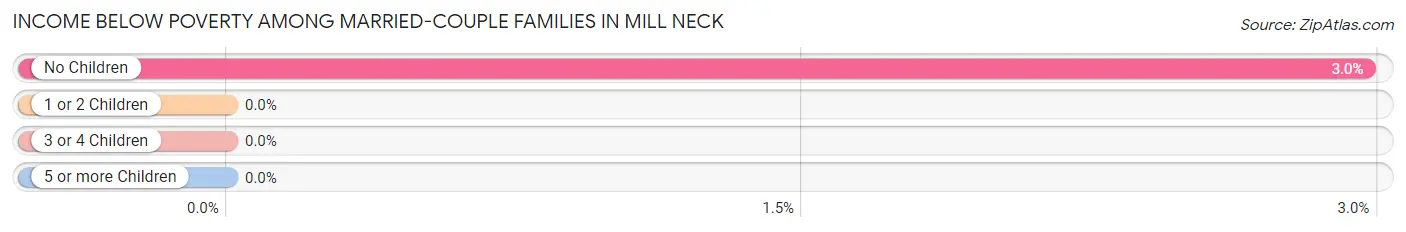
| Children | Above Poverty | Below Poverty |
| No Children | 196 (97.0%) | 6 (3.0%) |
| 1 or 2 Children | 69 (100.0%) | 0 (0.0%) |
| 3 or 4 Children | 43 (100.0%) | 0 (0.0%) |
| 5 or more Children | 2 (100.0%) | 0 (0.0%) |
| Total | 310 (98.1%) | 6 (1.9%) |
Income Below Poverty Among Single-Parent Households in Mill Neck
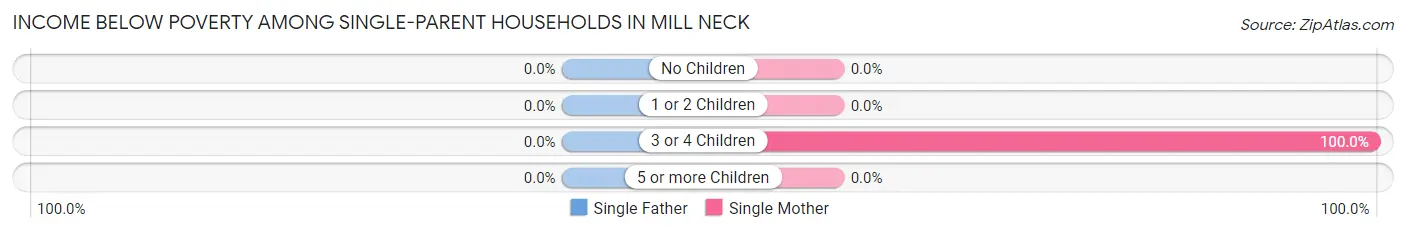
| Children | Single Father | Single Mother |
| No Children | 0 (0.0%) | 0 (0.0%) |
| 1 or 2 Children | 0 (0.0%) | 0 (0.0%) |
| 3 or 4 Children | 0 (0.0%) | 3 (100.0%) |
| 5 or more Children | 0 (0.0%) | 0 (0.0%) |
| Total | 0 (0.0%) | 3 (21.4%) |
Income Below Poverty Among Married-Couple vs Single-Parent Households in Mill Neck
The poverty data for Mill Neck shows that 6 of the married-couple family households (1.9%) and 3 of the single-parent households (21.4%) are living below the poverty level. Within the married-couple family households, those with no children have the highest poverty rate, with 6 households (3.0%) falling below the poverty line. Among the single-parent households, those with 3 or 4 children have the highest poverty rate, with 3 household (100.0%) living below poverty.
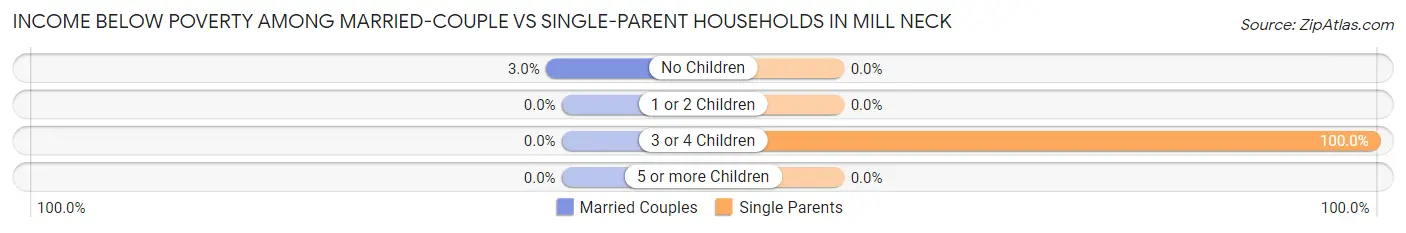
| Children | Married-Couple Families | Single-Parent Households |
| No Children | 6 (3.0%) | 0 (0.0%) |
| 1 or 2 Children | 0 (0.0%) | 0 (0.0%) |
| 3 or 4 Children | 0 (0.0%) | 3 (100.0%) |
| 5 or more Children | 0 (0.0%) | 0 (0.0%) |
| Total | 6 (1.9%) | 3 (21.4%) |
Race in Mill Neck
The most populous races in Mill Neck are White / Caucasian (973 | 87.8%), Hispanic or Latino (211 | 19.0%), and Asian (70 | 6.3%).
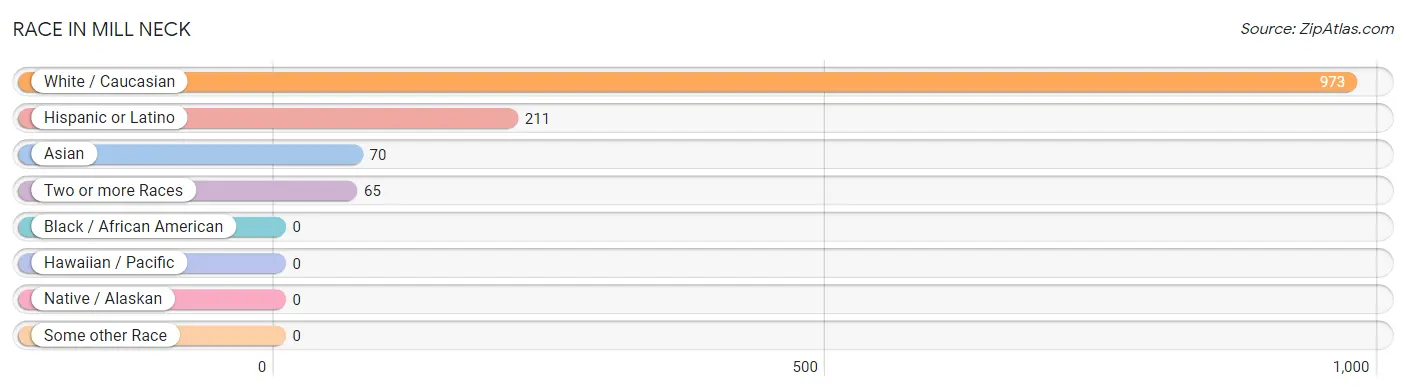
| Race | # Population | % Population |
| Asian | 70 | 6.3% |
| Black / African American | 0 | 0.0% |
| Hawaiian / Pacific | 0 | 0.0% |
| Hispanic or Latino | 211 | 19.0% |
| Native / Alaskan | 0 | 0.0% |
| White / Caucasian | 973 | 87.8% |
| Two or more Races | 65 | 5.9% |
| Some other Race | 0 | 0.0% |
| Total | 1,108 | 100.0% |
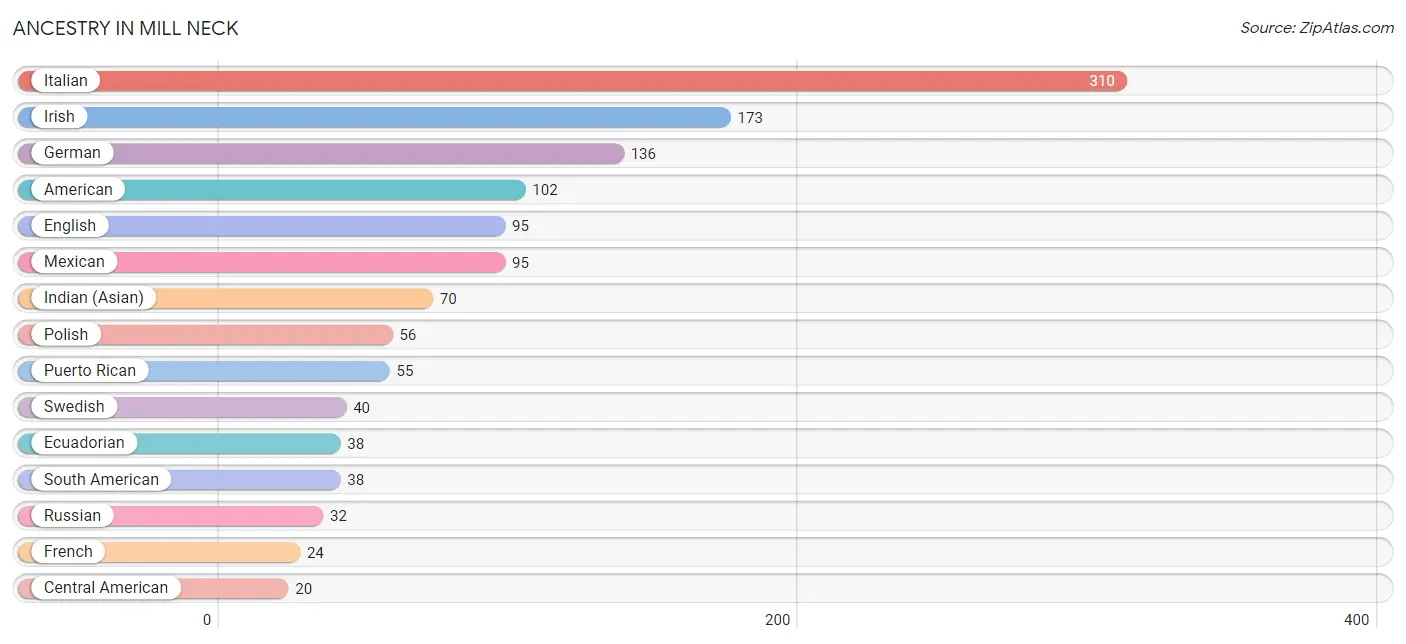
Ancestry in Mill Neck
The most populous ancestries reported in Mill Neck are Italian (310 | 28.0%), Irish (173 | 15.6%), German (136 | 12.3%), American (102 | 9.2%), and English (95 | 8.6%), together accounting for 73.6% of all Mill Neck residents.
| Ancestry | # Population | % Population |
| American | 102 | 9.2% |
| Arab | 6 | 0.5% |
| Assyrian / Chaldean / Syriac | 3 | 0.3% |
| Austrian | 3 | 0.3% |
| Belgian | 18 | 1.6% |
| British | 3 | 0.3% |
| Burmese | 2 | 0.2% |
| Canadian | 3 | 0.3% |
| Central American | 20 | 1.8% |
| Croatian | 12 | 1.1% |
| Dutch | 3 | 0.3% |
| Eastern European | 9 | 0.8% |
| Ecuadorian | 38 | 3.4% |
| English | 95 | 8.6% |
| European | 8 | 0.7% |
| Finnish | 3 | 0.3% |
| French | 24 | 2.2% |
| French Canadian | 3 | 0.3% |
| German | 136 | 12.3% |
| Greek | 2 | 0.2% |
| Hungarian | 3 | 0.3% |
| Indian (Asian) | 70 | 6.3% |
| Irish | 173 | 15.6% |
| Italian | 310 | 28.0% |
| Jordanian | 3 | 0.3% |
| Latvian | 3 | 0.3% |
| Lebanese | 3 | 0.3% |
| Lithuanian | 3 | 0.3% |
| Mexican | 95 | 8.6% |
| Norwegian | 6 | 0.5% |
| Polish | 56 | 5.1% |
| Puerto Rican | 55 | 5.0% |
| Romanian | 3 | 0.3% |
| Russian | 32 | 2.9% |
| Salvadoran | 20 | 1.8% |
| Scandinavian | 3 | 0.3% |
| Scotch-Irish | 12 | 1.1% |
| Scottish | 12 | 1.1% |
| Slavic | 3 | 0.3% |
| South American | 38 | 3.4% |
| Spaniard | 3 | 0.3% |
| Swedish | 40 | 3.6% |
| Thai | 7 | 0.6% |
| Ukrainian | 4 | 0.4% | View All 44 Rows |
Immigrants in Mill Neck
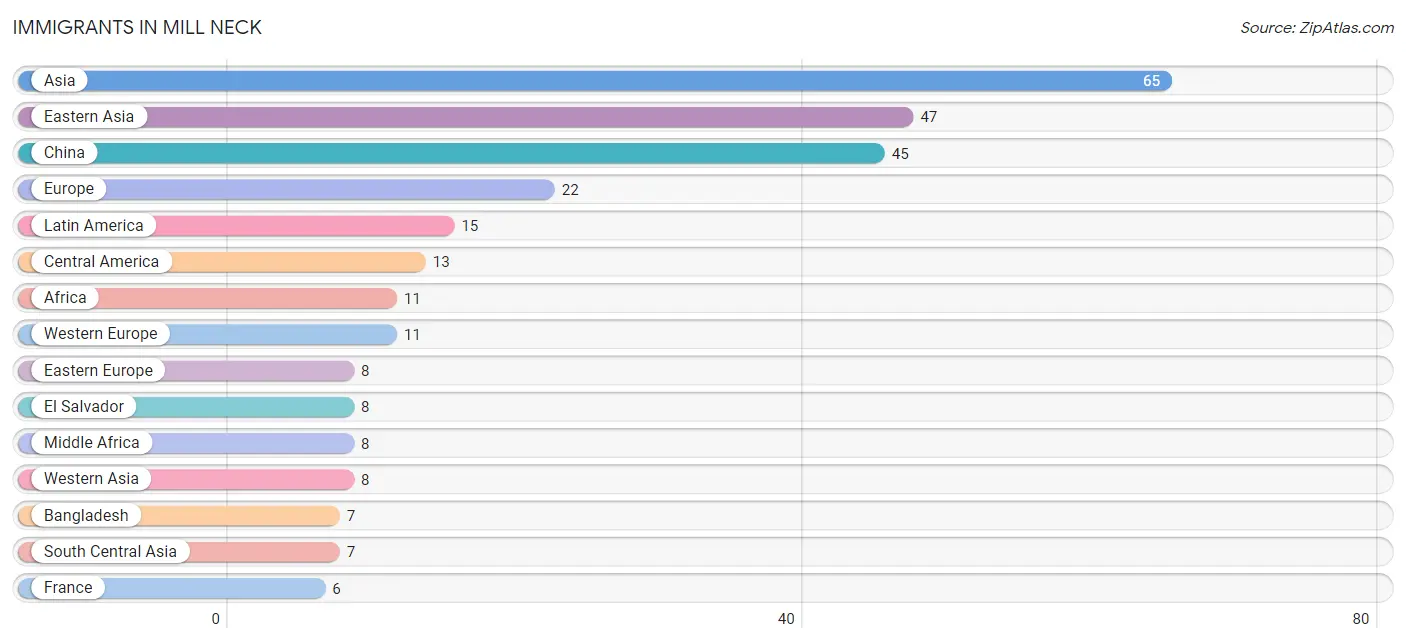
The most numerous immigrant groups reported in Mill Neck came from Asia (65 | 5.9%), Eastern Asia (47 | 4.2%), China (45 | 4.1%), Europe (22 | 2.0%), and Latin America (15 | 1.3%), together accounting for 17.5% of all Mill Neck residents.
| Immigration Origin | # Population | % Population |
| Africa | 11 | 1.0% |
| Asia | 65 | 5.9% |
| Bangladesh | 7 | 0.6% |
| Central America | 13 | 1.2% |
| China | 45 | 4.1% |
| Croatia | 2 | 0.2% |
| Eastern Asia | 47 | 4.2% |
| Eastern Europe | 8 | 0.7% |
| Ecuador | 2 | 0.2% |
| El Salvador | 8 | 0.7% |
| Europe | 22 | 2.0% |
| France | 6 | 0.5% |
| Germany | 5 | 0.4% |
| Hungary | 3 | 0.3% |
| Israel | 2 | 0.2% |
| Jordan | 3 | 0.3% |
| Korea | 2 | 0.2% |
| Latin America | 15 | 1.3% |
| Lebanon | 3 | 0.3% |
| Mexico | 5 | 0.4% |
| Middle Africa | 8 | 0.7% |
| Northern Africa | 3 | 0.3% |
| Northern Europe | 3 | 0.3% |
| Romania | 3 | 0.3% |
| Singapore | 3 | 0.3% |
| South America | 2 | 0.2% |
| South Central Asia | 7 | 0.6% |
| South Eastern Asia | 3 | 0.3% |
| Sweden | 3 | 0.3% |
| Western Asia | 8 | 0.7% |
| Western Europe | 11 | 1.0% | View All 31 Rows |
Sex and Age in Mill Neck
Sex and Age in Mill Neck
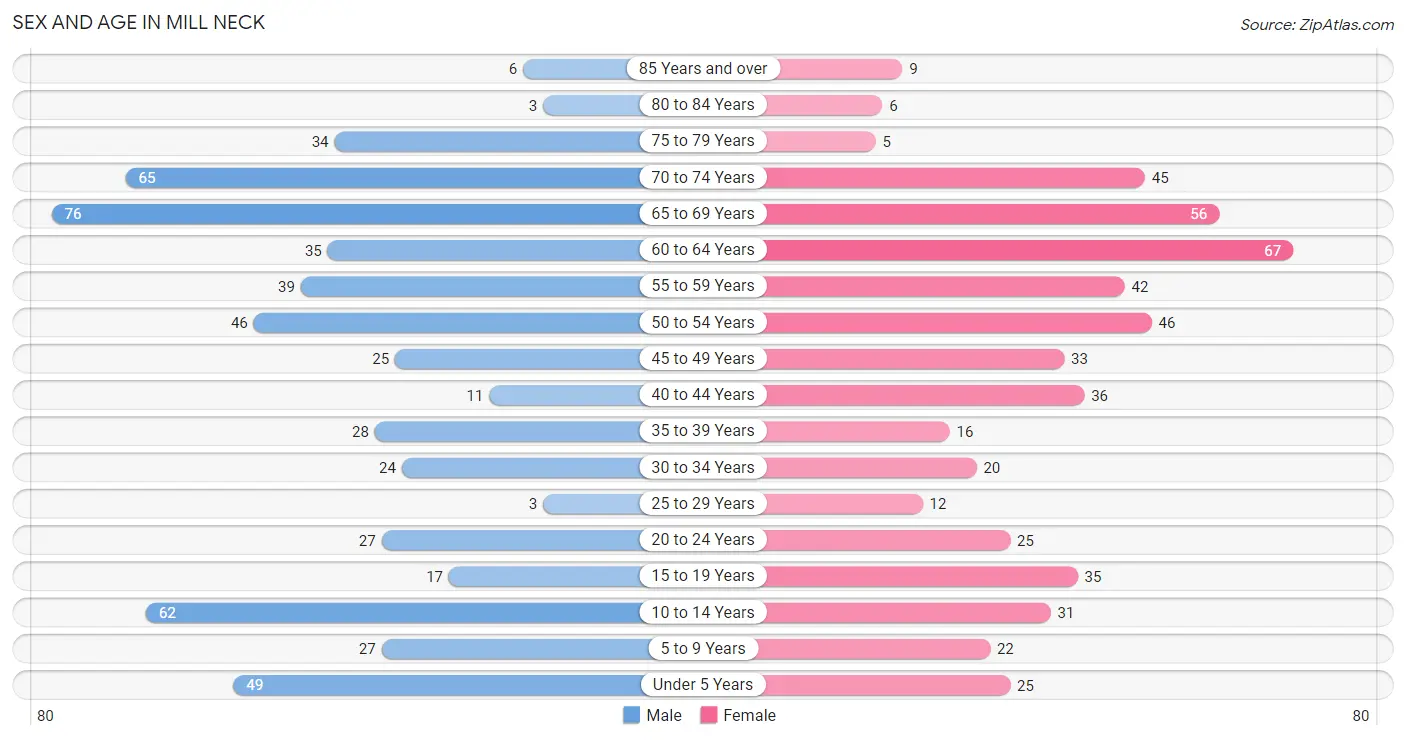
The most populous age groups in Mill Neck are 65 to 69 Years (76 | 13.2%) for men and 60 to 64 Years (67 | 12.6%) for women.
| Age Bracket | Male | Female |
| Under 5 Years | 49 (8.5%) | 25 (4.7%) |
| 5 to 9 Years | 27 (4.7%) | 22 (4.1%) |
| 10 to 14 Years | 62 (10.7%) | 31 (5.8%) |
| 15 to 19 Years | 17 (2.9%) | 35 (6.6%) |
| 20 to 24 Years | 27 (4.7%) | 25 (4.7%) |
| 25 to 29 Years | 3 (0.5%) | 12 (2.3%) |
| 30 to 34 Years | 24 (4.2%) | 20 (3.8%) |
| 35 to 39 Years | 28 (4.9%) | 16 (3.0%) |
| 40 to 44 Years | 11 (1.9%) | 36 (6.8%) |
| 45 to 49 Years | 25 (4.3%) | 33 (6.2%) |
| 50 to 54 Years | 46 (8.0%) | 46 (8.7%) |
| 55 to 59 Years | 39 (6.8%) | 42 (7.9%) |
| 60 to 64 Years | 35 (6.1%) | 67 (12.6%) |
| 65 to 69 Years | 76 (13.2%) | 56 (10.5%) |
| 70 to 74 Years | 65 (11.3%) | 45 (8.5%) |
| 75 to 79 Years | 34 (5.9%) | 5 (0.9%) |
| 80 to 84 Years | 3 (0.5%) | 6 (1.1%) |
| 85 Years and over | 6 (1.0%) | 9 (1.7%) |
| Total | 577 (100.0%) | 531 (100.0%) |
Families and Households in Mill Neck
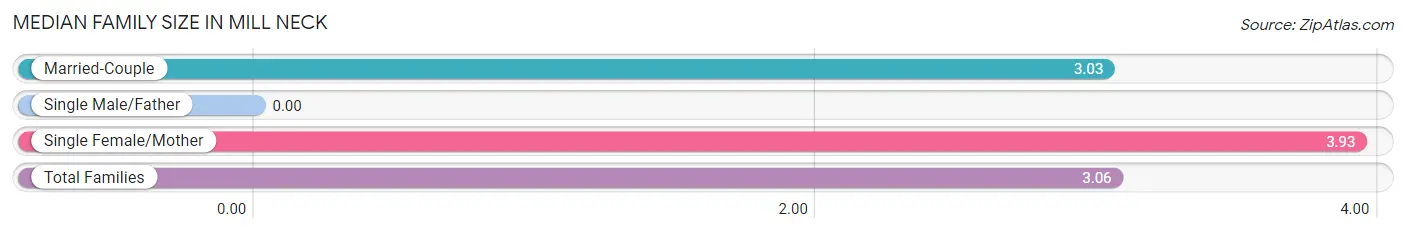
Median Family Size in Mill Neck
| Family Type | # Families | Family Size |
| Married-Couple | 316 (95.8%) | 3.03 |
| Single Male/Father | 0 (0.0%) | - |
| Single Female/Mother | 14 (4.2%) | 3.93 |
| Total Families | 330 (100.0%) | 3.06 |
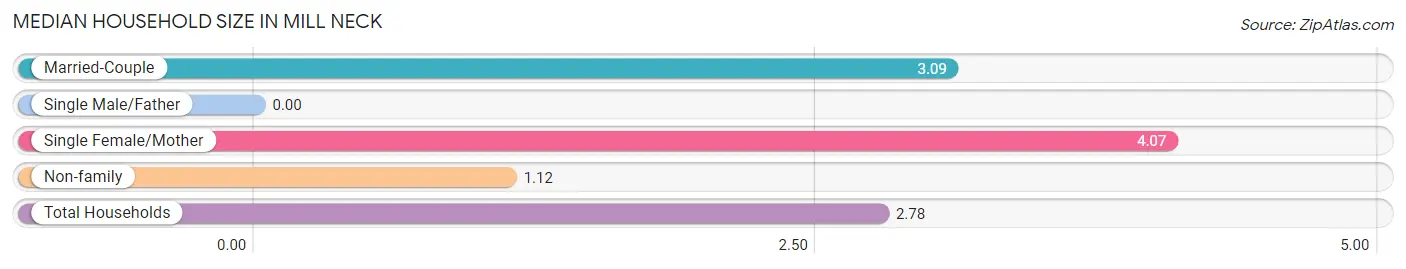
Median Household Size in Mill Neck
| Household Type | # Households | Household Size |
| Married-Couple | 316 (79.4%) | 3.09 |
| Single Male/Father | 0 (0.0%) | - |
| Single Female/Mother | 14 (3.5%) | 4.07 |
| Non-family | 68 (17.1%) | 1.12 |
| Total Households | 398 (100.0%) | 2.78 |
Household Size by Marriage Status in Mill Neck
Out of a total of 398 households in Mill Neck, 330 (82.9%) are family households, while 68 (17.1%) are nonfamily households. The most numerous type of family households are 2-person households, comprising 158, and the most common type of nonfamily households are 1-person households, comprising 58.
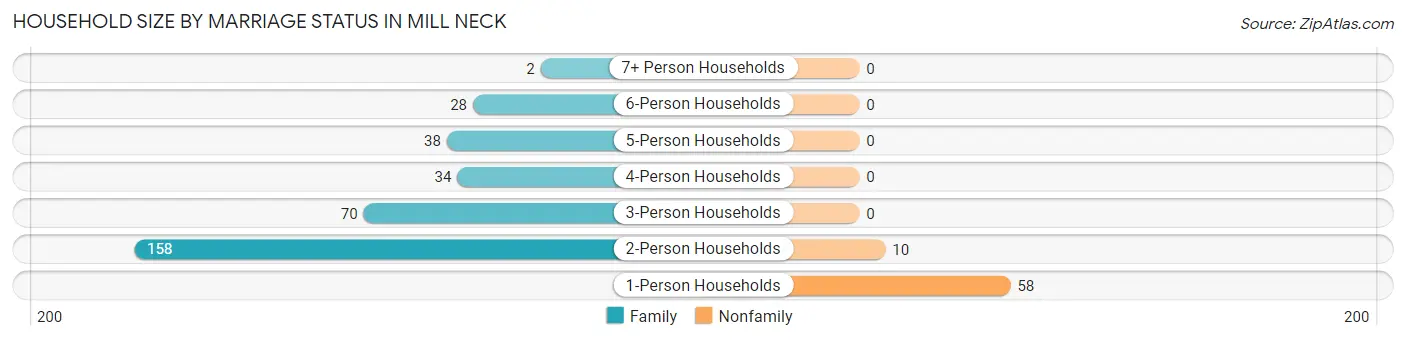
| Household Size | Family Households | Nonfamily Households |
| 1-Person Households | - | 58 (14.6%) |
| 2-Person Households | 158 (39.7%) | 10 (2.5%) |
| 3-Person Households | 70 (17.6%) | 0 (0.0%) |
| 4-Person Households | 34 (8.5%) | 0 (0.0%) |
| 5-Person Households | 38 (9.6%) | 0 (0.0%) |
| 6-Person Households | 28 (7.0%) | 0 (0.0%) |
| 7+ Person Households | 2 (0.5%) | 0 (0.0%) |
| Total | 330 (82.9%) | 68 (17.1%) |
Female Fertility in Mill Neck
Fertility by Age in Mill Neck
Average fertility rate in Mill Neck is 66.0 births per 1,000 women. Women in the age bracket of 20 to 34 years have the highest fertility rate with 158.0 births per 1,000 women. Women in the age bracket of 20 to 34 years acount for 75.0% of all women with births.
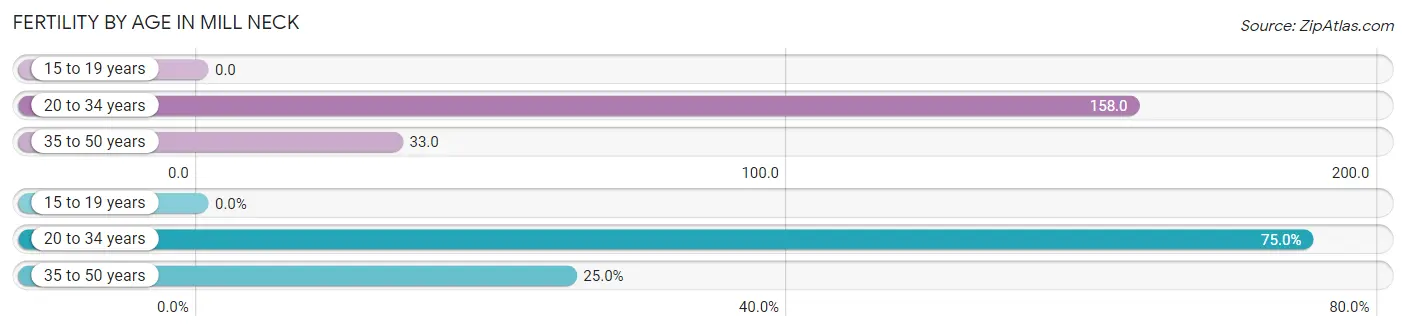
| Age Bracket | Women with Births | Births / 1,000 Women |
| 15 to 19 years | 0 (0.0%) | 0.0 |
| 20 to 34 years | 9 (75.0%) | 158.0 |
| 35 to 50 years | 3 (25.0%) | 33.0 |
| Total | 12 (100.0%) | 66.0 |
Fertility by Age by Marriage Status in Mill Neck
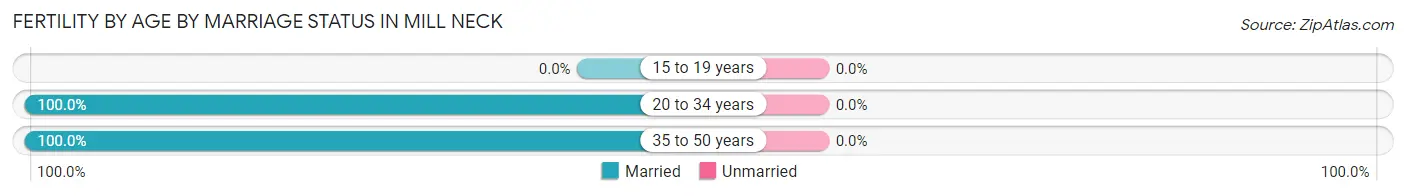
| Age Bracket | Married | Unmarried |
| 15 to 19 years | 0 (0.0%) | 0 (0.0%) |
| 20 to 34 years | 9 (100.0%) | 0 (0.0%) |
| 35 to 50 years | 3 (100.0%) | 0 (0.0%) |
| Total | 12 (100.0%) | 0 (0.0%) |
Fertility by Education in Mill Neck
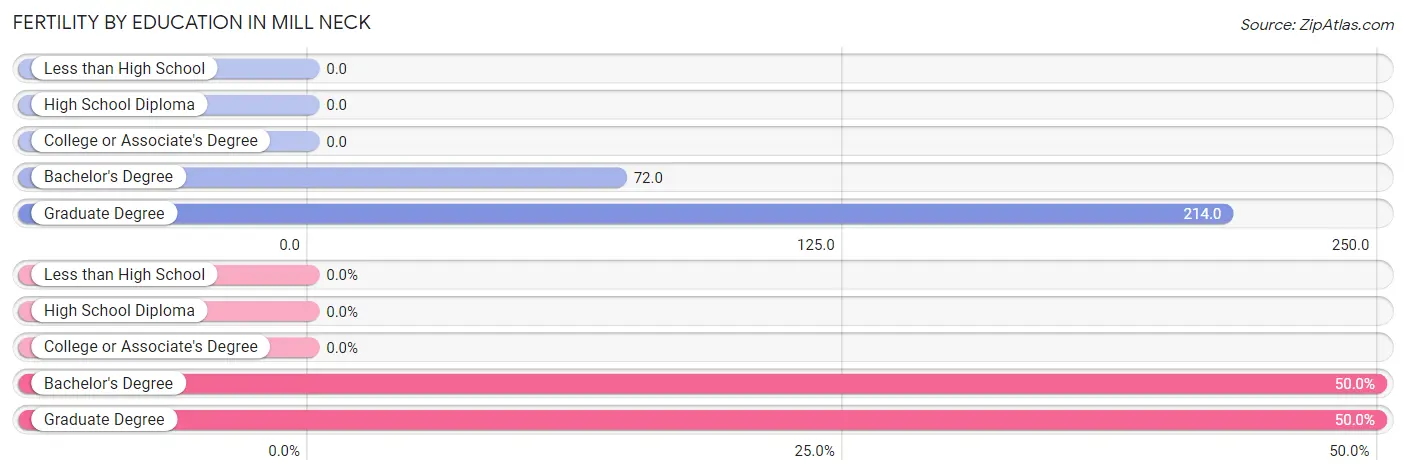
| Educational Attainment | Women with Births | Births / 1,000 Women |
| Less than High School | 0 (0.0%) | 0.0 |
| High School Diploma | 0 (0.0%) | 0.0 |
| College or Associate's Degree | 0 (0.0%) | 0.0 |
| Bachelor's Degree | 6 (50.0%) | 72.0 |
| Graduate Degree | 6 (50.0%) | 214.0 |
| Total | 12 (100.0%) | 66.0 |
Fertility by Education by Marriage Status in Mill Neck
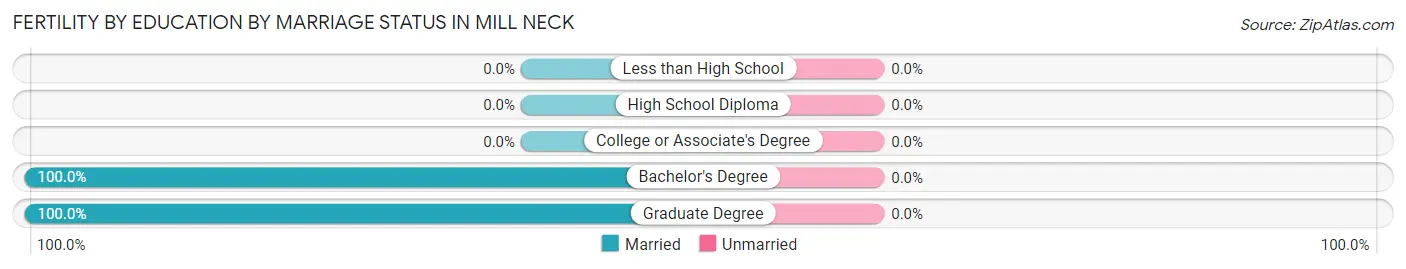
| Educational Attainment | Married | Unmarried |
| Less than High School | 0 (0.0%) | 0 (0.0%) |
| High School Diploma | 0 (0.0%) | 0 (0.0%) |
| College or Associate's Degree | 0 (0.0%) | 0 (0.0%) |
| Bachelor's Degree | 6 (100.0%) | 0 (0.0%) |
| Graduate Degree | 6 (100.0%) | 0 (0.0%) |
| Total | 12 (100.0%) | 0 (0.0%) |
Employment Characteristics in Mill Neck
Employment by Class of Employer in Mill Neck
Among the 498 employed individuals in Mill Neck, private company employees (249 | 50.0%), self-employed (incorporated) (91 | 18.3%), and not-for-profit organizations (81 | 16.3%) make up the most common classes of employment.
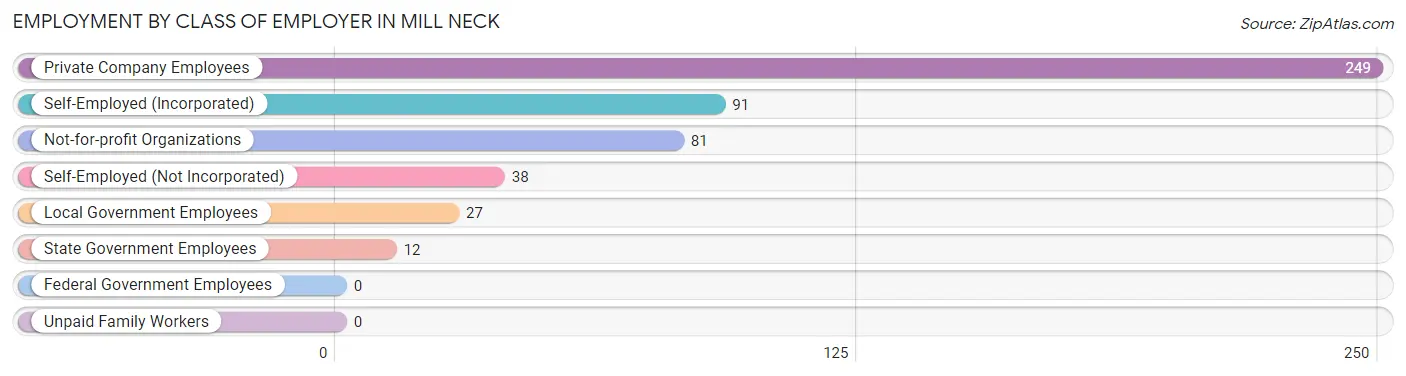
| Employer Class | # Employees | % Employees |
| Private Company Employees | 249 | 50.0% |
| Self-Employed (Incorporated) | 91 | 18.3% |
| Self-Employed (Not Incorporated) | 38 | 7.6% |
| Not-for-profit Organizations | 81 | 16.3% |
| Local Government Employees | 27 | 5.4% |
| State Government Employees | 12 | 2.4% |
| Federal Government Employees | 0 | 0.0% |
| Unpaid Family Workers | 0 | 0.0% |
| Total | 498 | 100.0% |
Employment Status by Age in Mill Neck
According to the labor force statistics for Mill Neck, out of the total population over 16 years of age (872), 59.9% or 522 individuals are in the labor force, with 4.6% or 24 of them unemployed. The age group with the highest labor force participation rate is 25 to 29 years, with 86.7% or 13 individuals in the labor force. Within the labor force, the 75 years and over age range has the highest percentage of unemployed individuals, with 37.5% or 3 of them being unemployed.
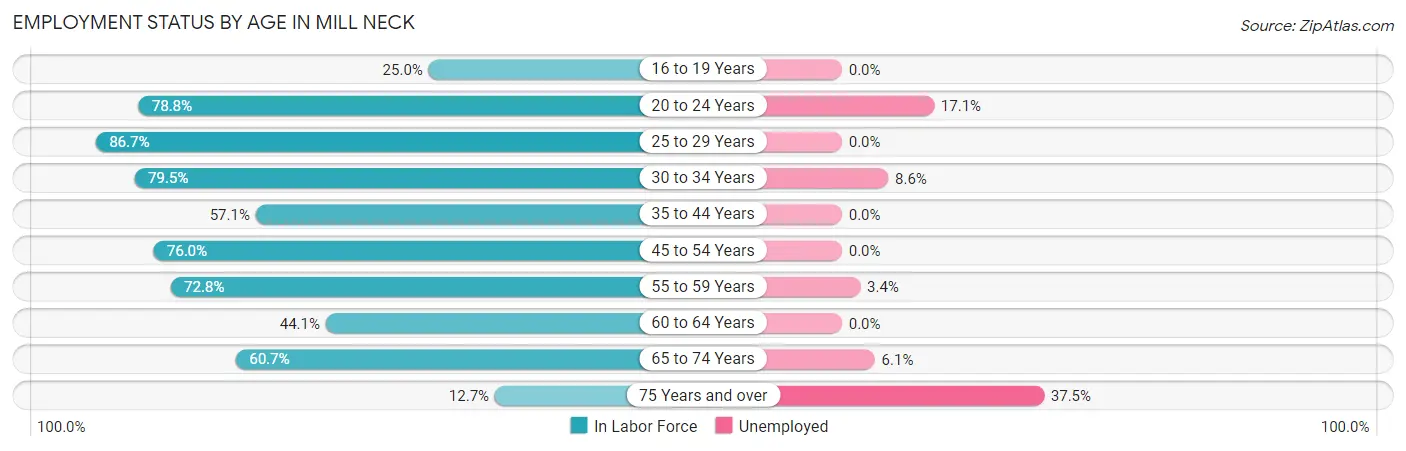
| Age Bracket | In Labor Force | Unemployed |
| 16 to 19 Years | 8 (25.0%) | 0 (0.0%) |
| 20 to 24 Years | 41 (78.8%) | 7 (17.1%) |
| 25 to 29 Years | 13 (86.7%) | 0 (0.0%) |
| 30 to 34 Years | 35 (79.5%) | 3 (8.6%) |
| 35 to 44 Years | 52 (57.1%) | 0 (0.0%) |
| 45 to 54 Years | 114 (76.0%) | 0 (0.0%) |
| 55 to 59 Years | 59 (72.8%) | 2 (3.4%) |
| 60 to 64 Years | 45 (44.1%) | 0 (0.0%) |
| 65 to 74 Years | 147 (60.7%) | 9 (6.1%) |
| 75 Years and over | 8 (12.7%) | 3 (37.5%) |
| Total | 522 (59.9%) | 24 (4.6%) |
Employment Status by Educational Attainment in Mill Neck
According to labor force statistics for Mill Neck, 65.8% of individuals (318) out of the total population between 25 and 64 years of age (483) are in the labor force, with 1.6% or 5 of them being unemployed. The group with the highest labor force participation rate are those with the educational attainment of college / associate degree, with 86.6% or 58 individuals in the labor force. Within the labor force, individuals with bachelor's degree or higher education have the highest percentage of unemployment, with 2.1% or 5 of them being unemployed.
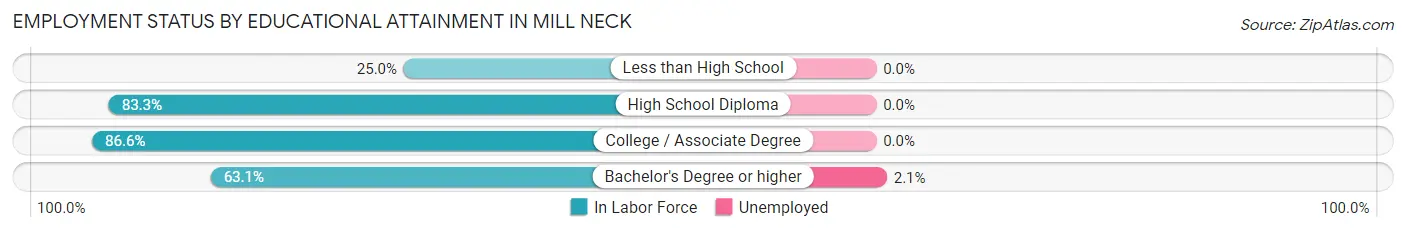
| Educational Attainment | In Labor Force | Unemployed |
| Less than High School | 4 (25.0%) | 0 (0.0%) |
| High School Diploma | 15 (83.3%) | 0 (0.0%) |
| College / Associate Degree | 58 (86.6%) | 0 (0.0%) |
| Bachelor's Degree or higher | 241 (63.1%) | 8 (2.1%) |
| Total | 318 (65.8%) | 8 (1.6%) |
Employment Occupations by Sex in Mill Neck
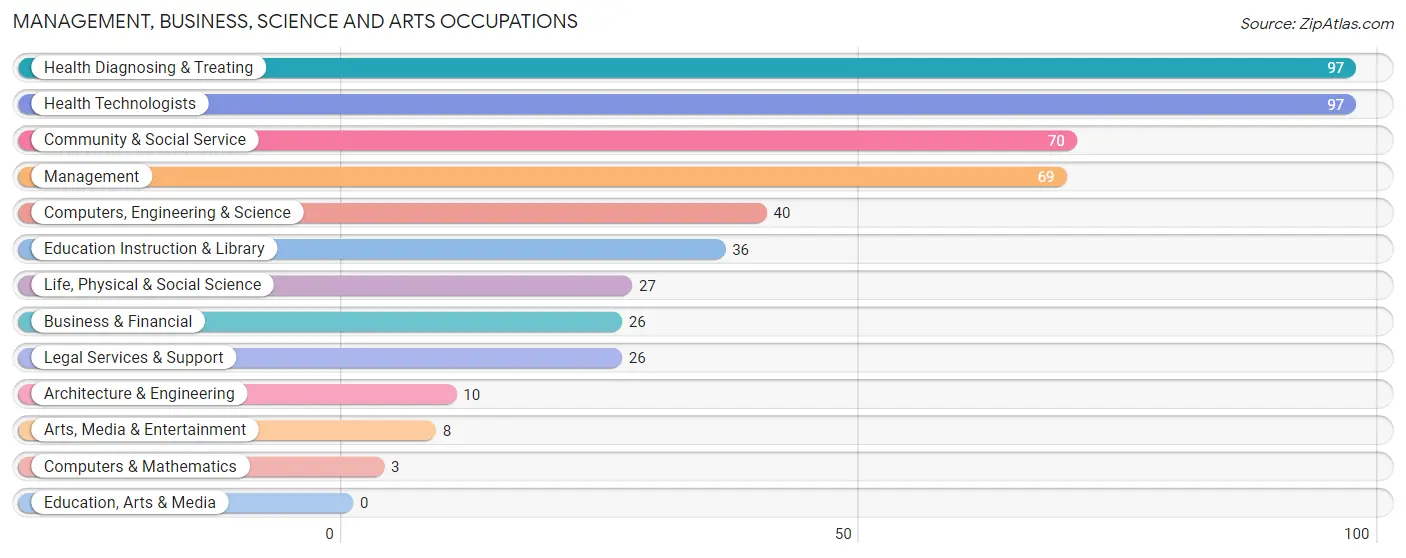
Management, Business, Science and Arts Occupations
The most common Management, Business, Science and Arts occupations in Mill Neck are Health Diagnosing & Treating (97 | 19.5%), Health Technologists (97 | 19.5%), Community & Social Service (70 | 14.1%), Management (69 | 13.9%), and Computers, Engineering & Science (40 | 8.0%).
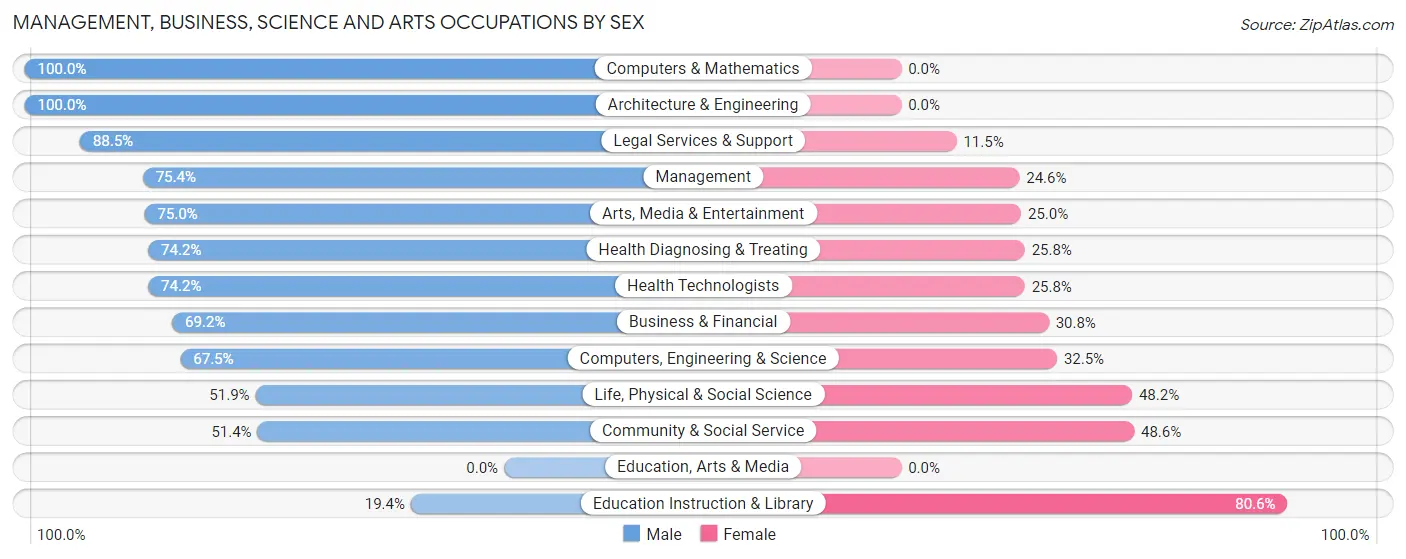
Management, Business, Science and Arts Occupations by Sex
Within the Management, Business, Science and Arts occupations in Mill Neck, the most male-oriented occupations are Computers & Mathematics (100.0%), Architecture & Engineering (100.0%), and Legal Services & Support (88.5%), while the most female-oriented occupations are Education Instruction & Library (80.6%), Community & Social Service (48.6%), and Life, Physical & Social Science (48.1%).
| Occupation | Male | Female |
| Management | 52 (75.4%) | 17 (24.6%) |
| Business & Financial | 18 (69.2%) | 8 (30.8%) |
| Computers, Engineering & Science | 27 (67.5%) | 13 (32.5%) |
| Computers & Mathematics | 3 (100.0%) | 0 (0.0%) |
| Architecture & Engineering | 10 (100.0%) | 0 (0.0%) |
| Life, Physical & Social Science | 14 (51.8%) | 13 (48.1%) |
| Community & Social Service | 36 (51.4%) | 34 (48.6%) |
| Education, Arts & Media | 0 (0.0%) | 0 (0.0%) |
| Legal Services & Support | 23 (88.5%) | 3 (11.5%) |
| Education Instruction & Library | 7 (19.4%) | 29 (80.6%) |
| Arts, Media & Entertainment | 6 (75.0%) | 2 (25.0%) |
| Health Diagnosing & Treating | 72 (74.2%) | 25 (25.8%) |
| Health Technologists | 72 (74.2%) | 25 (25.8%) |
| Total (Category) | 205 (67.9%) | 97 (32.1%) |
| Total (Overall) | 309 (62.1%) | 189 (38.0%) |
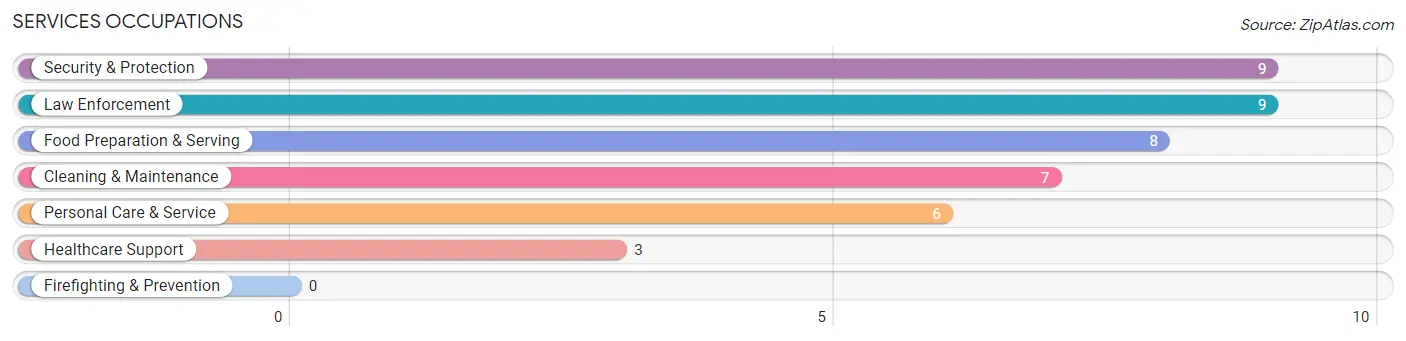
Services Occupations
The most common Services occupations in Mill Neck are Security & Protection (9 | 1.8%), Law Enforcement (9 | 1.8%), Food Preparation & Serving (8 | 1.6%), Cleaning & Maintenance (7 | 1.4%), and Personal Care & Service (6 | 1.2%).
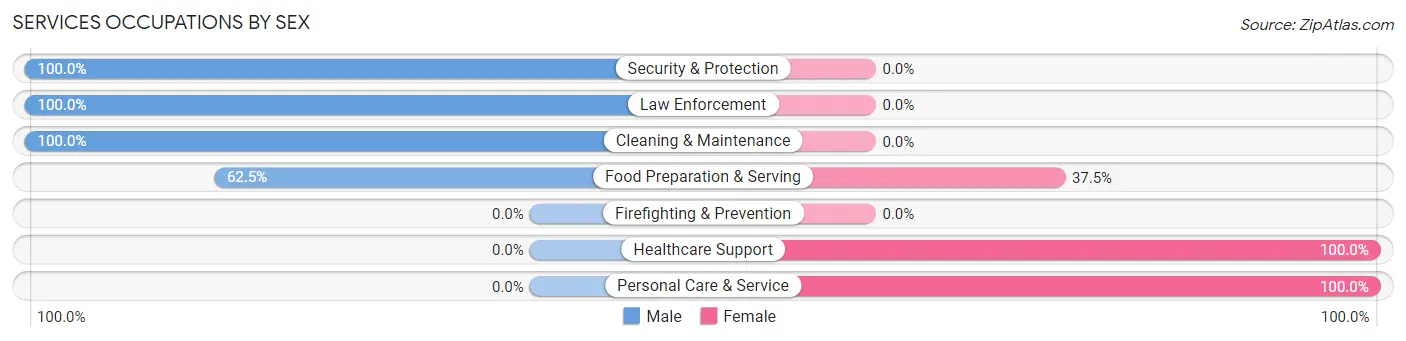
Services Occupations by Sex
Within the Services occupations in Mill Neck, the most male-oriented occupations are Security & Protection (100.0%), Law Enforcement (100.0%), and Cleaning & Maintenance (100.0%), while the most female-oriented occupations are Healthcare Support (100.0%), Personal Care & Service (100.0%), and Food Preparation & Serving (37.5%).
| Occupation | Male | Female |
| Healthcare Support | 0 (0.0%) | 3 (100.0%) |
| Security & Protection | 9 (100.0%) | 0 (0.0%) |
| Firefighting & Prevention | 0 (0.0%) | 0 (0.0%) |
| Law Enforcement | 9 (100.0%) | 0 (0.0%) |
| Food Preparation & Serving | 5 (62.5%) | 3 (37.5%) |
| Cleaning & Maintenance | 7 (100.0%) | 0 (0.0%) |
| Personal Care & Service | 0 (0.0%) | 6 (100.0%) |
| Total (Category) | 21 (63.6%) | 12 (36.4%) |
| Total (Overall) | 309 (62.1%) | 189 (38.0%) |
Sales and Office Occupations
The most common Sales and Office occupations in Mill Neck are Office & Administration (58 | 11.7%), and Sales & Related (50 | 10.0%).

Sales and Office Occupations by Sex

| Occupation | Male | Female |
| Sales & Related | 28 (56.0%) | 22 (44.0%) |
| Office & Administration | 0 (0.0%) | 58 (100.0%) |
| Total (Category) | 28 (25.9%) | 80 (74.1%) |
| Total (Overall) | 309 (62.1%) | 189 (38.0%) |
Natural Resources, Construction and Maintenance Occupations
The most common Natural Resources, Construction and Maintenance occupations in Mill Neck are Construction & Extraction (37 | 7.4%), and Installation, Maintenance & Repair (18 | 3.6%).
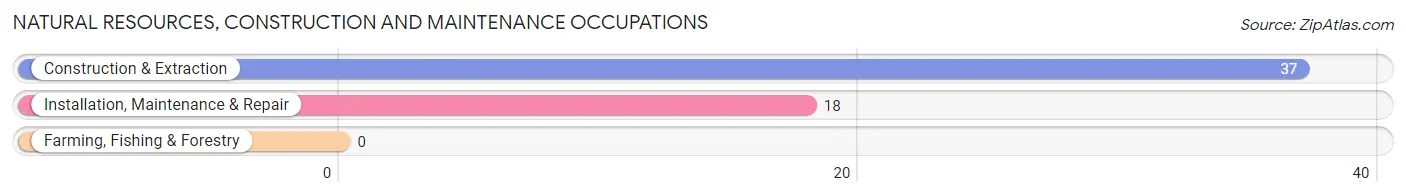
Natural Resources, Construction and Maintenance Occupations by Sex
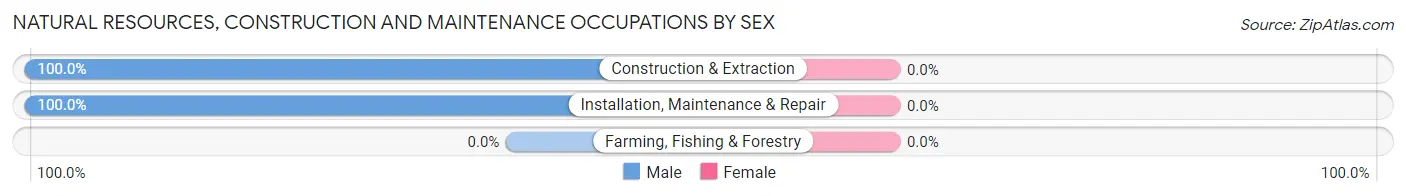
| Occupation | Male | Female |
| Farming, Fishing & Forestry | 0 (0.0%) | 0 (0.0%) |
| Construction & Extraction | 37 (100.0%) | 0 (0.0%) |
| Installation, Maintenance & Repair | 18 (100.0%) | 0 (0.0%) |
| Total (Category) | 55 (100.0%) | 0 (0.0%) |
| Total (Overall) | 309 (62.1%) | 189 (38.0%) |
Production, Transportation and Moving Occupations
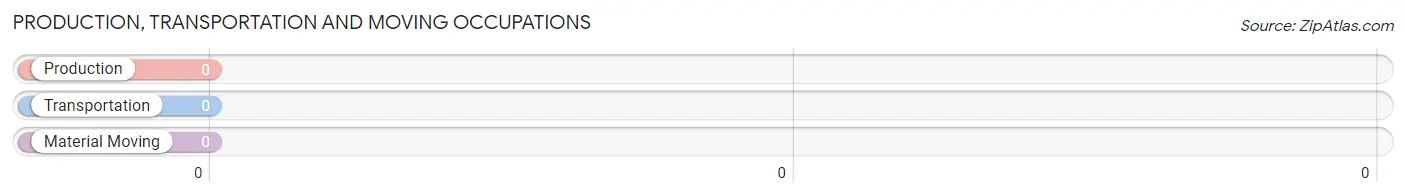
Production, Transportation and Moving Occupations by Sex
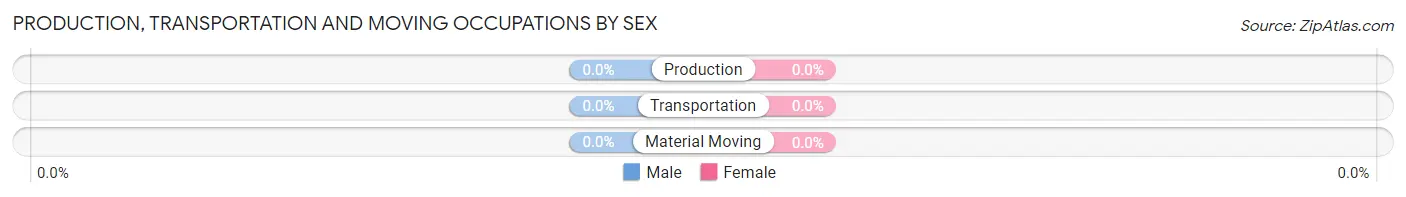
| Occupation | Male | Female |
| Production | 0 (0.0%) | 0 (0.0%) |
| Transportation | 0 (0.0%) | 0 (0.0%) |
| Material Moving | 0 (0.0%) | 0 (0.0%) |
| Total (Category) | 0 (0.0%) | 0 (0.0%) |
| Total (Overall) | 309 (62.1%) | 189 (38.0%) |
Employment Industries by Sex in Mill Neck
Employment Industries in Mill Neck
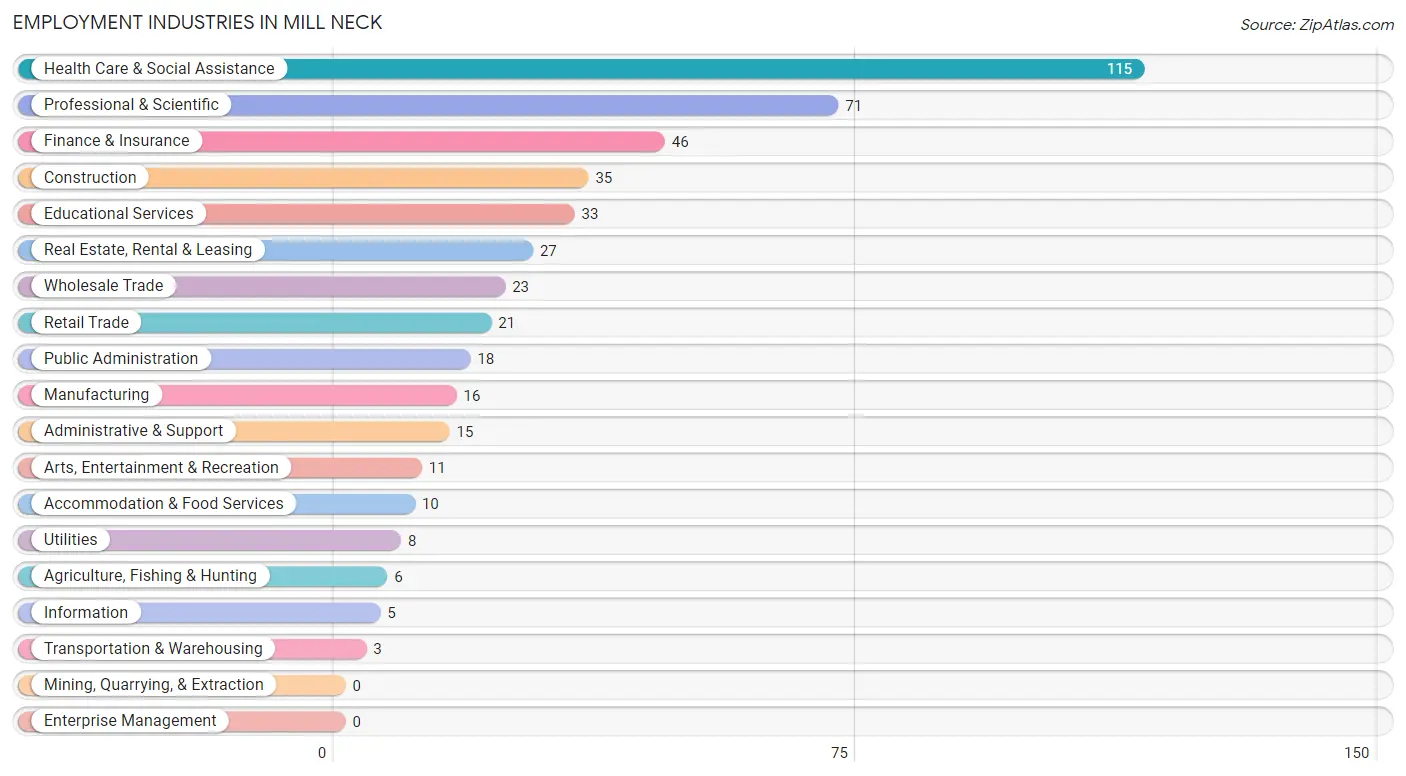
The major employment industries in Mill Neck include Health Care & Social Assistance (115 | 23.1%), Professional & Scientific (71 | 14.3%), Finance & Insurance (46 | 9.2%), Construction (35 | 7.0%), and Educational Services (33 | 6.6%).
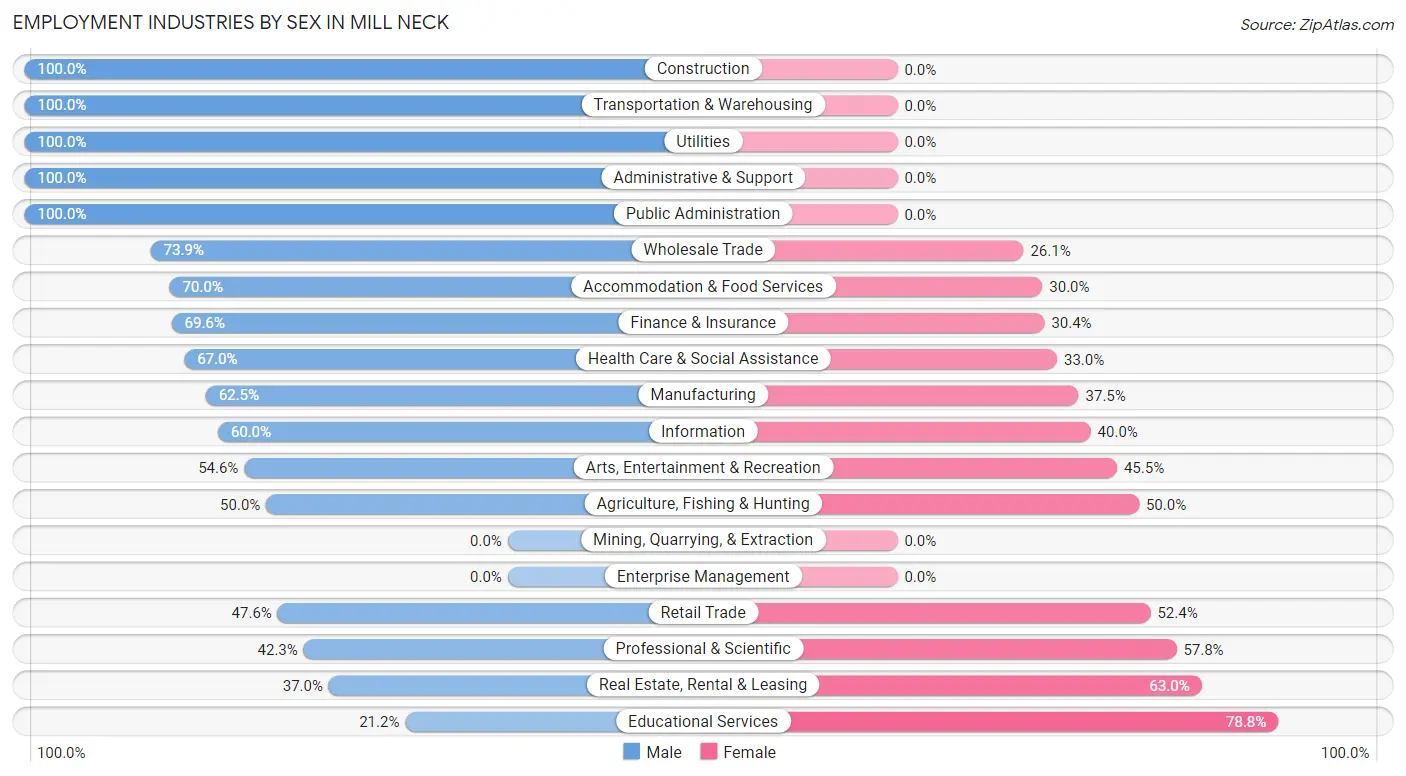
Employment Industries by Sex in Mill Neck
The Mill Neck industries that see more men than women are Construction (100.0%), Transportation & Warehousing (100.0%), and Utilities (100.0%), whereas the industries that tend to have a higher number of women are Educational Services (78.8%), Real Estate, Rental & Leasing (63.0%), and Professional & Scientific (57.8%).
| Industry | Male | Female |
| Agriculture, Fishing & Hunting | 3 (50.0%) | 3 (50.0%) |
| Mining, Quarrying, & Extraction | 0 (0.0%) | 0 (0.0%) |
| Construction | 35 (100.0%) | 0 (0.0%) |
| Manufacturing | 10 (62.5%) | 6 (37.5%) |
| Wholesale Trade | 17 (73.9%) | 6 (26.1%) |
| Retail Trade | 10 (47.6%) | 11 (52.4%) |
| Transportation & Warehousing | 3 (100.0%) | 0 (0.0%) |
| Utilities | 8 (100.0%) | 0 (0.0%) |
| Information | 3 (60.0%) | 2 (40.0%) |
| Finance & Insurance | 32 (69.6%) | 14 (30.4%) |
| Real Estate, Rental & Leasing | 10 (37.0%) | 17 (63.0%) |
| Professional & Scientific | 30 (42.2%) | 41 (57.8%) |
| Enterprise Management | 0 (0.0%) | 0 (0.0%) |
| Administrative & Support | 15 (100.0%) | 0 (0.0%) |
| Educational Services | 7 (21.2%) | 26 (78.8%) |
| Health Care & Social Assistance | 77 (67.0%) | 38 (33.0%) |
| Arts, Entertainment & Recreation | 6 (54.5%) | 5 (45.5%) |
| Accommodation & Food Services | 7 (70.0%) | 3 (30.0%) |
| Public Administration | 18 (100.0%) | 0 (0.0%) |
| Total | 309 (62.1%) | 189 (38.0%) |
Education in Mill Neck
School Enrollment in Mill Neck
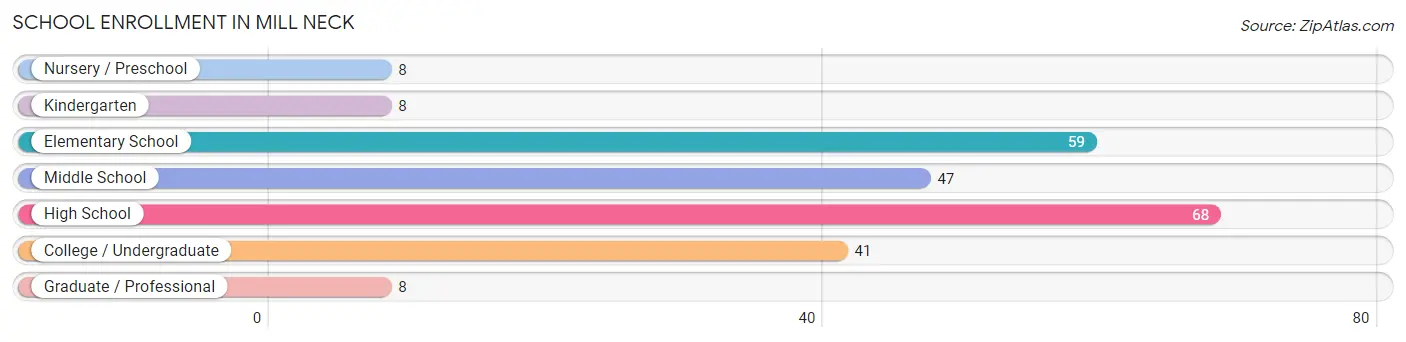
The most common levels of schooling among the 239 students in Mill Neck are high school (68 | 28.4%), elementary school (59 | 24.7%), and middle school (47 | 19.7%).
| School Level | # Students | % Students |
| Nursery / Preschool | 8 | 3.4% |
| Kindergarten | 8 | 3.4% |
| Elementary School | 59 | 24.7% |
| Middle School | 47 | 19.7% |
| High School | 68 | 28.4% |
| College / Undergraduate | 41 | 17.2% |
| Graduate / Professional | 8 | 3.4% |
| Total | 239 | 100.0% |
School Enrollment by Age by Funding Source in Mill Neck
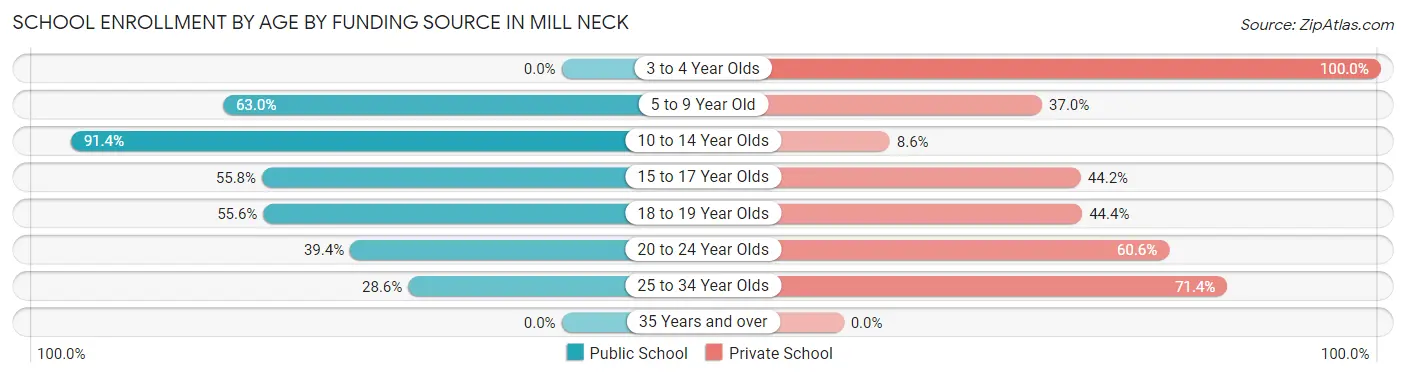
Out of a total of 239 students who are enrolled in schools in Mill Neck, 81 (33.9%) attend a private institution, while the remaining 158 (66.1%) are enrolled in public schools. The age group of 3 to 4 year olds has the highest likelihood of being enrolled in private schools, with 8 (100.0% in the age bracket) enrolled. Conversely, the age group of 10 to 14 year olds has the lowest likelihood of being enrolled in a private school, with 85 (91.4% in the age bracket) attending a public institution.
| Age Bracket | Public School | Private School |
| 3 to 4 Year Olds | 0 (0.0%) | 8 (100.0%) |
| 5 to 9 Year Old | 29 (63.0%) | 17 (37.0%) |
| 10 to 14 Year Olds | 85 (91.4%) | 8 (8.6%) |
| 15 to 17 Year Olds | 24 (55.8%) | 19 (44.2%) |
| 18 to 19 Year Olds | 5 (55.6%) | 4 (44.4%) |
| 20 to 24 Year Olds | 13 (39.4%) | 20 (60.6%) |
| 25 to 34 Year Olds | 2 (28.6%) | 5 (71.4%) |
| 35 Years and over | 0 (0.0%) | 0 (0.0%) |
| Total | 158 (66.1%) | 81 (33.9%) |
Educational Attainment by Field of Study in Mill Neck
Business (127 | 19.7%), social sciences (67 | 10.4%), science & technology (67 | 10.4%), education (62 | 9.6%), and liberal arts & history (50 | 7.8%) are the most common fields of study among 644 individuals in Mill Neck who have obtained a bachelor's degree or higher.
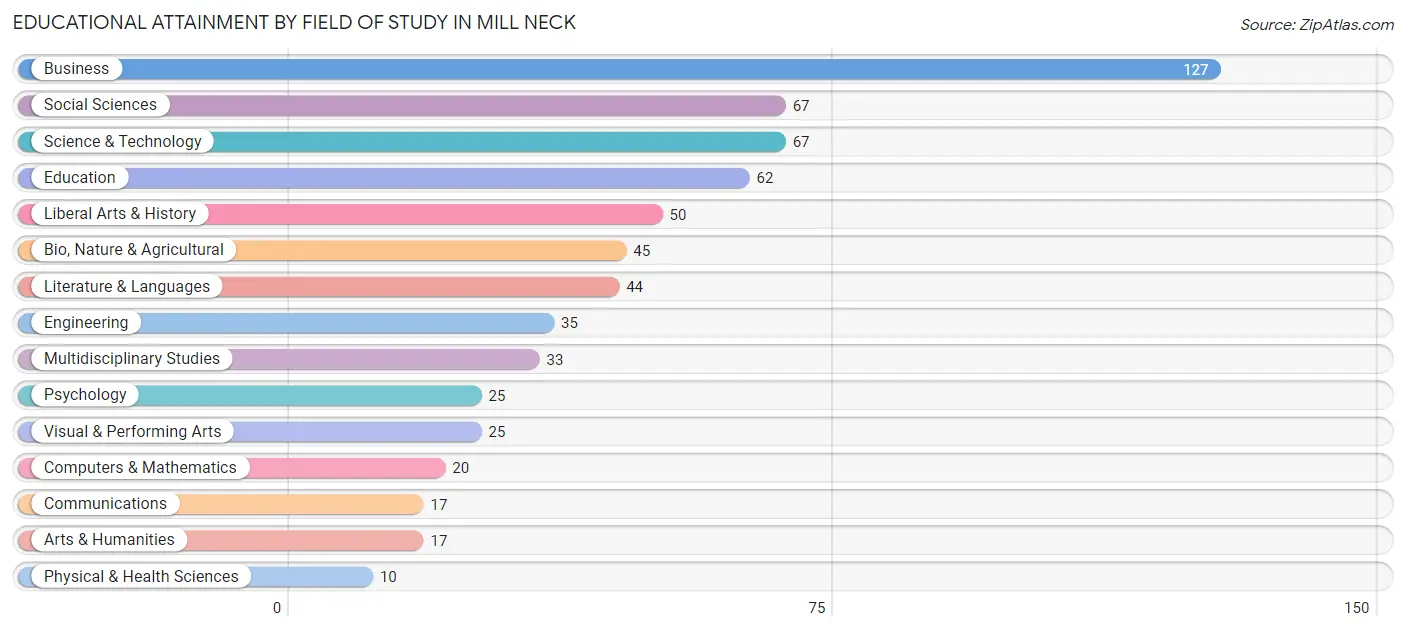
| Field of Study | # Graduates | % Graduates |
| Computers & Mathematics | 20 | 3.1% |
| Bio, Nature & Agricultural | 45 | 7.0% |
| Physical & Health Sciences | 10 | 1.5% |
| Psychology | 25 | 3.9% |
| Social Sciences | 67 | 10.4% |
| Engineering | 35 | 5.4% |
| Multidisciplinary Studies | 33 | 5.1% |
| Science & Technology | 67 | 10.4% |
| Business | 127 | 19.7% |
| Education | 62 | 9.6% |
| Literature & Languages | 44 | 6.8% |
| Liberal Arts & History | 50 | 7.8% |
| Visual & Performing Arts | 25 | 3.9% |
| Communications | 17 | 2.6% |
| Arts & Humanities | 17 | 2.6% |
| Total | 644 | 100.0% |
Transportation & Commute in Mill Neck
Vehicle Availability by Sex in Mill Neck
The most prevalent vehicle ownership categories in Mill Neck are males with 2 vehicles (111, accounting for 35.9%) and females with 2 vehicles (80, making up 58.7%).
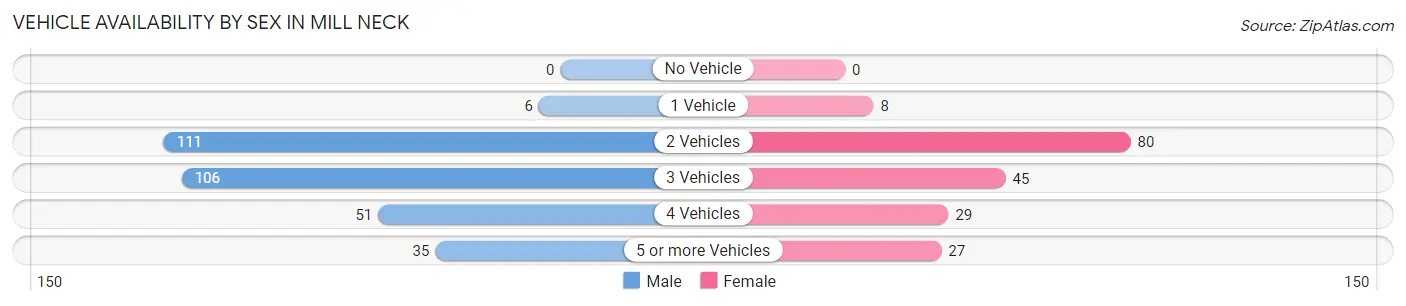
| Vehicles Available | Male | Female |
| No Vehicle | 0 (0.0%) | 0 (0.0%) |
| 1 Vehicle | 6 (1.9%) | 8 (4.2%) |
| 2 Vehicles | 111 (35.9%) | 80 (42.3%) |
| 3 Vehicles | 106 (34.3%) | 45 (23.8%) |
| 4 Vehicles | 51 (16.5%) | 29 (15.3%) |
| 5 or more Vehicles | 35 (11.3%) | 27 (14.3%) |
| Total | 309 (100.0%) | 189 (100.0%) |
Commute Time in Mill Neck
The most frequently occuring commute durations in Mill Neck are 30 to 34 minutes (120 commuters, 27.0%), 10 to 14 minutes (52 commuters, 11.7%), and 20 to 24 minutes (44 commuters, 9.9%).
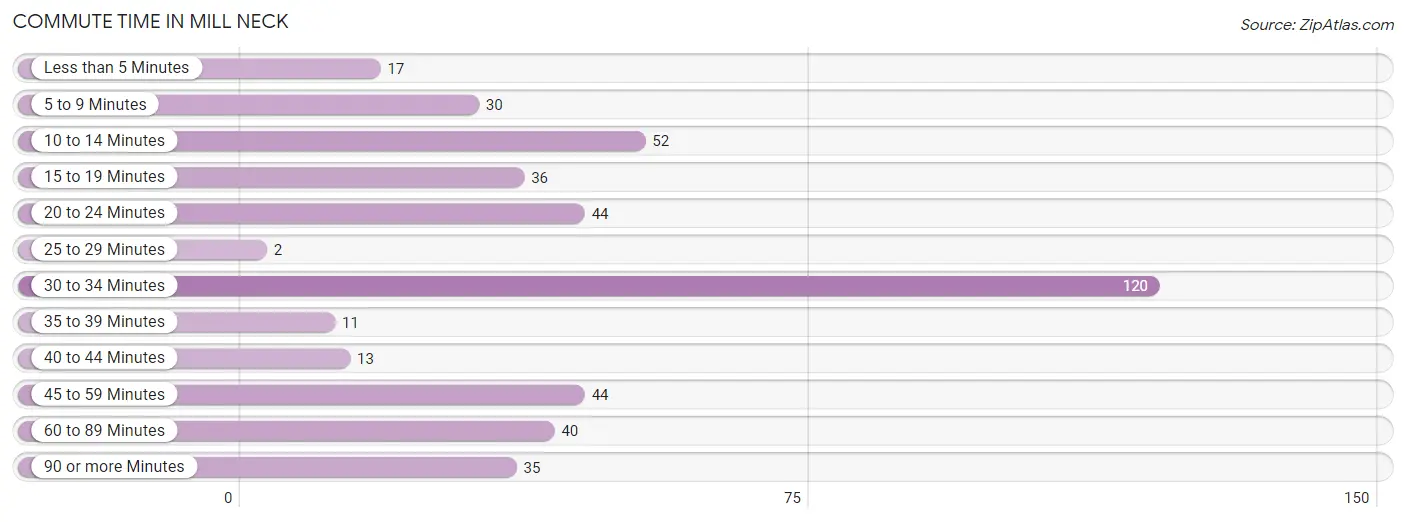
| Commute Time | # Commuters | % Commuters |
| Less than 5 Minutes | 17 | 3.8% |
| 5 to 9 Minutes | 30 | 6.8% |
| 10 to 14 Minutes | 52 | 11.7% |
| 15 to 19 Minutes | 36 | 8.1% |
| 20 to 24 Minutes | 44 | 9.9% |
| 25 to 29 Minutes | 2 | 0.4% |
| 30 to 34 Minutes | 120 | 27.0% |
| 35 to 39 Minutes | 11 | 2.5% |
| 40 to 44 Minutes | 13 | 2.9% |
| 45 to 59 Minutes | 44 | 9.9% |
| 60 to 89 Minutes | 40 | 9.0% |
| 90 or more Minutes | 35 | 7.9% |
Commute Time by Sex in Mill Neck
The most common commute times in Mill Neck are 30 to 34 minutes (85 commuters, 30.4%) for males and 30 to 34 minutes (35 commuters, 21.3%) for females.
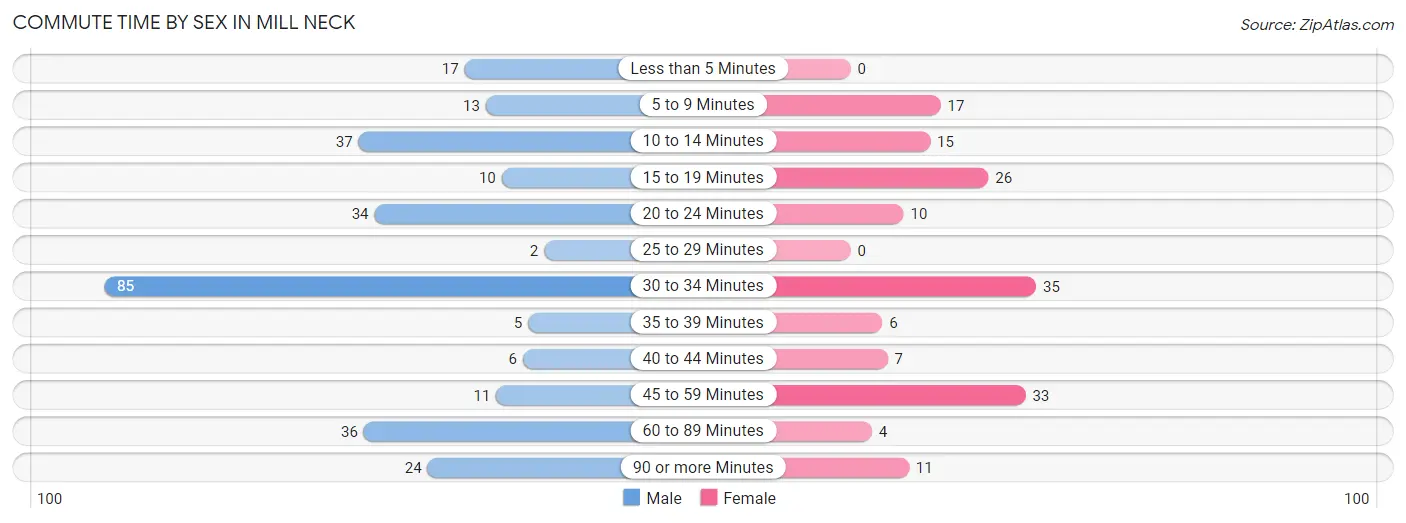
| Commute Time | Male | Female |
| Less than 5 Minutes | 17 (6.1%) | 0 (0.0%) |
| 5 to 9 Minutes | 13 (4.6%) | 17 (10.4%) |
| 10 to 14 Minutes | 37 (13.2%) | 15 (9.1%) |
| 15 to 19 Minutes | 10 (3.6%) | 26 (15.9%) |
| 20 to 24 Minutes | 34 (12.1%) | 10 (6.1%) |
| 25 to 29 Minutes | 2 (0.7%) | 0 (0.0%) |
| 30 to 34 Minutes | 85 (30.4%) | 35 (21.3%) |
| 35 to 39 Minutes | 5 (1.8%) | 6 (3.7%) |
| 40 to 44 Minutes | 6 (2.1%) | 7 (4.3%) |
| 45 to 59 Minutes | 11 (3.9%) | 33 (20.1%) |
| 60 to 89 Minutes | 36 (12.9%) | 4 (2.4%) |
| 90 or more Minutes | 24 (8.6%) | 11 (6.7%) |
Time of Departure to Work by Sex in Mill Neck
The most frequent times of departure to work in Mill Neck are 8:00 AM to 8:29 AM (90, 32.1%) for males and 7:00 AM to 7:29 AM (67, 40.8%) for females.
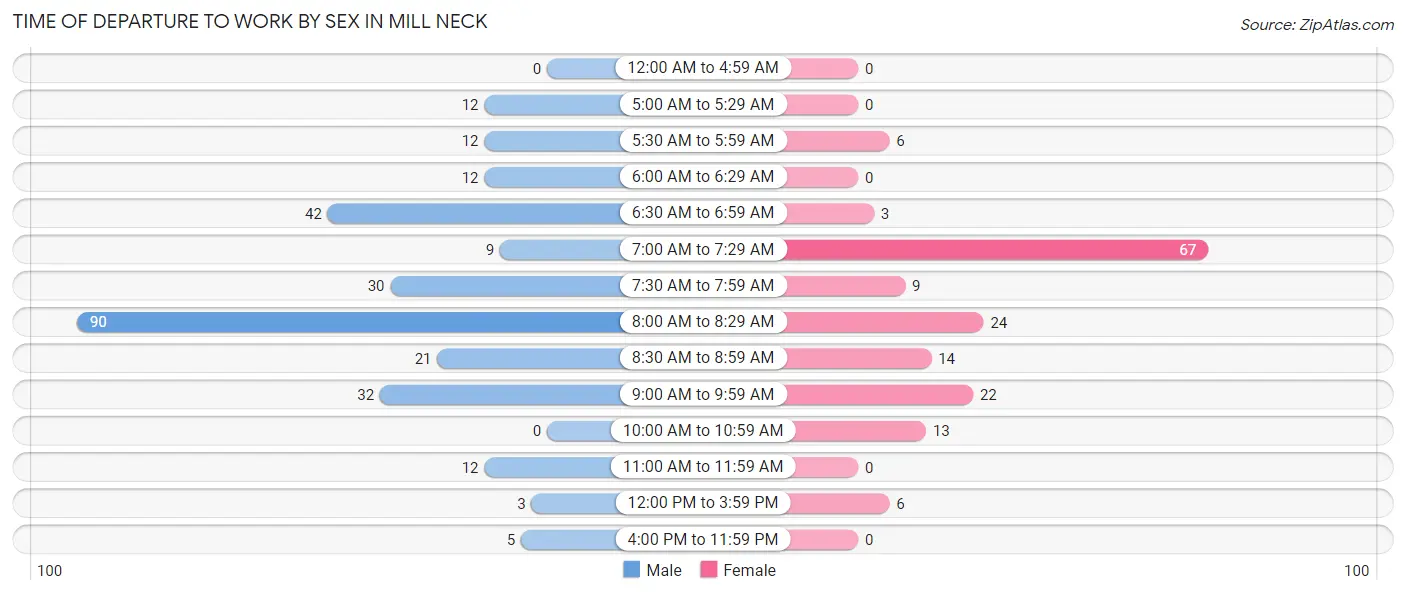
| Time of Departure | Male | Female |
| 12:00 AM to 4:59 AM | 0 (0.0%) | 0 (0.0%) |
| 5:00 AM to 5:29 AM | 12 (4.3%) | 0 (0.0%) |
| 5:30 AM to 5:59 AM | 12 (4.3%) | 6 (3.7%) |
| 6:00 AM to 6:29 AM | 12 (4.3%) | 0 (0.0%) |
| 6:30 AM to 6:59 AM | 42 (15.0%) | 3 (1.8%) |
| 7:00 AM to 7:29 AM | 9 (3.2%) | 67 (40.8%) |
| 7:30 AM to 7:59 AM | 30 (10.7%) | 9 (5.5%) |
| 8:00 AM to 8:29 AM | 90 (32.1%) | 24 (14.6%) |
| 8:30 AM to 8:59 AM | 21 (7.5%) | 14 (8.5%) |
| 9:00 AM to 9:59 AM | 32 (11.4%) | 22 (13.4%) |
| 10:00 AM to 10:59 AM | 0 (0.0%) | 13 (7.9%) |
| 11:00 AM to 11:59 AM | 12 (4.3%) | 0 (0.0%) |
| 12:00 PM to 3:59 PM | 3 (1.1%) | 6 (3.7%) |
| 4:00 PM to 11:59 PM | 5 (1.8%) | 0 (0.0%) |
| Total | 280 (100.0%) | 164 (100.0%) |
Housing Occupancy in Mill Neck
Occupancy by Ownership in Mill Neck
Of the total 398 dwellings in Mill Neck, owner-occupied units account for 366 (92.0%), while renter-occupied units make up 32 (8.0%).
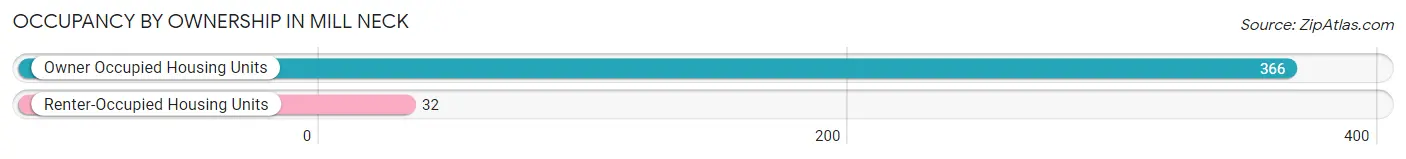
| Occupancy | # Housing Units | % Housing Units |
| Owner Occupied Housing Units | 366 | 92.0% |
| Renter-Occupied Housing Units | 32 | 8.0% |
| Total Occupied Housing Units | 398 | 100.0% |
Occupancy by Household Size in Mill Neck
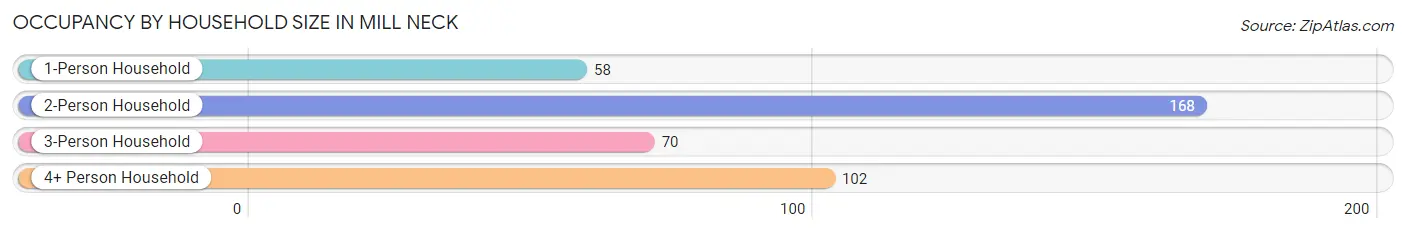
| Household Size | # Housing Units | % Housing Units |
| 1-Person Household | 58 | 14.6% |
| 2-Person Household | 168 | 42.2% |
| 3-Person Household | 70 | 17.6% |
| 4+ Person Household | 102 | 25.6% |
| Total Housing Units | 398 | 100.0% |
Occupancy by Ownership by Household Size in Mill Neck
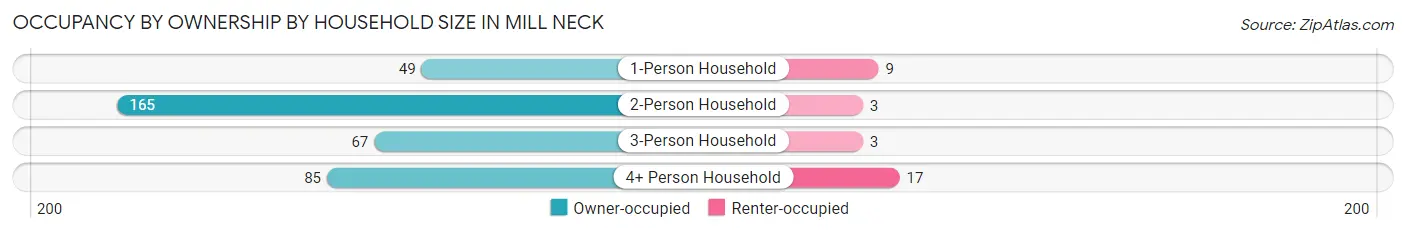
| Household Size | Owner-occupied | Renter-occupied |
| 1-Person Household | 49 (84.5%) | 9 (15.5%) |
| 2-Person Household | 165 (98.2%) | 3 (1.8%) |
| 3-Person Household | 67 (95.7%) | 3 (4.3%) |
| 4+ Person Household | 85 (83.3%) | 17 (16.7%) |
| Total Housing Units | 366 (92.0%) | 32 (8.0%) |
Occupancy by Educational Attainment in Mill Neck
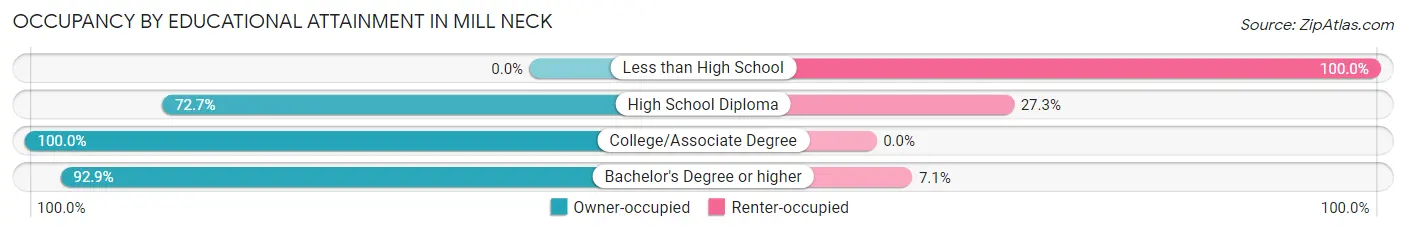
| Household Size | Owner-occupied | Renter-occupied |
| Less than High School | 0 (0.0%) | 4 (100.0%) |
| High School Diploma | 8 (72.7%) | 3 (27.3%) |
| College/Associate Degree | 31 (100.0%) | 0 (0.0%) |
| Bachelor's Degree or higher | 327 (92.9%) | 25 (7.1%) |
Occupancy by Age of Householder in Mill Neck
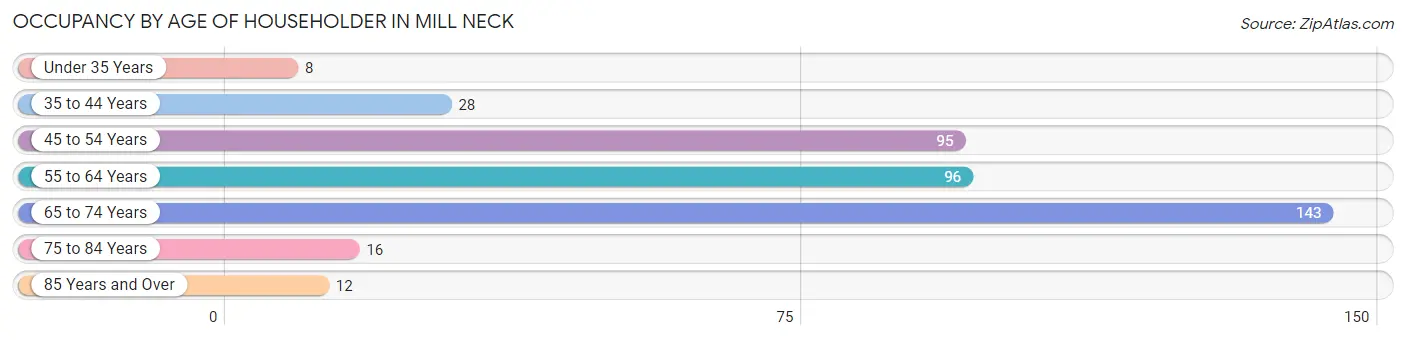
| Age Bracket | # Households | % Households |
| Under 35 Years | 8 | 2.0% |
| 35 to 44 Years | 28 | 7.0% |
| 45 to 54 Years | 95 | 23.9% |
| 55 to 64 Years | 96 | 24.1% |
| 65 to 74 Years | 143 | 35.9% |
| 75 to 84 Years | 16 | 4.0% |
| 85 Years and Over | 12 | 3.0% |
| Total | 398 | 100.0% |
Housing Finances in Mill Neck
Median Income by Occupancy in Mill Neck
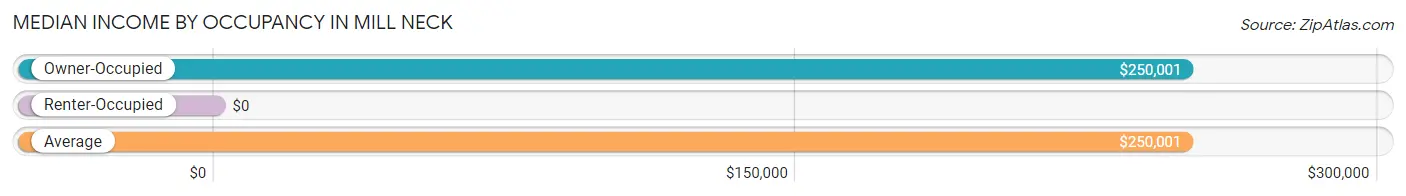
| Occupancy Type | # Households | Median Income |
| Owner-Occupied | 366 (92.0%) | $250,001 |
| Renter-Occupied | 32 (8.0%) | $0 |
| Average | 398 (100.0%) | $250,001 |
Occupancy by Householder Income Bracket in Mill Neck
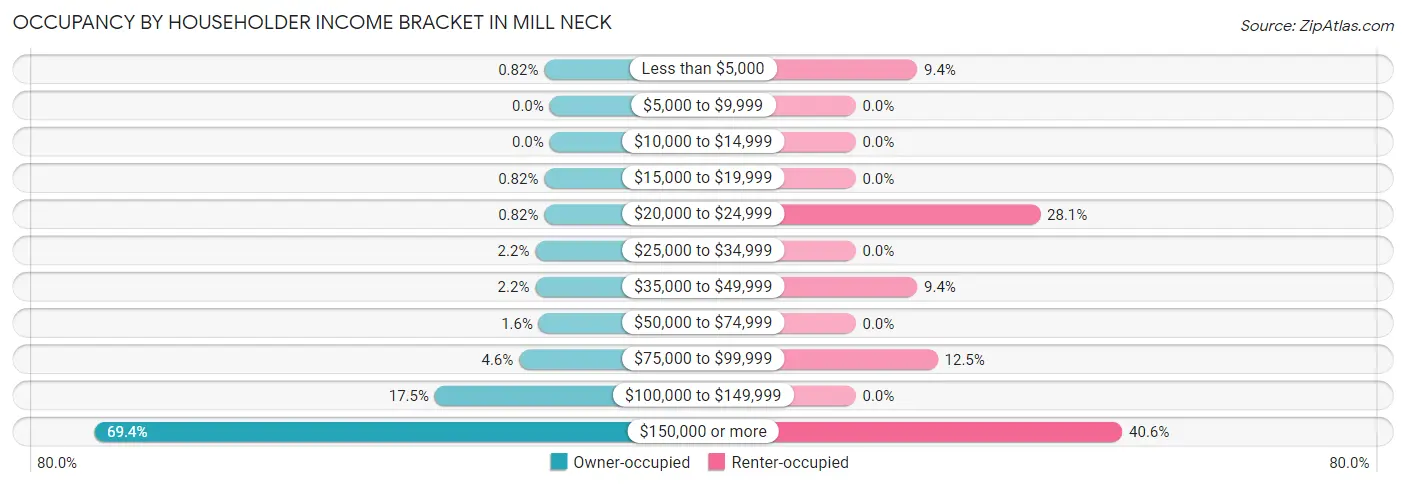
| Income Bracket | Owner-occupied | Renter-occupied |
| Less than $5,000 | 3 (0.8%) | 3 (9.4%) |
| $5,000 to $9,999 | 0 (0.0%) | 0 (0.0%) |
| $10,000 to $14,999 | 0 (0.0%) | 0 (0.0%) |
| $15,000 to $19,999 | 3 (0.8%) | 0 (0.0%) |
| $20,000 to $24,999 | 3 (0.8%) | 9 (28.1%) |
| $25,000 to $34,999 | 8 (2.2%) | 0 (0.0%) |
| $35,000 to $49,999 | 8 (2.2%) | 3 (9.4%) |
| $50,000 to $74,999 | 6 (1.6%) | 0 (0.0%) |
| $75,000 to $99,999 | 17 (4.6%) | 4 (12.5%) |
| $100,000 to $149,999 | 64 (17.5%) | 0 (0.0%) |
| $150,000 or more | 254 (69.4%) | 13 (40.6%) |
| Total | 366 (100.0%) | 32 (100.0%) |
Monthly Housing Cost Tiers in Mill Neck
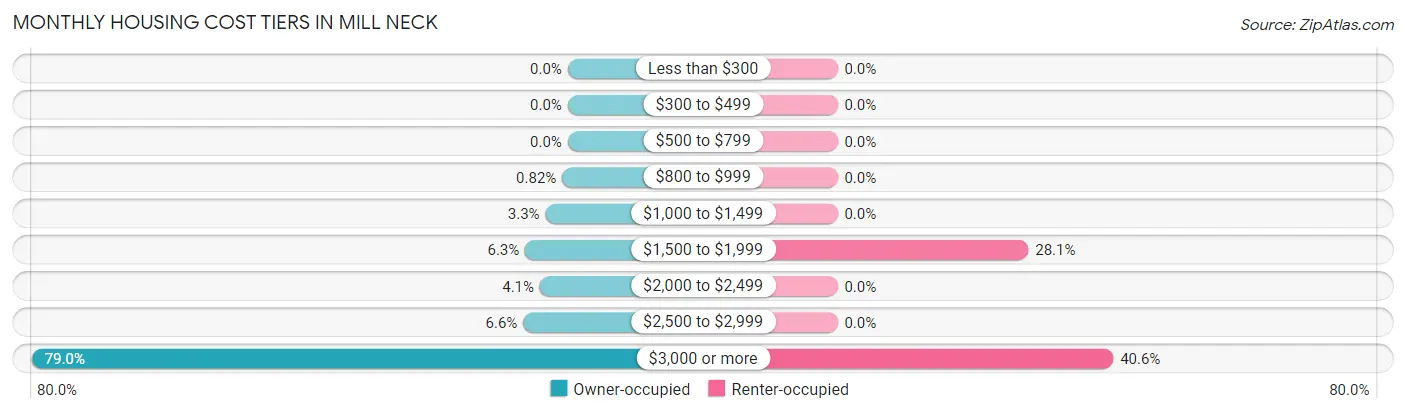
| Monthly Cost | Owner-occupied | Renter-occupied |
| Less than $300 | 0 (0.0%) | 0 (0.0%) |
| $300 to $499 | 0 (0.0%) | 0 (0.0%) |
| $500 to $799 | 0 (0.0%) | 0 (0.0%) |
| $800 to $999 | 3 (0.8%) | 0 (0.0%) |
| $1,000 to $1,499 | 12 (3.3%) | 0 (0.0%) |
| $1,500 to $1,999 | 23 (6.3%) | 9 (28.1%) |
| $2,000 to $2,499 | 15 (4.1%) | 0 (0.0%) |
| $2,500 to $2,999 | 24 (6.6%) | 0 (0.0%) |
| $3,000 or more | 289 (79.0%) | 13 (40.6%) |
| Total | 366 (100.0%) | 32 (100.0%) |
Physical Housing Characteristics in Mill Neck
Housing Structures in Mill Neck
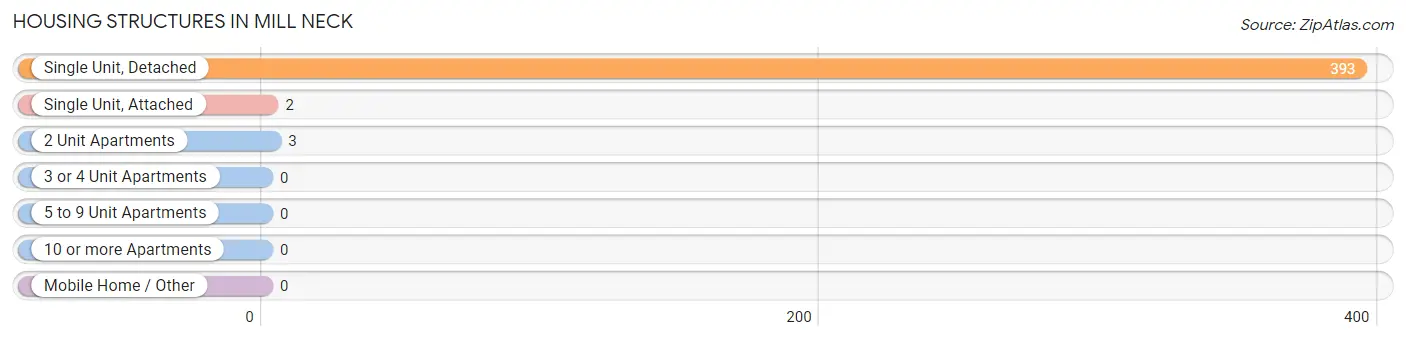
| Structure Type | # Housing Units | % Housing Units |
| Single Unit, Detached | 393 | 98.7% |
| Single Unit, Attached | 2 | 0.5% |
| 2 Unit Apartments | 3 | 0.7% |
| 3 or 4 Unit Apartments | 0 | 0.0% |
| 5 to 9 Unit Apartments | 0 | 0.0% |
| 10 or more Apartments | 0 | 0.0% |
| Mobile Home / Other | 0 | 0.0% |
| Total | 398 | 100.0% |
Housing Structures by Occupancy in Mill Neck
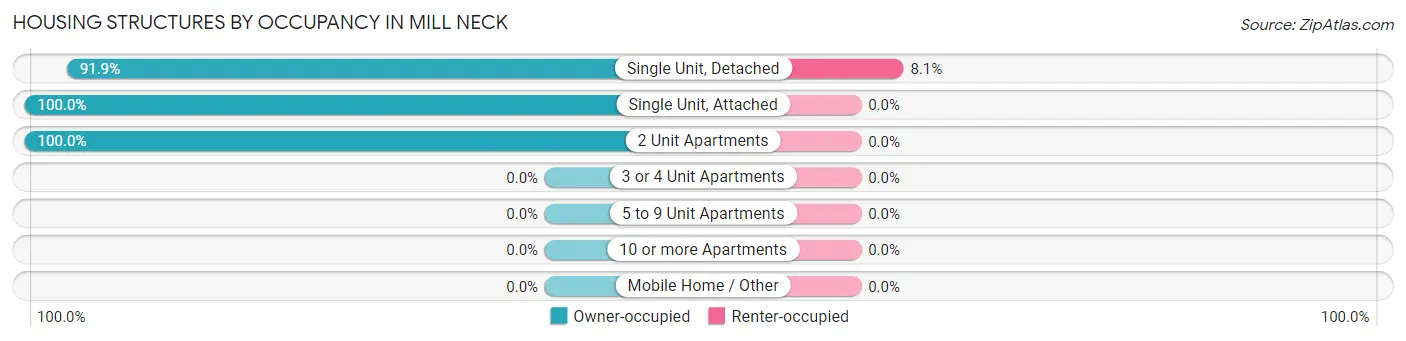
| Structure Type | Owner-occupied | Renter-occupied |
| Single Unit, Detached | 361 (91.9%) | 32 (8.1%) |
| Single Unit, Attached | 2 (100.0%) | 0 (0.0%) |
| 2 Unit Apartments | 3 (100.0%) | 0 (0.0%) |
| 3 or 4 Unit Apartments | 0 (0.0%) | 0 (0.0%) |
| 5 to 9 Unit Apartments | 0 (0.0%) | 0 (0.0%) |
| 10 or more Apartments | 0 (0.0%) | 0 (0.0%) |
| Mobile Home / Other | 0 (0.0%) | 0 (0.0%) |
| Total | 366 (92.0%) | 32 (8.0%) |
Housing Structures by Number of Rooms in Mill Neck
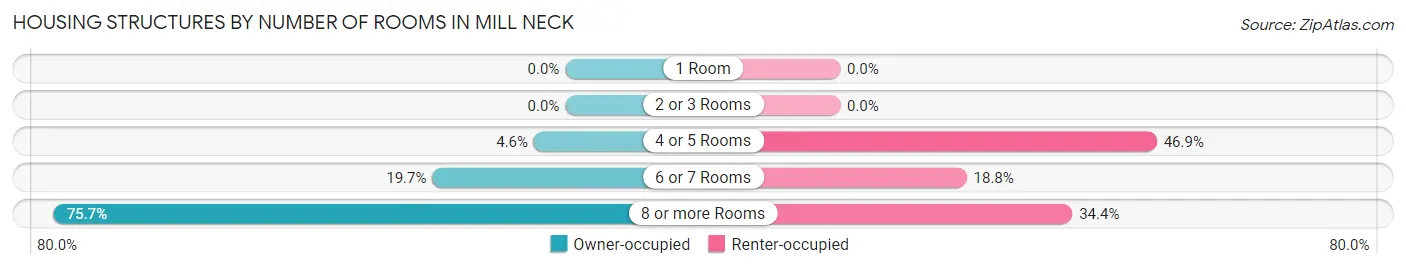
| Number of Rooms | Owner-occupied | Renter-occupied |
| 1 Room | 0 (0.0%) | 0 (0.0%) |
| 2 or 3 Rooms | 0 (0.0%) | 0 (0.0%) |
| 4 or 5 Rooms | 17 (4.6%) | 15 (46.9%) |
| 6 or 7 Rooms | 72 (19.7%) | 6 (18.8%) |
| 8 or more Rooms | 277 (75.7%) | 11 (34.4%) |
| Total | 366 (100.0%) | 32 (100.0%) |
Housing Structure by Heating Type in Mill Neck
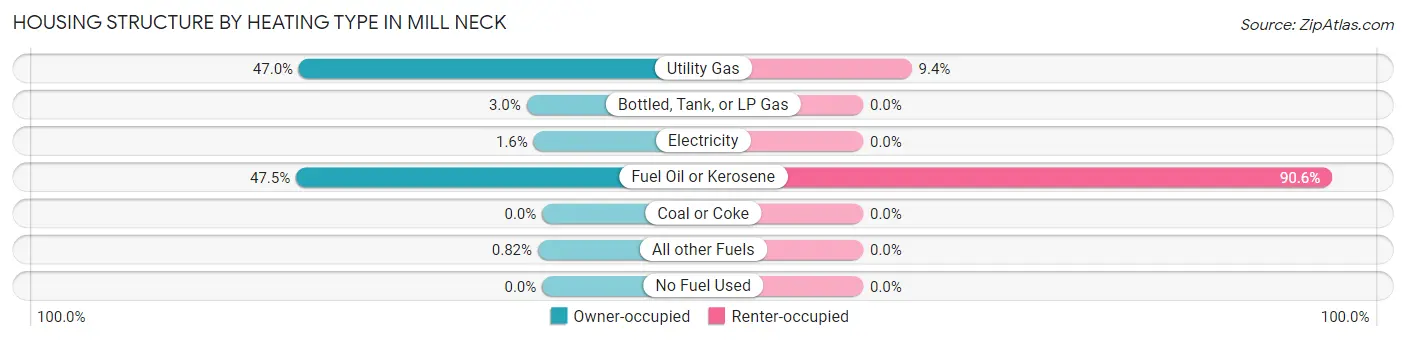
| Heating Type | Owner-occupied | Renter-occupied |
| Utility Gas | 172 (47.0%) | 3 (9.4%) |
| Bottled, Tank, or LP Gas | 11 (3.0%) | 0 (0.0%) |
| Electricity | 6 (1.6%) | 0 (0.0%) |
| Fuel Oil or Kerosene | 174 (47.5%) | 29 (90.6%) |
| Coal or Coke | 0 (0.0%) | 0 (0.0%) |
| All other Fuels | 3 (0.8%) | 0 (0.0%) |
| No Fuel Used | 0 (0.0%) | 0 (0.0%) |
| Total | 366 (100.0%) | 32 (100.0%) |
Household Vehicle Usage in Mill Neck
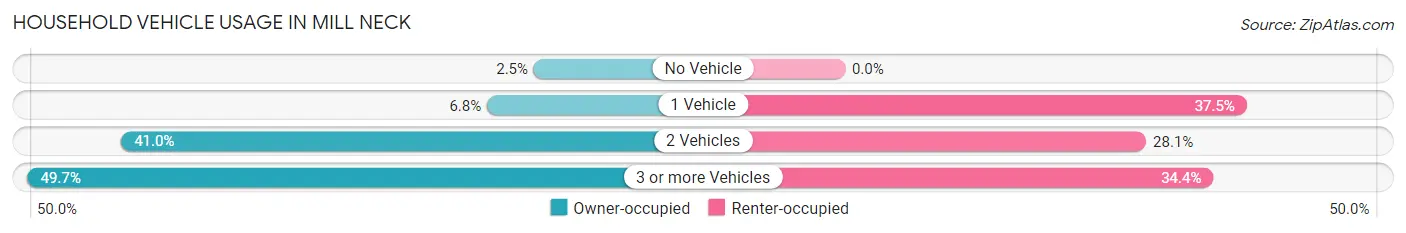
| Vehicles per Household | Owner-occupied | Renter-occupied |
| No Vehicle | 9 (2.5%) | 0 (0.0%) |
| 1 Vehicle | 25 (6.8%) | 12 (37.5%) |
| 2 Vehicles | 150 (41.0%) | 9 (28.1%) |
| 3 or more Vehicles | 182 (49.7%) | 11 (34.4%) |
| Total | 366 (100.0%) | 32 (100.0%) |
Real Estate & Mortgages in Mill Neck
Real Estate and Mortgage Overview in Mill Neck
| Characteristic | Without Mortgage | With Mortgage |
| Housing Units | 125 | 241 |
| Median Property Value | $1,738,600 | $1,389,400 |
| Median Household Income | $250,001 | $174 |
| Monthly Housing Costs | $1,501 | $226 |
| Real Estate Taxes | $10,001 | $0 |
Property Value by Mortgage Status in Mill Neck
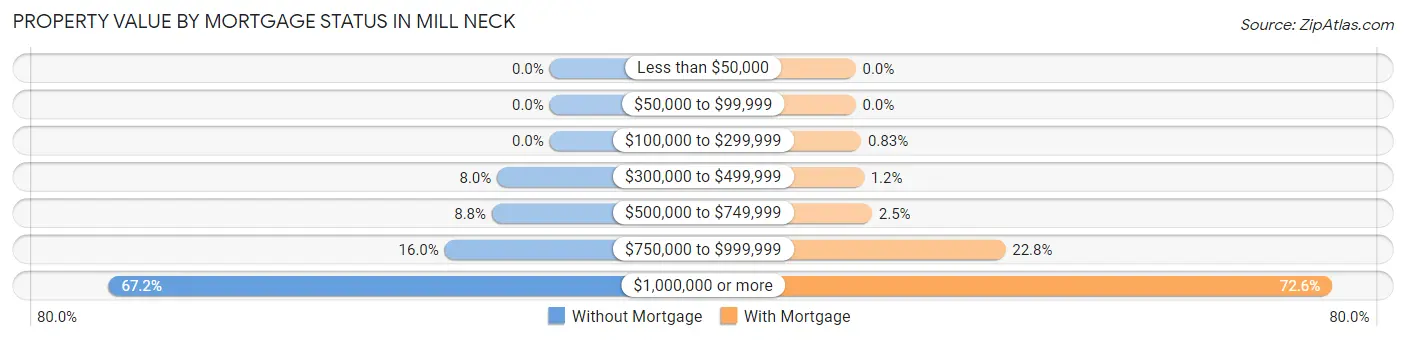
| Property Value | Without Mortgage | With Mortgage |
| Less than $50,000 | 0 (0.0%) | 0 (0.0%) |
| $50,000 to $99,999 | 0 (0.0%) | 0 (0.0%) |
| $100,000 to $299,999 | 0 (0.0%) | 2 (0.8%) |
| $300,000 to $499,999 | 10 (8.0%) | 3 (1.2%) |
| $500,000 to $749,999 | 11 (8.8%) | 6 (2.5%) |
| $750,000 to $999,999 | 20 (16.0%) | 55 (22.8%) |
| $1,000,000 or more | 84 (67.2%) | 175 (72.6%) |
| Total | 125 (100.0%) | 241 (100.0%) |
Household Income by Mortgage Status in Mill Neck
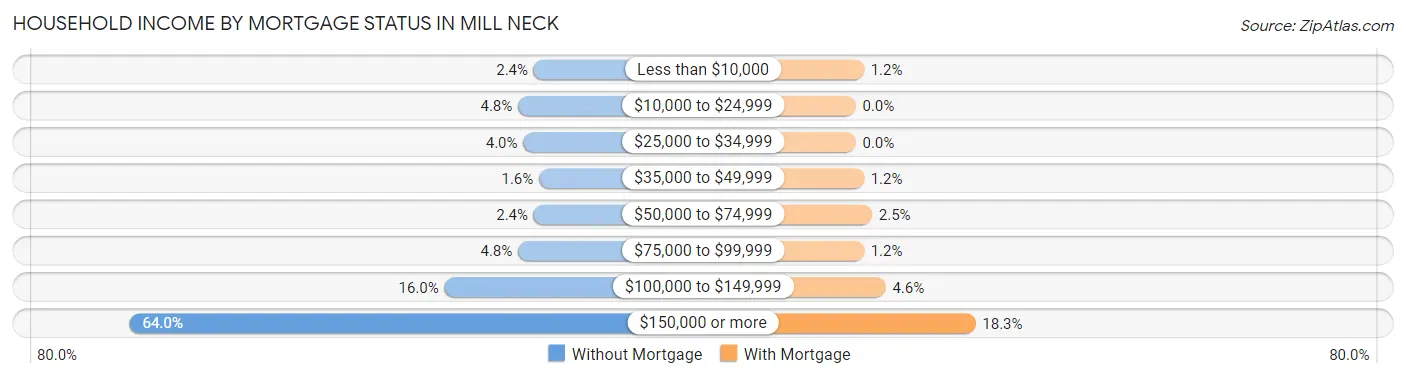
| Household Income | Without Mortgage | With Mortgage |
| Less than $10,000 | 3 (2.4%) | 3 (1.2%) |
| $10,000 to $24,999 | 6 (4.8%) | 0 (0.0%) |
| $25,000 to $34,999 | 5 (4.0%) | 0 (0.0%) |
| $35,000 to $49,999 | 2 (1.6%) | 3 (1.2%) |
| $50,000 to $74,999 | 3 (2.4%) | 6 (2.5%) |
| $75,000 to $99,999 | 6 (4.8%) | 3 (1.2%) |
| $100,000 to $149,999 | 20 (16.0%) | 11 (4.6%) |
| $150,000 or more | 80 (64.0%) | 44 (18.3%) |
| Total | 125 (100.0%) | 241 (100.0%) |
Property Value to Household Income Ratio in Mill Neck
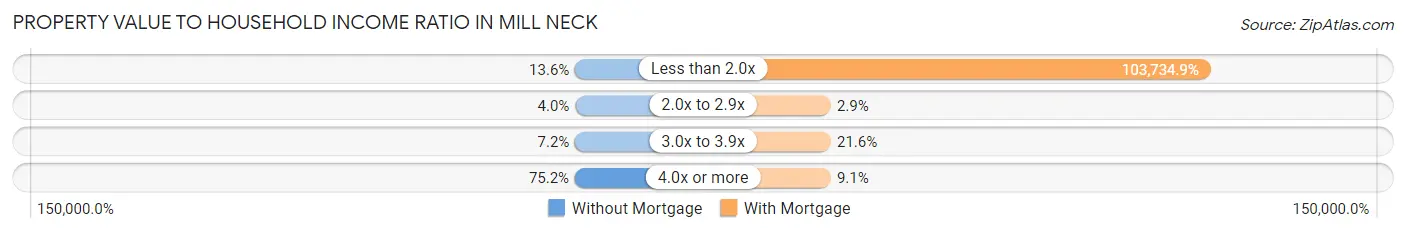
| Value-to-Income Ratio | Without Mortgage | With Mortgage |
| Less than 2.0x | 17 (13.6%) | 250,001 (103,734.9%) |
| 2.0x to 2.9x | 5 (4.0%) | 7 (2.9%) |
| 3.0x to 3.9x | 9 (7.2%) | 52 (21.6%) |
| 4.0x or more | 94 (75.2%) | 22 (9.1%) |
| Total | 125 (100.0%) | 241 (100.0%) |
Real Estate Taxes by Mortgage Status in Mill Neck

| Property Taxes | Without Mortgage | With Mortgage |
| Less than $800 | 0 (0.0%) | 0 (0.0%) |
| $800 to $1,499 | 0 (0.0%) | 0 (0.0%) |
| $800 to $1,499 | 125 (100.0%) | 0 (0.0%) |
| Total | 125 (100.0%) | 241 (100.0%) |
Health & Disability in Mill Neck
Health Insurance Coverage by Age in Mill Neck
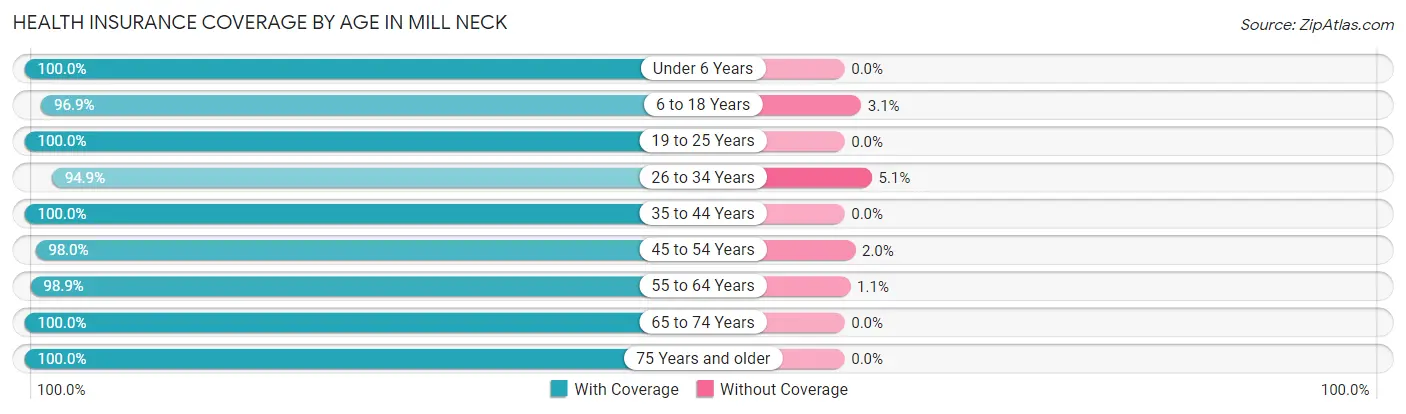
| Age Bracket | With Coverage | Without Coverage |
| Under 6 Years | 74 (100.0%) | 0 (0.0%) |
| 6 to 18 Years | 188 (96.9%) | 6 (3.1%) |
| 19 to 25 Years | 52 (100.0%) | 0 (0.0%) |
| 26 to 34 Years | 56 (94.9%) | 3 (5.1%) |
| 35 to 44 Years | 91 (100.0%) | 0 (0.0%) |
| 45 to 54 Years | 147 (98.0%) | 3 (2.0%) |
| 55 to 64 Years | 181 (98.9%) | 2 (1.1%) |
| 65 to 74 Years | 242 (100.0%) | 0 (0.0%) |
| 75 Years and older | 63 (100.0%) | 0 (0.0%) |
| Total | 1,094 (98.7%) | 14 (1.3%) |
Health Insurance Coverage by Citizenship Status in Mill Neck
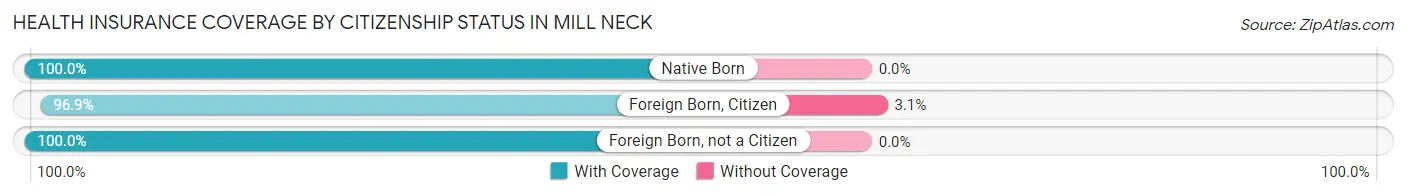
| Citizenship Status | With Coverage | Without Coverage |
| Native Born | 74 (100.0%) | 0 (0.0%) |
| Foreign Born, Citizen | 188 (96.9%) | 6 (3.1%) |
| Foreign Born, not a Citizen | 52 (100.0%) | 0 (0.0%) |
Health Insurance Coverage by Household Income in Mill Neck
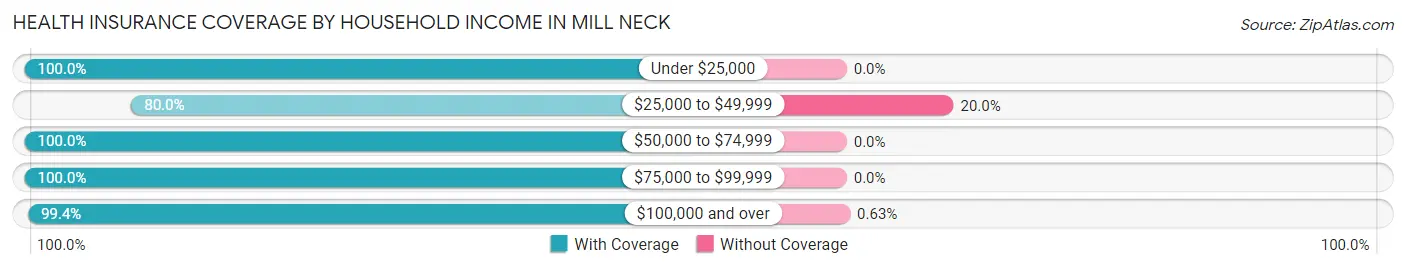
| Household Income | With Coverage | Without Coverage |
| Under $25,000 | 39 (100.0%) | 0 (0.0%) |
| $25,000 to $49,999 | 32 (80.0%) | 8 (20.0%) |
| $50,000 to $74,999 | 12 (100.0%) | 0 (0.0%) |
| $75,000 to $99,999 | 60 (100.0%) | 0 (0.0%) |
| $100,000 and over | 951 (99.4%) | 6 (0.6%) |
Public vs Private Health Insurance Coverage by Age in Mill Neck
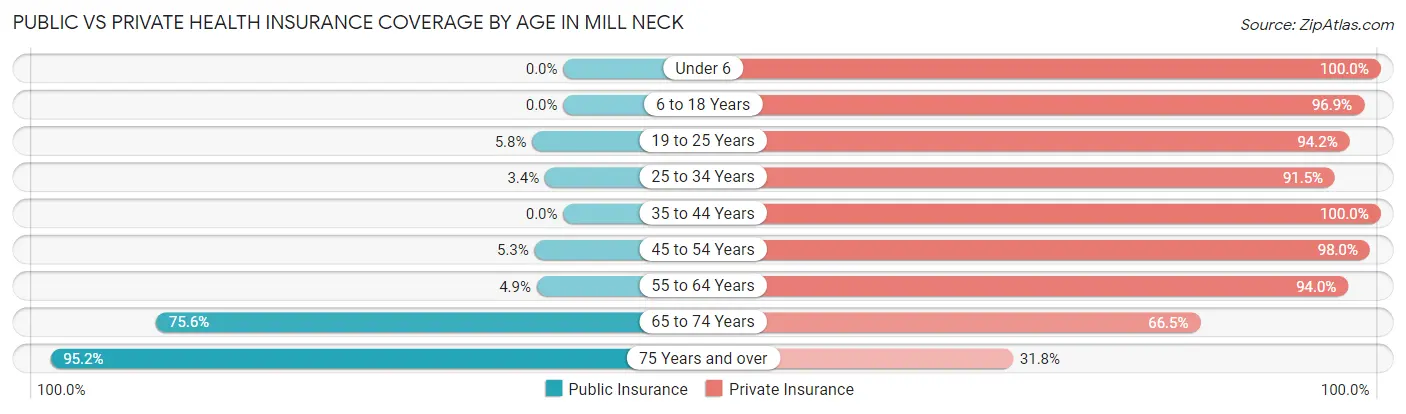
| Age Bracket | Public Insurance | Private Insurance |
| Under 6 | 0 (0.0%) | 74 (100.0%) |
| 6 to 18 Years | 0 (0.0%) | 188 (96.9%) |
| 19 to 25 Years | 3 (5.8%) | 49 (94.2%) |
| 25 to 34 Years | 2 (3.4%) | 54 (91.5%) |
| 35 to 44 Years | 0 (0.0%) | 91 (100.0%) |
| 45 to 54 Years | 8 (5.3%) | 147 (98.0%) |
| 55 to 64 Years | 9 (4.9%) | 172 (94.0%) |
| 65 to 74 Years | 183 (75.6%) | 161 (66.5%) |
| 75 Years and over | 60 (95.2%) | 20 (31.8%) |
| Total | 265 (23.9%) | 956 (86.3%) |
Disability Status by Sex by Age in Mill Neck
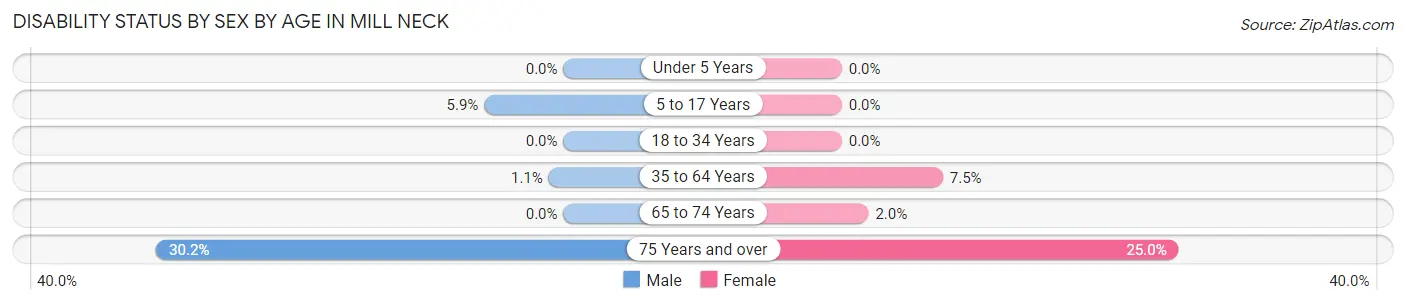
| Age Bracket | Male | Female |
| Under 5 Years | 0 (0.0%) | 0 (0.0%) |
| 5 to 17 Years | 6 (5.9%) | 0 (0.0%) |
| 18 to 34 Years | 0 (0.0%) | 0 (0.0%) |
| 35 to 64 Years | 2 (1.1%) | 18 (7.5%) |
| 65 to 74 Years | 0 (0.0%) | 2 (2.0%) |
| 75 Years and over | 13 (30.2%) | 5 (25.0%) |
Disability Class by Sex by Age in Mill Neck
Disability Class: Hearing Difficulty
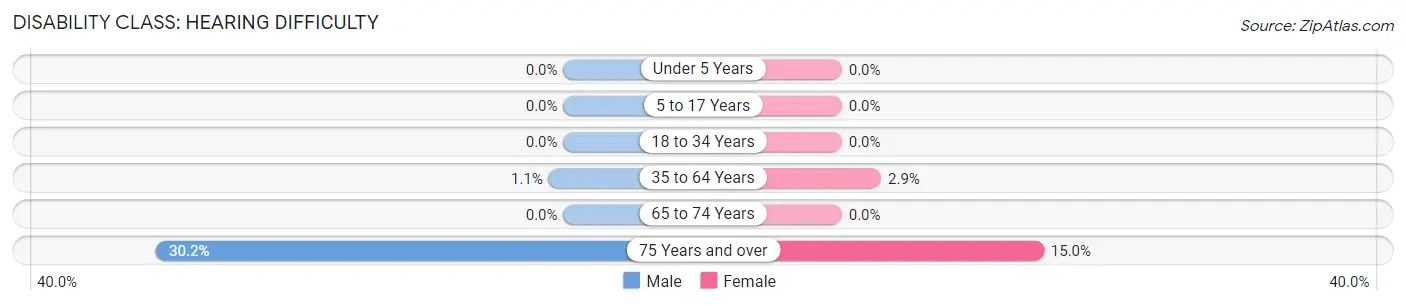
| Age Bracket | Male | Female |
| Under 5 Years | 0 (0.0%) | 0 (0.0%) |
| 5 to 17 Years | 0 (0.0%) | 0 (0.0%) |
| 18 to 34 Years | 0 (0.0%) | 0 (0.0%) |
| 35 to 64 Years | 2 (1.1%) | 7 (2.9%) |
| 65 to 74 Years | 0 (0.0%) | 0 (0.0%) |
| 75 Years and over | 13 (30.2%) | 3 (15.0%) |
Disability Class: Vision Difficulty
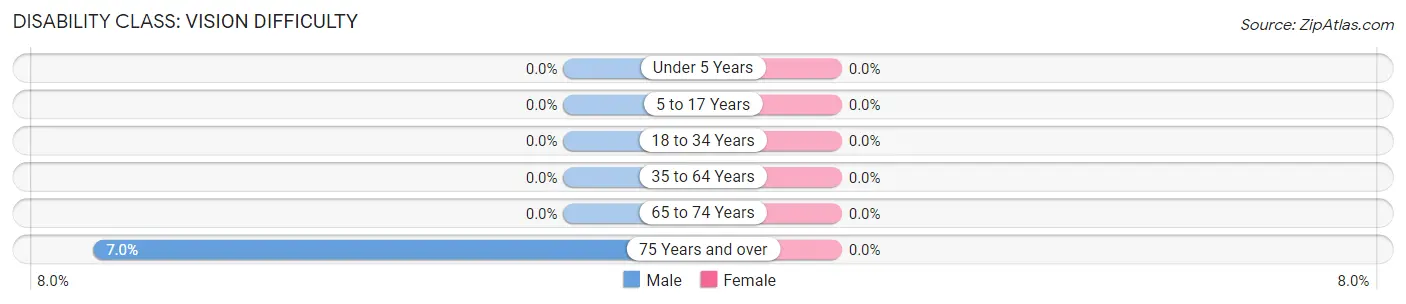
| Age Bracket | Male | Female |
| Under 5 Years | 0 (0.0%) | 0 (0.0%) |
| 5 to 17 Years | 0 (0.0%) | 0 (0.0%) |
| 18 to 34 Years | 0 (0.0%) | 0 (0.0%) |
| 35 to 64 Years | 0 (0.0%) | 0 (0.0%) |
| 65 to 74 Years | 0 (0.0%) | 0 (0.0%) |
| 75 Years and over | 3 (7.0%) | 0 (0.0%) |
Disability Class: Cognitive Difficulty
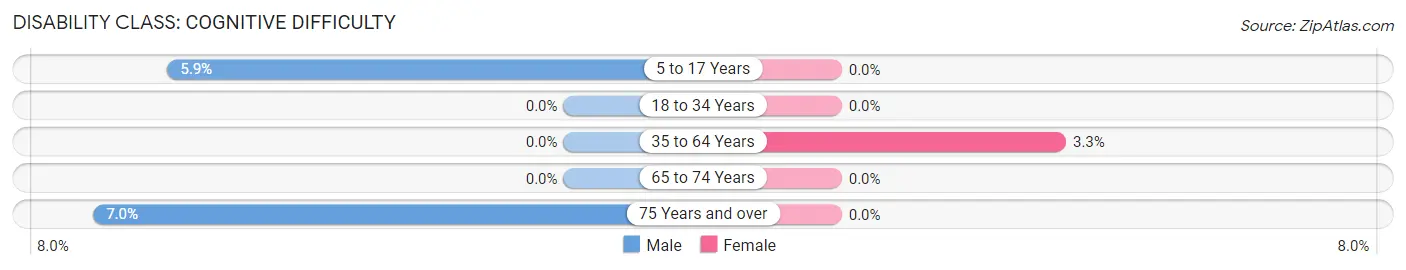
| Age Bracket | Male | Female |
| 5 to 17 Years | 6 (5.9%) | 0 (0.0%) |
| 18 to 34 Years | 0 (0.0%) | 0 (0.0%) |
| 35 to 64 Years | 0 (0.0%) | 8 (3.3%) |
| 65 to 74 Years | 0 (0.0%) | 0 (0.0%) |
| 75 Years and over | 3 (7.0%) | 0 (0.0%) |
Disability Class: Ambulatory Difficulty
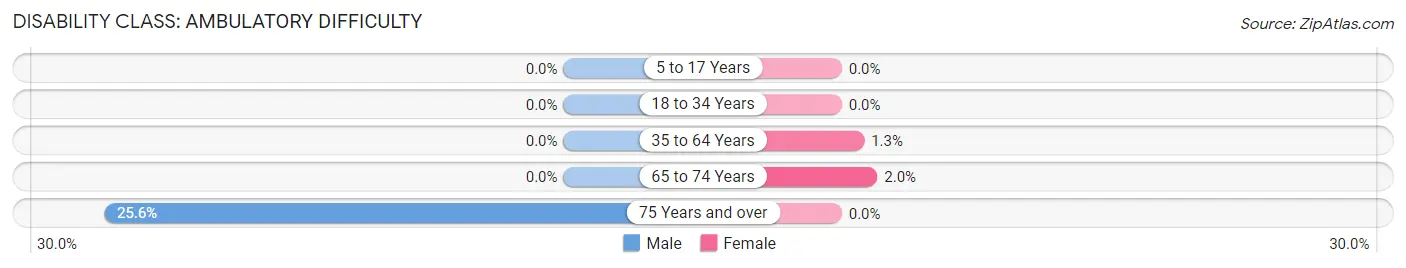
| Age Bracket | Male | Female |
| 5 to 17 Years | 0 (0.0%) | 0 (0.0%) |
| 18 to 34 Years | 0 (0.0%) | 0 (0.0%) |
| 35 to 64 Years | 0 (0.0%) | 3 (1.3%) |
| 65 to 74 Years | 0 (0.0%) | 2 (2.0%) |
| 75 Years and over | 11 (25.6%) | 0 (0.0%) |
Disability Class: Self-Care Difficulty
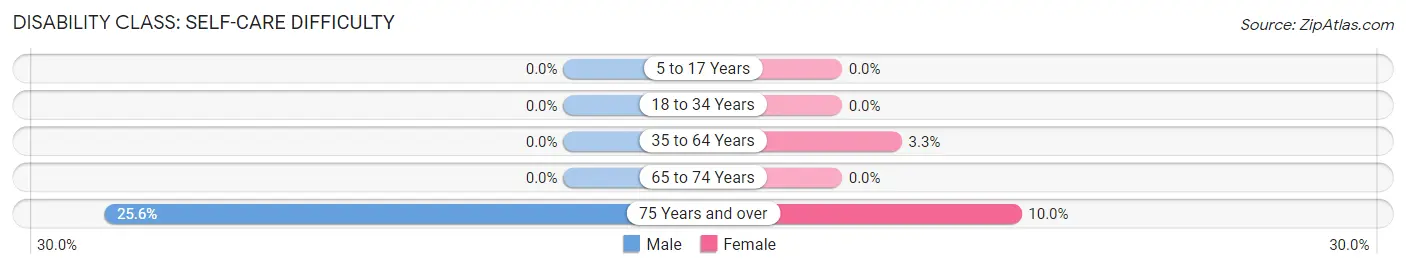
| Age Bracket | Male | Female |
| 5 to 17 Years | 0 (0.0%) | 0 (0.0%) |
| 18 to 34 Years | 0 (0.0%) | 0 (0.0%) |
| 35 to 64 Years | 0 (0.0%) | 8 (3.3%) |
| 65 to 74 Years | 0 (0.0%) | 0 (0.0%) |
| 75 Years and over | 11 (25.6%) | 2 (10.0%) |
Technology Access in Mill Neck
Computing Device Access in Mill Neck
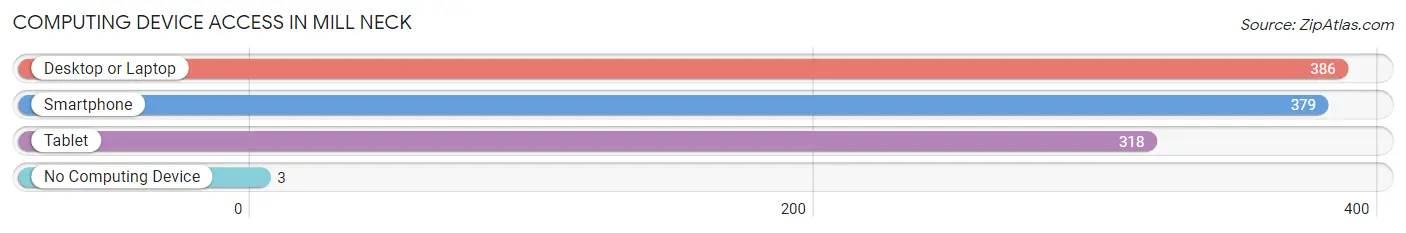
| Device Type | # Households | % Households |
| Desktop or Laptop | 386 | 97.0% |
| Smartphone | 379 | 95.2% |
| Tablet | 318 | 79.9% |
| No Computing Device | 3 | 0.7% |
| Total | 398 | 100.0% |
Internet Access in Mill Neck
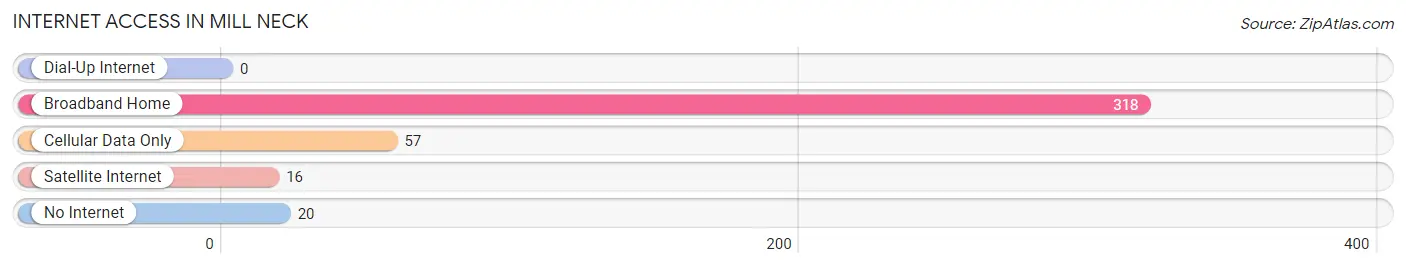
| Internet Type | # Households | % Households |
| Dial-Up Internet | 0 | 0.0% |
| Broadband Home | 318 | 79.9% |
| Cellular Data Only | 57 | 14.3% |
| Satellite Internet | 16 | 4.0% |
| No Internet | 20 | 5.0% |
| Total | 398 | 100.0% |
Mill Neck Summary
Nestled on the North Shore of Long Island, Mill Neck is a small hamlet located in the Town of Oyster Bay in Nassau County, New York. It is a picturesque community with a population of just over 1,000 people, and is home to a variety of historic sites, natural attractions, and recreational activities.
History
Mill Neck was first settled in the late 1600s by the Matinecock Native American tribe. The name “Mill Neck” is derived from the Matinecock word “Munnekonck”, which translates to “place of many hills”. The area was originally used for farming and fishing, and the Matinecock tribe maintained a strong presence in the area until the late 1700s.
In the early 1800s, the area was purchased by the Townsend family, who built a large estate on the property. The estate was later purchased by the Sands family, who built a large mansion on the property. The Sands family owned the property until the early 1900s, when it was sold to the Mill Neck Manor Foundation. The Foundation used the property to establish a school for the deaf, which is still in operation today.
Geography
Mill Neck is located on the North Shore of Long Island, approximately 25 miles east of New York City. It is bordered by the Town of Oyster Bay to the west, the Town of Huntington to the east, and the Long Island Sound to the south. The hamlet is situated on a peninsula, with the Long Island Sound to the south and Oyster Bay to the north. The area is characterized by rolling hills, wooded areas, and a variety of wetlands.
Economy
Mill Neck’s economy is largely based on tourism and agriculture. The hamlet is home to a variety of historic sites, including the Mill Neck Manor Estate, which is a popular tourist destination. The area is also home to a number of farms, which produce a variety of fruits and vegetables. Additionally, the hamlet is home to a number of small businesses, including restaurants, shops, and galleries.
Demographics
As of the 2010 census, the population of Mill Neck was 1,072. The racial makeup of the hamlet was 94.3% White, 1.2% African American, 0.3% Native American, 1.2% Asian, 0.1% Pacific Islander, 1.2% from other races, and 1.9% from two or more races. The median household income was $107,917, and the median family income was $125,000.
Conclusion
Mill Neck is a small hamlet located on the North Shore of Long Island. It is a picturesque community with a variety of historic sites, natural attractions, and recreational activities. The economy of Mill Neck is largely based on tourism and agriculture, and the hamlet is home to a diverse population of just over 1,000 people. Mill Neck is a unique and vibrant community, and is a great place to live, work, and play.
Common Questions
What is Per Capita Income in Mill Neck?
Per Capita income in Mill Neck is $145,188.
What is the Median Family Income in Mill Neck?
Median Family Income in Mill Neck is $250,001.
What is the Median Household income in Mill Neck?
Median Household Income in Mill Neck is $250,001.
What is Income or Wage Gap in Mill Neck?
Income or Wage Gap in Mill Neck is 55.3%.
Women in Mill Neck earn 44.7 cents for every dollar earned by a man.
What is Inequality or Gini Index in Mill Neck?
Inequality or Gini Index in Mill Neck is 0.51.
What is the Total Population of Mill Neck?
Total Population of Mill Neck is 1,108.
What is the Total Male Population of Mill Neck?
Total Male Population of Mill Neck is 577.
What is the Total Female Population of Mill Neck?
Total Female Population of Mill Neck is 531.
What is the Ratio of Males per 100 Females in Mill Neck?
There are 108.66 Males per 100 Females in Mill Neck.
What is the Ratio of Females per 100 Males in Mill Neck?
There are 92.03 Females per 100 Males in Mill Neck.
What is the Median Population Age in Mill Neck?
Median Population Age in Mill Neck is 51.5 Years.
What is the Average Family Size in Mill Neck
Average Family Size in Mill Neck is 3.1 People.
What is the Average Household Size in Mill Neck
Average Household Size in Mill Neck is 2.8 People.
How Large is the Labor Force in Mill Neck?
There are 522 People in the Labor Forcein in Mill Neck.
What is the Percentage of People in the Labor Force in Mill Neck?
59.9% of People are in the Labor Force in Mill Neck.
What is the Unemployment Rate in Mill Neck?
Unemployment Rate in Mill Neck is 4.6%.