Molalla, OR Map & Demographics
Molalla Map
Molalla Overview
$33,627
PER CAPITA INCOME
$99,167
AVG FAMILY INCOME
$77,442
AVG HOUSEHOLD INCOME
17.4%
WAGE / INCOME GAP [ % ]
82.6¢/ $1
WAGE / INCOME GAP [ $ ]
0.38
INEQUALITY / GINI INDEX
10,147
TOTAL POPULATION
5,015
MALE POPULATION
5,132
FEMALE POPULATION
97.72
MALES / 100 FEMALES
102.33
FEMALES / 100 MALES
33.6
MEDIAN AGE
3.2
AVG FAMILY SIZE
2.7
AVG HOUSEHOLD SIZE
5,753
LABOR FORCE [ PEOPLE ]
73.6%
PERCENT IN LABOR FORCE
7.0%
UNEMPLOYMENT RATE
Molalla Zip Codes
Molalla Area Codes
Income in Molalla
Income Overview in Molalla
Per Capita Income in Molalla is $33,627, while median incomes of families and households are $99,167 and $77,442 respectively.
| Characteristic | Number | Measure |
| Per Capita Income | 10,147 | $33,627 |
| Median Family Income | 2,426 | $99,167 |
| Mean Family Income | 2,426 | $104,516 |
| Median Household Income | 3,781 | $77,442 |
| Mean Household Income | 3,781 | $90,110 |
| Income Deficit | 2,426 | $0 |
| Wage / Income Gap (%) | 10,147 | 17.37% |
| Wage / Income Gap ($) | 10,147 | 82.63¢ per $1 |
| Gini / Inequality Index | 10,147 | 0.38 |
Earnings by Sex in Molalla
Average Earnings in Molalla are $44,003, $48,004 for men and $39,665 for women, a difference of 17.4%.
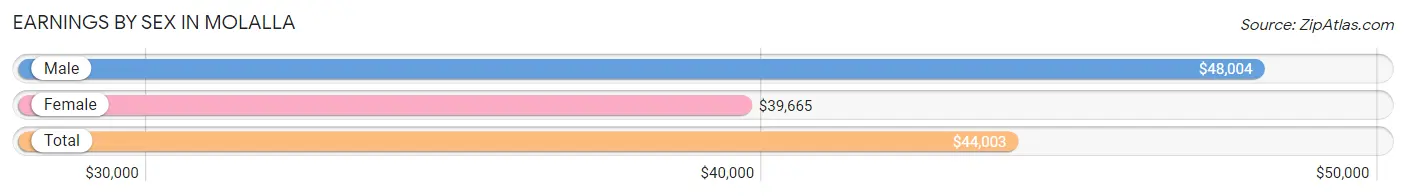
| Sex | Number | Average Earnings |
| Male | 2,846 (48.2%) | $48,004 |
| Female | 3,063 (51.8%) | $39,665 |
| Total | 5,909 (100.0%) | $44,003 |
Earnings by Sex by Income Bracket in Molalla
The most common earnings brackets in Molalla are $100,000+ for men (438 | 15.4%) and $45,000 to $49,999 for women (558 | 18.2%).
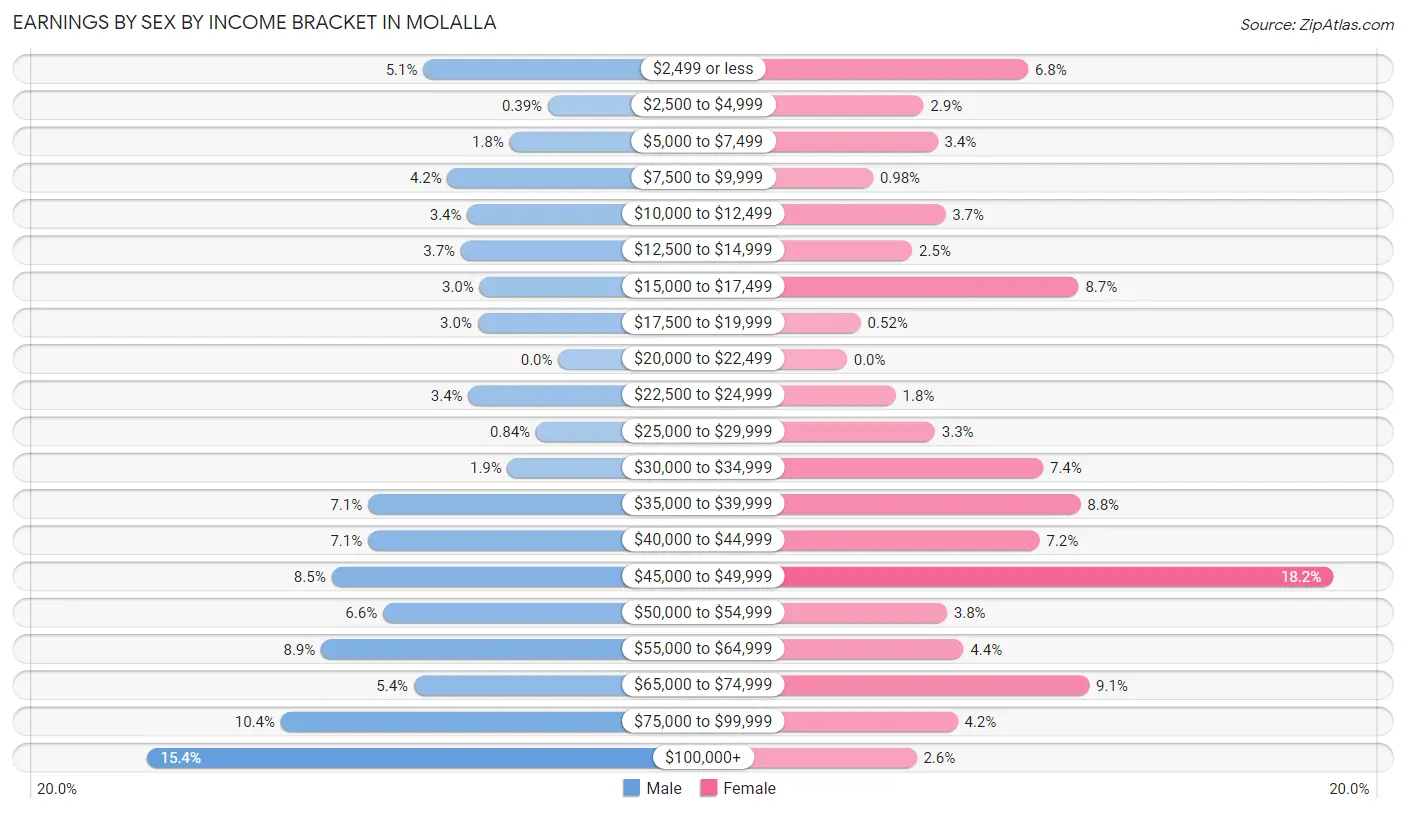
| Income | Male | Female |
| $2,499 or less | 144 (5.1%) | 208 (6.8%) |
| $2,500 to $4,999 | 11 (0.4%) | 88 (2.9%) |
| $5,000 to $7,499 | 52 (1.8%) | 104 (3.4%) |
| $7,500 to $9,999 | 118 (4.2%) | 30 (1.0%) |
| $10,000 to $12,499 | 97 (3.4%) | 113 (3.7%) |
| $12,500 to $14,999 | 104 (3.6%) | 75 (2.5%) |
| $15,000 to $17,499 | 84 (2.9%) | 266 (8.7%) |
| $17,500 to $19,999 | 86 (3.0%) | 16 (0.5%) |
| $20,000 to $22,499 | 0 (0.0%) | 0 (0.0%) |
| $22,500 to $24,999 | 96 (3.4%) | 56 (1.8%) |
| $25,000 to $29,999 | 24 (0.8%) | 101 (3.3%) |
| $30,000 to $34,999 | 54 (1.9%) | 225 (7.3%) |
| $35,000 to $39,999 | 203 (7.1%) | 268 (8.7%) |
| $40,000 to $44,999 | 203 (7.1%) | 221 (7.2%) |
| $45,000 to $49,999 | 242 (8.5%) | 558 (18.2%) |
| $50,000 to $54,999 | 187 (6.6%) | 115 (3.7%) |
| $55,000 to $64,999 | 253 (8.9%) | 134 (4.4%) |
| $65,000 to $74,999 | 154 (5.4%) | 278 (9.1%) |
| $75,000 to $99,999 | 296 (10.4%) | 127 (4.2%) |
| $100,000+ | 438 (15.4%) | 80 (2.6%) |
| Total | 2,846 (100.0%) | 3,063 (100.0%) |
Earnings by Sex by Educational Attainment in Molalla
Average earnings in Molalla are $51,841 for men and $44,304 for women, a difference of 14.5%. Men with an educational attainment of bachelor's degree enjoy the highest average annual earnings of $91,632, while those with less than high school education earn the least with $47,984. Women with an educational attainment of college or associate's degree earn the most with the average annual earnings of $46,985, while those with graduate degree education have the smallest earnings of $37,083.
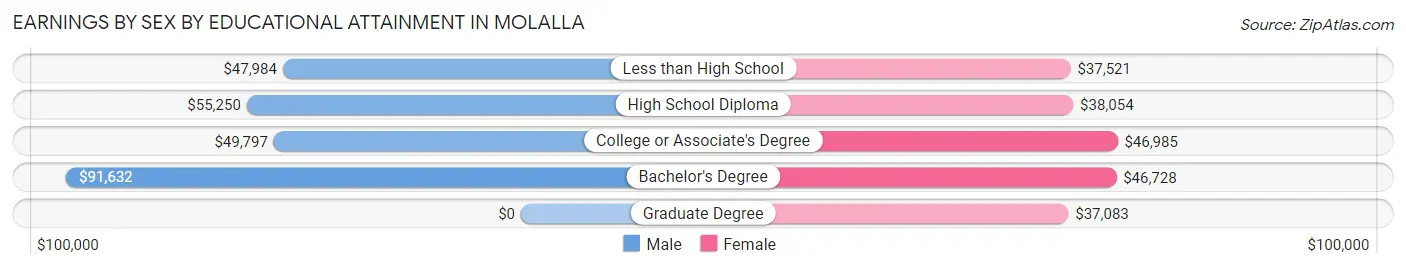
| Educational Attainment | Male Income | Female Income |
| Less than High School | $47,984 | $37,521 |
| High School Diploma | $55,250 | $38,054 |
| College or Associate's Degree | $49,797 | $46,985 |
| Bachelor's Degree | $91,632 | $46,728 |
| Graduate Degree | - | - |
| Total | $51,841 | $44,304 |
Family Income in Molalla
Family Income Brackets in Molalla
According to the Molalla family income data, there are 910 families falling into the $100,000 to $149,999 income range, which is the most common income bracket and makes up 37.5% of all families.
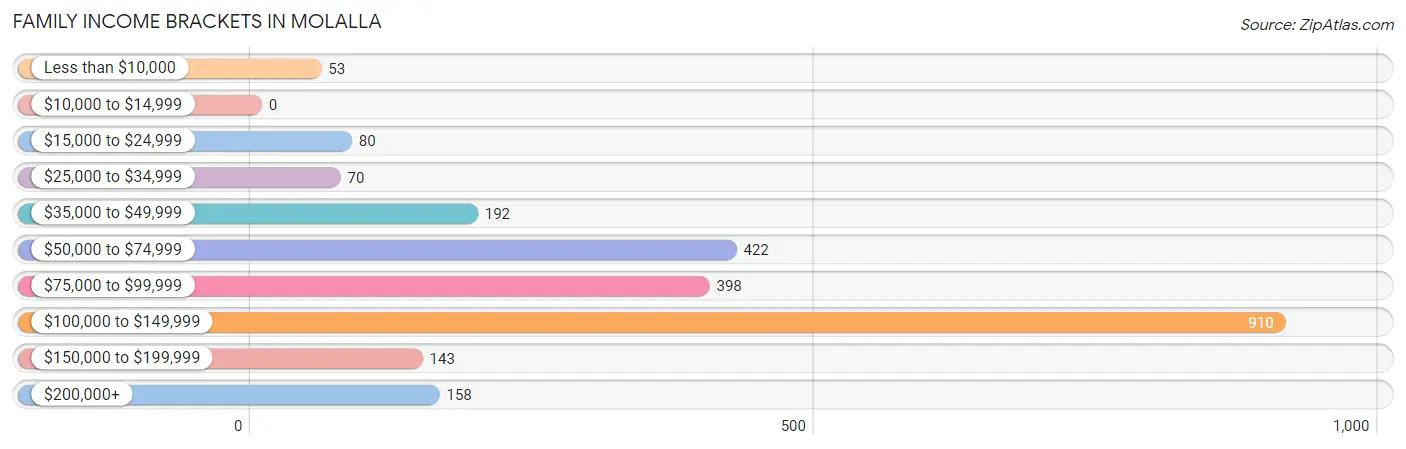
| Income Bracket | # Families | % Families |
| Less than $10,000 | 53 | 2.2% |
| $10,000 to $14,999 | 0 | 0.0% |
| $15,000 to $24,999 | 80 | 3.3% |
| $25,000 to $34,999 | 70 | 2.9% |
| $35,000 to $49,999 | 192 | 7.9% |
| $50,000 to $74,999 | 422 | 17.4% |
| $75,000 to $99,999 | 398 | 16.4% |
| $100,000 to $149,999 | 910 | 37.5% |
| $150,000 to $199,999 | 143 | 5.9% |
| $200,000+ | 158 | 6.5% |
Family Income by Famaliy Size in Molalla
5-person families (190 | 7.8%) account for the highest median family income in Molalla with $131,154 per family, while 3-person families (371 | 15.3%) have the highest median income of $38,388 per family member.
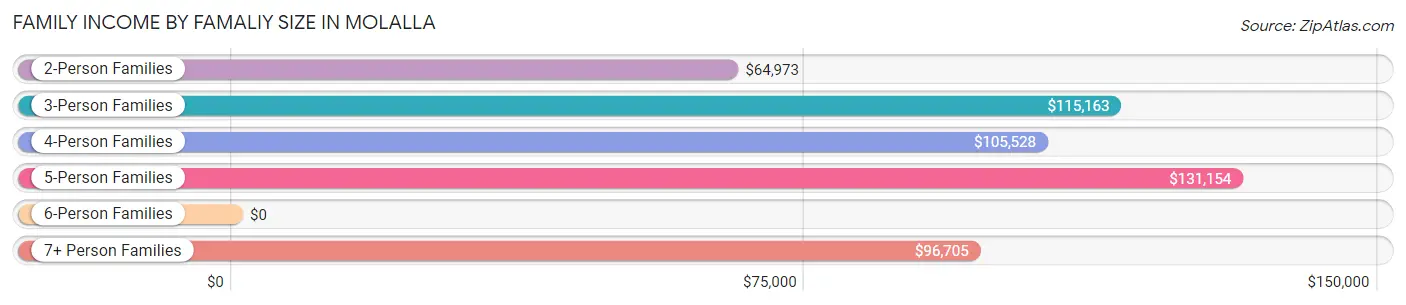
| Income Bracket | # Families | Median Income |
| 2-Person Families | 933 (38.5%) | $64,973 |
| 3-Person Families | 371 (15.3%) | $115,163 |
| 4-Person Families | 868 (35.8%) | $105,528 |
| 5-Person Families | 190 (7.8%) | $131,154 |
| 6-Person Families | 35 (1.4%) | $0 |
| 7+ Person Families | 29 (1.2%) | $96,705 |
| Total | 2,426 (100.0%) | $99,167 |
Family Income by Number of Earners in Molalla
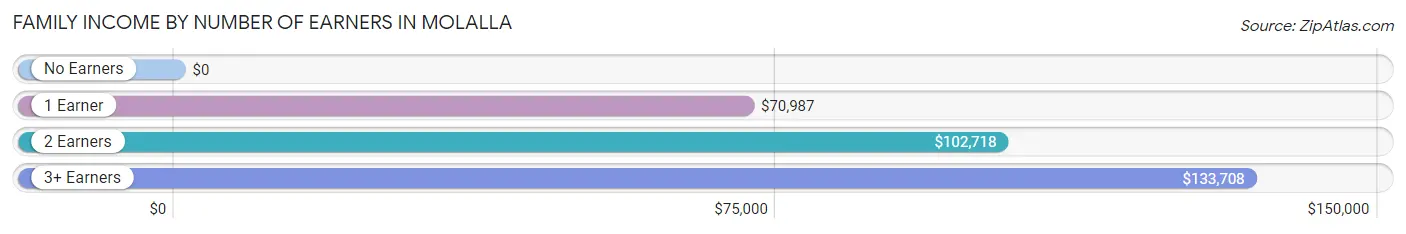
| Number of Earners | # Families | Median Income |
| No Earners | 153 (6.3%) | $0 |
| 1 Earner | 640 (26.4%) | $70,987 |
| 2 Earners | 1,382 (57.0%) | $102,718 |
| 3+ Earners | 251 (10.3%) | $133,708 |
| Total | 2,426 (100.0%) | $99,167 |
Household Income in Molalla
Household Income Brackets in Molalla
With 979 households falling in the category, the $100,000 to $149,999 income range is the most frequent in Molalla, accounting for 25.9% of all households. In contrast, only 72 households (1.9%) fall into the $10,000 to $14,999 income bracket, making it the least populous group.
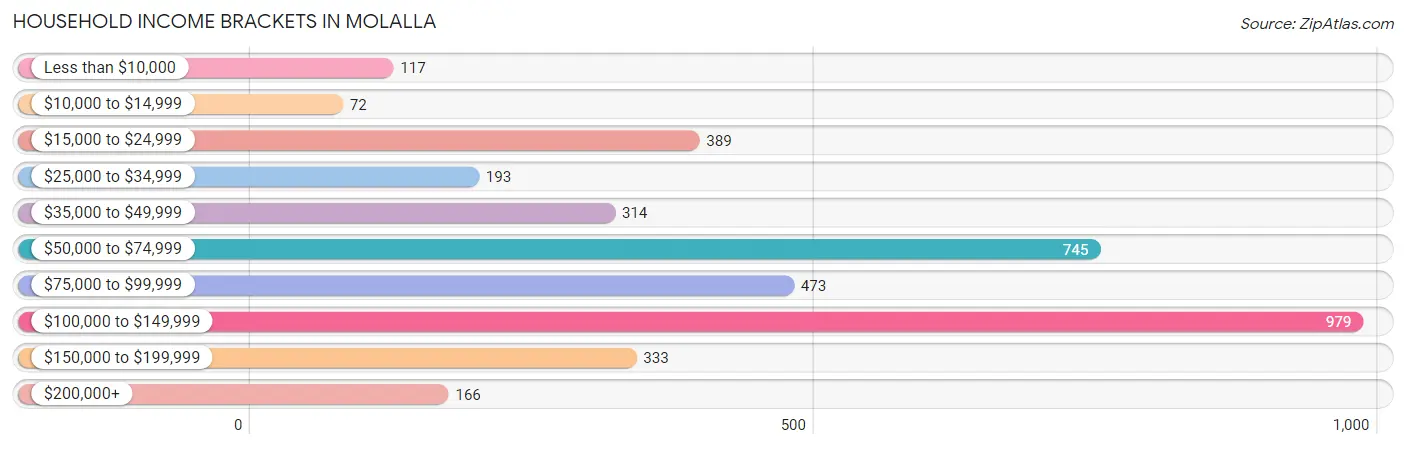
| Income Bracket | # Households | % Households |
| Less than $10,000 | 117 | 3.1% |
| $10,000 to $14,999 | 72 | 1.9% |
| $15,000 to $24,999 | 389 | 10.3% |
| $25,000 to $34,999 | 193 | 5.1% |
| $35,000 to $49,999 | 314 | 8.3% |
| $50,000 to $74,999 | 745 | 19.7% |
| $75,000 to $99,999 | 473 | 12.5% |
| $100,000 to $149,999 | 979 | 25.9% |
| $150,000 to $199,999 | 333 | 8.8% |
| $200,000+ | 166 | 4.4% |
Household Income by Householder Age in Molalla
The median household income in Molalla is $77,442, with the highest median household income of $102,880 found in the 25 to 44 years age bracket for the primary householder. A total of 1,768 households (46.8%) fall into this category. Meanwhile, the 15 to 24 years age bracket for the primary householder has the lowest median household income of $36,250, with 173 households (4.6%) in this group.
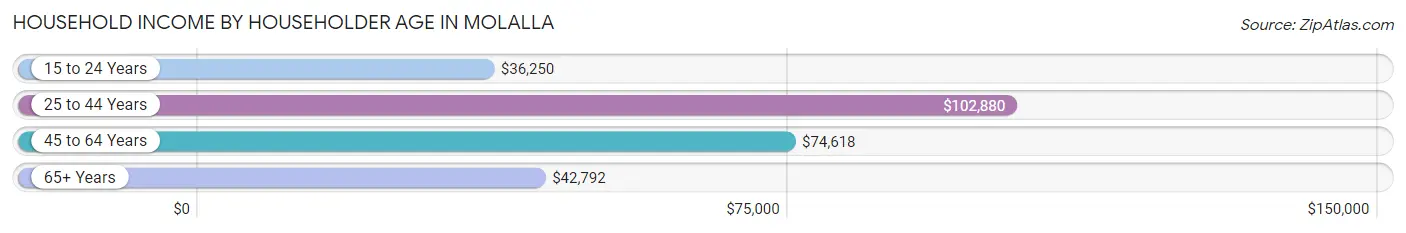
| Income Bracket | # Households | Median Income |
| 15 to 24 Years | 173 (4.6%) | $36,250 |
| 25 to 44 Years | 1,768 (46.8%) | $102,880 |
| 45 to 64 Years | 1,219 (32.2%) | $74,618 |
| 65+ Years | 621 (16.4%) | $42,792 |
| Total | 3,781 (100.0%) | $77,442 |
Poverty in Molalla
Income Below Poverty by Sex and Age in Molalla
With 7.8% poverty level for males and 6.2% for females among the residents of Molalla, 75 year old and over males and 75 year old and over females are the most vulnerable to poverty, with 61 males (46.6%) and 24 females (13.6%) in their respective age groups living below the poverty level.
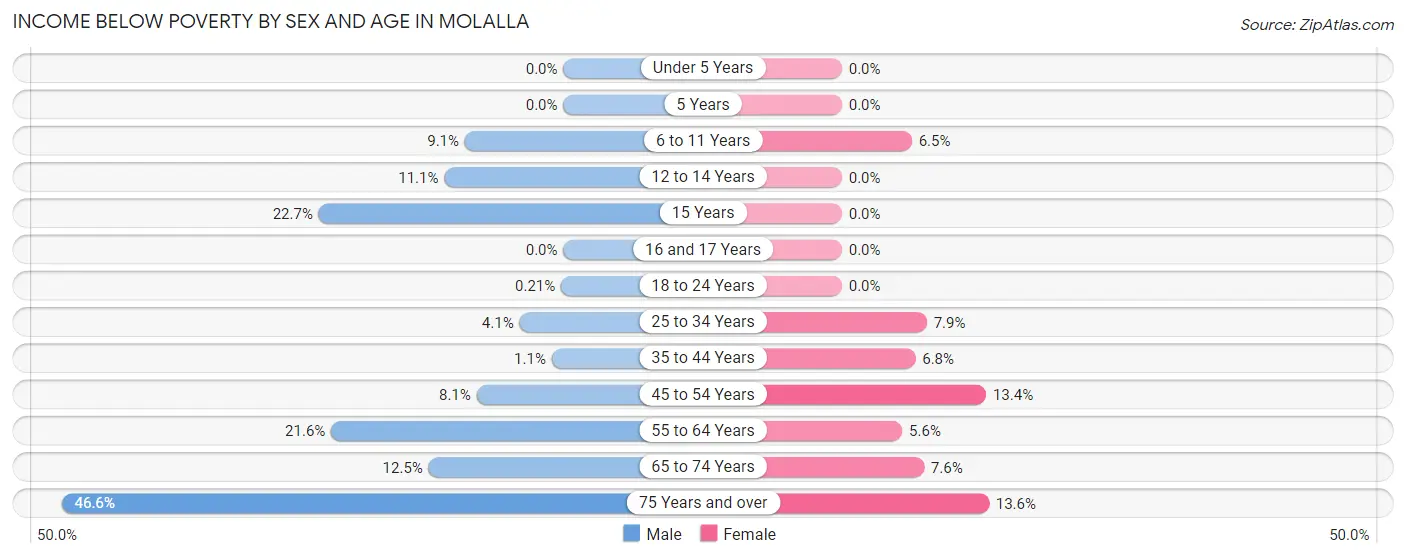
| Age Bracket | Male | Female |
| Under 5 Years | 0 (0.0%) | 0 (0.0%) |
| 5 Years | 0 (0.0%) | 0 (0.0%) |
| 6 to 11 Years | 53 (9.1%) | 35 (6.5%) |
| 12 to 14 Years | 19 (11.1%) | 0 (0.0%) |
| 15 Years | 32 (22.7%) | 0 (0.0%) |
| 16 and 17 Years | 0 (0.0%) | 0 (0.0%) |
| 18 to 24 Years | 1 (0.2%) | 0 (0.0%) |
| 25 to 34 Years | 35 (4.1%) | 90 (7.9%) |
| 35 to 44 Years | 10 (1.1%) | 42 (6.8%) |
| 45 to 54 Years | 49 (8.1%) | 63 (13.4%) |
| 55 to 64 Years | 89 (21.5%) | 32 (5.6%) |
| 65 to 74 Years | 37 (12.5%) | 31 (7.6%) |
| 75 Years and over | 61 (46.6%) | 24 (13.6%) |
| Total | 386 (7.8%) | 317 (6.2%) |
Income Above Poverty by Sex and Age in Molalla
According to the poverty statistics in Molalla, males aged under 5 years and females aged under 5 years are the age groups that are most secure financially, with 100.0% of males and 100.0% of females in these age groups living above the poverty line.
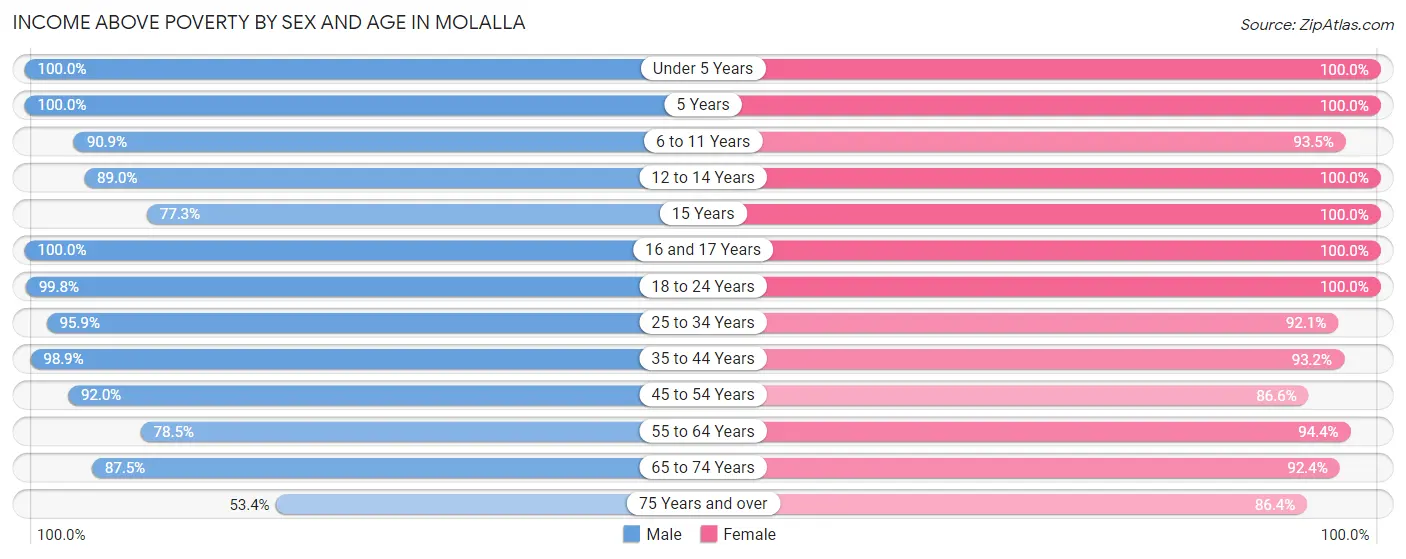
| Age Bracket | Male | Female |
| Under 5 Years | 204 (100.0%) | 290 (100.0%) |
| 5 Years | 27 (100.0%) | 102 (100.0%) |
| 6 to 11 Years | 527 (90.9%) | 504 (93.5%) |
| 12 to 14 Years | 153 (88.9%) | 134 (100.0%) |
| 15 Years | 109 (77.3%) | 81 (100.0%) |
| 16 and 17 Years | 99 (100.0%) | 130 (100.0%) |
| 18 to 24 Years | 473 (99.8%) | 424 (100.0%) |
| 25 to 34 Years | 824 (95.9%) | 1,052 (92.1%) |
| 35 to 44 Years | 914 (98.9%) | 574 (93.2%) |
| 45 to 54 Years | 560 (91.9%) | 408 (86.6%) |
| 55 to 64 Years | 324 (78.4%) | 539 (94.4%) |
| 65 to 74 Years | 259 (87.5%) | 376 (92.4%) |
| 75 Years and over | 70 (53.4%) | 152 (86.4%) |
| Total | 4,543 (92.2%) | 4,766 (93.8%) |
Income Below Poverty Among Married-Couple Families in Molalla
The poverty statistics for married-couple families in Molalla show that 5.5% or 99 of the total 1,796 families live below the poverty line. Families with no children have the highest poverty rate of 6.5%, comprising of 40 families. On the other hand, families with 3 or 4 children have the lowest poverty rate of 0.0%, which includes 0 families.
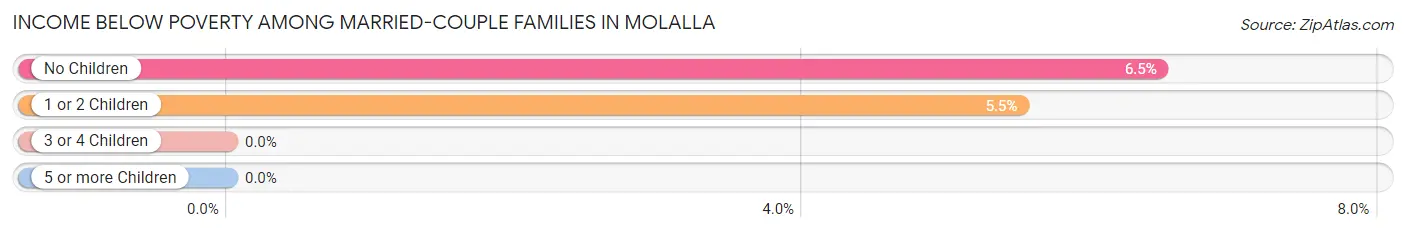
| Children | Above Poverty | Below Poverty |
| No Children | 577 (93.5%) | 40 (6.5%) |
| 1 or 2 Children | 1,012 (94.5%) | 59 (5.5%) |
| 3 or 4 Children | 79 (100.0%) | 0 (0.0%) |
| 5 or more Children | 29 (100.0%) | 0 (0.0%) |
| Total | 1,697 (94.5%) | 99 (5.5%) |
Income Below Poverty Among Single-Parent Households in Molalla
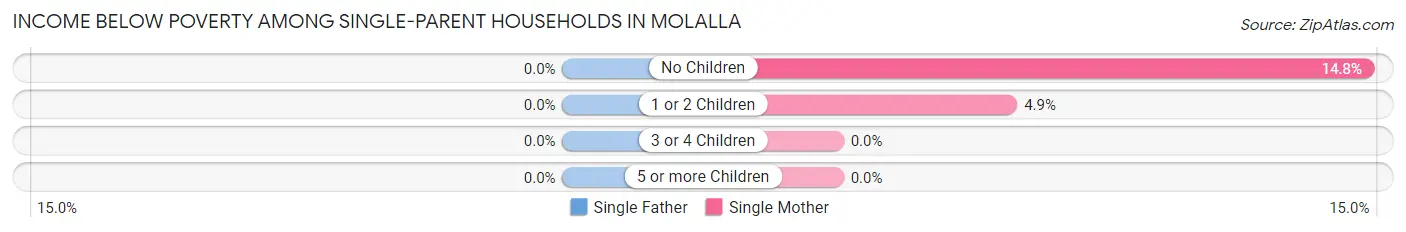
| Children | Single Father | Single Mother |
| No Children | 0 (0.0%) | 24 (14.8%) |
| 1 or 2 Children | 0 (0.0%) | 10 (4.9%) |
| 3 or 4 Children | 0 (0.0%) | 0 (0.0%) |
| 5 or more Children | 0 (0.0%) | 0 (0.0%) |
| Total | 0 (0.0%) | 34 (9.0%) |
Income Below Poverty Among Married-Couple vs Single-Parent Households in Molalla
The poverty data for Molalla shows that 99 of the married-couple family households (5.5%) and 34 of the single-parent households (5.4%) are living below the poverty level. Within the married-couple family households, those with no children have the highest poverty rate, with 40 households (6.5%) falling below the poverty line. Among the single-parent households, those with no children have the highest poverty rate, with 24 household (7.5%) living below poverty.
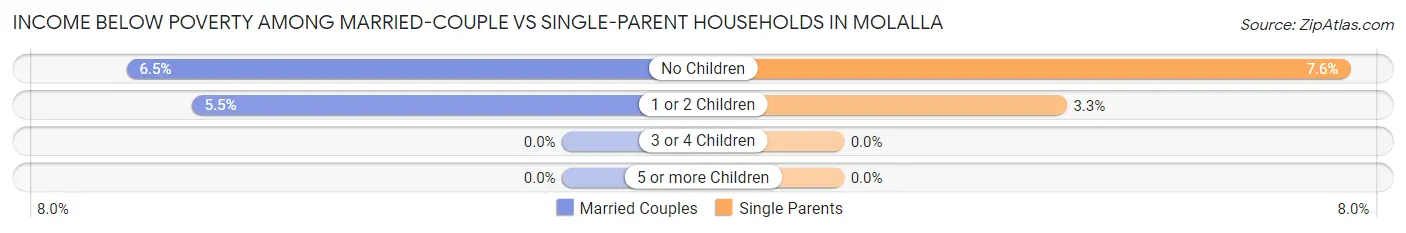
| Children | Married-Couple Families | Single-Parent Households |
| No Children | 40 (6.5%) | 24 (7.5%) |
| 1 or 2 Children | 59 (5.5%) | 10 (3.3%) |
| 3 or 4 Children | 0 (0.0%) | 0 (0.0%) |
| 5 or more Children | 0 (0.0%) | 0 (0.0%) |
| Total | 99 (5.5%) | 34 (5.4%) |
Race in Molalla
The most populous races in Molalla are White / Caucasian (9,294 | 91.6%), Hispanic or Latino (1,431 | 14.1%), and Two or more Races (470 | 4.6%).
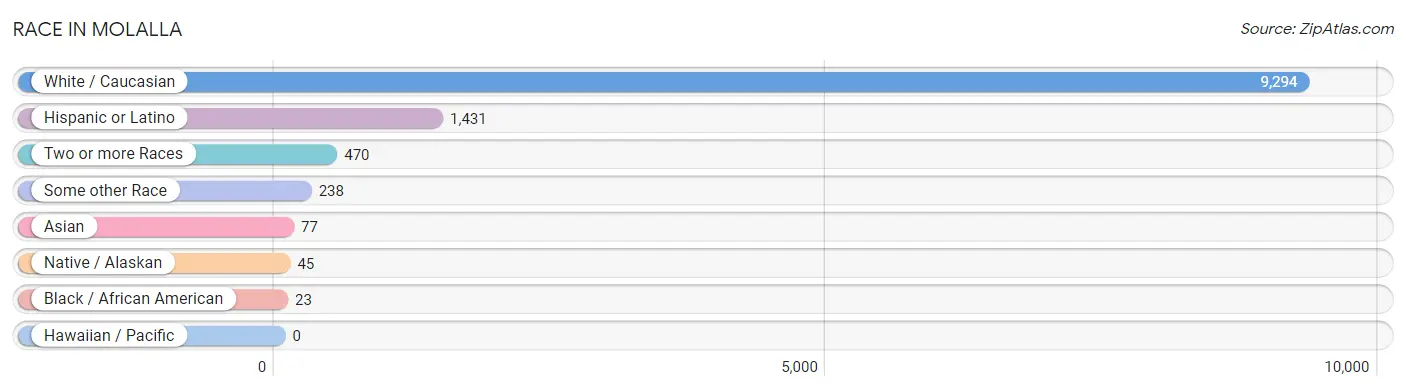
| Race | # Population | % Population |
| Asian | 77 | 0.8% |
| Black / African American | 23 | 0.2% |
| Hawaiian / Pacific | 0 | 0.0% |
| Hispanic or Latino | 1,431 | 14.1% |
| Native / Alaskan | 45 | 0.4% |
| White / Caucasian | 9,294 | 91.6% |
| Two or more Races | 470 | 4.6% |
| Some other Race | 238 | 2.4% |
| Total | 10,147 | 100.0% |
Ancestry in Molalla
The most populous ancestries reported in Molalla are German (1,928 | 19.0%), Irish (1,494 | 14.7%), Mexican (1,240 | 12.2%), English (1,127 | 11.1%), and Scottish (699 | 6.9%), together accounting for 63.9% of all Molalla residents.
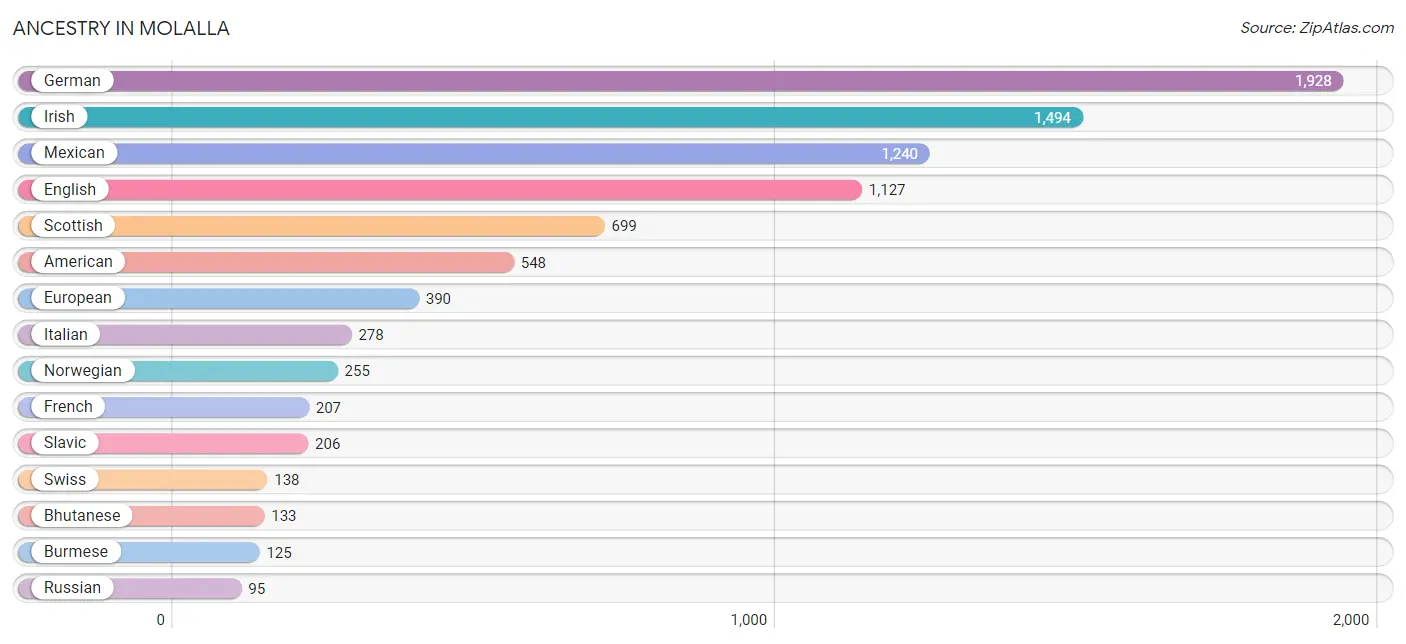
| Ancestry | # Population | % Population |
| Alaskan Athabascan | 60 | 0.6% |
| American | 548 | 5.4% |
| Arab | 20 | 0.2% |
| Austrian | 9 | 0.1% |
| Basque | 6 | 0.1% |
| Bhutanese | 133 | 1.3% |
| British | 87 | 0.9% |
| Burmese | 125 | 1.2% |
| Central American | 38 | 0.4% |
| Central American Indian | 20 | 0.2% |
| Cherokee | 34 | 0.3% |
| Choctaw | 16 | 0.2% |
| Cuban | 64 | 0.6% |
| Czech | 14 | 0.1% |
| Danish | 35 | 0.3% |
| Dutch | 50 | 0.5% |
| Eastern European | 27 | 0.3% |
| Ecuadorian | 39 | 0.4% |
| English | 1,127 | 11.1% |
| European | 390 | 3.8% |
| Finnish | 12 | 0.1% |
| French | 207 | 2.0% |
| French Canadian | 9 | 0.1% |
| German | 1,928 | 19.0% |
| Greek | 23 | 0.2% |
| Guatemalan | 38 | 0.4% |
| Hungarian | 47 | 0.5% |
| Indian (Asian) | 37 | 0.4% |
| Iranian | 31 | 0.3% |
| Irish | 1,494 | 14.7% |
| Italian | 278 | 2.7% |
| Korean | 60 | 0.6% |
| Laotian | 14 | 0.1% |
| Lithuanian | 28 | 0.3% |
| Mexican | 1,240 | 12.2% |
| Northern European | 11 | 0.1% |
| Norwegian | 255 | 2.5% |
| Portuguese | 37 | 0.4% |
| Pueblo | 9 | 0.1% |
| Puget Sound Salish | 10 | 0.1% |
| Romanian | 7 | 0.1% |
| Russian | 95 | 0.9% |
| Scandinavian | 44 | 0.4% |
| Scotch-Irish | 56 | 0.5% |
| Scottish | 699 | 6.9% |
| Slavic | 206 | 2.0% |
| South American | 39 | 0.4% |
| Spaniard | 29 | 0.3% |
| Sri Lankan | 40 | 0.4% |
| Swedish | 85 | 0.8% |
| Swiss | 138 | 1.4% |
| Welsh | 54 | 0.5% | View All 52 Rows |
Immigrants in Molalla
The most numerous immigrant groups reported in Molalla came from Latin America (429 | 4.2%), Central America (390 | 3.8%), Mexico (352 | 3.5%), Asia (82 | 0.8%), and Ecuador (39 | 0.4%), together accounting for 12.7% of all Molalla residents.
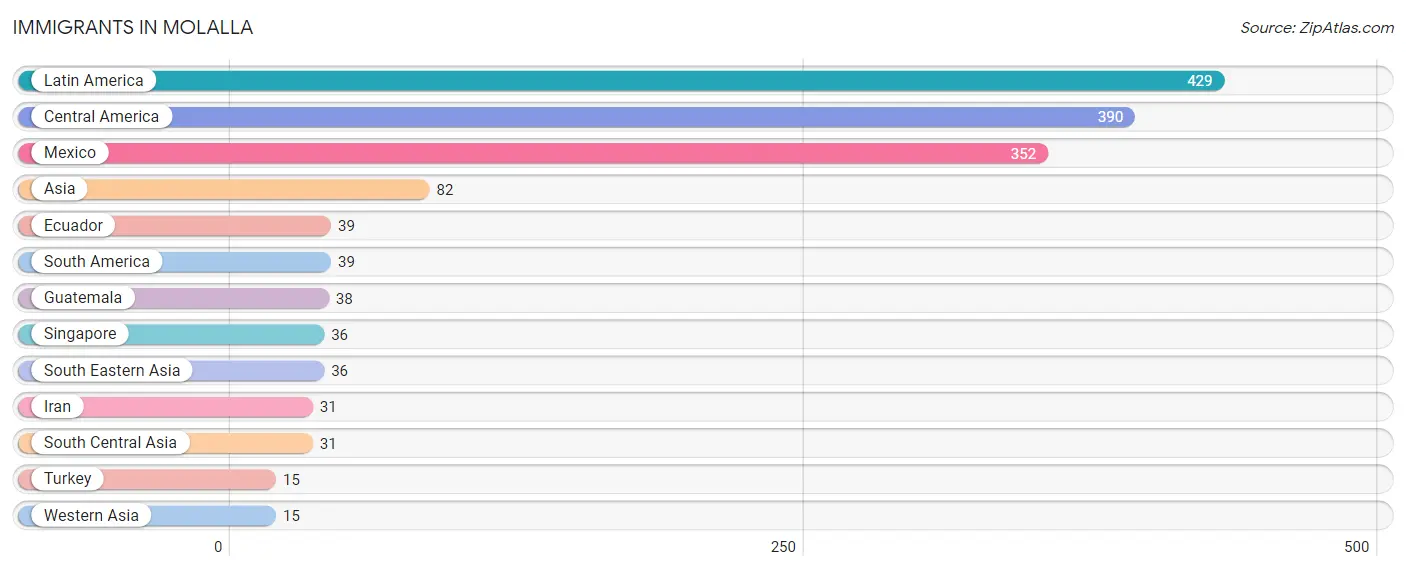
| Immigration Origin | # Population | % Population |
| Asia | 82 | 0.8% |
| Central America | 390 | 3.8% |
| Ecuador | 39 | 0.4% |
| Guatemala | 38 | 0.4% |
| Iran | 31 | 0.3% |
| Latin America | 429 | 4.2% |
| Mexico | 352 | 3.5% |
| Singapore | 36 | 0.4% |
| South America | 39 | 0.4% |
| South Central Asia | 31 | 0.3% |
| South Eastern Asia | 36 | 0.4% |
| Turkey | 15 | 0.2% |
| Western Asia | 15 | 0.2% | View All 13 Rows |
Sex and Age in Molalla
Sex and Age in Molalla
The most populous age groups in Molalla are 40 to 44 Years (516 | 10.3%) for men and 25 to 29 Years (637 | 12.4%) for women.
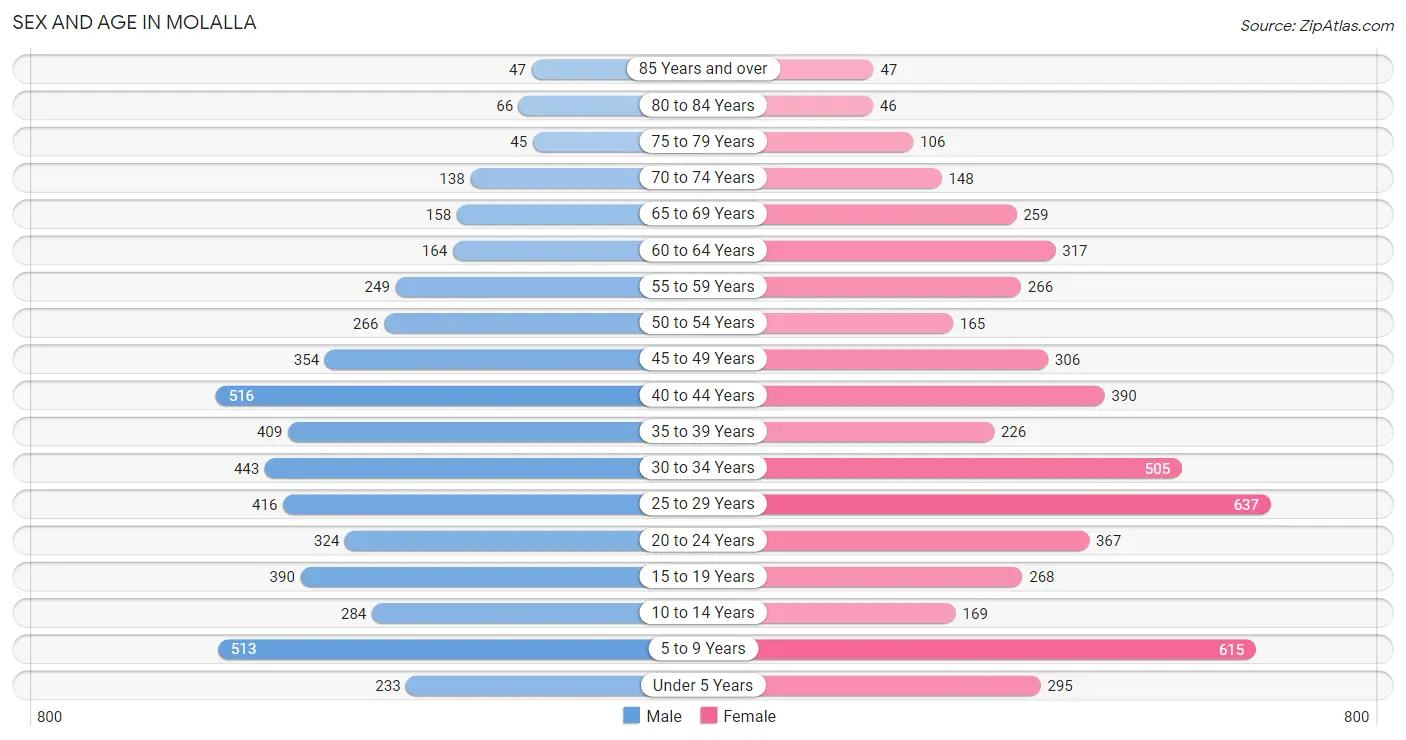
| Age Bracket | Male | Female |
| Under 5 Years | 233 (4.6%) | 295 (5.8%) |
| 5 to 9 Years | 513 (10.2%) | 615 (12.0%) |
| 10 to 14 Years | 284 (5.7%) | 169 (3.3%) |
| 15 to 19 Years | 390 (7.8%) | 268 (5.2%) |
| 20 to 24 Years | 324 (6.5%) | 367 (7.1%) |
| 25 to 29 Years | 416 (8.3%) | 637 (12.4%) |
| 30 to 34 Years | 443 (8.8%) | 505 (9.8%) |
| 35 to 39 Years | 409 (8.2%) | 226 (4.4%) |
| 40 to 44 Years | 516 (10.3%) | 390 (7.6%) |
| 45 to 49 Years | 354 (7.1%) | 306 (6.0%) |
| 50 to 54 Years | 266 (5.3%) | 165 (3.2%) |
| 55 to 59 Years | 249 (5.0%) | 266 (5.2%) |
| 60 to 64 Years | 164 (3.3%) | 317 (6.2%) |
| 65 to 69 Years | 158 (3.2%) | 259 (5.1%) |
| 70 to 74 Years | 138 (2.8%) | 148 (2.9%) |
| 75 to 79 Years | 45 (0.9%) | 106 (2.1%) |
| 80 to 84 Years | 66 (1.3%) | 46 (0.9%) |
| 85 Years and over | 47 (0.9%) | 47 (0.9%) |
| Total | 5,015 (100.0%) | 5,132 (100.0%) |
Families and Households in Molalla
Median Family Size in Molalla
The median family size in Molalla is 3.17 persons per family, with married-couple families (1,796 | 74.0%) accounting for the largest median family size of 3.45 persons per family. On the other hand, single male/father families (251 | 10.3%) represent the smallest median family size with 1.98 persons per family.
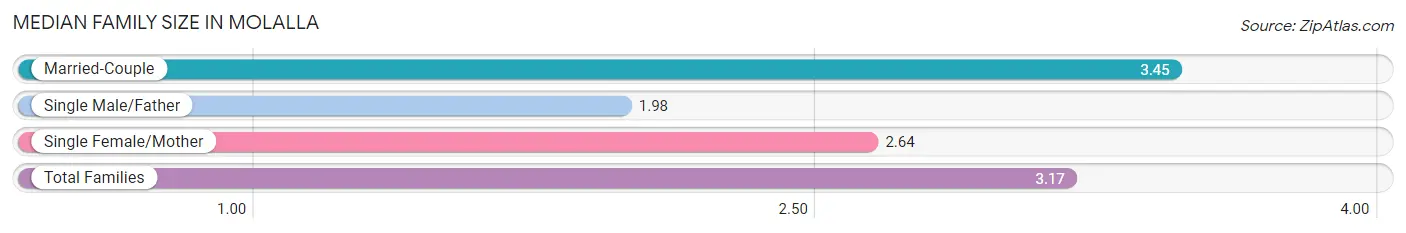
| Family Type | # Families | Family Size |
| Married-Couple | 1,796 (74.0%) | 3.45 |
| Single Male/Father | 251 (10.3%) | 1.98 |
| Single Female/Mother | 379 (15.6%) | 2.64 |
| Total Families | 2,426 (100.0%) | 3.17 |
Median Household Size in Molalla
The median household size in Molalla is 2.66 persons per household, with married-couple households (1,796 | 47.5%) accounting for the largest median household size of 3.52 persons per household. non-family households (1,355 | 35.8%) represent the smallest median household size with 1.44 persons per household.
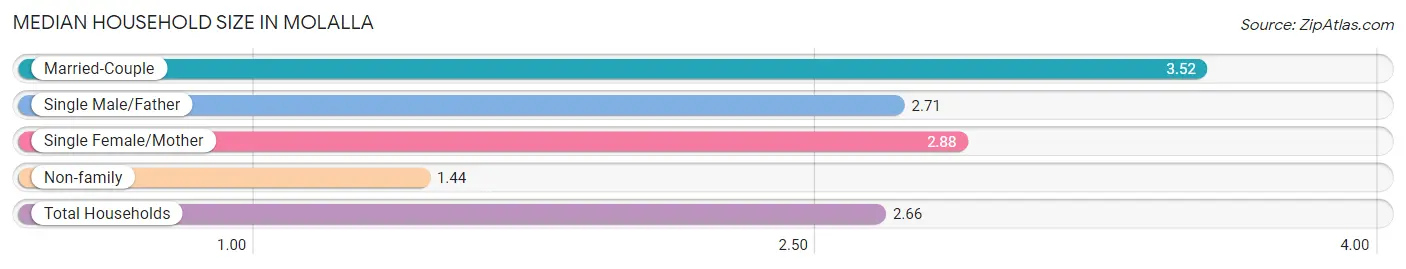
| Household Type | # Households | Household Size |
| Married-Couple | 1,796 (47.5%) | 3.52 |
| Single Male/Father | 251 (6.6%) | 2.71 |
| Single Female/Mother | 379 (10.0%) | 2.88 |
| Non-family | 1,355 (35.8%) | 1.44 |
| Total Households | 3,781 (100.0%) | 2.66 |
Household Size by Marriage Status in Molalla
Out of a total of 3,781 households in Molalla, 2,426 (64.2%) are family households, while 1,355 (35.8%) are nonfamily households. The most numerous type of family households are 4-person households, comprising 865, and the most common type of nonfamily households are 1-person households, comprising 1,077.
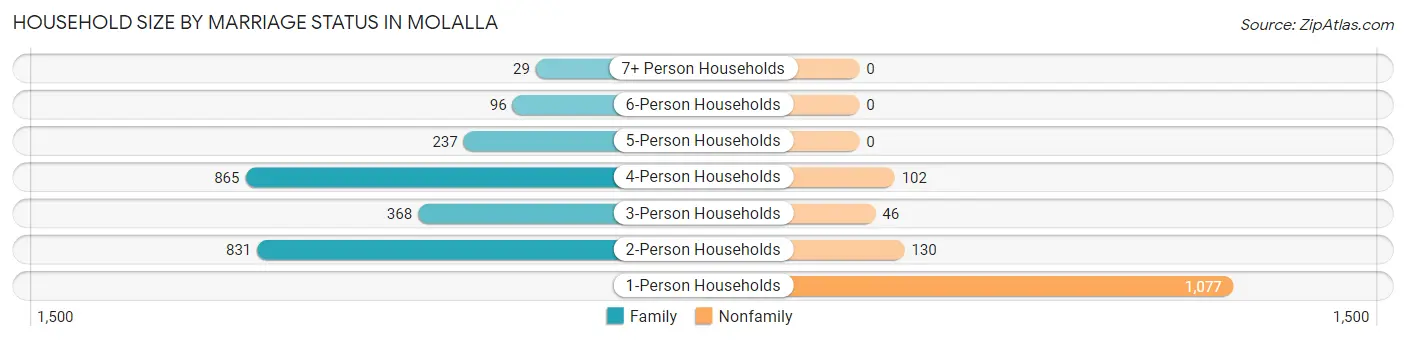
| Household Size | Family Households | Nonfamily Households |
| 1-Person Households | - | 1,077 (28.5%) |
| 2-Person Households | 831 (22.0%) | 130 (3.4%) |
| 3-Person Households | 368 (9.7%) | 46 (1.2%) |
| 4-Person Households | 865 (22.9%) | 102 (2.7%) |
| 5-Person Households | 237 (6.3%) | 0 (0.0%) |
| 6-Person Households | 96 (2.5%) | 0 (0.0%) |
| 7+ Person Households | 29 (0.8%) | 0 (0.0%) |
| Total | 2,426 (64.2%) | 1,355 (35.8%) |
Female Fertility in Molalla
Fertility by Age in Molalla
Average fertility rate in Molalla is 41.0 births per 1,000 women. Women in the age bracket of 20 to 34 years have the highest fertility rate with 68.0 births per 1,000 women. Women in the age bracket of 20 to 34 years acount for 91.9% of all women with births.
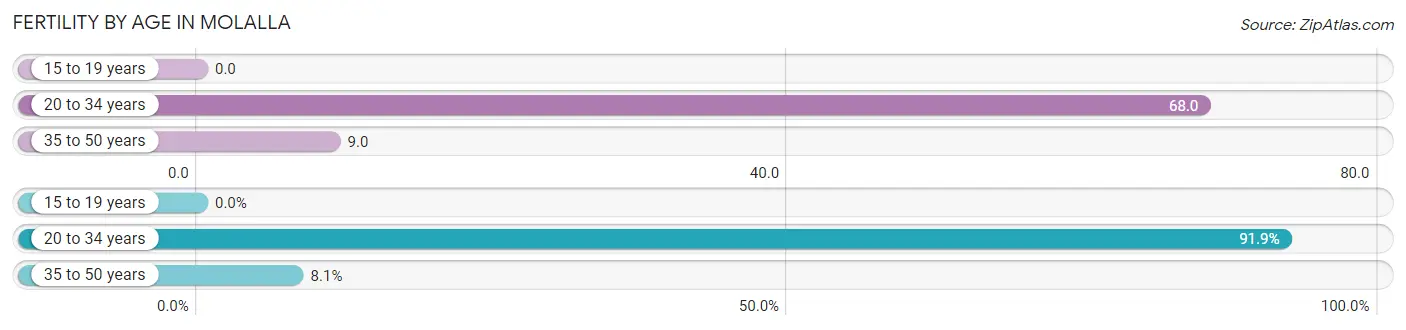
| Age Bracket | Women with Births | Births / 1,000 Women |
| 15 to 19 years | 0 (0.0%) | 0.0 |
| 20 to 34 years | 102 (91.9%) | 68.0 |
| 35 to 50 years | 9 (8.1%) | 9.0 |
| Total | 111 (100.0%) | 41.0 |
Fertility by Age by Marriage Status in Molalla
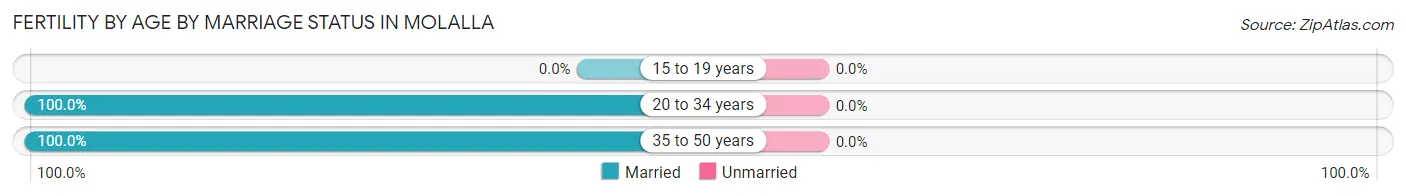
| Age Bracket | Married | Unmarried |
| 15 to 19 years | 0 (0.0%) | 0 (0.0%) |
| 20 to 34 years | 102 (100.0%) | 0 (0.0%) |
| 35 to 50 years | 9 (100.0%) | 0 (0.0%) |
| Total | 111 (100.0%) | 0 (0.0%) |
Fertility by Education in Molalla
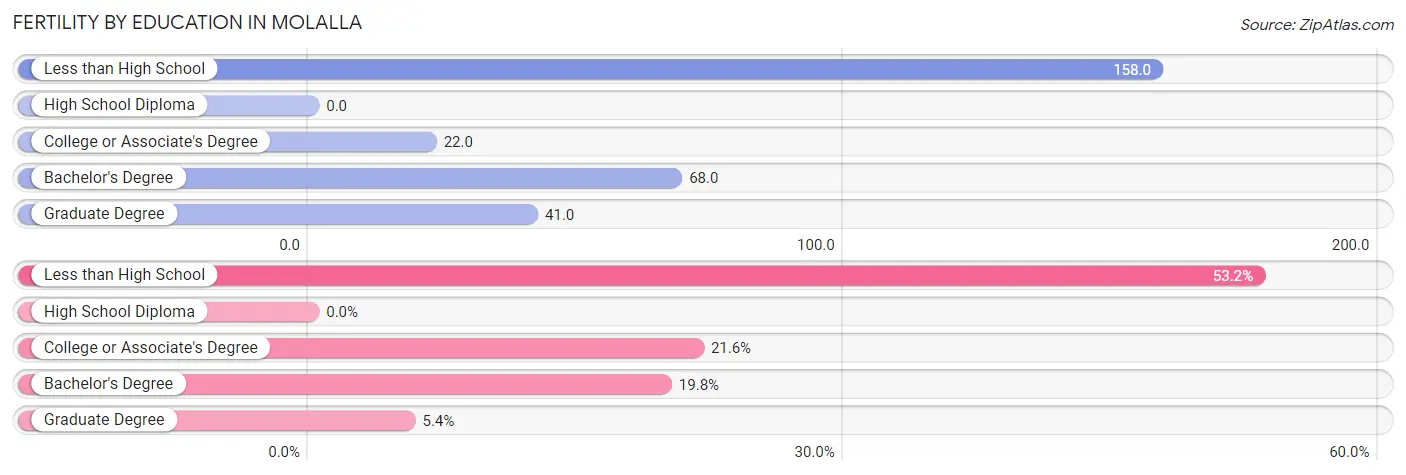
| Educational Attainment | Women with Births | Births / 1,000 Women |
| Less than High School | 59 (53.1%) | 158.0 |
| High School Diploma | 0 (0.0%) | 0.0 |
| College or Associate's Degree | 24 (21.6%) | 22.0 |
| Bachelor's Degree | 22 (19.8%) | 68.0 |
| Graduate Degree | 6 (5.4%) | 41.0 |
| Total | 111 (100.0%) | 41.0 |
Fertility by Education by Marriage Status in Molalla
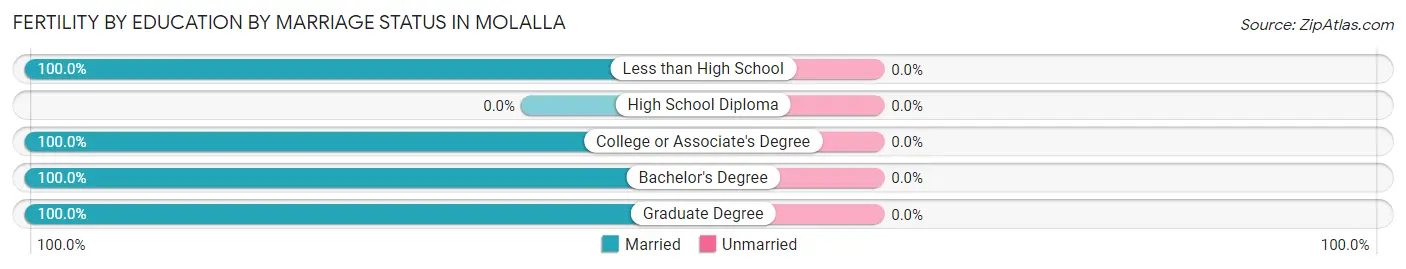
| Educational Attainment | Married | Unmarried |
| Less than High School | 59 (100.0%) | 0 (0.0%) |
| High School Diploma | 0 (0.0%) | 0 (0.0%) |
| College or Associate's Degree | 24 (100.0%) | 0 (0.0%) |
| Bachelor's Degree | 22 (100.0%) | 0 (0.0%) |
| Graduate Degree | 6 (100.0%) | 0 (0.0%) |
| Total | 111 (100.0%) | 0 (0.0%) |
Employment Characteristics in Molalla
Employment by Class of Employer in Molalla
Among the 5,266 employed individuals in Molalla, private company employees (3,600 | 68.4%), local government employees (703 | 13.4%), and self-employed (not incorporated) (439 | 8.3%) make up the most common classes of employment.
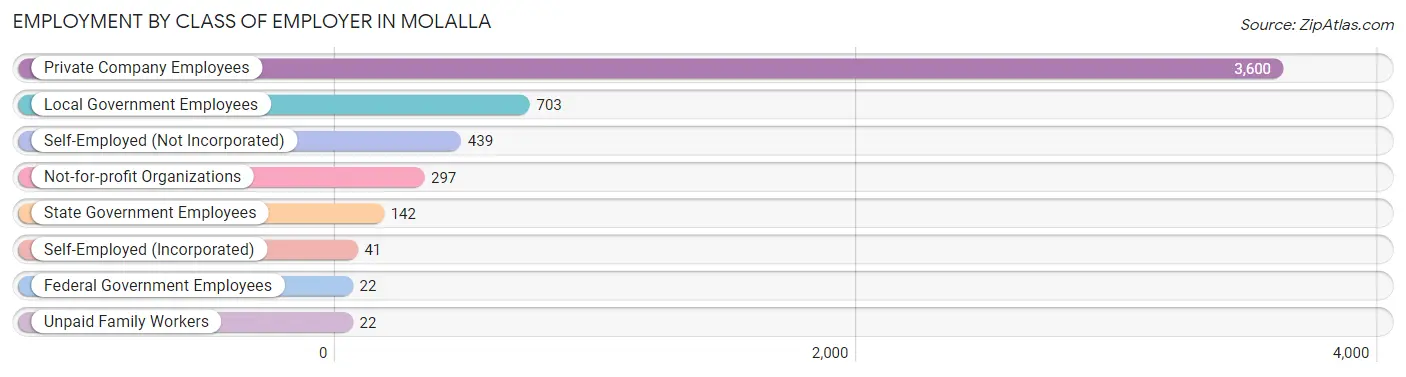
| Employer Class | # Employees | % Employees |
| Private Company Employees | 3,600 | 68.4% |
| Self-Employed (Incorporated) | 41 | 0.8% |
| Self-Employed (Not Incorporated) | 439 | 8.3% |
| Not-for-profit Organizations | 297 | 5.6% |
| Local Government Employees | 703 | 13.4% |
| State Government Employees | 142 | 2.7% |
| Federal Government Employees | 22 | 0.4% |
| Unpaid Family Workers | 22 | 0.4% |
| Total | 5,266 | 100.0% |
Employment Status by Age in Molalla
According to the labor force statistics for Molalla, out of the total population over 16 years of age (7,816), 73.6% or 5,753 individuals are in the labor force, with 7.0% or 403 of them unemployed. The age group with the highest labor force participation rate is 30 to 34 years, with 95.5% or 905 individuals in the labor force. Within the labor force, the 20 to 24 years age range has the highest percentage of unemployed individuals, with 29.8% or 177 of them being unemployed.
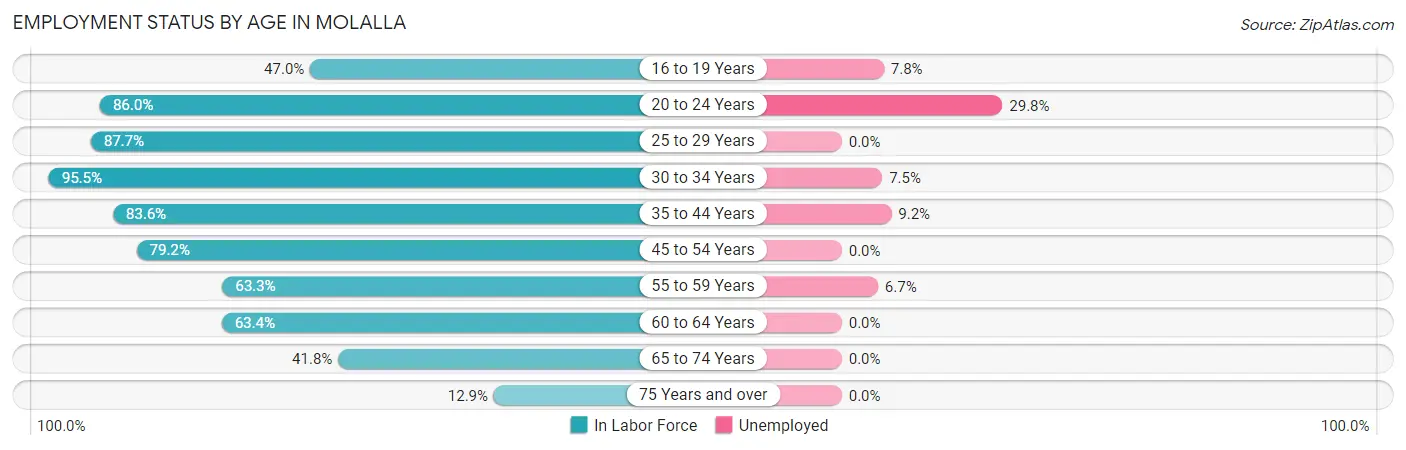
| Age Bracket | In Labor Force | Unemployed |
| 16 to 19 Years | 205 (47.0%) | 16 (7.8%) |
| 20 to 24 Years | 594 (86.0%) | 177 (29.8%) |
| 25 to 29 Years | 923 (87.7%) | 0 (0.0%) |
| 30 to 34 Years | 905 (95.5%) | 68 (7.5%) |
| 35 to 44 Years | 1,288 (83.6%) | 118 (9.2%) |
| 45 to 54 Years | 864 (79.2%) | 0 (0.0%) |
| 55 to 59 Years | 326 (63.3%) | 22 (6.7%) |
| 60 to 64 Years | 305 (63.4%) | 0 (0.0%) |
| 65 to 74 Years | 294 (41.8%) | 0 (0.0%) |
| 75 Years and over | 46 (12.9%) | 0 (0.0%) |
| Total | 5,753 (73.6%) | 403 (7.0%) |
Employment Status by Educational Attainment in Molalla
According to labor force statistics for Molalla, 81.9% of individuals (4,610) out of the total population between 25 and 64 years of age (5,629) are in the labor force, with 4.5% or 207 of them being unemployed. The group with the highest labor force participation rate are those with the educational attainment of college / associate degree, with 84.6% or 2,385 individuals in the labor force. Within the labor force, individuals with college / associate degree education have the highest percentage of unemployment, with 6.2% or 148 of them being unemployed.
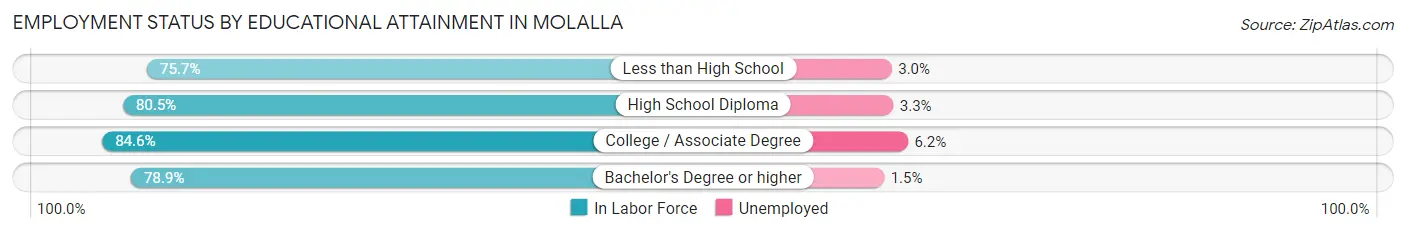
| Educational Attainment | In Labor Force | Unemployed |
| Less than High School | 362 (75.7%) | 14 (3.0%) |
| High School Diploma | 1,197 (80.5%) | 49 (3.3%) |
| College / Associate Degree | 2,385 (84.6%) | 175 (6.2%) |
| Bachelor's Degree or higher | 667 (78.9%) | 13 (1.5%) |
| Total | 4,610 (81.9%) | 253 (4.5%) |
Employment Occupations by Sex in Molalla
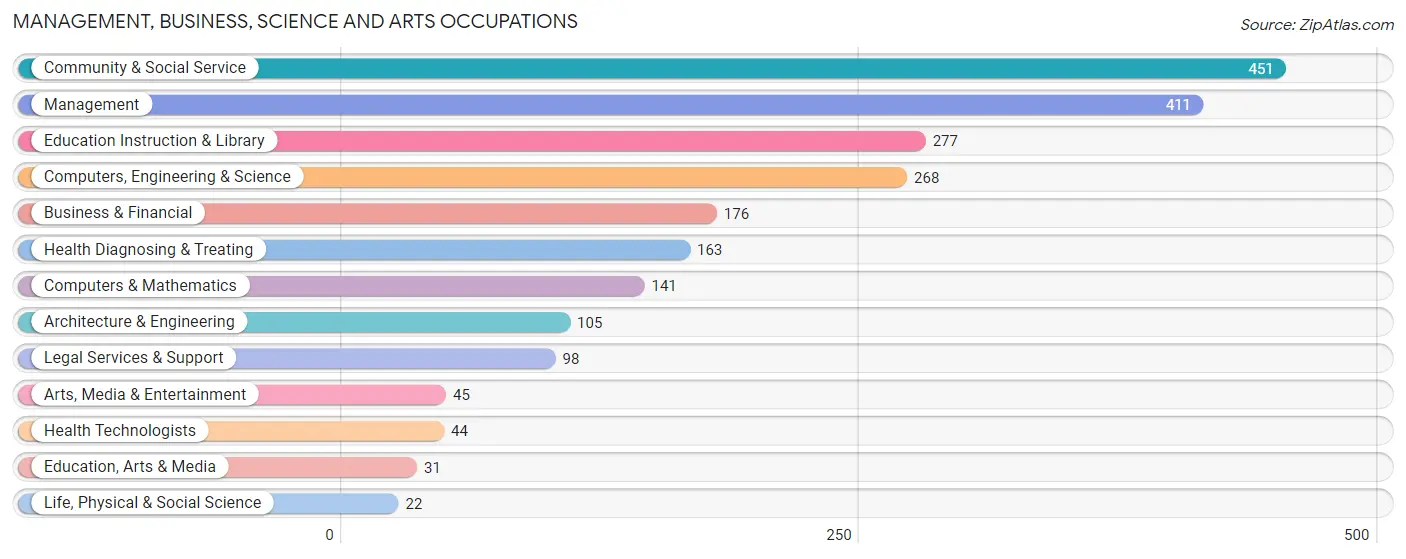
Management, Business, Science and Arts Occupations
The most common Management, Business, Science and Arts occupations in Molalla are Community & Social Service (451 | 8.5%), Management (411 | 7.7%), Education Instruction & Library (277 | 5.2%), Computers, Engineering & Science (268 | 5.0%), and Business & Financial (176 | 3.3%).
Management, Business, Science and Arts Occupations by Sex
Within the Management, Business, Science and Arts occupations in Molalla, the most male-oriented occupations are Education, Arts & Media (100.0%), Architecture & Engineering (90.5%), and Computers, Engineering & Science (74.3%), while the most female-oriented occupations are Life, Physical & Social Science (100.0%), Legal Services & Support (100.0%), and Arts, Media & Entertainment (100.0%).
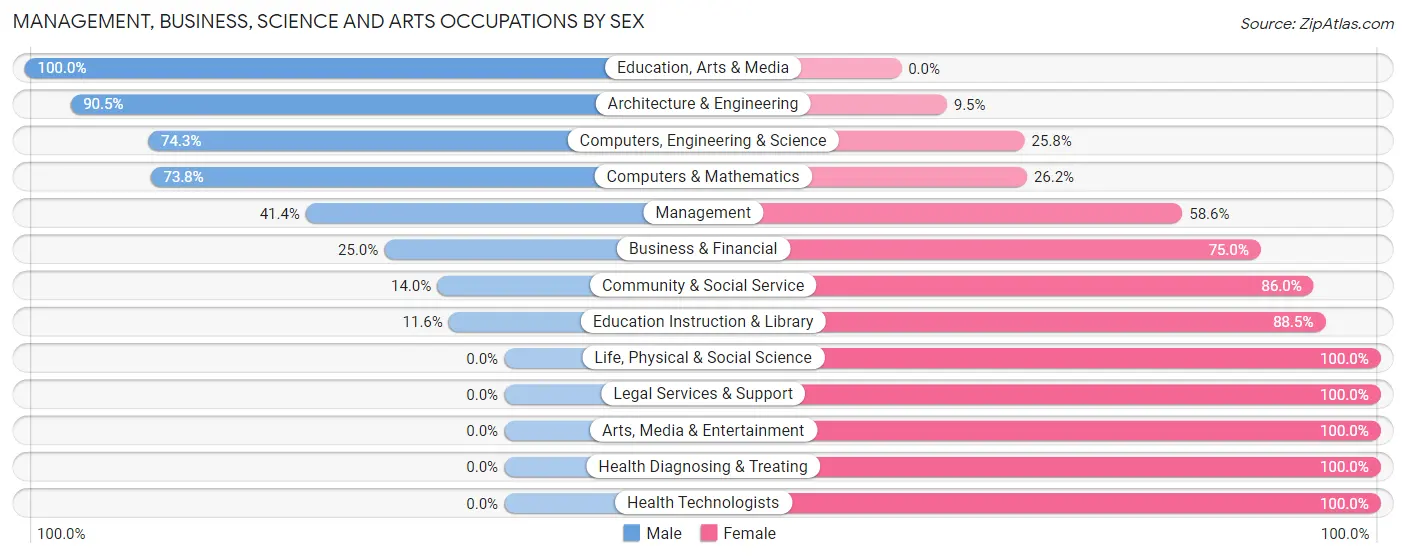
| Occupation | Male | Female |
| Management | 170 (41.4%) | 241 (58.6%) |
| Business & Financial | 44 (25.0%) | 132 (75.0%) |
| Computers, Engineering & Science | 199 (74.3%) | 69 (25.8%) |
| Computers & Mathematics | 104 (73.8%) | 37 (26.2%) |
| Architecture & Engineering | 95 (90.5%) | 10 (9.5%) |
| Life, Physical & Social Science | 0 (0.0%) | 22 (100.0%) |
| Community & Social Service | 63 (14.0%) | 388 (86.0%) |
| Education, Arts & Media | 31 (100.0%) | 0 (0.0%) |
| Legal Services & Support | 0 (0.0%) | 98 (100.0%) |
| Education Instruction & Library | 32 (11.6%) | 245 (88.4%) |
| Arts, Media & Entertainment | 0 (0.0%) | 45 (100.0%) |
| Health Diagnosing & Treating | 0 (0.0%) | 163 (100.0%) |
| Health Technologists | 0 (0.0%) | 44 (100.0%) |
| Total (Category) | 476 (32.4%) | 993 (67.6%) |
| Total (Overall) | 2,512 (47.0%) | 2,827 (52.9%) |
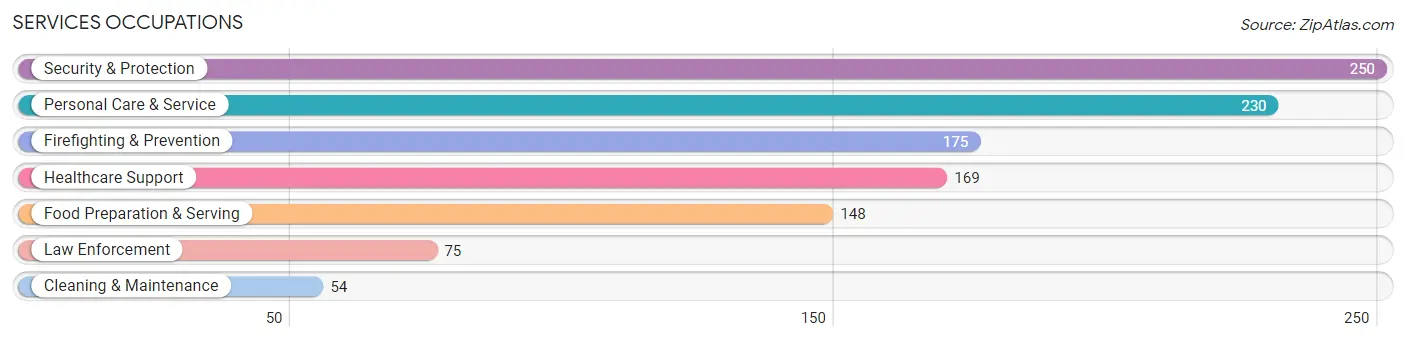
Services Occupations
The most common Services occupations in Molalla are Security & Protection (250 | 4.7%), Personal Care & Service (230 | 4.3%), Firefighting & Prevention (175 | 3.3%), Healthcare Support (169 | 3.2%), and Food Preparation & Serving (148 | 2.8%).
Services Occupations by Sex
Within the Services occupations in Molalla, the most male-oriented occupations are Law Enforcement (84.0%), Cleaning & Maintenance (70.4%), and Security & Protection (48.0%), while the most female-oriented occupations are Healthcare Support (100.0%), Personal Care & Service (100.0%), and Food Preparation & Serving (71.0%).
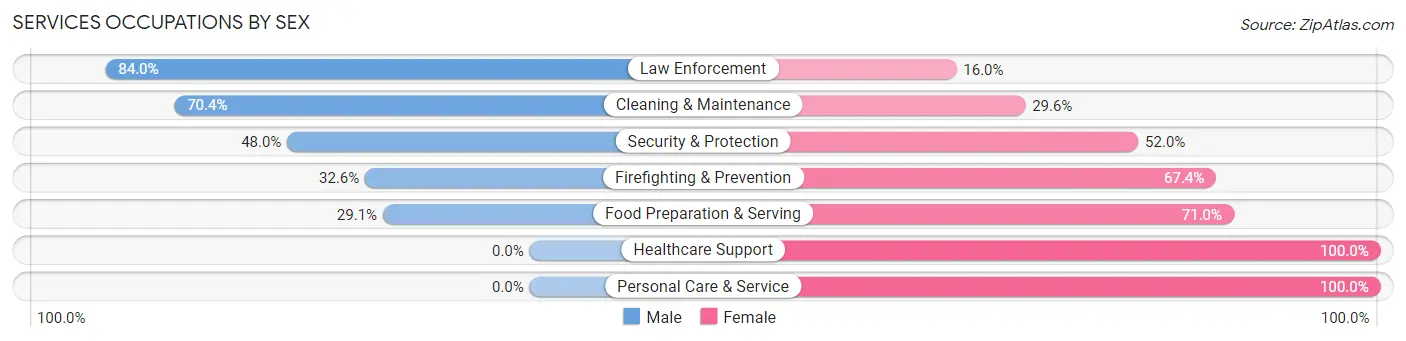
| Occupation | Male | Female |
| Healthcare Support | 0 (0.0%) | 169 (100.0%) |
| Security & Protection | 120 (48.0%) | 130 (52.0%) |
| Firefighting & Prevention | 57 (32.6%) | 118 (67.4%) |
| Law Enforcement | 63 (84.0%) | 12 (16.0%) |
| Food Preparation & Serving | 43 (29.0%) | 105 (71.0%) |
| Cleaning & Maintenance | 38 (70.4%) | 16 (29.6%) |
| Personal Care & Service | 0 (0.0%) | 230 (100.0%) |
| Total (Category) | 201 (23.6%) | 650 (76.4%) |
| Total (Overall) | 2,512 (47.0%) | 2,827 (52.9%) |
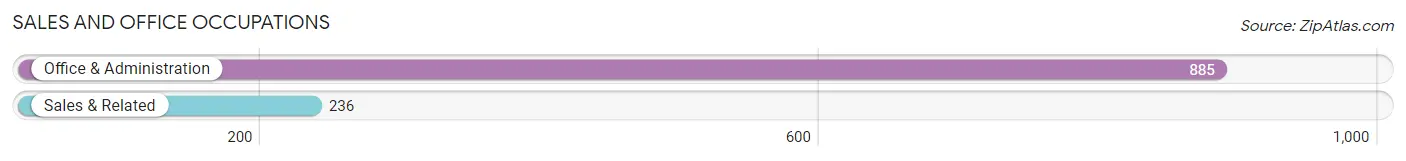
Sales and Office Occupations
The most common Sales and Office occupations in Molalla are Office & Administration (885 | 16.6%), and Sales & Related (236 | 4.4%).
Sales and Office Occupations by Sex
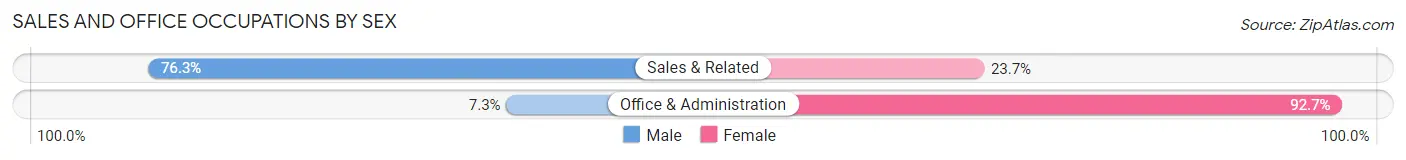
| Occupation | Male | Female |
| Sales & Related | 180 (76.3%) | 56 (23.7%) |
| Office & Administration | 65 (7.3%) | 820 (92.7%) |
| Total (Category) | 245 (21.9%) | 876 (78.1%) |
| Total (Overall) | 2,512 (47.0%) | 2,827 (52.9%) |
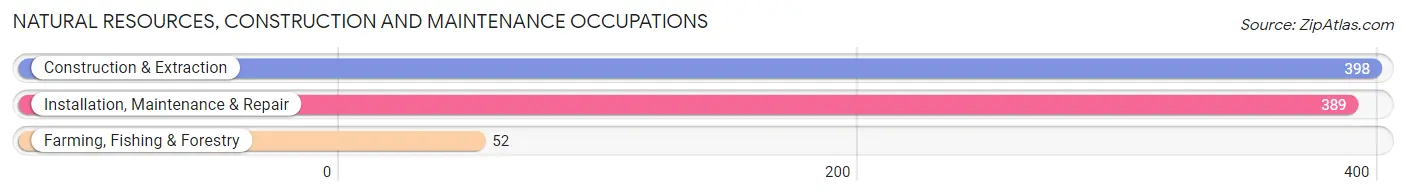
Natural Resources, Construction and Maintenance Occupations
The most common Natural Resources, Construction and Maintenance occupations in Molalla are Construction & Extraction (398 | 7.4%), Installation, Maintenance & Repair (389 | 7.3%), and Farming, Fishing & Forestry (52 | 1.0%).
Natural Resources, Construction and Maintenance Occupations by Sex
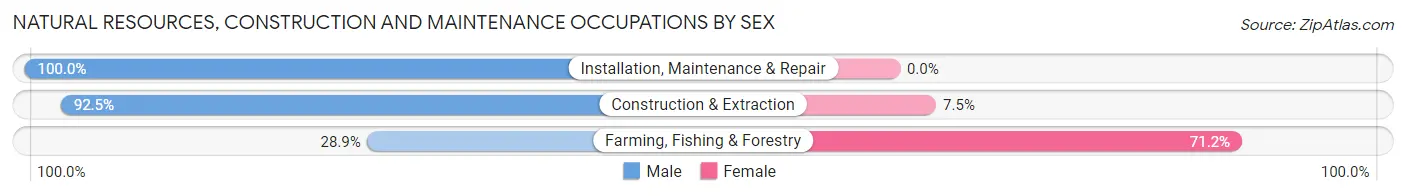
| Occupation | Male | Female |
| Farming, Fishing & Forestry | 15 (28.8%) | 37 (71.2%) |
| Construction & Extraction | 368 (92.5%) | 30 (7.5%) |
| Installation, Maintenance & Repair | 389 (100.0%) | 0 (0.0%) |
| Total (Category) | 772 (92.0%) | 67 (8.0%) |
| Total (Overall) | 2,512 (47.0%) | 2,827 (52.9%) |
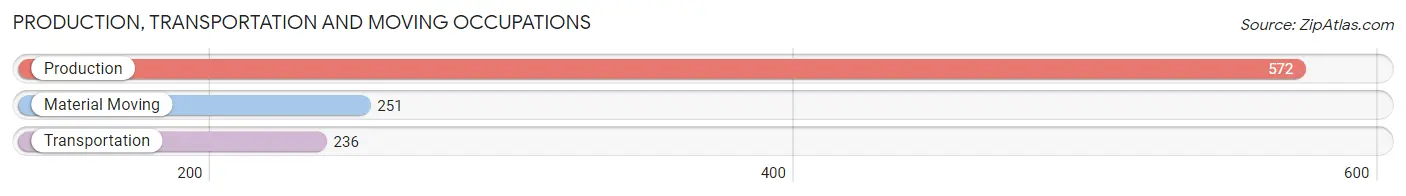
Production, Transportation and Moving Occupations
The most common Production, Transportation and Moving occupations in Molalla are Production (572 | 10.7%), Material Moving (251 | 4.7%), and Transportation (236 | 4.4%).
Production, Transportation and Moving Occupations by Sex
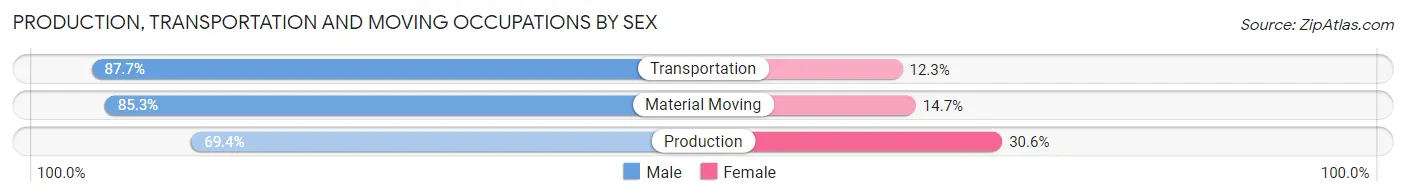
| Occupation | Male | Female |
| Production | 397 (69.4%) | 175 (30.6%) |
| Transportation | 207 (87.7%) | 29 (12.3%) |
| Material Moving | 214 (85.3%) | 37 (14.7%) |
| Total (Category) | 818 (77.2%) | 241 (22.8%) |
| Total (Overall) | 2,512 (47.0%) | 2,827 (52.9%) |
Employment Industries by Sex in Molalla
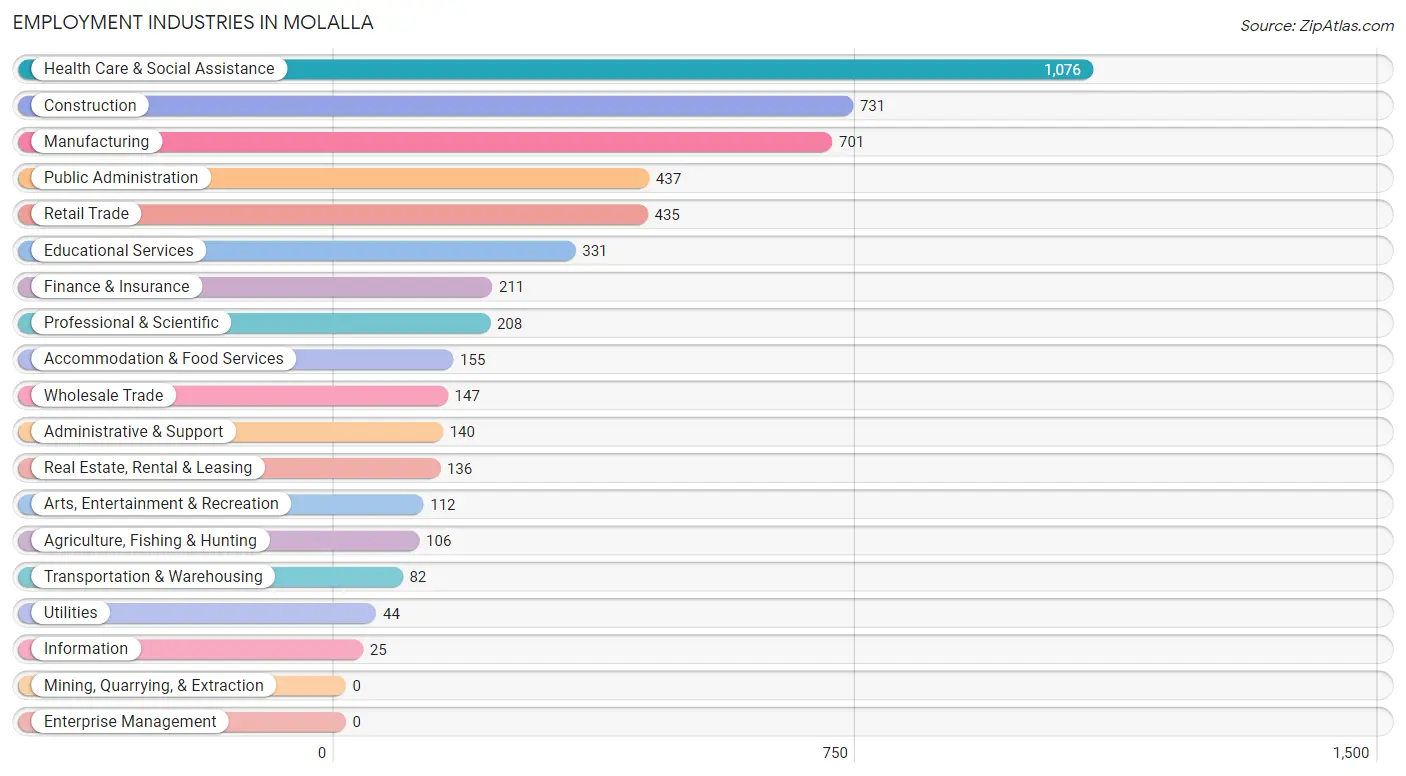
Employment Industries in Molalla
The major employment industries in Molalla include Health Care & Social Assistance (1,076 | 20.2%), Construction (731 | 13.7%), Manufacturing (701 | 13.1%), Public Administration (437 | 8.2%), and Retail Trade (435 | 8.2%).
Employment Industries by Sex in Molalla
The Molalla industries that see more men than women are Utilities (100.0%), Transportation & Warehousing (91.5%), and Wholesale Trade (91.2%), whereas the industries that tend to have a higher number of women are Real Estate, Rental & Leasing (100.0%), Health Care & Social Assistance (94.9%), and Arts, Entertainment & Recreation (91.1%).
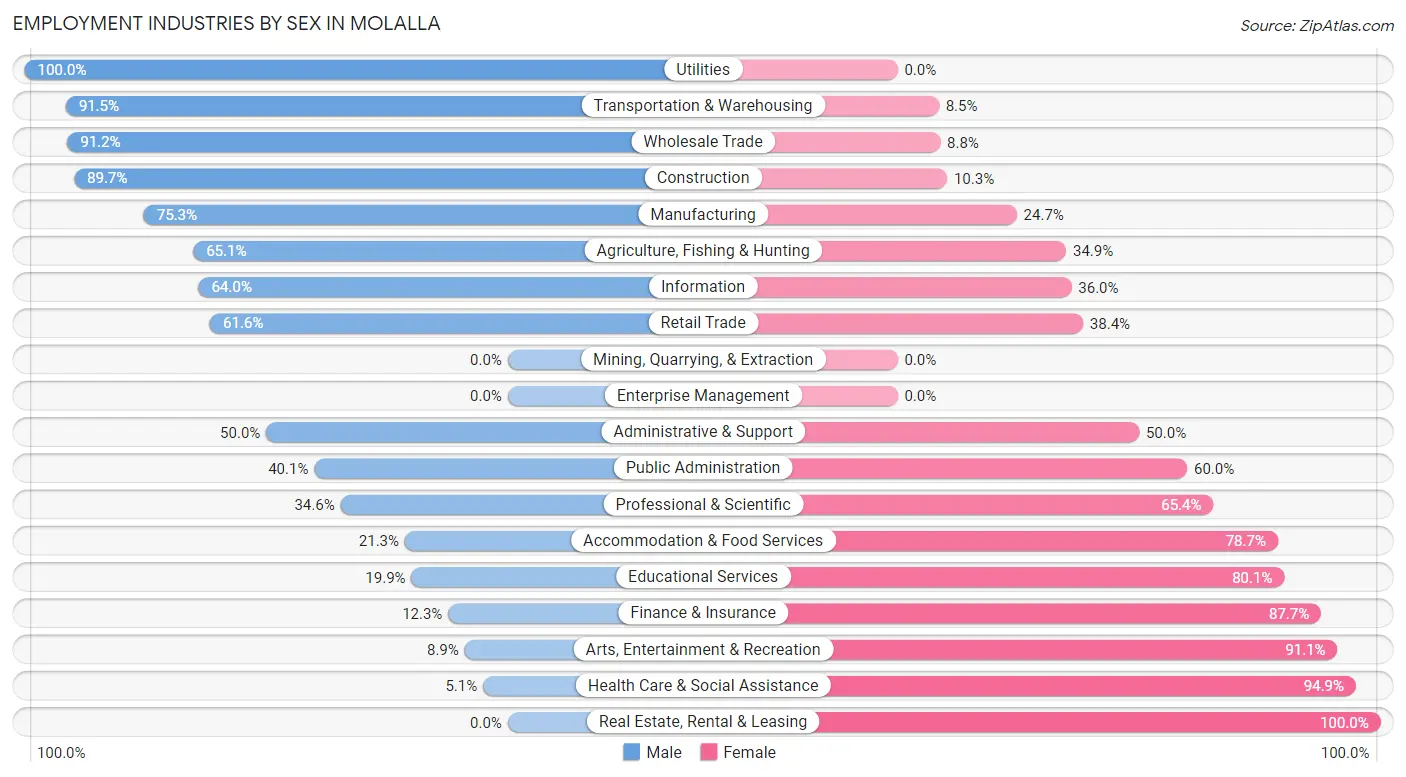
| Industry | Male | Female |
| Agriculture, Fishing & Hunting | 69 (65.1%) | 37 (34.9%) |
| Mining, Quarrying, & Extraction | 0 (0.0%) | 0 (0.0%) |
| Construction | 656 (89.7%) | 75 (10.3%) |
| Manufacturing | 528 (75.3%) | 173 (24.7%) |
| Wholesale Trade | 134 (91.2%) | 13 (8.8%) |
| Retail Trade | 268 (61.6%) | 167 (38.4%) |
| Transportation & Warehousing | 75 (91.5%) | 7 (8.5%) |
| Utilities | 44 (100.0%) | 0 (0.0%) |
| Information | 16 (64.0%) | 9 (36.0%) |
| Finance & Insurance | 26 (12.3%) | 185 (87.7%) |
| Real Estate, Rental & Leasing | 0 (0.0%) | 136 (100.0%) |
| Professional & Scientific | 72 (34.6%) | 136 (65.4%) |
| Enterprise Management | 0 (0.0%) | 0 (0.0%) |
| Administrative & Support | 70 (50.0%) | 70 (50.0%) |
| Educational Services | 66 (19.9%) | 265 (80.1%) |
| Health Care & Social Assistance | 55 (5.1%) | 1,021 (94.9%) |
| Arts, Entertainment & Recreation | 10 (8.9%) | 102 (91.1%) |
| Accommodation & Food Services | 33 (21.3%) | 122 (78.7%) |
| Public Administration | 175 (40.1%) | 262 (60.0%) |
| Total | 2,512 (47.0%) | 2,827 (52.9%) |
Education in Molalla
School Enrollment in Molalla
The most common levels of schooling among the 2,532 students in Molalla are elementary school (864 | 34.1%), high school (474 | 18.7%), and college / undergraduate (419 | 16.6%).
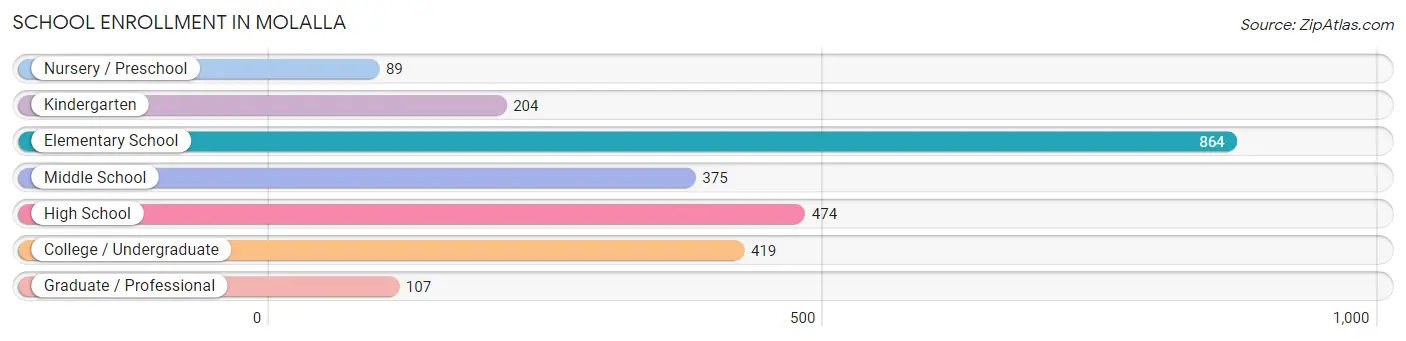
| School Level | # Students | % Students |
| Nursery / Preschool | 89 | 3.5% |
| Kindergarten | 204 | 8.1% |
| Elementary School | 864 | 34.1% |
| Middle School | 375 | 14.8% |
| High School | 474 | 18.7% |
| College / Undergraduate | 419 | 16.6% |
| Graduate / Professional | 107 | 4.2% |
| Total | 2,532 | 100.0% |
School Enrollment by Age by Funding Source in Molalla
Out of a total of 2,532 students who are enrolled in schools in Molalla, 430 (17.0%) attend a private institution, while the remaining 2,102 (83.0%) are enrolled in public schools. The age group of 3 to 4 year olds has the highest likelihood of being enrolled in private schools, with 48 (81.4% in the age bracket) enrolled. Conversely, the age group of 20 to 24 year olds has the lowest likelihood of being enrolled in a private school, with 139 (100.0% in the age bracket) attending a public institution.
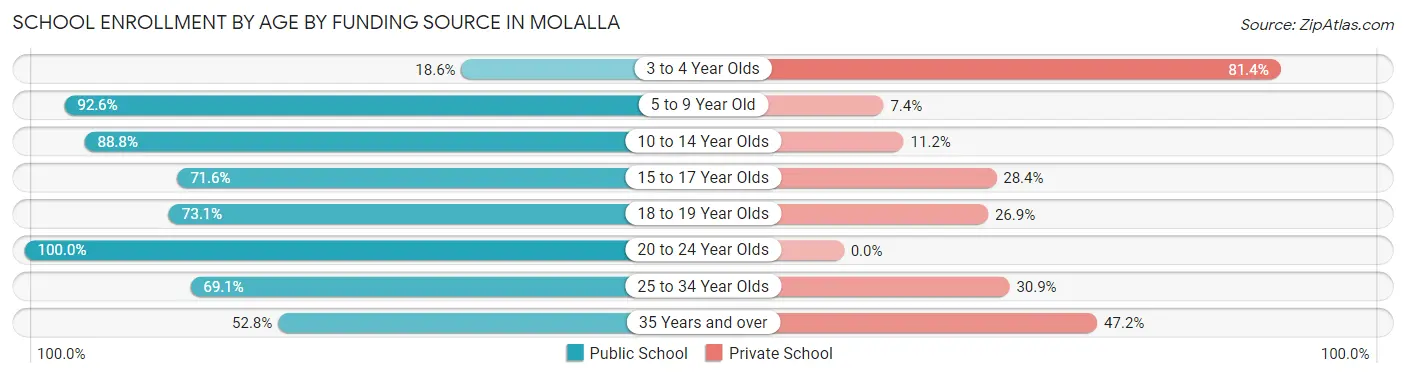
| Age Bracket | Public School | Private School |
| 3 to 4 Year Olds | 11 (18.6%) | 48 (81.4%) |
| 5 to 9 Year Old | 1,012 (92.6%) | 81 (7.4%) |
| 10 to 14 Year Olds | 358 (88.8%) | 45 (11.2%) |
| 15 to 17 Year Olds | 287 (71.6%) | 114 (28.4%) |
| 18 to 19 Year Olds | 68 (73.1%) | 25 (26.9%) |
| 20 to 24 Year Olds | 139 (100.0%) | 0 (0.0%) |
| 25 to 34 Year Olds | 188 (69.1%) | 84 (30.9%) |
| 35 Years and over | 38 (52.8%) | 34 (47.2%) |
| Total | 2,102 (83.0%) | 430 (17.0%) |
Educational Attainment by Field of Study in Molalla
Education (257 | 24.1%), business (143 | 13.4%), social sciences (107 | 10.0%), literature & languages (95 | 8.9%), and science & technology (94 | 8.8%) are the most common fields of study among 1,066 individuals in Molalla who have obtained a bachelor's degree or higher.
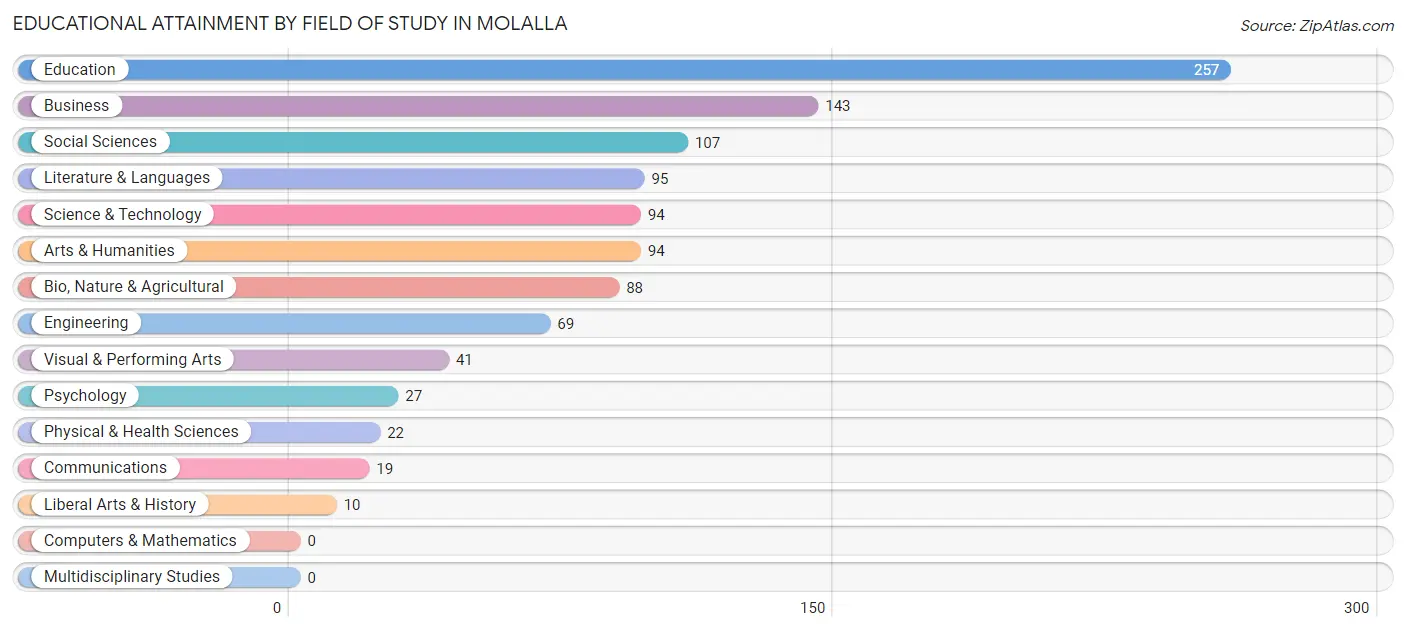
| Field of Study | # Graduates | % Graduates |
| Computers & Mathematics | 0 | 0.0% |
| Bio, Nature & Agricultural | 88 | 8.3% |
| Physical & Health Sciences | 22 | 2.1% |
| Psychology | 27 | 2.5% |
| Social Sciences | 107 | 10.0% |
| Engineering | 69 | 6.5% |
| Multidisciplinary Studies | 0 | 0.0% |
| Science & Technology | 94 | 8.8% |
| Business | 143 | 13.4% |
| Education | 257 | 24.1% |
| Literature & Languages | 95 | 8.9% |
| Liberal Arts & History | 10 | 0.9% |
| Visual & Performing Arts | 41 | 3.8% |
| Communications | 19 | 1.8% |
| Arts & Humanities | 94 | 8.8% |
| Total | 1,066 | 100.0% |
Transportation & Commute in Molalla
Vehicle Availability by Sex in Molalla
The most prevalent vehicle ownership categories in Molalla are males with 2 vehicles (867, accounting for 34.7%) and females with 2 vehicles (1,009, making up 31.4%).
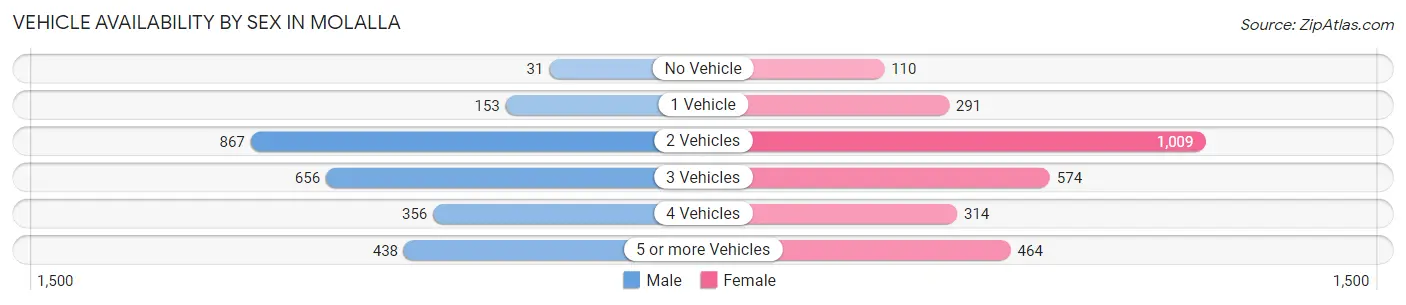
| Vehicles Available | Male | Female |
| No Vehicle | 31 (1.2%) | 110 (4.0%) |
| 1 Vehicle | 153 (6.1%) | 291 (10.5%) |
| 2 Vehicles | 867 (34.7%) | 1,009 (36.5%) |
| 3 Vehicles | 656 (26.2%) | 574 (20.8%) |
| 4 Vehicles | 356 (14.2%) | 314 (11.4%) |
| 5 or more Vehicles | 438 (17.5%) | 464 (16.8%) |
| Total | 2,501 (100.0%) | 2,762 (100.0%) |
Commute Time in Molalla
The most frequently occuring commute durations in Molalla are 45 to 59 minutes (1,288 commuters, 27.5%), 20 to 24 minutes (534 commuters, 11.4%), and 5 to 9 minutes (523 commuters, 11.2%).
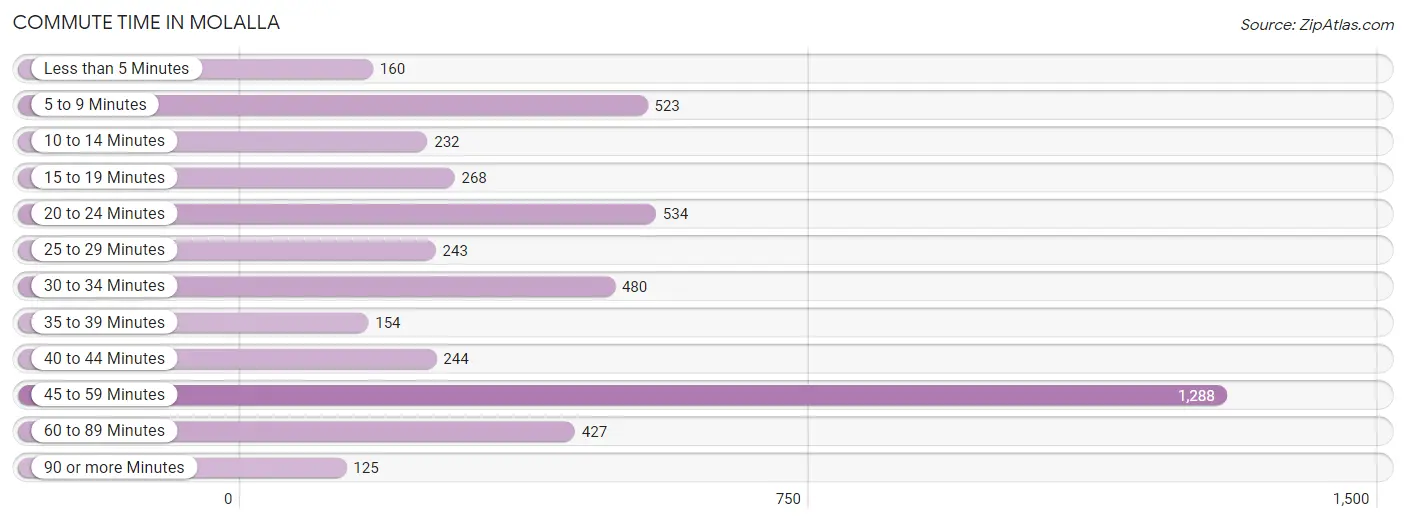
| Commute Time | # Commuters | % Commuters |
| Less than 5 Minutes | 160 | 3.4% |
| 5 to 9 Minutes | 523 | 11.2% |
| 10 to 14 Minutes | 232 | 5.0% |
| 15 to 19 Minutes | 268 | 5.7% |
| 20 to 24 Minutes | 534 | 11.4% |
| 25 to 29 Minutes | 243 | 5.2% |
| 30 to 34 Minutes | 480 | 10.3% |
| 35 to 39 Minutes | 154 | 3.3% |
| 40 to 44 Minutes | 244 | 5.2% |
| 45 to 59 Minutes | 1,288 | 27.5% |
| 60 to 89 Minutes | 427 | 9.1% |
| 90 or more Minutes | 125 | 2.7% |
Commute Time by Sex in Molalla
The most common commute times in Molalla are 45 to 59 minutes (462 commuters, 19.0%) for males and 45 to 59 minutes (826 commuters, 36.8%) for females.
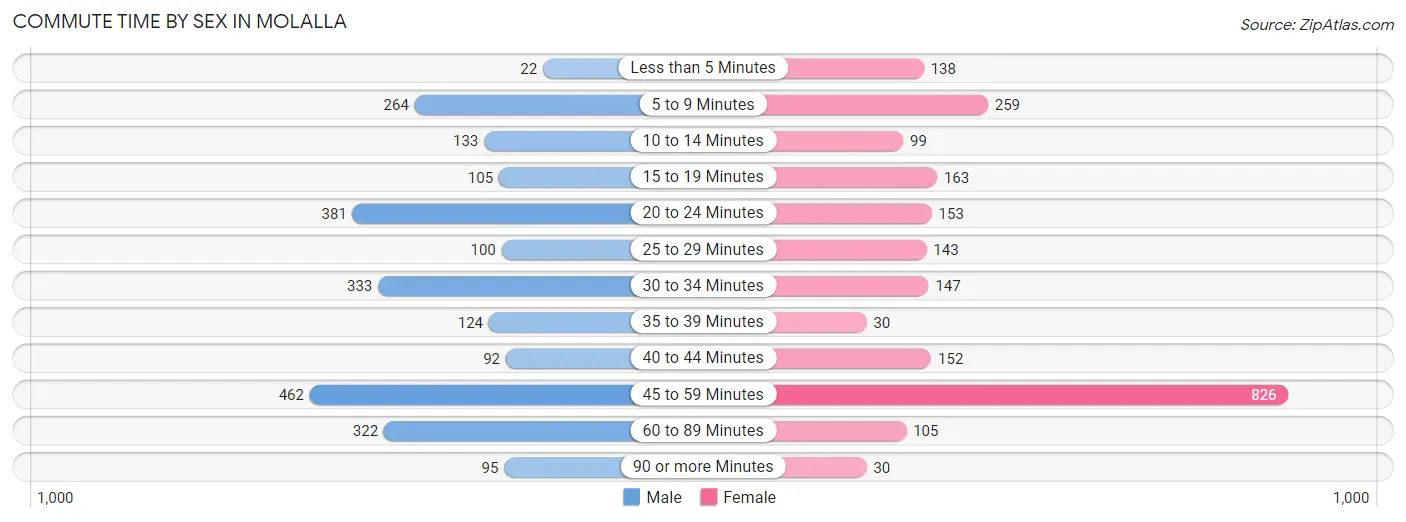
| Commute Time | Male | Female |
| Less than 5 Minutes | 22 (0.9%) | 138 (6.1%) |
| 5 to 9 Minutes | 264 (10.8%) | 259 (11.5%) |
| 10 to 14 Minutes | 133 (5.5%) | 99 (4.4%) |
| 15 to 19 Minutes | 105 (4.3%) | 163 (7.3%) |
| 20 to 24 Minutes | 381 (15.7%) | 153 (6.8%) |
| 25 to 29 Minutes | 100 (4.1%) | 143 (6.4%) |
| 30 to 34 Minutes | 333 (13.7%) | 147 (6.6%) |
| 35 to 39 Minutes | 124 (5.1%) | 30 (1.3%) |
| 40 to 44 Minutes | 92 (3.8%) | 152 (6.8%) |
| 45 to 59 Minutes | 462 (19.0%) | 826 (36.8%) |
| 60 to 89 Minutes | 322 (13.2%) | 105 (4.7%) |
| 90 or more Minutes | 95 (3.9%) | 30 (1.3%) |
Time of Departure to Work by Sex in Molalla
The most frequent times of departure to work in Molalla are 5:30 AM to 5:59 AM (317, 13.0%) for males and 7:00 AM to 7:29 AM (393, 17.5%) for females.
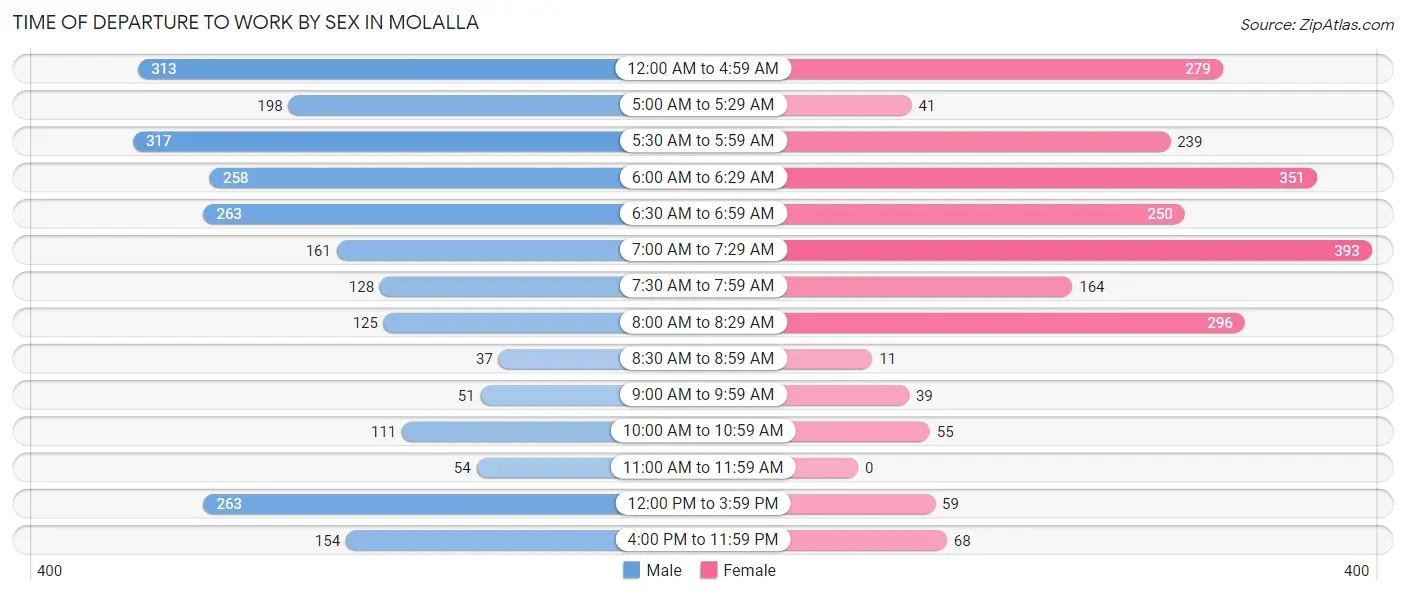
| Time of Departure | Male | Female |
| 12:00 AM to 4:59 AM | 313 (12.9%) | 279 (12.4%) |
| 5:00 AM to 5:29 AM | 198 (8.1%) | 41 (1.8%) |
| 5:30 AM to 5:59 AM | 317 (13.0%) | 239 (10.6%) |
| 6:00 AM to 6:29 AM | 258 (10.6%) | 351 (15.6%) |
| 6:30 AM to 6:59 AM | 263 (10.8%) | 250 (11.1%) |
| 7:00 AM to 7:29 AM | 161 (6.6%) | 393 (17.5%) |
| 7:30 AM to 7:59 AM | 128 (5.3%) | 164 (7.3%) |
| 8:00 AM to 8:29 AM | 125 (5.1%) | 296 (13.2%) |
| 8:30 AM to 8:59 AM | 37 (1.5%) | 11 (0.5%) |
| 9:00 AM to 9:59 AM | 51 (2.1%) | 39 (1.7%) |
| 10:00 AM to 10:59 AM | 111 (4.6%) | 55 (2.5%) |
| 11:00 AM to 11:59 AM | 54 (2.2%) | 0 (0.0%) |
| 12:00 PM to 3:59 PM | 263 (10.8%) | 59 (2.6%) |
| 4:00 PM to 11:59 PM | 154 (6.3%) | 68 (3.0%) |
| Total | 2,433 (100.0%) | 2,245 (100.0%) |
Housing Occupancy in Molalla
Occupancy by Ownership in Molalla
Of the total 3,781 dwellings in Molalla, owner-occupied units account for 2,355 (62.3%), while renter-occupied units make up 1,426 (37.7%).
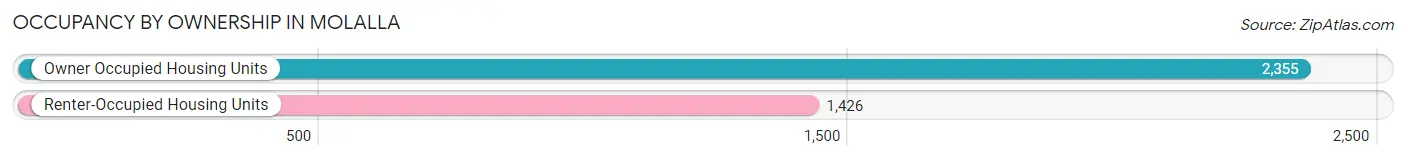
| Occupancy | # Housing Units | % Housing Units |
| Owner Occupied Housing Units | 2,355 | 62.3% |
| Renter-Occupied Housing Units | 1,426 | 37.7% |
| Total Occupied Housing Units | 3,781 | 100.0% |
Occupancy by Household Size in Molalla
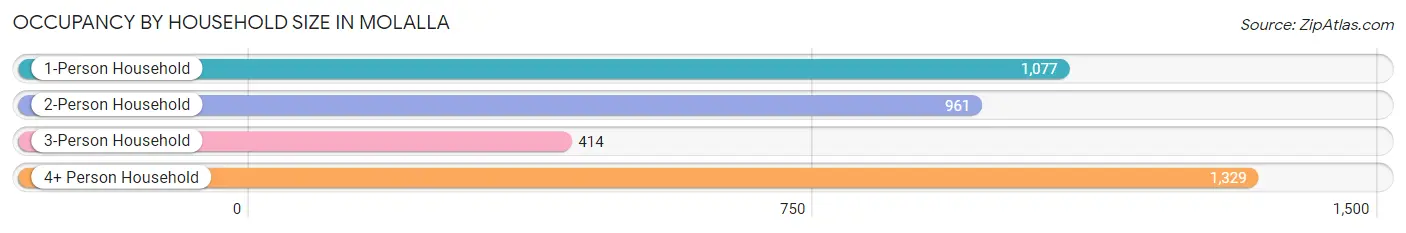
| Household Size | # Housing Units | % Housing Units |
| 1-Person Household | 1,077 | 28.5% |
| 2-Person Household | 961 | 25.4% |
| 3-Person Household | 414 | 11.0% |
| 4+ Person Household | 1,329 | 35.1% |
| Total Housing Units | 3,781 | 100.0% |
Occupancy by Ownership by Household Size in Molalla
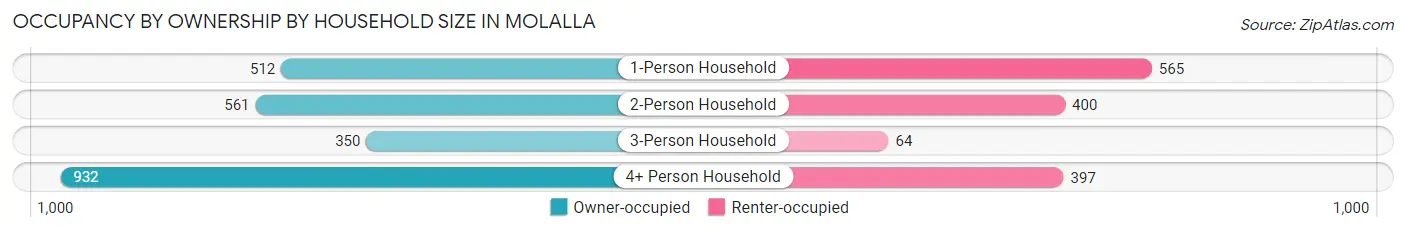
| Household Size | Owner-occupied | Renter-occupied |
| 1-Person Household | 512 (47.5%) | 565 (52.5%) |
| 2-Person Household | 561 (58.4%) | 400 (41.6%) |
| 3-Person Household | 350 (84.5%) | 64 (15.5%) |
| 4+ Person Household | 932 (70.1%) | 397 (29.9%) |
| Total Housing Units | 2,355 (62.3%) | 1,426 (37.7%) |
Occupancy by Educational Attainment in Molalla
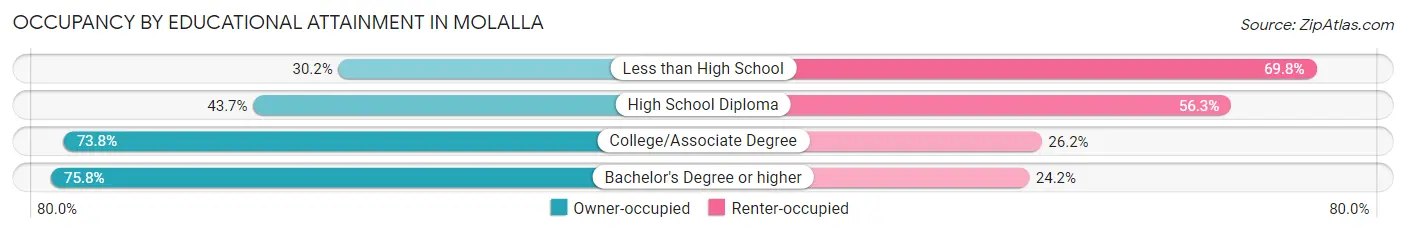
| Household Size | Owner-occupied | Renter-occupied |
| Less than High School | 71 (30.2%) | 164 (69.8%) |
| High School Diploma | 505 (43.7%) | 650 (56.3%) |
| College/Associate Degree | 1,222 (73.8%) | 434 (26.2%) |
| Bachelor's Degree or higher | 557 (75.8%) | 178 (24.2%) |
Occupancy by Age of Householder in Molalla
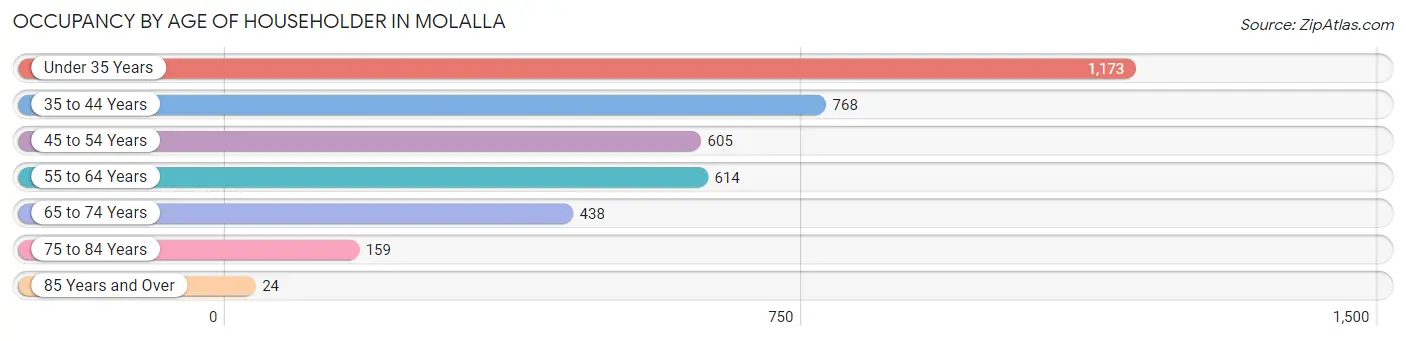
| Age Bracket | # Households | % Households |
| Under 35 Years | 1,173 | 31.0% |
| 35 to 44 Years | 768 | 20.3% |
| 45 to 54 Years | 605 | 16.0% |
| 55 to 64 Years | 614 | 16.2% |
| 65 to 74 Years | 438 | 11.6% |
| 75 to 84 Years | 159 | 4.2% |
| 85 Years and Over | 24 | 0.6% |
| Total | 3,781 | 100.0% |
Housing Finances in Molalla
Median Income by Occupancy in Molalla
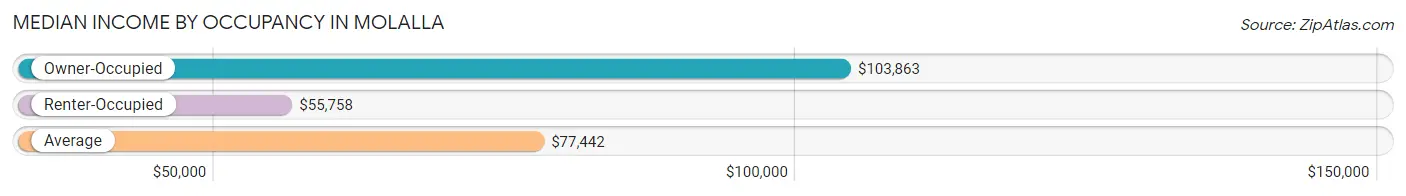
| Occupancy Type | # Households | Median Income |
| Owner-Occupied | 2,355 (62.3%) | $103,863 |
| Renter-Occupied | 1,426 (37.7%) | $55,758 |
| Average | 3,781 (100.0%) | $77,442 |
Occupancy by Householder Income Bracket in Molalla
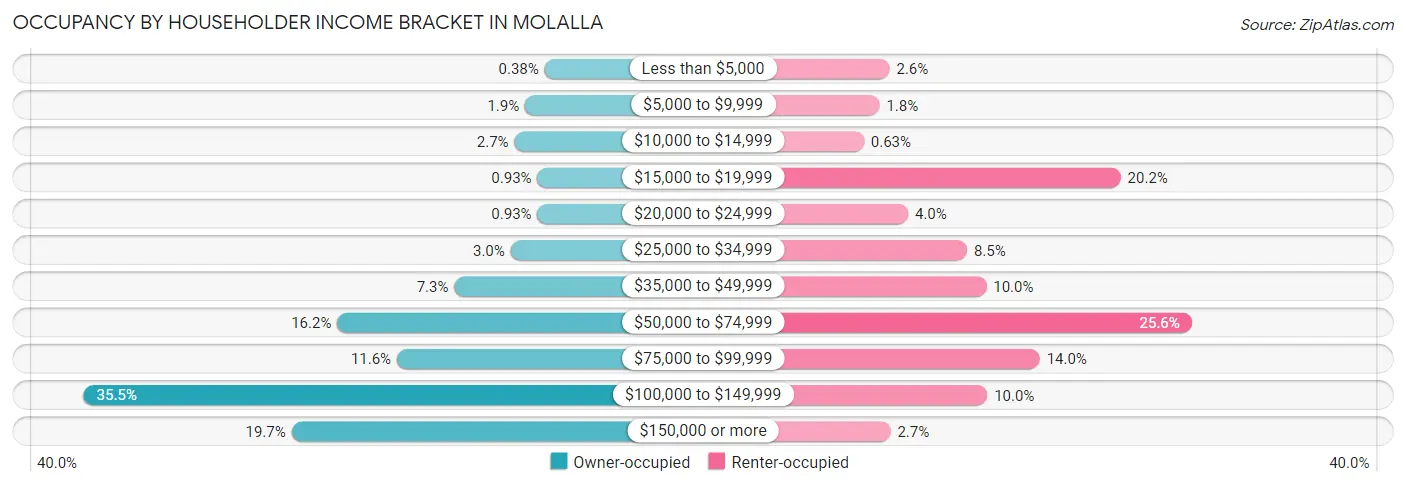
| Income Bracket | Owner-occupied | Renter-occupied |
| Less than $5,000 | 9 (0.4%) | 37 (2.6%) |
| $5,000 to $9,999 | 44 (1.9%) | 26 (1.8%) |
| $10,000 to $14,999 | 63 (2.7%) | 9 (0.6%) |
| $15,000 to $19,999 | 22 (0.9%) | 288 (20.2%) |
| $20,000 to $24,999 | 22 (0.9%) | 57 (4.0%) |
| $25,000 to $34,999 | 70 (3.0%) | 121 (8.5%) |
| $35,000 to $49,999 | 171 (7.3%) | 142 (10.0%) |
| $50,000 to $74,999 | 381 (16.2%) | 365 (25.6%) |
| $75,000 to $99,999 | 274 (11.6%) | 200 (14.0%) |
| $100,000 to $149,999 | 836 (35.5%) | 143 (10.0%) |
| $150,000 or more | 463 (19.7%) | 38 (2.7%) |
| Total | 2,355 (100.0%) | 1,426 (100.0%) |
Monthly Housing Cost Tiers in Molalla
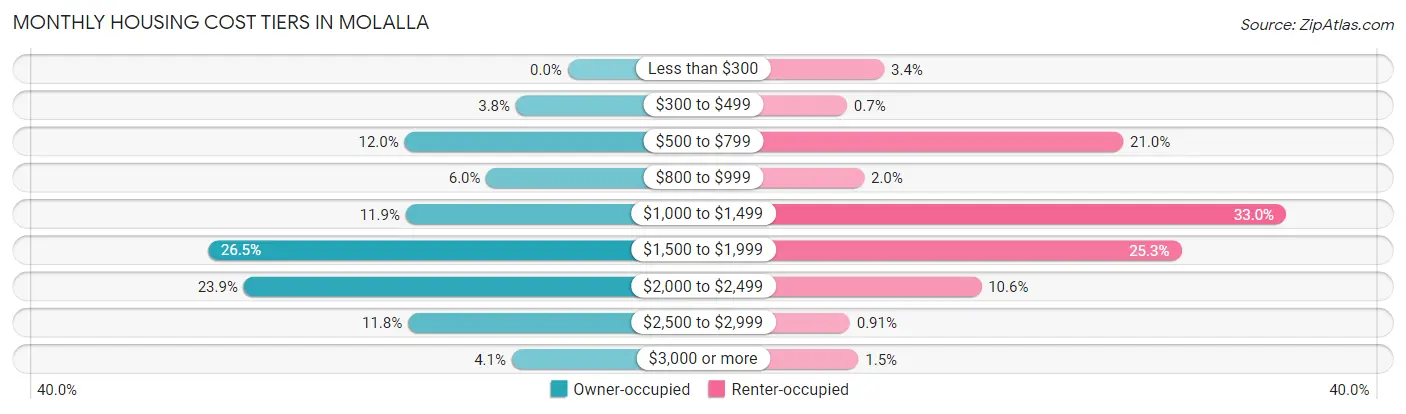
| Monthly Cost | Owner-occupied | Renter-occupied |
| Less than $300 | 0 (0.0%) | 49 (3.4%) |
| $300 to $499 | 90 (3.8%) | 10 (0.7%) |
| $500 to $799 | 283 (12.0%) | 300 (21.0%) |
| $800 to $999 | 141 (6.0%) | 28 (2.0%) |
| $1,000 to $1,499 | 281 (11.9%) | 471 (33.0%) |
| $1,500 to $1,999 | 624 (26.5%) | 361 (25.3%) |
| $2,000 to $2,499 | 562 (23.9%) | 151 (10.6%) |
| $2,500 to $2,999 | 277 (11.8%) | 13 (0.9%) |
| $3,000 or more | 97 (4.1%) | 22 (1.5%) |
| Total | 2,355 (100.0%) | 1,426 (100.0%) |
Physical Housing Characteristics in Molalla
Housing Structures in Molalla
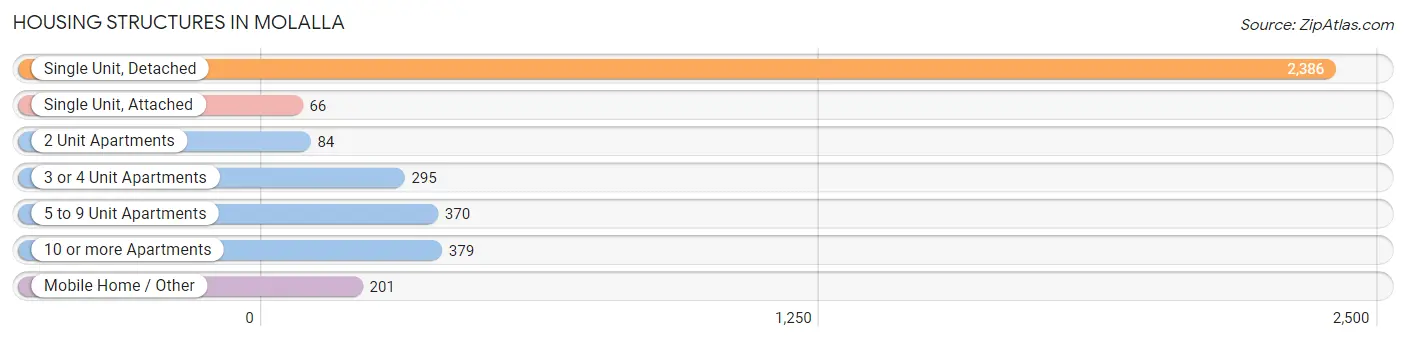
| Structure Type | # Housing Units | % Housing Units |
| Single Unit, Detached | 2,386 | 63.1% |
| Single Unit, Attached | 66 | 1.8% |
| 2 Unit Apartments | 84 | 2.2% |
| 3 or 4 Unit Apartments | 295 | 7.8% |
| 5 to 9 Unit Apartments | 370 | 9.8% |
| 10 or more Apartments | 379 | 10.0% |
| Mobile Home / Other | 201 | 5.3% |
| Total | 3,781 | 100.0% |
Housing Structures by Occupancy in Molalla
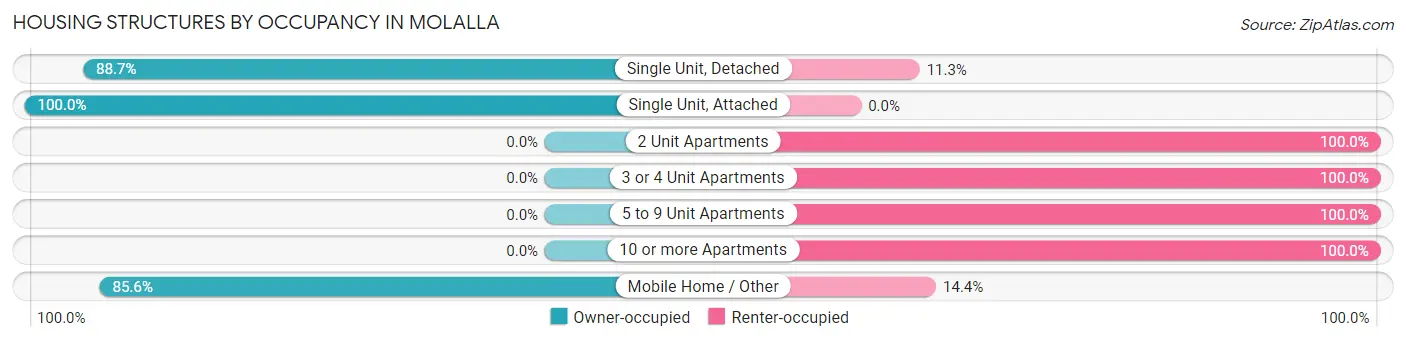
| Structure Type | Owner-occupied | Renter-occupied |
| Single Unit, Detached | 2,117 (88.7%) | 269 (11.3%) |
| Single Unit, Attached | 66 (100.0%) | 0 (0.0%) |
| 2 Unit Apartments | 0 (0.0%) | 84 (100.0%) |
| 3 or 4 Unit Apartments | 0 (0.0%) | 295 (100.0%) |
| 5 to 9 Unit Apartments | 0 (0.0%) | 370 (100.0%) |
| 10 or more Apartments | 0 (0.0%) | 379 (100.0%) |
| Mobile Home / Other | 172 (85.6%) | 29 (14.4%) |
| Total | 2,355 (62.3%) | 1,426 (37.7%) |
Housing Structures by Number of Rooms in Molalla
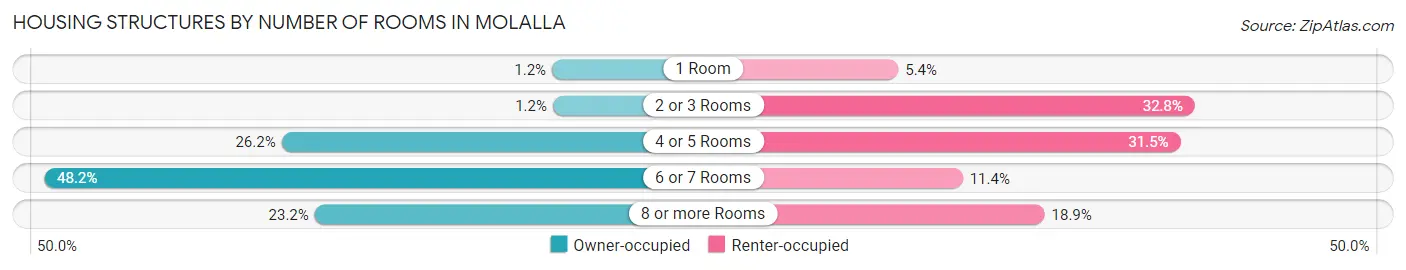
| Number of Rooms | Owner-occupied | Renter-occupied |
| 1 Room | 29 (1.2%) | 77 (5.4%) |
| 2 or 3 Rooms | 27 (1.1%) | 468 (32.8%) |
| 4 or 5 Rooms | 618 (26.2%) | 449 (31.5%) |
| 6 or 7 Rooms | 1,135 (48.2%) | 162 (11.4%) |
| 8 or more Rooms | 546 (23.2%) | 270 (18.9%) |
| Total | 2,355 (100.0%) | 1,426 (100.0%) |
Housing Structure by Heating Type in Molalla
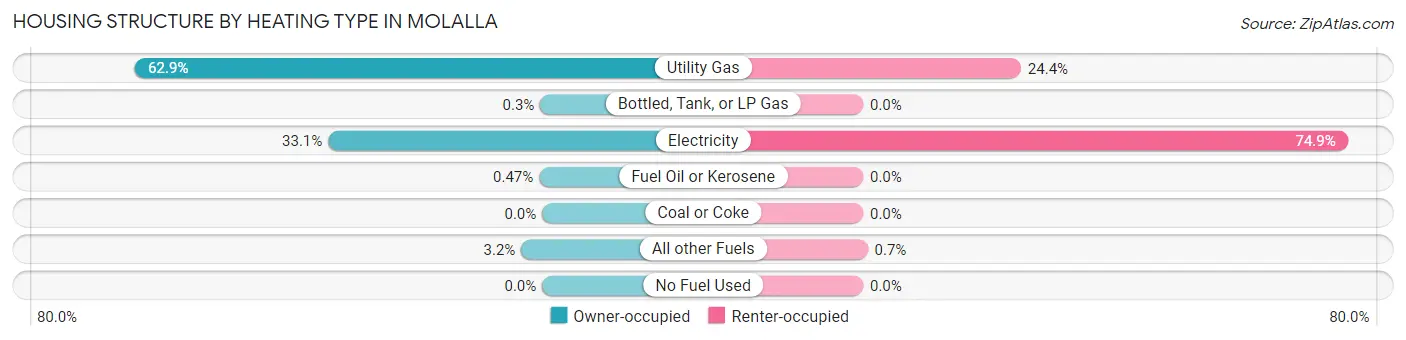
| Heating Type | Owner-occupied | Renter-occupied |
| Utility Gas | 1,482 (62.9%) | 348 (24.4%) |
| Bottled, Tank, or LP Gas | 7 (0.3%) | 0 (0.0%) |
| Electricity | 779 (33.1%) | 1,068 (74.9%) |
| Fuel Oil or Kerosene | 11 (0.5%) | 0 (0.0%) |
| Coal or Coke | 0 (0.0%) | 0 (0.0%) |
| All other Fuels | 76 (3.2%) | 10 (0.7%) |
| No Fuel Used | 0 (0.0%) | 0 (0.0%) |
| Total | 2,355 (100.0%) | 1,426 (100.0%) |
Household Vehicle Usage in Molalla
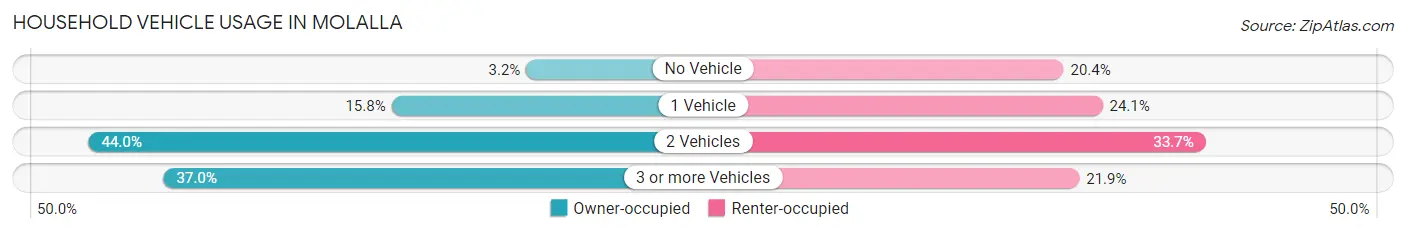
| Vehicles per Household | Owner-occupied | Renter-occupied |
| No Vehicle | 75 (3.2%) | 291 (20.4%) |
| 1 Vehicle | 371 (15.8%) | 343 (24.0%) |
| 2 Vehicles | 1,037 (44.0%) | 480 (33.7%) |
| 3 or more Vehicles | 872 (37.0%) | 312 (21.9%) |
| Total | 2,355 (100.0%) | 1,426 (100.0%) |
Real Estate & Mortgages in Molalla
Real Estate and Mortgage Overview in Molalla
| Characteristic | Without Mortgage | With Mortgage |
| Housing Units | 469 | 1,886 |
| Median Property Value | $330,700 | $393,700 |
| Median Household Income | $52,869 | $428 |
| Monthly Housing Costs | $684 | $97 |
| Real Estate Taxes | $3,140 | $33 |
Property Value by Mortgage Status in Molalla
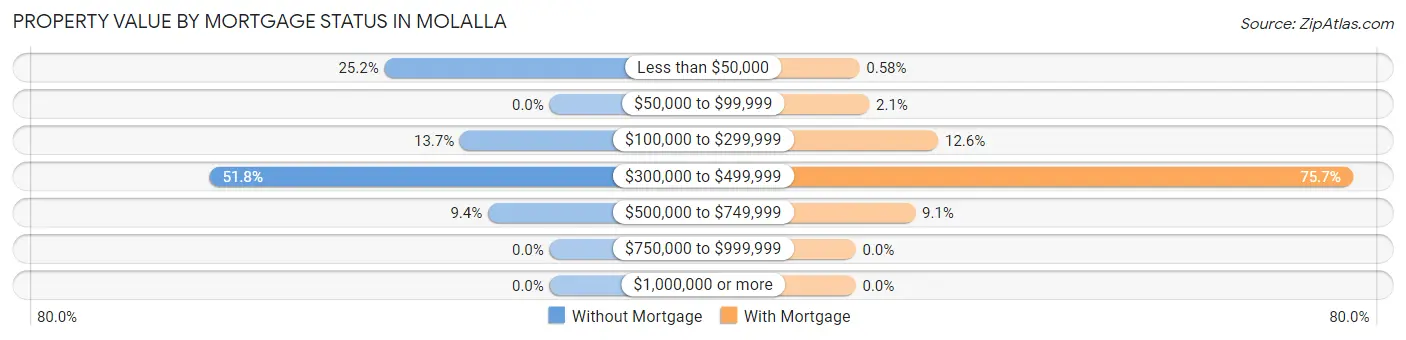
| Property Value | Without Mortgage | With Mortgage |
| Less than $50,000 | 118 (25.2%) | 11 (0.6%) |
| $50,000 to $99,999 | 0 (0.0%) | 39 (2.1%) |
| $100,000 to $299,999 | 64 (13.7%) | 237 (12.6%) |
| $300,000 to $499,999 | 243 (51.8%) | 1,428 (75.7%) |
| $500,000 to $749,999 | 44 (9.4%) | 171 (9.1%) |
| $750,000 to $999,999 | 0 (0.0%) | 0 (0.0%) |
| $1,000,000 or more | 0 (0.0%) | 0 (0.0%) |
| Total | 469 (100.0%) | 1,886 (100.0%) |
Household Income by Mortgage Status in Molalla
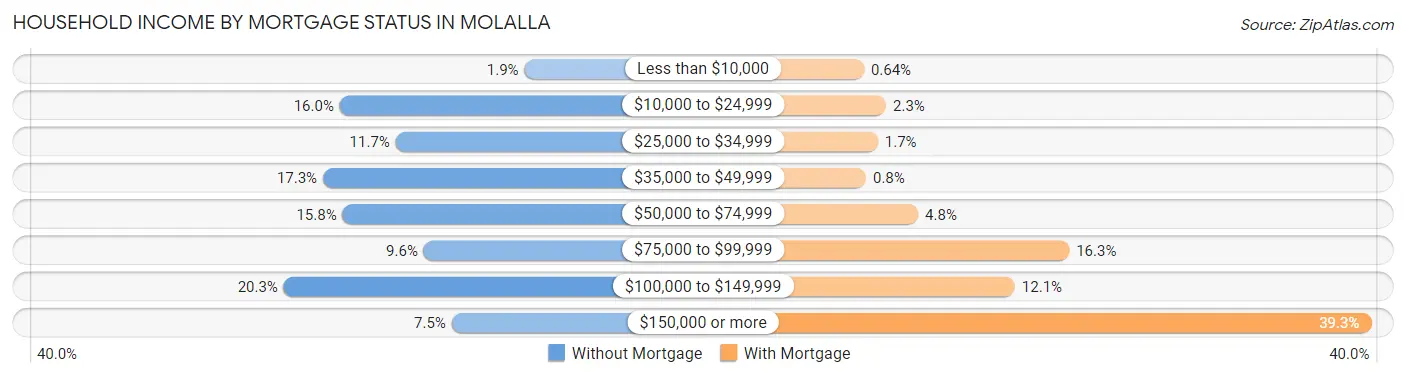
| Household Income | Without Mortgage | With Mortgage |
| Less than $10,000 | 9 (1.9%) | 12 (0.6%) |
| $10,000 to $24,999 | 75 (16.0%) | 44 (2.3%) |
| $25,000 to $34,999 | 55 (11.7%) | 32 (1.7%) |
| $35,000 to $49,999 | 81 (17.3%) | 15 (0.8%) |
| $50,000 to $74,999 | 74 (15.8%) | 90 (4.8%) |
| $75,000 to $99,999 | 45 (9.6%) | 307 (16.3%) |
| $100,000 to $149,999 | 95 (20.3%) | 229 (12.1%) |
| $150,000 or more | 35 (7.5%) | 741 (39.3%) |
| Total | 469 (100.0%) | 1,886 (100.0%) |
Property Value to Household Income Ratio in Molalla
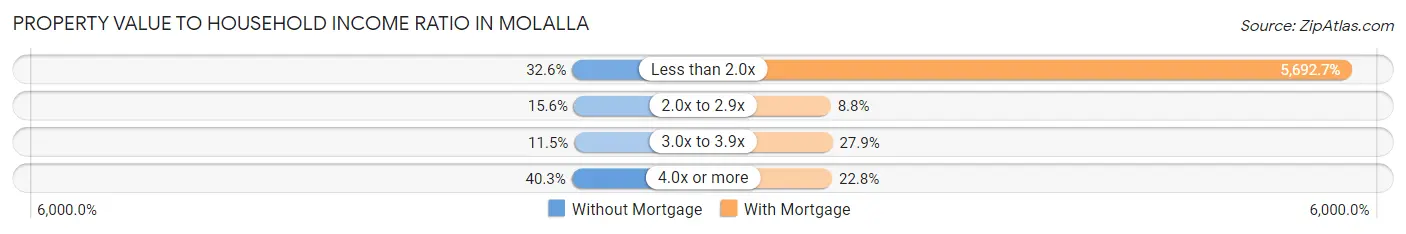
| Value-to-Income Ratio | Without Mortgage | With Mortgage |
| Less than 2.0x | 153 (32.6%) | 107,364 (5,692.7%) |
| 2.0x to 2.9x | 73 (15.6%) | 166 (8.8%) |
| 3.0x to 3.9x | 54 (11.5%) | 526 (27.9%) |
| 4.0x or more | 189 (40.3%) | 430 (22.8%) |
| Total | 469 (100.0%) | 1,886 (100.0%) |
Real Estate Taxes by Mortgage Status in Molalla
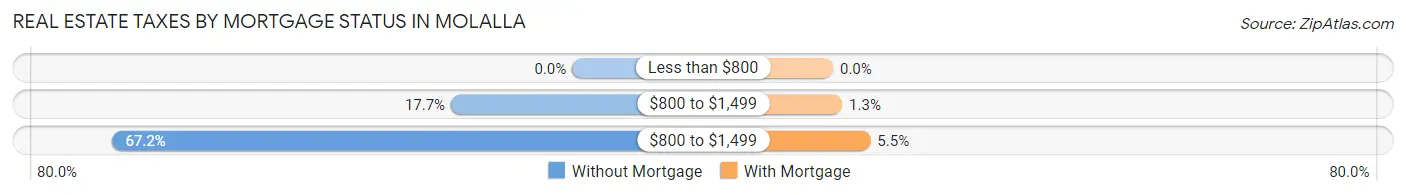
| Property Taxes | Without Mortgage | With Mortgage |
| Less than $800 | 0 (0.0%) | 0 (0.0%) |
| $800 to $1,499 | 83 (17.7%) | 25 (1.3%) |
| $800 to $1,499 | 315 (67.2%) | 103 (5.5%) |
| Total | 469 (100.0%) | 1,886 (100.0%) |
Health & Disability in Molalla
Health Insurance Coverage by Age in Molalla
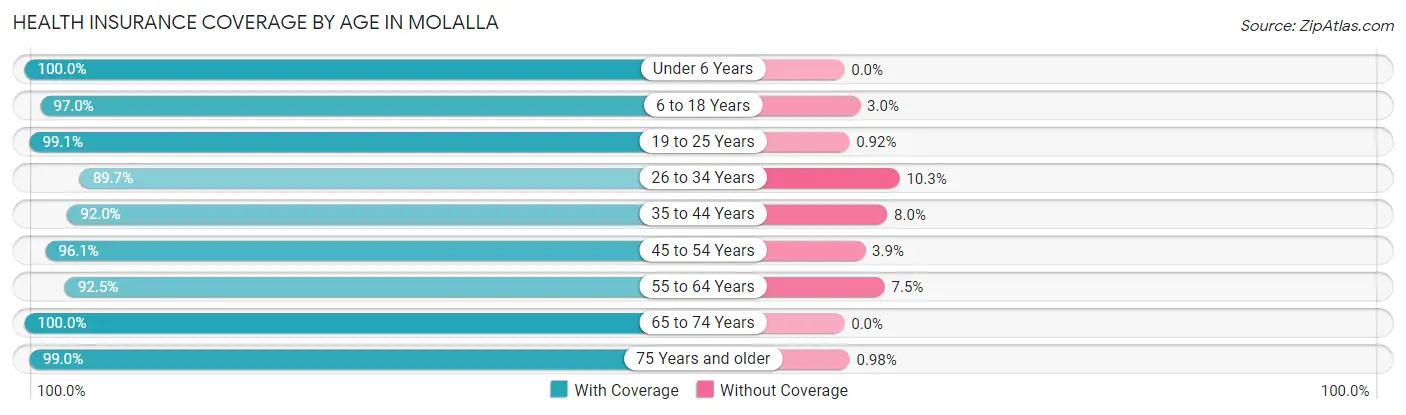
| Age Bracket | With Coverage | Without Coverage |
| Under 6 Years | 657 (100.0%) | 0 (0.0%) |
| 6 to 18 Years | 1,902 (97.0%) | 58 (3.0%) |
| 19 to 25 Years | 1,073 (99.1%) | 10 (0.9%) |
| 26 to 34 Years | 1,569 (89.7%) | 180 (10.3%) |
| 35 to 44 Years | 1,417 (92.0%) | 123 (8.0%) |
| 45 to 54 Years | 1,038 (96.1%) | 42 (3.9%) |
| 55 to 64 Years | 910 (92.5%) | 74 (7.5%) |
| 65 to 74 Years | 703 (100.0%) | 0 (0.0%) |
| 75 Years and older | 304 (99.0%) | 3 (1.0%) |
| Total | 9,573 (95.1%) | 490 (4.9%) |
Health Insurance Coverage by Citizenship Status in Molalla
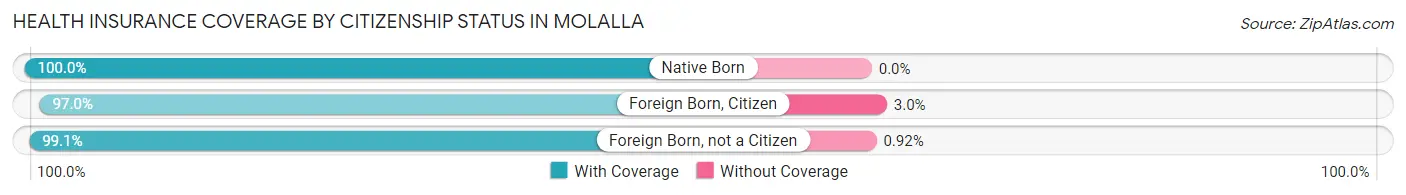
| Citizenship Status | With Coverage | Without Coverage |
| Native Born | 657 (100.0%) | 0 (0.0%) |
| Foreign Born, Citizen | 1,902 (97.0%) | 58 (3.0%) |
| Foreign Born, not a Citizen | 1,073 (99.1%) | 10 (0.9%) |
Health Insurance Coverage by Household Income in Molalla
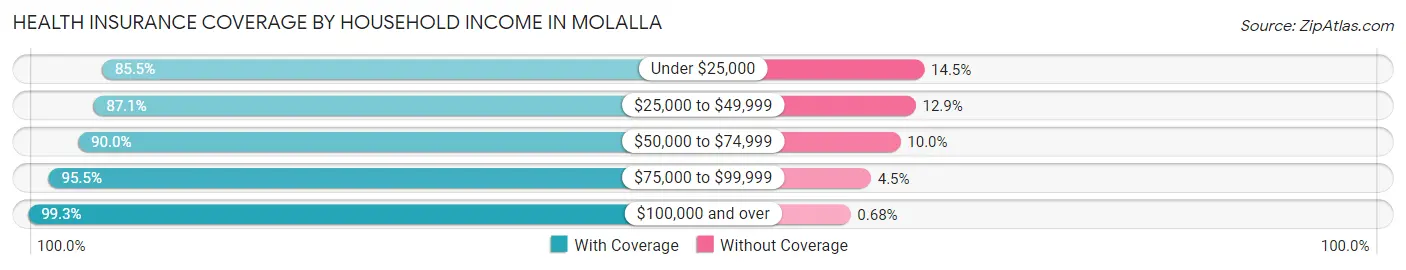
| Household Income | With Coverage | Without Coverage |
| Under $25,000 | 697 (85.5%) | 118 (14.5%) |
| $25,000 to $49,999 | 866 (87.1%) | 128 (12.9%) |
| $50,000 to $74,999 | 1,272 (90.0%) | 142 (10.0%) |
| $75,000 to $99,999 | 1,320 (95.5%) | 62 (4.5%) |
| $100,000 and over | 5,391 (99.3%) | 37 (0.7%) |
Public vs Private Health Insurance Coverage by Age in Molalla
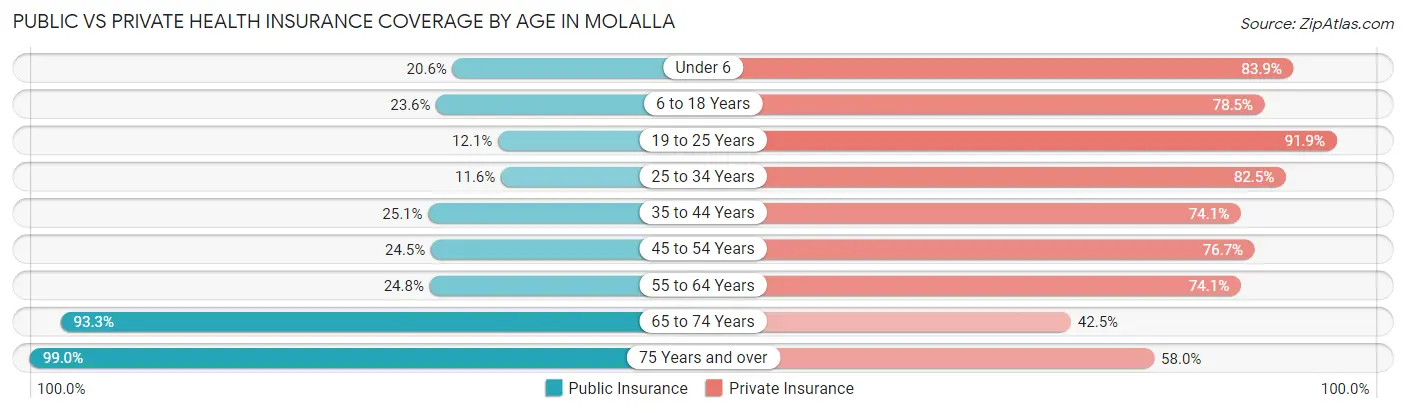
| Age Bracket | Public Insurance | Private Insurance |
| Under 6 | 135 (20.5%) | 551 (83.9%) |
| 6 to 18 Years | 462 (23.6%) | 1,539 (78.5%) |
| 19 to 25 Years | 131 (12.1%) | 995 (91.9%) |
| 25 to 34 Years | 202 (11.6%) | 1,442 (82.5%) |
| 35 to 44 Years | 386 (25.1%) | 1,141 (74.1%) |
| 45 to 54 Years | 265 (24.5%) | 828 (76.7%) |
| 55 to 64 Years | 244 (24.8%) | 729 (74.1%) |
| 65 to 74 Years | 656 (93.3%) | 299 (42.5%) |
| 75 Years and over | 304 (99.0%) | 178 (58.0%) |
| Total | 2,785 (27.7%) | 7,702 (76.5%) |
Disability Status by Sex by Age in Molalla
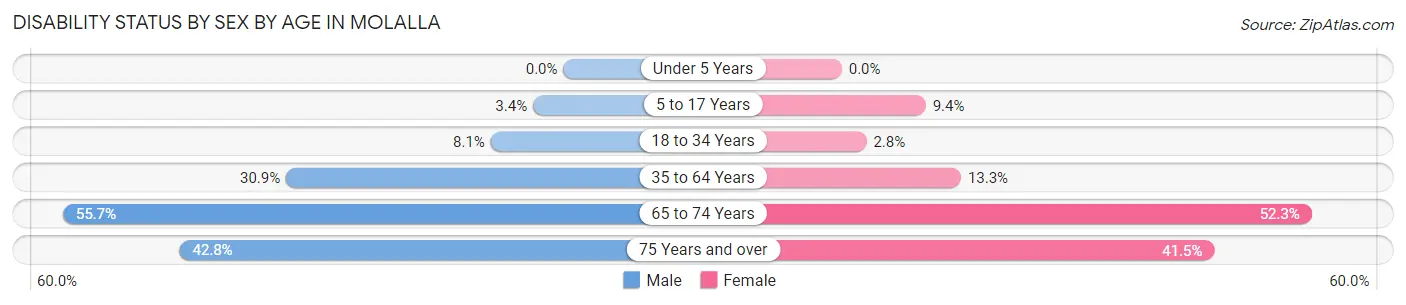
| Age Bracket | Male | Female |
| Under 5 Years | 0 (0.0%) | 0 (0.0%) |
| 5 to 17 Years | 35 (3.4%) | 93 (9.3%) |
| 18 to 34 Years | 107 (8.1%) | 43 (2.8%) |
| 35 to 64 Years | 601 (30.9%) | 220 (13.3%) |
| 65 to 74 Years | 165 (55.7%) | 213 (52.3%) |
| 75 Years and over | 56 (42.7%) | 73 (41.5%) |
Disability Class by Sex by Age in Molalla
Disability Class: Hearing Difficulty
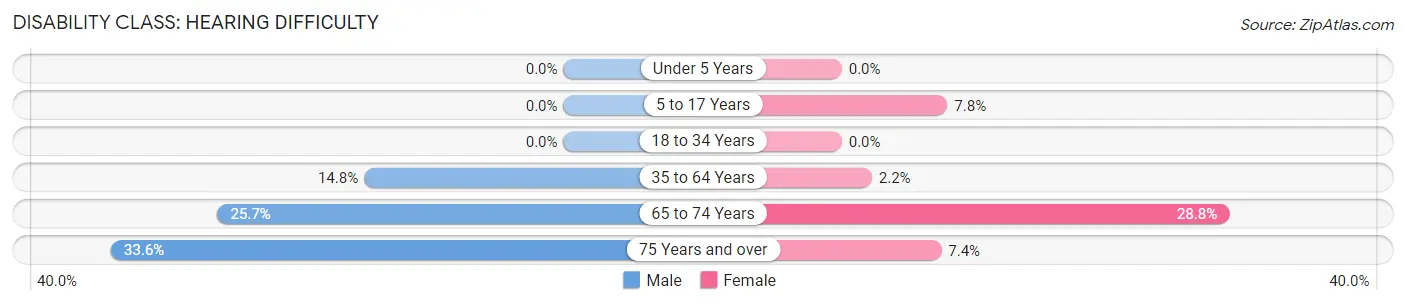
| Age Bracket | Male | Female |
| Under 5 Years | 0 (0.0%) | 0 (0.0%) |
| 5 to 17 Years | 0 (0.0%) | 78 (7.8%) |
| 18 to 34 Years | 0 (0.0%) | 0 (0.0%) |
| 35 to 64 Years | 288 (14.8%) | 37 (2.2%) |
| 65 to 74 Years | 76 (25.7%) | 117 (28.7%) |
| 75 Years and over | 44 (33.6%) | 13 (7.4%) |
Disability Class: Vision Difficulty
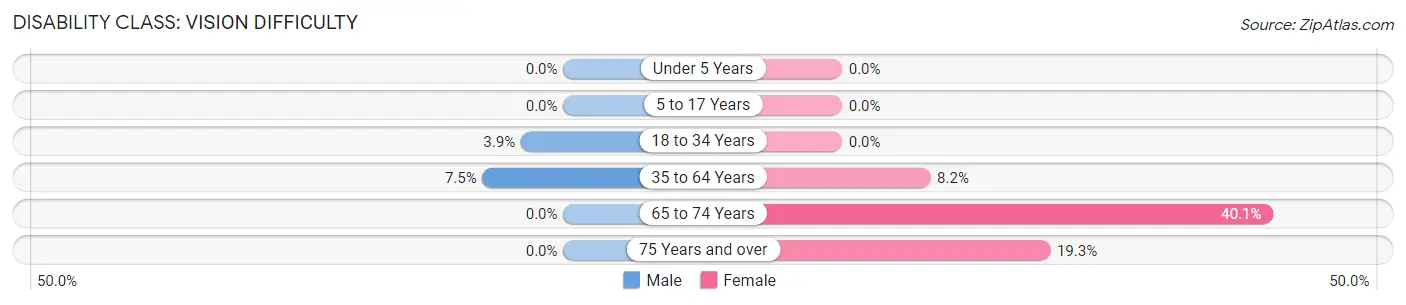
| Age Bracket | Male | Female |
| Under 5 Years | 0 (0.0%) | 0 (0.0%) |
| 5 to 17 Years | 0 (0.0%) | 0 (0.0%) |
| 18 to 34 Years | 52 (3.9%) | 0 (0.0%) |
| 35 to 64 Years | 146 (7.5%) | 136 (8.2%) |
| 65 to 74 Years | 0 (0.0%) | 163 (40.1%) |
| 75 Years and over | 0 (0.0%) | 34 (19.3%) |
Disability Class: Cognitive Difficulty
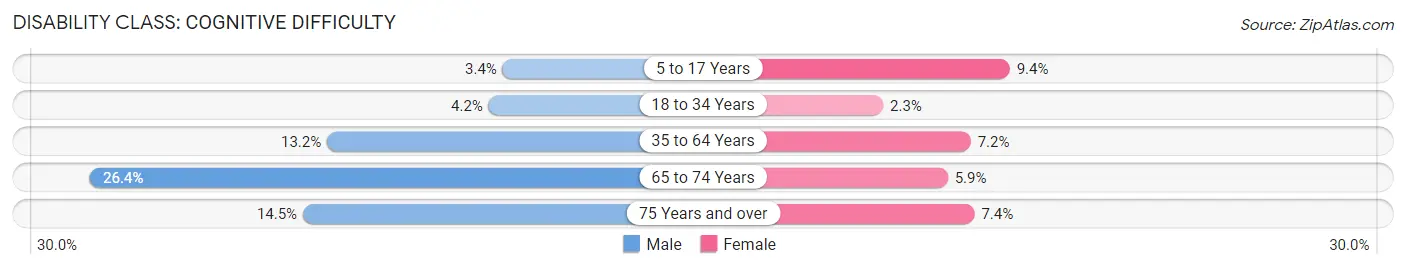
| Age Bracket | Male | Female |
| 5 to 17 Years | 35 (3.4%) | 93 (9.3%) |
| 18 to 34 Years | 55 (4.2%) | 36 (2.3%) |
| 35 to 64 Years | 256 (13.2%) | 119 (7.2%) |
| 65 to 74 Years | 78 (26.4%) | 24 (5.9%) |
| 75 Years and over | 19 (14.5%) | 13 (7.4%) |
Disability Class: Ambulatory Difficulty
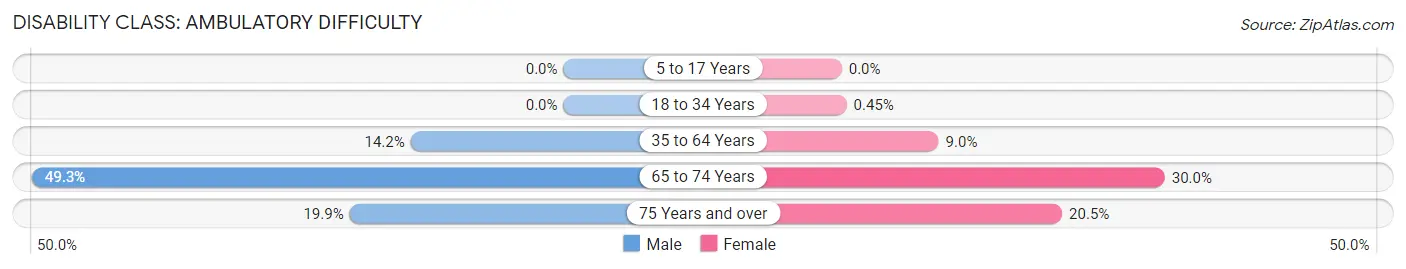
| Age Bracket | Male | Female |
| 5 to 17 Years | 0 (0.0%) | 0 (0.0%) |
| 18 to 34 Years | 0 (0.0%) | 7 (0.4%) |
| 35 to 64 Years | 276 (14.2%) | 149 (9.0%) |
| 65 to 74 Years | 146 (49.3%) | 122 (30.0%) |
| 75 Years and over | 26 (19.9%) | 36 (20.4%) |
Disability Class: Self-Care Difficulty
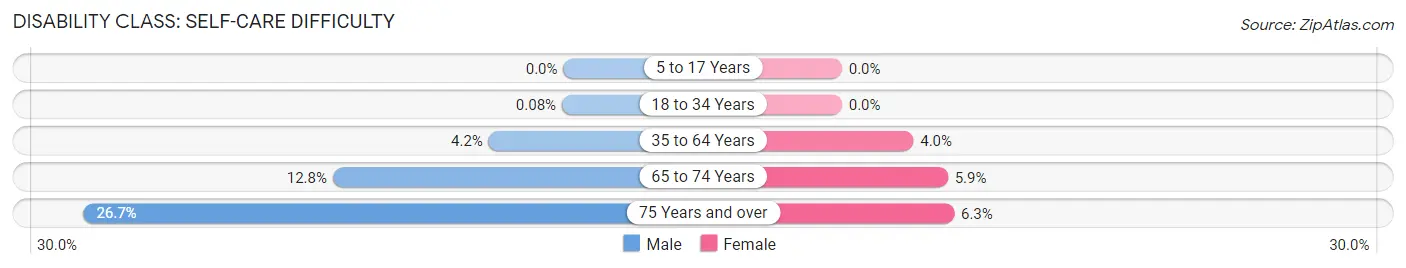
| Age Bracket | Male | Female |
| 5 to 17 Years | 0 (0.0%) | 0 (0.0%) |
| 18 to 34 Years | 1 (0.1%) | 0 (0.0%) |
| 35 to 64 Years | 81 (4.2%) | 66 (4.0%) |
| 65 to 74 Years | 38 (12.8%) | 24 (5.9%) |
| 75 Years and over | 35 (26.7%) | 11 (6.2%) |
Technology Access in Molalla
Computing Device Access in Molalla
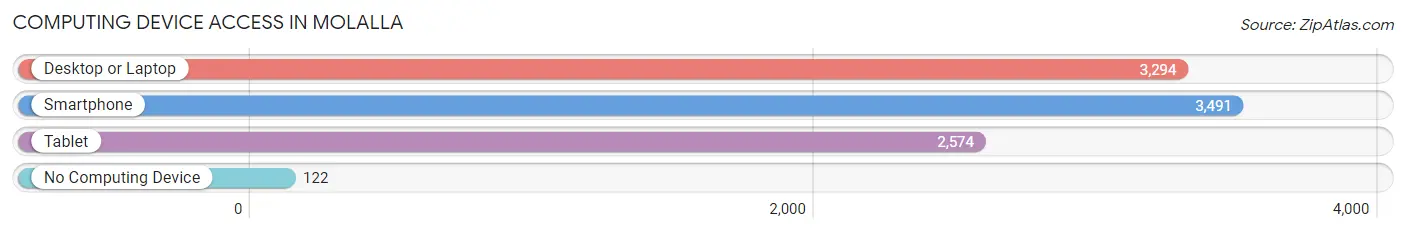
| Device Type | # Households | % Households |
| Desktop or Laptop | 3,294 | 87.1% |
| Smartphone | 3,491 | 92.3% |
| Tablet | 2,574 | 68.1% |
| No Computing Device | 122 | 3.2% |
| Total | 3,781 | 100.0% |
Internet Access in Molalla
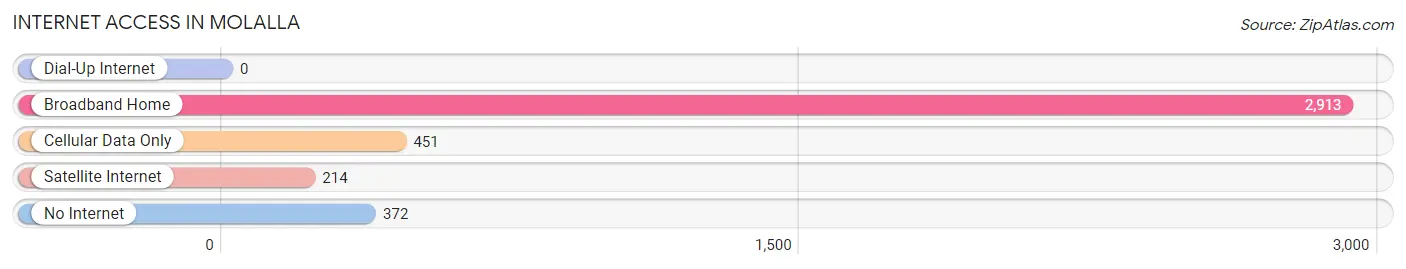
| Internet Type | # Households | % Households |
| Dial-Up Internet | 0 | 0.0% |
| Broadband Home | 2,913 | 77.0% |
| Cellular Data Only | 451 | 11.9% |
| Satellite Internet | 214 | 5.7% |
| No Internet | 372 | 9.8% |
| Total | 3,781 | 100.0% |
Molalla Summary
Molalla is a city located in Clackamas County, Oregon, United States. It is situated in the foothills of the Cascade Mountains, approximately 30 miles south of Portland. The population was 8,108 at the 2010 census.
History
Molalla was first settled in 1844 by a group of settlers from the Willamette Valley. The town was named after the Molalla River, which was named after the Molalla Indians, who were the original inhabitants of the area. The Molalla Indians were a peaceful tribe who lived in the area for centuries before the arrival of the settlers.
The first post office in Molalla was established in 1851. In 1853, the first school was built in the town. In 1854, the first church was built.
In 1856, the first sawmill was built in Molalla. This sawmill was the first of many that would be built in the area, as the timber industry became an important part of the local economy.
In 1858 the first newspaper the Molalla Pioneer was established
In 1864, the first bridge was built across the Molalla River. This bridge was the first of many that would be built in the area, as the town grew and developed.
In 1871, the first railroad was built in Molalla. This railroad connected the town to Portland and other cities in the Willamette Valley.
In 1876 the first bank was established in Molalla
In 1877 the first telephone line was established in Molalla
In 1878 the first fire department was established in Molalla
In 1883 the first electric lights were installed in Molalla
In 1884 the first water system was established in Molalla
In 1885 the first public library was established in Molalla
In 1887 the first hospital was established in Molalla
In 1889 the first high school was established in Molalla
In 1890 the first bank building was constructed in Molalla
In 1891 the first newspaper the Molalla Pioneer was published
In 1892 the first telephone exchange was established in Molalla
In 1893 the first public park was established in Molalla
In 1895 the first electric streetcar line was established in Molalla
In 1896 the first movie theater was established in Molalla
In 1898 the first automobile was registered in Molalla
In 1900 the population of Molalla was 1 092
Geography
Molalla is located in the foothills of the Cascade Mountains, approximately 30 miles south of Portland. The city is situated on the Molalla River, which flows through the city and is a tributary of the Willamette River. The city is surrounded by rolling hills and forests, and is located at an elevation of 830 feet.
The climate in Molalla is mild and temperate, with warm summers and cool winters. The average annual temperature is 54 degrees Fahrenheit, and the average annual precipitation is 44 inches.
Economy
Molalla’s economy is largely based on the timber industry. The city is home to several sawmills and lumber companies, as well as a number of other businesses related to the timber industry.
In addition to the timber industry, Molalla is also home to a number of other businesses, including manufacturing, retail, and service industries. The city is also home to a number of small businesses, including restaurants, shops, and other services.
Demographics
As of the 2010 census, the population of Molalla was 8,108. The racial makeup of the city was 91.3% White, 0.7% African American, 1.2% Native American, 0.7% Asian, 0.1% Pacific Islander, 2.3% from other races, and 3.9% from two or more races. Hispanic or Latino of any race were 6.2% of the population.
The median household income in Molalla was $45,945, and the median family income was $51,945. The per capita income in Molalla was $20,945. About 11.3% of families and 14.2% of the population were below the poverty line, including 19.2% of those under age 18 and 8.2% of those age 65 or over.
Common Questions
What is Per Capita Income in Molalla?
Per Capita income in Molalla is $33,627.
What is the Median Family Income in Molalla?
Median Family Income in Molalla is $99,167.
What is the Median Household income in Molalla?
Median Household Income in Molalla is $77,442.
What is Income or Wage Gap in Molalla?
Income or Wage Gap in Molalla is 17.4%.
Women in Molalla earn 82.6 cents for every dollar earned by a man.
What is Inequality or Gini Index in Molalla?
Inequality or Gini Index in Molalla is 0.38.
What is the Total Population of Molalla?
Total Population of Molalla is 10,147.
What is the Total Male Population of Molalla?
Total Male Population of Molalla is 5,015.
What is the Total Female Population of Molalla?
Total Female Population of Molalla is 5,132.
What is the Ratio of Males per 100 Females in Molalla?
There are 97.72 Males per 100 Females in Molalla.
What is the Ratio of Females per 100 Males in Molalla?
There are 102.33 Females per 100 Males in Molalla.
What is the Median Population Age in Molalla?
Median Population Age in Molalla is 33.6 Years.
What is the Average Family Size in Molalla
Average Family Size in Molalla is 3.2 People.
What is the Average Household Size in Molalla
Average Household Size in Molalla is 2.7 People.
How Large is the Labor Force in Molalla?
There are 5,753 People in the Labor Forcein in Molalla.
What is the Percentage of People in the Labor Force in Molalla?
73.6% of People are in the Labor Force in Molalla.
What is the Unemployment Rate in Molalla?
Unemployment Rate in Molalla is 7.0%.