Prineville, OR Map & Demographics
Prineville Map
Prineville Overview
$29,991
PER CAPITA INCOME
$71,370
AVG FAMILY INCOME
$63,904
AVG HOUSEHOLD INCOME
25.1%
WAGE / INCOME GAP [ % ]
74.9¢/ $1
WAGE / INCOME GAP [ $ ]
0.37
INEQUALITY / GINI INDEX
10,915
TOTAL POPULATION
5,337
MALE POPULATION
5,578
FEMALE POPULATION
95.68
MALES / 100 FEMALES
104.52
FEMALES / 100 MALES
40.7
MEDIAN AGE
2.8
AVG FAMILY SIZE
2.3
AVG HOUSEHOLD SIZE
5,410
LABOR FORCE [ PEOPLE ]
61.1%
PERCENT IN LABOR FORCE
6.4%
UNEMPLOYMENT RATE
Prineville Zip Codes
Prineville Area Codes
Income in Prineville
Income Overview in Prineville
Per Capita Income in Prineville is $29,991, while median incomes of families and households are $71,370 and $63,904 respectively.
| Characteristic | Number | Measure |
| Per Capita Income | 10,915 | $29,991 |
| Median Family Income | 3,010 | $71,370 |
| Mean Family Income | 3,010 | $74,842 |
| Median Household Income | 4,612 | $63,904 |
| Mean Household Income | 4,612 | $67,555 |
| Income Deficit | 3,010 | $0 |
| Wage / Income Gap (%) | 10,915 | 25.08% |
| Wage / Income Gap ($) | 10,915 | 74.92¢ per $1 |
| Gini / Inequality Index | 10,915 | 0.37 |
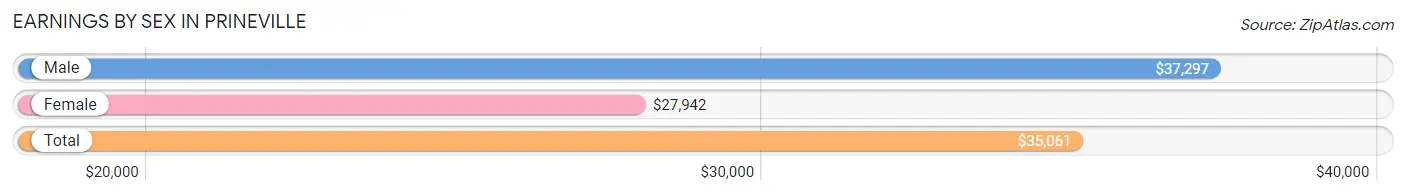
Earnings by Sex in Prineville
Average Earnings in Prineville are $35,061, $37,297 for men and $27,942 for women, a difference of 25.1%.
| Sex | Number | Average Earnings |
| Male | 2,991 (52.8%) | $37,297 |
| Female | 2,673 (47.2%) | $27,942 |
| Total | 5,664 (100.0%) | $35,061 |
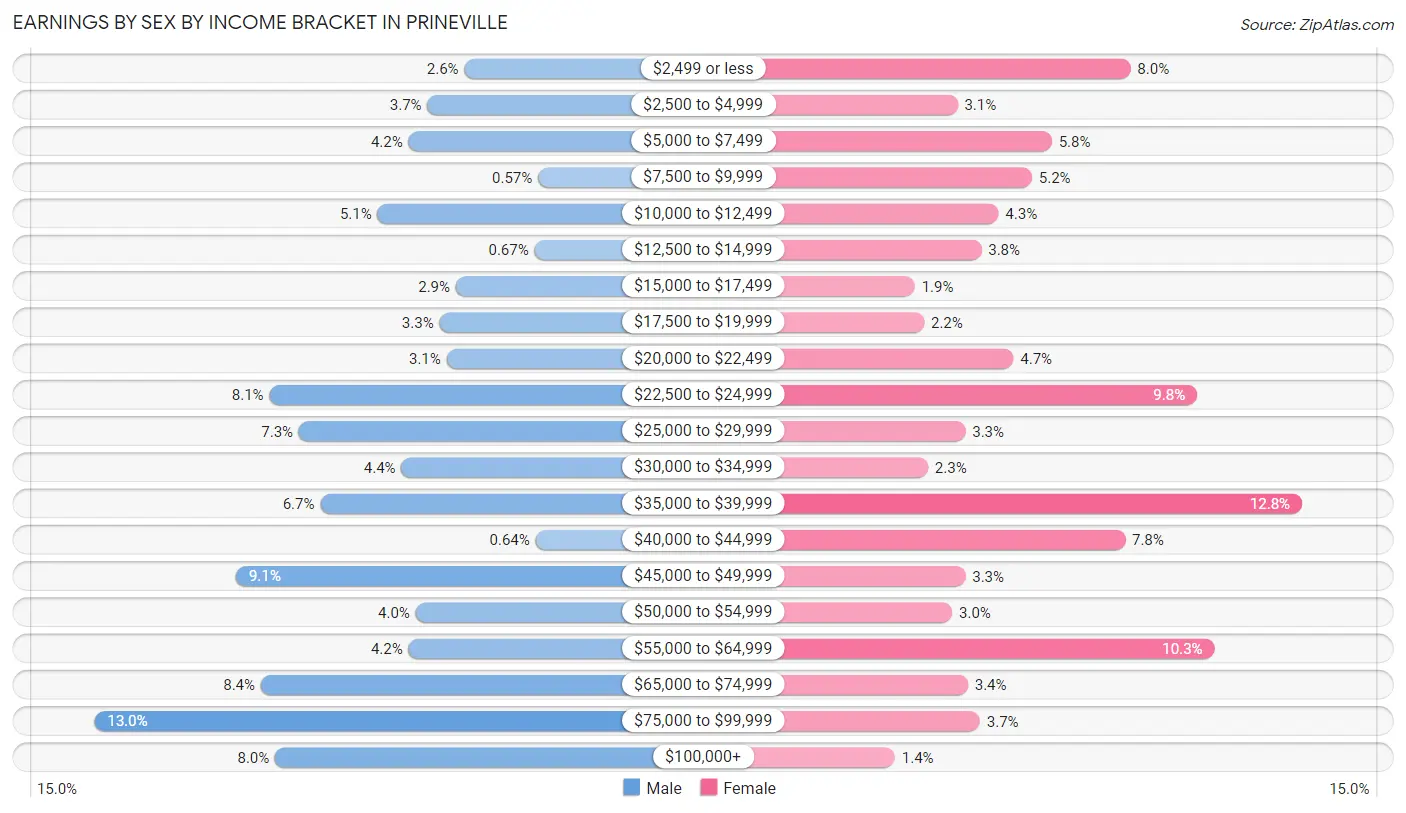
Earnings by Sex by Income Bracket in Prineville
The most common earnings brackets in Prineville are $75,000 to $99,999 for men (390 | 13.0%) and $35,000 to $39,999 for women (342 | 12.8%).
| Income | Male | Female |
| $2,499 or less | 79 (2.6%) | 213 (8.0%) |
| $2,500 to $4,999 | 110 (3.7%) | 83 (3.1%) |
| $5,000 to $7,499 | 126 (4.2%) | 154 (5.8%) |
| $7,500 to $9,999 | 17 (0.6%) | 139 (5.2%) |
| $10,000 to $12,499 | 152 (5.1%) | 114 (4.3%) |
| $12,500 to $14,999 | 20 (0.7%) | 101 (3.8%) |
| $15,000 to $17,499 | 86 (2.9%) | 51 (1.9%) |
| $17,500 to $19,999 | 100 (3.3%) | 58 (2.2%) |
| $20,000 to $22,499 | 94 (3.1%) | 125 (4.7%) |
| $22,500 to $24,999 | 243 (8.1%) | 263 (9.8%) |
| $25,000 to $29,999 | 218 (7.3%) | 89 (3.3%) |
| $30,000 to $34,999 | 132 (4.4%) | 61 (2.3%) |
| $35,000 to $39,999 | 200 (6.7%) | 342 (12.8%) |
| $40,000 to $44,999 | 19 (0.6%) | 209 (7.8%) |
| $45,000 to $49,999 | 271 (9.1%) | 89 (3.3%) |
| $50,000 to $54,999 | 120 (4.0%) | 79 (3.0%) |
| $55,000 to $64,999 | 126 (4.2%) | 276 (10.3%) |
| $65,000 to $74,999 | 250 (8.4%) | 91 (3.4%) |
| $75,000 to $99,999 | 390 (13.0%) | 100 (3.7%) |
| $100,000+ | 238 (8.0%) | 36 (1.3%) |
| Total | 2,991 (100.0%) | 2,673 (100.0%) |
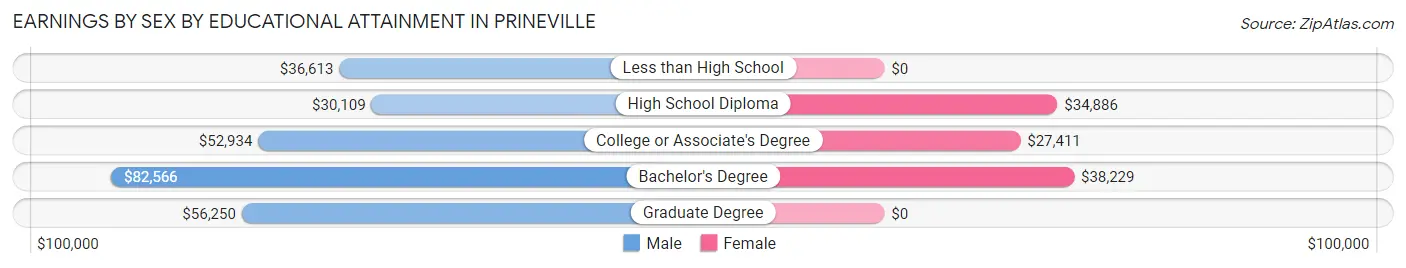
Earnings by Sex by Educational Attainment in Prineville
Average earnings in Prineville are $45,508 for men and $37,525 for women, a difference of 17.5%. Men with an educational attainment of bachelor's degree enjoy the highest average annual earnings of $82,566, while those with high school diploma education earn the least with $30,109. Women with an educational attainment of bachelor's degree earn the most with the average annual earnings of $38,229, while those with college or associate's degree education have the smallest earnings of $27,411.
| Educational Attainment | Male Income | Female Income |
| Less than High School | $36,613 | $0 |
| High School Diploma | $30,109 | $34,886 |
| College or Associate's Degree | $52,934 | $27,411 |
| Bachelor's Degree | $82,566 | $38,229 |
| Graduate Degree | $56,250 | $0 |
| Total | $45,508 | $37,525 |
Family Income in Prineville
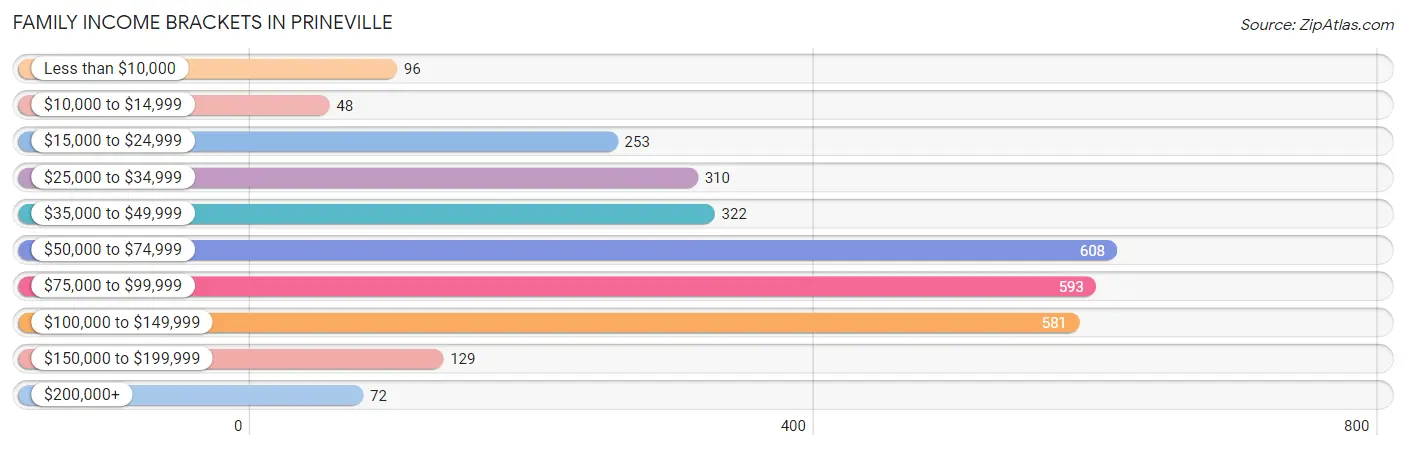
Family Income Brackets in Prineville
According to the Prineville family income data, there are 608 families falling into the $50,000 to $74,999 income range, which is the most common income bracket and makes up 20.2% of all families. Conversely, the $10,000 to $14,999 income bracket is the least frequent group with only 48 families (1.6%) belonging to this category.
| Income Bracket | # Families | % Families |
| Less than $10,000 | 96 | 3.2% |
| $10,000 to $14,999 | 48 | 1.6% |
| $15,000 to $24,999 | 253 | 8.4% |
| $25,000 to $34,999 | 310 | 10.3% |
| $35,000 to $49,999 | 322 | 10.7% |
| $50,000 to $74,999 | 608 | 20.2% |
| $75,000 to $99,999 | 593 | 19.7% |
| $100,000 to $149,999 | 581 | 19.3% |
| $150,000 to $199,999 | 129 | 4.3% |
| $200,000+ | 72 | 2.4% |
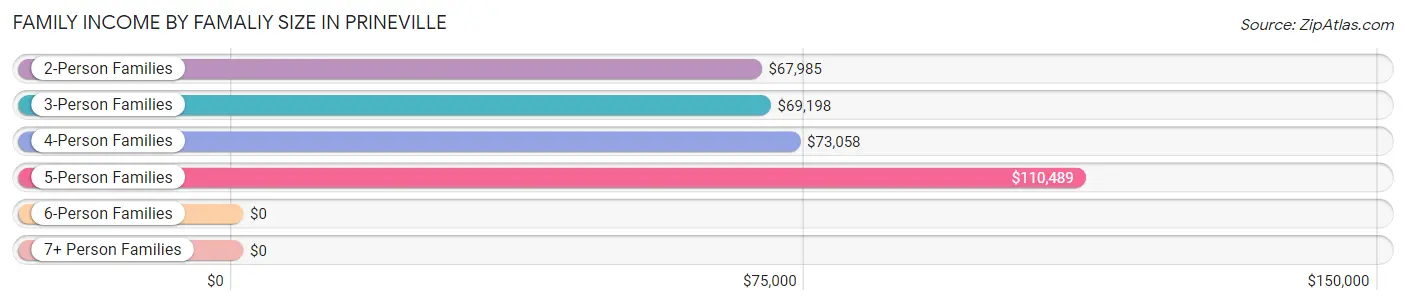
Family Income by Famaliy Size in Prineville
5-person families (90 | 3.0%) account for the highest median family income in Prineville with $110,489 per family, while 2-person families (1,643 | 54.6%) have the highest median income of $33,992 per family member.
| Income Bracket | # Families | Median Income |
| 2-Person Families | 1,643 (54.6%) | $67,985 |
| 3-Person Families | 663 (22.0%) | $69,198 |
| 4-Person Families | 525 (17.4%) | $73,058 |
| 5-Person Families | 90 (3.0%) | $110,489 |
| 6-Person Families | 63 (2.1%) | $0 |
| 7+ Person Families | 26 (0.9%) | $0 |
| Total | 3,010 (100.0%) | $71,370 |
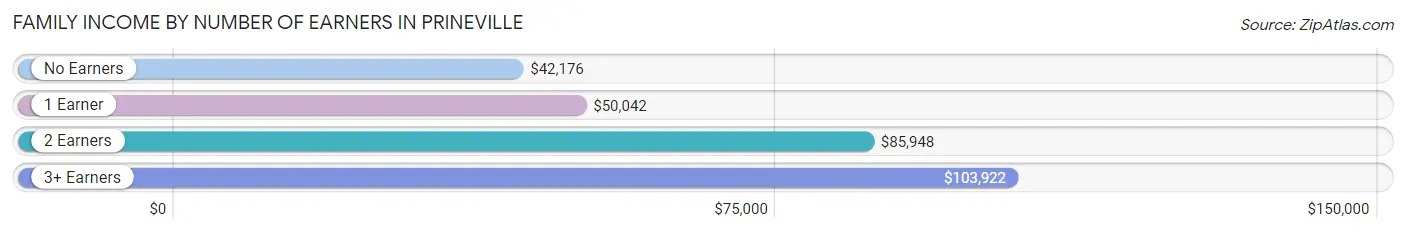
Family Income by Number of Earners in Prineville
The median family income in Prineville is $71,370, with families comprising 3+ earners (287) having the highest median family income of $103,922, while families with no earners (483) have the lowest median family income of $42,176, accounting for 9.5% and 16.1% of families, respectively.
| Number of Earners | # Families | Median Income |
| No Earners | 483 (16.1%) | $42,176 |
| 1 Earner | 1,188 (39.5%) | $50,042 |
| 2 Earners | 1,052 (34.9%) | $85,948 |
| 3+ Earners | 287 (9.5%) | $103,922 |
| Total | 3,010 (100.0%) | $71,370 |
Household Income in Prineville
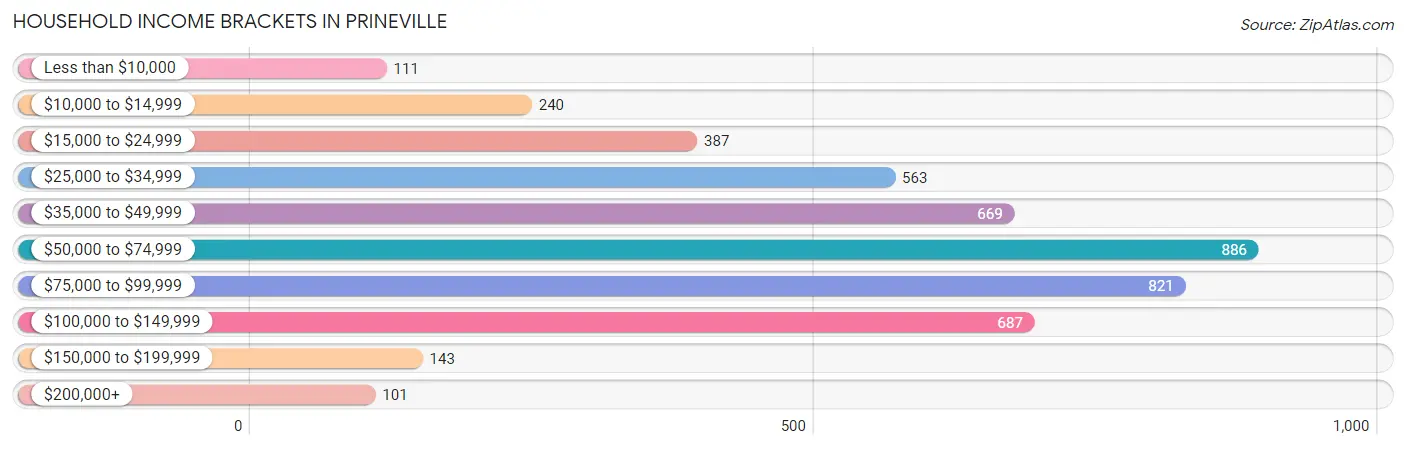
Household Income Brackets in Prineville
With 886 households falling in the category, the $50,000 to $74,999 income range is the most frequent in Prineville, accounting for 19.2% of all households. In contrast, only 101 households (2.2%) fall into the $200,000+ income bracket, making it the least populous group.
| Income Bracket | # Households | % Households |
| Less than $10,000 | 111 | 2.4% |
| $10,000 to $14,999 | 240 | 5.2% |
| $15,000 to $24,999 | 387 | 8.4% |
| $25,000 to $34,999 | 563 | 12.2% |
| $35,000 to $49,999 | 669 | 14.5% |
| $50,000 to $74,999 | 886 | 19.2% |
| $75,000 to $99,999 | 821 | 17.8% |
| $100,000 to $149,999 | 687 | 14.9% |
| $150,000 to $199,999 | 143 | 3.1% |
| $200,000+ | 101 | 2.2% |
Household Income by Householder Age in Prineville
The median household income in Prineville is $63,904, with the highest median household income of $80,467 found in the 25 to 44 years age bracket for the primary householder. A total of 1,487 households (32.2%) fall into this category. Meanwhile, the 15 to 24 years age bracket for the primary householder has the lowest median household income of $39,542, with 123 households (2.7%) in this group.
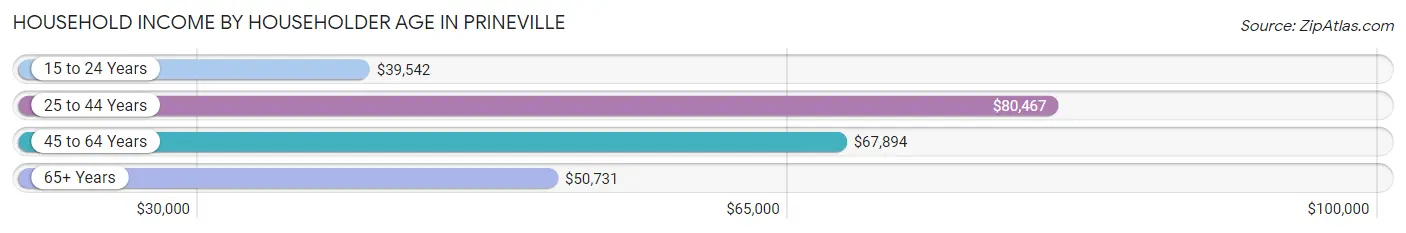
| Income Bracket | # Households | Median Income |
| 15 to 24 Years | 123 (2.7%) | $39,542 |
| 25 to 44 Years | 1,487 (32.2%) | $80,467 |
| 45 to 64 Years | 1,525 (33.1%) | $67,894 |
| 65+ Years | 1,477 (32.0%) | $50,731 |
| Total | 4,612 (100.0%) | $63,904 |
Poverty in Prineville
Income Below Poverty by Sex and Age in Prineville
With 12.9% poverty level for males and 9.4% for females among the residents of Prineville, under 5 year old males and 5 year old females are the most vulnerable to poverty, with 193 males (42.6%) and 11 females (25.0%) in their respective age groups living below the poverty level.
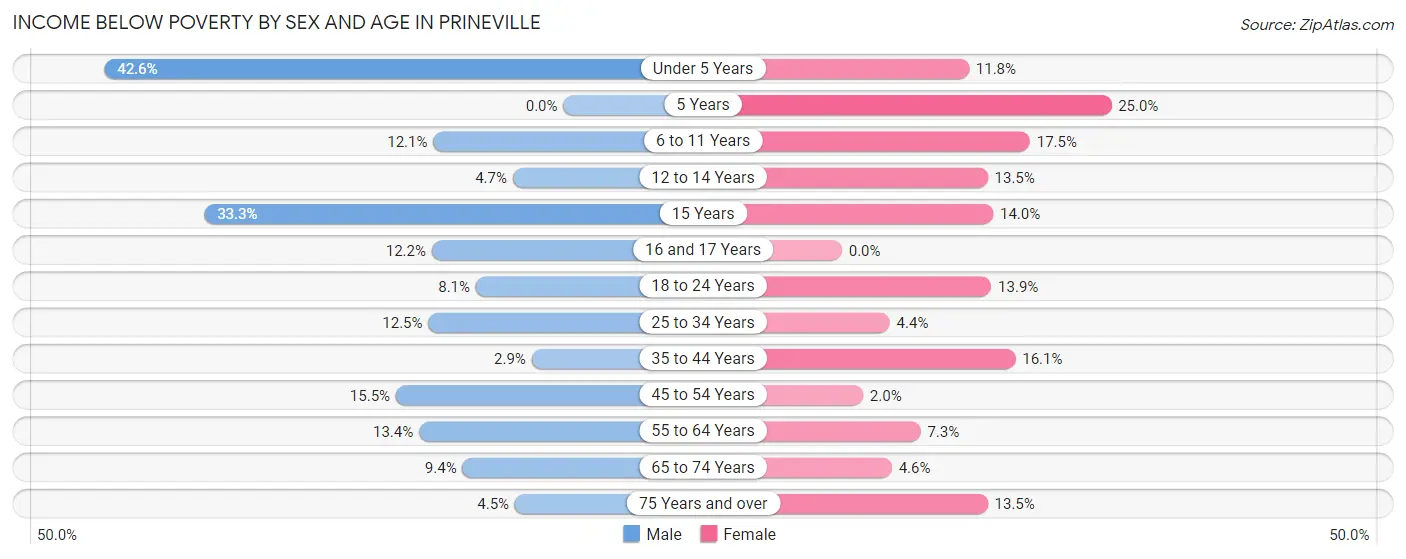
| Age Bracket | Male | Female |
| Under 5 Years | 193 (42.6%) | 31 (11.8%) |
| 5 Years | 0 (0.0%) | 11 (25.0%) |
| 6 to 11 Years | 39 (12.1%) | 67 (17.4%) |
| 12 to 14 Years | 10 (4.7%) | 28 (13.5%) |
| 15 Years | 5 (33.3%) | 8 (14.0%) |
| 16 and 17 Years | 16 (12.2%) | 0 (0.0%) |
| 18 to 24 Years | 28 (8.1%) | 46 (13.9%) |
| 25 to 34 Years | 92 (12.5%) | 33 (4.4%) |
| 35 to 44 Years | 19 (2.9%) | 141 (16.1%) |
| 45 to 54 Years | 124 (15.5%) | 12 (2.0%) |
| 55 to 64 Years | 85 (13.4%) | 47 (7.3%) |
| 65 to 74 Years | 50 (9.4%) | 41 (4.6%) |
| 75 Years and over | 17 (4.5%) | 54 (13.5%) |
| Total | 678 (12.9%) | 519 (9.4%) |
Income Above Poverty by Sex and Age in Prineville
According to the poverty statistics in Prineville, males aged 5 years and females aged 16 and 17 years are the age groups that are most secure financially, with 100.0% of males and 100.0% of females in these age groups living above the poverty line.
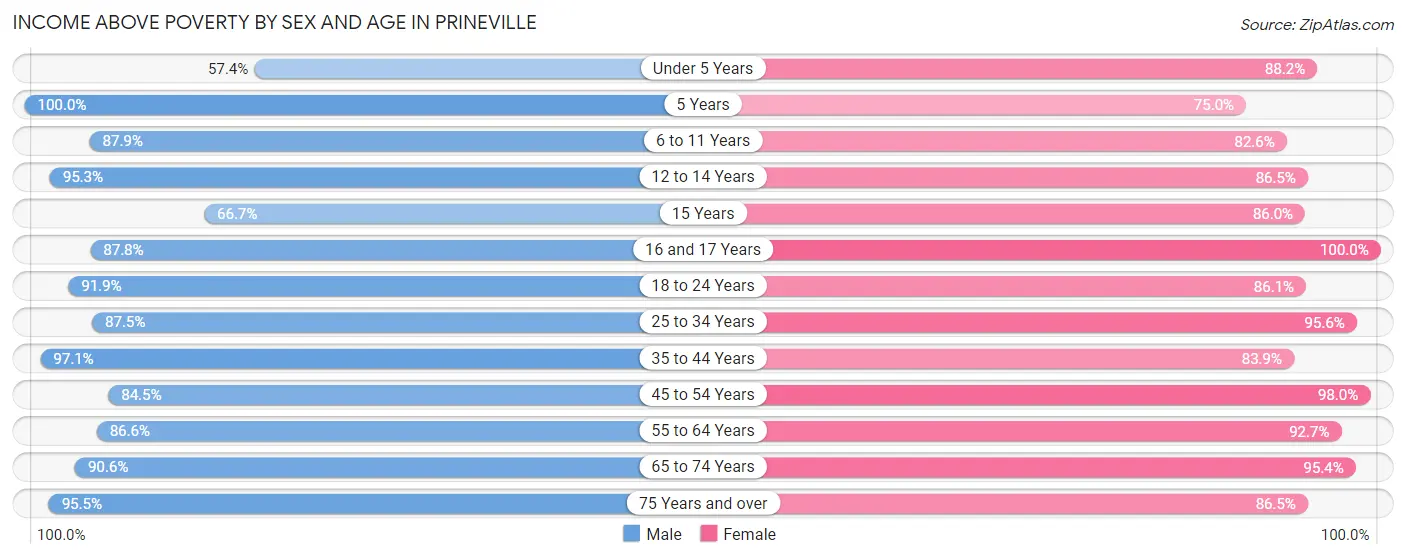
| Age Bracket | Male | Female |
| Under 5 Years | 260 (57.4%) | 232 (88.2%) |
| 5 Years | 67 (100.0%) | 33 (75.0%) |
| 6 to 11 Years | 284 (87.9%) | 317 (82.6%) |
| 12 to 14 Years | 203 (95.3%) | 179 (86.5%) |
| 15 Years | 10 (66.7%) | 49 (86.0%) |
| 16 and 17 Years | 115 (87.8%) | 95 (100.0%) |
| 18 to 24 Years | 317 (91.9%) | 286 (86.1%) |
| 25 to 34 Years | 642 (87.5%) | 710 (95.6%) |
| 35 to 44 Years | 627 (97.1%) | 735 (83.9%) |
| 45 to 54 Years | 674 (84.5%) | 600 (98.0%) |
| 55 to 64 Years | 550 (86.6%) | 597 (92.7%) |
| 65 to 74 Years | 484 (90.6%) | 844 (95.4%) |
| 75 Years and over | 362 (95.5%) | 345 (86.5%) |
| Total | 4,595 (87.1%) | 5,022 (90.6%) |
Income Below Poverty Among Married-Couple Families in Prineville
The poverty statistics for married-couple families in Prineville show that 1.0% or 20 of the total 2,059 families live below the poverty line. Families with 1 or 2 children have the highest poverty rate of 1.4%, comprising of 10 families. On the other hand, families with 3 or 4 children have the lowest poverty rate of 0.0%, which includes 0 families.
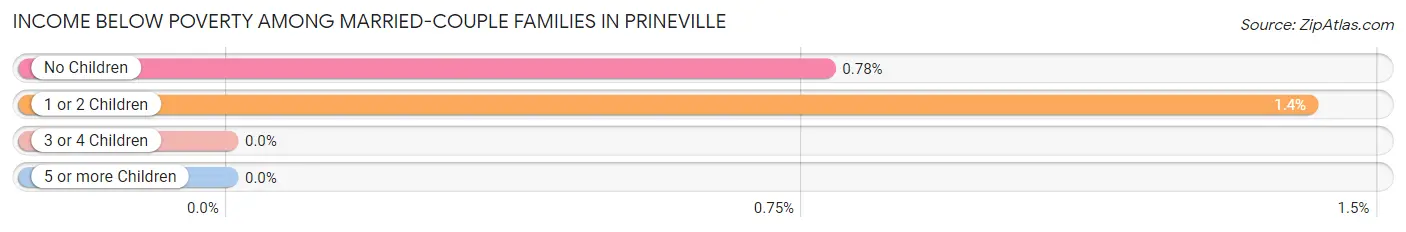
| Children | Above Poverty | Below Poverty |
| No Children | 1,272 (99.2%) | 10 (0.8%) |
| 1 or 2 Children | 699 (98.6%) | 10 (1.4%) |
| 3 or 4 Children | 63 (100.0%) | 0 (0.0%) |
| 5 or more Children | 5 (100.0%) | 0 (0.0%) |
| Total | 2,039 (99.0%) | 20 (1.0%) |
Income Below Poverty Among Single-Parent Households in Prineville
According to the poverty data in Prineville, 14.2% or 47 single-father households and 24.0% or 149 single-mother households are living below the poverty line. Among single-father households, those with 1 or 2 children have the highest poverty rate, with 47 households (27.7%) experiencing poverty. Likewise, among single-mother households, those with 5 or more children have the highest poverty rate, with 38 households (80.8%) falling below the poverty line.
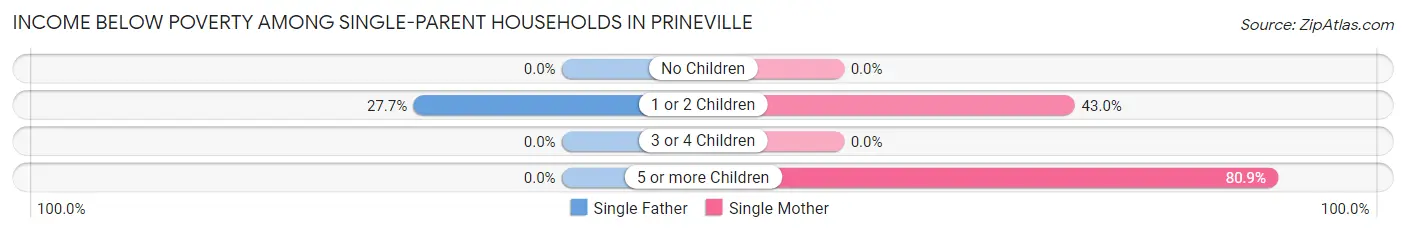
| Children | Single Father | Single Mother |
| No Children | 0 (0.0%) | 0 (0.0%) |
| 1 or 2 Children | 47 (27.7%) | 111 (43.0%) |
| 3 or 4 Children | 0 (0.0%) | 0 (0.0%) |
| 5 or more Children | 0 (0.0%) | 38 (80.8%) |
| Total | 47 (14.2%) | 149 (24.0%) |
Income Below Poverty Among Married-Couple vs Single-Parent Households in Prineville
The poverty data for Prineville shows that 20 of the married-couple family households (1.0%) and 196 of the single-parent households (20.6%) are living below the poverty level. Within the married-couple family households, those with 1 or 2 children have the highest poverty rate, with 10 households (1.4%) falling below the poverty line. Among the single-parent households, those with 5 or more children have the highest poverty rate, with 38 household (80.8%) living below poverty.
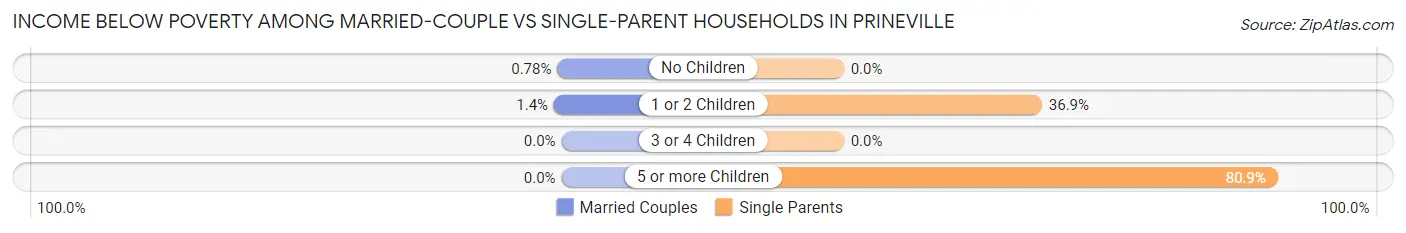
| Children | Married-Couple Families | Single-Parent Households |
| No Children | 10 (0.8%) | 0 (0.0%) |
| 1 or 2 Children | 10 (1.4%) | 158 (36.9%) |
| 3 or 4 Children | 0 (0.0%) | 0 (0.0%) |
| 5 or more Children | 0 (0.0%) | 38 (80.8%) |
| Total | 20 (1.0%) | 196 (20.6%) |
Race in Prineville
The most populous races in Prineville are White / Caucasian (9,592 | 87.9%), Hispanic or Latino (1,246 | 11.4%), and Two or more Races (563 | 5.2%).
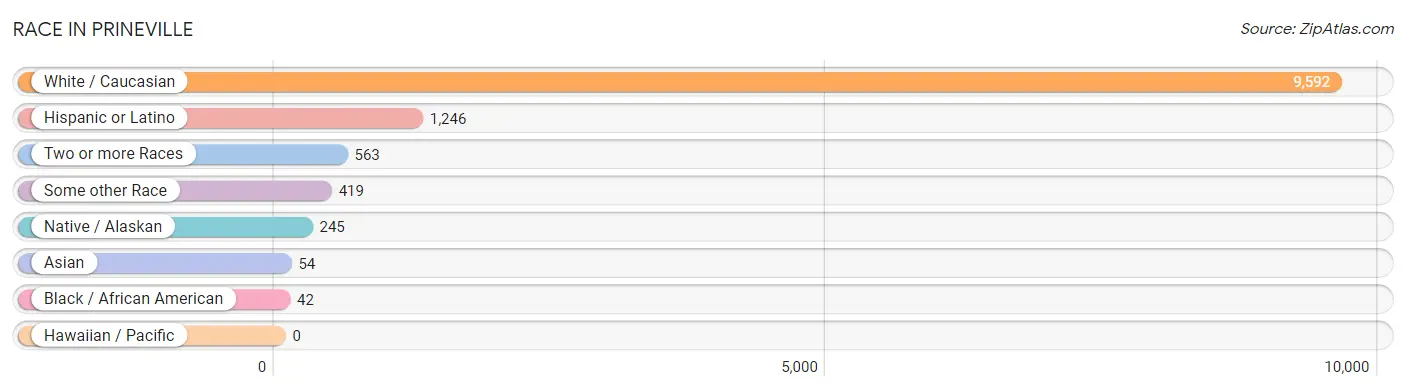
| Race | # Population | % Population |
| Asian | 54 | 0.5% |
| Black / African American | 42 | 0.4% |
| Hawaiian / Pacific | 0 | 0.0% |
| Hispanic or Latino | 1,246 | 11.4% |
| Native / Alaskan | 245 | 2.2% |
| White / Caucasian | 9,592 | 87.9% |
| Two or more Races | 563 | 5.2% |
| Some other Race | 419 | 3.8% |
| Total | 10,915 | 100.0% |
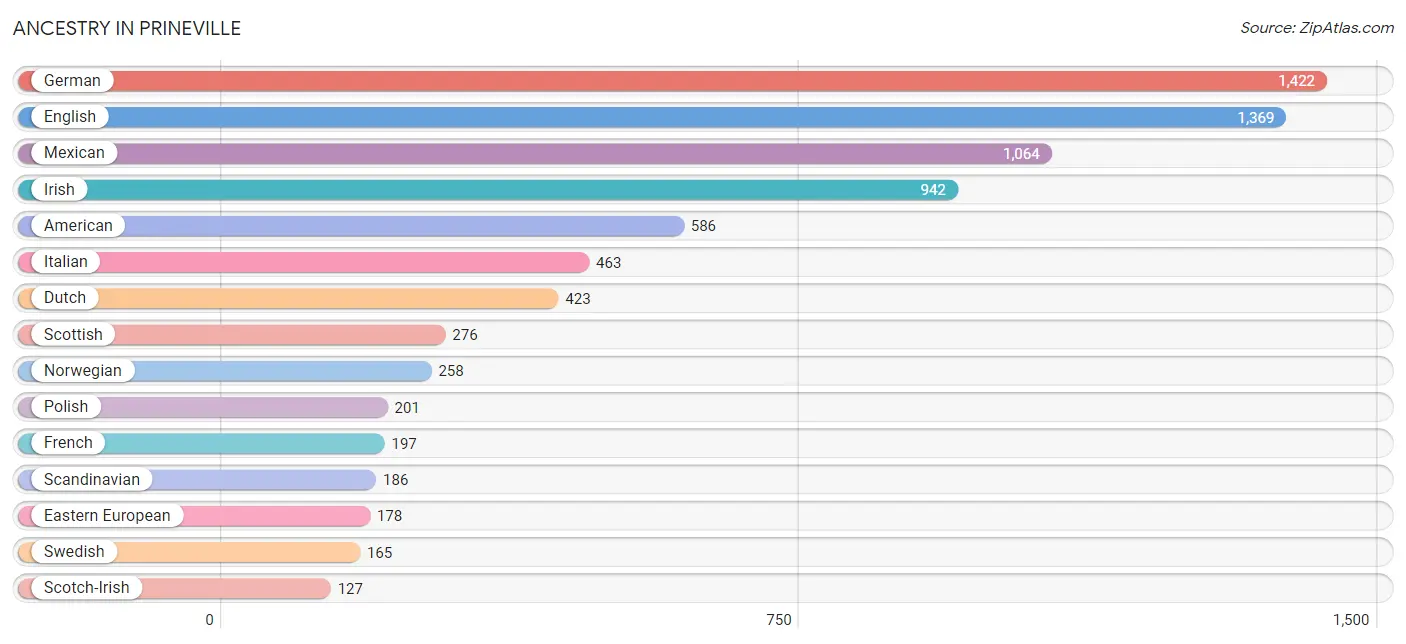
Ancestry in Prineville
The most populous ancestries reported in Prineville are German (1,422 | 13.0%), English (1,369 | 12.5%), Mexican (1,064 | 9.8%), Irish (942 | 8.6%), and American (586 | 5.4%), together accounting for 49.3% of all Prineville residents.
| Ancestry | # Population | % Population |
| Alaskan Athabascan | 11 | 0.1% |
| American | 586 | 5.4% |
| Arab | 32 | 0.3% |
| Bhutanese | 27 | 0.3% |
| Blackfeet | 13 | 0.1% |
| British | 62 | 0.6% |
| Bulgarian | 23 | 0.2% |
| Burmese | 7 | 0.1% |
| Canadian | 17 | 0.2% |
| Celtic | 11 | 0.1% |
| Cherokee | 27 | 0.3% |
| Chickasaw | 10 | 0.1% |
| Creek | 21 | 0.2% |
| Czech | 62 | 0.6% |
| Czechoslovakian | 12 | 0.1% |
| Danish | 12 | 0.1% |
| Dutch | 423 | 3.9% |
| Eastern European | 178 | 1.6% |
| English | 1,369 | 12.5% |
| European | 85 | 0.8% |
| Finnish | 82 | 0.7% |
| French | 197 | 1.8% |
| German | 1,422 | 13.0% |
| Greek | 35 | 0.3% |
| Indian (Asian) | 27 | 0.3% |
| Irish | 942 | 8.6% |
| Italian | 463 | 4.2% |
| Korean | 24 | 0.2% |
| Mexican | 1,064 | 9.8% |
| Native Hawaiian | 34 | 0.3% |
| Northern European | 9 | 0.1% |
| Norwegian | 258 | 2.4% |
| Polish | 201 | 1.8% |
| Portuguese | 4 | 0.0% |
| Puerto Rican | 47 | 0.4% |
| Russian | 39 | 0.4% |
| Scandinavian | 186 | 1.7% |
| Scotch-Irish | 127 | 1.2% |
| Scottish | 276 | 2.5% |
| Sioux | 24 | 0.2% |
| Slovene | 21 | 0.2% |
| South American | 13 | 0.1% |
| Spaniard | 1 | 0.0% |
| Spanish | 121 | 1.1% |
| Swedish | 165 | 1.5% |
| Swiss | 41 | 0.4% |
| Thai | 16 | 0.2% |
| Tlingit-Haida | 20 | 0.2% |
| Ukrainian | 109 | 1.0% |
| Venezuelan | 13 | 0.1% |
| Yakama | 6 | 0.1% | View All 51 Rows |
Immigrants in Prineville
The most numerous immigrant groups reported in Prineville came from Latin America (222 | 2.0%), Central America (205 | 1.9%), Mexico (205 | 1.9%), Europe (155 | 1.4%), and Eastern Europe (121 | 1.1%), together accounting for 8.3% of all Prineville residents.
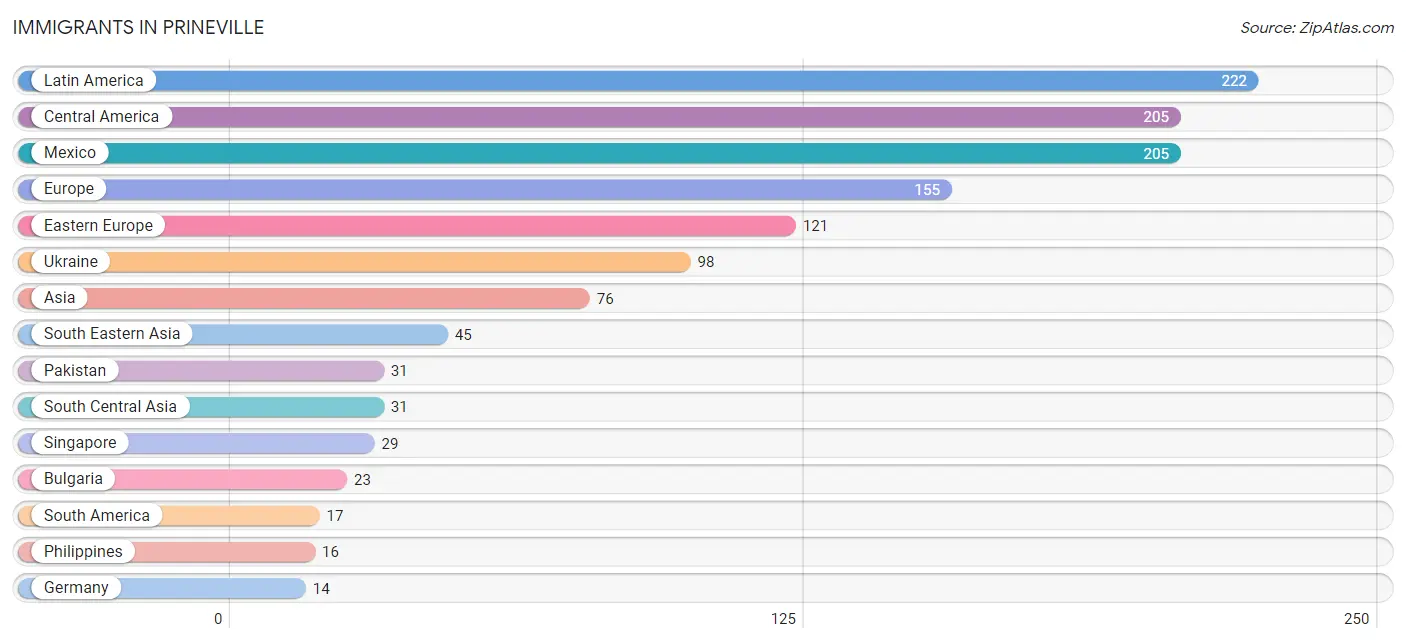
| Immigration Origin | # Population | % Population |
| Asia | 76 | 0.7% |
| Brazil | 4 | 0.0% |
| Bulgaria | 23 | 0.2% |
| Central America | 205 | 1.9% |
| Eastern Europe | 121 | 1.1% |
| Europe | 155 | 1.4% |
| Germany | 14 | 0.1% |
| Greece | 9 | 0.1% |
| Latin America | 222 | 2.0% |
| Mexico | 205 | 1.9% |
| Northern Europe | 11 | 0.1% |
| Pakistan | 31 | 0.3% |
| Philippines | 16 | 0.2% |
| Scotland | 11 | 0.1% |
| Singapore | 29 | 0.3% |
| South America | 17 | 0.2% |
| South Central Asia | 31 | 0.3% |
| South Eastern Asia | 45 | 0.4% |
| Southern Europe | 9 | 0.1% |
| Ukraine | 98 | 0.9% |
| Venezuela | 13 | 0.1% |
| Western Europe | 14 | 0.1% | View All 22 Rows |
Sex and Age in Prineville
Sex and Age in Prineville
The most populous age groups in Prineville are Under 5 Years (453 | 8.5%) for men and 65 to 69 Years (578 | 10.4%) for women.
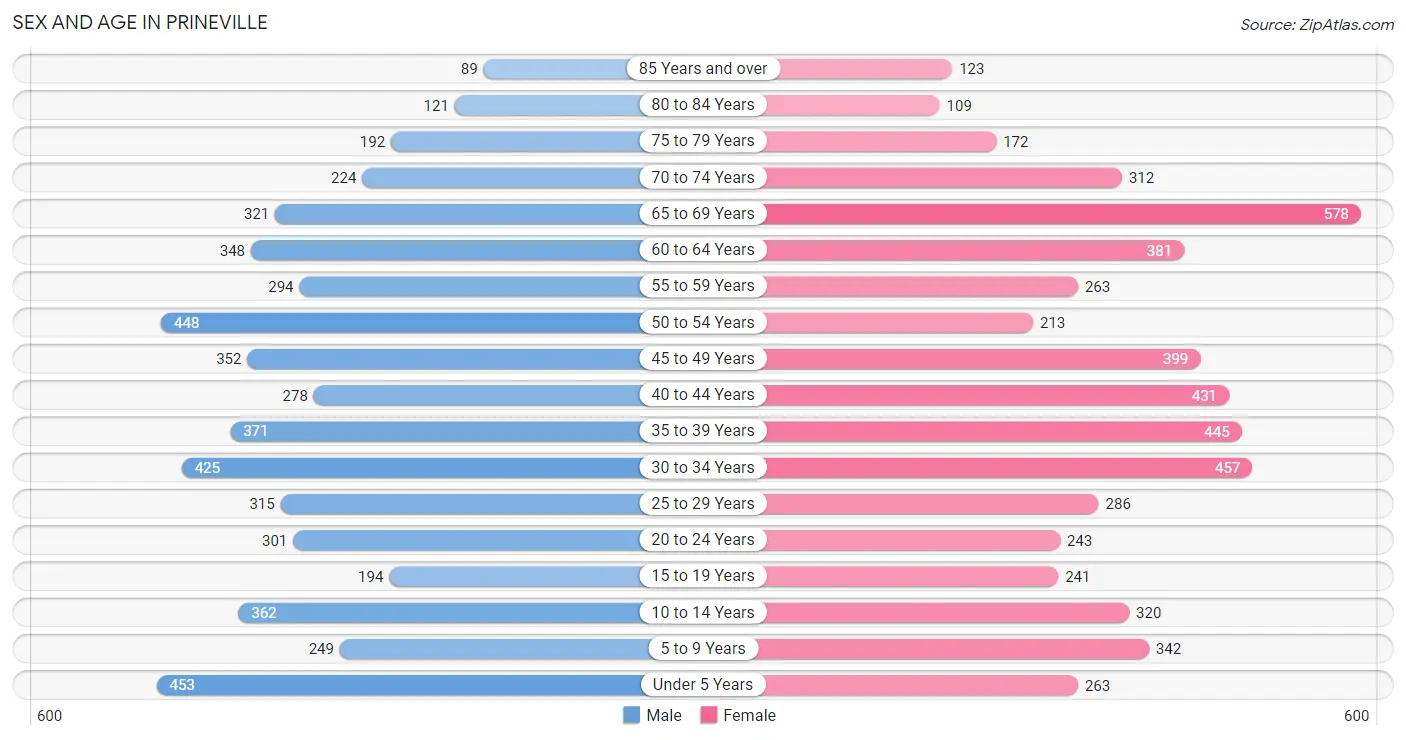
| Age Bracket | Male | Female |
| Under 5 Years | 453 (8.5%) | 263 (4.7%) |
| 5 to 9 Years | 249 (4.7%) | 342 (6.1%) |
| 10 to 14 Years | 362 (6.8%) | 320 (5.7%) |
| 15 to 19 Years | 194 (3.6%) | 241 (4.3%) |
| 20 to 24 Years | 301 (5.6%) | 243 (4.4%) |
| 25 to 29 Years | 315 (5.9%) | 286 (5.1%) |
| 30 to 34 Years | 425 (8.0%) | 457 (8.2%) |
| 35 to 39 Years | 371 (7.0%) | 445 (8.0%) |
| 40 to 44 Years | 278 (5.2%) | 431 (7.7%) |
| 45 to 49 Years | 352 (6.6%) | 399 (7.1%) |
| 50 to 54 Years | 448 (8.4%) | 213 (3.8%) |
| 55 to 59 Years | 294 (5.5%) | 263 (4.7%) |
| 60 to 64 Years | 348 (6.5%) | 381 (6.8%) |
| 65 to 69 Years | 321 (6.0%) | 578 (10.4%) |
| 70 to 74 Years | 224 (4.2%) | 312 (5.6%) |
| 75 to 79 Years | 192 (3.6%) | 172 (3.1%) |
| 80 to 84 Years | 121 (2.3%) | 109 (1.9%) |
| 85 Years and over | 89 (1.7%) | 123 (2.2%) |
| Total | 5,337 (100.0%) | 5,578 (100.0%) |
Families and Households in Prineville
Median Family Size in Prineville
The median family size in Prineville is 2.83 persons per family, with single female/mother families (620 | 20.6%) accounting for the largest median family size of 2.92 persons per family. On the other hand, single male/father families (331 | 11.0%) represent the smallest median family size with 2.31 persons per family.
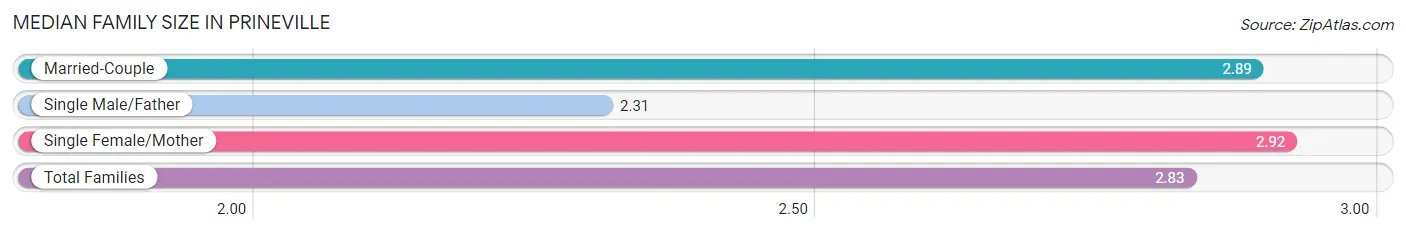
| Family Type | # Families | Family Size |
| Married-Couple | 2,059 (68.4%) | 2.89 |
| Single Male/Father | 331 (11.0%) | 2.31 |
| Single Female/Mother | 620 (20.6%) | 2.92 |
| Total Families | 3,010 (100.0%) | 2.83 |
Median Household Size in Prineville
The median household size in Prineville is 2.33 persons per household, with single female/mother households (620 | 13.4%) accounting for the largest median household size of 3.29 persons per household. non-family households (1,602 | 34.7%) represent the smallest median household size with 1.16 persons per household.
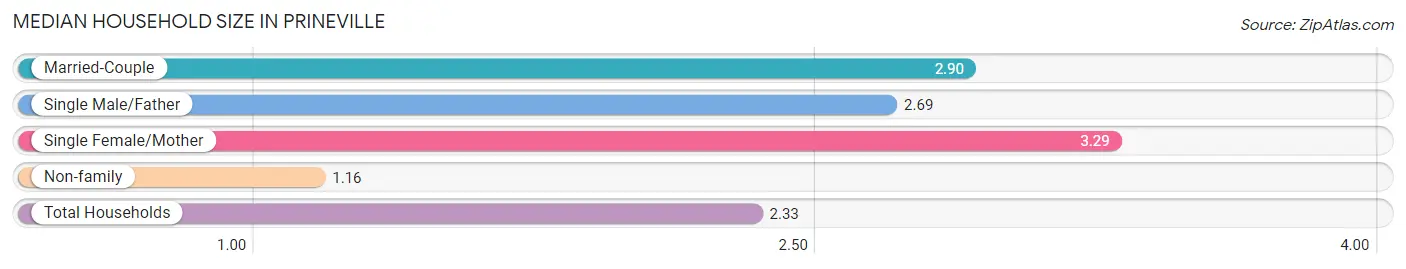
| Household Type | # Households | Household Size |
| Married-Couple | 2,059 (44.6%) | 2.90 |
| Single Male/Father | 331 (7.2%) | 2.69 |
| Single Female/Mother | 620 (13.4%) | 3.29 |
| Non-family | 1,602 (34.7%) | 1.16 |
| Total Households | 4,612 (100.0%) | 2.33 |
Household Size by Marriage Status in Prineville
Out of a total of 4,612 households in Prineville, 3,010 (65.3%) are family households, while 1,602 (34.7%) are nonfamily households. The most numerous type of family households are 2-person households, comprising 1,393, and the most common type of nonfamily households are 1-person households, comprising 1,380.
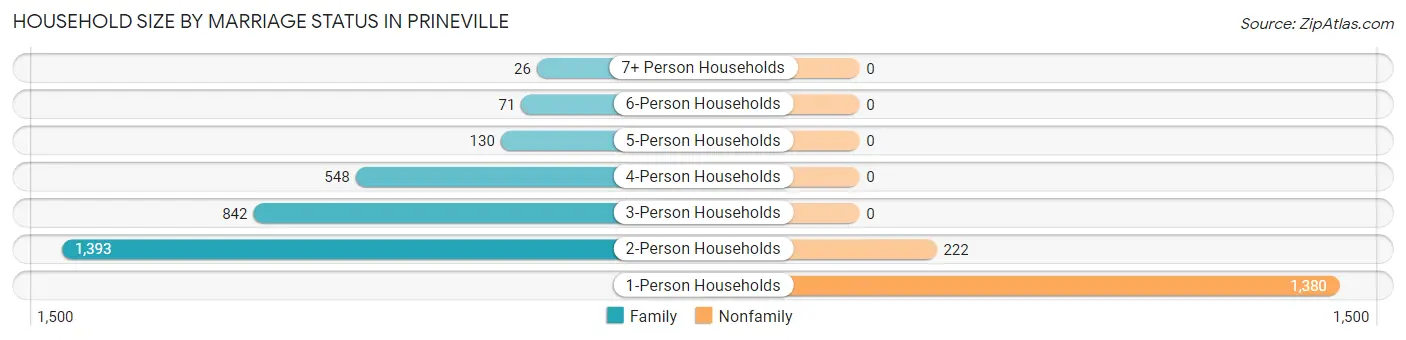
| Household Size | Family Households | Nonfamily Households |
| 1-Person Households | - | 1,380 (29.9%) |
| 2-Person Households | 1,393 (30.2%) | 222 (4.8%) |
| 3-Person Households | 842 (18.3%) | 0 (0.0%) |
| 4-Person Households | 548 (11.9%) | 0 (0.0%) |
| 5-Person Households | 130 (2.8%) | 0 (0.0%) |
| 6-Person Households | 71 (1.5%) | 0 (0.0%) |
| 7+ Person Households | 26 (0.6%) | 0 (0.0%) |
| Total | 3,010 (65.3%) | 1,602 (34.7%) |
Female Fertility in Prineville
Fertility by Age in Prineville
Average fertility rate in Prineville is 58.0 births per 1,000 women. Women in the age bracket of 15 to 19 years have the highest fertility rate with 145.0 births per 1,000 women. Women in the age bracket of 20 to 34 years acount for 49.0% of all women with births.
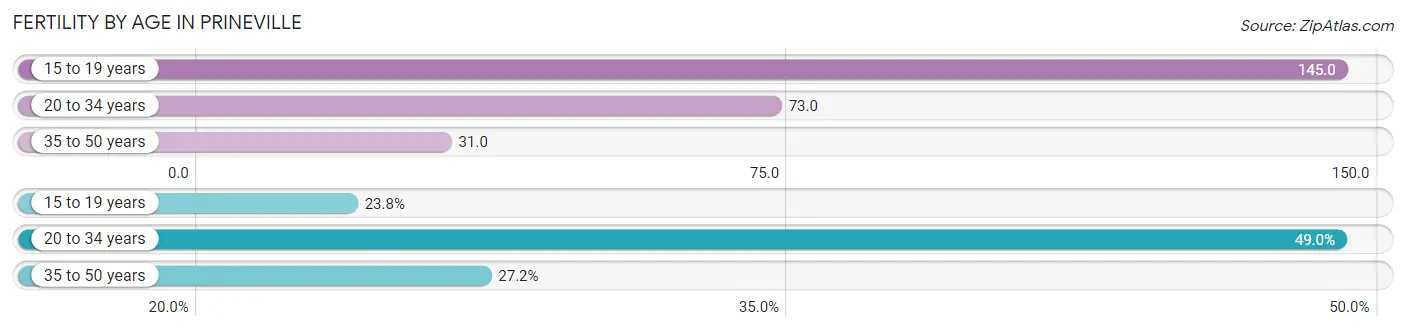
| Age Bracket | Women with Births | Births / 1,000 Women |
| 15 to 19 years | 35 (23.8%) | 145.0 |
| 20 to 34 years | 72 (49.0%) | 73.0 |
| 35 to 50 years | 40 (27.2%) | 31.0 |
| Total | 147 (100.0%) | 58.0 |
Fertility by Age by Marriage Status in Prineville
53.7% of women with births (147) in Prineville are married. The highest percentage of unmarried women with births falls into 15 to 19 years age bracket with 100.0% of them unmarried at the time of birth, while the lowest percentage of unmarried women with births belong to 20 to 34 years age bracket with 26.4% of them unmarried.
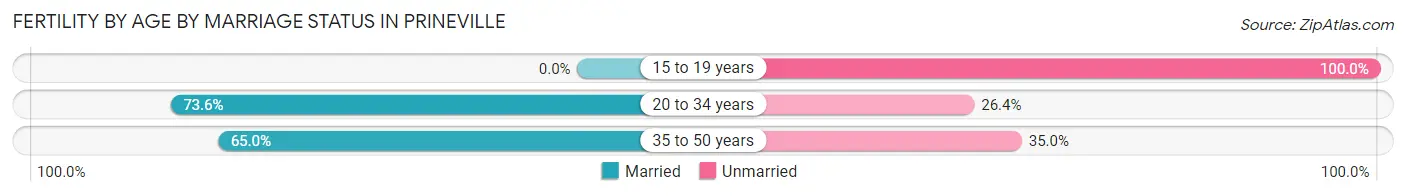
| Age Bracket | Married | Unmarried |
| 15 to 19 years | 0 (0.0%) | 35 (100.0%) |
| 20 to 34 years | 53 (73.6%) | 19 (26.4%) |
| 35 to 50 years | 26 (65.0%) | 14 (35.0%) |
| Total | 79 (53.7%) | 68 (46.3%) |
Fertility by Education in Prineville
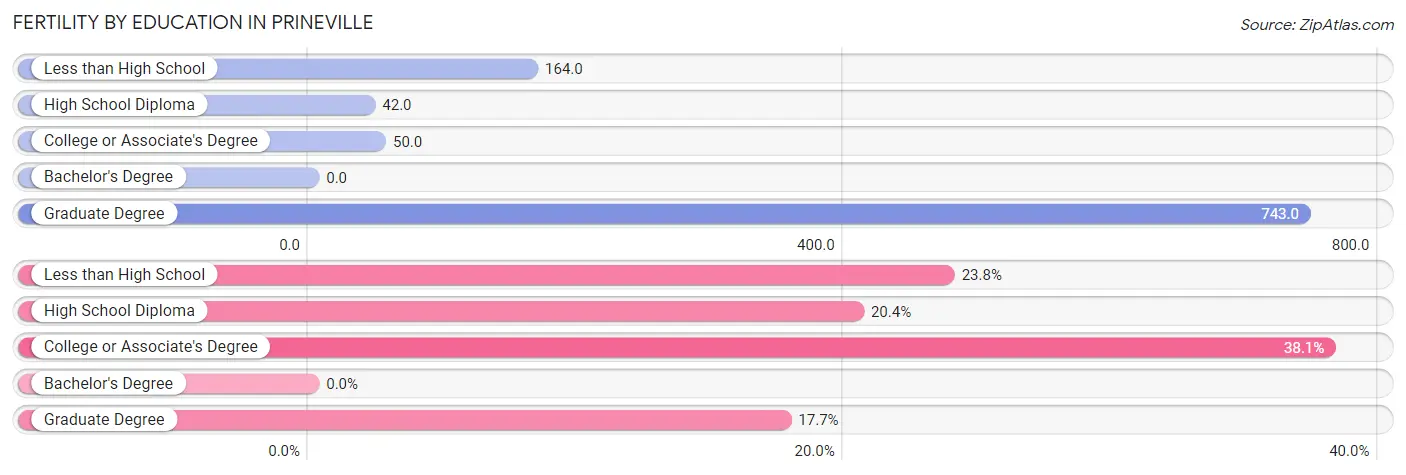
| Educational Attainment | Women with Births | Births / 1,000 Women |
| Less than High School | 35 (23.8%) | 164.0 |
| High School Diploma | 30 (20.4%) | 42.0 |
| College or Associate's Degree | 56 (38.1%) | 50.0 |
| Bachelor's Degree | 0 (0.0%) | 0.0 |
| Graduate Degree | 26 (17.7%) | 743.0 |
| Total | 147 (100.0%) | 58.0 |
Fertility by Education by Marriage Status in Prineville
46.3% of women with births in Prineville are unmarried. Women with the educational attainment of graduate degree are most likely to be married with 100.0% of them married at childbirth, while women with the educational attainment of less than high school are least likely to be married with 100.0% of them unmarried at childbirth.
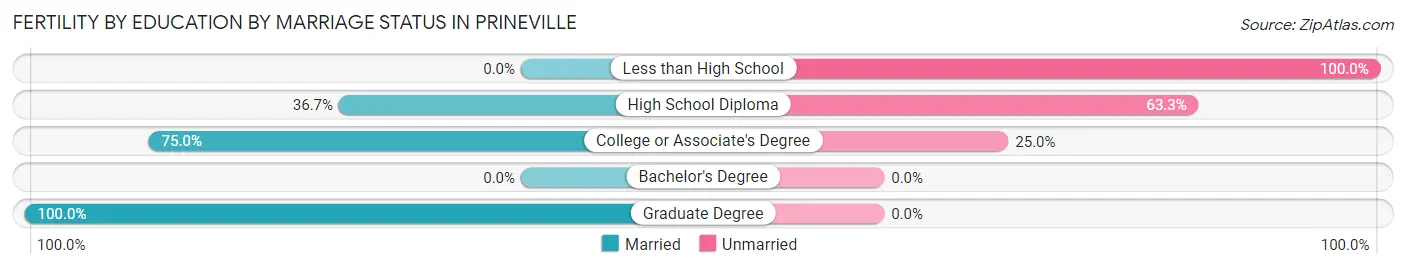
| Educational Attainment | Married | Unmarried |
| Less than High School | 0 (0.0%) | 35 (100.0%) |
| High School Diploma | 11 (36.7%) | 19 (63.3%) |
| College or Associate's Degree | 42 (75.0%) | 14 (25.0%) |
| Bachelor's Degree | 0 (0.0%) | 0 (0.0%) |
| Graduate Degree | 26 (100.0%) | 0 (0.0%) |
| Total | 79 (53.7%) | 68 (46.3%) |
Employment Characteristics in Prineville
Employment by Class of Employer in Prineville
Among the 4,905 employed individuals in Prineville, private company employees (3,399 | 69.3%), not-for-profit organizations (393 | 8.0%), and self-employed (not incorporated) (384 | 7.8%) make up the most common classes of employment.
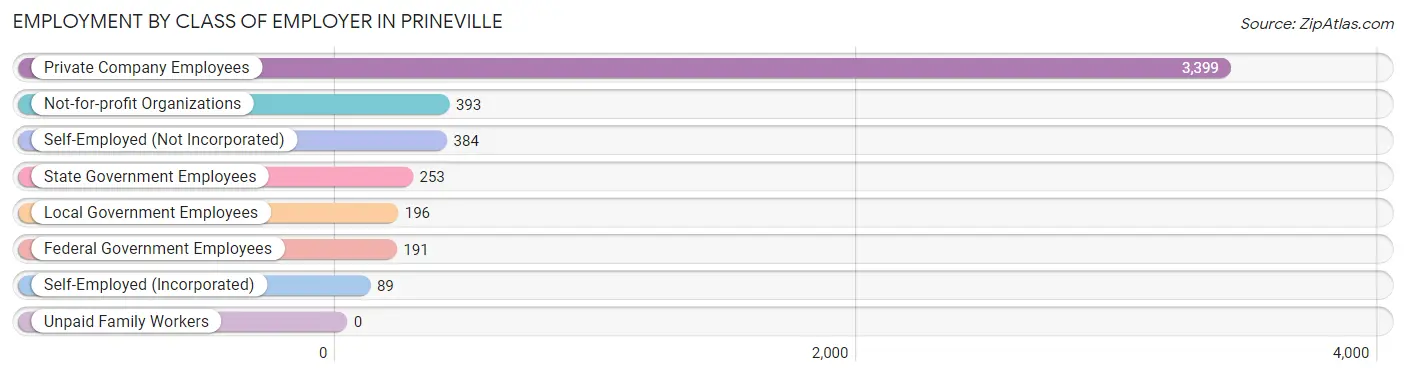
| Employer Class | # Employees | % Employees |
| Private Company Employees | 3,399 | 69.3% |
| Self-Employed (Incorporated) | 89 | 1.8% |
| Self-Employed (Not Incorporated) | 384 | 7.8% |
| Not-for-profit Organizations | 393 | 8.0% |
| Local Government Employees | 196 | 4.0% |
| State Government Employees | 253 | 5.2% |
| Federal Government Employees | 191 | 3.9% |
| Unpaid Family Workers | 0 | 0.0% |
| Total | 4,905 | 100.0% |
Employment Status by Age in Prineville
According to the labor force statistics for Prineville, out of the total population over 16 years of age (8,854), 61.1% or 5,410 individuals are in the labor force, with 6.4% or 346 of them unemployed. The age group with the highest labor force participation rate is 25 to 29 years, with 93.7% or 563 individuals in the labor force. Within the labor force, the 16 to 19 years age range has the highest percentage of unemployed individuals, with 21.1% or 49 of them being unemployed.
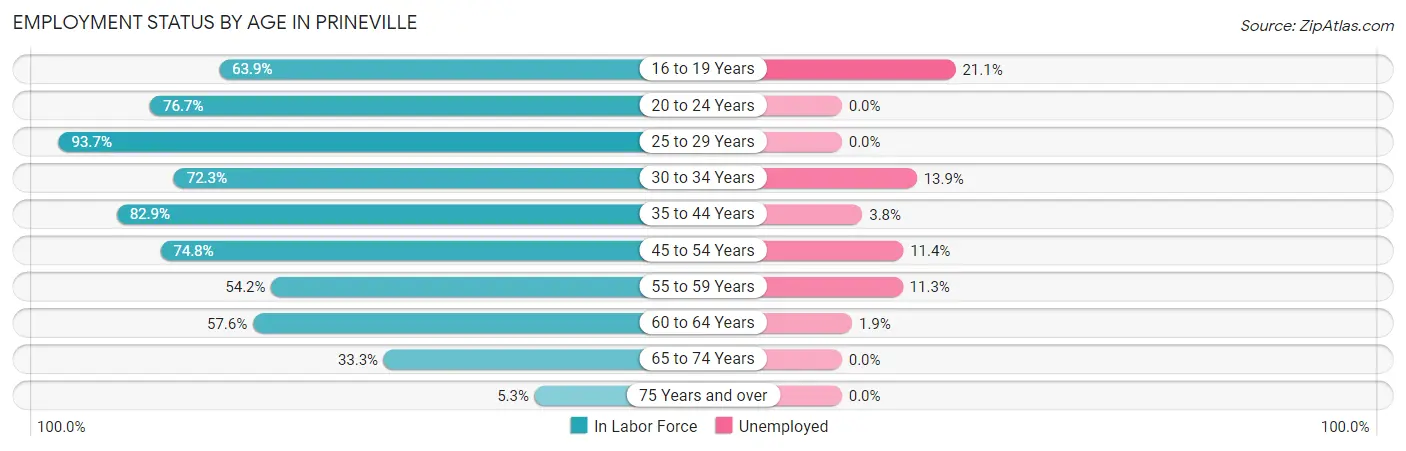
| Age Bracket | In Labor Force | Unemployed |
| 16 to 19 Years | 232 (63.9%) | 49 (21.1%) |
| 20 to 24 Years | 417 (76.7%) | 0 (0.0%) |
| 25 to 29 Years | 563 (93.7%) | 0 (0.0%) |
| 30 to 34 Years | 638 (72.3%) | 89 (13.9%) |
| 35 to 44 Years | 1,264 (82.9%) | 48 (3.8%) |
| 45 to 54 Years | 1,056 (74.8%) | 120 (11.4%) |
| 55 to 59 Years | 302 (54.2%) | 34 (11.3%) |
| 60 to 64 Years | 420 (57.6%) | 8 (1.9%) |
| 65 to 74 Years | 478 (33.3%) | 0 (0.0%) |
| 75 Years and over | 43 (5.3%) | 0 (0.0%) |
| Total | 5,410 (61.1%) | 346 (6.4%) |
Employment Status by Educational Attainment in Prineville
According to labor force statistics for Prineville, 74.4% of individuals (4,245) out of the total population between 25 and 64 years of age (5,706) are in the labor force, with 7.0% or 297 of them being unemployed. The group with the highest labor force participation rate are those with the educational attainment of college / associate degree, with 80.7% or 1,677 individuals in the labor force. Within the labor force, individuals with high school diploma education have the highest percentage of unemployment, with 13.2% or 166 of them being unemployed.
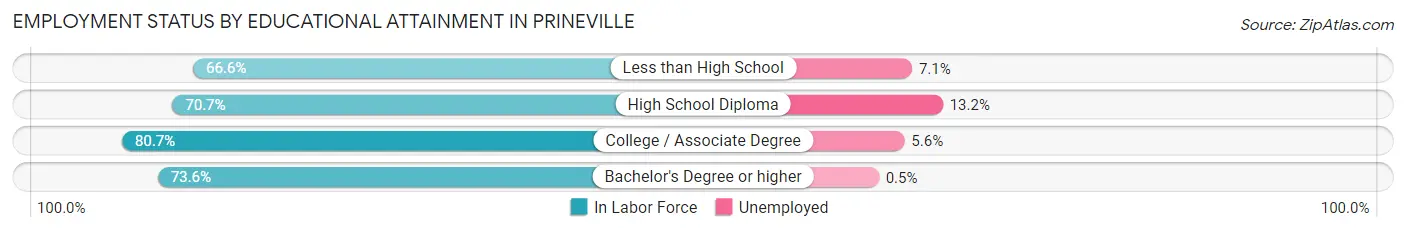
| Educational Attainment | In Labor Force | Unemployed |
| Less than High School | 494 (66.6%) | 53 (7.1%) |
| High School Diploma | 1,254 (70.7%) | 234 (13.2%) |
| College / Associate Degree | 1,677 (80.7%) | 116 (5.6%) |
| Bachelor's Degree or higher | 818 (73.6%) | 6 (0.5%) |
| Total | 4,245 (74.4%) | 399 (7.0%) |
Employment Occupations by Sex in Prineville
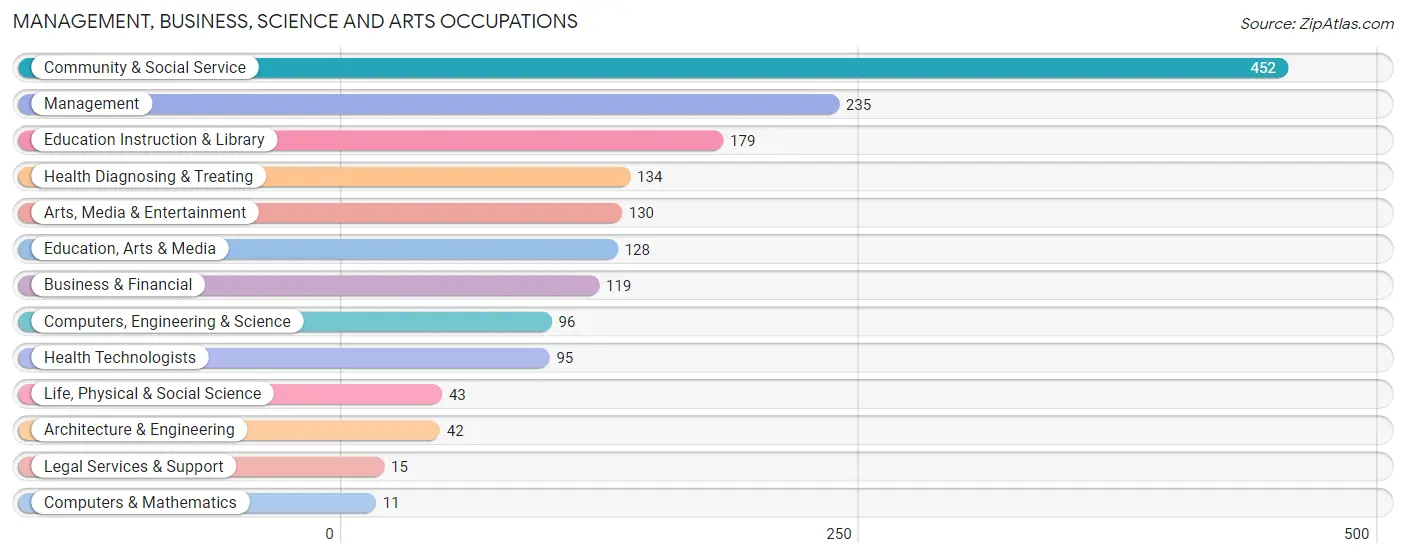
Management, Business, Science and Arts Occupations
The most common Management, Business, Science and Arts occupations in Prineville are Community & Social Service (452 | 8.9%), Management (235 | 4.6%), Education Instruction & Library (179 | 3.5%), Health Diagnosing & Treating (134 | 2.6%), and Arts, Media & Entertainment (130 | 2.6%).
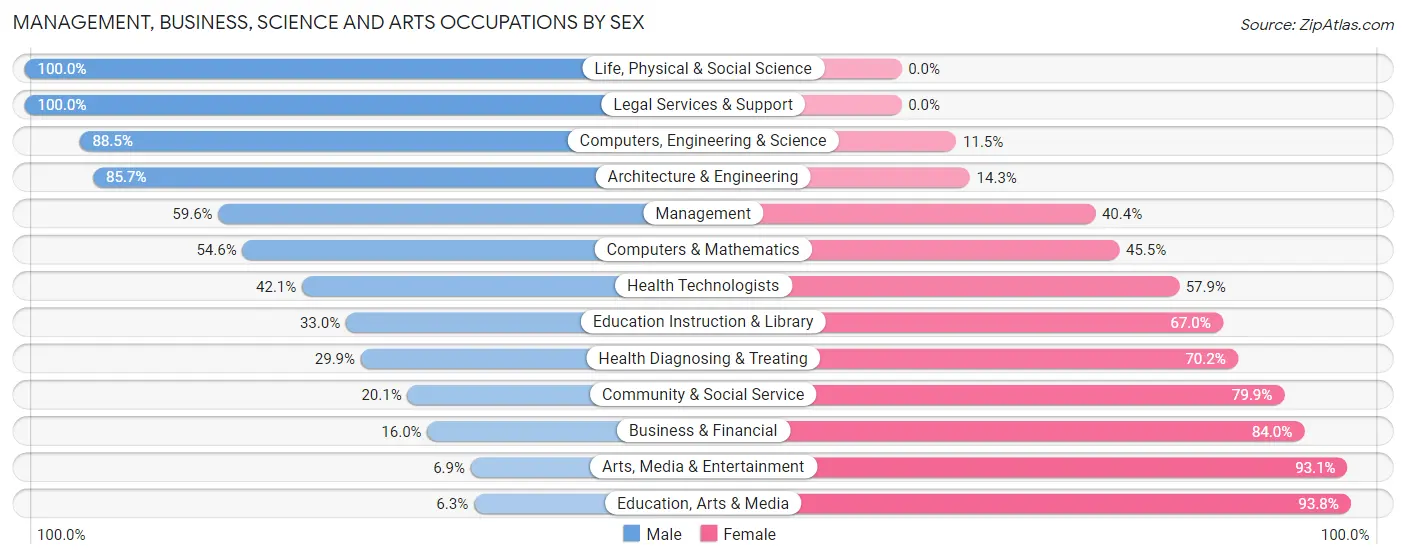
Management, Business, Science and Arts Occupations by Sex
Within the Management, Business, Science and Arts occupations in Prineville, the most male-oriented occupations are Life, Physical & Social Science (100.0%), Legal Services & Support (100.0%), and Computers, Engineering & Science (88.5%), while the most female-oriented occupations are Education, Arts & Media (93.8%), Arts, Media & Entertainment (93.1%), and Business & Financial (84.0%).
| Occupation | Male | Female |
| Management | 140 (59.6%) | 95 (40.4%) |
| Business & Financial | 19 (16.0%) | 100 (84.0%) |
| Computers, Engineering & Science | 85 (88.5%) | 11 (11.5%) |
| Computers & Mathematics | 6 (54.5%) | 5 (45.5%) |
| Architecture & Engineering | 36 (85.7%) | 6 (14.3%) |
| Life, Physical & Social Science | 43 (100.0%) | 0 (0.0%) |
| Community & Social Service | 91 (20.1%) | 361 (79.9%) |
| Education, Arts & Media | 8 (6.2%) | 120 (93.8%) |
| Legal Services & Support | 15 (100.0%) | 0 (0.0%) |
| Education Instruction & Library | 59 (33.0%) | 120 (67.0%) |
| Arts, Media & Entertainment | 9 (6.9%) | 121 (93.1%) |
| Health Diagnosing & Treating | 40 (29.8%) | 94 (70.2%) |
| Health Technologists | 40 (42.1%) | 55 (57.9%) |
| Total (Category) | 375 (36.2%) | 661 (63.8%) |
| Total (Overall) | 2,644 (52.2%) | 2,421 (47.8%) |
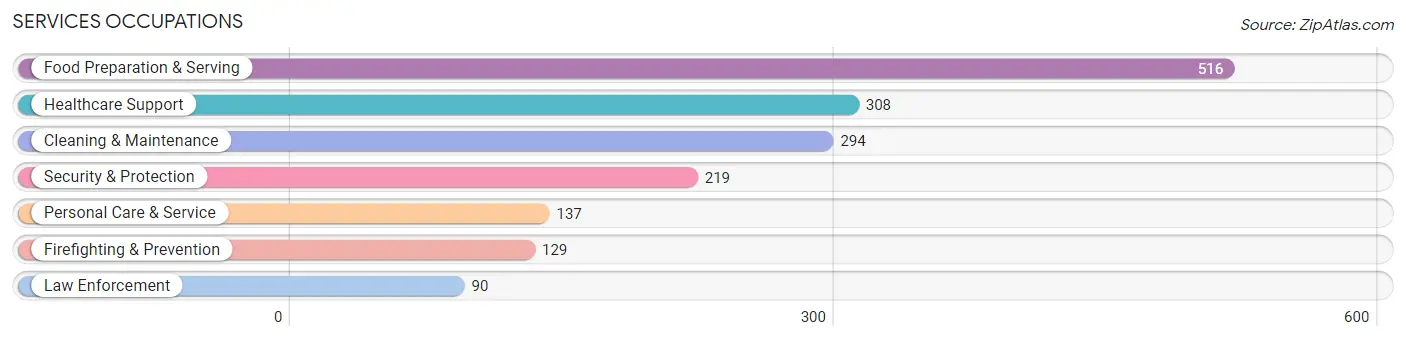
Services Occupations
The most common Services occupations in Prineville are Food Preparation & Serving (516 | 10.2%), Healthcare Support (308 | 6.1%), Cleaning & Maintenance (294 | 5.8%), Security & Protection (219 | 4.3%), and Personal Care & Service (137 | 2.7%).
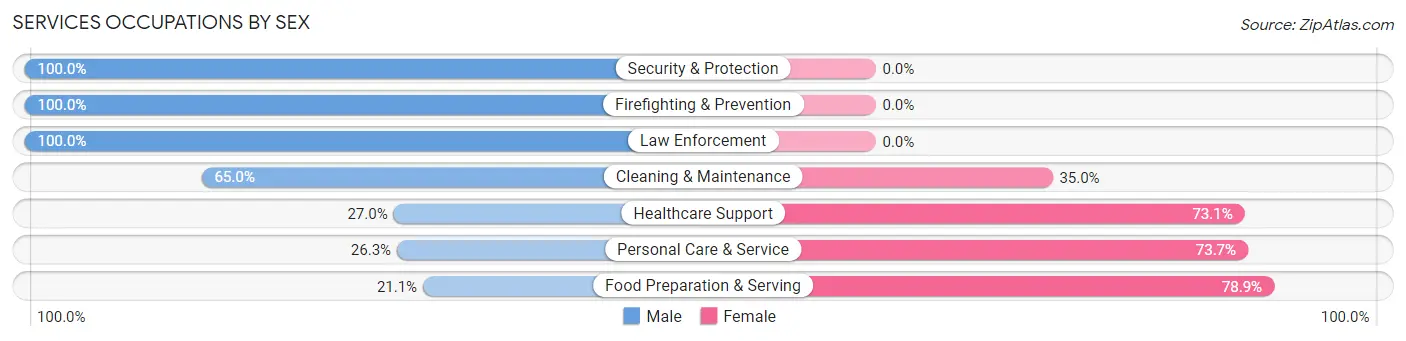
Services Occupations by Sex
Within the Services occupations in Prineville, the most male-oriented occupations are Security & Protection (100.0%), Firefighting & Prevention (100.0%), and Law Enforcement (100.0%), while the most female-oriented occupations are Food Preparation & Serving (78.9%), Personal Care & Service (73.7%), and Healthcare Support (73.1%).
| Occupation | Male | Female |
| Healthcare Support | 83 (27.0%) | 225 (73.1%) |
| Security & Protection | 219 (100.0%) | 0 (0.0%) |
| Firefighting & Prevention | 129 (100.0%) | 0 (0.0%) |
| Law Enforcement | 90 (100.0%) | 0 (0.0%) |
| Food Preparation & Serving | 109 (21.1%) | 407 (78.9%) |
| Cleaning & Maintenance | 191 (65.0%) | 103 (35.0%) |
| Personal Care & Service | 36 (26.3%) | 101 (73.7%) |
| Total (Category) | 638 (43.3%) | 836 (56.7%) |
| Total (Overall) | 2,644 (52.2%) | 2,421 (47.8%) |
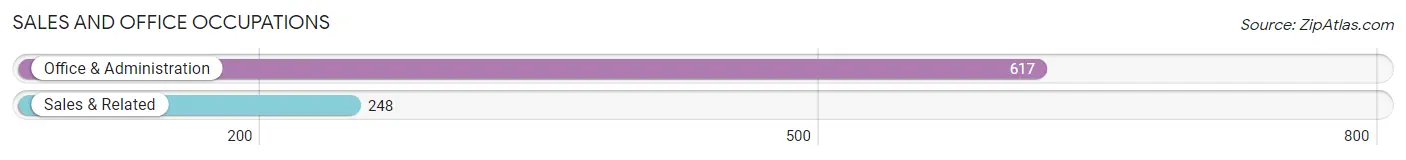
Sales and Office Occupations
The most common Sales and Office occupations in Prineville are Office & Administration (617 | 12.2%), and Sales & Related (248 | 4.9%).
Sales and Office Occupations by Sex
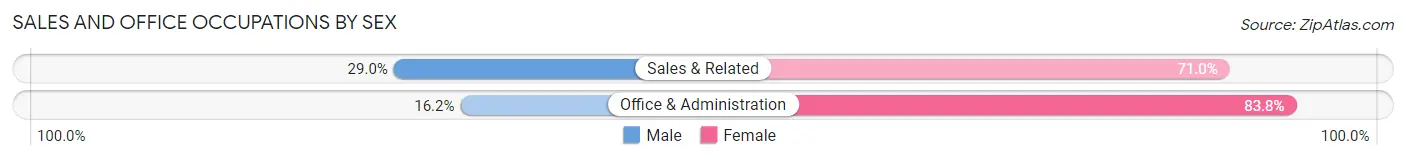
| Occupation | Male | Female |
| Sales & Related | 72 (29.0%) | 176 (71.0%) |
| Office & Administration | 100 (16.2%) | 517 (83.8%) |
| Total (Category) | 172 (19.9%) | 693 (80.1%) |
| Total (Overall) | 2,644 (52.2%) | 2,421 (47.8%) |
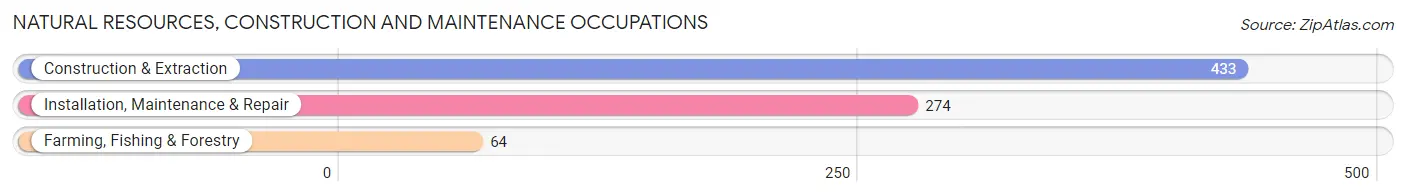
Natural Resources, Construction and Maintenance Occupations
The most common Natural Resources, Construction and Maintenance occupations in Prineville are Construction & Extraction (433 | 8.6%), Installation, Maintenance & Repair (274 | 5.4%), and Farming, Fishing & Forestry (64 | 1.3%).
Natural Resources, Construction and Maintenance Occupations by Sex
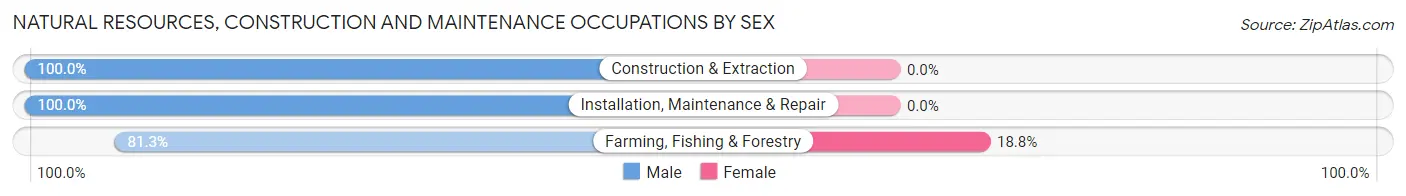
| Occupation | Male | Female |
| Farming, Fishing & Forestry | 52 (81.2%) | 12 (18.8%) |
| Construction & Extraction | 433 (100.0%) | 0 (0.0%) |
| Installation, Maintenance & Repair | 274 (100.0%) | 0 (0.0%) |
| Total (Category) | 759 (98.4%) | 12 (1.6%) |
| Total (Overall) | 2,644 (52.2%) | 2,421 (47.8%) |
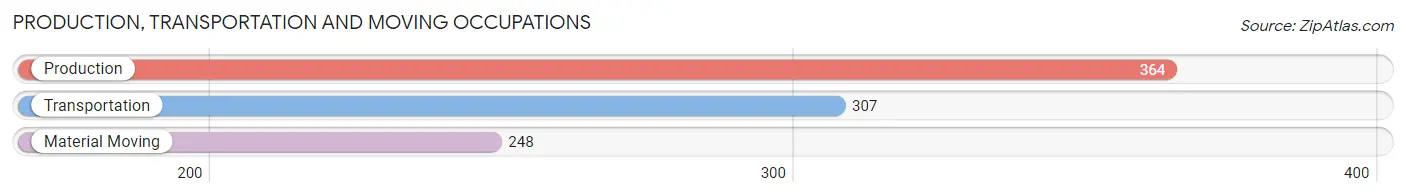
Production, Transportation and Moving Occupations
The most common Production, Transportation and Moving occupations in Prineville are Production (364 | 7.2%), Transportation (307 | 6.1%), and Material Moving (248 | 4.9%).
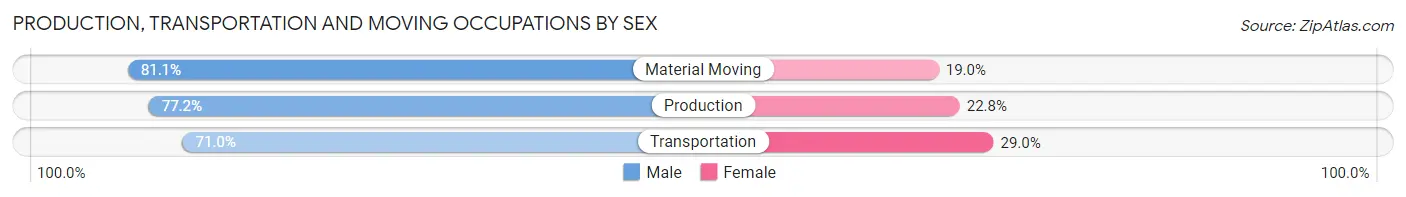
Production, Transportation and Moving Occupations by Sex
| Occupation | Male | Female |
| Production | 281 (77.2%) | 83 (22.8%) |
| Transportation | 218 (71.0%) | 89 (29.0%) |
| Material Moving | 201 (81.0%) | 47 (19.0%) |
| Total (Category) | 700 (76.2%) | 219 (23.8%) |
| Total (Overall) | 2,644 (52.2%) | 2,421 (47.8%) |
Employment Industries by Sex in Prineville
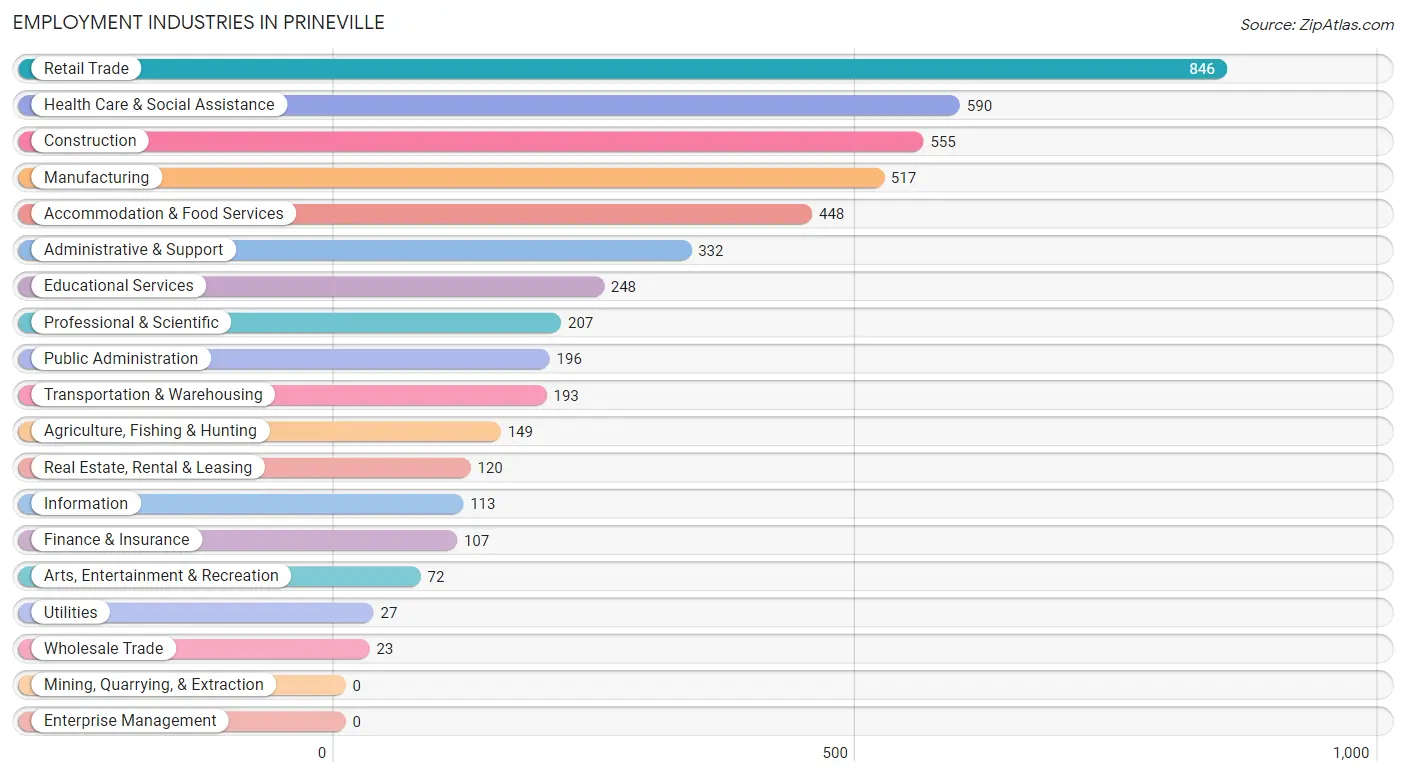
Employment Industries in Prineville
The major employment industries in Prineville include Retail Trade (846 | 16.7%), Health Care & Social Assistance (590 | 11.7%), Construction (555 | 11.0%), Manufacturing (517 | 10.2%), and Accommodation & Food Services (448 | 8.8%).
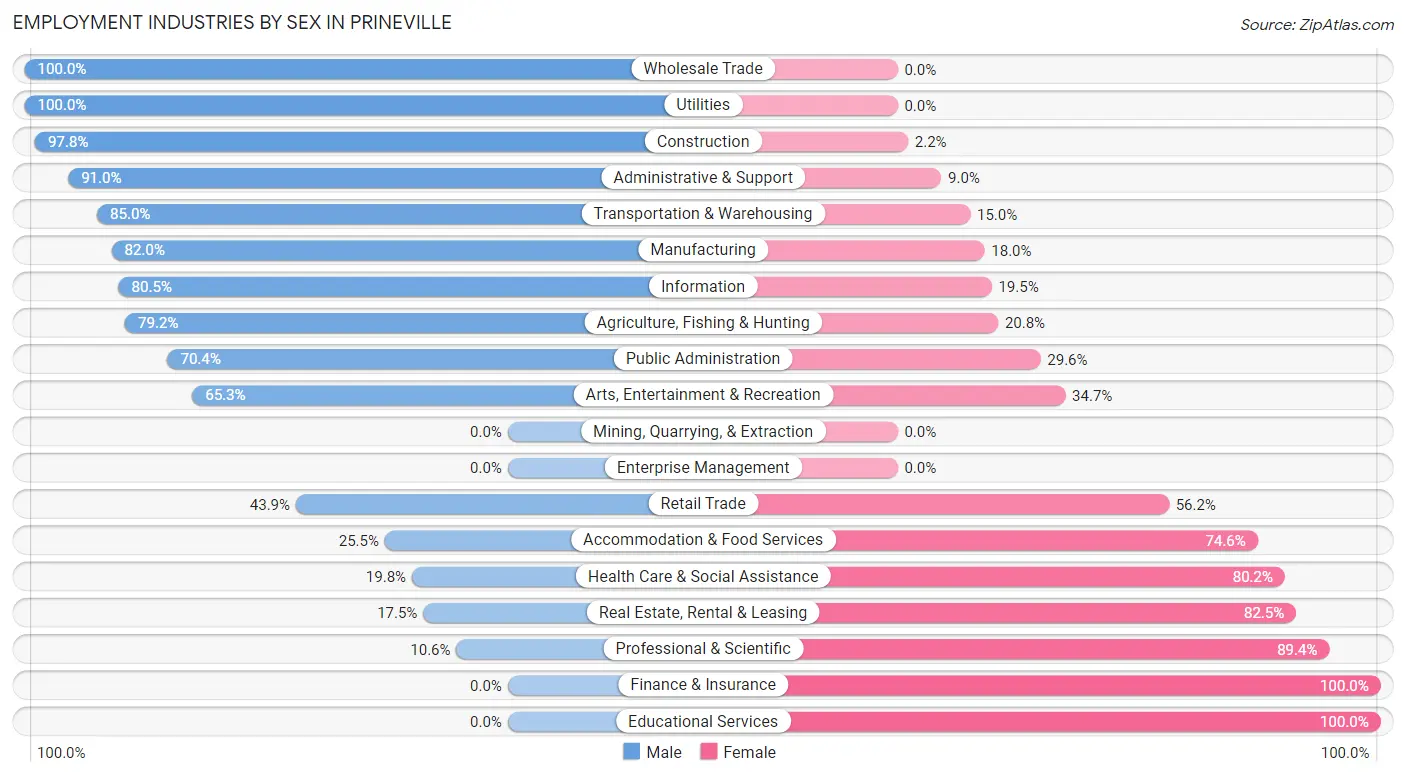
Employment Industries by Sex in Prineville
The Prineville industries that see more men than women are Wholesale Trade (100.0%), Utilities (100.0%), and Construction (97.8%), whereas the industries that tend to have a higher number of women are Finance & Insurance (100.0%), Educational Services (100.0%), and Professional & Scientific (89.4%).
| Industry | Male | Female |
| Agriculture, Fishing & Hunting | 118 (79.2%) | 31 (20.8%) |
| Mining, Quarrying, & Extraction | 0 (0.0%) | 0 (0.0%) |
| Construction | 543 (97.8%) | 12 (2.2%) |
| Manufacturing | 424 (82.0%) | 93 (18.0%) |
| Wholesale Trade | 23 (100.0%) | 0 (0.0%) |
| Retail Trade | 371 (43.9%) | 475 (56.1%) |
| Transportation & Warehousing | 164 (85.0%) | 29 (15.0%) |
| Utilities | 27 (100.0%) | 0 (0.0%) |
| Information | 91 (80.5%) | 22 (19.5%) |
| Finance & Insurance | 0 (0.0%) | 107 (100.0%) |
| Real Estate, Rental & Leasing | 21 (17.5%) | 99 (82.5%) |
| Professional & Scientific | 22 (10.6%) | 185 (89.4%) |
| Enterprise Management | 0 (0.0%) | 0 (0.0%) |
| Administrative & Support | 302 (91.0%) | 30 (9.0%) |
| Educational Services | 0 (0.0%) | 248 (100.0%) |
| Health Care & Social Assistance | 117 (19.8%) | 473 (80.2%) |
| Arts, Entertainment & Recreation | 47 (65.3%) | 25 (34.7%) |
| Accommodation & Food Services | 114 (25.5%) | 334 (74.6%) |
| Public Administration | 138 (70.4%) | 58 (29.6%) |
| Total | 2,644 (52.2%) | 2,421 (47.8%) |
Education in Prineville
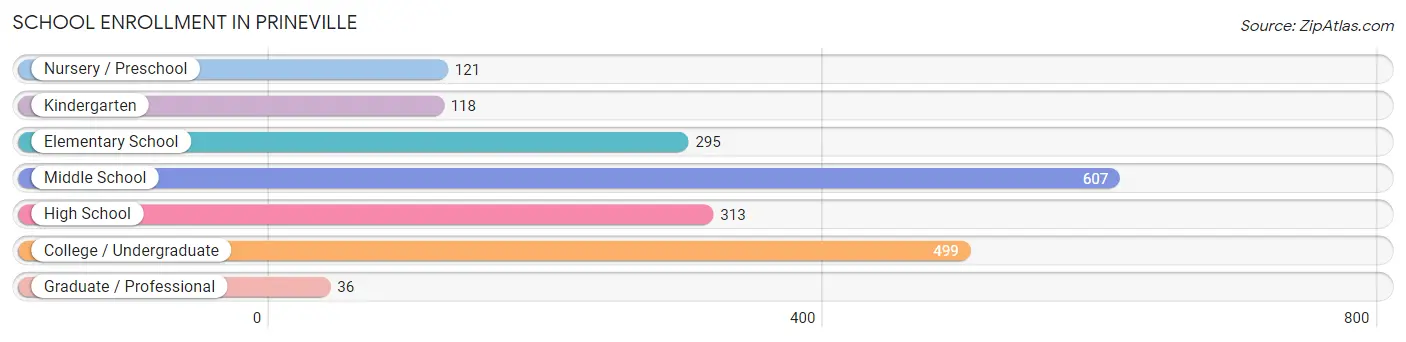
School Enrollment in Prineville
The most common levels of schooling among the 1,989 students in Prineville are middle school (607 | 30.5%), college / undergraduate (499 | 25.1%), and high school (313 | 15.7%).
| School Level | # Students | % Students |
| Nursery / Preschool | 121 | 6.1% |
| Kindergarten | 118 | 5.9% |
| Elementary School | 295 | 14.8% |
| Middle School | 607 | 30.5% |
| High School | 313 | 15.7% |
| College / Undergraduate | 499 | 25.1% |
| Graduate / Professional | 36 | 1.8% |
| Total | 1,989 | 100.0% |
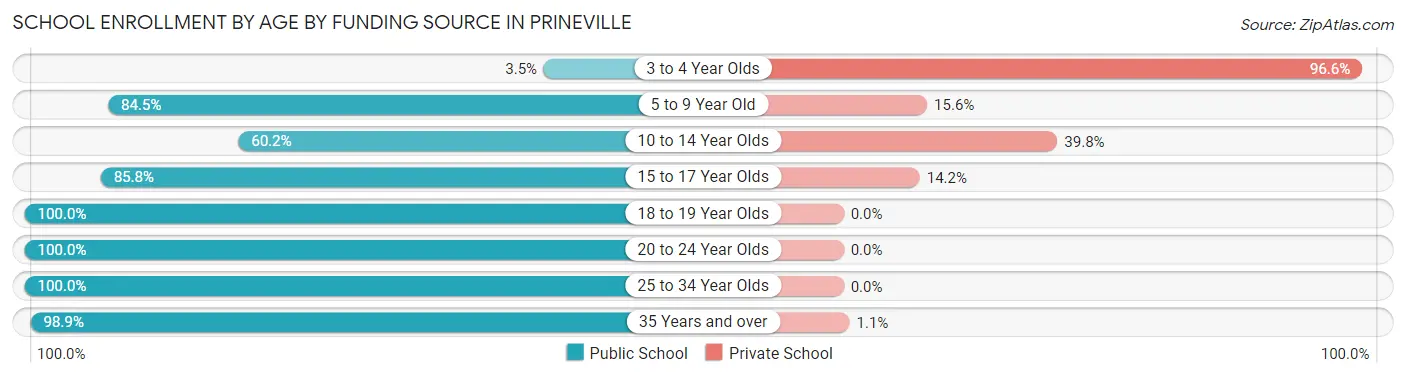
School Enrollment by Age by Funding Source in Prineville
Out of a total of 1,989 students who are enrolled in schools in Prineville, 420 (21.1%) attend a private institution, while the remaining 1,569 (78.9%) are enrolled in public schools. The age group of 3 to 4 year olds has the highest likelihood of being enrolled in private schools, with 56 (96.6% in the age bracket) enrolled. Conversely, the age group of 18 to 19 year olds has the lowest likelihood of being enrolled in a private school, with 56 (100.0% in the age bracket) attending a public institution.
| Age Bracket | Public School | Private School |
| 3 to 4 Year Olds | 2 (3.5%) | 56 (96.6%) |
| 5 to 9 Year Old | 391 (84.5%) | 72 (15.5%) |
| 10 to 14 Year Olds | 375 (60.2%) | 248 (39.8%) |
| 15 to 17 Year Olds | 242 (85.8%) | 40 (14.2%) |
| 18 to 19 Year Olds | 56 (100.0%) | 0 (0.0%) |
| 20 to 24 Year Olds | 209 (100.0%) | 0 (0.0%) |
| 25 to 34 Year Olds | 25 (100.0%) | 0 (0.0%) |
| 35 Years and over | 270 (98.9%) | 3 (1.1%) |
| Total | 1,569 (78.9%) | 420 (21.1%) |
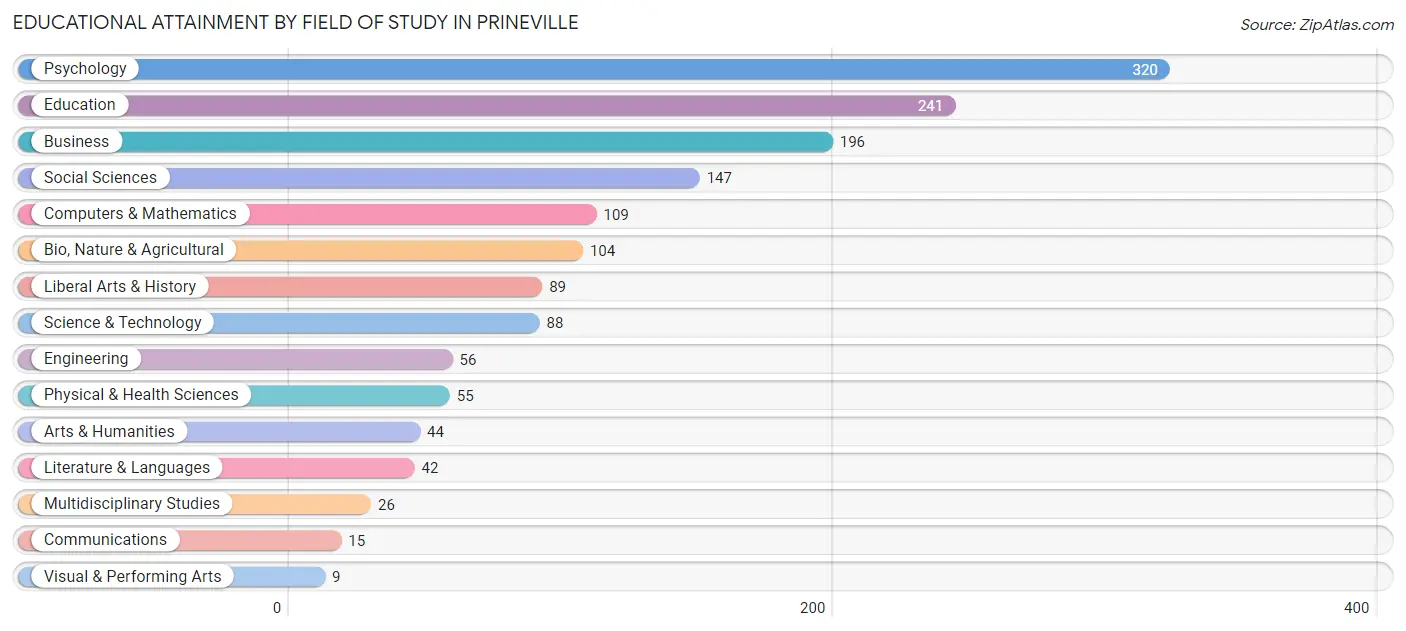
Educational Attainment by Field of Study in Prineville
Psychology (320 | 20.8%), education (241 | 15.6%), business (196 | 12.7%), social sciences (147 | 9.5%), and computers & mathematics (109 | 7.1%) are the most common fields of study among 1,541 individuals in Prineville who have obtained a bachelor's degree or higher.
| Field of Study | # Graduates | % Graduates |
| Computers & Mathematics | 109 | 7.1% |
| Bio, Nature & Agricultural | 104 | 6.8% |
| Physical & Health Sciences | 55 | 3.6% |
| Psychology | 320 | 20.8% |
| Social Sciences | 147 | 9.5% |
| Engineering | 56 | 3.6% |
| Multidisciplinary Studies | 26 | 1.7% |
| Science & Technology | 88 | 5.7% |
| Business | 196 | 12.7% |
| Education | 241 | 15.6% |
| Literature & Languages | 42 | 2.7% |
| Liberal Arts & History | 89 | 5.8% |
| Visual & Performing Arts | 9 | 0.6% |
| Communications | 15 | 1.0% |
| Arts & Humanities | 44 | 2.9% |
| Total | 1,541 | 100.0% |
Transportation & Commute in Prineville
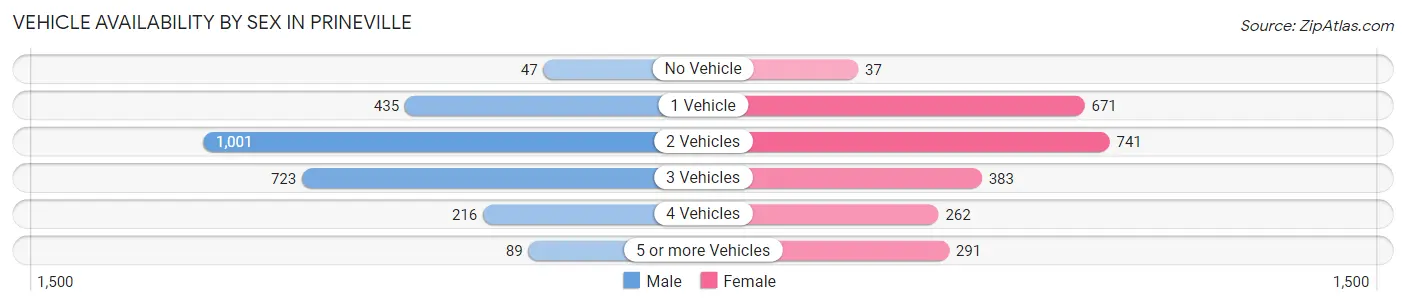
Vehicle Availability by Sex in Prineville
The most prevalent vehicle ownership categories in Prineville are males with 2 vehicles (1,001, accounting for 39.9%) and females with 2 vehicles (741, making up 42.0%).
| Vehicles Available | Male | Female |
| No Vehicle | 47 (1.9%) | 37 (1.5%) |
| 1 Vehicle | 435 (17.3%) | 671 (28.1%) |
| 2 Vehicles | 1,001 (39.9%) | 741 (31.1%) |
| 3 Vehicles | 723 (28.8%) | 383 (16.1%) |
| 4 Vehicles | 216 (8.6%) | 262 (11.0%) |
| 5 or more Vehicles | 89 (3.5%) | 291 (12.2%) |
| Total | 2,511 (100.0%) | 2,385 (100.0%) |
Commute Time in Prineville
The most frequently occuring commute durations in Prineville are 5 to 9 minutes (1,301 commuters, 28.5%), 45 to 59 minutes (517 commuters, 11.3%), and 10 to 14 minutes (492 commuters, 10.8%).
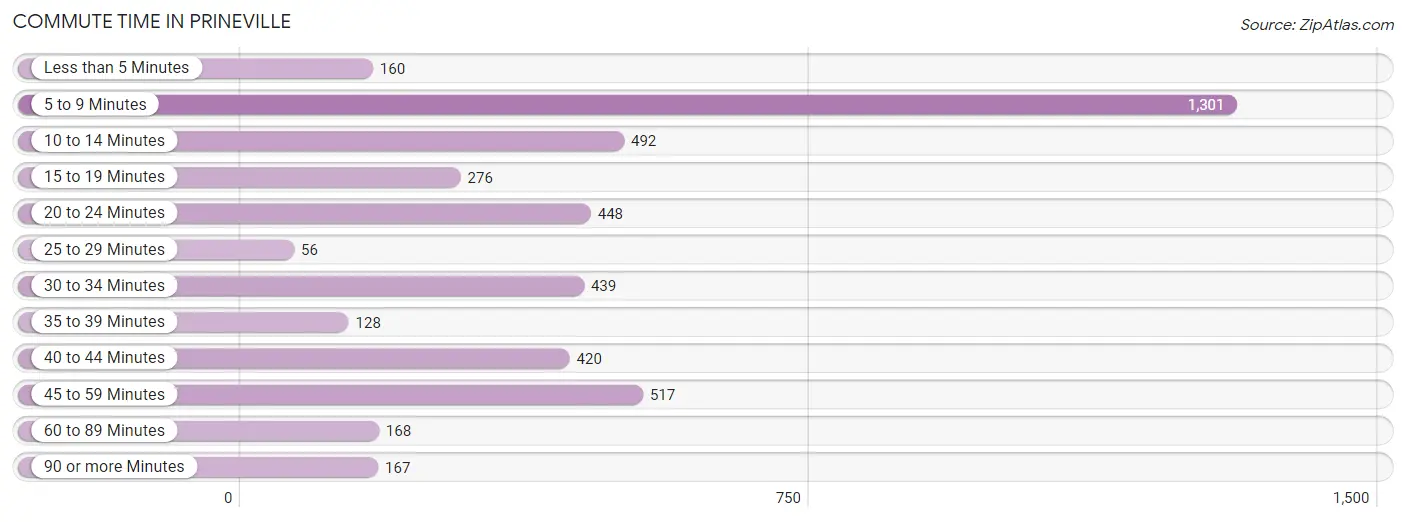
| Commute Time | # Commuters | % Commuters |
| Less than 5 Minutes | 160 | 3.5% |
| 5 to 9 Minutes | 1,301 | 28.5% |
| 10 to 14 Minutes | 492 | 10.8% |
| 15 to 19 Minutes | 276 | 6.0% |
| 20 to 24 Minutes | 448 | 9.8% |
| 25 to 29 Minutes | 56 | 1.2% |
| 30 to 34 Minutes | 439 | 9.6% |
| 35 to 39 Minutes | 128 | 2.8% |
| 40 to 44 Minutes | 420 | 9.2% |
| 45 to 59 Minutes | 517 | 11.3% |
| 60 to 89 Minutes | 168 | 3.7% |
| 90 or more Minutes | 167 | 3.6% |
Commute Time by Sex in Prineville
The most common commute times in Prineville are 5 to 9 minutes (508 commuters, 21.6%) for males and 5 to 9 minutes (793 commuters, 35.6%) for females.
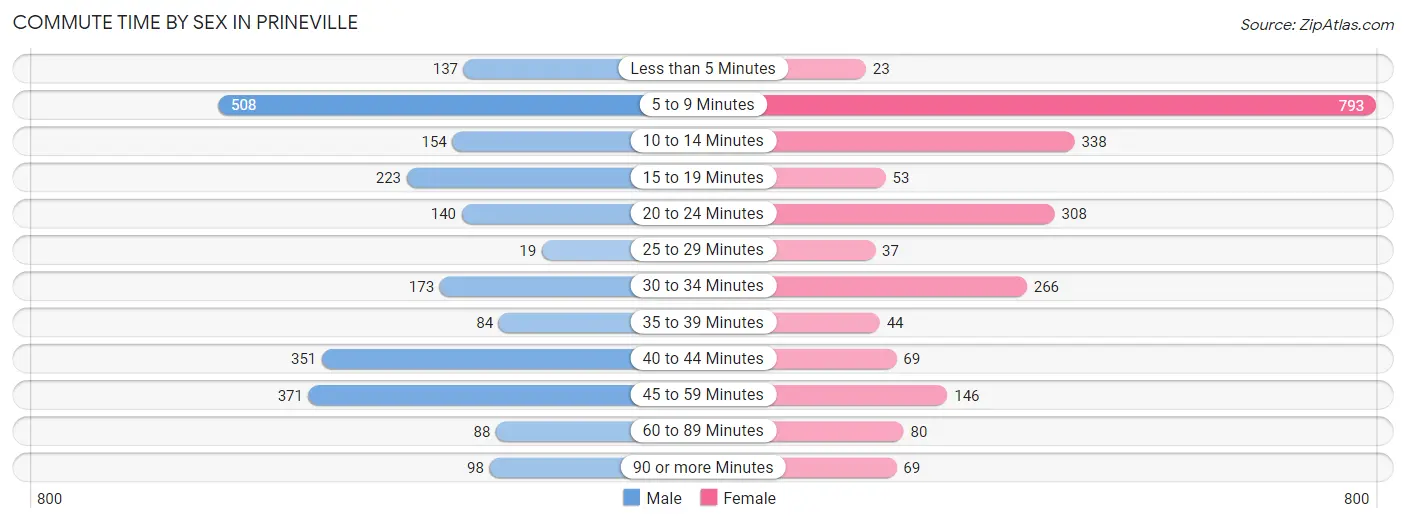
| Commute Time | Male | Female |
| Less than 5 Minutes | 137 (5.8%) | 23 (1.0%) |
| 5 to 9 Minutes | 508 (21.6%) | 793 (35.6%) |
| 10 to 14 Minutes | 154 (6.6%) | 338 (15.2%) |
| 15 to 19 Minutes | 223 (9.5%) | 53 (2.4%) |
| 20 to 24 Minutes | 140 (6.0%) | 308 (13.8%) |
| 25 to 29 Minutes | 19 (0.8%) | 37 (1.7%) |
| 30 to 34 Minutes | 173 (7.4%) | 266 (11.9%) |
| 35 to 39 Minutes | 84 (3.6%) | 44 (2.0%) |
| 40 to 44 Minutes | 351 (15.0%) | 69 (3.1%) |
| 45 to 59 Minutes | 371 (15.8%) | 146 (6.6%) |
| 60 to 89 Minutes | 88 (3.7%) | 80 (3.6%) |
| 90 or more Minutes | 98 (4.2%) | 69 (3.1%) |
Time of Departure to Work by Sex in Prineville
The most frequent times of departure to work in Prineville are 6:30 AM to 6:59 AM (288, 12.3%) for males and 7:30 AM to 7:59 AM (391, 17.6%) for females.
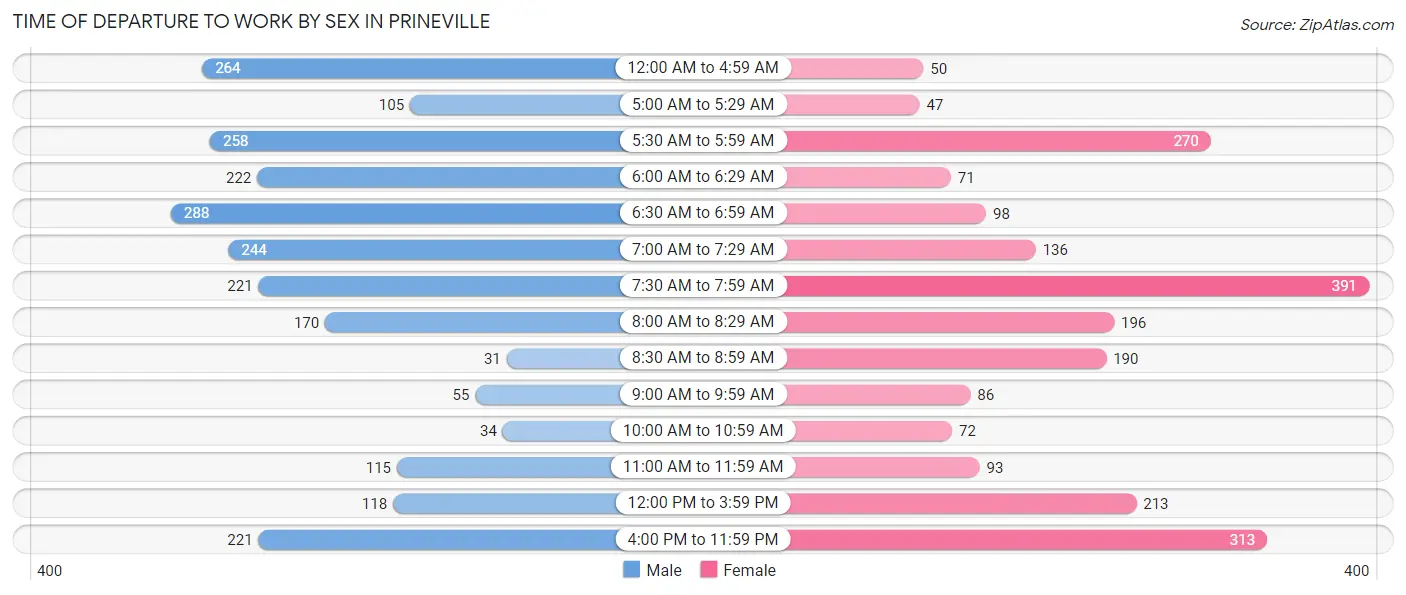
| Time of Departure | Male | Female |
| 12:00 AM to 4:59 AM | 264 (11.3%) | 50 (2.2%) |
| 5:00 AM to 5:29 AM | 105 (4.5%) | 47 (2.1%) |
| 5:30 AM to 5:59 AM | 258 (11.0%) | 270 (12.1%) |
| 6:00 AM to 6:29 AM | 222 (9.5%) | 71 (3.2%) |
| 6:30 AM to 6:59 AM | 288 (12.3%) | 98 (4.4%) |
| 7:00 AM to 7:29 AM | 244 (10.4%) | 136 (6.1%) |
| 7:30 AM to 7:59 AM | 221 (9.4%) | 391 (17.6%) |
| 8:00 AM to 8:29 AM | 170 (7.2%) | 196 (8.8%) |
| 8:30 AM to 8:59 AM | 31 (1.3%) | 190 (8.5%) |
| 9:00 AM to 9:59 AM | 55 (2.3%) | 86 (3.9%) |
| 10:00 AM to 10:59 AM | 34 (1.5%) | 72 (3.2%) |
| 11:00 AM to 11:59 AM | 115 (4.9%) | 93 (4.2%) |
| 12:00 PM to 3:59 PM | 118 (5.0%) | 213 (9.6%) |
| 4:00 PM to 11:59 PM | 221 (9.4%) | 313 (14.1%) |
| Total | 2,346 (100.0%) | 2,226 (100.0%) |
Housing Occupancy in Prineville
Occupancy by Ownership in Prineville
Of the total 4,612 dwellings in Prineville, owner-occupied units account for 2,834 (61.5%), while renter-occupied units make up 1,778 (38.6%).
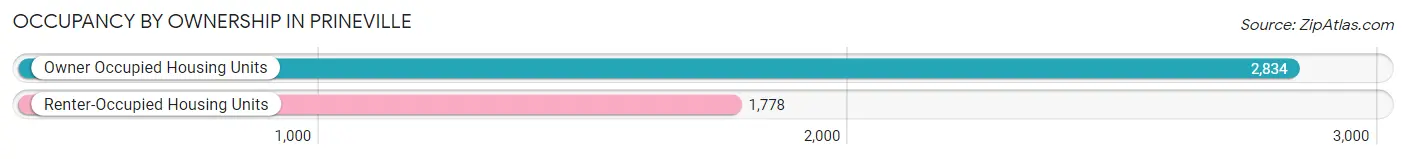
| Occupancy | # Housing Units | % Housing Units |
| Owner Occupied Housing Units | 2,834 | 61.5% |
| Renter-Occupied Housing Units | 1,778 | 38.6% |
| Total Occupied Housing Units | 4,612 | 100.0% |
Occupancy by Household Size in Prineville
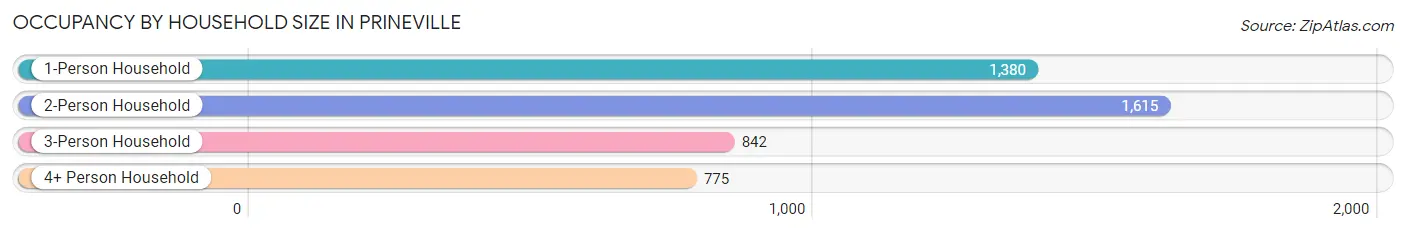
| Household Size | # Housing Units | % Housing Units |
| 1-Person Household | 1,380 | 29.9% |
| 2-Person Household | 1,615 | 35.0% |
| 3-Person Household | 842 | 18.3% |
| 4+ Person Household | 775 | 16.8% |
| Total Housing Units | 4,612 | 100.0% |
Occupancy by Ownership by Household Size in Prineville
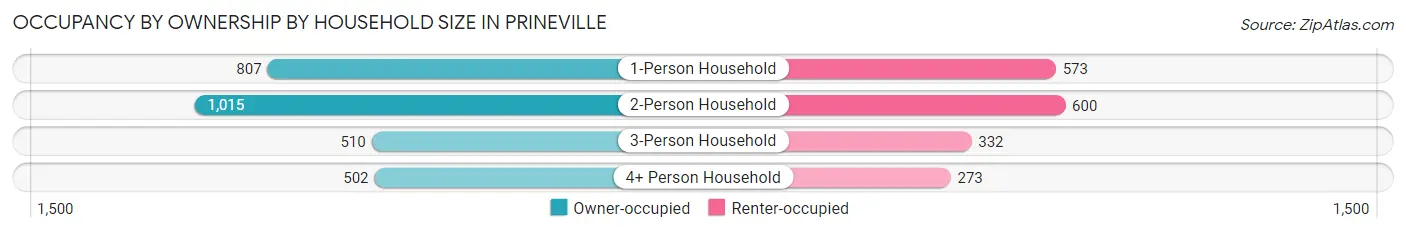
| Household Size | Owner-occupied | Renter-occupied |
| 1-Person Household | 807 (58.5%) | 573 (41.5%) |
| 2-Person Household | 1,015 (62.8%) | 600 (37.1%) |
| 3-Person Household | 510 (60.6%) | 332 (39.4%) |
| 4+ Person Household | 502 (64.8%) | 273 (35.2%) |
| Total Housing Units | 2,834 (61.5%) | 1,778 (38.6%) |
Occupancy by Educational Attainment in Prineville
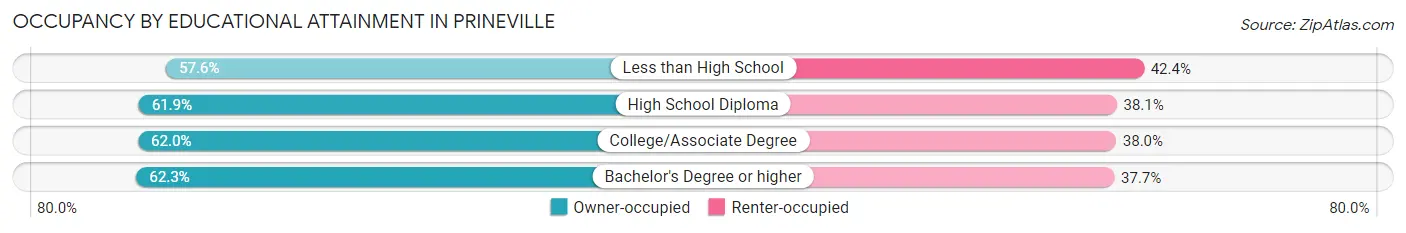
| Household Size | Owner-occupied | Renter-occupied |
| Less than High School | 335 (57.6%) | 247 (42.4%) |
| High School Diploma | 763 (61.9%) | 470 (38.1%) |
| College/Associate Degree | 1,208 (62.0%) | 741 (38.0%) |
| Bachelor's Degree or higher | 528 (62.3%) | 320 (37.7%) |
Occupancy by Age of Householder in Prineville
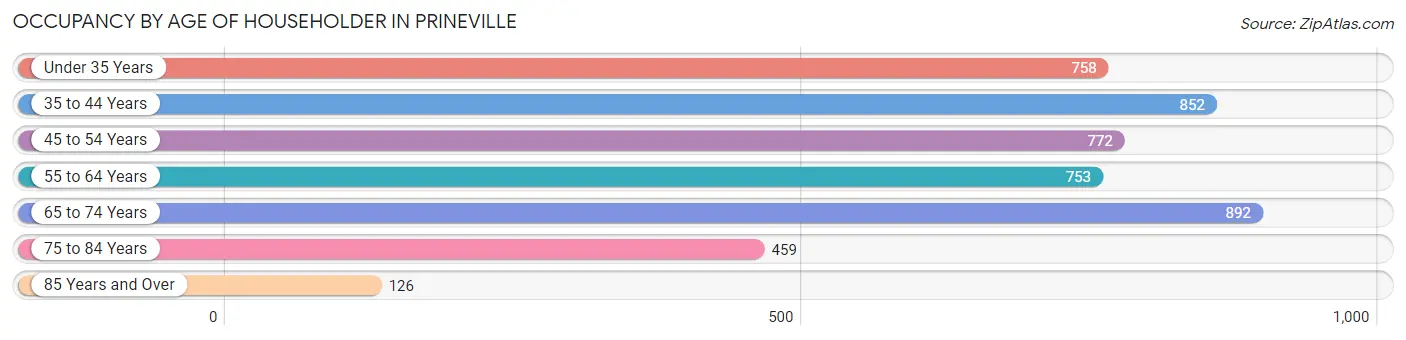
| Age Bracket | # Households | % Households |
| Under 35 Years | 758 | 16.4% |
| 35 to 44 Years | 852 | 18.5% |
| 45 to 54 Years | 772 | 16.7% |
| 55 to 64 Years | 753 | 16.3% |
| 65 to 74 Years | 892 | 19.3% |
| 75 to 84 Years | 459 | 10.0% |
| 85 Years and Over | 126 | 2.7% |
| Total | 4,612 | 100.0% |
Housing Finances in Prineville
Median Income by Occupancy in Prineville
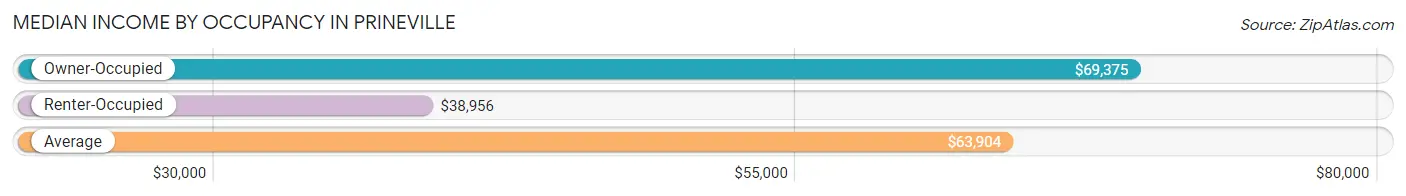
| Occupancy Type | # Households | Median Income |
| Owner-Occupied | 2,834 (61.5%) | $69,375 |
| Renter-Occupied | 1,778 (38.6%) | $38,956 |
| Average | 4,612 (100.0%) | $63,904 |
Occupancy by Householder Income Bracket in Prineville
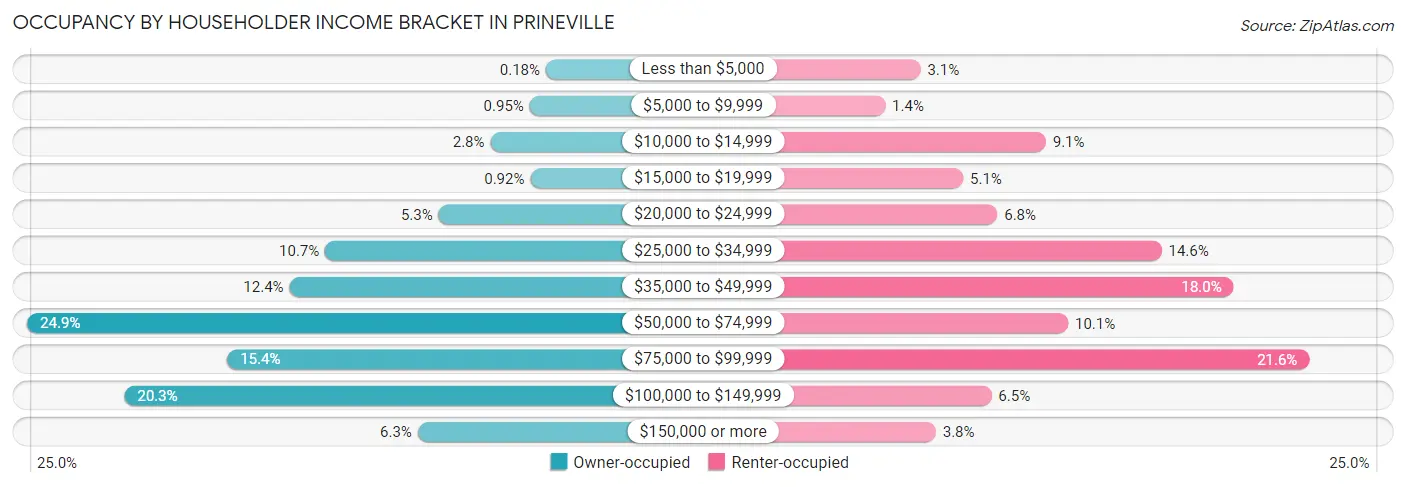
| Income Bracket | Owner-occupied | Renter-occupied |
| Less than $5,000 | 5 (0.2%) | 55 (3.1%) |
| $5,000 to $9,999 | 27 (0.9%) | 25 (1.4%) |
| $10,000 to $14,999 | 80 (2.8%) | 161 (9.1%) |
| $15,000 to $19,999 | 26 (0.9%) | 91 (5.1%) |
| $20,000 to $24,999 | 150 (5.3%) | 120 (6.8%) |
| $25,000 to $34,999 | 303 (10.7%) | 259 (14.6%) |
| $35,000 to $49,999 | 351 (12.4%) | 320 (18.0%) |
| $50,000 to $74,999 | 705 (24.9%) | 180 (10.1%) |
| $75,000 to $99,999 | 435 (15.3%) | 384 (21.6%) |
| $100,000 to $149,999 | 574 (20.3%) | 115 (6.5%) |
| $150,000 or more | 178 (6.3%) | 68 (3.8%) |
| Total | 2,834 (100.0%) | 1,778 (100.0%) |
Monthly Housing Cost Tiers in Prineville
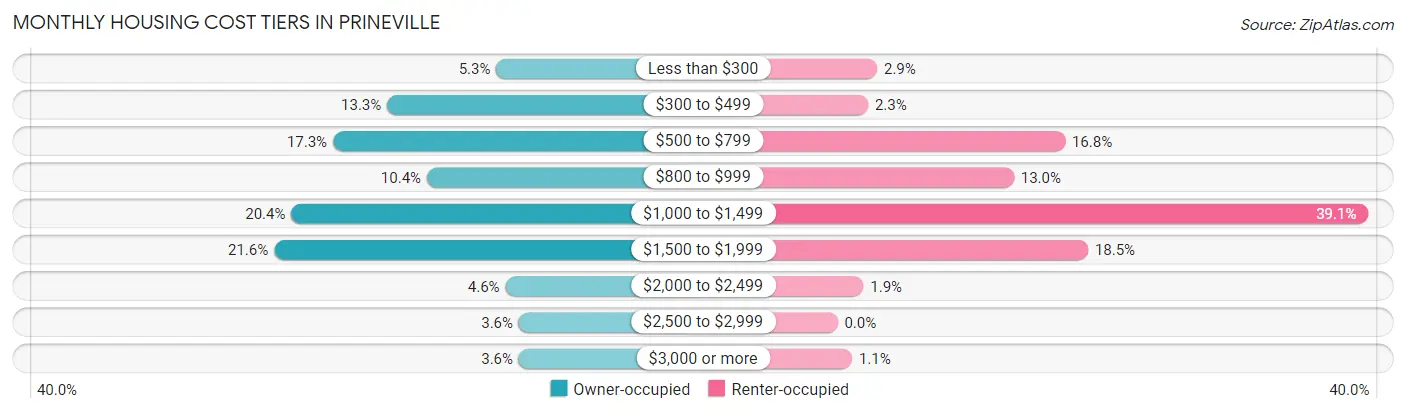
| Monthly Cost | Owner-occupied | Renter-occupied |
| Less than $300 | 149 (5.3%) | 52 (2.9%) |
| $300 to $499 | 377 (13.3%) | 40 (2.2%) |
| $500 to $799 | 490 (17.3%) | 298 (16.8%) |
| $800 to $999 | 294 (10.4%) | 231 (13.0%) |
| $1,000 to $1,499 | 577 (20.4%) | 695 (39.1%) |
| $1,500 to $1,999 | 613 (21.6%) | 328 (18.4%) |
| $2,000 to $2,499 | 130 (4.6%) | 34 (1.9%) |
| $2,500 to $2,999 | 102 (3.6%) | 0 (0.0%) |
| $3,000 or more | 102 (3.6%) | 19 (1.1%) |
| Total | 2,834 (100.0%) | 1,778 (100.0%) |
Physical Housing Characteristics in Prineville
Housing Structures in Prineville
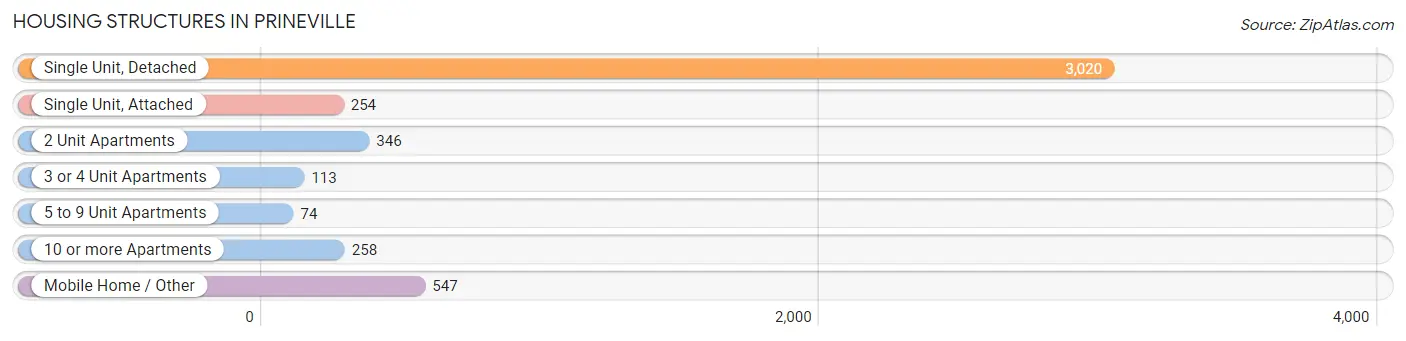
| Structure Type | # Housing Units | % Housing Units |
| Single Unit, Detached | 3,020 | 65.5% |
| Single Unit, Attached | 254 | 5.5% |
| 2 Unit Apartments | 346 | 7.5% |
| 3 or 4 Unit Apartments | 113 | 2.5% |
| 5 to 9 Unit Apartments | 74 | 1.6% |
| 10 or more Apartments | 258 | 5.6% |
| Mobile Home / Other | 547 | 11.9% |
| Total | 4,612 | 100.0% |
Housing Structures by Occupancy in Prineville
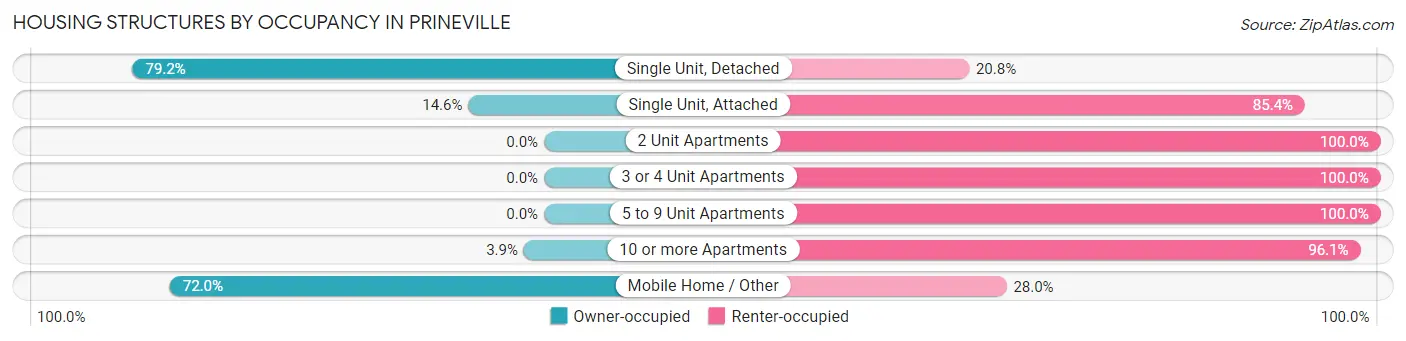
| Structure Type | Owner-occupied | Renter-occupied |
| Single Unit, Detached | 2,393 (79.2%) | 627 (20.8%) |
| Single Unit, Attached | 37 (14.6%) | 217 (85.4%) |
| 2 Unit Apartments | 0 (0.0%) | 346 (100.0%) |
| 3 or 4 Unit Apartments | 0 (0.0%) | 113 (100.0%) |
| 5 to 9 Unit Apartments | 0 (0.0%) | 74 (100.0%) |
| 10 or more Apartments | 10 (3.9%) | 248 (96.1%) |
| Mobile Home / Other | 394 (72.0%) | 153 (28.0%) |
| Total | 2,834 (61.5%) | 1,778 (38.6%) |
Housing Structures by Number of Rooms in Prineville
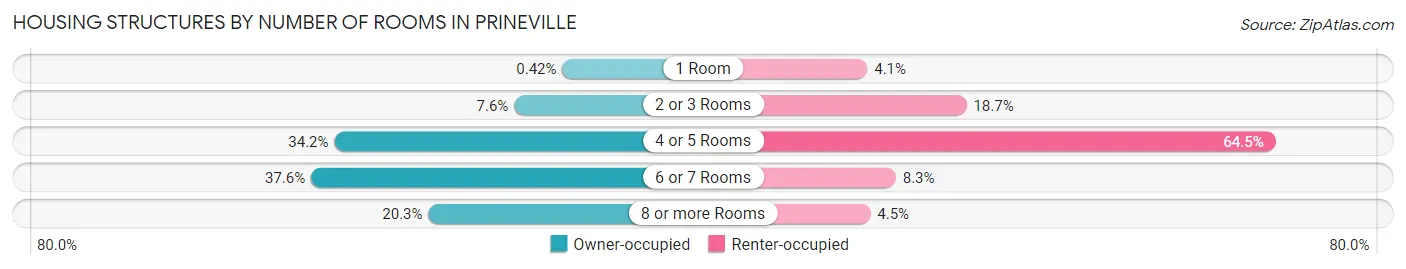
| Number of Rooms | Owner-occupied | Renter-occupied |
| 1 Room | 12 (0.4%) | 72 (4.1%) |
| 2 or 3 Rooms | 214 (7.5%) | 333 (18.7%) |
| 4 or 5 Rooms | 968 (34.2%) | 1,146 (64.4%) |
| 6 or 7 Rooms | 1,066 (37.6%) | 147 (8.3%) |
| 8 or more Rooms | 574 (20.3%) | 80 (4.5%) |
| Total | 2,834 (100.0%) | 1,778 (100.0%) |
Housing Structure by Heating Type in Prineville
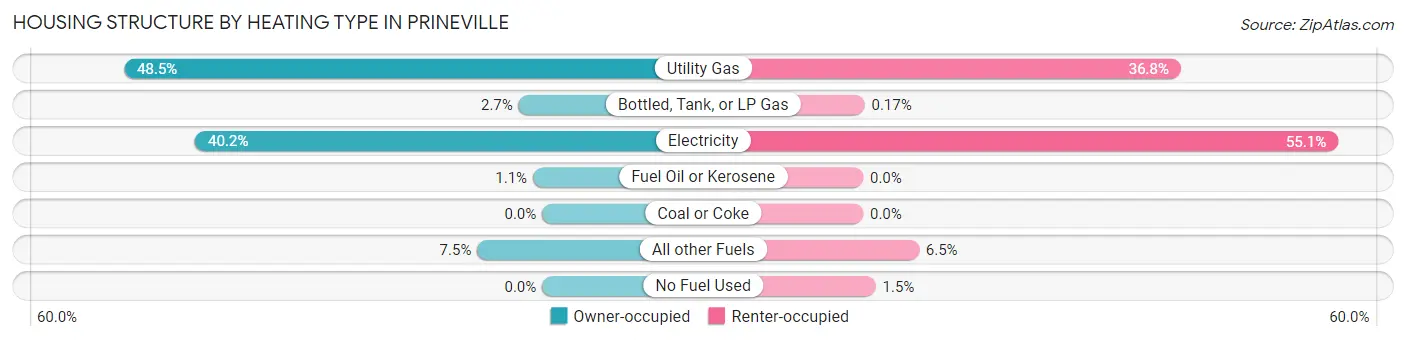
| Heating Type | Owner-occupied | Renter-occupied |
| Utility Gas | 1,374 (48.5%) | 655 (36.8%) |
| Bottled, Tank, or LP Gas | 77 (2.7%) | 3 (0.2%) |
| Electricity | 1,140 (40.2%) | 979 (55.1%) |
| Fuel Oil or Kerosene | 30 (1.1%) | 0 (0.0%) |
| Coal or Coke | 0 (0.0%) | 0 (0.0%) |
| All other Fuels | 213 (7.5%) | 115 (6.5%) |
| No Fuel Used | 0 (0.0%) | 26 (1.5%) |
| Total | 2,834 (100.0%) | 1,778 (100.0%) |
Household Vehicle Usage in Prineville
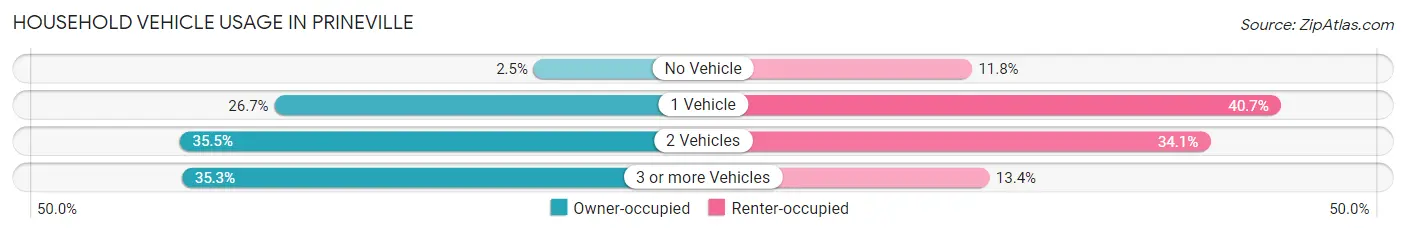
| Vehicles per Household | Owner-occupied | Renter-occupied |
| No Vehicle | 70 (2.5%) | 210 (11.8%) |
| 1 Vehicle | 756 (26.7%) | 723 (40.7%) |
| 2 Vehicles | 1,007 (35.5%) | 606 (34.1%) |
| 3 or more Vehicles | 1,001 (35.3%) | 239 (13.4%) |
| Total | 2,834 (100.0%) | 1,778 (100.0%) |
Real Estate & Mortgages in Prineville
Real Estate and Mortgage Overview in Prineville
| Characteristic | Without Mortgage | With Mortgage |
| Housing Units | 983 | 1,851 |
| Median Property Value | $232,200 | $320,400 |
| Median Household Income | $46,845 | $162 |
| Monthly Housing Costs | $486 | $102 |
| Real Estate Taxes | $1,887 | $21 |
Property Value by Mortgage Status in Prineville
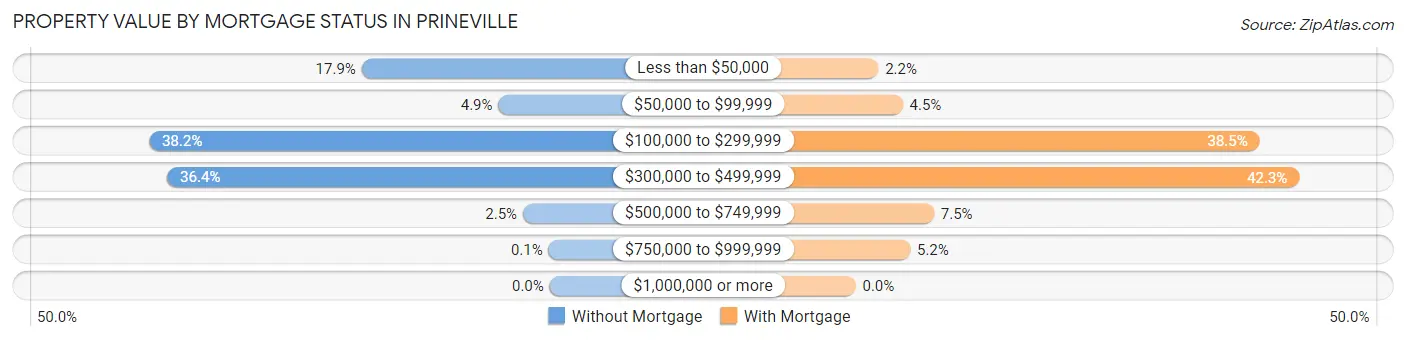
| Property Value | Without Mortgage | With Mortgage |
| Less than $50,000 | 176 (17.9%) | 40 (2.2%) |
| $50,000 to $99,999 | 48 (4.9%) | 83 (4.5%) |
| $100,000 to $299,999 | 375 (38.2%) | 712 (38.5%) |
| $300,000 to $499,999 | 358 (36.4%) | 782 (42.2%) |
| $500,000 to $749,999 | 25 (2.5%) | 138 (7.5%) |
| $750,000 to $999,999 | 1 (0.1%) | 96 (5.2%) |
| $1,000,000 or more | 0 (0.0%) | 0 (0.0%) |
| Total | 983 (100.0%) | 1,851 (100.0%) |
Household Income by Mortgage Status in Prineville
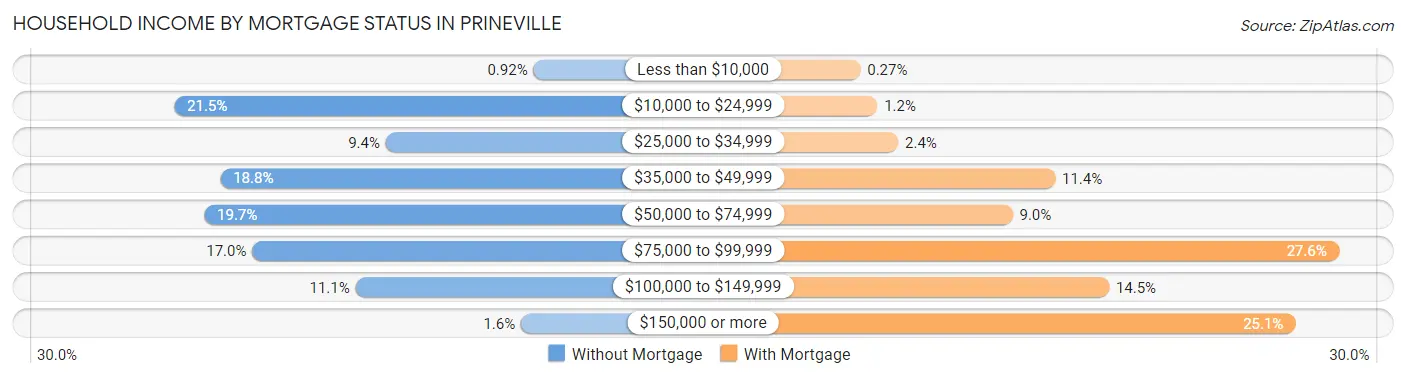
| Household Income | Without Mortgage | With Mortgage |
| Less than $10,000 | 9 (0.9%) | 5 (0.3%) |
| $10,000 to $24,999 | 211 (21.5%) | 23 (1.2%) |
| $25,000 to $34,999 | 92 (9.4%) | 45 (2.4%) |
| $35,000 to $49,999 | 185 (18.8%) | 211 (11.4%) |
| $50,000 to $74,999 | 194 (19.7%) | 166 (9.0%) |
| $75,000 to $99,999 | 167 (17.0%) | 511 (27.6%) |
| $100,000 to $149,999 | 109 (11.1%) | 268 (14.5%) |
| $150,000 or more | 16 (1.6%) | 465 (25.1%) |
| Total | 983 (100.0%) | 1,851 (100.0%) |
Property Value to Household Income Ratio in Prineville
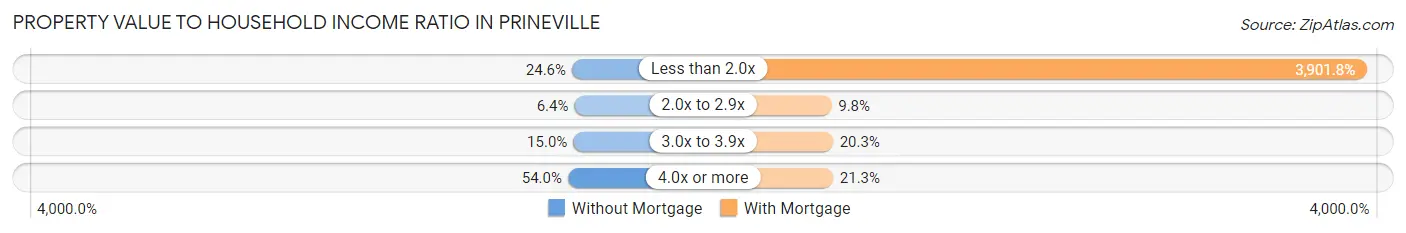
| Value-to-Income Ratio | Without Mortgage | With Mortgage |
| Less than 2.0x | 242 (24.6%) | 72,223 (3,901.8%) |
| 2.0x to 2.9x | 63 (6.4%) | 182 (9.8%) |
| 3.0x to 3.9x | 147 (14.9%) | 375 (20.3%) |
| 4.0x or more | 531 (54.0%) | 395 (21.3%) |
| Total | 983 (100.0%) | 1,851 (100.0%) |
Real Estate Taxes by Mortgage Status in Prineville
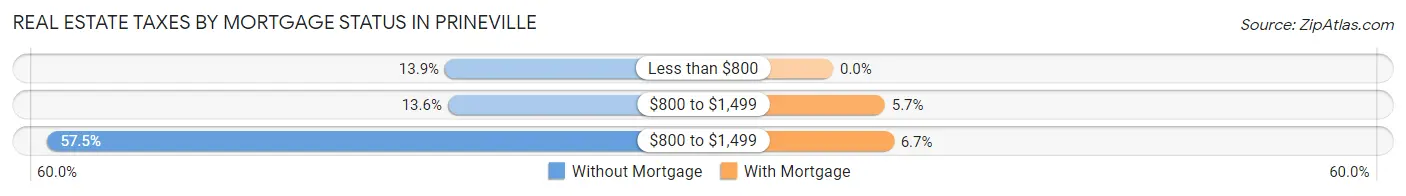
| Property Taxes | Without Mortgage | With Mortgage |
| Less than $800 | 137 (13.9%) | 0 (0.0%) |
| $800 to $1,499 | 134 (13.6%) | 105 (5.7%) |
| $800 to $1,499 | 565 (57.5%) | 123 (6.7%) |
| Total | 983 (100.0%) | 1,851 (100.0%) |
Health & Disability in Prineville
Health Insurance Coverage by Age in Prineville
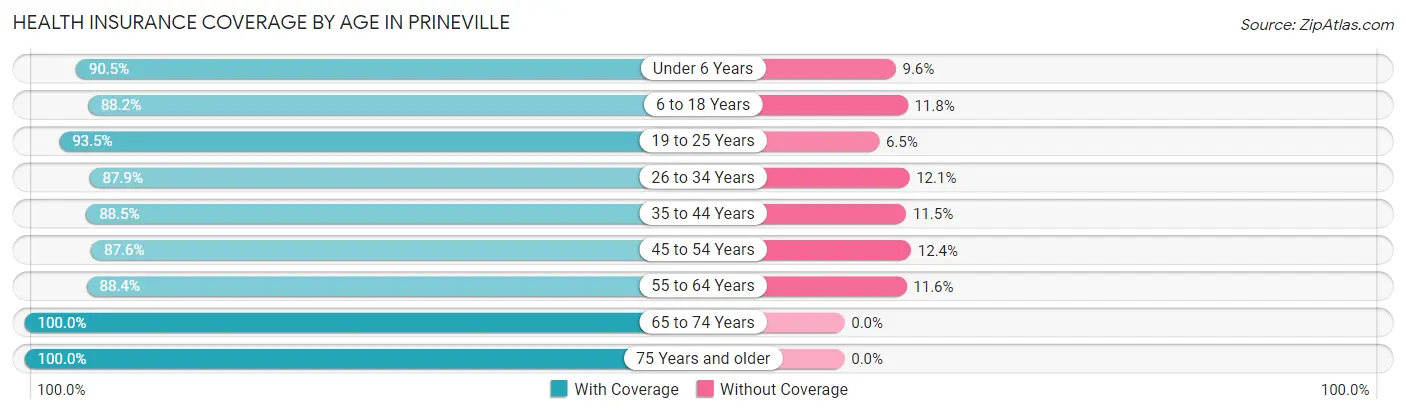
| Age Bracket | With Coverage | Without Coverage |
| Under 6 Years | 748 (90.4%) | 79 (9.6%) |
| 6 to 18 Years | 1,393 (88.2%) | 186 (11.8%) |
| 19 to 25 Years | 652 (93.5%) | 45 (6.5%) |
| 26 to 34 Years | 1,176 (87.9%) | 162 (12.1%) |
| 35 to 44 Years | 1,347 (88.5%) | 175 (11.5%) |
| 45 to 54 Years | 1,235 (87.6%) | 175 (12.4%) |
| 55 to 64 Years | 1,131 (88.4%) | 148 (11.6%) |
| 65 to 74 Years | 1,419 (100.0%) | 0 (0.0%) |
| 75 Years and older | 778 (100.0%) | 0 (0.0%) |
| Total | 9,879 (91.1%) | 970 (8.9%) |
Health Insurance Coverage by Citizenship Status in Prineville
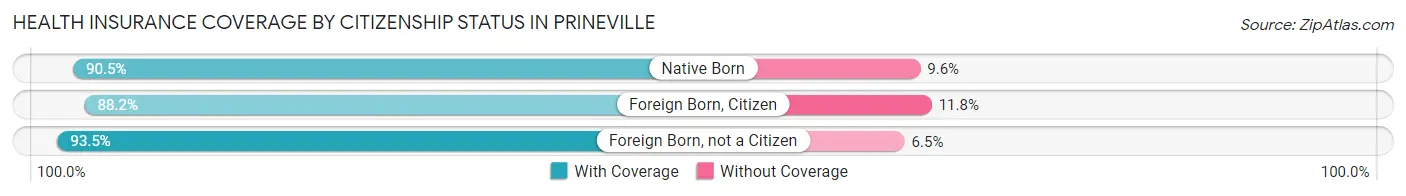
| Citizenship Status | With Coverage | Without Coverage |
| Native Born | 748 (90.4%) | 79 (9.6%) |
| Foreign Born, Citizen | 1,393 (88.2%) | 186 (11.8%) |
| Foreign Born, not a Citizen | 652 (93.5%) | 45 (6.5%) |
Health Insurance Coverage by Household Income in Prineville
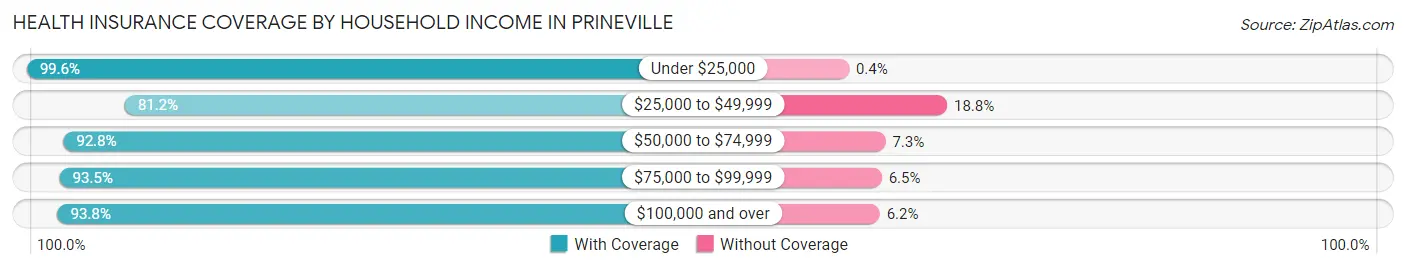
| Household Income | With Coverage | Without Coverage |
| Under $25,000 | 1,242 (99.6%) | 5 (0.4%) |
| $25,000 to $49,999 | 2,232 (81.2%) | 516 (18.8%) |
| $50,000 to $74,999 | 1,816 (92.7%) | 142 (7.2%) |
| $75,000 to $99,999 | 1,800 (93.5%) | 126 (6.5%) |
| $100,000 and over | 2,708 (93.8%) | 178 (6.2%) |
Public vs Private Health Insurance Coverage by Age in Prineville
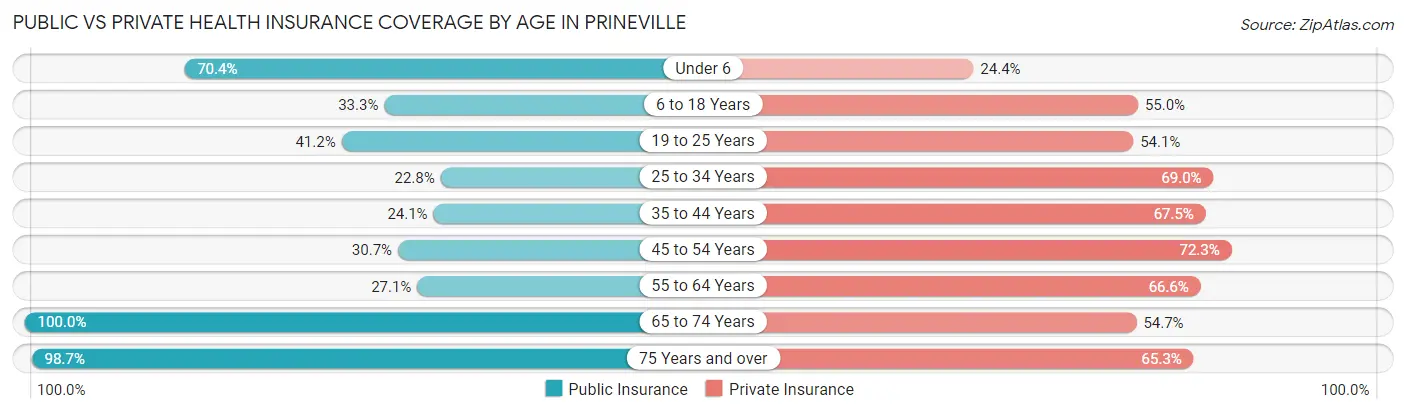
| Age Bracket | Public Insurance | Private Insurance |
| Under 6 | 582 (70.4%) | 202 (24.4%) |
| 6 to 18 Years | 525 (33.3%) | 868 (55.0%) |
| 19 to 25 Years | 287 (41.2%) | 377 (54.1%) |
| 25 to 34 Years | 305 (22.8%) | 923 (69.0%) |
| 35 to 44 Years | 367 (24.1%) | 1,028 (67.5%) |
| 45 to 54 Years | 433 (30.7%) | 1,020 (72.3%) |
| 55 to 64 Years | 347 (27.1%) | 852 (66.6%) |
| 65 to 74 Years | 1,419 (100.0%) | 776 (54.7%) |
| 75 Years and over | 768 (98.7%) | 508 (65.3%) |
| Total | 5,033 (46.4%) | 6,554 (60.4%) |
Disability Status by Sex by Age in Prineville
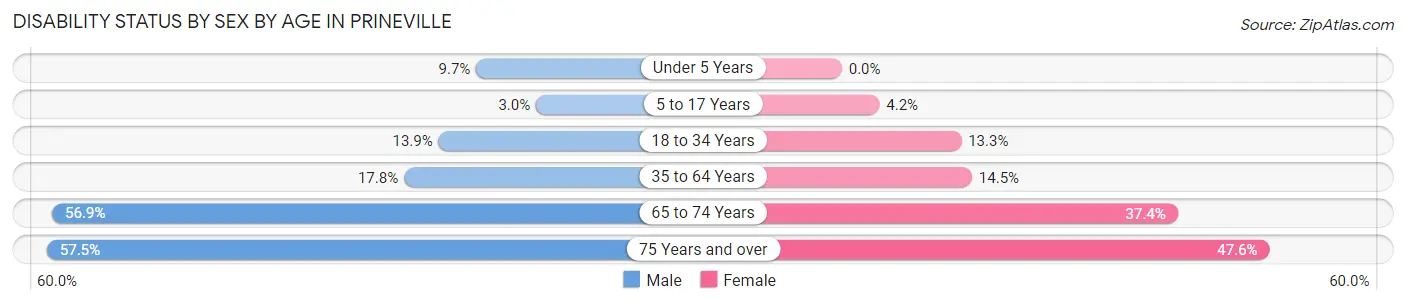
| Age Bracket | Male | Female |
| Under 5 Years | 44 (9.7%) | 0 (0.0%) |
| 5 to 17 Years | 23 (3.0%) | 34 (4.2%) |
| 18 to 34 Years | 150 (13.9%) | 143 (13.3%) |
| 35 to 64 Years | 369 (17.7%) | 309 (14.5%) |
| 65 to 74 Years | 304 (56.9%) | 331 (37.4%) |
| 75 Years and over | 218 (57.5%) | 190 (47.6%) |
Disability Class by Sex by Age in Prineville
Disability Class: Hearing Difficulty
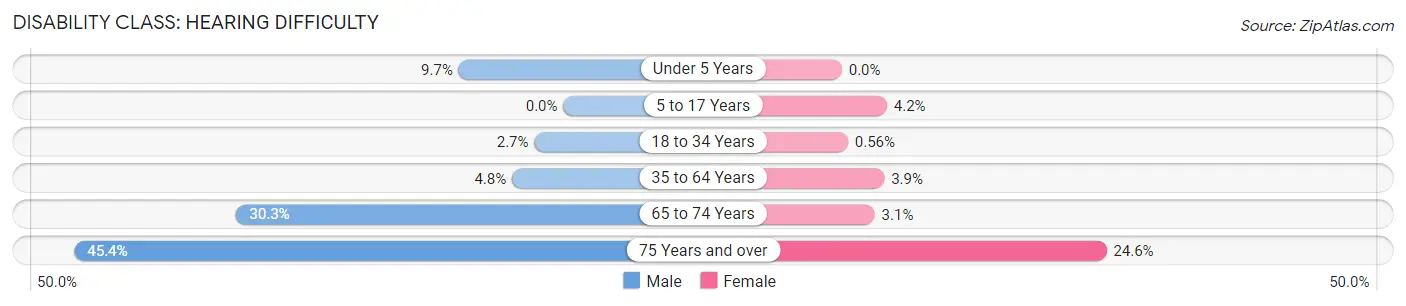
| Age Bracket | Male | Female |
| Under 5 Years | 44 (9.7%) | 0 (0.0%) |
| 5 to 17 Years | 0 (0.0%) | 34 (4.2%) |
| 18 to 34 Years | 29 (2.7%) | 6 (0.6%) |
| 35 to 64 Years | 99 (4.8%) | 84 (3.9%) |
| 65 to 74 Years | 162 (30.3%) | 27 (3.0%) |
| 75 Years and over | 172 (45.4%) | 98 (24.6%) |
Disability Class: Vision Difficulty
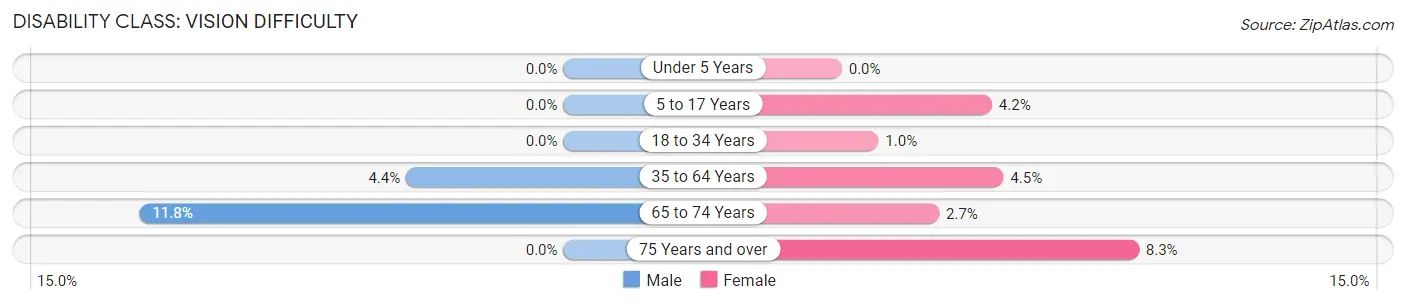
| Age Bracket | Male | Female |
| Under 5 Years | 0 (0.0%) | 0 (0.0%) |
| 5 to 17 Years | 0 (0.0%) | 34 (4.2%) |
| 18 to 34 Years | 0 (0.0%) | 11 (1.0%) |
| 35 to 64 Years | 91 (4.4%) | 96 (4.5%) |
| 65 to 74 Years | 63 (11.8%) | 24 (2.7%) |
| 75 Years and over | 0 (0.0%) | 33 (8.3%) |
Disability Class: Cognitive Difficulty
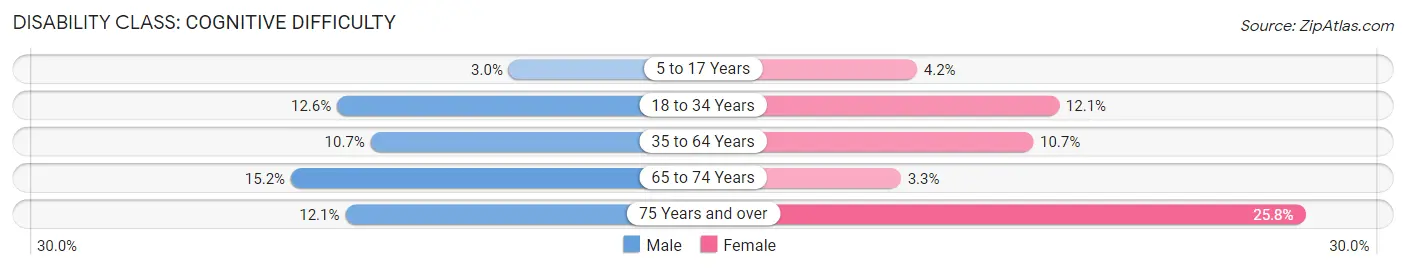
| Age Bracket | Male | Female |
| 5 to 17 Years | 23 (3.0%) | 34 (4.2%) |
| 18 to 34 Years | 136 (12.6%) | 130 (12.1%) |
| 35 to 64 Years | 223 (10.7%) | 227 (10.6%) |
| 65 to 74 Years | 81 (15.2%) | 29 (3.3%) |
| 75 Years and over | 46 (12.1%) | 103 (25.8%) |
Disability Class: Ambulatory Difficulty
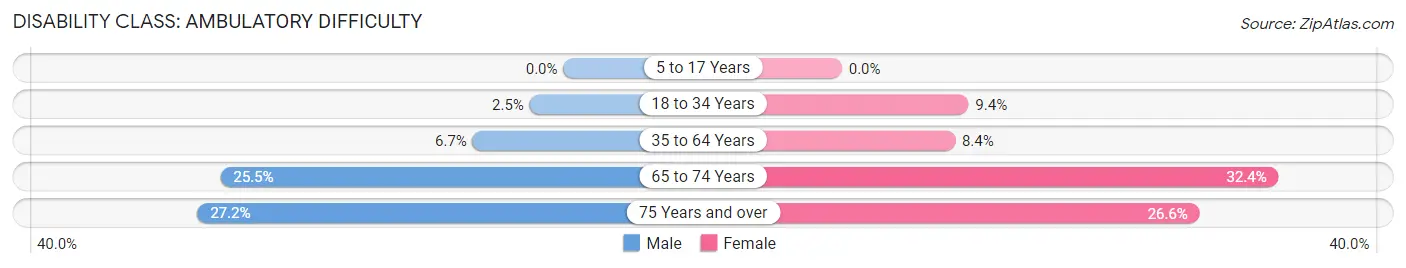
| Age Bracket | Male | Female |
| 5 to 17 Years | 0 (0.0%) | 0 (0.0%) |
| 18 to 34 Years | 27 (2.5%) | 101 (9.4%) |
| 35 to 64 Years | 140 (6.7%) | 179 (8.4%) |
| 65 to 74 Years | 136 (25.5%) | 287 (32.4%) |
| 75 Years and over | 103 (27.2%) | 106 (26.6%) |
Disability Class: Self-Care Difficulty
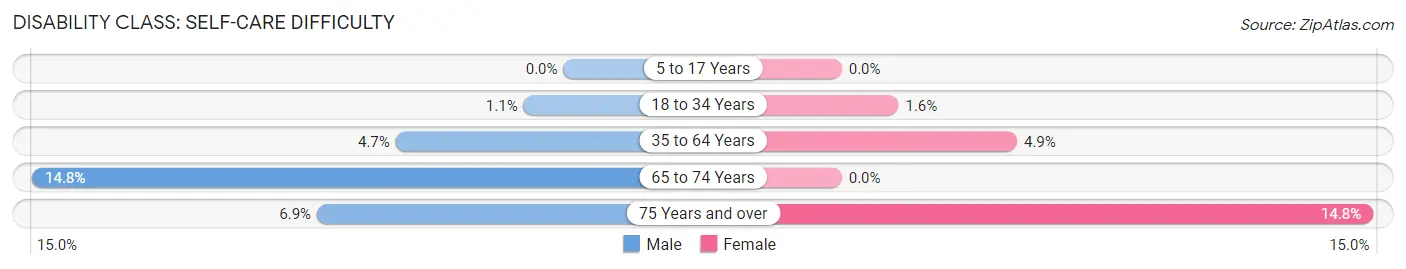
| Age Bracket | Male | Female |
| 5 to 17 Years | 0 (0.0%) | 0 (0.0%) |
| 18 to 34 Years | 12 (1.1%) | 17 (1.6%) |
| 35 to 64 Years | 97 (4.7%) | 104 (4.9%) |
| 65 to 74 Years | 79 (14.8%) | 0 (0.0%) |
| 75 Years and over | 26 (6.9%) | 59 (14.8%) |
Technology Access in Prineville
Computing Device Access in Prineville
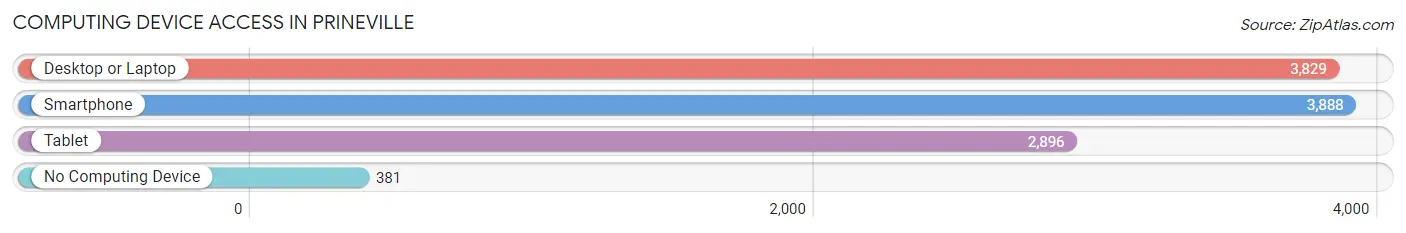
| Device Type | # Households | % Households |
| Desktop or Laptop | 3,829 | 83.0% |
| Smartphone | 3,888 | 84.3% |
| Tablet | 2,896 | 62.8% |
| No Computing Device | 381 | 8.3% |
| Total | 4,612 | 100.0% |
Internet Access in Prineville
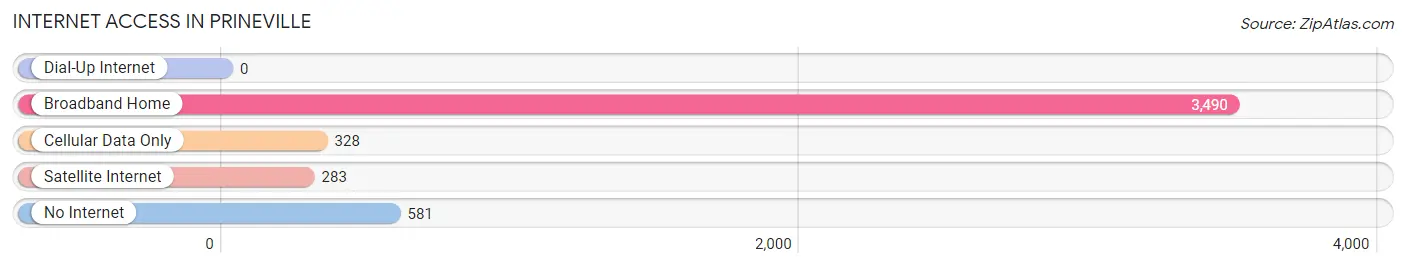
| Internet Type | # Households | % Households |
| Dial-Up Internet | 0 | 0.0% |
| Broadband Home | 3,490 | 75.7% |
| Cellular Data Only | 328 | 7.1% |
| Satellite Internet | 283 | 6.1% |
| No Internet | 581 | 12.6% |
| Total | 4,612 | 100.0% |
Prineville Summary
Prineville, Oregon is a small city located in the heart of Central Oregon. It is the county seat of Crook County and is situated in the foothills of the Ochoco Mountains. Prineville is a rural community with a population of approximately 9,253 people as of the 2020 census.
History
Prineville was founded in 1877 by Barney Prine, a former soldier in the Civil War. Prine had been sent to the area to survey the land for the Oregon Central Military Road. He decided to stay and build a homestead, which he named Prineville. The town was officially incorporated in 1880.
In the early days, Prineville was a small farming community. The main crops were wheat, oats, and barley. The town also had a few small businesses, including a general store, a blacksmith shop, and a saloon.
In the late 1800s, Prineville began to grow as a logging town. The first sawmill was built in 1885 and the town quickly became a hub for the timber industry. The railroad arrived in 1887, connecting Prineville to the rest of the state.
In the early 1900s, Prineville experienced a boom in population and industry. The town was home to several large lumber mills, a brick factory, and a cannery. The population grew to over 2,000 people by 1910.
Geography
Prineville is located in the high desert of Central Oregon. The city is situated in the foothills of the Ochoco Mountains, at an elevation of 3,000 feet. The city is surrounded by rolling hills and sagebrush-covered plains.
The climate in Prineville is semi-arid, with hot summers and cold winters. The average annual temperature is 54 degrees Fahrenheit. The average annual precipitation is 11 inches.
Economy
Prineville’s economy is largely based on agriculture and timber. The city is home to several large lumber mills, as well as a number of smaller sawmills. The city is also home to a number of agricultural businesses, including cattle ranches, hay farms, and fruit orchards.
The city is also home to a number of technology companies, including Facebook, Apple, and Google. These companies have established data centers in Prineville, bringing jobs and economic growth to the area.
Demographics
As of the 2020 census, Prineville had a population of 9,253 people. The racial makeup of the city was 91.3% White, 0.7% African American, 0.7% Native American, 0.7% Asian, 0.2% Pacific Islander, and 5.7% from other races.
The median household income in Prineville was $45,845 in 2019. The median home value was $219,000. The median age of the population was 38.7 years.
Prineville is a small, rural community with a rich history and a bright future. The city is home to a diverse population and a thriving economy. Prineville is a great place to live, work, and play.
Common Questions
What is Per Capita Income in Prineville?
Per Capita income in Prineville is $29,991.
What is the Median Family Income in Prineville?
Median Family Income in Prineville is $71,370.
What is the Median Household income in Prineville?
Median Household Income in Prineville is $63,904.
What is Income or Wage Gap in Prineville?
Income or Wage Gap in Prineville is 25.1%.
Women in Prineville earn 74.9 cents for every dollar earned by a man.
What is Inequality or Gini Index in Prineville?
Inequality or Gini Index in Prineville is 0.37.
What is the Total Population of Prineville?
Total Population of Prineville is 10,915.
What is the Total Male Population of Prineville?
Total Male Population of Prineville is 5,337.
What is the Total Female Population of Prineville?
Total Female Population of Prineville is 5,578.
What is the Ratio of Males per 100 Females in Prineville?
There are 95.68 Males per 100 Females in Prineville.
What is the Ratio of Females per 100 Males in Prineville?
There are 104.52 Females per 100 Males in Prineville.
What is the Median Population Age in Prineville?
Median Population Age in Prineville is 40.7 Years.
What is the Average Family Size in Prineville
Average Family Size in Prineville is 2.8 People.
What is the Average Household Size in Prineville
Average Household Size in Prineville is 2.3 People.
How Large is the Labor Force in Prineville?
There are 5,410 People in the Labor Forcein in Prineville.
What is the Percentage of People in the Labor Force in Prineville?
61.1% of People are in the Labor Force in Prineville.
What is the Unemployment Rate in Prineville?
Unemployment Rate in Prineville is 6.4%.