Early, TX Map & Demographics
Early Map
Early Overview
$29,754
PER CAPITA INCOME
$73,162
AVG FAMILY INCOME
$60,313
AVG HOUSEHOLD INCOME
51.6%
WAGE / INCOME GAP [ % ]
48.4¢/ $1
WAGE / INCOME GAP [ $ ]
0.37
INEQUALITY / GINI INDEX
3,116
TOTAL POPULATION
1,555
MALE POPULATION
1,561
FEMALE POPULATION
99.62
MALES / 100 FEMALES
100.39
FEMALES / 100 MALES
36.2
MEDIAN AGE
3.2
AVG FAMILY SIZE
2.6
AVG HOUSEHOLD SIZE
1,496
LABOR FORCE [ PEOPLE ]
68.3%
PERCENT IN LABOR FORCE
2.4%
UNEMPLOYMENT RATE
Early Zip Codes
Early Area Codes
Income in Early
Income Overview in Early
Per Capita Income in Early is $29,754, while median incomes of families and households are $73,162 and $60,313 respectively.
| Characteristic | Number | Measure |
| Per Capita Income | 3,116 | $29,754 |
| Median Family Income | 783 | $73,162 |
| Mean Family Income | 783 | $84,481 |
| Median Household Income | 1,175 | $60,313 |
| Mean Household Income | 1,175 | $75,684 |
| Income Deficit | 783 | $0 |
| Wage / Income Gap (%) | 3,116 | 51.57% |
| Wage / Income Gap ($) | 3,116 | 48.43¢ per $1 |
| Gini / Inequality Index | 3,116 | 0.37 |
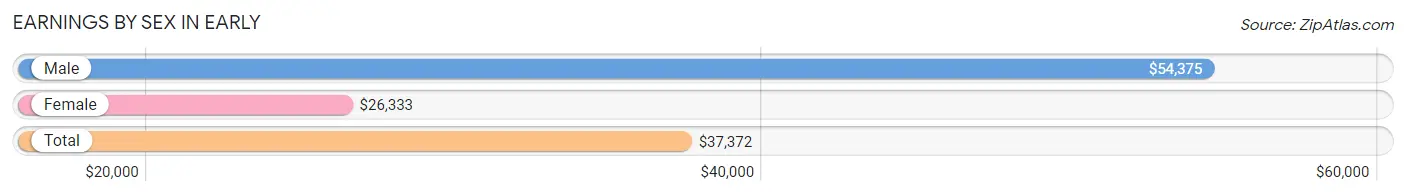
Earnings by Sex in Early
Average Earnings in Early are $37,372, $54,375 for men and $26,333 for women, a difference of 51.6%.
| Sex | Number | Average Earnings |
| Male | 742 (48.4%) | $54,375 |
| Female | 792 (51.6%) | $26,333 |
| Total | 1,534 (100.0%) | $37,372 |
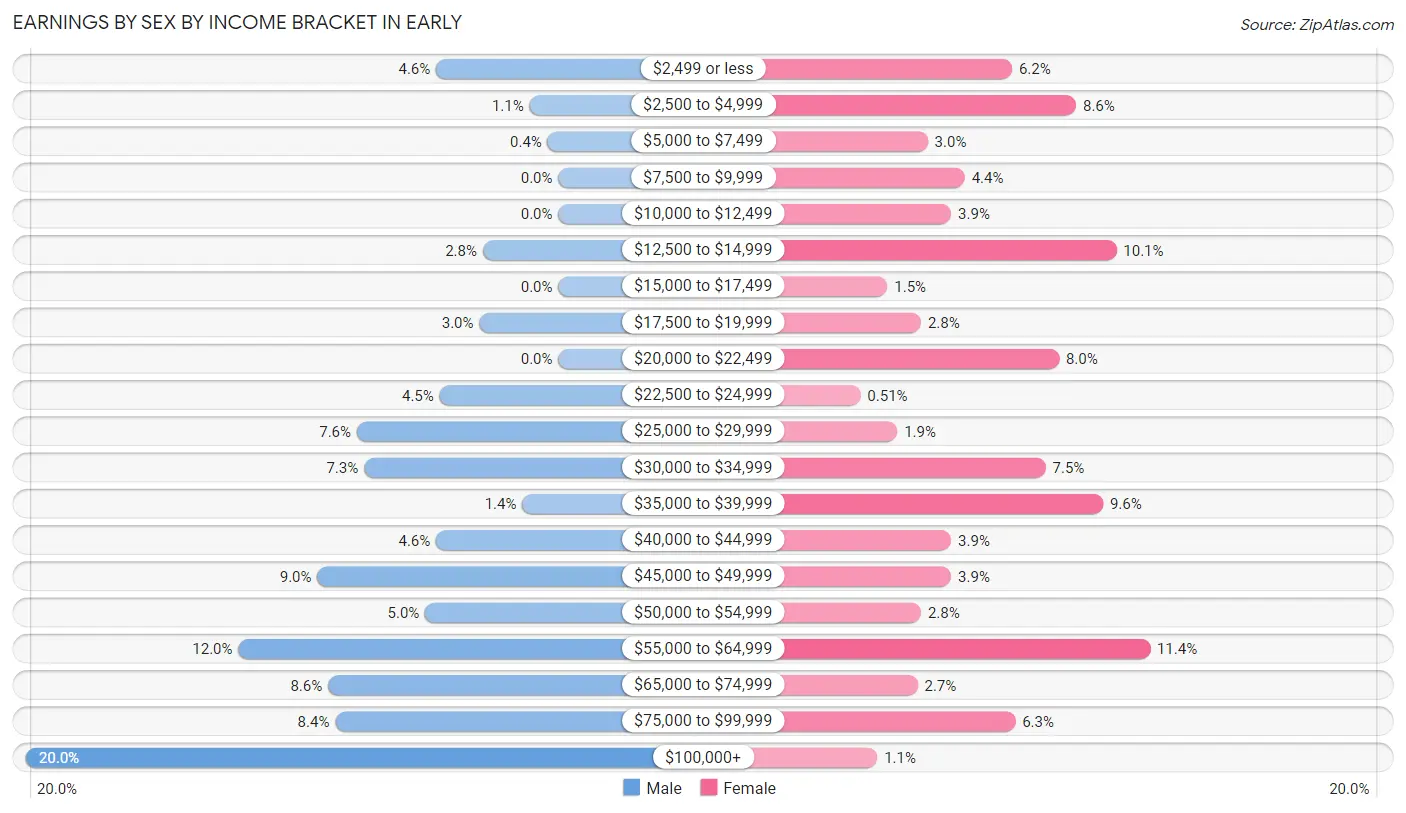
Earnings by Sex by Income Bracket in Early
The most common earnings brackets in Early are $100,000+ for men (148 | 20.0%) and $55,000 to $64,999 for women (90 | 11.4%).
| Income | Male | Female |
| $2,499 or less | 34 (4.6%) | 49 (6.2%) |
| $2,500 to $4,999 | 8 (1.1%) | 68 (8.6%) |
| $5,000 to $7,499 | 3 (0.4%) | 24 (3.0%) |
| $7,500 to $9,999 | 0 (0.0%) | 35 (4.4%) |
| $10,000 to $12,499 | 0 (0.0%) | 31 (3.9%) |
| $12,500 to $14,999 | 21 (2.8%) | 80 (10.1%) |
| $15,000 to $17,499 | 0 (0.0%) | 12 (1.5%) |
| $17,500 to $19,999 | 22 (3.0%) | 22 (2.8%) |
| $20,000 to $22,499 | 0 (0.0%) | 63 (8.0%) |
| $22,500 to $24,999 | 33 (4.4%) | 4 (0.5%) |
| $25,000 to $29,999 | 56 (7.5%) | 15 (1.9%) |
| $30,000 to $34,999 | 54 (7.3%) | 59 (7.4%) |
| $35,000 to $39,999 | 10 (1.3%) | 76 (9.6%) |
| $40,000 to $44,999 | 34 (4.6%) | 31 (3.9%) |
| $45,000 to $49,999 | 67 (9.0%) | 31 (3.9%) |
| $50,000 to $54,999 | 37 (5.0%) | 22 (2.8%) |
| $55,000 to $64,999 | 89 (12.0%) | 90 (11.4%) |
| $65,000 to $74,999 | 64 (8.6%) | 21 (2.6%) |
| $75,000 to $99,999 | 62 (8.4%) | 50 (6.3%) |
| $100,000+ | 148 (20.0%) | 9 (1.1%) |
| Total | 742 (100.0%) | 792 (100.0%) |
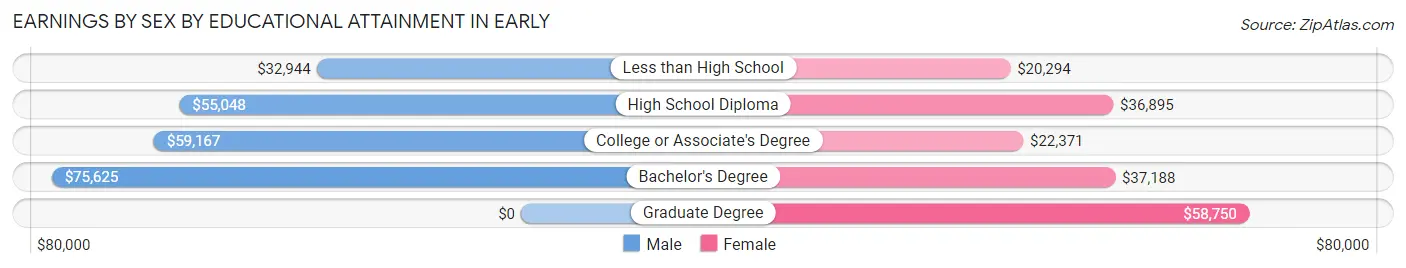
Earnings by Sex by Educational Attainment in Early
Average earnings in Early are $56,202 for men and $31,964 for women, a difference of 43.1%. Men with an educational attainment of bachelor's degree enjoy the highest average annual earnings of $75,625, while those with less than high school education earn the least with $32,944. Women with an educational attainment of graduate degree earn the most with the average annual earnings of $58,750, while those with less than high school education have the smallest earnings of $20,294.
| Educational Attainment | Male Income | Female Income |
| Less than High School | $32,944 | $20,294 |
| High School Diploma | $55,048 | $36,895 |
| College or Associate's Degree | $59,167 | $22,371 |
| Bachelor's Degree | $75,625 | $37,188 |
| Graduate Degree | - | - |
| Total | $56,202 | $31,964 |
Family Income in Early
Family Income Brackets in Early
According to the Early family income data, there are 166 families falling into the $50,000 to $74,999 income range, which is the most common income bracket and makes up 21.2% of all families.
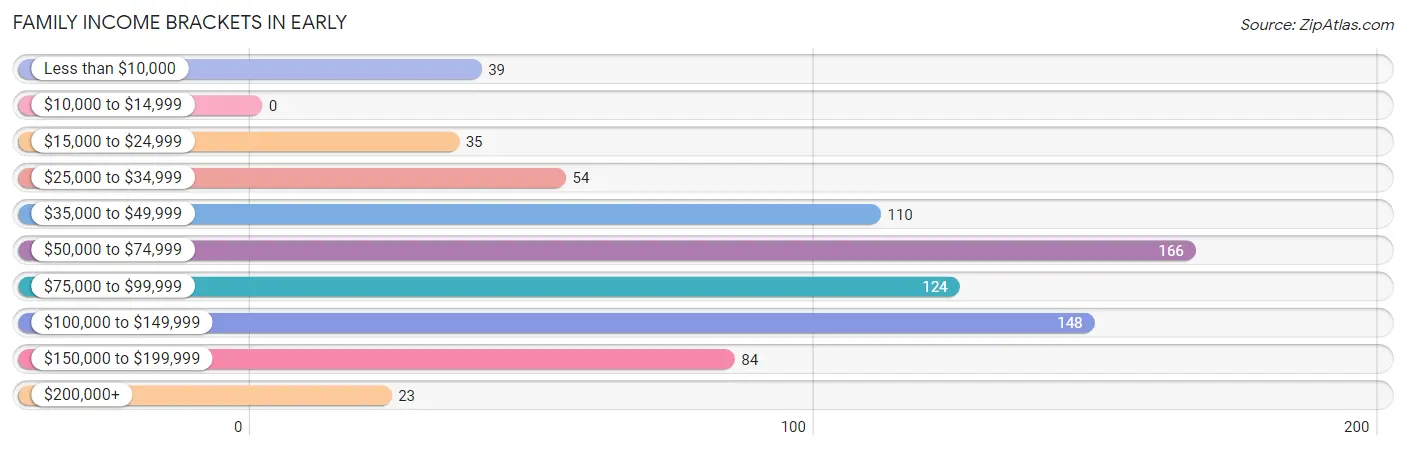
| Income Bracket | # Families | % Families |
| Less than $10,000 | 39 | 5.0% |
| $10,000 to $14,999 | 0 | 0.0% |
| $15,000 to $24,999 | 35 | 4.5% |
| $25,000 to $34,999 | 54 | 6.9% |
| $35,000 to $49,999 | 110 | 14.0% |
| $50,000 to $74,999 | 166 | 21.2% |
| $75,000 to $99,999 | 124 | 15.8% |
| $100,000 to $149,999 | 148 | 18.9% |
| $150,000 to $199,999 | 84 | 10.7% |
| $200,000+ | 23 | 2.9% |
Family Income by Famaliy Size in Early
5-person families (82 | 10.5%) account for the highest median family income in Early with $122,188 per family, while 3-person families (142 | 18.1%) have the highest median income of $30,000 per family member.
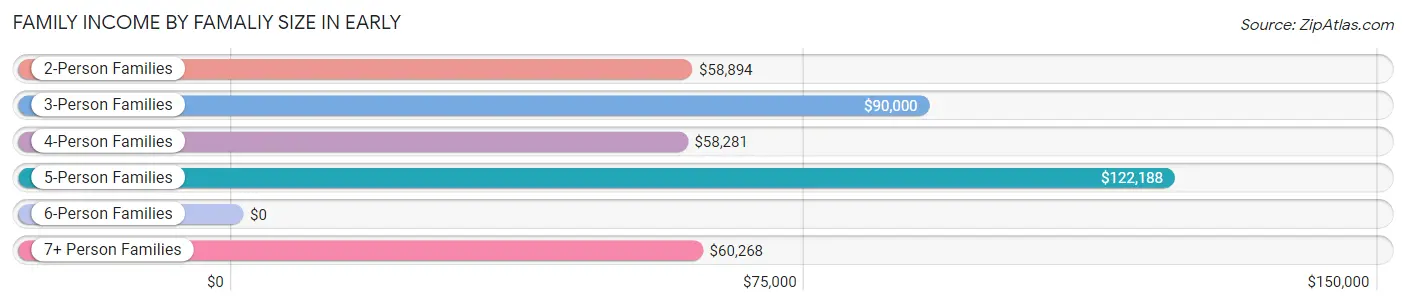
| Income Bracket | # Families | Median Income |
| 2-Person Families | 351 (44.8%) | $58,894 |
| 3-Person Families | 142 (18.1%) | $90,000 |
| 4-Person Families | 152 (19.4%) | $58,281 |
| 5-Person Families | 82 (10.5%) | $122,188 |
| 6-Person Families | 0 (0.0%) | $0 |
| 7+ Person Families | 56 (7.1%) | $60,268 |
| Total | 783 (100.0%) | $73,162 |
Family Income by Number of Earners in Early
The median family income in Early is $73,162, with families comprising 3+ earners (80) having the highest median family income of $167,841, while families with 1 earner (253) have the lowest median family income of $48,346, accounting for 10.2% and 32.3% of families, respectively.
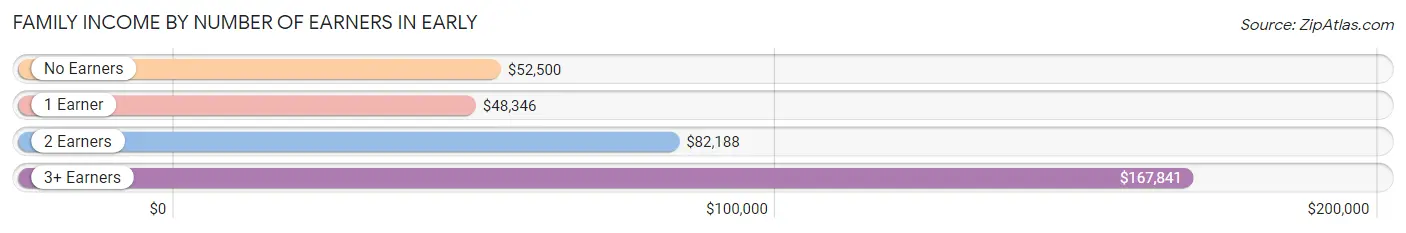
| Number of Earners | # Families | Median Income |
| No Earners | 80 (10.2%) | $52,500 |
| 1 Earner | 253 (32.3%) | $48,346 |
| 2 Earners | 370 (47.2%) | $82,188 |
| 3+ Earners | 80 (10.2%) | $167,841 |
| Total | 783 (100.0%) | $73,162 |
Household Income in Early
Household Income Brackets in Early
With 242 households falling in the category, the $100,000 to $149,999 income range is the most frequent in Early, accounting for 20.6% of all households. In contrast, only 11 households (0.9%) fall into the $10,000 to $14,999 income bracket, making it the least populous group.
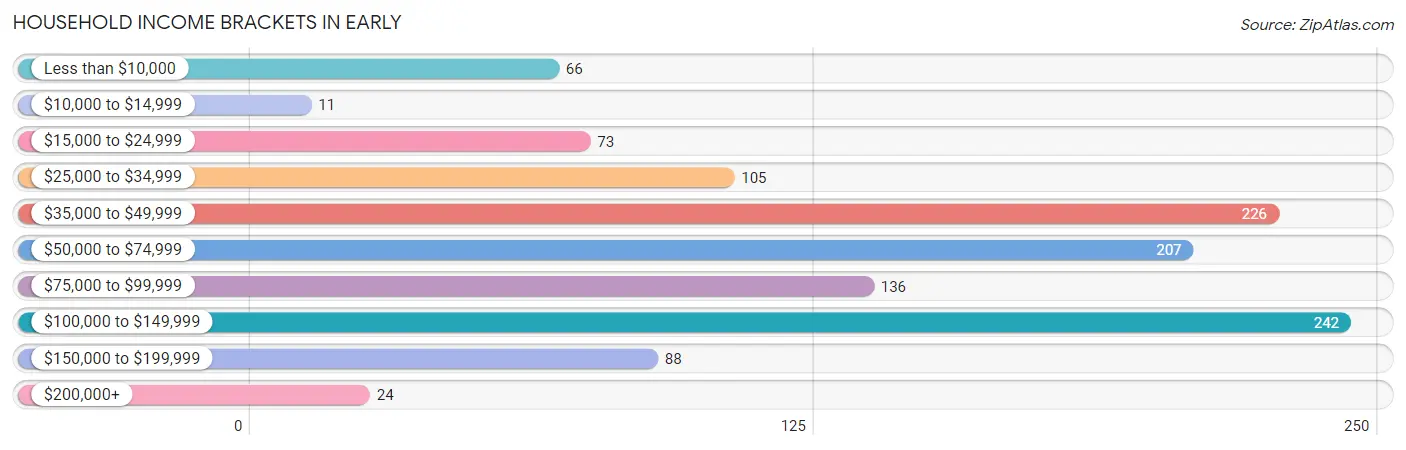
| Income Bracket | # Households | % Households |
| Less than $10,000 | 66 | 5.6% |
| $10,000 to $14,999 | 11 | 0.9% |
| $15,000 to $24,999 | 73 | 6.2% |
| $25,000 to $34,999 | 105 | 8.9% |
| $35,000 to $49,999 | 226 | 19.2% |
| $50,000 to $74,999 | 207 | 17.6% |
| $75,000 to $99,999 | 136 | 11.6% |
| $100,000 to $149,999 | 242 | 20.6% |
| $150,000 to $199,999 | 88 | 7.5% |
| $200,000+ | 24 | 2.0% |
Household Income by Householder Age in Early
The median household income in Early is $60,313, with the highest median household income of $73,750 found in the 25 to 44 years age bracket for the primary householder. A total of 401 households (34.1%) fall into this category. Meanwhile, the 15 to 24 years age bracket for the primary householder has the lowest median household income of $0, with 23 households (2.0%) in this group.
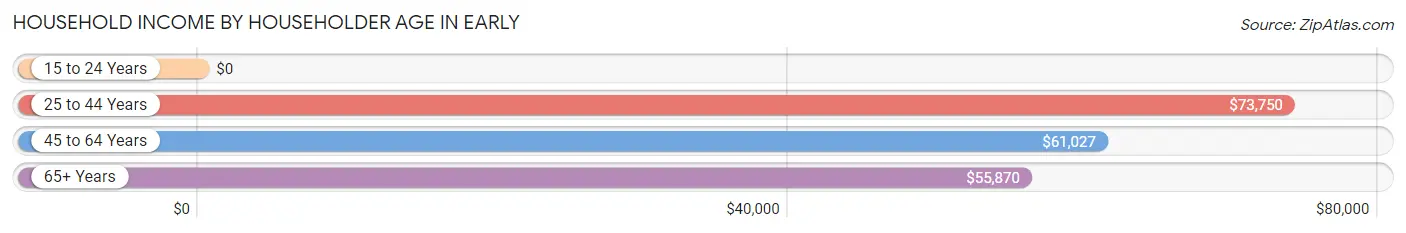
| Income Bracket | # Households | Median Income |
| 15 to 24 Years | 23 (2.0%) | $0 |
| 25 to 44 Years | 401 (34.1%) | $73,750 |
| 45 to 64 Years | 499 (42.5%) | $61,027 |
| 65+ Years | 252 (21.4%) | $55,870 |
| Total | 1,175 (100.0%) | $60,313 |
Poverty in Early
Income Below Poverty by Sex and Age in Early
With 5.5% poverty level for males and 16.5% for females among the residents of Early, 6 to 11 year old males and under 5 year old females are the most vulnerable to poverty, with 32 males (21.9%) and 66 females (50.4%) in their respective age groups living below the poverty level.
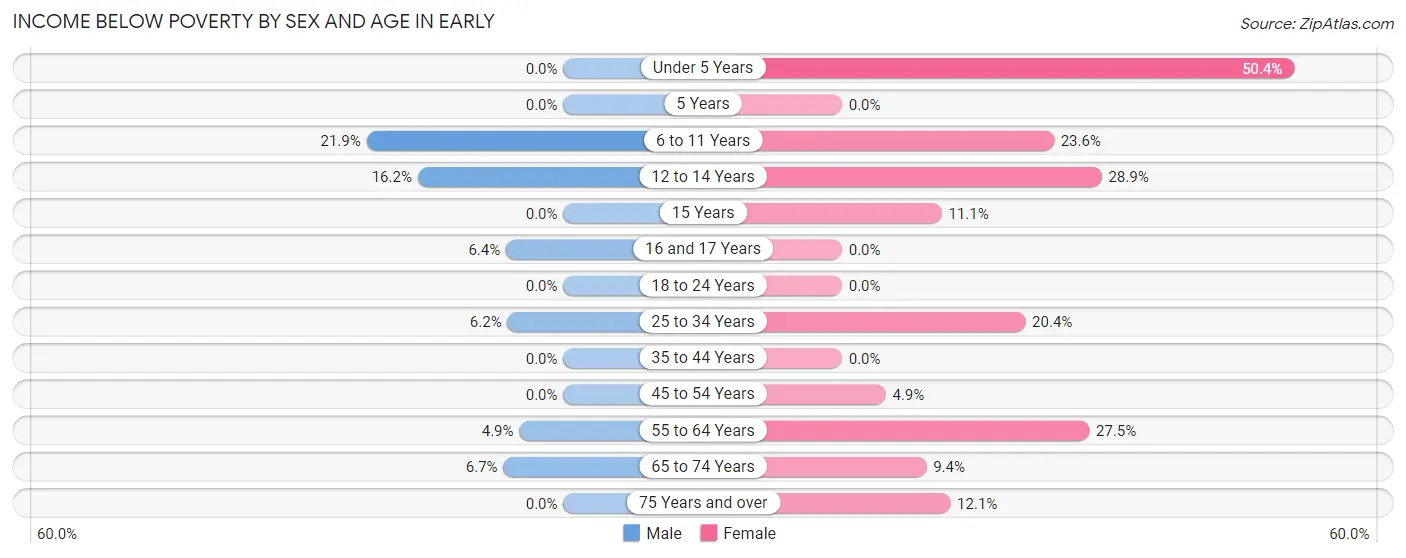
| Age Bracket | Male | Female |
| Under 5 Years | 0 (0.0%) | 66 (50.4%) |
| 5 Years | 0 (0.0%) | 0 (0.0%) |
| 6 to 11 Years | 32 (21.9%) | 38 (23.6%) |
| 12 to 14 Years | 24 (16.2%) | 24 (28.9%) |
| 15 Years | 0 (0.0%) | 3 (11.1%) |
| 16 and 17 Years | 3 (6.4%) | 0 (0.0%) |
| 18 to 24 Years | 0 (0.0%) | 0 (0.0%) |
| 25 to 34 Years | 13 (6.2%) | 39 (20.4%) |
| 35 to 44 Years | 0 (0.0%) | 0 (0.0%) |
| 45 to 54 Years | 0 (0.0%) | 11 (4.9%) |
| 55 to 64 Years | 7 (4.9%) | 46 (27.5%) |
| 65 to 74 Years | 5 (6.7%) | 11 (9.4%) |
| 75 Years and over | 0 (0.0%) | 14 (12.1%) |
| Total | 84 (5.5%) | 252 (16.5%) |
Income Above Poverty by Sex and Age in Early
According to the poverty statistics in Early, males aged under 5 years and females aged 5 years are the age groups that are most secure financially, with 100.0% of males and 100.0% of females in these age groups living above the poverty line.
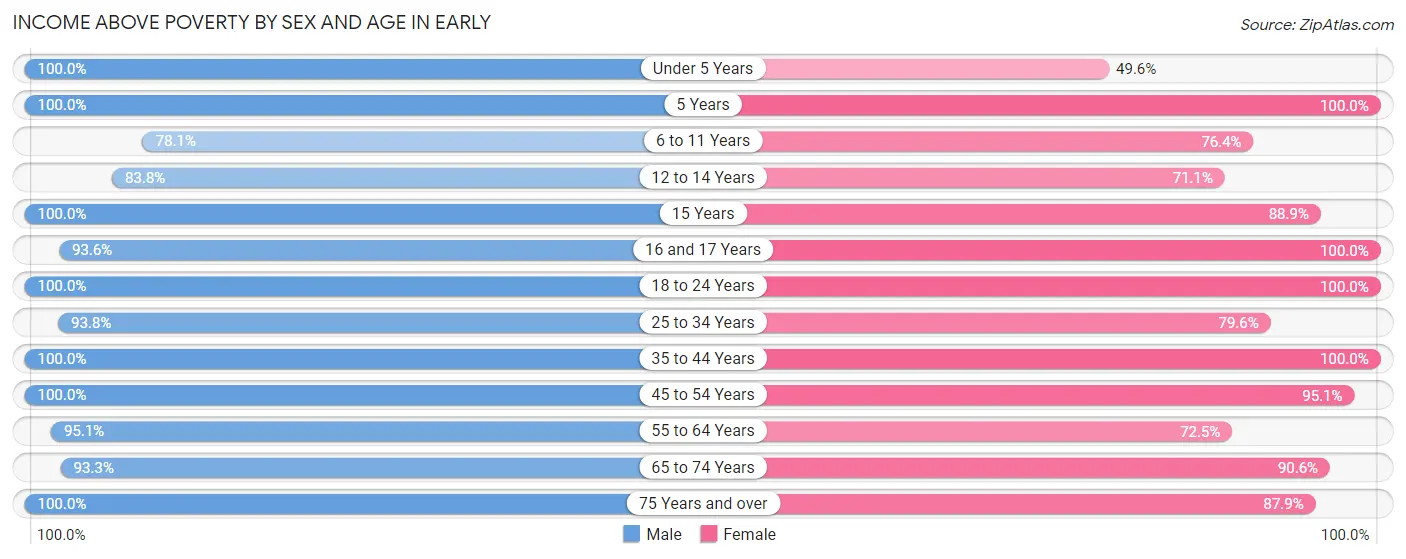
| Age Bracket | Male | Female |
| Under 5 Years | 72 (100.0%) | 65 (49.6%) |
| 5 Years | 26 (100.0%) | 26 (100.0%) |
| 6 to 11 Years | 114 (78.1%) | 123 (76.4%) |
| 12 to 14 Years | 124 (83.8%) | 59 (71.1%) |
| 15 Years | 53 (100.0%) | 24 (88.9%) |
| 16 and 17 Years | 44 (93.6%) | 45 (100.0%) |
| 18 to 24 Years | 51 (100.0%) | 77 (100.0%) |
| 25 to 34 Years | 196 (93.8%) | 152 (79.6%) |
| 35 to 44 Years | 189 (100.0%) | 159 (100.0%) |
| 45 to 54 Years | 236 (100.0%) | 215 (95.1%) |
| 55 to 64 Years | 136 (95.1%) | 121 (72.5%) |
| 65 to 74 Years | 70 (93.3%) | 106 (90.6%) |
| 75 Years and over | 142 (100.0%) | 102 (87.9%) |
| Total | 1,453 (94.5%) | 1,274 (83.5%) |
Income Below Poverty Among Married-Couple Families in Early
The poverty statistics for married-couple families in Early show that 1.4% or 8 of the total 568 families live below the poverty line. Families with no children have the highest poverty rate of 1.7%, comprising of 5 families. On the other hand, families with 3 or 4 children have the lowest poverty rate of 0.0%, which includes 0 families.
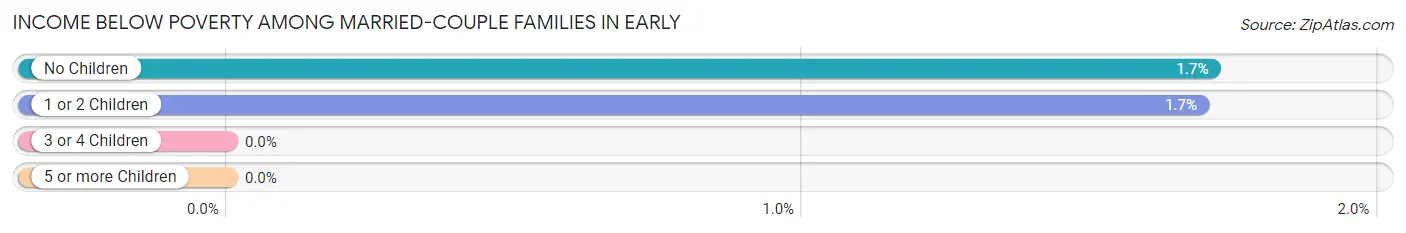
| Children | Above Poverty | Below Poverty |
| No Children | 287 (98.3%) | 5 (1.7%) |
| 1 or 2 Children | 174 (98.3%) | 3 (1.7%) |
| 3 or 4 Children | 71 (100.0%) | 0 (0.0%) |
| 5 or more Children | 28 (100.0%) | 0 (0.0%) |
| Total | 560 (98.6%) | 8 (1.4%) |
Income Below Poverty Among Single-Parent Households in Early
According to the poverty data in Early, 15.3% or 13 single-father households and 30.0% or 39 single-mother households are living below the poverty line. Among single-father households, those with 3 or 4 children have the highest poverty rate, with 13 households (100.0%) experiencing poverty. Likewise, among single-mother households, those with 3 or 4 children have the highest poverty rate, with 39 households (92.9%) falling below the poverty line.
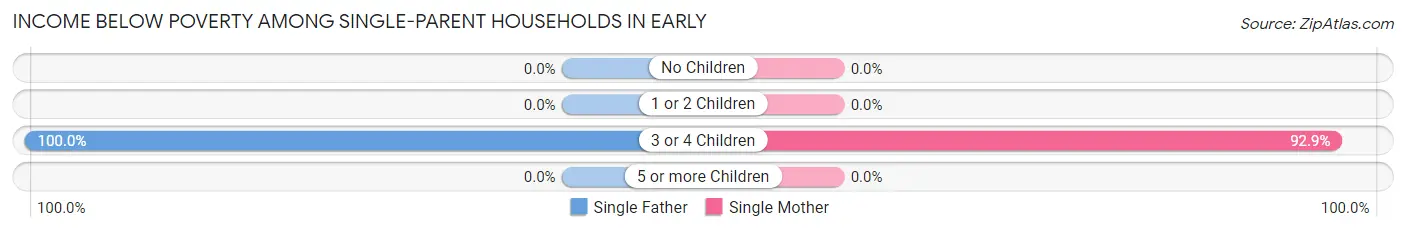
| Children | Single Father | Single Mother |
| No Children | 0 (0.0%) | 0 (0.0%) |
| 1 or 2 Children | 0 (0.0%) | 0 (0.0%) |
| 3 or 4 Children | 13 (100.0%) | 39 (92.9%) |
| 5 or more Children | 0 (0.0%) | 0 (0.0%) |
| Total | 13 (15.3%) | 39 (30.0%) |
Income Below Poverty Among Married-Couple vs Single-Parent Households in Early
The poverty data for Early shows that 8 of the married-couple family households (1.4%) and 52 of the single-parent households (24.2%) are living below the poverty level. Within the married-couple family households, those with no children have the highest poverty rate, with 5 households (1.7%) falling below the poverty line. Among the single-parent households, those with 3 or 4 children have the highest poverty rate, with 52 household (94.6%) living below poverty.
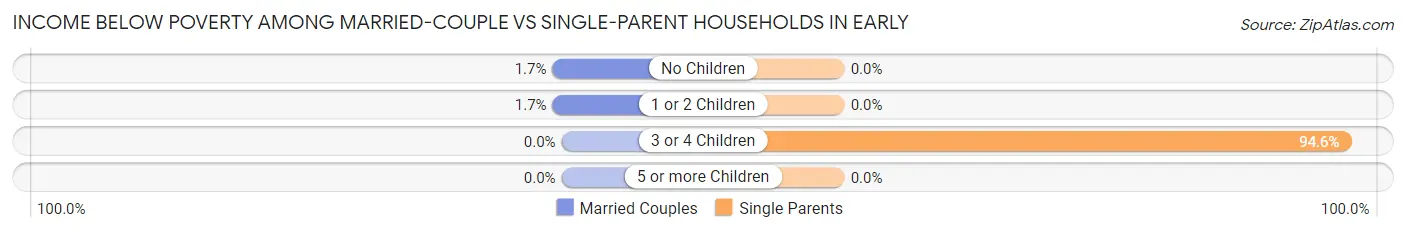
| Children | Married-Couple Families | Single-Parent Households |
| No Children | 5 (1.7%) | 0 (0.0%) |
| 1 or 2 Children | 3 (1.7%) | 0 (0.0%) |
| 3 or 4 Children | 0 (0.0%) | 52 (94.6%) |
| 5 or more Children | 0 (0.0%) | 0 (0.0%) |
| Total | 8 (1.4%) | 52 (24.2%) |
Race in Early
The most populous races in Early are White / Caucasian (2,514 | 80.7%), Hispanic or Latino (566 | 18.2%), and Two or more Races (485 | 15.6%).
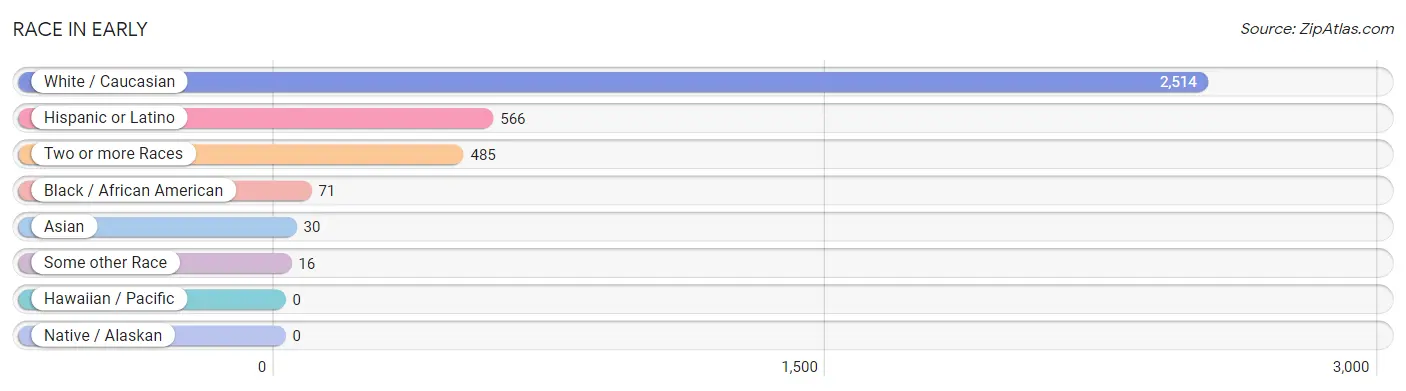
| Race | # Population | % Population |
| Asian | 30 | 1.0% |
| Black / African American | 71 | 2.3% |
| Hawaiian / Pacific | 0 | 0.0% |
| Hispanic or Latino | 566 | 18.2% |
| Native / Alaskan | 0 | 0.0% |
| White / Caucasian | 2,514 | 80.7% |
| Two or more Races | 485 | 15.6% |
| Some other Race | 16 | 0.5% |
| Total | 3,116 | 100.0% |
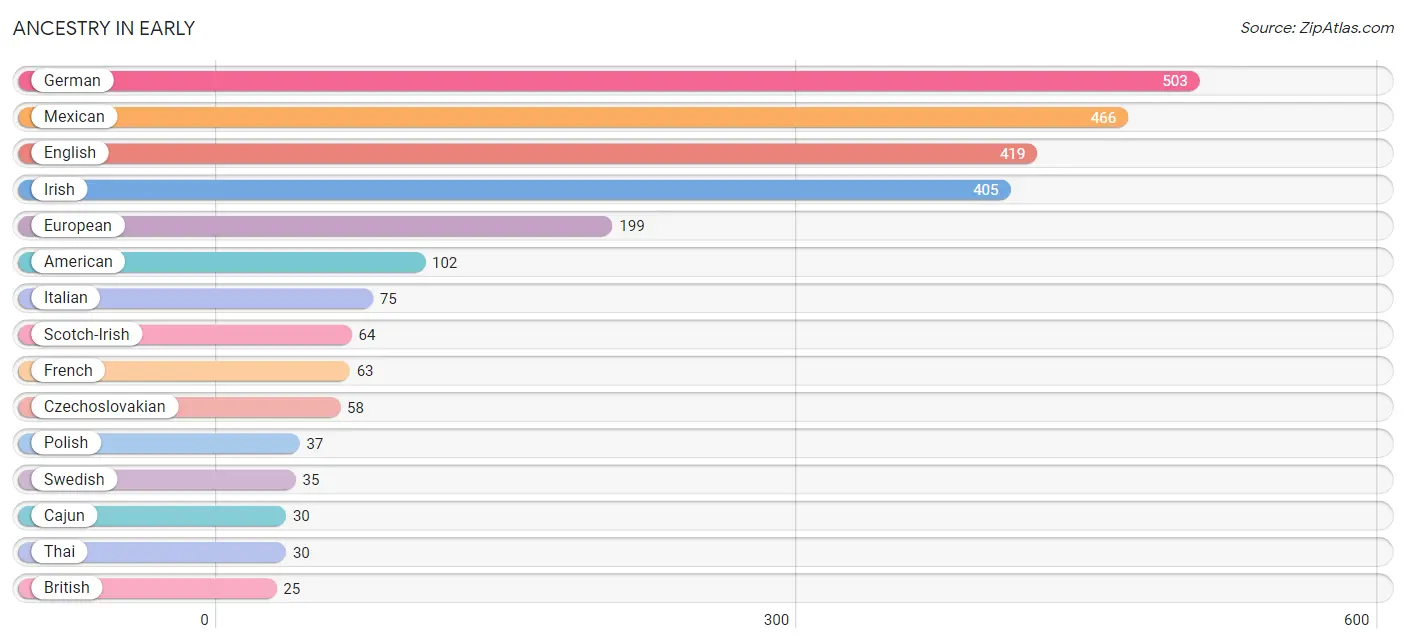
Ancestry in Early
The most populous ancestries reported in Early are German (503 | 16.1%), Mexican (466 | 15.0%), English (419 | 13.5%), Irish (405 | 13.0%), and European (199 | 6.4%), together accounting for 63.9% of all Early residents.
| Ancestry | # Population | % Population |
| American | 102 | 3.3% |
| Apache | 14 | 0.4% |
| Arab | 9 | 0.3% |
| Belgian | 4 | 0.1% |
| British | 25 | 0.8% |
| Cajun | 30 | 1.0% |
| Central American | 8 | 0.3% |
| Cherokee | 4 | 0.1% |
| Choctaw | 4 | 0.1% |
| Costa Rican | 8 | 0.3% |
| Croatian | 5 | 0.2% |
| Czech | 24 | 0.8% |
| Czechoslovakian | 58 | 1.9% |
| Dutch | 24 | 0.8% |
| English | 419 | 13.5% |
| European | 199 | 6.4% |
| Finnish | 8 | 0.3% |
| French | 63 | 2.0% |
| German | 503 | 16.1% |
| Irish | 405 | 13.0% |
| Italian | 75 | 2.4% |
| Mexican | 466 | 15.0% |
| Norwegian | 10 | 0.3% |
| Osage | 6 | 0.2% |
| Palestinian | 9 | 0.3% |
| Polish | 37 | 1.2% |
| Scandinavian | 18 | 0.6% |
| Scotch-Irish | 64 | 2.1% |
| Scottish | 5 | 0.2% |
| Spaniard | 20 | 0.6% |
| Spanish | 14 | 0.4% |
| Swedish | 35 | 1.1% |
| Thai | 30 | 1.0% |
| Welsh | 4 | 0.1% | View All 34 Rows |
Immigrants in Early
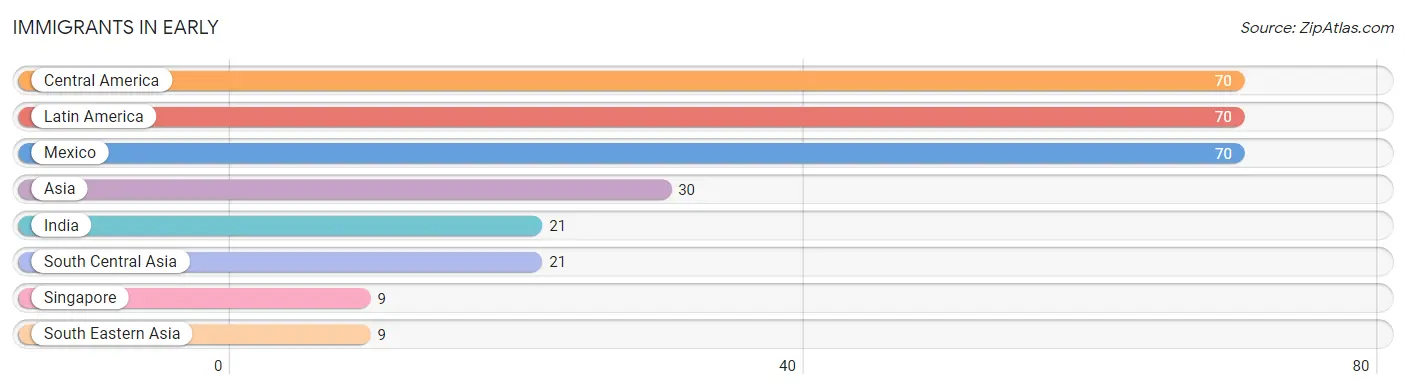
The most numerous immigrant groups reported in Early came from Central America (70 | 2.2%), Latin America (70 | 2.2%), Mexico (70 | 2.2%), Asia (30 | 1.0%), and India (21 | 0.7%), together accounting for 8.4% of all Early residents.
| Immigration Origin | # Population | % Population |
| Asia | 30 | 1.0% |
| Central America | 70 | 2.2% |
| India | 21 | 0.7% |
| Latin America | 70 | 2.2% |
| Mexico | 70 | 2.2% |
| Singapore | 9 | 0.3% |
| South Central Asia | 21 | 0.7% |
| South Eastern Asia | 9 | 0.3% | View All 8 Rows |
Sex and Age in Early
Sex and Age in Early
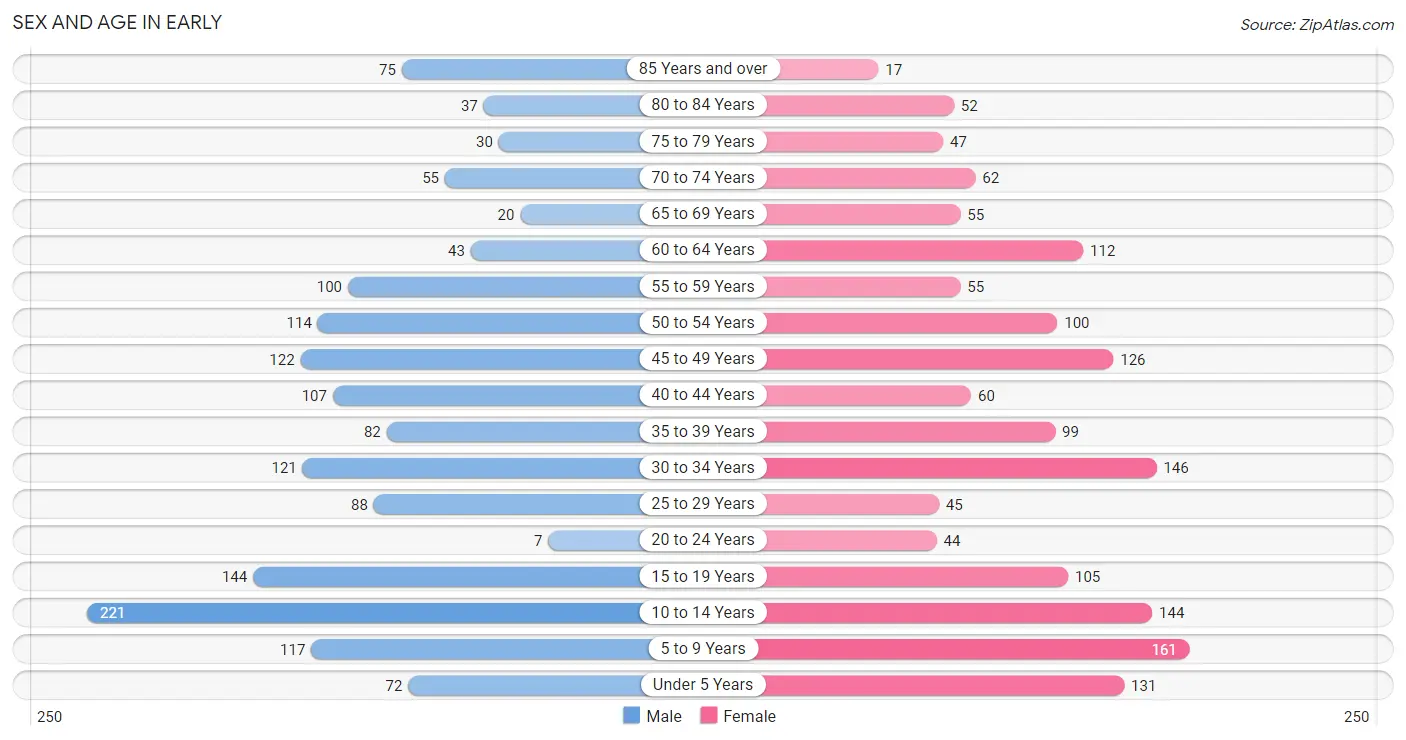
The most populous age groups in Early are 10 to 14 Years (221 | 14.2%) for men and 5 to 9 Years (161 | 10.3%) for women.
| Age Bracket | Male | Female |
| Under 5 Years | 72 (4.6%) | 131 (8.4%) |
| 5 to 9 Years | 117 (7.5%) | 161 (10.3%) |
| 10 to 14 Years | 221 (14.2%) | 144 (9.2%) |
| 15 to 19 Years | 144 (9.3%) | 105 (6.7%) |
| 20 to 24 Years | 7 (0.4%) | 44 (2.8%) |
| 25 to 29 Years | 88 (5.7%) | 45 (2.9%) |
| 30 to 34 Years | 121 (7.8%) | 146 (9.3%) |
| 35 to 39 Years | 82 (5.3%) | 99 (6.3%) |
| 40 to 44 Years | 107 (6.9%) | 60 (3.8%) |
| 45 to 49 Years | 122 (7.9%) | 126 (8.1%) |
| 50 to 54 Years | 114 (7.3%) | 100 (6.4%) |
| 55 to 59 Years | 100 (6.4%) | 55 (3.5%) |
| 60 to 64 Years | 43 (2.8%) | 112 (7.2%) |
| 65 to 69 Years | 20 (1.3%) | 55 (3.5%) |
| 70 to 74 Years | 55 (3.5%) | 62 (4.0%) |
| 75 to 79 Years | 30 (1.9%) | 47 (3.0%) |
| 80 to 84 Years | 37 (2.4%) | 52 (3.3%) |
| 85 Years and over | 75 (4.8%) | 17 (1.1%) |
| Total | 1,555 (100.0%) | 1,561 (100.0%) |
Families and Households in Early
Median Family Size in Early
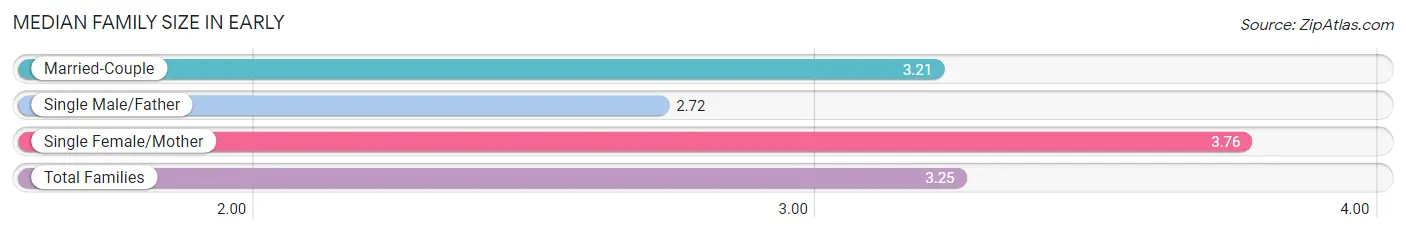
The median family size in Early is 3.25 persons per family, with single female/mother families (130 | 16.6%) accounting for the largest median family size of 3.76 persons per family. On the other hand, single male/father families (85 | 10.9%) represent the smallest median family size with 2.72 persons per family.
| Family Type | # Families | Family Size |
| Married-Couple | 568 (72.5%) | 3.21 |
| Single Male/Father | 85 (10.9%) | 2.72 |
| Single Female/Mother | 130 (16.6%) | 3.76 |
| Total Families | 783 (100.0%) | 3.25 |
Median Household Size in Early
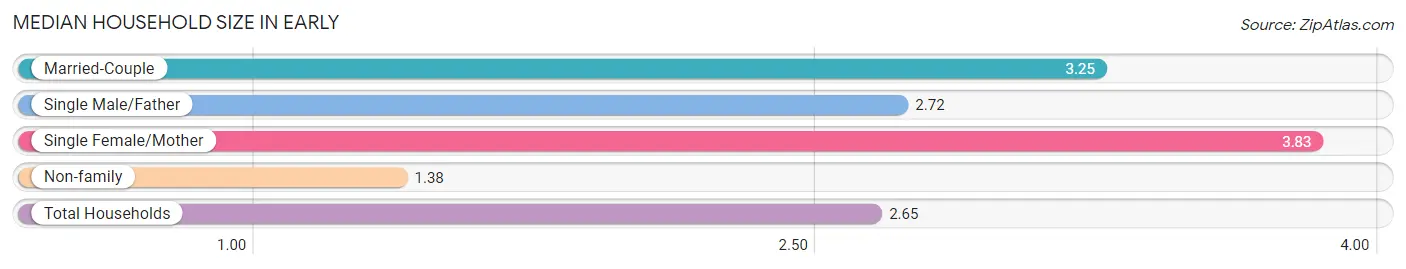
The median household size in Early is 2.65 persons per household, with single female/mother households (130 | 11.1%) accounting for the largest median household size of 3.83 persons per household. non-family households (392 | 33.4%) represent the smallest median household size with 1.38 persons per household.
| Household Type | # Households | Household Size |
| Married-Couple | 568 (48.3%) | 3.25 |
| Single Male/Father | 85 (7.2%) | 2.72 |
| Single Female/Mother | 130 (11.1%) | 3.83 |
| Non-family | 392 (33.4%) | 1.38 |
| Total Households | 1,175 (100.0%) | 2.65 |
Household Size by Marriage Status in Early
Out of a total of 1,175 households in Early, 783 (66.6%) are family households, while 392 (33.4%) are nonfamily households. The most numerous type of family households are 2-person households, comprising 319, and the most common type of nonfamily households are 1-person households, comprising 305.
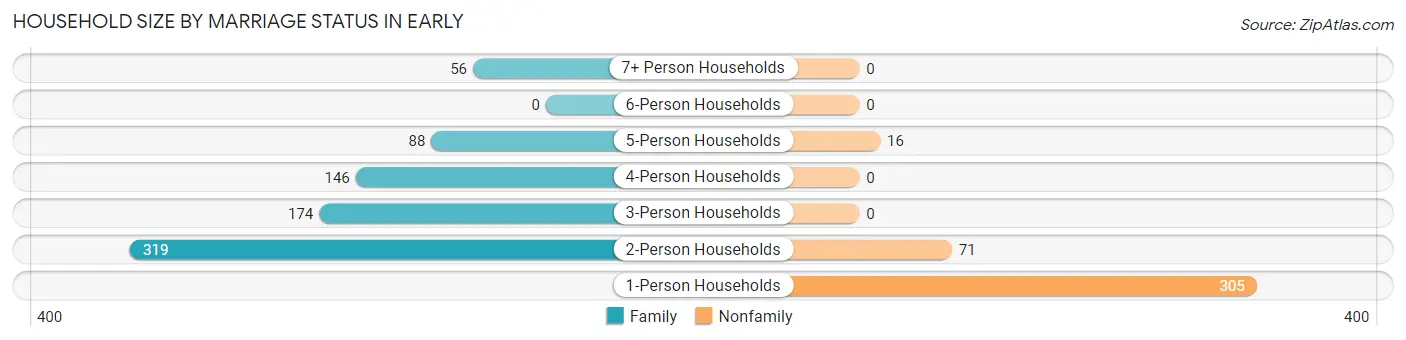
| Household Size | Family Households | Nonfamily Households |
| 1-Person Households | - | 305 (26.0%) |
| 2-Person Households | 319 (27.2%) | 71 (6.0%) |
| 3-Person Households | 174 (14.8%) | 0 (0.0%) |
| 4-Person Households | 146 (12.4%) | 0 (0.0%) |
| 5-Person Households | 88 (7.5%) | 16 (1.4%) |
| 6-Person Households | 0 (0.0%) | 0 (0.0%) |
| 7+ Person Households | 56 (4.8%) | 0 (0.0%) |
| Total | 783 (66.6%) | 392 (33.4%) |
Female Fertility in Early
Fertility by Age in Early
Average fertility rate in Early is 77.0 births per 1,000 women. Women in the age bracket of 20 to 34 years have the highest fertility rate with 209.0 births per 1,000 women. Women in the age bracket of 20 to 34 years acount for 100.0% of all women with births.
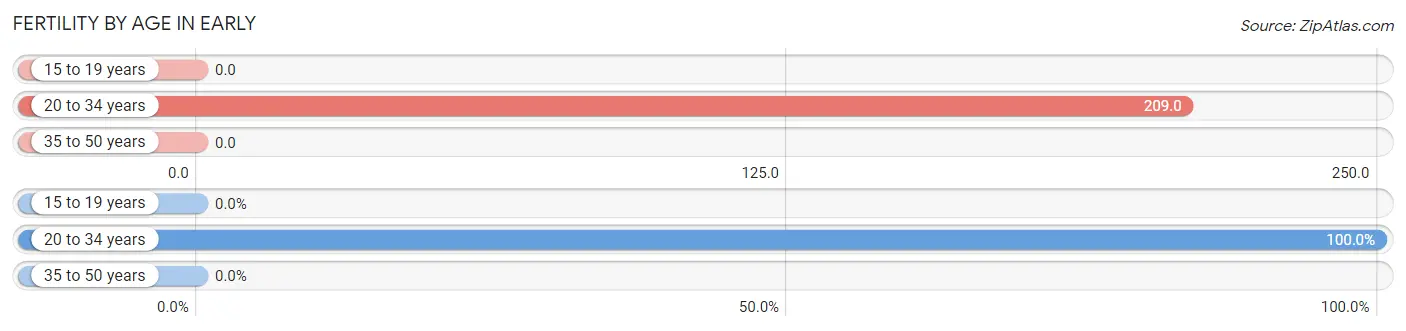
| Age Bracket | Women with Births | Births / 1,000 Women |
| 15 to 19 years | 0 (0.0%) | 0.0 |
| 20 to 34 years | 49 (100.0%) | 209.0 |
| 35 to 50 years | 0 (0.0%) | 0.0 |
| Total | 49 (100.0%) | 77.0 |
Fertility by Age by Marriage Status in Early
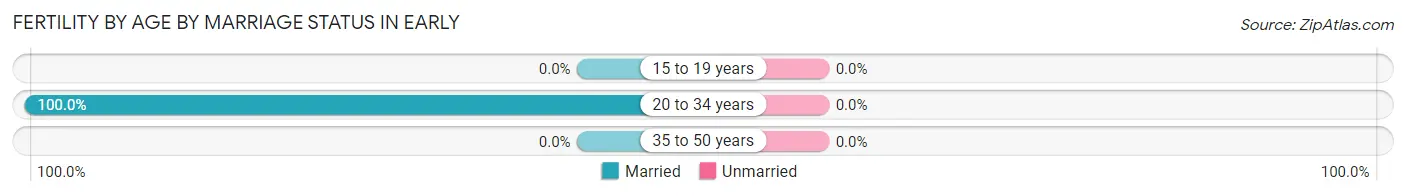
| Age Bracket | Married | Unmarried |
| 15 to 19 years | 0 (0.0%) | 0 (0.0%) |
| 20 to 34 years | 49 (100.0%) | 0 (0.0%) |
| 35 to 50 years | 0 (0.0%) | 0 (0.0%) |
| Total | 49 (100.0%) | 0 (0.0%) |
Fertility by Education in Early
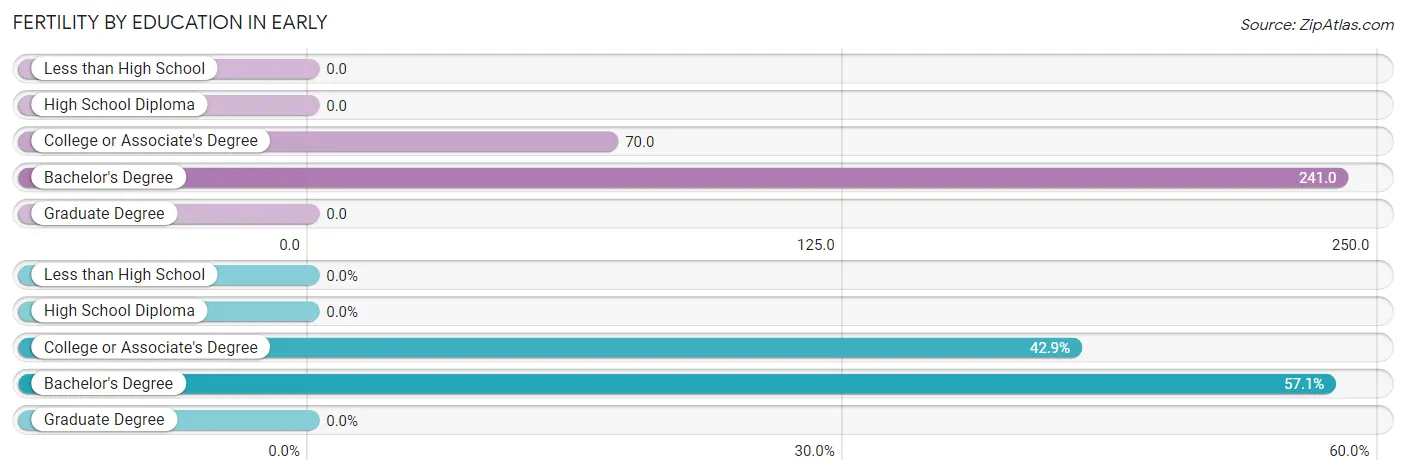
| Educational Attainment | Women with Births | Births / 1,000 Women |
| Less than High School | 0 (0.0%) | 0.0 |
| High School Diploma | 0 (0.0%) | 0.0 |
| College or Associate's Degree | 21 (42.9%) | 70.0 |
| Bachelor's Degree | 28 (57.1%) | 241.0 |
| Graduate Degree | 0 (0.0%) | 0.0 |
| Total | 49 (100.0%) | 77.0 |
Fertility by Education by Marriage Status in Early
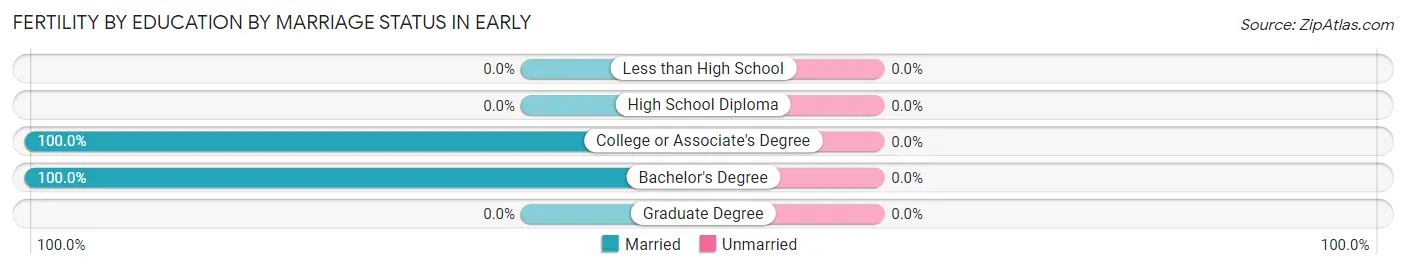
| Educational Attainment | Married | Unmarried |
| Less than High School | 0 (0.0%) | 0 (0.0%) |
| High School Diploma | 0 (0.0%) | 0 (0.0%) |
| College or Associate's Degree | 21 (100.0%) | 0 (0.0%) |
| Bachelor's Degree | 28 (100.0%) | 0 (0.0%) |
| Graduate Degree | 0 (0.0%) | 0 (0.0%) |
| Total | 49 (100.0%) | 0 (0.0%) |
Employment Characteristics in Early
Employment by Class of Employer in Early
Among the 1,415 employed individuals in Early, private company employees (797 | 56.3%), not-for-profit organizations (201 | 14.2%), and local government employees (143 | 10.1%) make up the most common classes of employment.
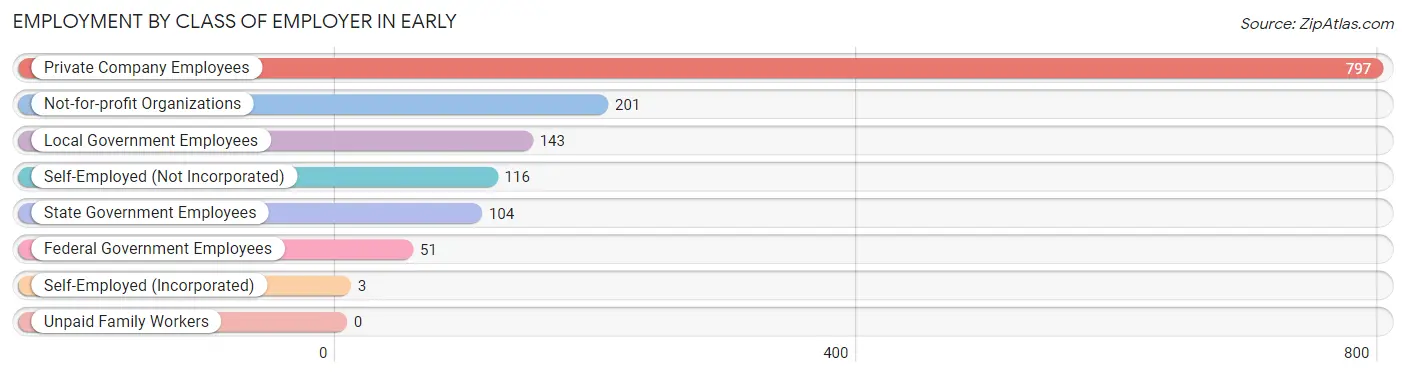
| Employer Class | # Employees | % Employees |
| Private Company Employees | 797 | 56.3% |
| Self-Employed (Incorporated) | 3 | 0.2% |
| Self-Employed (Not Incorporated) | 116 | 8.2% |
| Not-for-profit Organizations | 201 | 14.2% |
| Local Government Employees | 143 | 10.1% |
| State Government Employees | 104 | 7.3% |
| Federal Government Employees | 51 | 3.6% |
| Unpaid Family Workers | 0 | 0.0% |
| Total | 1,415 | 100.0% |
Employment Status by Age in Early
According to the labor force statistics for Early, out of the total population over 16 years of age (2,190), 68.3% or 1,496 individuals are in the labor force, with 2.4% or 36 of them unemployed. The age group with the highest labor force participation rate is 20 to 24 years, with 100.0% or 51 individuals in the labor force. Within the labor force, the 30 to 34 years age range has the highest percentage of unemployed individuals, with 12.3% or 30 of them being unemployed.
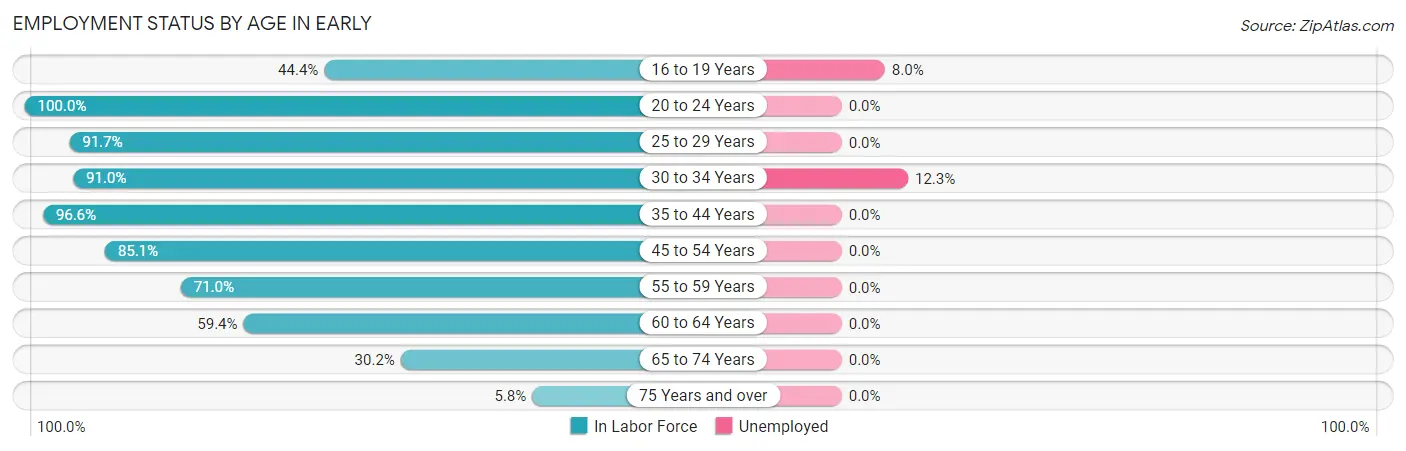
| Age Bracket | In Labor Force | Unemployed |
| 16 to 19 Years | 75 (44.4%) | 6 (8.0%) |
| 20 to 24 Years | 51 (100.0%) | 0 (0.0%) |
| 25 to 29 Years | 122 (91.7%) | 0 (0.0%) |
| 30 to 34 Years | 243 (91.0%) | 30 (12.3%) |
| 35 to 44 Years | 336 (96.6%) | 0 (0.0%) |
| 45 to 54 Years | 393 (85.1%) | 0 (0.0%) |
| 55 to 59 Years | 110 (71.0%) | 0 (0.0%) |
| 60 to 64 Years | 92 (59.4%) | 0 (0.0%) |
| 65 to 74 Years | 58 (30.2%) | 0 (0.0%) |
| 75 Years and over | 15 (5.8%) | 0 (0.0%) |
| Total | 1,496 (68.3%) | 36 (2.4%) |
Employment Status by Educational Attainment in Early
According to labor force statistics for Early, 85.3% of individuals (1,297) out of the total population between 25 and 64 years of age (1,520) are in the labor force, with 2.3% or 30 of them being unemployed. The group with the highest labor force participation rate are those with the educational attainment of bachelor's degree or higher, with 95.2% or 393 individuals in the labor force. Within the labor force, individuals with college / associate degree education have the highest percentage of unemployment, with 4.5% or 25 of them being unemployed.
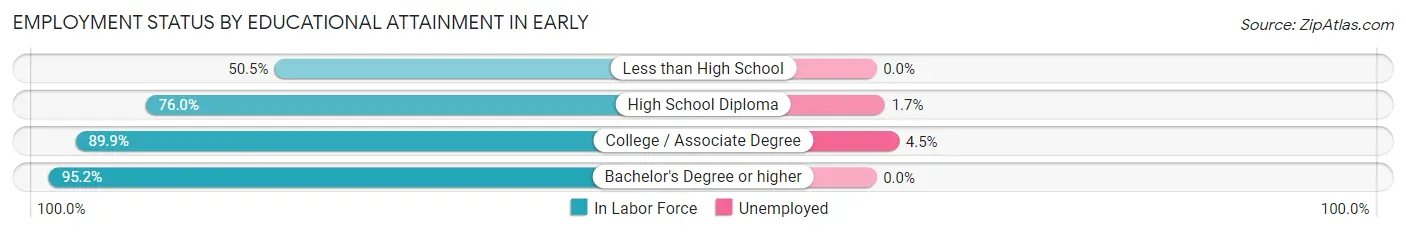
| Educational Attainment | In Labor Force | Unemployed |
| Less than High School | 49 (50.5%) | 0 (0.0%) |
| High School Diploma | 294 (76.0%) | 7 (1.7%) |
| College / Associate Degree | 560 (89.9%) | 28 (4.5%) |
| Bachelor's Degree or higher | 393 (95.2%) | 0 (0.0%) |
| Total | 1,297 (85.3%) | 35 (2.3%) |
Employment Occupations by Sex in Early
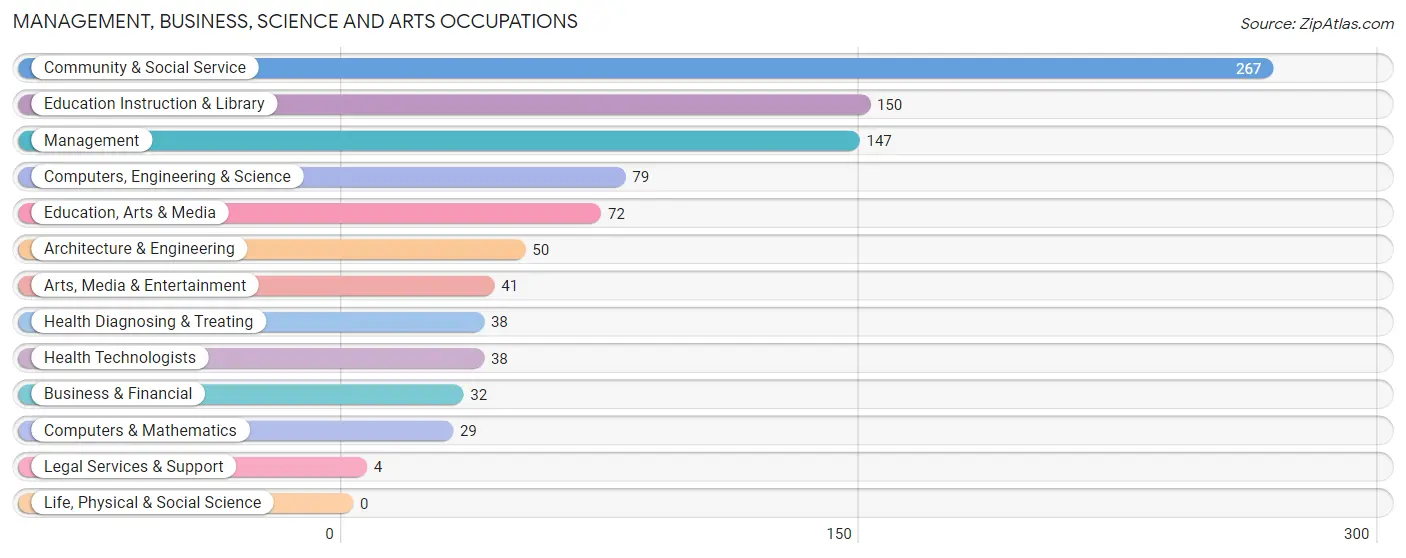
Management, Business, Science and Arts Occupations
The most common Management, Business, Science and Arts occupations in Early are Community & Social Service (267 | 18.4%), Education Instruction & Library (150 | 10.3%), Management (147 | 10.1%), Computers, Engineering & Science (79 | 5.4%), and Education, Arts & Media (72 | 5.0%).
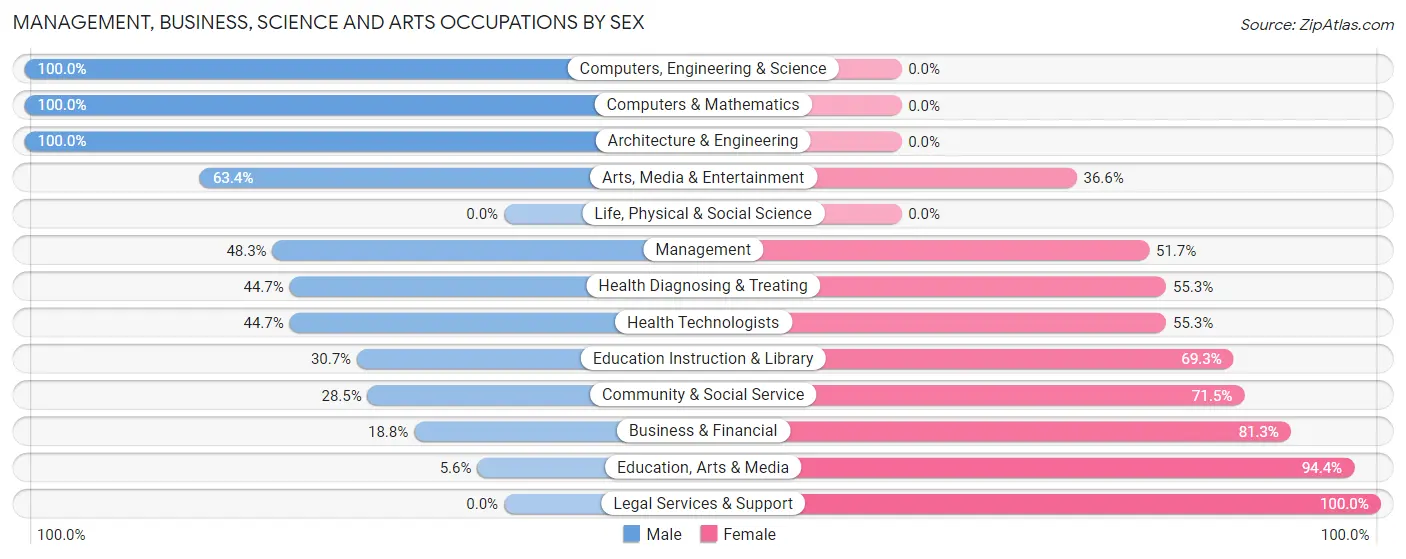
Management, Business, Science and Arts Occupations by Sex
Within the Management, Business, Science and Arts occupations in Early, the most male-oriented occupations are Computers, Engineering & Science (100.0%), Computers & Mathematics (100.0%), and Architecture & Engineering (100.0%), while the most female-oriented occupations are Legal Services & Support (100.0%), Education, Arts & Media (94.4%), and Business & Financial (81.2%).
| Occupation | Male | Female |
| Management | 71 (48.3%) | 76 (51.7%) |
| Business & Financial | 6 (18.8%) | 26 (81.2%) |
| Computers, Engineering & Science | 79 (100.0%) | 0 (0.0%) |
| Computers & Mathematics | 29 (100.0%) | 0 (0.0%) |
| Architecture & Engineering | 50 (100.0%) | 0 (0.0%) |
| Life, Physical & Social Science | 0 (0.0%) | 0 (0.0%) |
| Community & Social Service | 76 (28.5%) | 191 (71.5%) |
| Education, Arts & Media | 4 (5.6%) | 68 (94.4%) |
| Legal Services & Support | 0 (0.0%) | 4 (100.0%) |
| Education Instruction & Library | 46 (30.7%) | 104 (69.3%) |
| Arts, Media & Entertainment | 26 (63.4%) | 15 (36.6%) |
| Health Diagnosing & Treating | 17 (44.7%) | 21 (55.3%) |
| Health Technologists | 17 (44.7%) | 21 (55.3%) |
| Total (Category) | 249 (44.2%) | 314 (55.8%) |
| Total (Overall) | 686 (47.3%) | 763 (52.7%) |
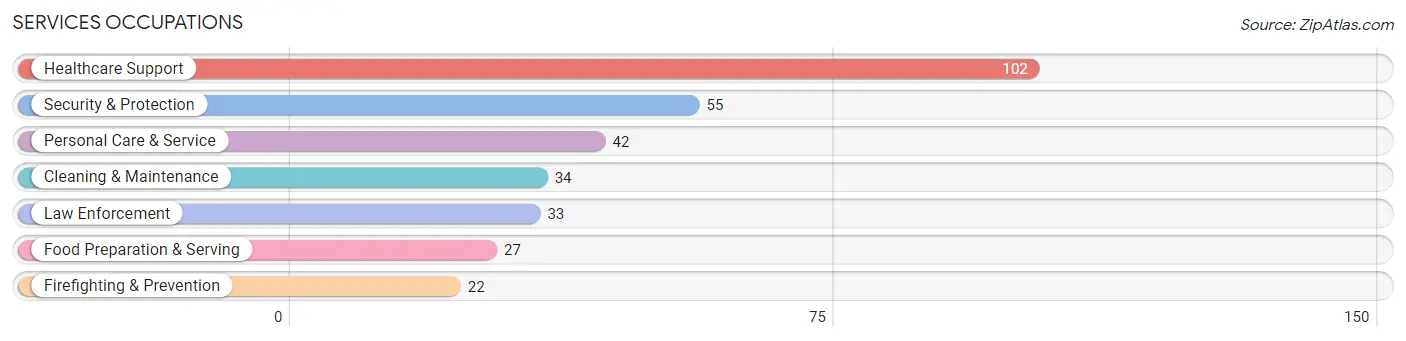
Services Occupations
The most common Services occupations in Early are Healthcare Support (102 | 7.0%), Security & Protection (55 | 3.8%), Personal Care & Service (42 | 2.9%), Cleaning & Maintenance (34 | 2.4%), and Law Enforcement (33 | 2.3%).
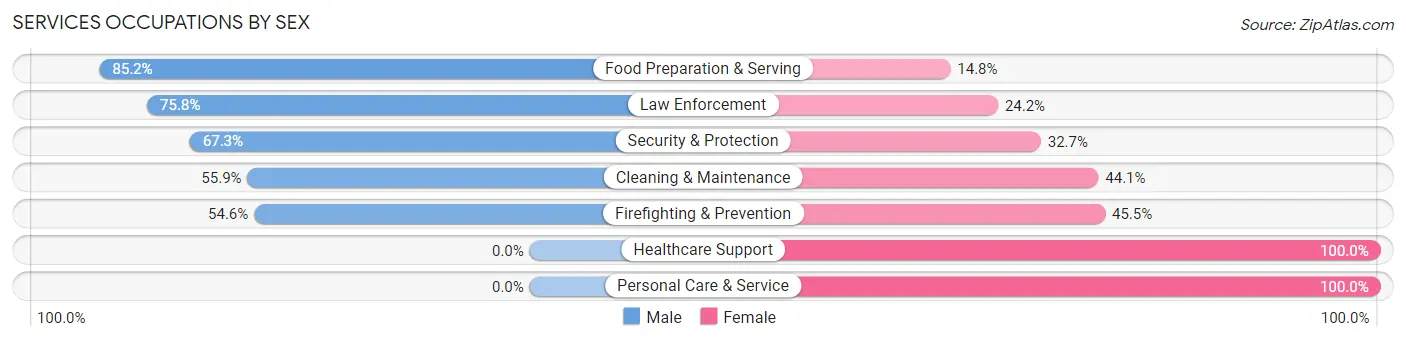
Services Occupations by Sex
Within the Services occupations in Early, the most male-oriented occupations are Food Preparation & Serving (85.2%), Law Enforcement (75.8%), and Security & Protection (67.3%), while the most female-oriented occupations are Healthcare Support (100.0%), Personal Care & Service (100.0%), and Firefighting & Prevention (45.5%).
| Occupation | Male | Female |
| Healthcare Support | 0 (0.0%) | 102 (100.0%) |
| Security & Protection | 37 (67.3%) | 18 (32.7%) |
| Firefighting & Prevention | 12 (54.5%) | 10 (45.5%) |
| Law Enforcement | 25 (75.8%) | 8 (24.2%) |
| Food Preparation & Serving | 23 (85.2%) | 4 (14.8%) |
| Cleaning & Maintenance | 19 (55.9%) | 15 (44.1%) |
| Personal Care & Service | 0 (0.0%) | 42 (100.0%) |
| Total (Category) | 79 (30.4%) | 181 (69.6%) |
| Total (Overall) | 686 (47.3%) | 763 (52.7%) |
Sales and Office Occupations
The most common Sales and Office occupations in Early are Sales & Related (239 | 16.5%), and Office & Administration (101 | 7.0%).
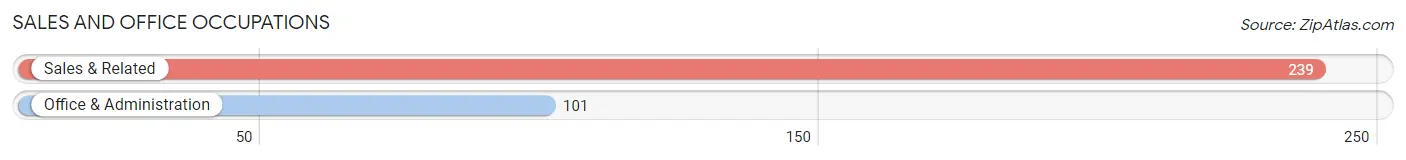
Sales and Office Occupations by Sex
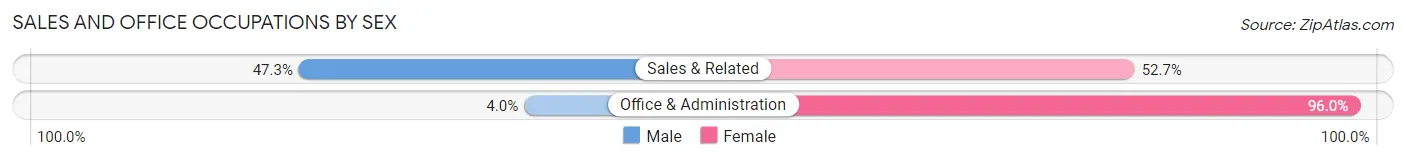
| Occupation | Male | Female |
| Sales & Related | 113 (47.3%) | 126 (52.7%) |
| Office & Administration | 4 (4.0%) | 97 (96.0%) |
| Total (Category) | 117 (34.4%) | 223 (65.6%) |
| Total (Overall) | 686 (47.3%) | 763 (52.7%) |
Natural Resources, Construction and Maintenance Occupations
The most common Natural Resources, Construction and Maintenance occupations in Early are Installation, Maintenance & Repair (42 | 2.9%), Farming, Fishing & Forestry (26 | 1.8%), and Construction & Extraction (15 | 1.0%).
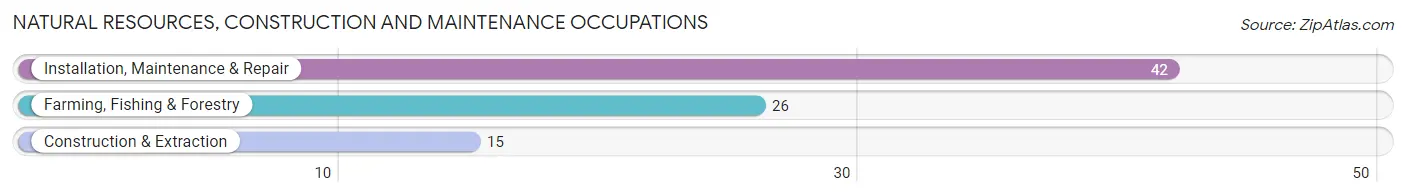
Natural Resources, Construction and Maintenance Occupations by Sex
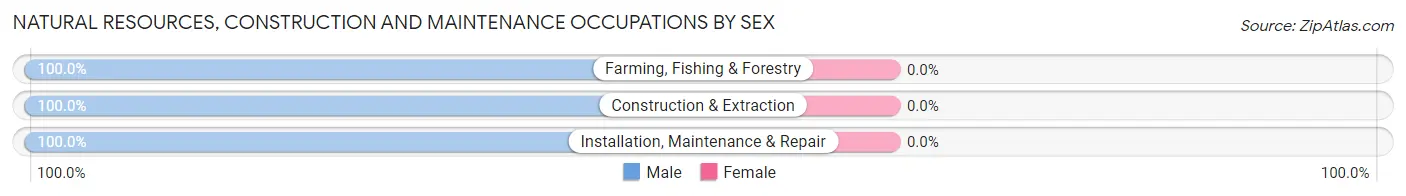
| Occupation | Male | Female |
| Farming, Fishing & Forestry | 26 (100.0%) | 0 (0.0%) |
| Construction & Extraction | 15 (100.0%) | 0 (0.0%) |
| Installation, Maintenance & Repair | 42 (100.0%) | 0 (0.0%) |
| Total (Category) | 83 (100.0%) | 0 (0.0%) |
| Total (Overall) | 686 (47.3%) | 763 (52.7%) |
Production, Transportation and Moving Occupations
The most common Production, Transportation and Moving occupations in Early are Production (105 | 7.2%), Transportation (49 | 3.4%), and Material Moving (49 | 3.4%).
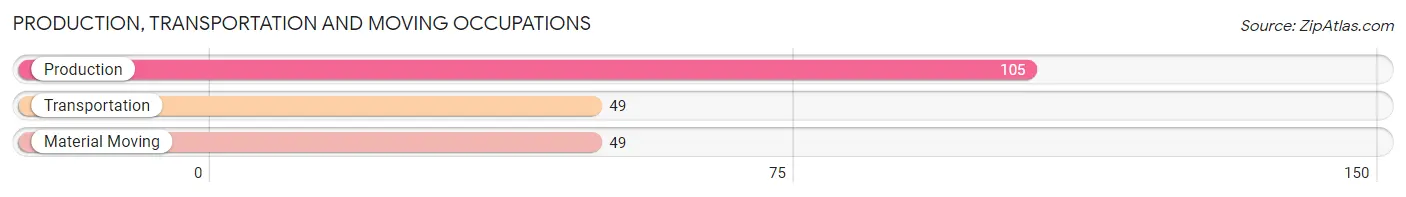
Production, Transportation and Moving Occupations by Sex
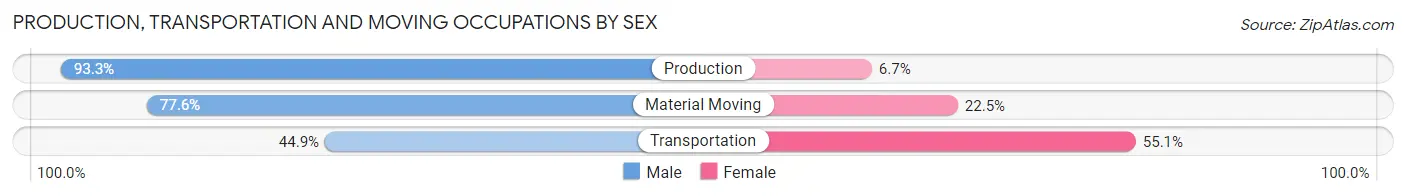
| Occupation | Male | Female |
| Production | 98 (93.3%) | 7 (6.7%) |
| Transportation | 22 (44.9%) | 27 (55.1%) |
| Material Moving | 38 (77.5%) | 11 (22.5%) |
| Total (Category) | 158 (77.8%) | 45 (22.2%) |
| Total (Overall) | 686 (47.3%) | 763 (52.7%) |
Employment Industries by Sex in Early
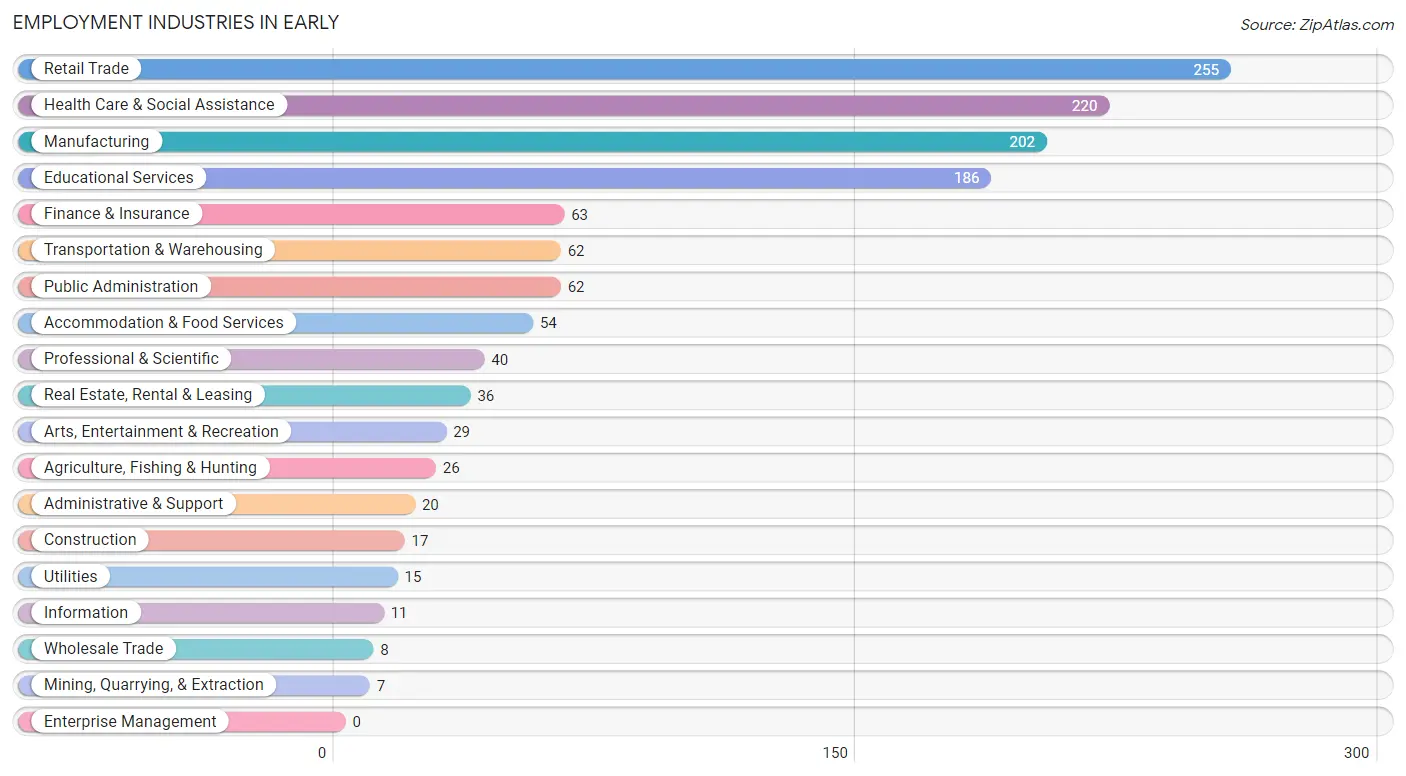
Employment Industries in Early
The major employment industries in Early include Retail Trade (255 | 17.6%), Health Care & Social Assistance (220 | 15.2%), Manufacturing (202 | 13.9%), Educational Services (186 | 12.8%), and Finance & Insurance (63 | 4.3%).
Employment Industries by Sex in Early
The Early industries that see more men than women are Agriculture, Fishing & Hunting (100.0%), Mining, Quarrying, & Extraction (100.0%), and Construction (100.0%), whereas the industries that tend to have a higher number of women are Arts, Entertainment & Recreation (100.0%), Finance & Insurance (84.1%), and Transportation & Warehousing (83.9%).
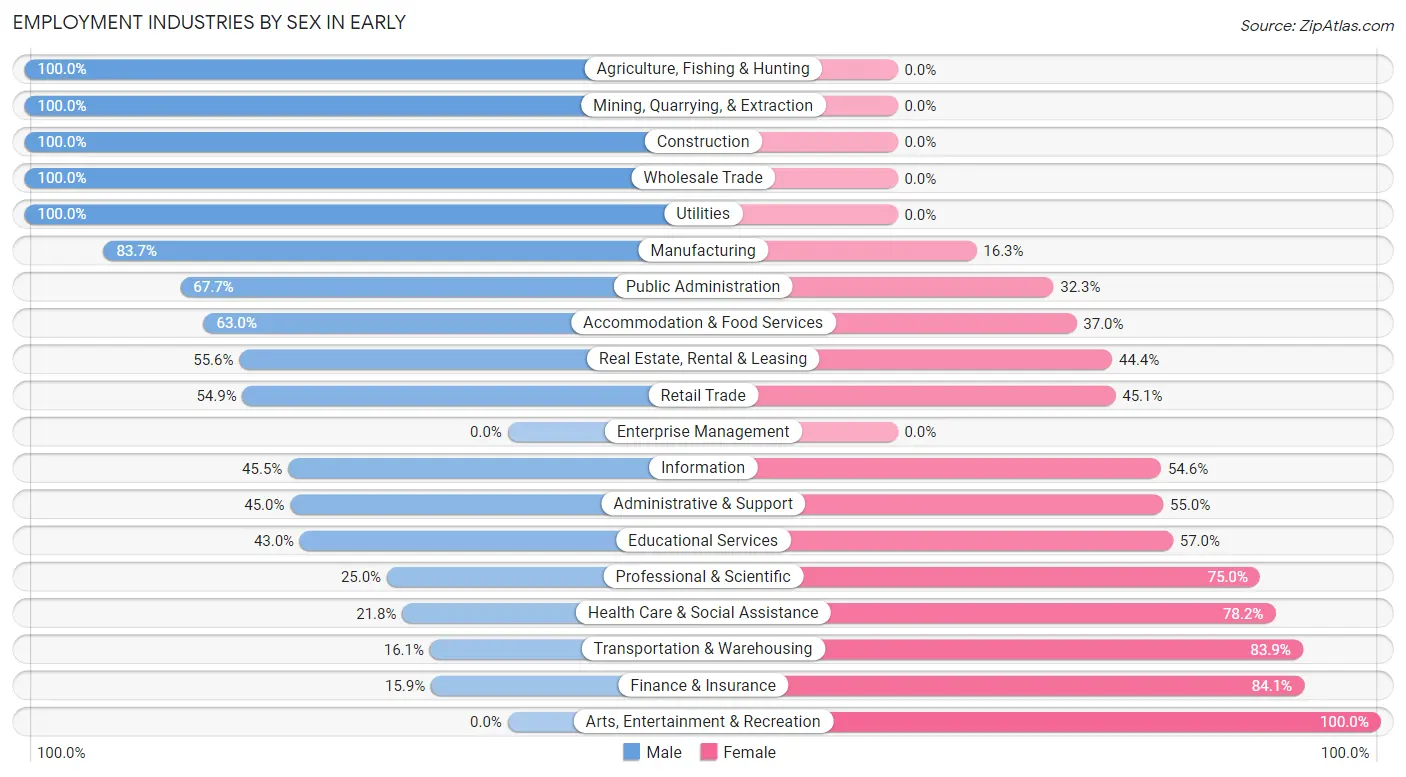
| Industry | Male | Female |
| Agriculture, Fishing & Hunting | 26 (100.0%) | 0 (0.0%) |
| Mining, Quarrying, & Extraction | 7 (100.0%) | 0 (0.0%) |
| Construction | 17 (100.0%) | 0 (0.0%) |
| Manufacturing | 169 (83.7%) | 33 (16.3%) |
| Wholesale Trade | 8 (100.0%) | 0 (0.0%) |
| Retail Trade | 140 (54.9%) | 115 (45.1%) |
| Transportation & Warehousing | 10 (16.1%) | 52 (83.9%) |
| Utilities | 15 (100.0%) | 0 (0.0%) |
| Information | 5 (45.5%) | 6 (54.5%) |
| Finance & Insurance | 10 (15.9%) | 53 (84.1%) |
| Real Estate, Rental & Leasing | 20 (55.6%) | 16 (44.4%) |
| Professional & Scientific | 10 (25.0%) | 30 (75.0%) |
| Enterprise Management | 0 (0.0%) | 0 (0.0%) |
| Administrative & Support | 9 (45.0%) | 11 (55.0%) |
| Educational Services | 80 (43.0%) | 106 (57.0%) |
| Health Care & Social Assistance | 48 (21.8%) | 172 (78.2%) |
| Arts, Entertainment & Recreation | 0 (0.0%) | 29 (100.0%) |
| Accommodation & Food Services | 34 (63.0%) | 20 (37.0%) |
| Public Administration | 42 (67.7%) | 20 (32.3%) |
| Total | 686 (47.3%) | 763 (52.7%) |
Education in Early
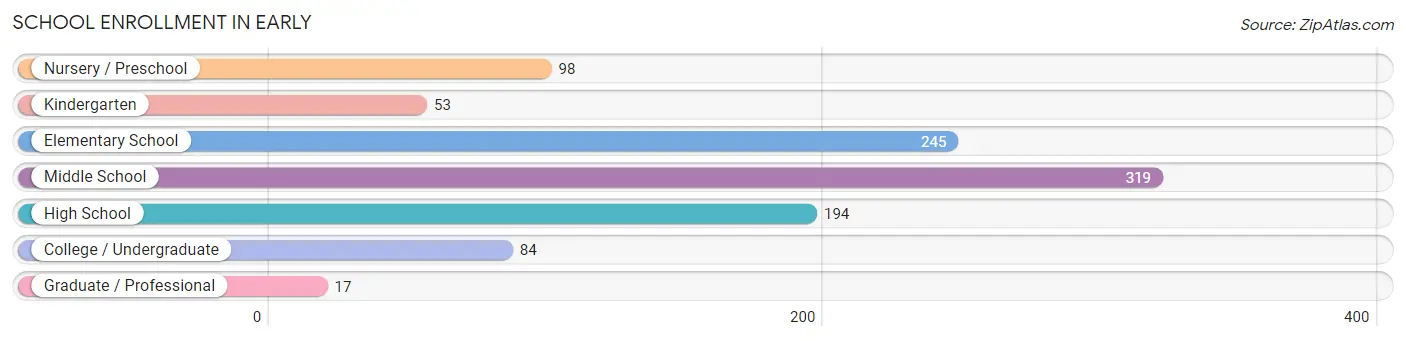
School Enrollment in Early
The most common levels of schooling among the 1,010 students in Early are middle school (319 | 31.6%), elementary school (245 | 24.3%), and high school (194 | 19.2%).
| School Level | # Students | % Students |
| Nursery / Preschool | 98 | 9.7% |
| Kindergarten | 53 | 5.2% |
| Elementary School | 245 | 24.3% |
| Middle School | 319 | 31.6% |
| High School | 194 | 19.2% |
| College / Undergraduate | 84 | 8.3% |
| Graduate / Professional | 17 | 1.7% |
| Total | 1,010 | 100.0% |
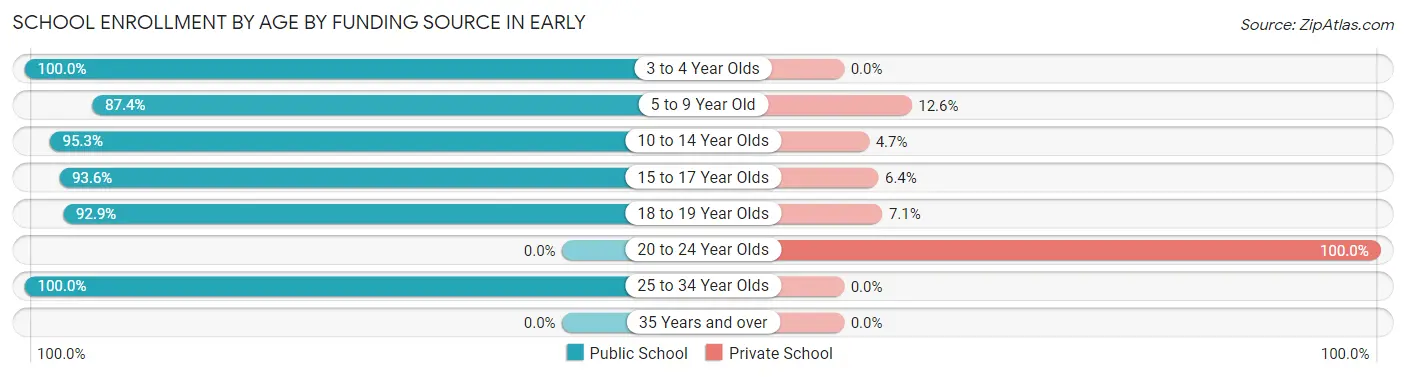
School Enrollment by Age by Funding Source in Early
Out of a total of 1,010 students who are enrolled in schools in Early, 74 (7.3%) attend a private institution, while the remaining 936 (92.7%) are enrolled in public schools. The age group of 20 to 24 year olds has the highest likelihood of being enrolled in private schools, with 6 (100.0% in the age bracket) enrolled. Conversely, the age group of 3 to 4 year olds has the lowest likelihood of being enrolled in a private school, with 72 (100.0% in the age bracket) attending a public institution.
| Age Bracket | Public School | Private School |
| 3 to 4 Year Olds | 72 (100.0%) | 0 (0.0%) |
| 5 to 9 Year Old | 243 (87.4%) | 35 (12.6%) |
| 10 to 14 Year Olds | 348 (95.3%) | 17 (4.7%) |
| 15 to 17 Year Olds | 161 (93.6%) | 11 (6.4%) |
| 18 to 19 Year Olds | 65 (92.9%) | 5 (7.1%) |
| 20 to 24 Year Olds | 0 (0.0%) | 6 (100.0%) |
| 25 to 34 Year Olds | 47 (100.0%) | 0 (0.0%) |
| 35 Years and over | 0 (0.0%) | 0 (0.0%) |
| Total | 936 (92.7%) | 74 (7.3%) |
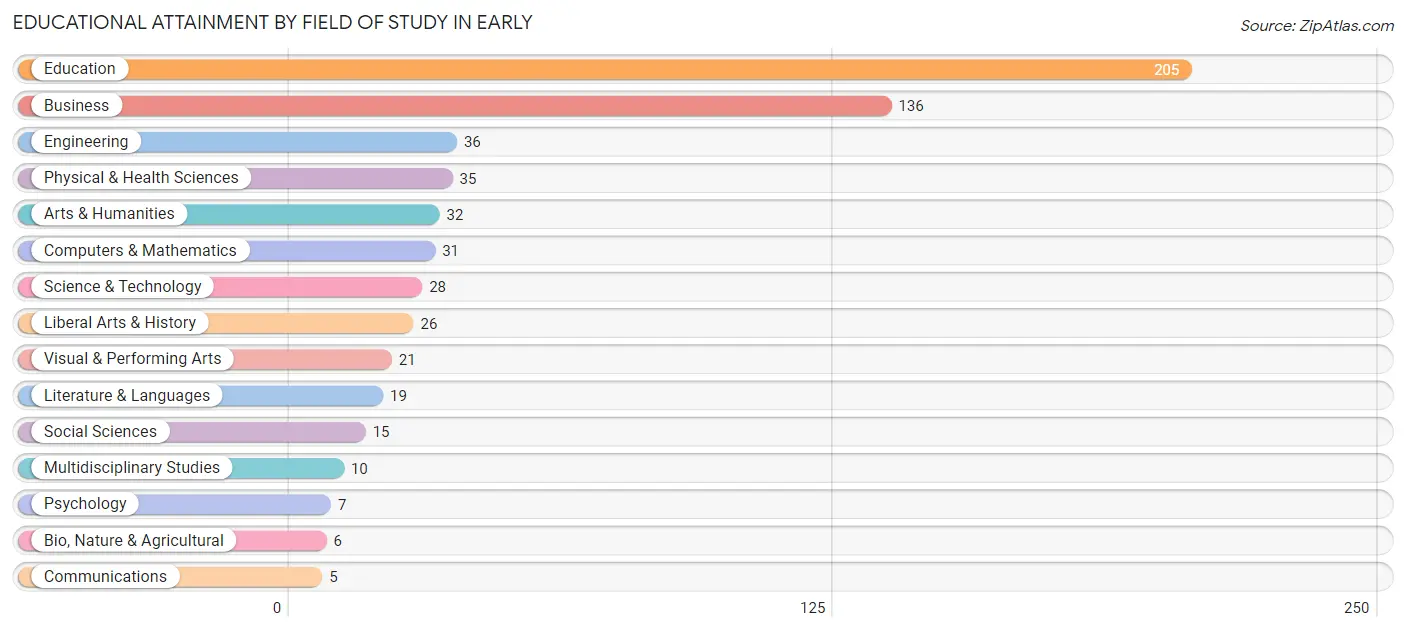
Educational Attainment by Field of Study in Early
Education (205 | 33.5%), business (136 | 22.2%), engineering (36 | 5.9%), physical & health sciences (35 | 5.7%), and arts & humanities (32 | 5.2%) are the most common fields of study among 612 individuals in Early who have obtained a bachelor's degree or higher.
| Field of Study | # Graduates | % Graduates |
| Computers & Mathematics | 31 | 5.1% |
| Bio, Nature & Agricultural | 6 | 1.0% |
| Physical & Health Sciences | 35 | 5.7% |
| Psychology | 7 | 1.1% |
| Social Sciences | 15 | 2.5% |
| Engineering | 36 | 5.9% |
| Multidisciplinary Studies | 10 | 1.6% |
| Science & Technology | 28 | 4.6% |
| Business | 136 | 22.2% |
| Education | 205 | 33.5% |
| Literature & Languages | 19 | 3.1% |
| Liberal Arts & History | 26 | 4.3% |
| Visual & Performing Arts | 21 | 3.4% |
| Communications | 5 | 0.8% |
| Arts & Humanities | 32 | 5.2% |
| Total | 612 | 100.0% |
Transportation & Commute in Early
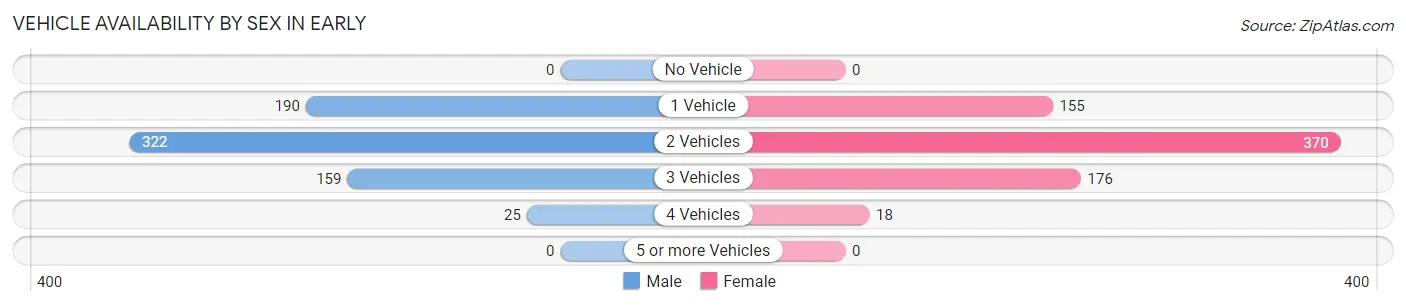
Vehicle Availability by Sex in Early
The most prevalent vehicle ownership categories in Early are males with 2 vehicles (322, accounting for 46.3%) and females with 2 vehicles (370, making up 44.8%).
| Vehicles Available | Male | Female |
| No Vehicle | 0 (0.0%) | 0 (0.0%) |
| 1 Vehicle | 190 (27.3%) | 155 (21.6%) |
| 2 Vehicles | 322 (46.3%) | 370 (51.5%) |
| 3 Vehicles | 159 (22.8%) | 176 (24.5%) |
| 4 Vehicles | 25 (3.6%) | 18 (2.5%) |
| 5 or more Vehicles | 0 (0.0%) | 0 (0.0%) |
| Total | 696 (100.0%) | 719 (100.0%) |
Commute Time in Early
The most frequently occuring commute durations in Early are 10 to 14 minutes (319 commuters, 24.1%), 5 to 9 minutes (282 commuters, 21.3%), and 15 to 19 minutes (209 commuters, 15.8%).
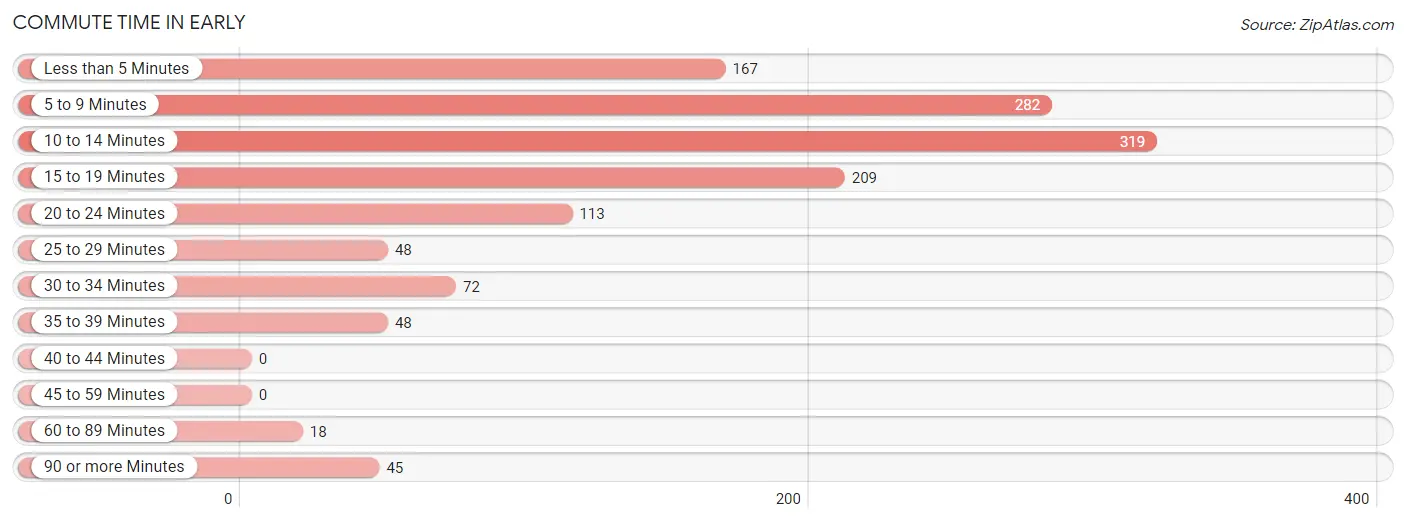
| Commute Time | # Commuters | % Commuters |
| Less than 5 Minutes | 167 | 12.6% |
| 5 to 9 Minutes | 282 | 21.3% |
| 10 to 14 Minutes | 319 | 24.1% |
| 15 to 19 Minutes | 209 | 15.8% |
| 20 to 24 Minutes | 113 | 8.6% |
| 25 to 29 Minutes | 48 | 3.6% |
| 30 to 34 Minutes | 72 | 5.4% |
| 35 to 39 Minutes | 48 | 3.6% |
| 40 to 44 Minutes | 0 | 0.0% |
| 45 to 59 Minutes | 0 | 0.0% |
| 60 to 89 Minutes | 18 | 1.4% |
| 90 or more Minutes | 45 | 3.4% |
Commute Time by Sex in Early
The most common commute times in Early are 10 to 14 minutes (232 commuters, 34.7%) for males and 5 to 9 minutes (195 commuters, 29.9%) for females.
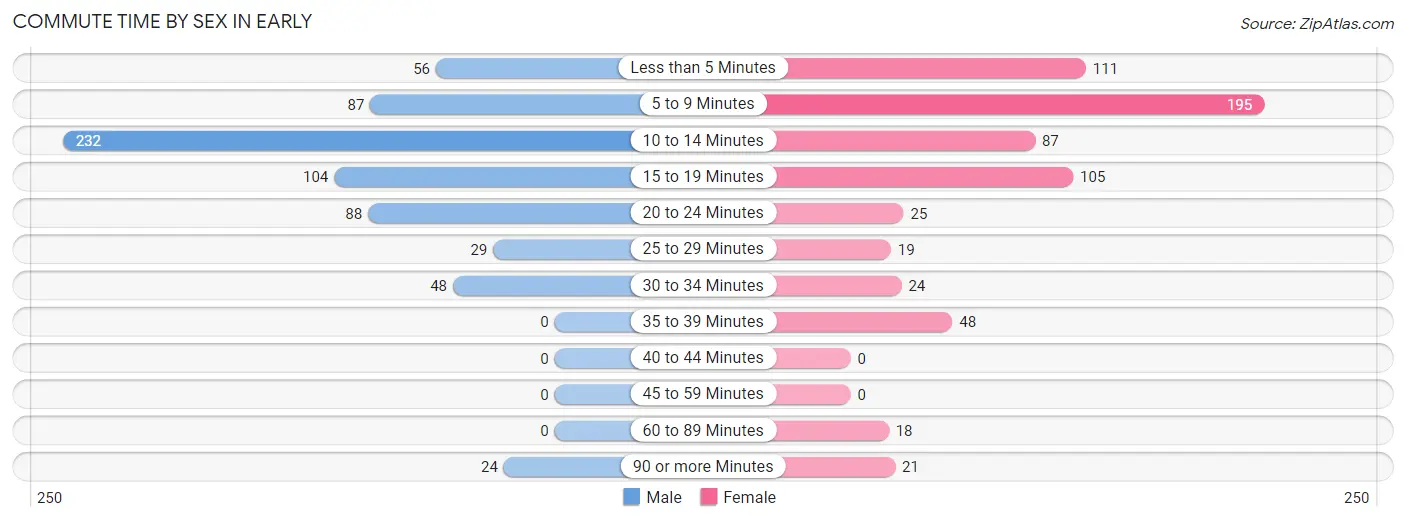
| Commute Time | Male | Female |
| Less than 5 Minutes | 56 (8.4%) | 111 (17.0%) |
| 5 to 9 Minutes | 87 (13.0%) | 195 (29.9%) |
| 10 to 14 Minutes | 232 (34.7%) | 87 (13.3%) |
| 15 to 19 Minutes | 104 (15.6%) | 105 (16.1%) |
| 20 to 24 Minutes | 88 (13.2%) | 25 (3.8%) |
| 25 to 29 Minutes | 29 (4.3%) | 19 (2.9%) |
| 30 to 34 Minutes | 48 (7.2%) | 24 (3.7%) |
| 35 to 39 Minutes | 0 (0.0%) | 48 (7.3%) |
| 40 to 44 Minutes | 0 (0.0%) | 0 (0.0%) |
| 45 to 59 Minutes | 0 (0.0%) | 0 (0.0%) |
| 60 to 89 Minutes | 0 (0.0%) | 18 (2.8%) |
| 90 or more Minutes | 24 (3.6%) | 21 (3.2%) |
Time of Departure to Work by Sex in Early
The most frequent times of departure to work in Early are 7:30 AM to 7:59 AM (136, 20.4%) for males and 7:00 AM to 7:29 AM (177, 27.1%) for females.
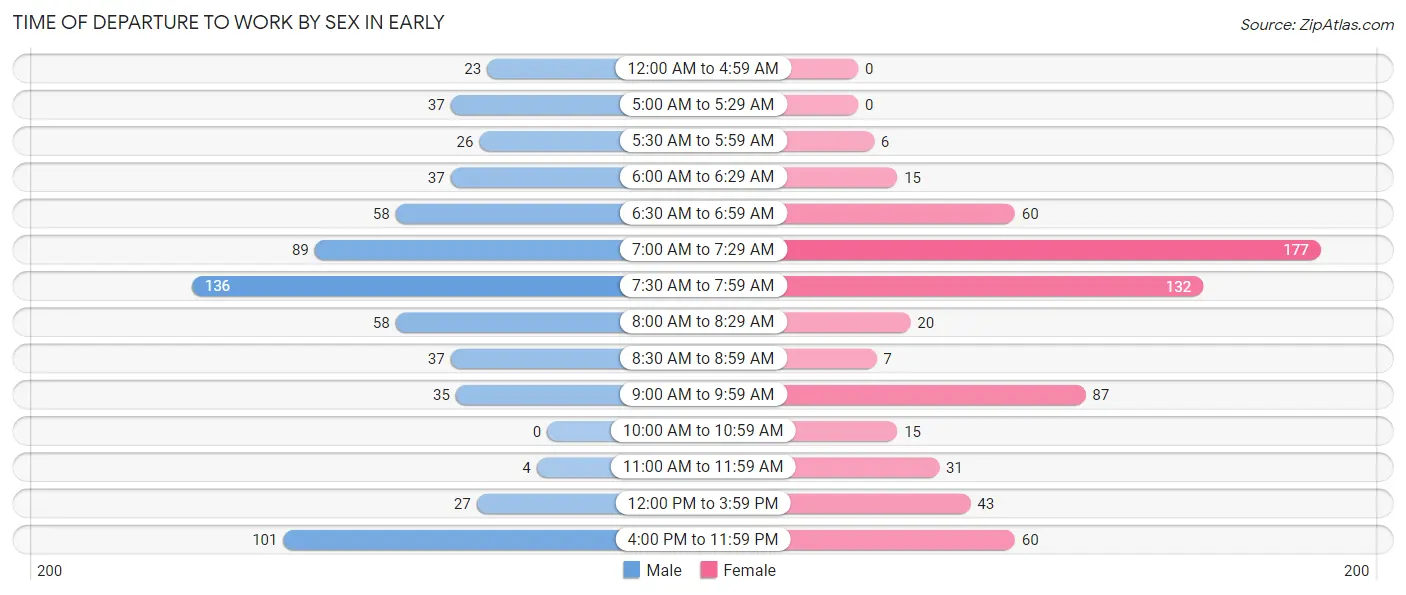
| Time of Departure | Male | Female |
| 12:00 AM to 4:59 AM | 23 (3.4%) | 0 (0.0%) |
| 5:00 AM to 5:29 AM | 37 (5.5%) | 0 (0.0%) |
| 5:30 AM to 5:59 AM | 26 (3.9%) | 6 (0.9%) |
| 6:00 AM to 6:29 AM | 37 (5.5%) | 15 (2.3%) |
| 6:30 AM to 6:59 AM | 58 (8.7%) | 60 (9.2%) |
| 7:00 AM to 7:29 AM | 89 (13.3%) | 177 (27.1%) |
| 7:30 AM to 7:59 AM | 136 (20.4%) | 132 (20.2%) |
| 8:00 AM to 8:29 AM | 58 (8.7%) | 20 (3.1%) |
| 8:30 AM to 8:59 AM | 37 (5.5%) | 7 (1.1%) |
| 9:00 AM to 9:59 AM | 35 (5.2%) | 87 (13.3%) |
| 10:00 AM to 10:59 AM | 0 (0.0%) | 15 (2.3%) |
| 11:00 AM to 11:59 AM | 4 (0.6%) | 31 (4.8%) |
| 12:00 PM to 3:59 PM | 27 (4.0%) | 43 (6.6%) |
| 4:00 PM to 11:59 PM | 101 (15.1%) | 60 (9.2%) |
| Total | 668 (100.0%) | 653 (100.0%) |
Housing Occupancy in Early
Occupancy by Ownership in Early
Of the total 1,175 dwellings in Early, owner-occupied units account for 831 (70.7%), while renter-occupied units make up 344 (29.3%).
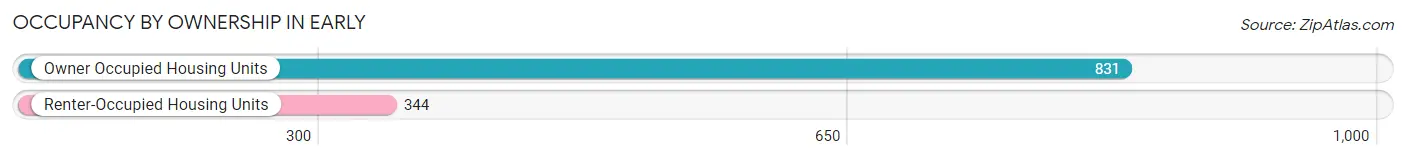
| Occupancy | # Housing Units | % Housing Units |
| Owner Occupied Housing Units | 831 | 70.7% |
| Renter-Occupied Housing Units | 344 | 29.3% |
| Total Occupied Housing Units | 1,175 | 100.0% |
Occupancy by Household Size in Early
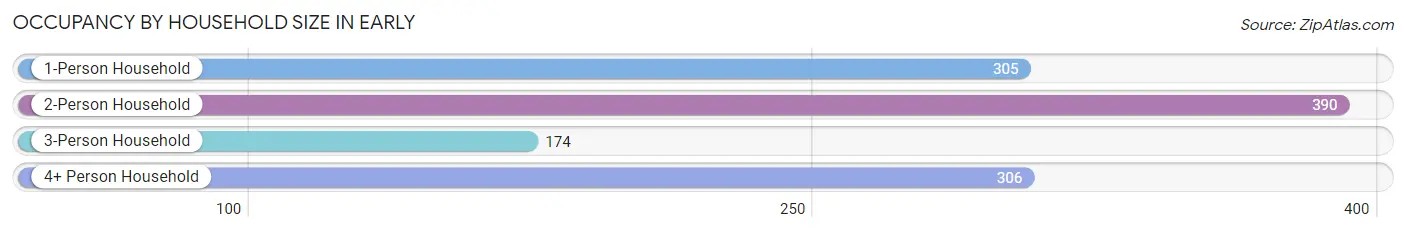
| Household Size | # Housing Units | % Housing Units |
| 1-Person Household | 305 | 26.0% |
| 2-Person Household | 390 | 33.2% |
| 3-Person Household | 174 | 14.8% |
| 4+ Person Household | 306 | 26.0% |
| Total Housing Units | 1,175 | 100.0% |
Occupancy by Ownership by Household Size in Early
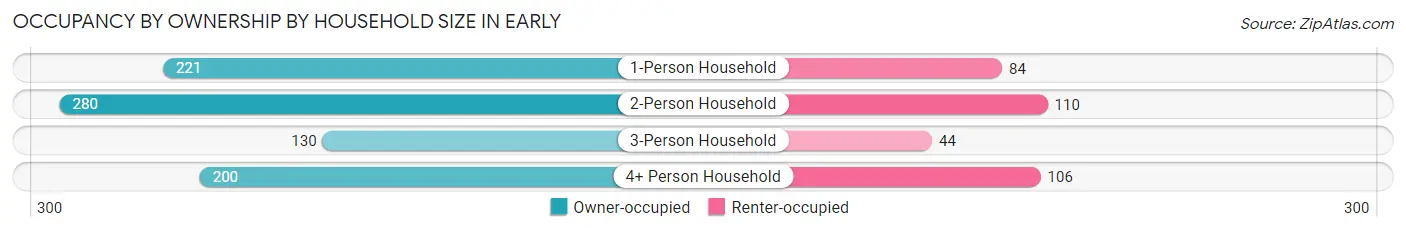
| Household Size | Owner-occupied | Renter-occupied |
| 1-Person Household | 221 (72.5%) | 84 (27.5%) |
| 2-Person Household | 280 (71.8%) | 110 (28.2%) |
| 3-Person Household | 130 (74.7%) | 44 (25.3%) |
| 4+ Person Household | 200 (65.4%) | 106 (34.6%) |
| Total Housing Units | 831 (70.7%) | 344 (29.3%) |
Occupancy by Educational Attainment in Early
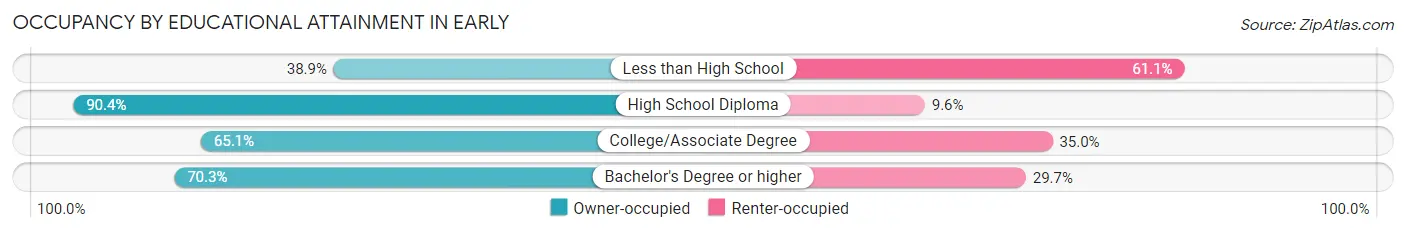
| Household Size | Owner-occupied | Renter-occupied |
| Less than High School | 21 (38.9%) | 33 (61.1%) |
| High School Diploma | 225 (90.4%) | 24 (9.6%) |
| College/Associate Degree | 348 (65.0%) | 187 (34.9%) |
| Bachelor's Degree or higher | 237 (70.3%) | 100 (29.7%) |
Occupancy by Age of Householder in Early
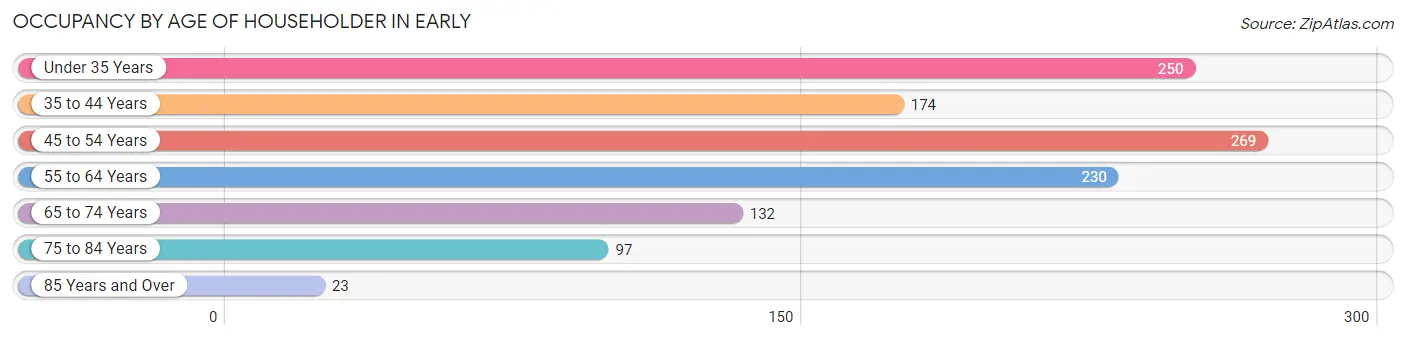
| Age Bracket | # Households | % Households |
| Under 35 Years | 250 | 21.3% |
| 35 to 44 Years | 174 | 14.8% |
| 45 to 54 Years | 269 | 22.9% |
| 55 to 64 Years | 230 | 19.6% |
| 65 to 74 Years | 132 | 11.2% |
| 75 to 84 Years | 97 | 8.3% |
| 85 Years and Over | 23 | 2.0% |
| Total | 1,175 | 100.0% |
Housing Finances in Early
Median Income by Occupancy in Early
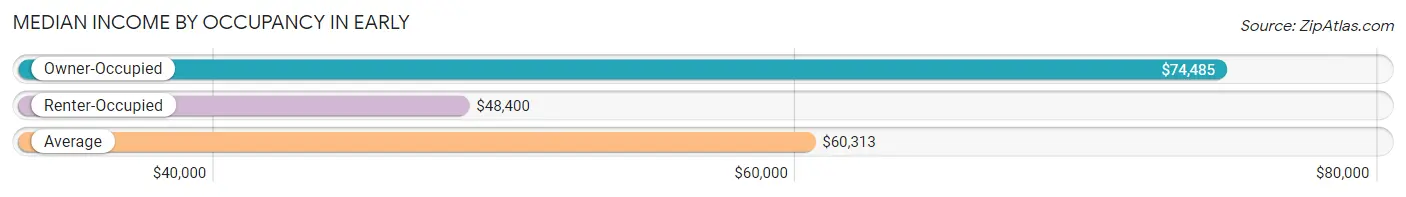
| Occupancy Type | # Households | Median Income |
| Owner-Occupied | 831 (70.7%) | $74,485 |
| Renter-Occupied | 344 (29.3%) | $48,400 |
| Average | 1,175 (100.0%) | $60,313 |
Occupancy by Householder Income Bracket in Early
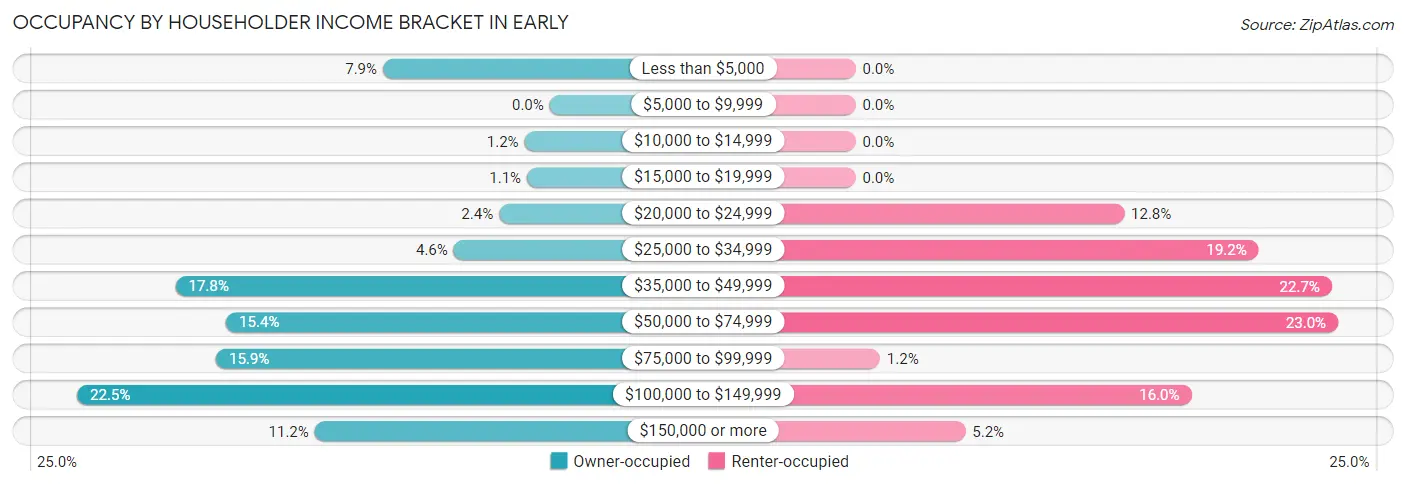
| Income Bracket | Owner-occupied | Renter-occupied |
| Less than $5,000 | 66 (7.9%) | 0 (0.0%) |
| $5,000 to $9,999 | 0 (0.0%) | 0 (0.0%) |
| $10,000 to $14,999 | 10 (1.2%) | 0 (0.0%) |
| $15,000 to $19,999 | 9 (1.1%) | 0 (0.0%) |
| $20,000 to $24,999 | 20 (2.4%) | 44 (12.8%) |
| $25,000 to $34,999 | 38 (4.6%) | 66 (19.2%) |
| $35,000 to $49,999 | 148 (17.8%) | 78 (22.7%) |
| $50,000 to $74,999 | 128 (15.4%) | 79 (23.0%) |
| $75,000 to $99,999 | 132 (15.9%) | 4 (1.2%) |
| $100,000 to $149,999 | 187 (22.5%) | 55 (16.0%) |
| $150,000 or more | 93 (11.2%) | 18 (5.2%) |
| Total | 831 (100.0%) | 344 (100.0%) |
Monthly Housing Cost Tiers in Early
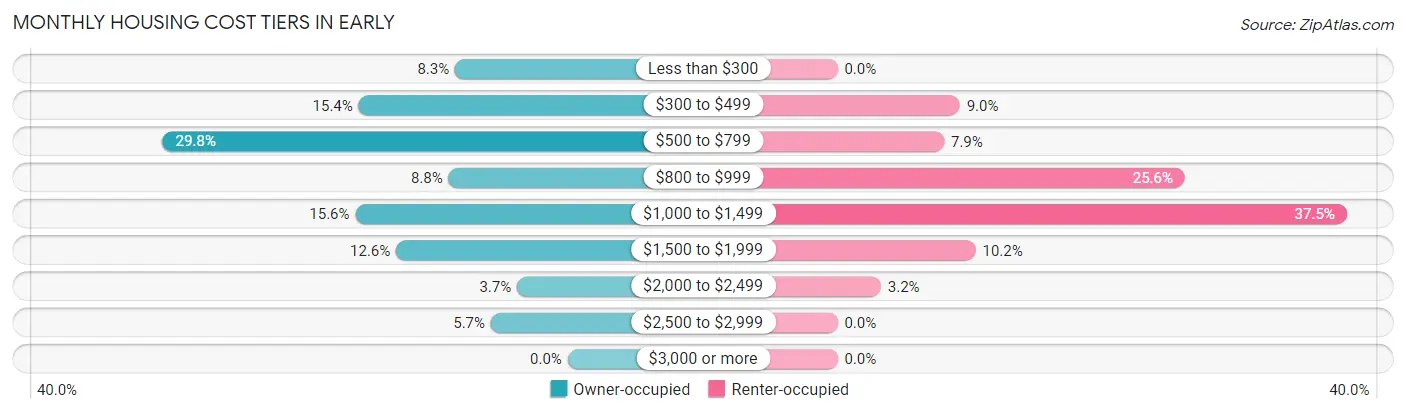
| Monthly Cost | Owner-occupied | Renter-occupied |
| Less than $300 | 69 (8.3%) | 0 (0.0%) |
| $300 to $499 | 128 (15.4%) | 31 (9.0%) |
| $500 to $799 | 248 (29.8%) | 27 (7.9%) |
| $800 to $999 | 73 (8.8%) | 88 (25.6%) |
| $1,000 to $1,499 | 130 (15.6%) | 129 (37.5%) |
| $1,500 to $1,999 | 105 (12.6%) | 35 (10.2%) |
| $2,000 to $2,499 | 31 (3.7%) | 11 (3.2%) |
| $2,500 to $2,999 | 47 (5.7%) | 0 (0.0%) |
| $3,000 or more | 0 (0.0%) | 0 (0.0%) |
| Total | 831 (100.0%) | 344 (100.0%) |
Physical Housing Characteristics in Early
Housing Structures in Early
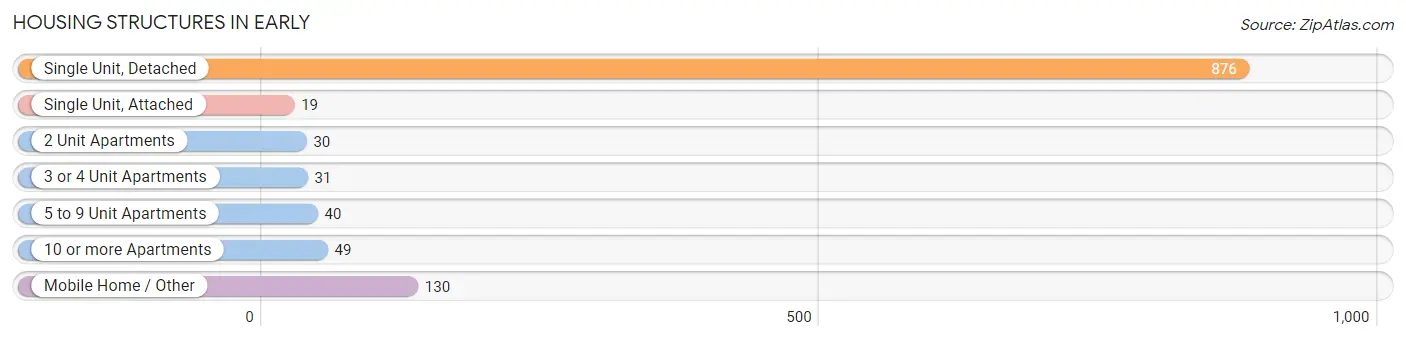
| Structure Type | # Housing Units | % Housing Units |
| Single Unit, Detached | 876 | 74.6% |
| Single Unit, Attached | 19 | 1.6% |
| 2 Unit Apartments | 30 | 2.5% |
| 3 or 4 Unit Apartments | 31 | 2.6% |
| 5 to 9 Unit Apartments | 40 | 3.4% |
| 10 or more Apartments | 49 | 4.2% |
| Mobile Home / Other | 130 | 11.1% |
| Total | 1,175 | 100.0% |
Housing Structures by Occupancy in Early
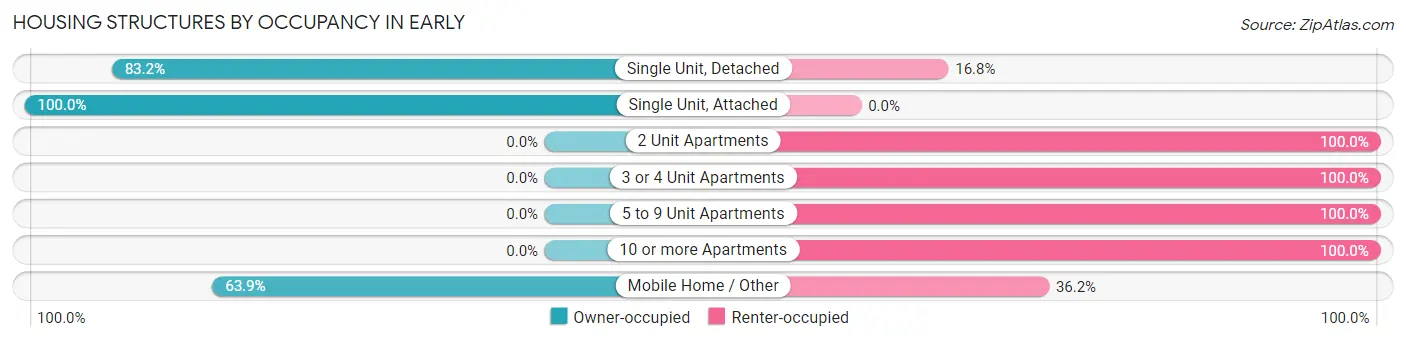
| Structure Type | Owner-occupied | Renter-occupied |
| Single Unit, Detached | 729 (83.2%) | 147 (16.8%) |
| Single Unit, Attached | 19 (100.0%) | 0 (0.0%) |
| 2 Unit Apartments | 0 (0.0%) | 30 (100.0%) |
| 3 or 4 Unit Apartments | 0 (0.0%) | 31 (100.0%) |
| 5 to 9 Unit Apartments | 0 (0.0%) | 40 (100.0%) |
| 10 or more Apartments | 0 (0.0%) | 49 (100.0%) |
| Mobile Home / Other | 83 (63.8%) | 47 (36.1%) |
| Total | 831 (70.7%) | 344 (29.3%) |
Housing Structures by Number of Rooms in Early
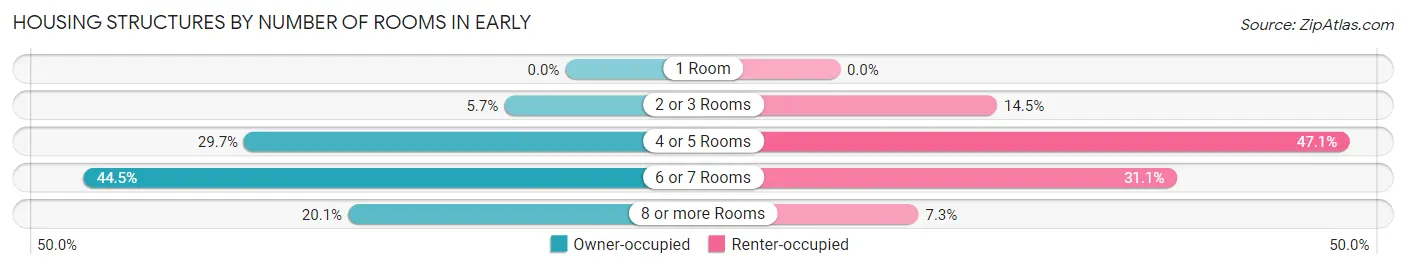
| Number of Rooms | Owner-occupied | Renter-occupied |
| 1 Room | 0 (0.0%) | 0 (0.0%) |
| 2 or 3 Rooms | 47 (5.7%) | 50 (14.5%) |
| 4 or 5 Rooms | 247 (29.7%) | 162 (47.1%) |
| 6 or 7 Rooms | 370 (44.5%) | 107 (31.1%) |
| 8 or more Rooms | 167 (20.1%) | 25 (7.3%) |
| Total | 831 (100.0%) | 344 (100.0%) |
Housing Structure by Heating Type in Early
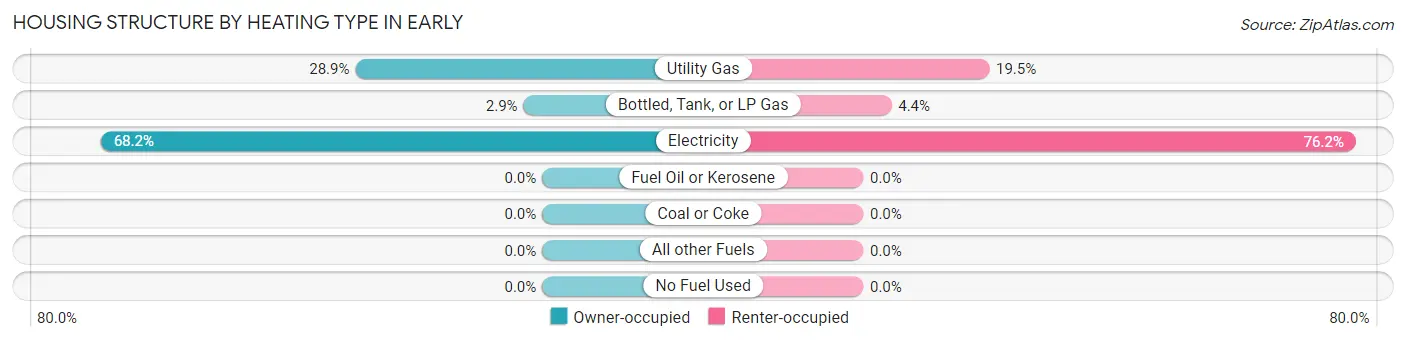
| Heating Type | Owner-occupied | Renter-occupied |
| Utility Gas | 240 (28.9%) | 67 (19.5%) |
| Bottled, Tank, or LP Gas | 24 (2.9%) | 15 (4.4%) |
| Electricity | 567 (68.2%) | 262 (76.2%) |
| Fuel Oil or Kerosene | 0 (0.0%) | 0 (0.0%) |
| Coal or Coke | 0 (0.0%) | 0 (0.0%) |
| All other Fuels | 0 (0.0%) | 0 (0.0%) |
| No Fuel Used | 0 (0.0%) | 0 (0.0%) |
| Total | 831 (100.0%) | 344 (100.0%) |
Household Vehicle Usage in Early
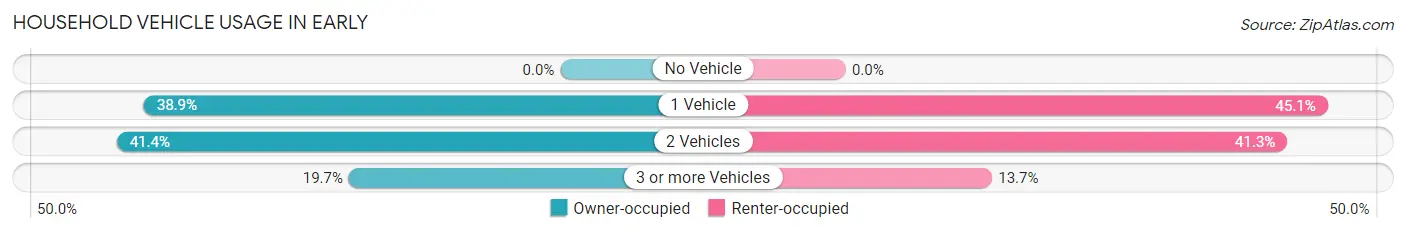
| Vehicles per Household | Owner-occupied | Renter-occupied |
| No Vehicle | 0 (0.0%) | 0 (0.0%) |
| 1 Vehicle | 323 (38.9%) | 155 (45.1%) |
| 2 Vehicles | 344 (41.4%) | 142 (41.3%) |
| 3 or more Vehicles | 164 (19.7%) | 47 (13.7%) |
| Total | 831 (100.0%) | 344 (100.0%) |
Real Estate & Mortgages in Early
Real Estate and Mortgage Overview in Early
| Characteristic | Without Mortgage | With Mortgage |
| Housing Units | 529 | 302 |
| Median Property Value | $138,800 | $186,000 |
| Median Household Income | $61,319 | $69 |
| Monthly Housing Costs | $550 | $0 |
| Real Estate Taxes | $2,273 | $0 |
Property Value by Mortgage Status in Early
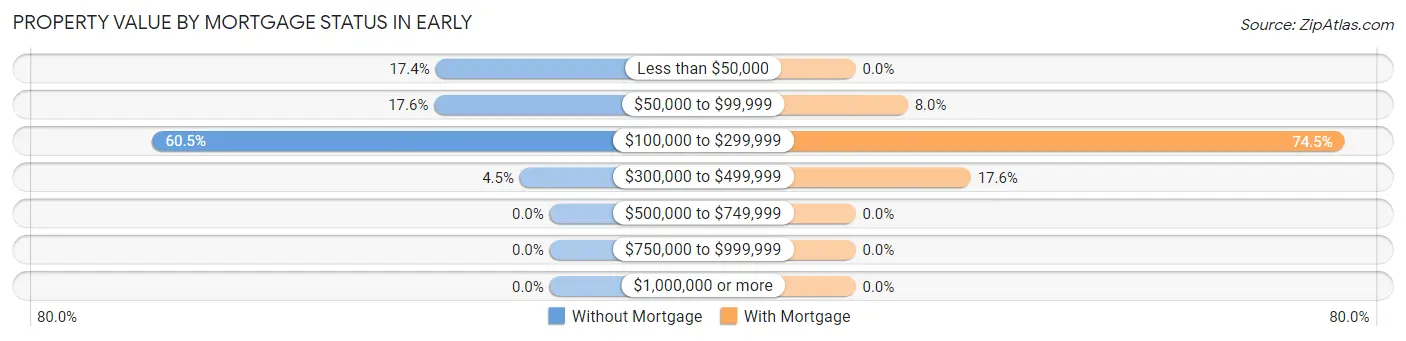
| Property Value | Without Mortgage | With Mortgage |
| Less than $50,000 | 92 (17.4%) | 0 (0.0%) |
| $50,000 to $99,999 | 93 (17.6%) | 24 (8.0%) |
| $100,000 to $299,999 | 320 (60.5%) | 225 (74.5%) |
| $300,000 to $499,999 | 24 (4.5%) | 53 (17.5%) |
| $500,000 to $749,999 | 0 (0.0%) | 0 (0.0%) |
| $750,000 to $999,999 | 0 (0.0%) | 0 (0.0%) |
| $1,000,000 or more | 0 (0.0%) | 0 (0.0%) |
| Total | 529 (100.0%) | 302 (100.0%) |
Household Income by Mortgage Status in Early
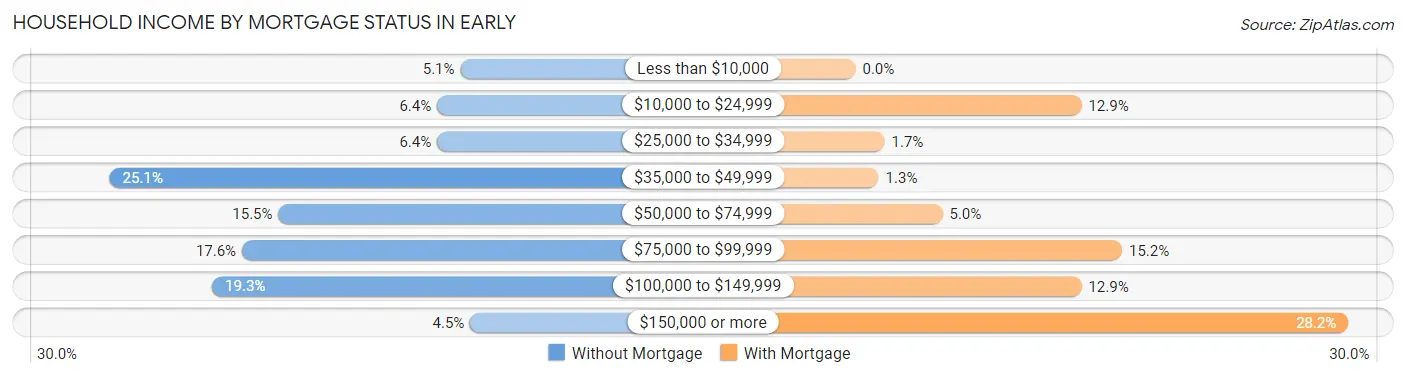
| Household Income | Without Mortgage | With Mortgage |
| Less than $10,000 | 27 (5.1%) | 0 (0.0%) |
| $10,000 to $24,999 | 34 (6.4%) | 39 (12.9%) |
| $25,000 to $34,999 | 34 (6.4%) | 5 (1.7%) |
| $35,000 to $49,999 | 133 (25.1%) | 4 (1.3%) |
| $50,000 to $74,999 | 82 (15.5%) | 15 (5.0%) |
| $75,000 to $99,999 | 93 (17.6%) | 46 (15.2%) |
| $100,000 to $149,999 | 102 (19.3%) | 39 (12.9%) |
| $150,000 or more | 24 (4.5%) | 85 (28.1%) |
| Total | 529 (100.0%) | 302 (100.0%) |
Property Value to Household Income Ratio in Early
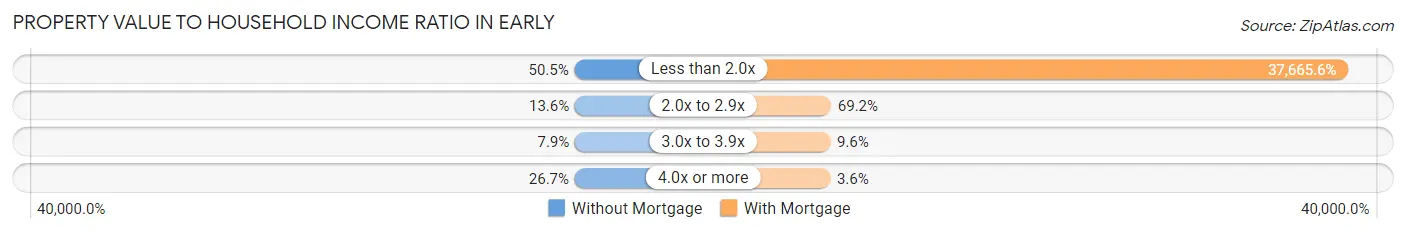
| Value-to-Income Ratio | Without Mortgage | With Mortgage |
| Less than 2.0x | 267 (50.5%) | 113,750 (37,665.6%) |
| 2.0x to 2.9x | 72 (13.6%) | 209 (69.2%) |
| 3.0x to 3.9x | 42 (7.9%) | 29 (9.6%) |
| 4.0x or more | 141 (26.7%) | 11 (3.6%) |
| Total | 529 (100.0%) | 302 (100.0%) |
Real Estate Taxes by Mortgage Status in Early
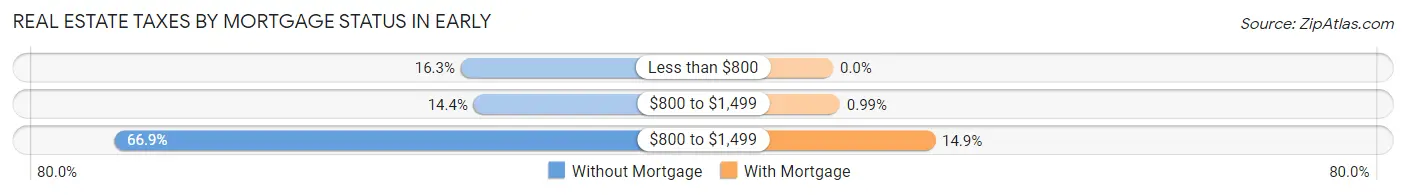
| Property Taxes | Without Mortgage | With Mortgage |
| Less than $800 | 86 (16.3%) | 0 (0.0%) |
| $800 to $1,499 | 76 (14.4%) | 3 (1.0%) |
| $800 to $1,499 | 354 (66.9%) | 45 (14.9%) |
| Total | 529 (100.0%) | 302 (100.0%) |
Health & Disability in Early
Health Insurance Coverage by Age in Early
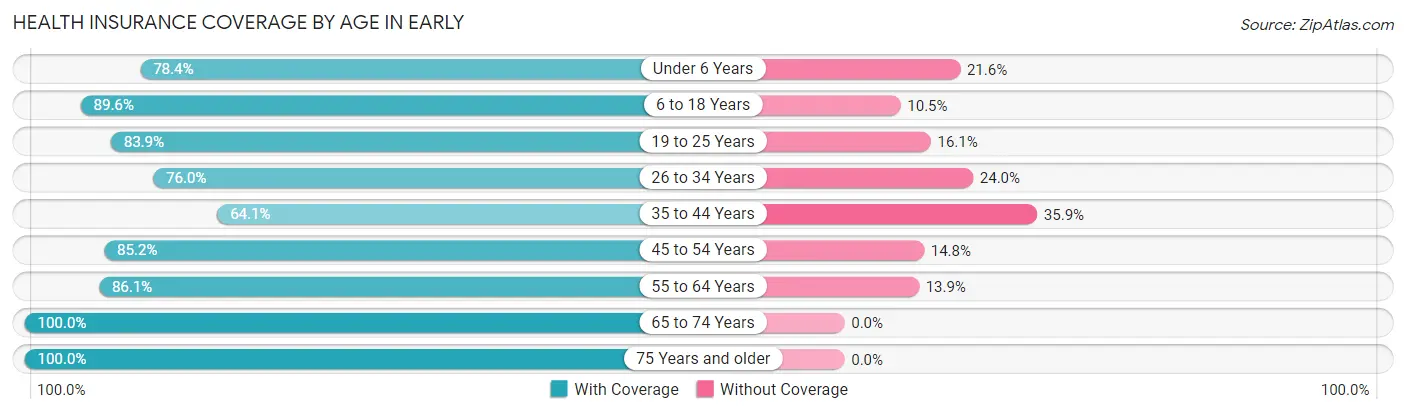
| Age Bracket | With Coverage | Without Coverage |
| Under 6 Years | 200 (78.4%) | 55 (21.6%) |
| 6 to 18 Years | 703 (89.5%) | 82 (10.4%) |
| 19 to 25 Years | 120 (83.9%) | 23 (16.1%) |
| 26 to 34 Years | 276 (76.0%) | 87 (24.0%) |
| 35 to 44 Years | 223 (64.1%) | 125 (35.9%) |
| 45 to 54 Years | 385 (85.2%) | 67 (14.8%) |
| 55 to 64 Years | 267 (86.1%) | 43 (13.9%) |
| 65 to 74 Years | 192 (100.0%) | 0 (0.0%) |
| 75 Years and older | 258 (100.0%) | 0 (0.0%) |
| Total | 2,624 (84.5%) | 482 (15.5%) |
Health Insurance Coverage by Citizenship Status in Early
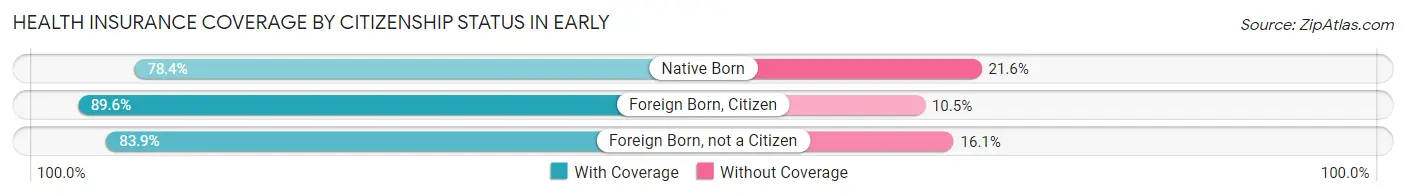
| Citizenship Status | With Coverage | Without Coverage |
| Native Born | 200 (78.4%) | 55 (21.6%) |
| Foreign Born, Citizen | 703 (89.5%) | 82 (10.4%) |
| Foreign Born, not a Citizen | 120 (83.9%) | 23 (16.1%) |
Health Insurance Coverage by Household Income in Early
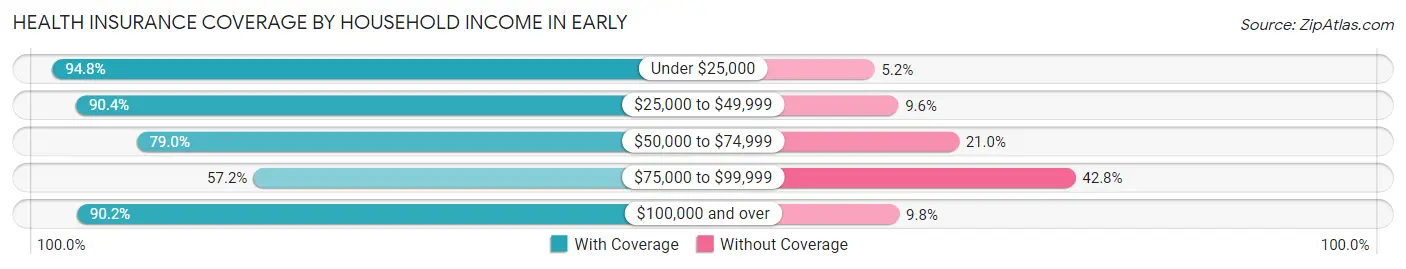
| Household Income | With Coverage | Without Coverage |
| Under $25,000 | 347 (94.8%) | 19 (5.2%) |
| $25,000 to $49,999 | 638 (90.4%) | 68 (9.6%) |
| $50,000 to $74,999 | 407 (79.0%) | 108 (21.0%) |
| $75,000 to $99,999 | 239 (57.2%) | 179 (42.8%) |
| $100,000 and over | 993 (90.2%) | 108 (9.8%) |
Public vs Private Health Insurance Coverage by Age in Early
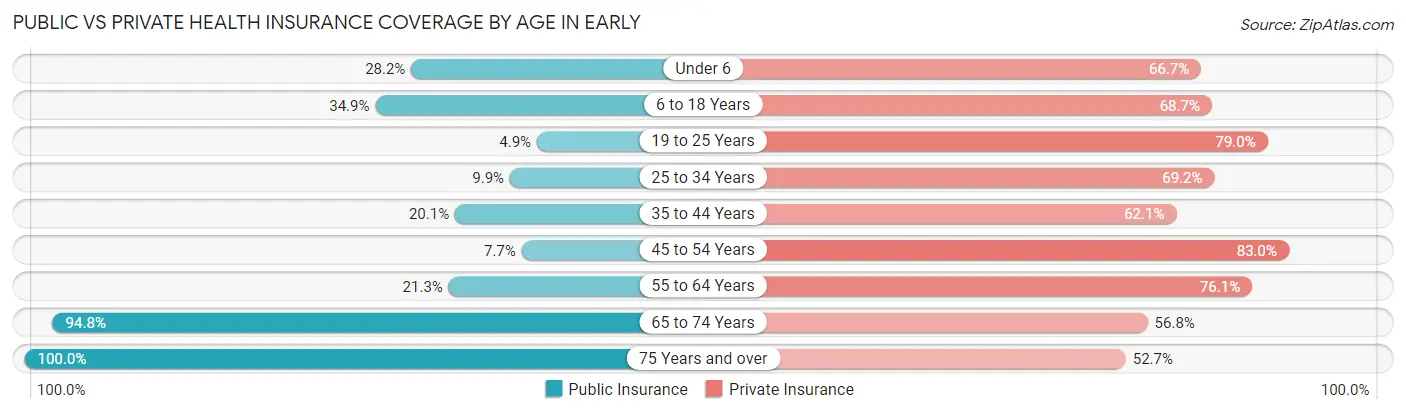
| Age Bracket | Public Insurance | Private Insurance |
| Under 6 | 72 (28.2%) | 170 (66.7%) |
| 6 to 18 Years | 274 (34.9%) | 539 (68.7%) |
| 19 to 25 Years | 7 (4.9%) | 113 (79.0%) |
| 25 to 34 Years | 36 (9.9%) | 251 (69.2%) |
| 35 to 44 Years | 70 (20.1%) | 216 (62.1%) |
| 45 to 54 Years | 35 (7.7%) | 375 (83.0%) |
| 55 to 64 Years | 66 (21.3%) | 236 (76.1%) |
| 65 to 74 Years | 182 (94.8%) | 109 (56.8%) |
| 75 Years and over | 258 (100.0%) | 136 (52.7%) |
| Total | 1,000 (32.2%) | 2,145 (69.1%) |
Disability Status by Sex by Age in Early
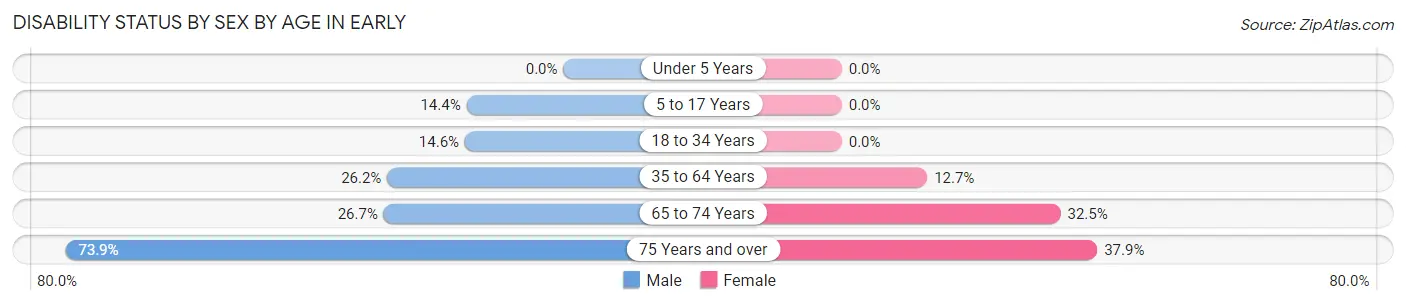
| Age Bracket | Male | Female |
| Under 5 Years | 0 (0.0%) | 0 (0.0%) |
| 5 to 17 Years | 63 (14.4%) | 0 (0.0%) |
| 18 to 34 Years | 38 (14.6%) | 0 (0.0%) |
| 35 to 64 Years | 146 (26.2%) | 70 (12.7%) |
| 65 to 74 Years | 20 (26.7%) | 38 (32.5%) |
| 75 Years and over | 105 (73.9%) | 44 (37.9%) |
Disability Class by Sex by Age in Early
Disability Class: Hearing Difficulty
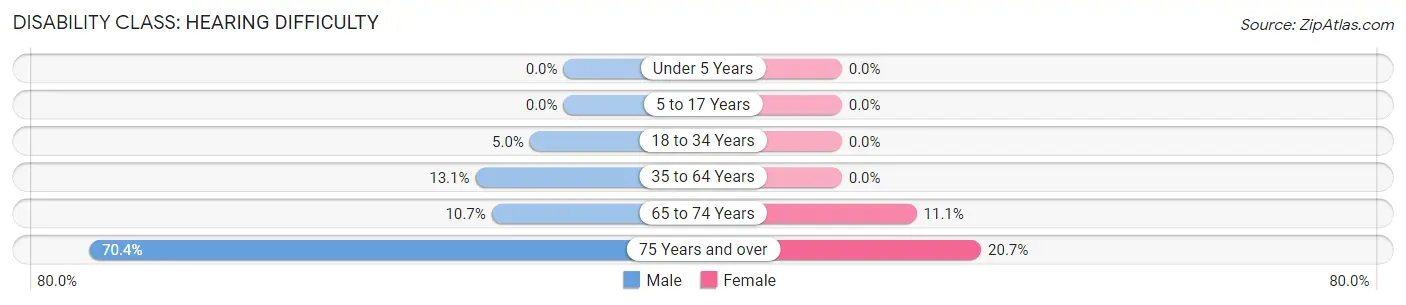
| Age Bracket | Male | Female |
| Under 5 Years | 0 (0.0%) | 0 (0.0%) |
| 5 to 17 Years | 0 (0.0%) | 0 (0.0%) |
| 18 to 34 Years | 13 (5.0%) | 0 (0.0%) |
| 35 to 64 Years | 73 (13.1%) | 0 (0.0%) |
| 65 to 74 Years | 8 (10.7%) | 13 (11.1%) |
| 75 Years and over | 100 (70.4%) | 24 (20.7%) |
Disability Class: Vision Difficulty
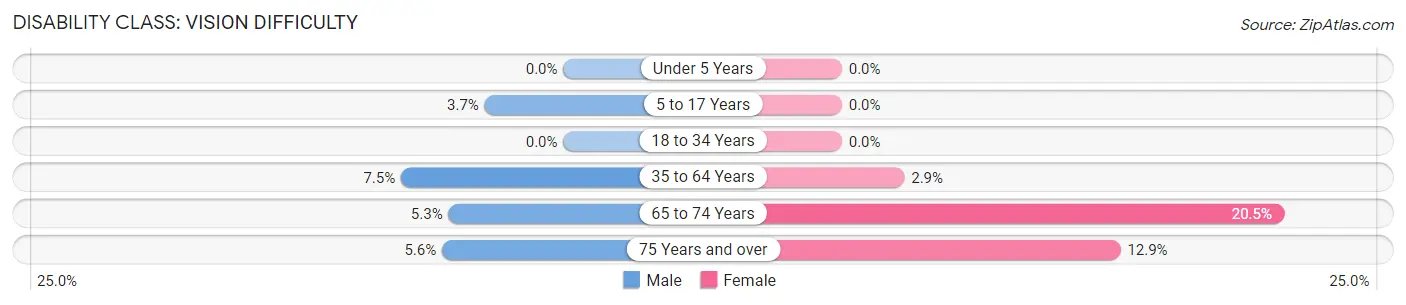
| Age Bracket | Male | Female |
| Under 5 Years | 0 (0.0%) | 0 (0.0%) |
| 5 to 17 Years | 16 (3.6%) | 0 (0.0%) |
| 18 to 34 Years | 0 (0.0%) | 0 (0.0%) |
| 35 to 64 Years | 42 (7.5%) | 16 (2.9%) |
| 65 to 74 Years | 4 (5.3%) | 24 (20.5%) |
| 75 Years and over | 8 (5.6%) | 15 (12.9%) |
Disability Class: Cognitive Difficulty
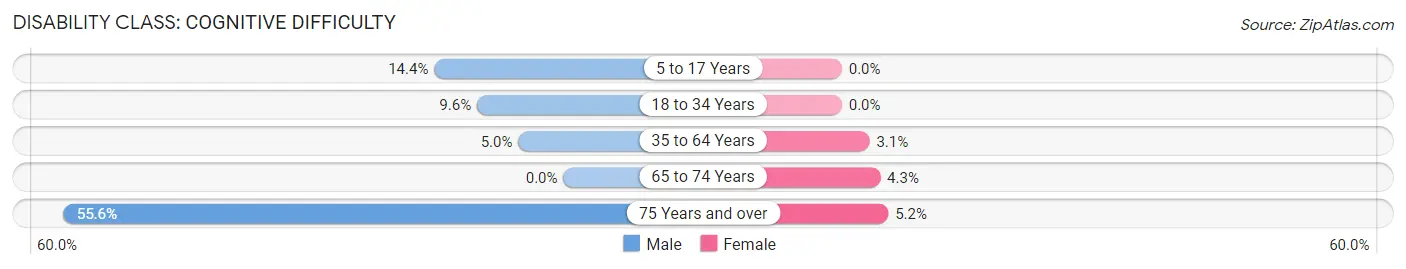
| Age Bracket | Male | Female |
| 5 to 17 Years | 63 (14.4%) | 0 (0.0%) |
| 18 to 34 Years | 25 (9.6%) | 0 (0.0%) |
| 35 to 64 Years | 28 (5.0%) | 17 (3.1%) |
| 65 to 74 Years | 0 (0.0%) | 5 (4.3%) |
| 75 Years and over | 79 (55.6%) | 6 (5.2%) |
Disability Class: Ambulatory Difficulty
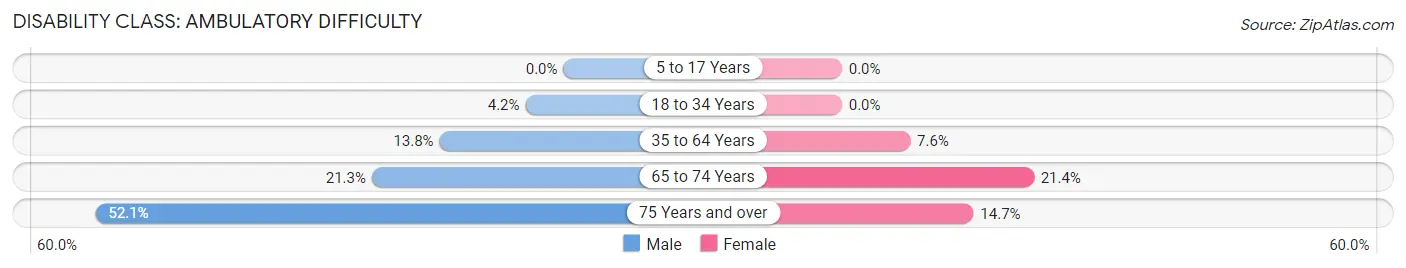
| Age Bracket | Male | Female |
| 5 to 17 Years | 0 (0.0%) | 0 (0.0%) |
| 18 to 34 Years | 11 (4.2%) | 0 (0.0%) |
| 35 to 64 Years | 77 (13.8%) | 42 (7.6%) |
| 65 to 74 Years | 16 (21.3%) | 25 (21.4%) |
| 75 Years and over | 74 (52.1%) | 17 (14.7%) |
Disability Class: Self-Care Difficulty
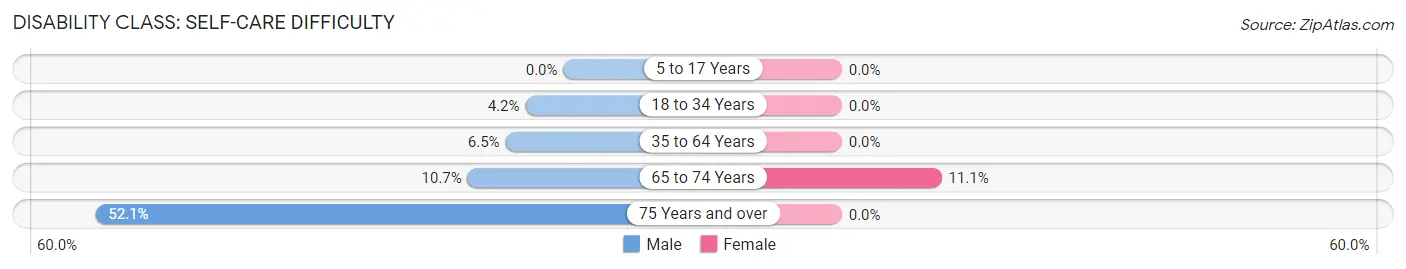
| Age Bracket | Male | Female |
| 5 to 17 Years | 0 (0.0%) | 0 (0.0%) |
| 18 to 34 Years | 11 (4.2%) | 0 (0.0%) |
| 35 to 64 Years | 36 (6.5%) | 0 (0.0%) |
| 65 to 74 Years | 8 (10.7%) | 13 (11.1%) |
| 75 Years and over | 74 (52.1%) | 0 (0.0%) |
Technology Access in Early
Computing Device Access in Early
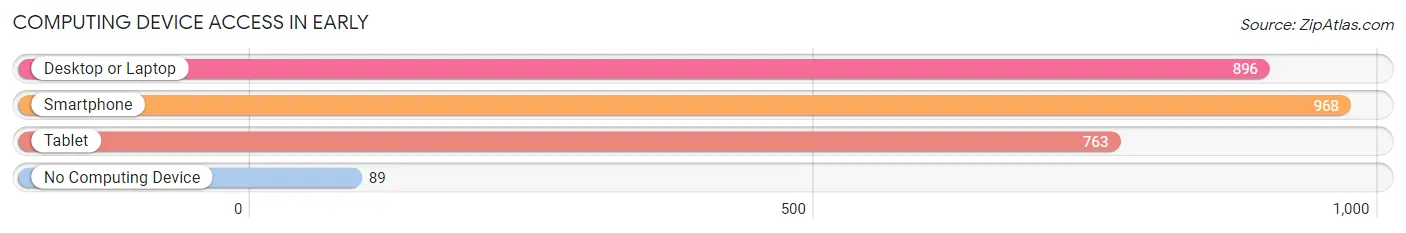
| Device Type | # Households | % Households |
| Desktop or Laptop | 896 | 76.3% |
| Smartphone | 968 | 82.4% |
| Tablet | 763 | 64.9% |
| No Computing Device | 89 | 7.6% |
| Total | 1,175 | 100.0% |
Internet Access in Early
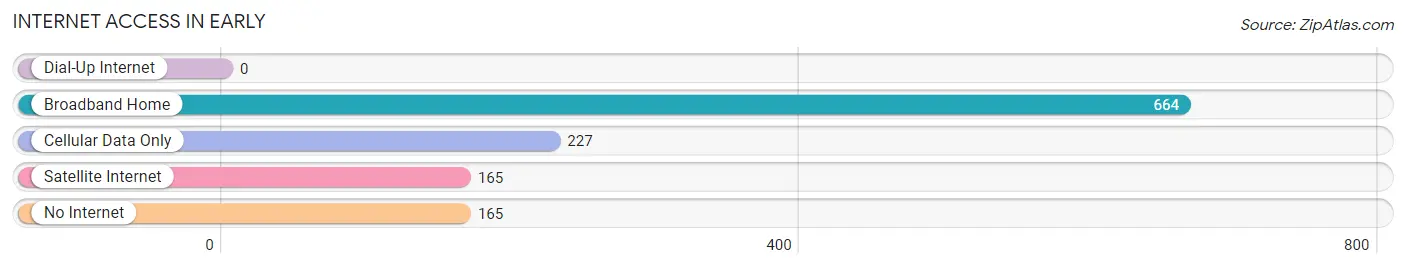
| Internet Type | # Households | % Households |
| Dial-Up Internet | 0 | 0.0% |
| Broadband Home | 664 | 56.5% |
| Cellular Data Only | 227 | 19.3% |
| Satellite Internet | 165 | 14.0% |
| No Internet | 165 | 14.0% |
| Total | 1,175 | 100.0% |
Early Summary
Texas is a state located in the south-central region of the United States. It is the second largest state in the country, both in terms of population and land area. Texas has a rich history, diverse geography, and a vibrant economy. It is also home to a diverse population, with a variety of ethnic and racial backgrounds.
History
Texas has a long and varied history, beginning with its first inhabitants, the Native Americans. The first Europeans to explore the area were Spanish explorers, who arrived in the 16th century. The Spanish established several missions and presidios in the area, and eventually claimed the region as part of the Spanish Empire.
In 1821, Mexico won its independence from Spain, and Texas became part of the newly formed Mexican Republic. In 1836, Texas declared its independence from Mexico, and the Republic of Texas was formed. The Republic of Texas existed until 1845, when it was annexed by the United States.
Texas was admitted to the Union as the 28th state in 1845. During the Civil War, Texas seceded from the Union and joined the Confederate States of America. After the war, Texas was readmitted to the Union in 1870.
Geography
Texas is located in the south-central region of the United States. It is bordered by Oklahoma to the north, Arkansas and Louisiana to the east, and Mexico to the south. The state has a total area of 268,820 square miles, making it the second largest state in the country.
Texas is divided into four distinct geographic regions: the Gulf Coastal Plains, the Great Plains, the Edwards Plateau, and the Basin and Range Province. The Gulf Coastal Plains are located along the Gulf of Mexico, and are characterized by flat terrain and sandy beaches. The Great Plains are located in the northern part of the state, and are characterized by rolling hills and grasslands. The Edwards Plateau is located in the central part of the state, and is characterized by rugged hills and canyons. The Basin and Range Province is located in the western part of the state, and is characterized by mountains and desert.
Economy
Texas has a strong and diverse economy. The state is a major producer of oil and natural gas, and is home to several major oil and gas companies. It is also a major producer of agricultural products, including cotton, cattle, and wheat.
The state is also home to several major industries, including aerospace, biotechnology, and information technology. Texas is also home to several major cities, including Houston, Dallas, San Antonio, and Austin.
Demographics
As of the 2010 census, Texas had a population of 25.1 million people. The state is home to a diverse population, with a variety of ethnic and racial backgrounds. The largest ethnic group in the state is Hispanic or Latino, which makes up 38.4% of the population. The second largest ethnic group is White, which makes up 43.8% of the population. Other ethnic groups include African American (11.8%), Asian (3.8%), and Native American (0.7%).
The state is also home to a variety of religious groups. The largest religious group in the state is Christian, which makes up 75.2% of the population. Other religious groups include Jewish (2.2%), Muslim (1.3%), and Buddhist (0.5%).
Conclusion
Texas is a state with a rich history, diverse geography, and a vibrant economy. It is also home to a diverse population, with a variety of ethnic and racial backgrounds. The state has a strong and diverse economy, and is home to several major industries. Texas is also home to several major cities, including Houston, Dallas, San Antonio, and Austin.
Common Questions
What is Per Capita Income in Early?
Per Capita income in Early is $29,754.
What is the Median Family Income in Early?
Median Family Income in Early is $73,162.
What is the Median Household income in Early?
Median Household Income in Early is $60,313.
What is Income or Wage Gap in Early?
Income or Wage Gap in Early is 51.6%.
Women in Early earn 48.4 cents for every dollar earned by a man.
What is Inequality or Gini Index in Early?
Inequality or Gini Index in Early is 0.37.
What is the Total Population of Early?
Total Population of Early is 3,116.
What is the Total Male Population of Early?
Total Male Population of Early is 1,555.
What is the Total Female Population of Early?
Total Female Population of Early is 1,561.
What is the Ratio of Males per 100 Females in Early?
There are 99.62 Males per 100 Females in Early.
What is the Ratio of Females per 100 Males in Early?
There are 100.39 Females per 100 Males in Early.
What is the Median Population Age in Early?
Median Population Age in Early is 36.2 Years.
What is the Average Family Size in Early
Average Family Size in Early is 3.2 People.
What is the Average Household Size in Early
Average Household Size in Early is 2.6 People.
How Large is the Labor Force in Early?
There are 1,496 People in the Labor Forcein in Early.
What is the Percentage of People in the Labor Force in Early?
68.3% of People are in the Labor Force in Early.
What is the Unemployment Rate in Early?
Unemployment Rate in Early is 2.4%.