Auburn, CA Map & Demographics
Auburn Map
Auburn Overview
$51,036
PER CAPITA INCOME
$104,764
AVG FAMILY INCOME
$73,074
AVG HOUSEHOLD INCOME
35.7%
WAGE / INCOME GAP [ % ]
64.3¢/ $1
WAGE / INCOME GAP [ $ ]
0.51
INEQUALITY / GINI INDEX
13,773
TOTAL POPULATION
6,373
MALE POPULATION
7,400
FEMALE POPULATION
86.12
MALES / 100 FEMALES
116.11
FEMALES / 100 MALES
47.3
MEDIAN AGE
2.7
AVG FAMILY SIZE
2.1
AVG HOUSEHOLD SIZE
6,446
LABOR FORCE [ PEOPLE ]
54.3%
PERCENT IN LABOR FORCE
2.9%
UNEMPLOYMENT RATE
Auburn Area Codes
Income in Auburn
Income Overview in Auburn
Per Capita Income in Auburn is $51,036, while median incomes of families and households are $104,764 and $73,074 respectively.
| Characteristic | Number | Measure |
| Per Capita Income | 13,773 | $51,036 |
| Median Family Income | 3,632 | $104,764 |
| Mean Family Income | 3,632 | $130,818 |
| Median Household Income | 6,328 | $73,074 |
| Mean Household Income | 6,328 | $108,693 |
| Income Deficit | 3,632 | $0 |
| Wage / Income Gap (%) | 13,773 | 35.72% |
| Wage / Income Gap ($) | 13,773 | 64.28¢ per $1 |
| Gini / Inequality Index | 13,773 | 0.51 |
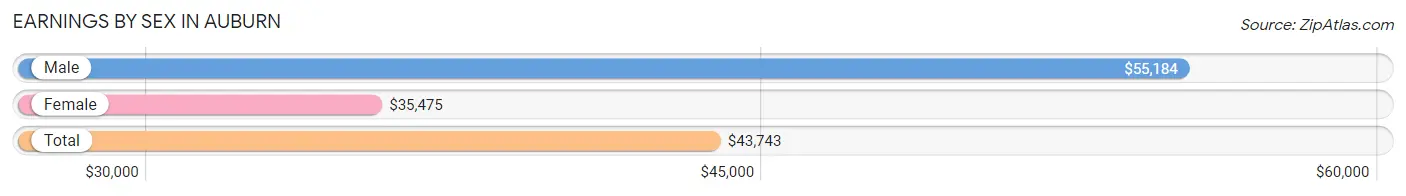
Earnings by Sex in Auburn
Average Earnings in Auburn are $43,743, $55,184 for men and $35,475 for women, a difference of 35.7%.
| Sex | Number | Average Earnings |
| Male | 3,379 (49.4%) | $55,184 |
| Female | 3,463 (50.6%) | $35,475 |
| Total | 6,842 (100.0%) | $43,743 |
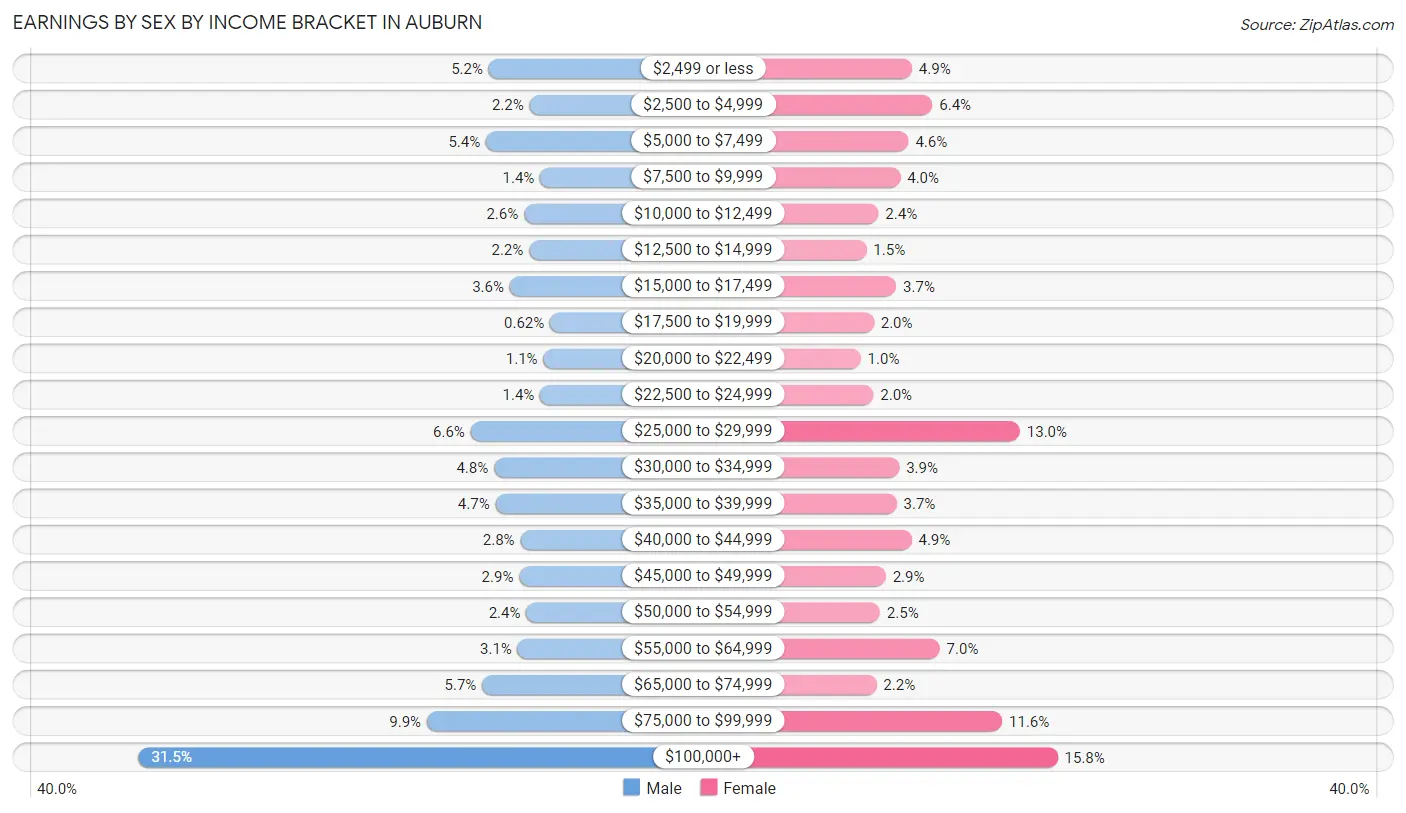
Earnings by Sex by Income Bracket in Auburn
The most common earnings brackets in Auburn are $100,000+ for men (1,063 | 31.5%) and $100,000+ for women (547 | 15.8%).
| Income | Male | Female |
| $2,499 or less | 176 (5.2%) | 169 (4.9%) |
| $2,500 to $4,999 | 73 (2.2%) | 222 (6.4%) |
| $5,000 to $7,499 | 183 (5.4%) | 160 (4.6%) |
| $7,500 to $9,999 | 46 (1.4%) | 139 (4.0%) |
| $10,000 to $12,499 | 87 (2.6%) | 82 (2.4%) |
| $12,500 to $14,999 | 74 (2.2%) | 51 (1.5%) |
| $15,000 to $17,499 | 123 (3.6%) | 128 (3.7%) |
| $17,500 to $19,999 | 21 (0.6%) | 70 (2.0%) |
| $20,000 to $22,499 | 38 (1.1%) | 36 (1.0%) |
| $22,500 to $24,999 | 46 (1.4%) | 69 (2.0%) |
| $25,000 to $29,999 | 222 (6.6%) | 449 (13.0%) |
| $30,000 to $34,999 | 163 (4.8%) | 136 (3.9%) |
| $35,000 to $39,999 | 159 (4.7%) | 129 (3.7%) |
| $40,000 to $44,999 | 96 (2.8%) | 168 (4.9%) |
| $45,000 to $49,999 | 99 (2.9%) | 101 (2.9%) |
| $50,000 to $54,999 | 81 (2.4%) | 86 (2.5%) |
| $55,000 to $64,999 | 103 (3.0%) | 241 (7.0%) |
| $65,000 to $74,999 | 193 (5.7%) | 77 (2.2%) |
| $75,000 to $99,999 | 333 (9.9%) | 403 (11.6%) |
| $100,000+ | 1,063 (31.5%) | 547 (15.8%) |
| Total | 3,379 (100.0%) | 3,463 (100.0%) |
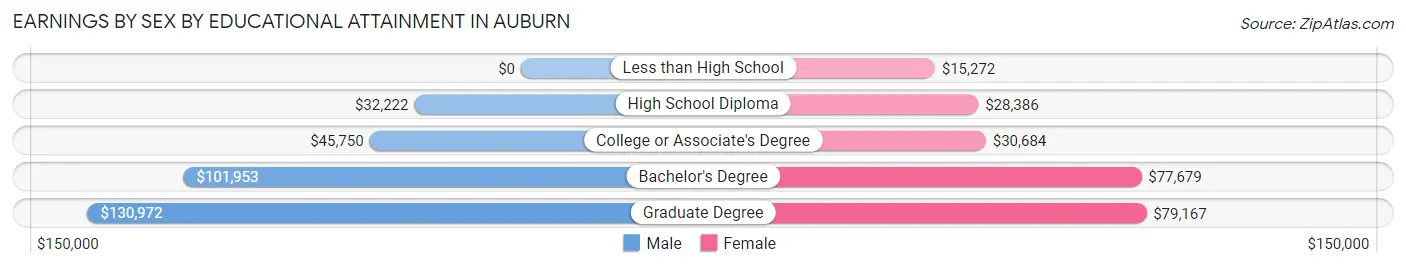
Earnings by Sex by Educational Attainment in Auburn
Average earnings in Auburn are $66,779 for men and $41,504 for women, a difference of 37.9%. Men with an educational attainment of graduate degree enjoy the highest average annual earnings of $130,972, while those with high school diploma education earn the least with $32,222. Women with an educational attainment of graduate degree earn the most with the average annual earnings of $79,167, while those with less than high school education have the smallest earnings of $15,272.
| Educational Attainment | Male Income | Female Income |
| Less than High School | - | - |
| High School Diploma | $32,222 | $28,386 |
| College or Associate's Degree | $45,750 | $30,684 |
| Bachelor's Degree | $101,953 | $77,679 |
| Graduate Degree | $130,972 | $79,167 |
| Total | $66,779 | $41,504 |
Family Income in Auburn
Family Income Brackets in Auburn
According to the Auburn family income data, there are 774 families falling into the $100,000 to $149,999 income range, which is the most common income bracket and makes up 21.3% of all families. Conversely, the $10,000 to $14,999 income bracket is the least frequent group with only 29 families (0.8%) belonging to this category.
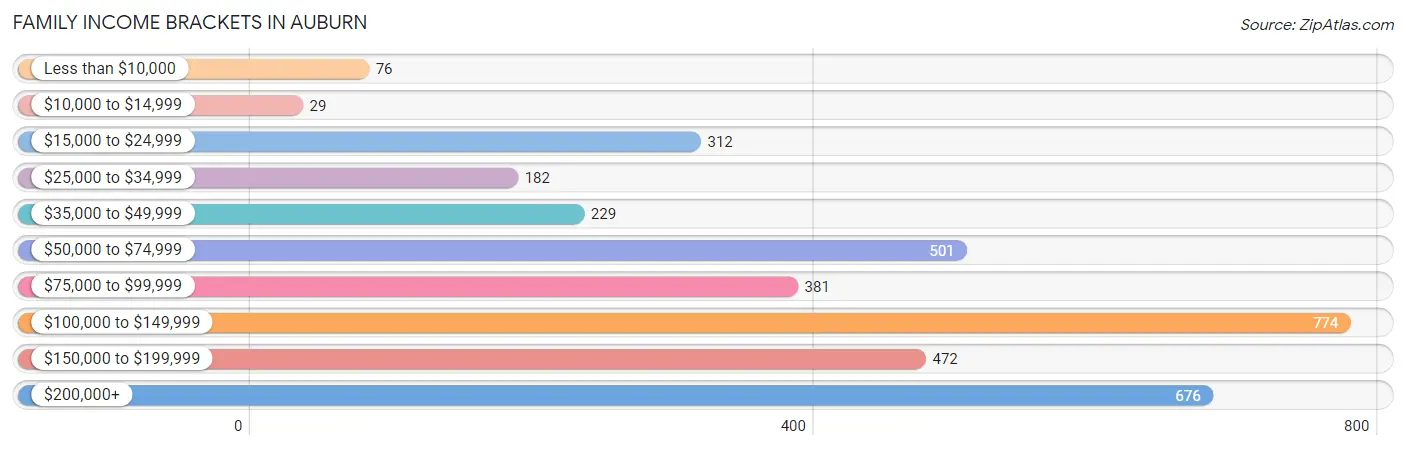
| Income Bracket | # Families | % Families |
| Less than $10,000 | 76 | 2.1% |
| $10,000 to $14,999 | 29 | 0.8% |
| $15,000 to $24,999 | 312 | 8.6% |
| $25,000 to $34,999 | 182 | 5.0% |
| $35,000 to $49,999 | 229 | 6.3% |
| $50,000 to $74,999 | 501 | 13.8% |
| $75,000 to $99,999 | 381 | 10.5% |
| $100,000 to $149,999 | 774 | 21.3% |
| $150,000 to $199,999 | 472 | 13.0% |
| $200,000+ | 676 | 18.6% |
Family Income by Famaliy Size in Auburn
4-person families (314 | 8.6%) account for the highest median family income in Auburn with $148,690 per family, while 2-person families (2,332 | 64.2%) have the highest median income of $48,625 per family member.
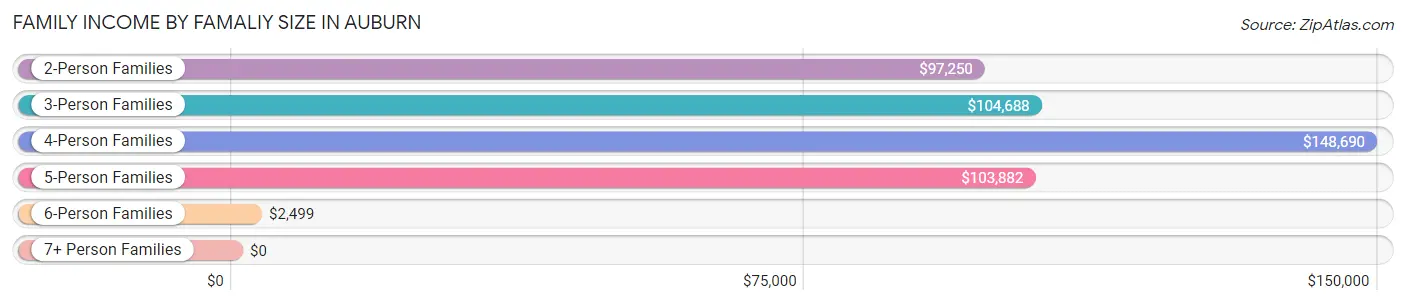
| Income Bracket | # Families | Median Income |
| 2-Person Families | 2,332 (64.2%) | $97,250 |
| 3-Person Families | 690 (19.0%) | $104,688 |
| 4-Person Families | 314 (8.6%) | $148,690 |
| 5-Person Families | 219 (6.0%) | $103,882 |
| 6-Person Families | 49 (1.3%) | $2,499 |
| 7+ Person Families | 28 (0.8%) | $0 |
| Total | 3,632 (100.0%) | $104,764 |
Family Income by Number of Earners in Auburn
The median family income in Auburn is $104,764, with families comprising 3+ earners (232) having the highest median family income of $173,750, while families with 1 earner (1,352) have the lowest median family income of $69,213, accounting for 6.4% and 37.2% of families, respectively.
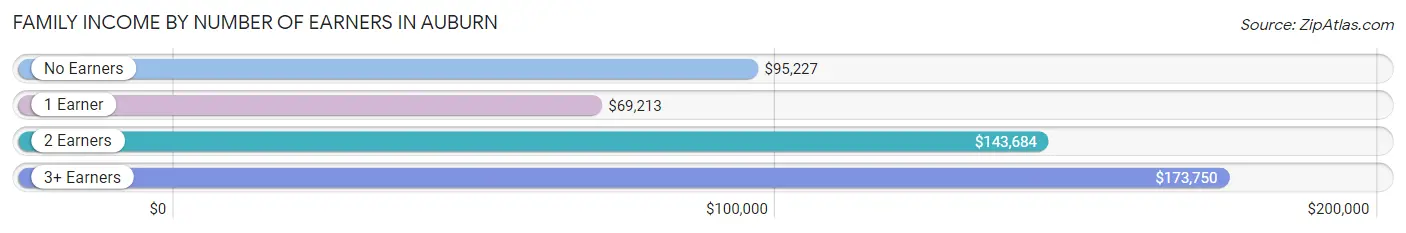
| Number of Earners | # Families | Median Income |
| No Earners | 848 (23.4%) | $95,227 |
| 1 Earner | 1,352 (37.2%) | $69,213 |
| 2 Earners | 1,200 (33.0%) | $143,684 |
| 3+ Earners | 232 (6.4%) | $173,750 |
| Total | 3,632 (100.0%) | $104,764 |
Household Income in Auburn
Household Income Brackets in Auburn
With 1,133 households falling in the category, the $100,000 to $149,999 income range is the most frequent in Auburn, accounting for 17.9% of all households. In contrast, only 259 households (4.1%) fall into the less than $10,000 income bracket, making it the least populous group.
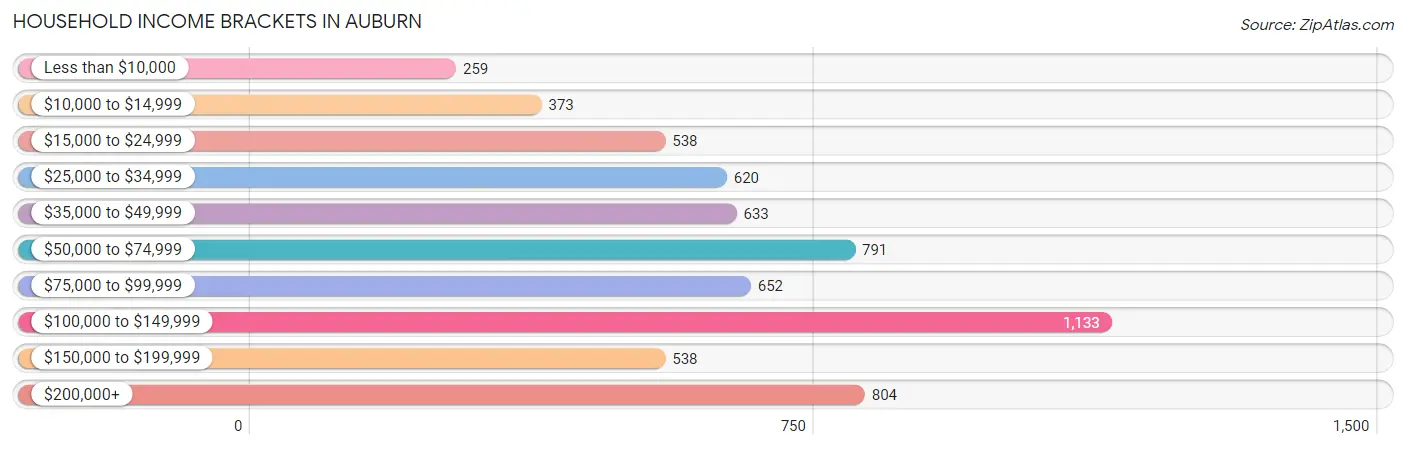
| Income Bracket | # Households | % Households |
| Less than $10,000 | 259 | 4.1% |
| $10,000 to $14,999 | 373 | 5.9% |
| $15,000 to $24,999 | 538 | 8.5% |
| $25,000 to $34,999 | 620 | 9.8% |
| $35,000 to $49,999 | 633 | 10.0% |
| $50,000 to $74,999 | 791 | 12.5% |
| $75,000 to $99,999 | 652 | 10.3% |
| $100,000 to $149,999 | 1,133 | 17.9% |
| $150,000 to $199,999 | 538 | 8.5% |
| $200,000+ | 804 | 12.7% |
Household Income by Householder Age in Auburn
The median household income in Auburn is $73,074, with the highest median household income of $88,780 found in the 45 to 64 years age bracket for the primary householder. A total of 2,413 households (38.1%) fall into this category. Meanwhile, the 15 to 24 years age bracket for the primary householder has the lowest median household income of $0, with 159 households (2.5%) in this group.
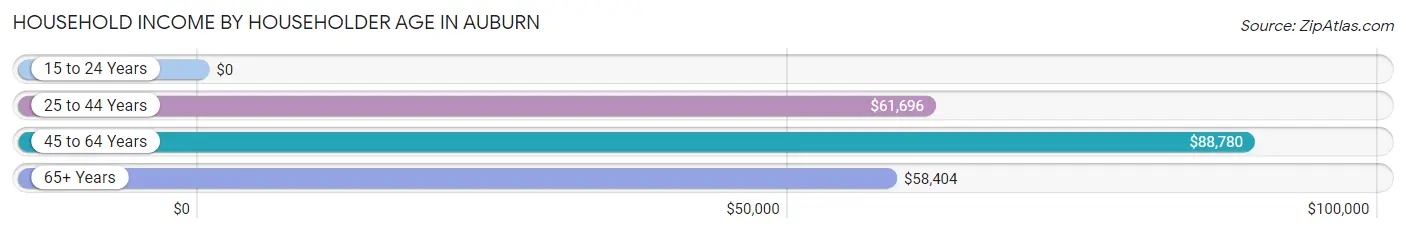
| Income Bracket | # Households | Median Income |
| 15 to 24 Years | 159 (2.5%) | $0 |
| 25 to 44 Years | 1,572 (24.8%) | $61,696 |
| 45 to 64 Years | 2,413 (38.1%) | $88,780 |
| 65+ Years | 2,184 (34.5%) | $58,404 |
| Total | 6,328 (100.0%) | $73,074 |
Poverty in Auburn
Income Below Poverty by Sex and Age in Auburn
With 14.4% poverty level for males and 14.5% for females among the residents of Auburn, 5 year old males and 35 to 44 year old females are the most vulnerable to poverty, with 27 males (58.7%) and 226 females (25.1%) in their respective age groups living below the poverty level.
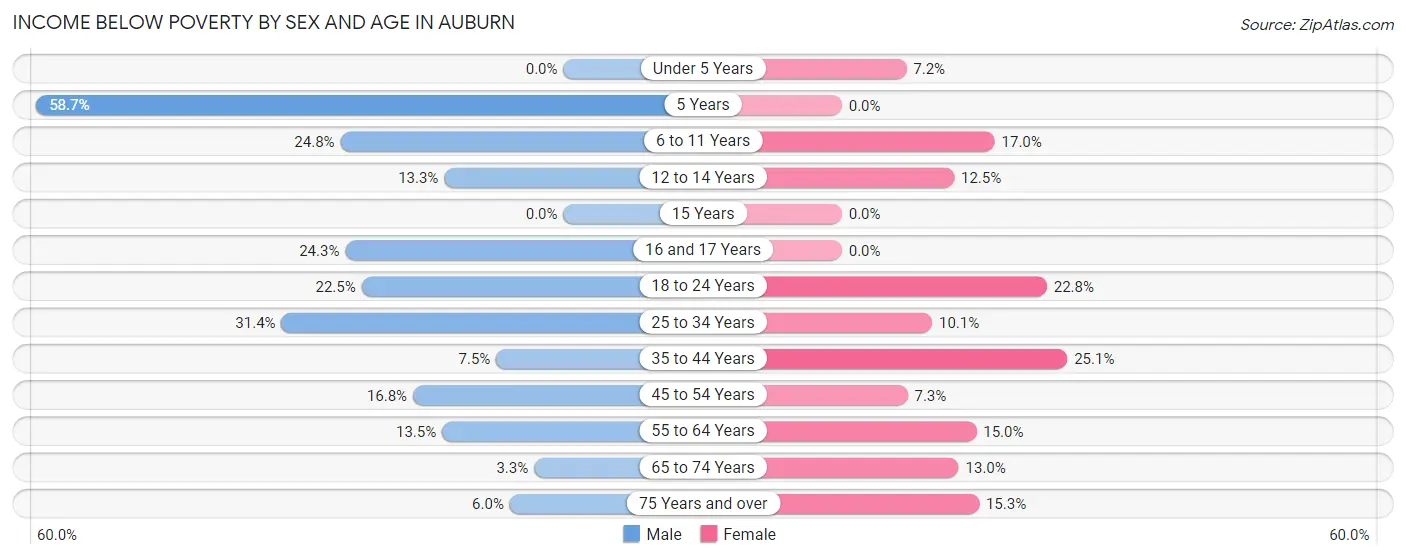
| Age Bracket | Male | Female |
| Under 5 Years | 0 (0.0%) | 10 (7.2%) |
| 5 Years | 27 (58.7%) | 0 (0.0%) |
| 6 to 11 Years | 110 (24.8%) | 72 (17.0%) |
| 12 to 14 Years | 13 (13.3%) | 30 (12.5%) |
| 15 Years | 0 (0.0%) | 0 (0.0%) |
| 16 and 17 Years | 34 (24.3%) | 0 (0.0%) |
| 18 to 24 Years | 113 (22.5%) | 126 (22.8%) |
| 25 to 34 Years | 222 (31.4%) | 76 (10.1%) |
| 35 to 44 Years | 61 (7.5%) | 226 (25.1%) |
| 45 to 54 Years | 129 (16.8%) | 54 (7.3%) |
| 55 to 64 Years | 140 (13.5%) | 189 (15.0%) |
| 65 to 74 Years | 30 (3.3%) | 152 (13.0%) |
| 75 Years and over | 31 (6.0%) | 118 (15.3%) |
| Total | 910 (14.4%) | 1,053 (14.5%) |
Income Above Poverty by Sex and Age in Auburn
According to the poverty statistics in Auburn, males aged under 5 years and females aged 5 years are the age groups that are most secure financially, with 100.0% of males and 100.0% of females in these age groups living above the poverty line.
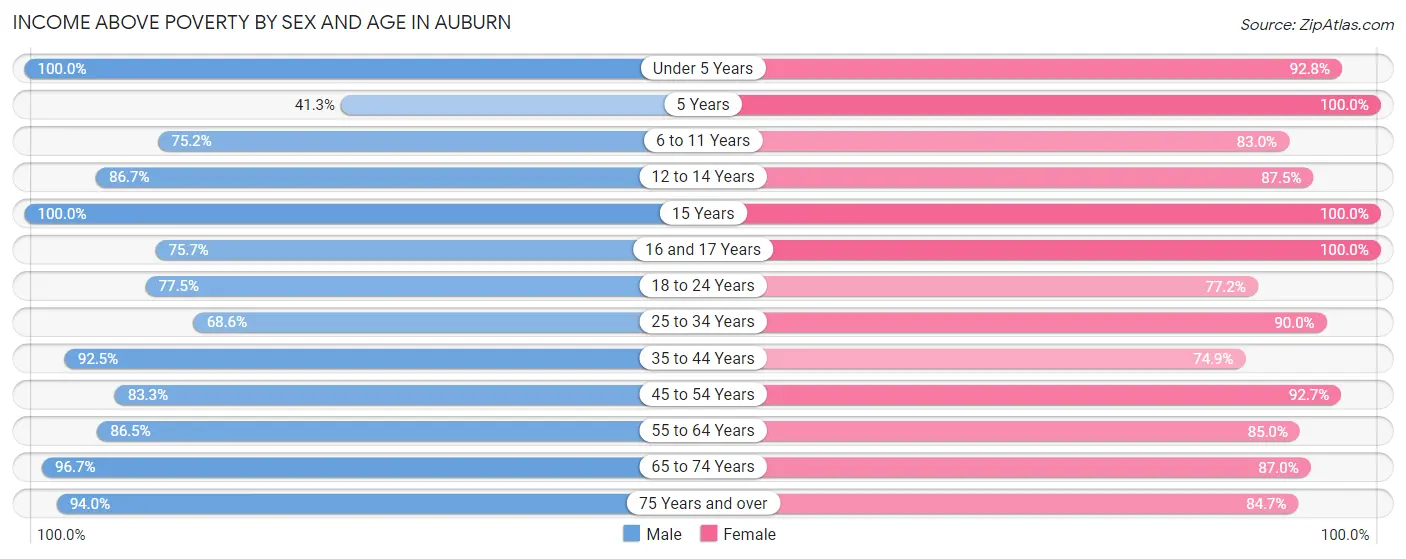
| Age Bracket | Male | Female |
| Under 5 Years | 281 (100.0%) | 129 (92.8%) |
| 5 Years | 19 (41.3%) | 128 (100.0%) |
| 6 to 11 Years | 333 (75.2%) | 351 (83.0%) |
| 12 to 14 Years | 85 (86.7%) | 210 (87.5%) |
| 15 Years | 51 (100.0%) | 39 (100.0%) |
| 16 and 17 Years | 106 (75.7%) | 127 (100.0%) |
| 18 to 24 Years | 390 (77.5%) | 426 (77.2%) |
| 25 to 34 Years | 485 (68.6%) | 680 (89.9%) |
| 35 to 44 Years | 754 (92.5%) | 674 (74.9%) |
| 45 to 54 Years | 641 (83.3%) | 684 (92.7%) |
| 55 to 64 Years | 896 (86.5%) | 1,073 (85.0%) |
| 65 to 74 Years | 889 (96.7%) | 1,016 (87.0%) |
| 75 Years and over | 488 (94.0%) | 654 (84.7%) |
| Total | 5,418 (85.6%) | 6,191 (85.5%) |
Income Below Poverty Among Married-Couple Families in Auburn
The poverty statistics for married-couple families in Auburn show that 6.5% or 169 of the total 2,618 families live below the poverty line. Families with 3 or 4 children have the highest poverty rate of 23.3%, comprising of 28 families. On the other hand, families with 5 or more children have the lowest poverty rate of 0.0%, which includes 0 families.
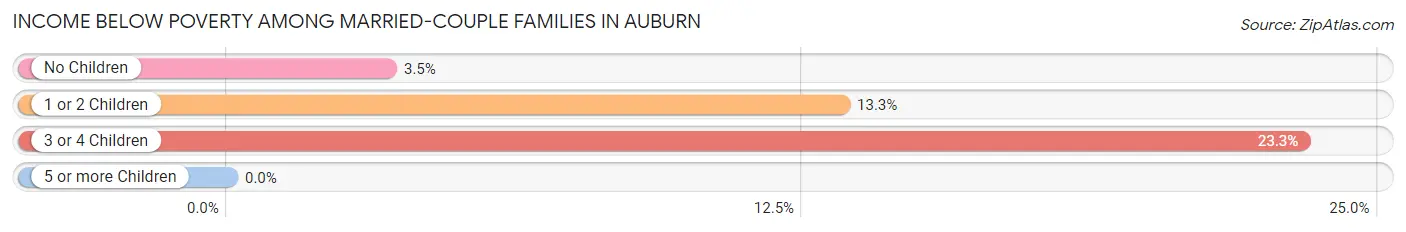
| Children | Above Poverty | Below Poverty |
| No Children | 1,841 (96.5%) | 66 (3.5%) |
| 1 or 2 Children | 488 (86.7%) | 75 (13.3%) |
| 3 or 4 Children | 92 (76.7%) | 28 (23.3%) |
| 5 or more Children | 28 (100.0%) | 0 (0.0%) |
| Total | 2,449 (93.5%) | 169 (6.5%) |
Income Below Poverty Among Single-Parent Households in Auburn
According to the poverty data in Auburn, 25.6% or 93 single-father households and 14.8% or 96 single-mother households are living below the poverty line. Among single-father households, those with no children have the highest poverty rate, with 77 households (52.4%) experiencing poverty. Likewise, among single-mother households, those with no children have the highest poverty rate, with 63 households (19.8%) falling below the poverty line.
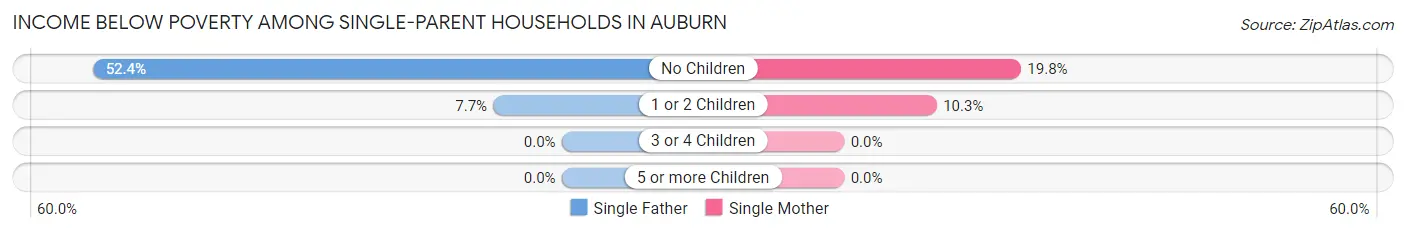
| Children | Single Father | Single Mother |
| No Children | 77 (52.4%) | 63 (19.8%) |
| 1 or 2 Children | 16 (7.7%) | 33 (10.3%) |
| 3 or 4 Children | 0 (0.0%) | 0 (0.0%) |
| 5 or more Children | 0 (0.0%) | 0 (0.0%) |
| Total | 93 (25.6%) | 96 (14.8%) |
Income Below Poverty Among Married-Couple vs Single-Parent Households in Auburn
The poverty data for Auburn shows that 169 of the married-couple family households (6.5%) and 189 of the single-parent households (18.6%) are living below the poverty level. Within the married-couple family households, those with 3 or 4 children have the highest poverty rate, with 28 households (23.3%) falling below the poverty line. Among the single-parent households, those with no children have the highest poverty rate, with 140 household (30.0%) living below poverty.
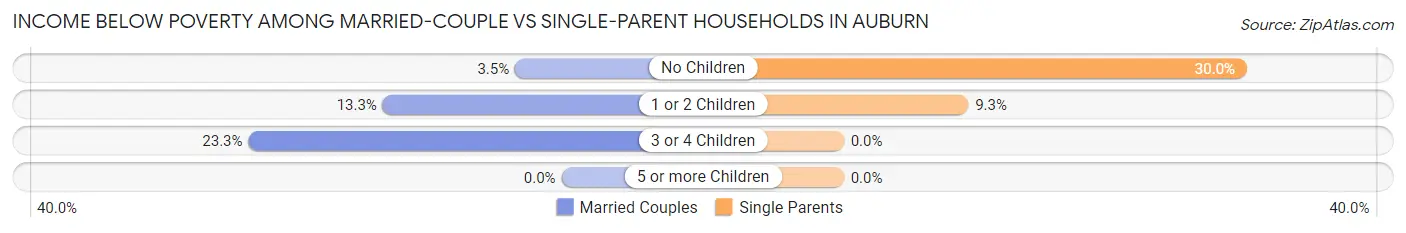
| Children | Married-Couple Families | Single-Parent Households |
| No Children | 66 (3.5%) | 140 (30.0%) |
| 1 or 2 Children | 75 (13.3%) | 49 (9.3%) |
| 3 or 4 Children | 28 (23.3%) | 0 (0.0%) |
| 5 or more Children | 0 (0.0%) | 0 (0.0%) |
| Total | 169 (6.5%) | 189 (18.6%) |
Race in Auburn
The most populous races in Auburn are White / Caucasian (11,578 | 84.1%), Hispanic or Latino (2,030 | 14.7%), and Two or more Races (1,514 | 11.0%).
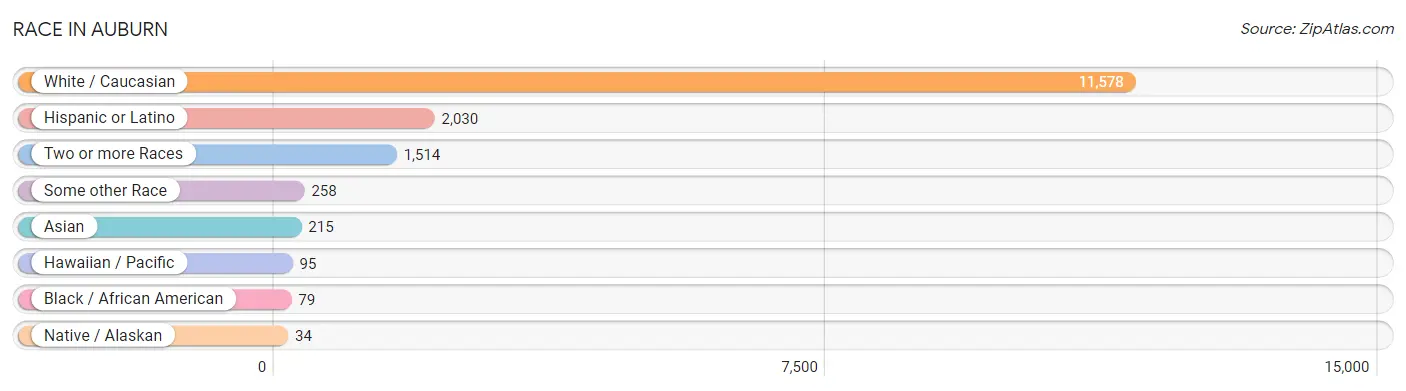
| Race | # Population | % Population |
| Asian | 215 | 1.6% |
| Black / African American | 79 | 0.6% |
| Hawaiian / Pacific | 95 | 0.7% |
| Hispanic or Latino | 2,030 | 14.7% |
| Native / Alaskan | 34 | 0.3% |
| White / Caucasian | 11,578 | 84.1% |
| Two or more Races | 1,514 | 11.0% |
| Some other Race | 258 | 1.9% |
| Total | 13,773 | 100.0% |
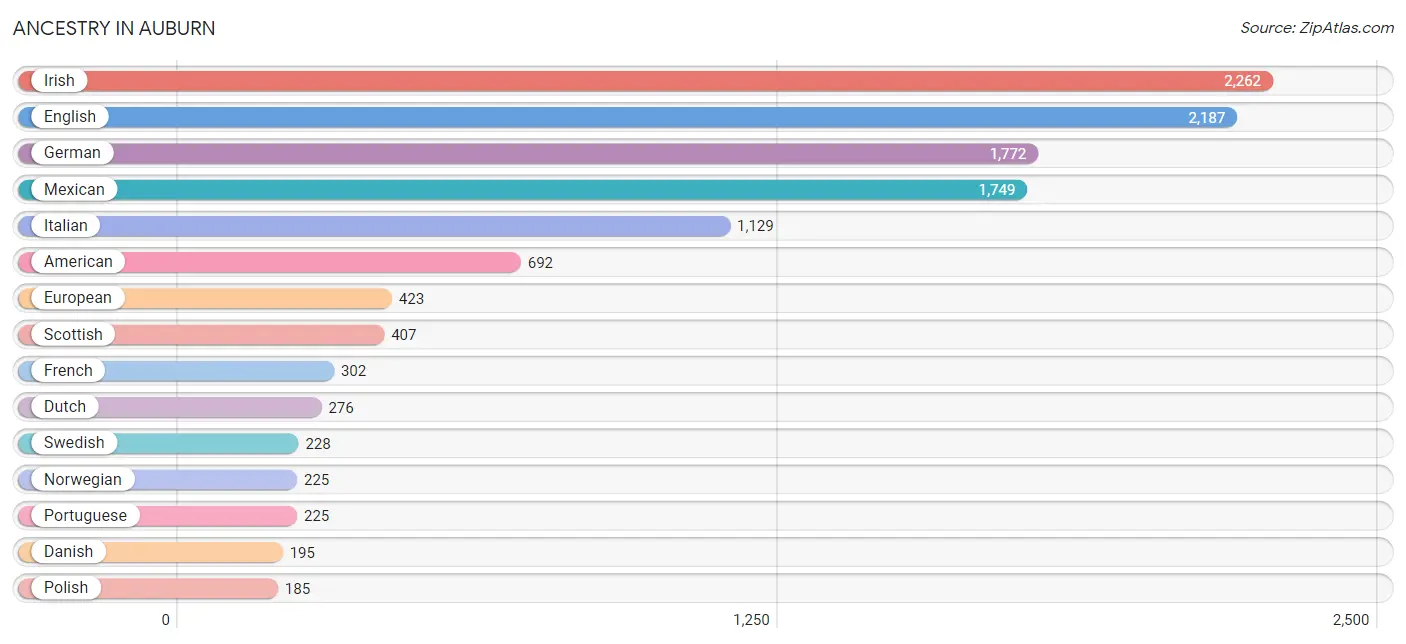
Ancestry in Auburn
The most populous ancestries reported in Auburn are Irish (2,262 | 16.4%), English (2,187 | 15.9%), German (1,772 | 12.9%), Mexican (1,749 | 12.7%), and Italian (1,129 | 8.2%), together accounting for 66.1% of all Auburn residents.
| Ancestry | # Population | % Population |
| African | 9 | 0.1% |
| Alsatian | 8 | 0.1% |
| American | 692 | 5.0% |
| Argentinean | 17 | 0.1% |
| Armenian | 15 | 0.1% |
| Austrian | 7 | 0.1% |
| Belgian | 17 | 0.1% |
| Bhutanese | 88 | 0.6% |
| British | 155 | 1.1% |
| Canadian | 106 | 0.8% |
| Central American | 17 | 0.1% |
| Cherokee | 83 | 0.6% |
| Chickasaw | 9 | 0.1% |
| Choctaw | 27 | 0.2% |
| Colombian | 4 | 0.0% |
| Costa Rican | 9 | 0.1% |
| Cree | 21 | 0.2% |
| Croatian | 33 | 0.2% |
| Czech | 52 | 0.4% |
| Czechoslovakian | 7 | 0.1% |
| Danish | 195 | 1.4% |
| Dutch | 276 | 2.0% |
| Eastern European | 111 | 0.8% |
| Ecuadorian | 7 | 0.1% |
| English | 2,187 | 15.9% |
| European | 423 | 3.1% |
| Filipino | 2 | 0.0% |
| Finnish | 57 | 0.4% |
| French | 302 | 2.2% |
| French Canadian | 20 | 0.2% |
| German | 1,772 | 12.9% |
| Greek | 38 | 0.3% |
| Hungarian | 9 | 0.1% |
| Indian (Asian) | 93 | 0.7% |
| Inupiat | 9 | 0.1% |
| Iranian | 39 | 0.3% |
| Irish | 2,262 | 16.4% |
| Italian | 1,129 | 8.2% |
| Japanese | 9 | 0.1% |
| Korean | 114 | 0.8% |
| Lithuanian | 46 | 0.3% |
| Mexican | 1,749 | 12.7% |
| Native Hawaiian | 25 | 0.2% |
| Nicaraguan | 8 | 0.1% |
| Northern European | 47 | 0.3% |
| Norwegian | 225 | 1.6% |
| Okinawan | 76 | 0.5% |
| Pennsylvania German | 37 | 0.3% |
| Peruvian | 20 | 0.2% |
| Polish | 185 | 1.3% |
| Portuguese | 225 | 1.6% |
| Puerto Rican | 89 | 0.6% |
| Russian | 91 | 0.7% |
| Samoan | 11 | 0.1% |
| Scandinavian | 67 | 0.5% |
| Scotch-Irish | 152 | 1.1% |
| Scottish | 407 | 3.0% |
| Slovak | 11 | 0.1% |
| South American | 48 | 0.4% |
| South American Indian | 12 | 0.1% |
| Spaniard | 69 | 0.5% |
| Spanish | 6 | 0.0% |
| Sri Lankan | 21 | 0.2% |
| Subsaharan African | 18 | 0.1% |
| Swedish | 228 | 1.7% |
| Swiss | 70 | 0.5% |
| Thai | 14 | 0.1% |
| Turkish | 6 | 0.0% |
| Ukrainian | 50 | 0.4% |
| Welsh | 129 | 0.9% |
| Yugoslavian | 31 | 0.2% | View All 71 Rows |
Immigrants in Auburn
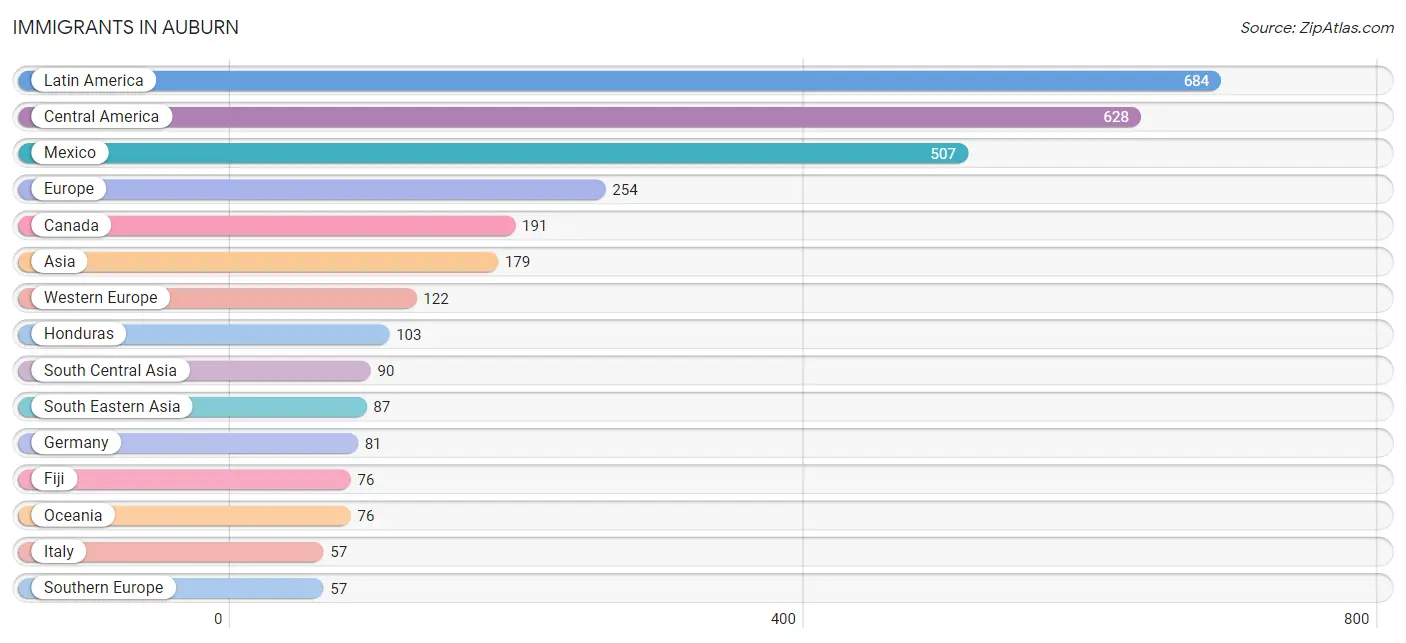
The most numerous immigrant groups reported in Auburn came from Latin America (684 | 5.0%), Central America (628 | 4.6%), Mexico (507 | 3.7%), Europe (254 | 1.8%), and Canada (191 | 1.4%), together accounting for 16.4% of all Auburn residents.
| Immigration Origin | # Population | % Population |
| Africa | 9 | 0.1% |
| Argentina | 17 | 0.1% |
| Asia | 179 | 1.3% |
| Austria | 7 | 0.1% |
| Canada | 191 | 1.4% |
| Central America | 628 | 4.6% |
| Chile | 11 | 0.1% |
| China | 2 | 0.0% |
| Colombia | 4 | 0.0% |
| Eastern Africa | 9 | 0.1% |
| Eastern Asia | 2 | 0.0% |
| Eastern Europe | 16 | 0.1% |
| Ecuador | 4 | 0.0% |
| El Salvador | 18 | 0.1% |
| England | 23 | 0.2% |
| Europe | 254 | 1.8% |
| Fiji | 76 | 0.5% |
| Germany | 81 | 0.6% |
| Honduras | 103 | 0.7% |
| Hungary | 6 | 0.0% |
| Iran | 39 | 0.3% |
| Italy | 57 | 0.4% |
| Latin America | 684 | 5.0% |
| Lithuania | 10 | 0.1% |
| Mexico | 507 | 3.7% |
| Netherlands | 34 | 0.3% |
| Northern Europe | 46 | 0.3% |
| Oceania | 76 | 0.5% |
| Pakistan | 14 | 0.1% |
| Peru | 20 | 0.2% |
| Philippines | 36 | 0.3% |
| Singapore | 37 | 0.3% |
| Somalia | 9 | 0.1% |
| South America | 56 | 0.4% |
| South Central Asia | 90 | 0.6% |
| South Eastern Asia | 87 | 0.6% |
| Southern Europe | 57 | 0.4% |
| Sri Lanka | 31 | 0.2% |
| Taiwan | 2 | 0.0% |
| Uzbekistan | 6 | 0.0% |
| Vietnam | 14 | 0.1% |
| Western Europe | 122 | 0.9% | View All 42 Rows |
Sex and Age in Auburn
Sex and Age in Auburn
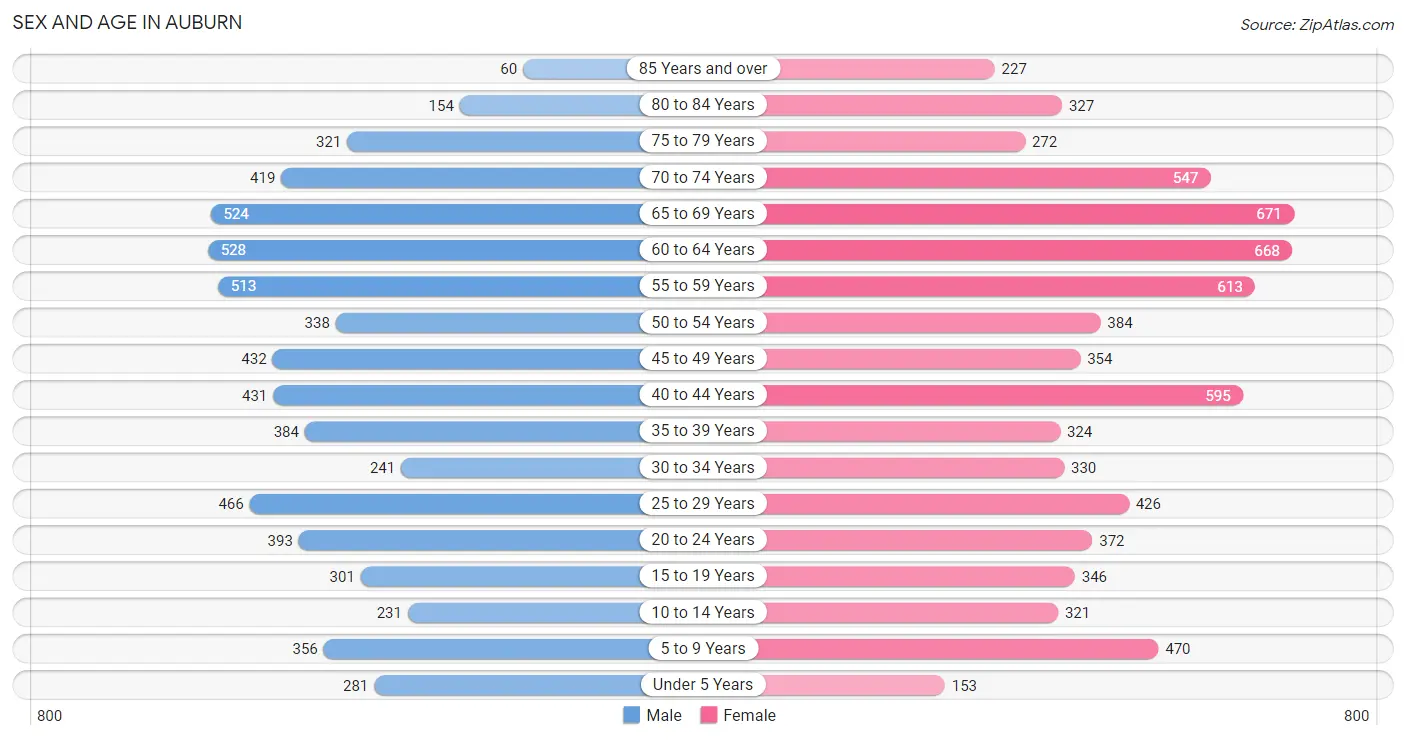
The most populous age groups in Auburn are 60 to 64 Years (528 | 8.3%) for men and 65 to 69 Years (671 | 9.1%) for women.
| Age Bracket | Male | Female |
| Under 5 Years | 281 (4.4%) | 153 (2.1%) |
| 5 to 9 Years | 356 (5.6%) | 470 (6.4%) |
| 10 to 14 Years | 231 (3.6%) | 321 (4.3%) |
| 15 to 19 Years | 301 (4.7%) | 346 (4.7%) |
| 20 to 24 Years | 393 (6.2%) | 372 (5.0%) |
| 25 to 29 Years | 466 (7.3%) | 426 (5.8%) |
| 30 to 34 Years | 241 (3.8%) | 330 (4.5%) |
| 35 to 39 Years | 384 (6.0%) | 324 (4.4%) |
| 40 to 44 Years | 431 (6.8%) | 595 (8.0%) |
| 45 to 49 Years | 432 (6.8%) | 354 (4.8%) |
| 50 to 54 Years | 338 (5.3%) | 384 (5.2%) |
| 55 to 59 Years | 513 (8.1%) | 613 (8.3%) |
| 60 to 64 Years | 528 (8.3%) | 668 (9.0%) |
| 65 to 69 Years | 524 (8.2%) | 671 (9.1%) |
| 70 to 74 Years | 419 (6.6%) | 547 (7.4%) |
| 75 to 79 Years | 321 (5.0%) | 272 (3.7%) |
| 80 to 84 Years | 154 (2.4%) | 327 (4.4%) |
| 85 Years and over | 60 (0.9%) | 227 (3.1%) |
| Total | 6,373 (100.0%) | 7,400 (100.0%) |
Families and Households in Auburn
Median Family Size in Auburn
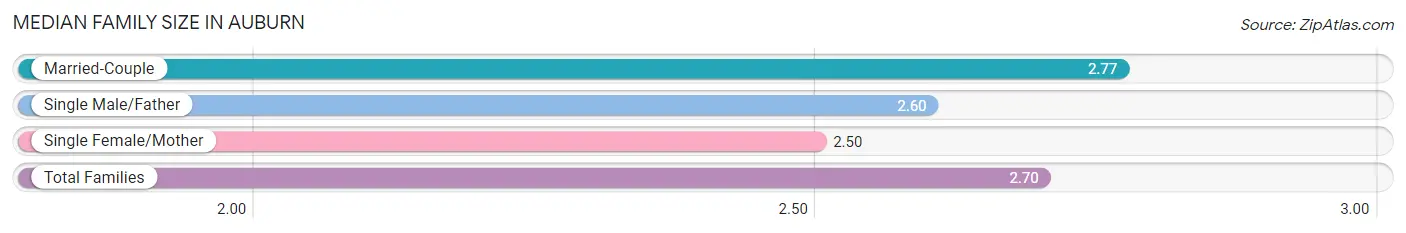
The median family size in Auburn is 2.70 persons per family, with married-couple families (2,618 | 72.1%) accounting for the largest median family size of 2.77 persons per family. On the other hand, single female/mother families (650 | 17.9%) represent the smallest median family size with 2.50 persons per family.
| Family Type | # Families | Family Size |
| Married-Couple | 2,618 (72.1%) | 2.77 |
| Single Male/Father | 364 (10.0%) | 2.60 |
| Single Female/Mother | 650 (17.9%) | 2.50 |
| Total Families | 3,632 (100.0%) | 2.70 |
Median Household Size in Auburn
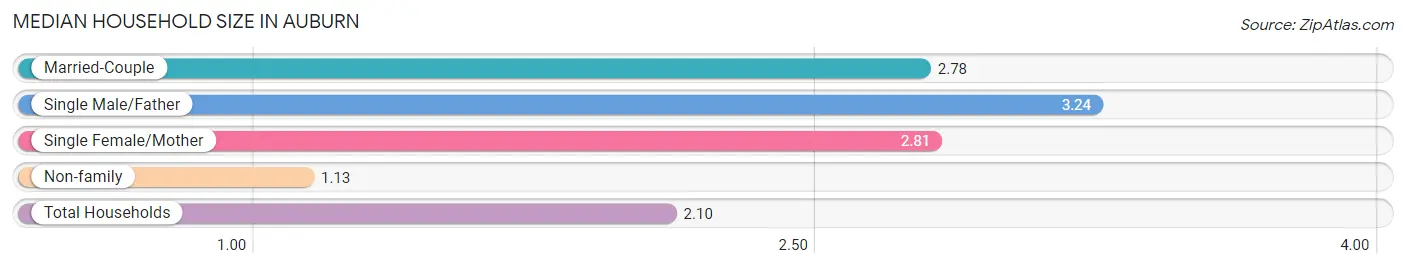
The median household size in Auburn is 2.10 persons per household, with single male/father households (364 | 5.8%) accounting for the largest median household size of 3.24 persons per household. non-family households (2,696 | 42.6%) represent the smallest median household size with 1.13 persons per household.
| Household Type | # Households | Household Size |
| Married-Couple | 2,618 (41.4%) | 2.78 |
| Single Male/Father | 364 (5.8%) | 3.24 |
| Single Female/Mother | 650 (10.3%) | 2.81 |
| Non-family | 2,696 (42.6%) | 1.13 |
| Total Households | 6,328 (100.0%) | 2.10 |
Household Size by Marriage Status in Auburn
Out of a total of 6,328 households in Auburn, 3,632 (57.4%) are family households, while 2,696 (42.6%) are nonfamily households. The most numerous type of family households are 2-person households, comprising 2,137, and the most common type of nonfamily households are 1-person households, comprising 2,459.
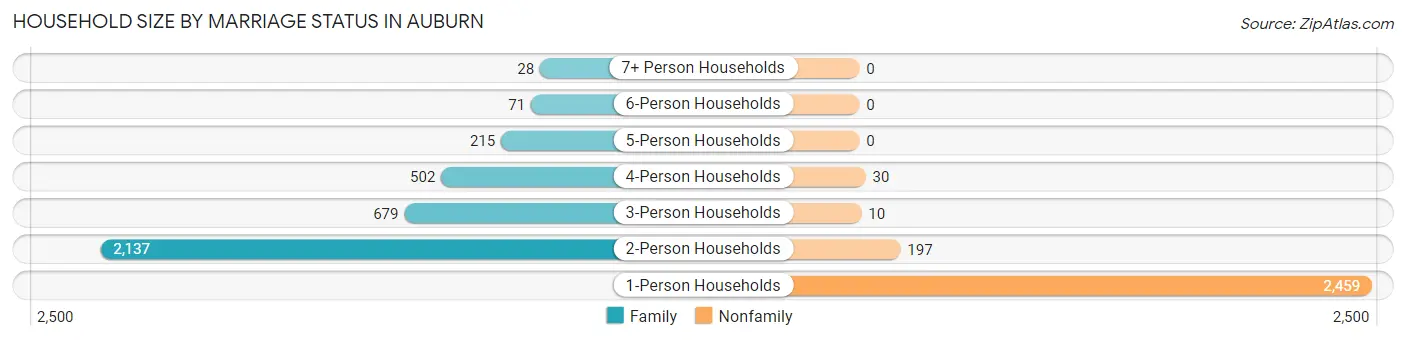
| Household Size | Family Households | Nonfamily Households |
| 1-Person Households | - | 2,459 (38.9%) |
| 2-Person Households | 2,137 (33.8%) | 197 (3.1%) |
| 3-Person Households | 679 (10.7%) | 10 (0.2%) |
| 4-Person Households | 502 (7.9%) | 30 (0.5%) |
| 5-Person Households | 215 (3.4%) | 0 (0.0%) |
| 6-Person Households | 71 (1.1%) | 0 (0.0%) |
| 7+ Person Households | 28 (0.4%) | 0 (0.0%) |
| Total | 3,632 (57.4%) | 2,696 (42.6%) |
Female Fertility in Auburn
Fertility by Age in Auburn
Average fertility rate in Auburn is 42.0 births per 1,000 women. Women in the age bracket of 20 to 34 years have the highest fertility rate with 105.0 births per 1,000 women. Women in the age bracket of 20 to 34 years acount for 100.0% of all women with births.
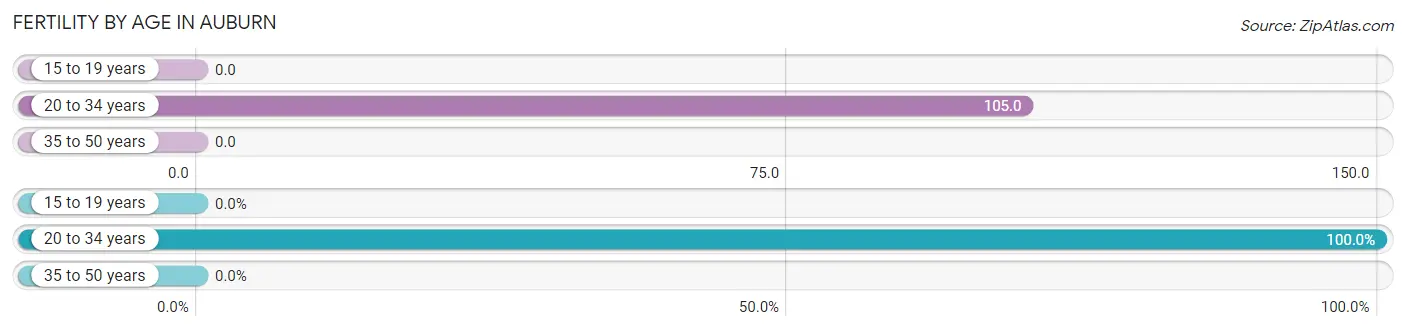
| Age Bracket | Women with Births | Births / 1,000 Women |
| 15 to 19 years | 0 (0.0%) | 0.0 |
| 20 to 34 years | 118 (100.0%) | 105.0 |
| 35 to 50 years | 0 (0.0%) | 0.0 |
| Total | 118 (100.0%) | 42.0 |
Fertility by Age by Marriage Status in Auburn
38.1% of women with births (118) in Auburn are married. The highest percentage of unmarried women with births falls into 20 to 34 years age bracket with 61.9% of them unmarried at the time of birth, while the lowest percentage of unmarried women with births belong to 20 to 34 years age bracket with 61.9% of them unmarried.
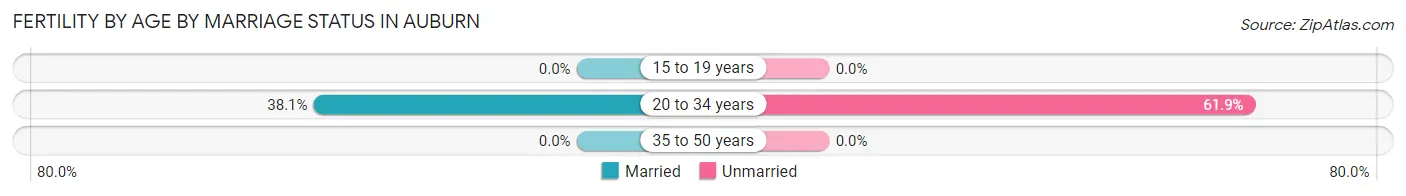
| Age Bracket | Married | Unmarried |
| 15 to 19 years | 0 (0.0%) | 0 (0.0%) |
| 20 to 34 years | 45 (38.1%) | 73 (61.9%) |
| 35 to 50 years | 0 (0.0%) | 0 (0.0%) |
| Total | 45 (38.1%) | 73 (61.9%) |
Fertility by Education in Auburn
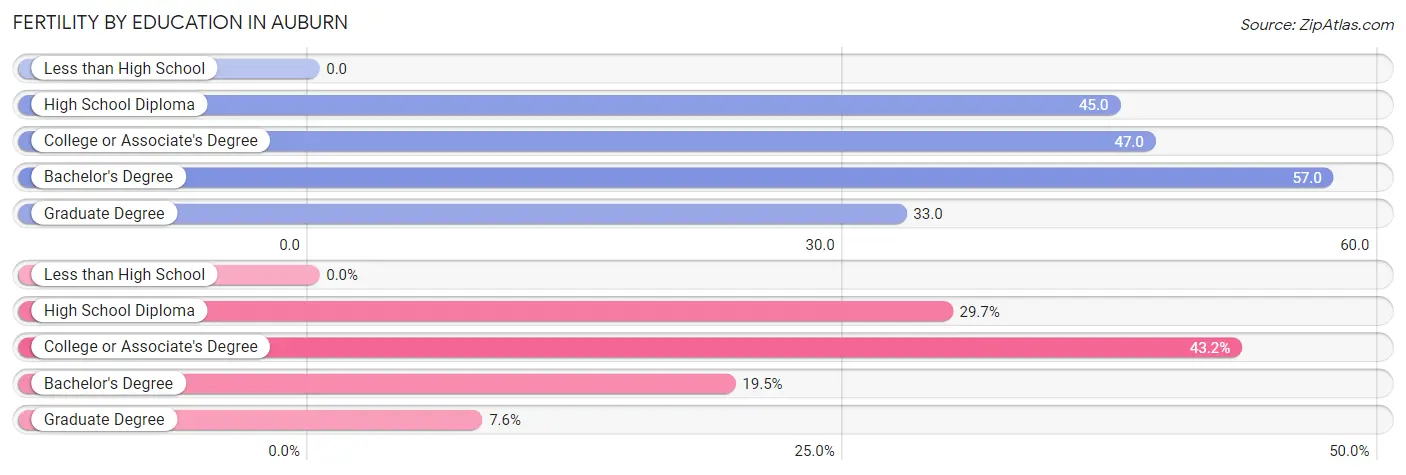
| Educational Attainment | Women with Births | Births / 1,000 Women |
| Less than High School | 0 (0.0%) | 0.0 |
| High School Diploma | 35 (29.7%) | 45.0 |
| College or Associate's Degree | 51 (43.2%) | 47.0 |
| Bachelor's Degree | 23 (19.5%) | 57.0 |
| Graduate Degree | 9 (7.6%) | 33.0 |
| Total | 118 (100.0%) | 42.0 |
Fertility by Education by Marriage Status in Auburn
61.9% of women with births in Auburn are unmarried. Women with the educational attainment of bachelor's degree are most likely to be married with 100.0% of them married at childbirth, while women with the educational attainment of high school diploma are least likely to be married with 97.1% of them unmarried at childbirth.
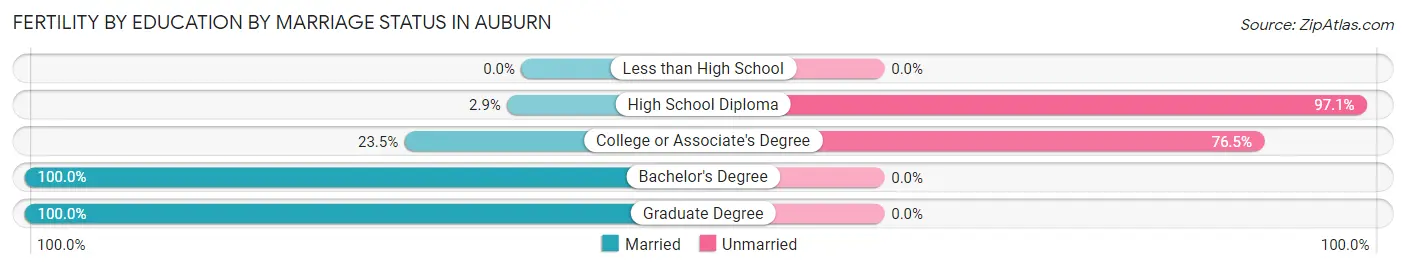
| Educational Attainment | Married | Unmarried |
| Less than High School | 0 (0.0%) | 0 (0.0%) |
| High School Diploma | 1 (2.9%) | 34 (97.1%) |
| College or Associate's Degree | 12 (23.5%) | 39 (76.5%) |
| Bachelor's Degree | 23 (100.0%) | 0 (0.0%) |
| Graduate Degree | 9 (100.0%) | 0 (0.0%) |
| Total | 45 (38.1%) | 73 (61.9%) |
Employment Characteristics in Auburn
Employment by Class of Employer in Auburn
Among the 6,153 employed individuals in Auburn, private company employees (3,880 | 63.1%), self-employed (not incorporated) (556 | 9.0%), and local government employees (503 | 8.2%) make up the most common classes of employment.
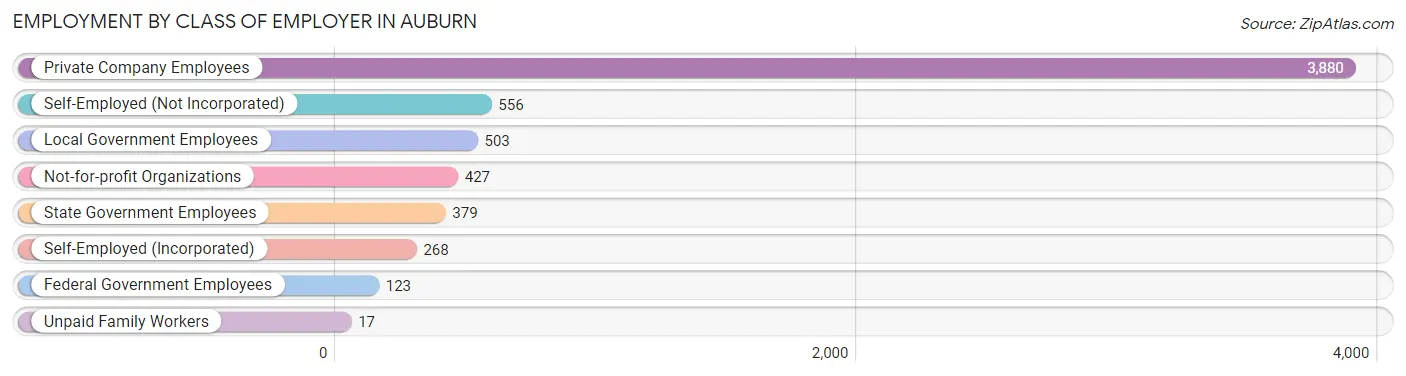
| Employer Class | # Employees | % Employees |
| Private Company Employees | 3,880 | 63.1% |
| Self-Employed (Incorporated) | 268 | 4.4% |
| Self-Employed (Not Incorporated) | 556 | 9.0% |
| Not-for-profit Organizations | 427 | 6.9% |
| Local Government Employees | 503 | 8.2% |
| State Government Employees | 379 | 6.2% |
| Federal Government Employees | 123 | 2.0% |
| Unpaid Family Workers | 17 | 0.3% |
| Total | 6,153 | 100.0% |
Employment Status by Age in Auburn
According to the labor force statistics for Auburn, out of the total population over 16 years of age (11,871), 54.3% or 6,446 individuals are in the labor force, with 2.9% or 187 of them unemployed. The age group with the highest labor force participation rate is 45 to 54 years, with 85.5% or 1,289 individuals in the labor force. Within the labor force, the 30 to 34 years age range has the highest percentage of unemployed individuals, with 8.7% or 38 of them being unemployed.
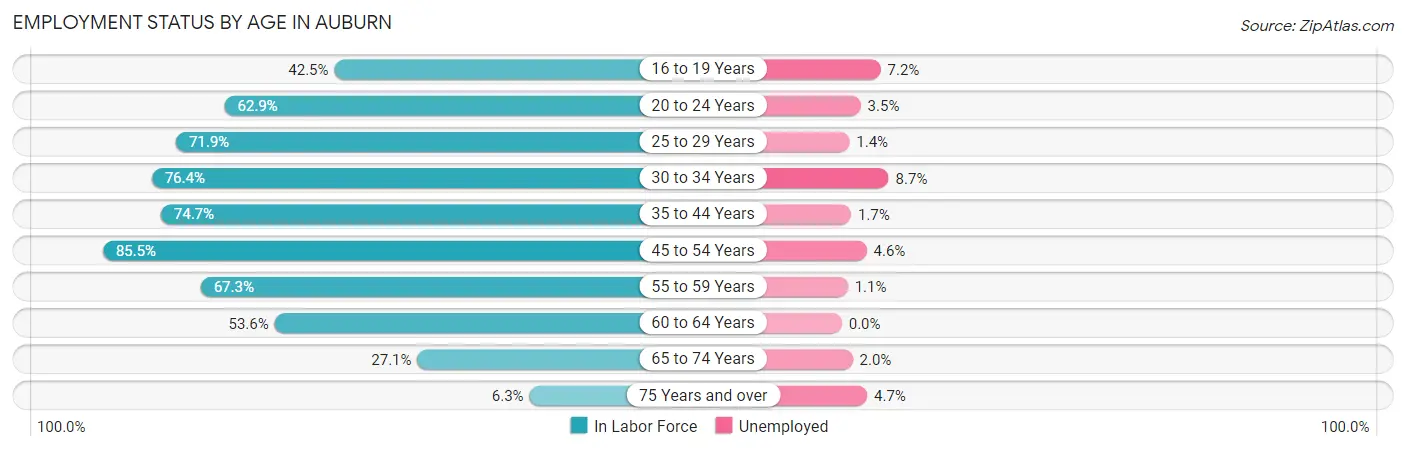
| Age Bracket | In Labor Force | Unemployed |
| 16 to 19 Years | 237 (42.5%) | 17 (7.2%) |
| 20 to 24 Years | 481 (62.9%) | 17 (3.5%) |
| 25 to 29 Years | 641 (71.9%) | 9 (1.4%) |
| 30 to 34 Years | 436 (76.4%) | 38 (8.7%) |
| 35 to 44 Years | 1,295 (74.7%) | 22 (1.7%) |
| 45 to 54 Years | 1,289 (85.5%) | 59 (4.6%) |
| 55 to 59 Years | 758 (67.3%) | 8 (1.1%) |
| 60 to 64 Years | 641 (53.6%) | 0 (0.0%) |
| 65 to 74 Years | 586 (27.1%) | 12 (2.0%) |
| 75 Years and over | 86 (6.3%) | 4 (4.7%) |
| Total | 6,446 (54.3%) | 187 (2.9%) |
Employment Status by Educational Attainment in Auburn
According to labor force statistics for Auburn, 72.0% of individuals (5,059) out of the total population between 25 and 64 years of age (7,027) are in the labor force, with 2.7% or 137 of them being unemployed. The group with the highest labor force participation rate are those with the educational attainment of bachelor's degree or higher, with 78.2% or 1,975 individuals in the labor force. Within the labor force, individuals with less than high school education have the highest percentage of unemployment, with 6.8% or 25 of them being unemployed.
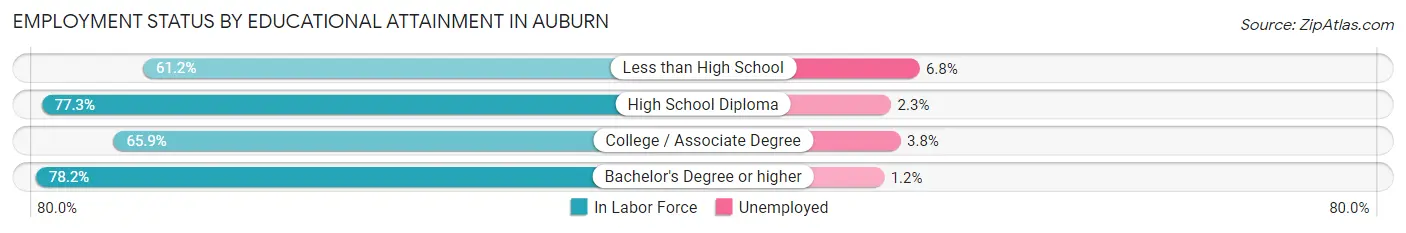
| Educational Attainment | In Labor Force | Unemployed |
| Less than High School | 369 (61.2%) | 41 (6.8%) |
| High School Diploma | 993 (77.3%) | 30 (2.3%) |
| College / Associate Degree | 1,723 (65.9%) | 99 (3.8%) |
| Bachelor's Degree or higher | 1,975 (78.2%) | 30 (1.2%) |
| Total | 5,059 (72.0%) | 190 (2.7%) |
Employment Occupations by Sex in Auburn
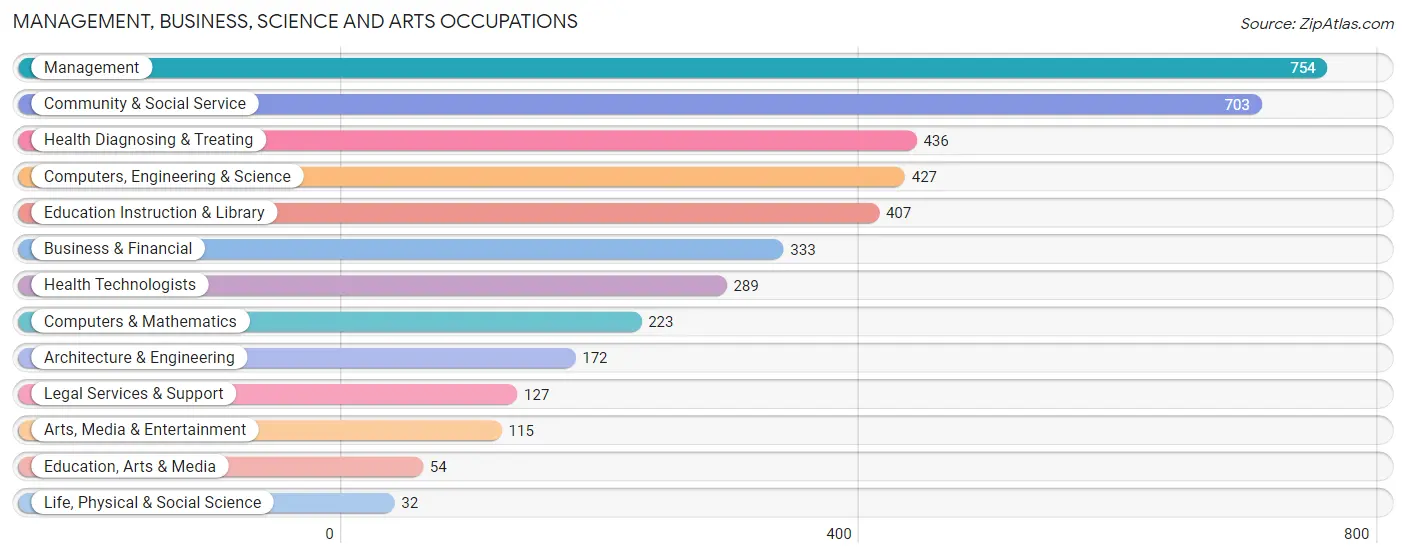
Management, Business, Science and Arts Occupations
The most common Management, Business, Science and Arts occupations in Auburn are Management (754 | 12.0%), Community & Social Service (703 | 11.2%), Health Diagnosing & Treating (436 | 7.0%), Computers, Engineering & Science (427 | 6.8%), and Education Instruction & Library (407 | 6.5%).
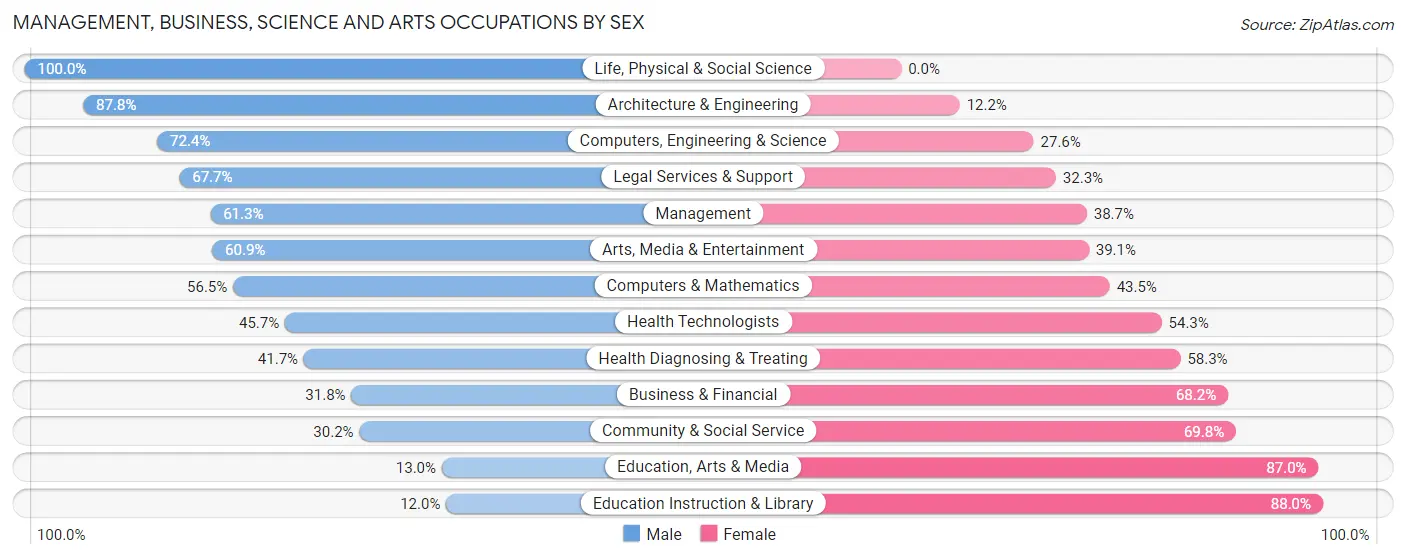
Management, Business, Science and Arts Occupations by Sex
Within the Management, Business, Science and Arts occupations in Auburn, the most male-oriented occupations are Life, Physical & Social Science (100.0%), Architecture & Engineering (87.8%), and Computers, Engineering & Science (72.4%), while the most female-oriented occupations are Education Instruction & Library (88.0%), Education, Arts & Media (87.0%), and Community & Social Service (69.8%).
| Occupation | Male | Female |
| Management | 462 (61.3%) | 292 (38.7%) |
| Business & Financial | 106 (31.8%) | 227 (68.2%) |
| Computers, Engineering & Science | 309 (72.4%) | 118 (27.6%) |
| Computers & Mathematics | 126 (56.5%) | 97 (43.5%) |
| Architecture & Engineering | 151 (87.8%) | 21 (12.2%) |
| Life, Physical & Social Science | 32 (100.0%) | 0 (0.0%) |
| Community & Social Service | 212 (30.2%) | 491 (69.8%) |
| Education, Arts & Media | 7 (13.0%) | 47 (87.0%) |
| Legal Services & Support | 86 (67.7%) | 41 (32.3%) |
| Education Instruction & Library | 49 (12.0%) | 358 (88.0%) |
| Arts, Media & Entertainment | 70 (60.9%) | 45 (39.1%) |
| Health Diagnosing & Treating | 182 (41.7%) | 254 (58.3%) |
| Health Technologists | 132 (45.7%) | 157 (54.3%) |
| Total (Category) | 1,271 (47.9%) | 1,382 (52.1%) |
| Total (Overall) | 3,122 (49.8%) | 3,143 (50.2%) |
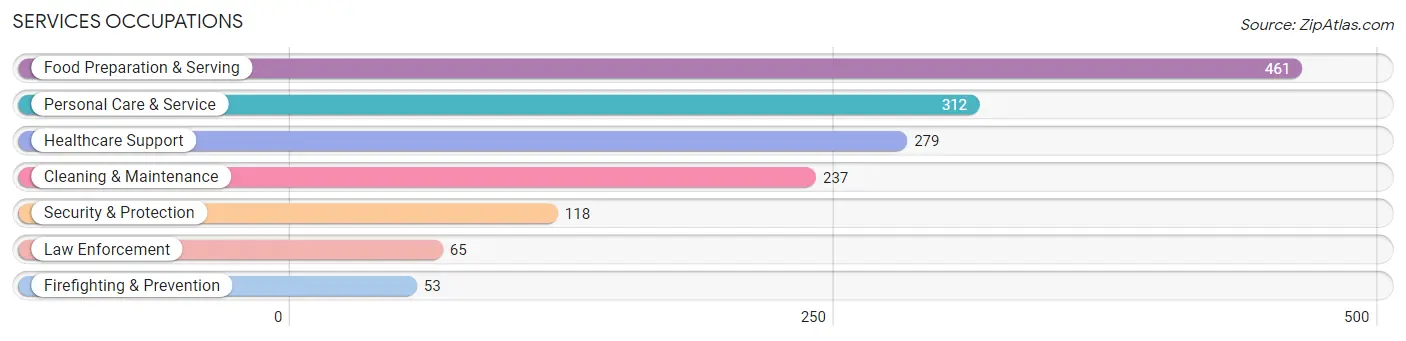
Services Occupations
The most common Services occupations in Auburn are Food Preparation & Serving (461 | 7.4%), Personal Care & Service (312 | 5.0%), Healthcare Support (279 | 4.4%), Cleaning & Maintenance (237 | 3.8%), and Security & Protection (118 | 1.9%).
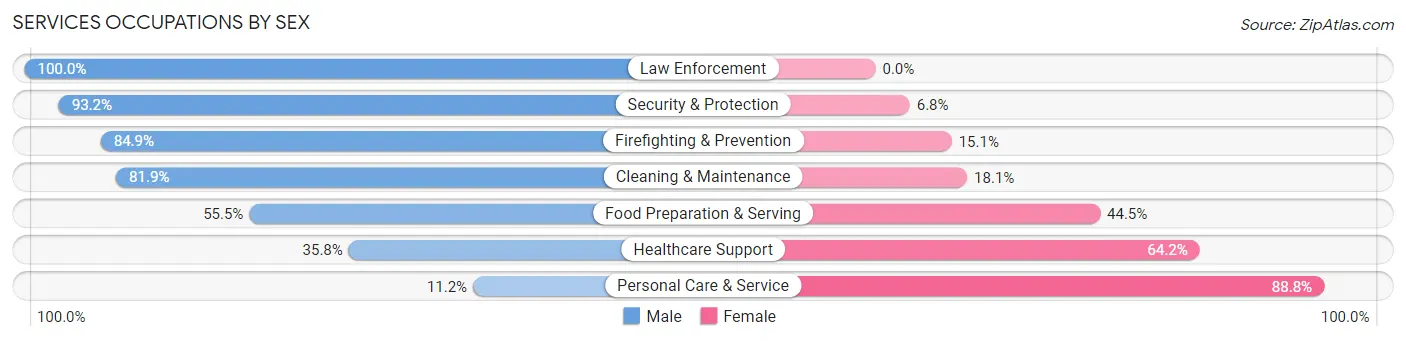
Services Occupations by Sex
Within the Services occupations in Auburn, the most male-oriented occupations are Law Enforcement (100.0%), Security & Protection (93.2%), and Firefighting & Prevention (84.9%), while the most female-oriented occupations are Personal Care & Service (88.8%), Healthcare Support (64.2%), and Food Preparation & Serving (44.5%).
| Occupation | Male | Female |
| Healthcare Support | 100 (35.8%) | 179 (64.2%) |
| Security & Protection | 110 (93.2%) | 8 (6.8%) |
| Firefighting & Prevention | 45 (84.9%) | 8 (15.1%) |
| Law Enforcement | 65 (100.0%) | 0 (0.0%) |
| Food Preparation & Serving | 256 (55.5%) | 205 (44.5%) |
| Cleaning & Maintenance | 194 (81.9%) | 43 (18.1%) |
| Personal Care & Service | 35 (11.2%) | 277 (88.8%) |
| Total (Category) | 695 (49.4%) | 712 (50.6%) |
| Total (Overall) | 3,122 (49.8%) | 3,143 (50.2%) |
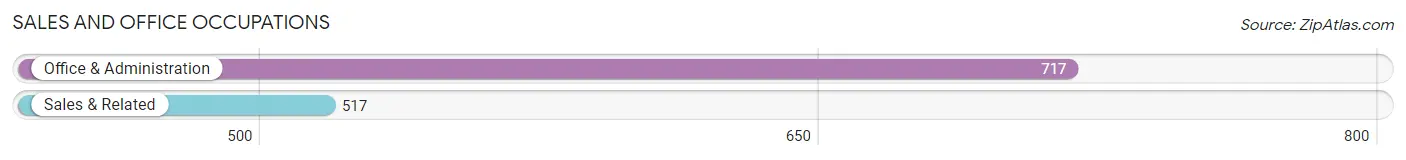
Sales and Office Occupations
The most common Sales and Office occupations in Auburn are Office & Administration (717 | 11.4%), and Sales & Related (517 | 8.3%).
Sales and Office Occupations by Sex
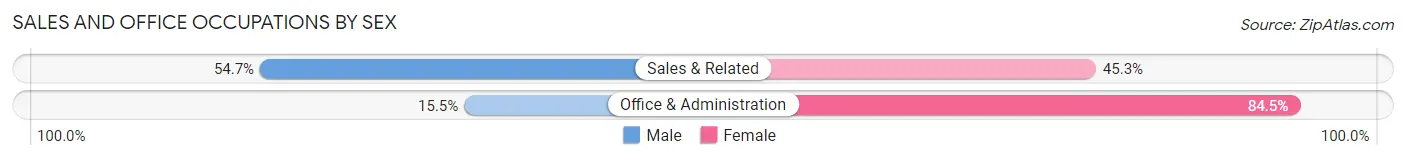
| Occupation | Male | Female |
| Sales & Related | 283 (54.7%) | 234 (45.3%) |
| Office & Administration | 111 (15.5%) | 606 (84.5%) |
| Total (Category) | 394 (31.9%) | 840 (68.1%) |
| Total (Overall) | 3,122 (49.8%) | 3,143 (50.2%) |
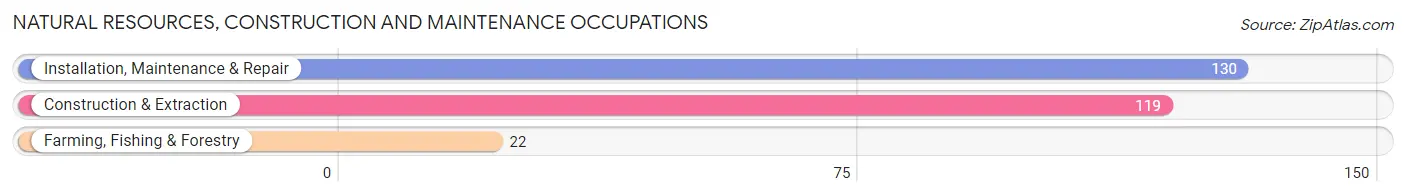
Natural Resources, Construction and Maintenance Occupations
The most common Natural Resources, Construction and Maintenance occupations in Auburn are Installation, Maintenance & Repair (130 | 2.1%), Construction & Extraction (119 | 1.9%), and Farming, Fishing & Forestry (22 | 0.4%).
Natural Resources, Construction and Maintenance Occupations by Sex
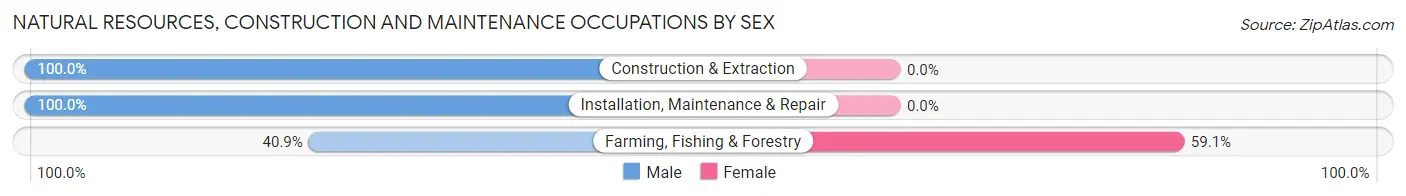
| Occupation | Male | Female |
| Farming, Fishing & Forestry | 9 (40.9%) | 13 (59.1%) |
| Construction & Extraction | 119 (100.0%) | 0 (0.0%) |
| Installation, Maintenance & Repair | 130 (100.0%) | 0 (0.0%) |
| Total (Category) | 258 (95.2%) | 13 (4.8%) |
| Total (Overall) | 3,122 (49.8%) | 3,143 (50.2%) |
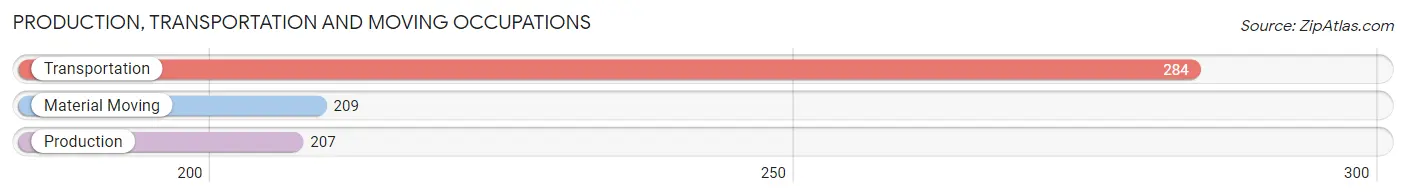
Production, Transportation and Moving Occupations
The most common Production, Transportation and Moving occupations in Auburn are Transportation (284 | 4.5%), Material Moving (209 | 3.3%), and Production (207 | 3.3%).
Production, Transportation and Moving Occupations by Sex
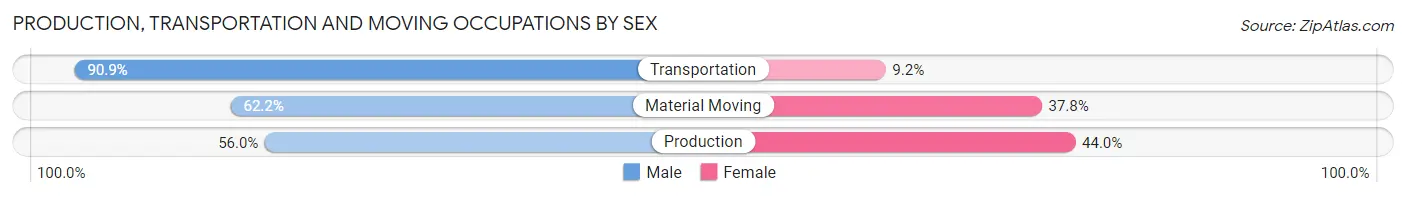
| Occupation | Male | Female |
| Production | 116 (56.0%) | 91 (44.0%) |
| Transportation | 258 (90.8%) | 26 (9.1%) |
| Material Moving | 130 (62.2%) | 79 (37.8%) |
| Total (Category) | 504 (72.0%) | 196 (28.0%) |
| Total (Overall) | 3,122 (49.8%) | 3,143 (50.2%) |
Employment Industries by Sex in Auburn
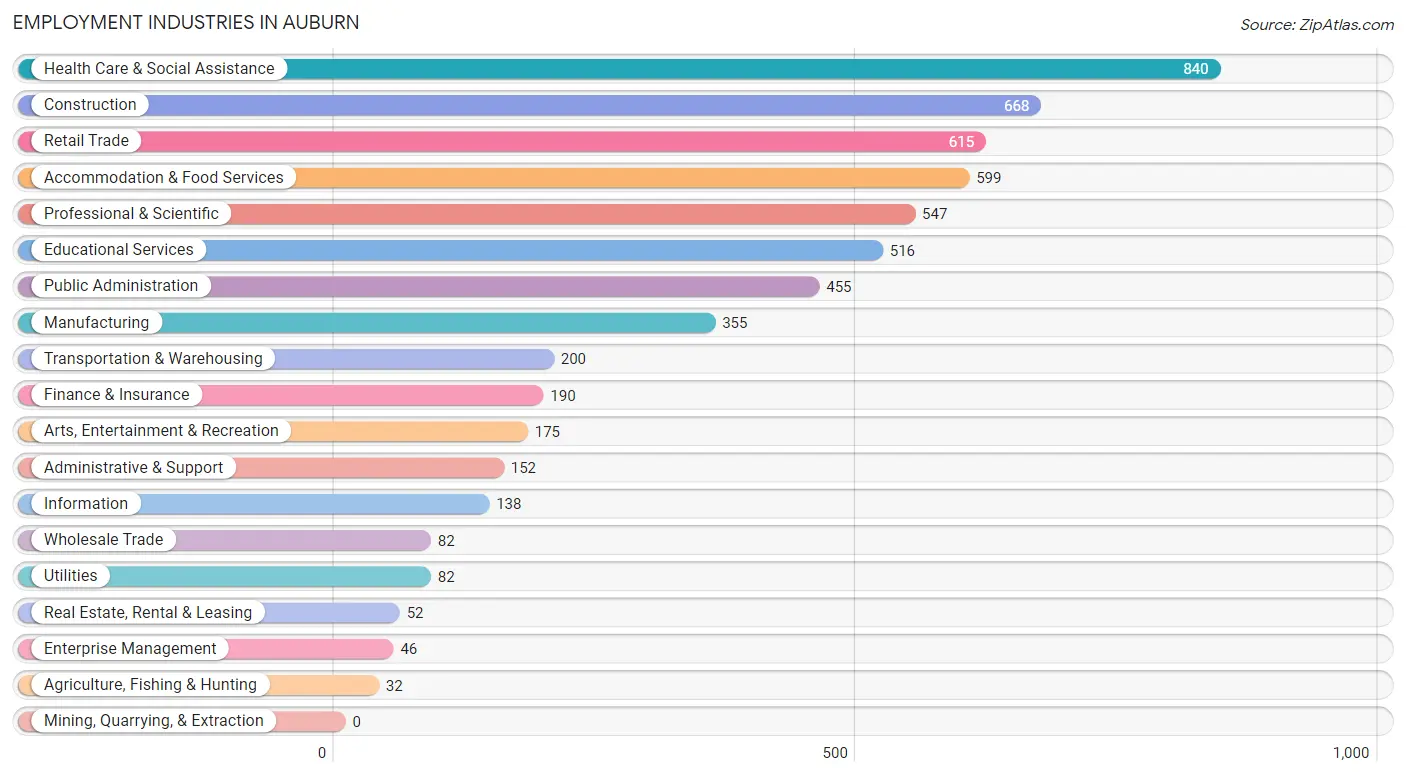
Employment Industries in Auburn
The major employment industries in Auburn include Health Care & Social Assistance (840 | 13.4%), Construction (668 | 10.7%), Retail Trade (615 | 9.8%), Accommodation & Food Services (599 | 9.6%), and Professional & Scientific (547 | 8.7%).
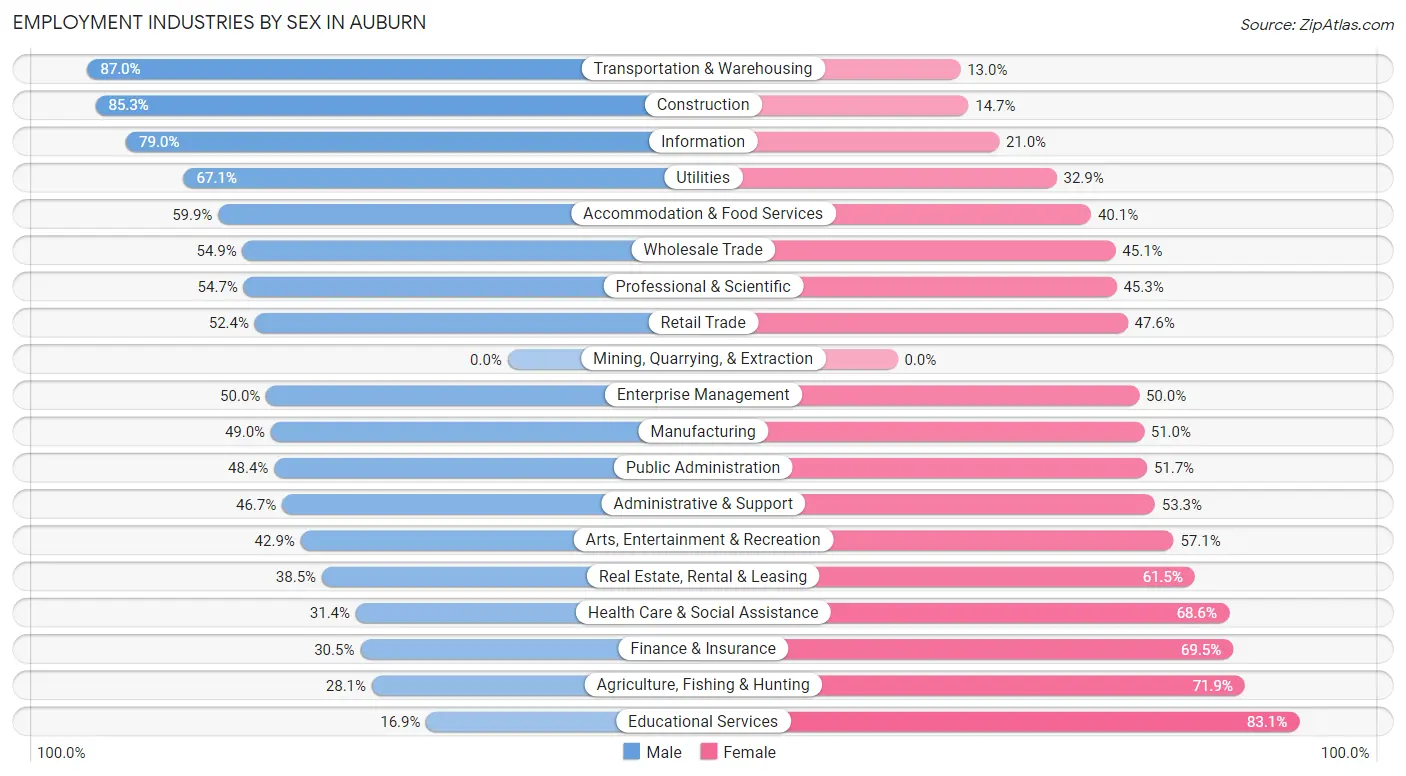
Employment Industries by Sex in Auburn
The Auburn industries that see more men than women are Transportation & Warehousing (87.0%), Construction (85.3%), and Information (79.0%), whereas the industries that tend to have a higher number of women are Educational Services (83.1%), Agriculture, Fishing & Hunting (71.9%), and Finance & Insurance (69.5%).
| Industry | Male | Female |
| Agriculture, Fishing & Hunting | 9 (28.1%) | 23 (71.9%) |
| Mining, Quarrying, & Extraction | 0 (0.0%) | 0 (0.0%) |
| Construction | 570 (85.3%) | 98 (14.7%) |
| Manufacturing | 174 (49.0%) | 181 (51.0%) |
| Wholesale Trade | 45 (54.9%) | 37 (45.1%) |
| Retail Trade | 322 (52.4%) | 293 (47.6%) |
| Transportation & Warehousing | 174 (87.0%) | 26 (13.0%) |
| Utilities | 55 (67.1%) | 27 (32.9%) |
| Information | 109 (79.0%) | 29 (21.0%) |
| Finance & Insurance | 58 (30.5%) | 132 (69.5%) |
| Real Estate, Rental & Leasing | 20 (38.5%) | 32 (61.5%) |
| Professional & Scientific | 299 (54.7%) | 248 (45.3%) |
| Enterprise Management | 23 (50.0%) | 23 (50.0%) |
| Administrative & Support | 71 (46.7%) | 81 (53.3%) |
| Educational Services | 87 (16.9%) | 429 (83.1%) |
| Health Care & Social Assistance | 264 (31.4%) | 576 (68.6%) |
| Arts, Entertainment & Recreation | 75 (42.9%) | 100 (57.1%) |
| Accommodation & Food Services | 359 (59.9%) | 240 (40.1%) |
| Public Administration | 220 (48.3%) | 235 (51.6%) |
| Total | 3,122 (49.8%) | 3,143 (50.2%) |
Education in Auburn
School Enrollment in Auburn
The most common levels of schooling among the 2,537 students in Auburn are elementary school (591 | 23.3%), high school (550 | 21.7%), and college / undergraduate (512 | 20.2%).
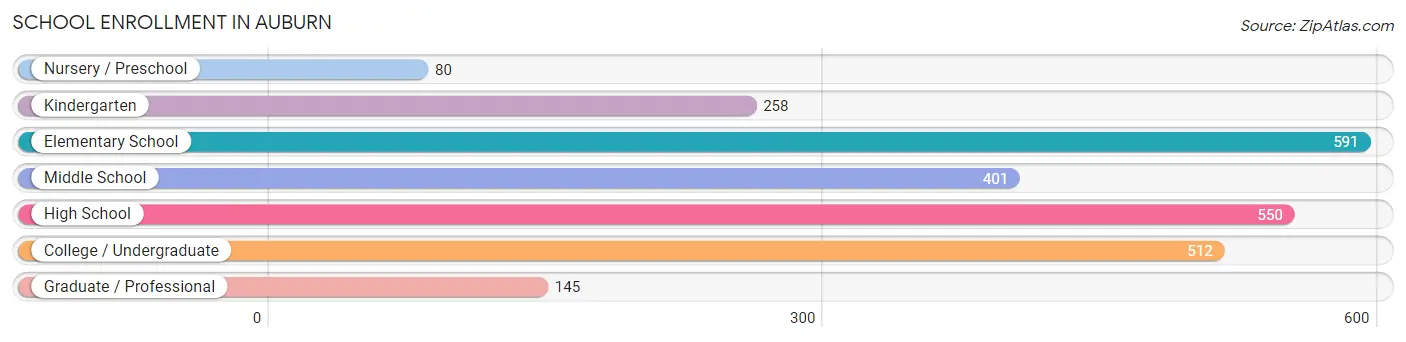
| School Level | # Students | % Students |
| Nursery / Preschool | 80 | 3.2% |
| Kindergarten | 258 | 10.2% |
| Elementary School | 591 | 23.3% |
| Middle School | 401 | 15.8% |
| High School | 550 | 21.7% |
| College / Undergraduate | 512 | 20.2% |
| Graduate / Professional | 145 | 5.7% |
| Total | 2,537 | 100.0% |
School Enrollment by Age by Funding Source in Auburn
Out of a total of 2,537 students who are enrolled in schools in Auburn, 259 (10.2%) attend a private institution, while the remaining 2,278 (89.8%) are enrolled in public schools. The age group of 3 to 4 year olds has the highest likelihood of being enrolled in private schools, with 33 (54.1% in the age bracket) enrolled. Conversely, the age group of 15 to 17 year olds has the lowest likelihood of being enrolled in a private school, with 347 (97.2% in the age bracket) attending a public institution.
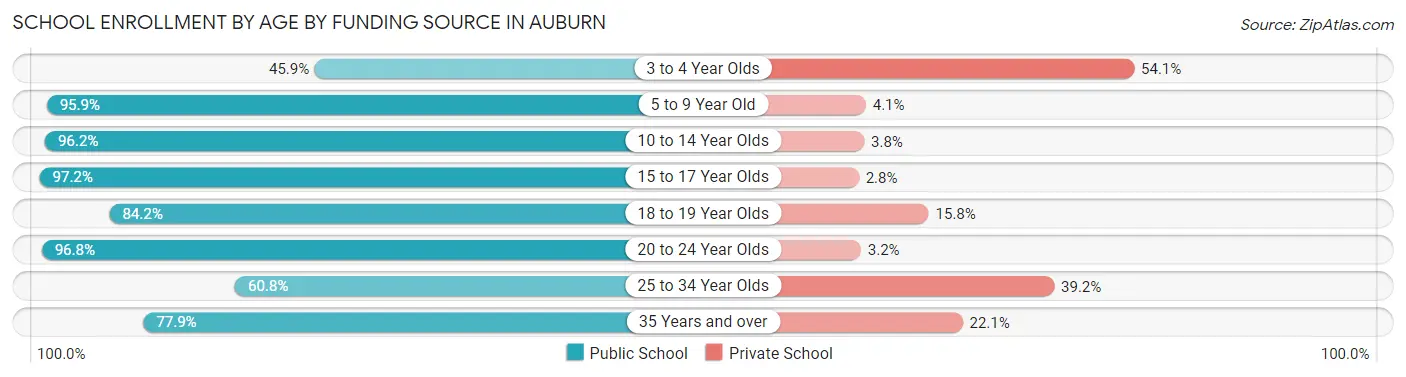
| Age Bracket | Public School | Private School |
| 3 to 4 Year Olds | 28 (45.9%) | 33 (54.1%) |
| 5 to 9 Year Old | 767 (95.9%) | 33 (4.1%) |
| 10 to 14 Year Olds | 531 (96.2%) | 21 (3.8%) |
| 15 to 17 Year Olds | 347 (97.2%) | 10 (2.8%) |
| 18 to 19 Year Olds | 133 (84.2%) | 25 (15.8%) |
| 20 to 24 Year Olds | 212 (96.8%) | 7 (3.2%) |
| 25 to 34 Year Olds | 152 (60.8%) | 98 (39.2%) |
| 35 Years and over | 109 (77.9%) | 31 (22.1%) |
| Total | 2,278 (89.8%) | 259 (10.2%) |
Educational Attainment by Field of Study in Auburn
Business (855 | 19.2%), education (451 | 10.1%), social sciences (438 | 9.8%), science & technology (424 | 9.5%), and liberal arts & history (303 | 6.8%) are the most common fields of study among 4,451 individuals in Auburn who have obtained a bachelor's degree or higher.
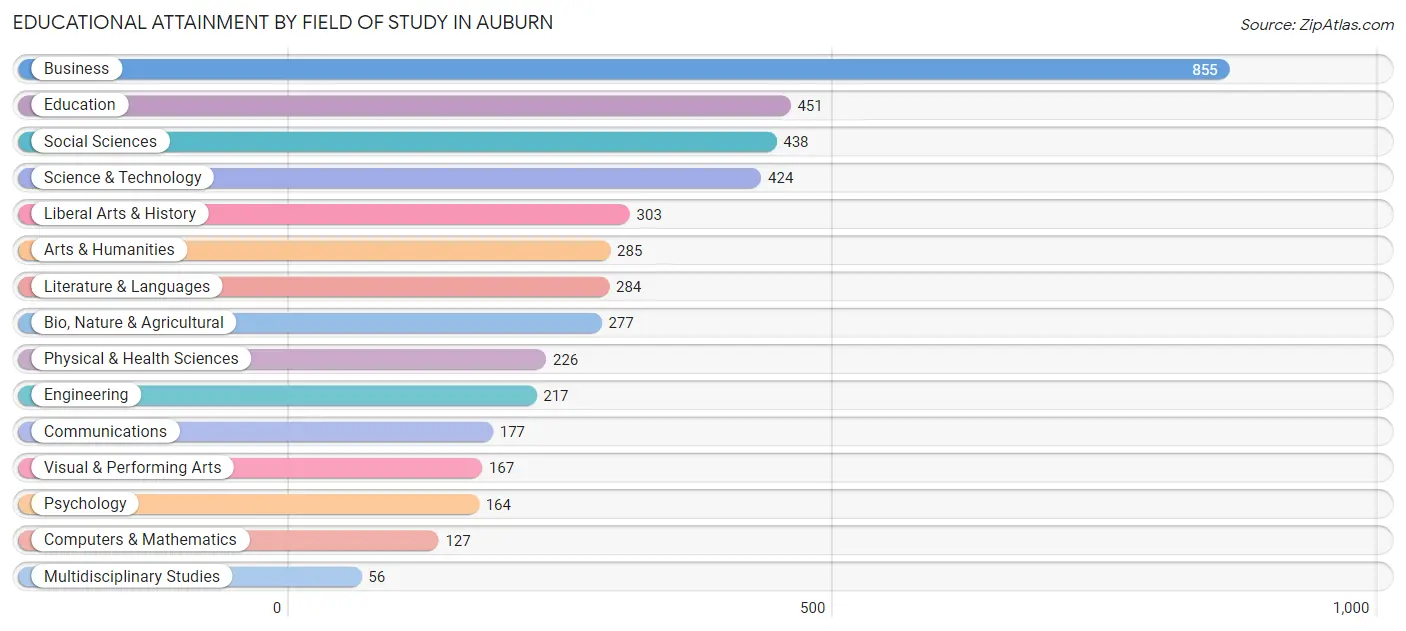
| Field of Study | # Graduates | % Graduates |
| Computers & Mathematics | 127 | 2.9% |
| Bio, Nature & Agricultural | 277 | 6.2% |
| Physical & Health Sciences | 226 | 5.1% |
| Psychology | 164 | 3.7% |
| Social Sciences | 438 | 9.8% |
| Engineering | 217 | 4.9% |
| Multidisciplinary Studies | 56 | 1.3% |
| Science & Technology | 424 | 9.5% |
| Business | 855 | 19.2% |
| Education | 451 | 10.1% |
| Literature & Languages | 284 | 6.4% |
| Liberal Arts & History | 303 | 6.8% |
| Visual & Performing Arts | 167 | 3.7% |
| Communications | 177 | 4.0% |
| Arts & Humanities | 285 | 6.4% |
| Total | 4,451 | 100.0% |
Transportation & Commute in Auburn
Vehicle Availability by Sex in Auburn
The most prevalent vehicle ownership categories in Auburn are males with 2 vehicles (1,480, accounting for 48.0%) and females with 2 vehicles (1,103, making up 50.7%).
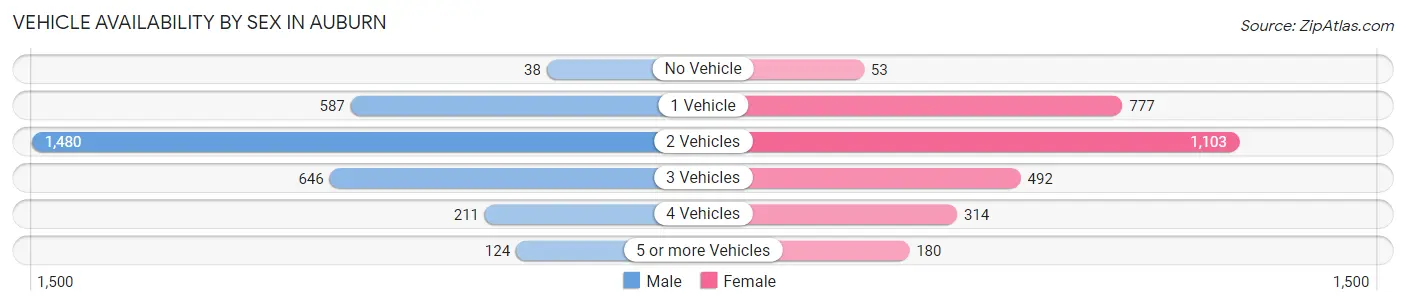
| Vehicles Available | Male | Female |
| No Vehicle | 38 (1.2%) | 53 (1.8%) |
| 1 Vehicle | 587 (19.0%) | 777 (26.6%) |
| 2 Vehicles | 1,480 (48.0%) | 1,103 (37.8%) |
| 3 Vehicles | 646 (20.9%) | 492 (16.9%) |
| 4 Vehicles | 211 (6.8%) | 314 (10.8%) |
| 5 or more Vehicles | 124 (4.0%) | 180 (6.2%) |
| Total | 3,086 (100.0%) | 2,919 (100.0%) |
Commute Time in Auburn
The most frequently occuring commute durations in Auburn are 15 to 19 minutes (1,047 commuters, 19.9%), 5 to 9 minutes (925 commuters, 17.6%), and 10 to 14 minutes (836 commuters, 15.9%).
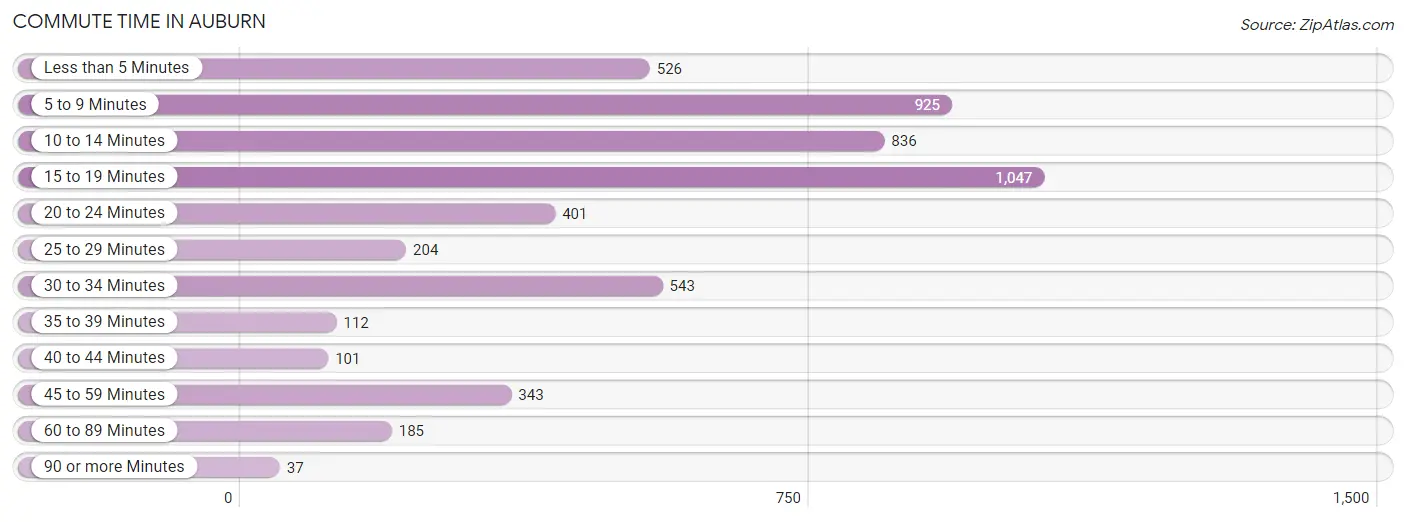
| Commute Time | # Commuters | % Commuters |
| Less than 5 Minutes | 526 | 10.0% |
| 5 to 9 Minutes | 925 | 17.6% |
| 10 to 14 Minutes | 836 | 15.9% |
| 15 to 19 Minutes | 1,047 | 19.9% |
| 20 to 24 Minutes | 401 | 7.6% |
| 25 to 29 Minutes | 204 | 3.9% |
| 30 to 34 Minutes | 543 | 10.3% |
| 35 to 39 Minutes | 112 | 2.1% |
| 40 to 44 Minutes | 101 | 1.9% |
| 45 to 59 Minutes | 343 | 6.5% |
| 60 to 89 Minutes | 185 | 3.5% |
| 90 or more Minutes | 37 | 0.7% |
Commute Time by Sex in Auburn
The most common commute times in Auburn are 15 to 19 minutes (506 commuters, 18.5%) for males and 5 to 9 minutes (560 commuters, 22.2%) for females.
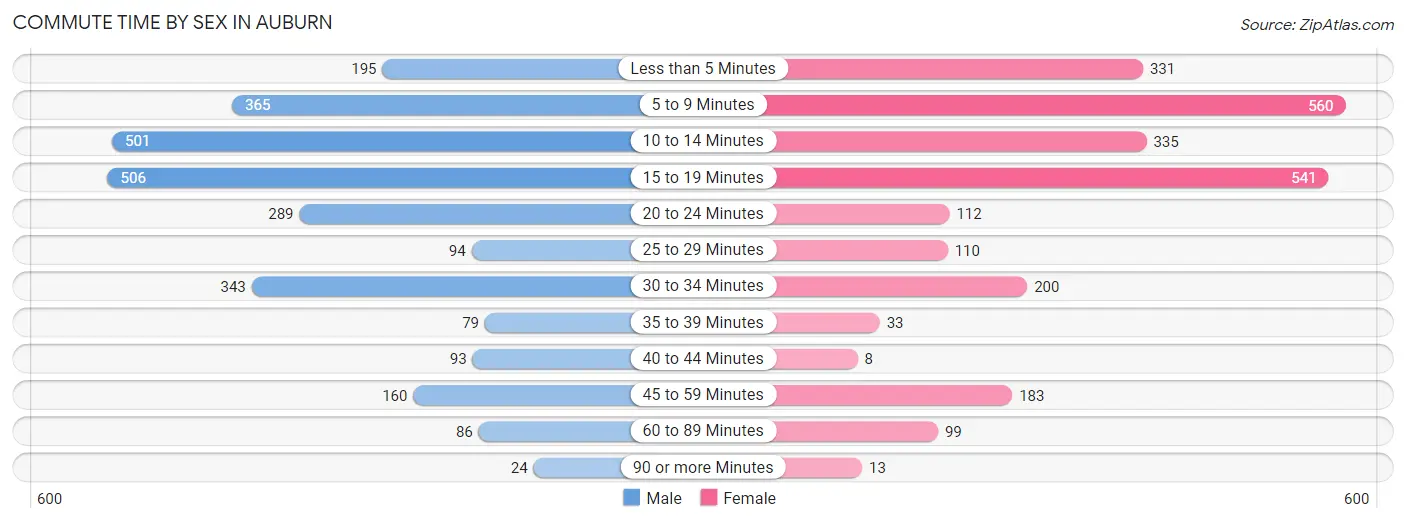
| Commute Time | Male | Female |
| Less than 5 Minutes | 195 (7.1%) | 331 (13.1%) |
| 5 to 9 Minutes | 365 (13.4%) | 560 (22.2%) |
| 10 to 14 Minutes | 501 (18.3%) | 335 (13.3%) |
| 15 to 19 Minutes | 506 (18.5%) | 541 (21.4%) |
| 20 to 24 Minutes | 289 (10.6%) | 112 (4.4%) |
| 25 to 29 Minutes | 94 (3.4%) | 110 (4.4%) |
| 30 to 34 Minutes | 343 (12.5%) | 200 (7.9%) |
| 35 to 39 Minutes | 79 (2.9%) | 33 (1.3%) |
| 40 to 44 Minutes | 93 (3.4%) | 8 (0.3%) |
| 45 to 59 Minutes | 160 (5.9%) | 183 (7.2%) |
| 60 to 89 Minutes | 86 (3.1%) | 99 (3.9%) |
| 90 or more Minutes | 24 (0.9%) | 13 (0.5%) |
Time of Departure to Work by Sex in Auburn
The most frequent times of departure to work in Auburn are 6:00 AM to 6:29 AM (430, 15.7%) for males and 7:30 AM to 7:59 AM (401, 15.9%) for females.
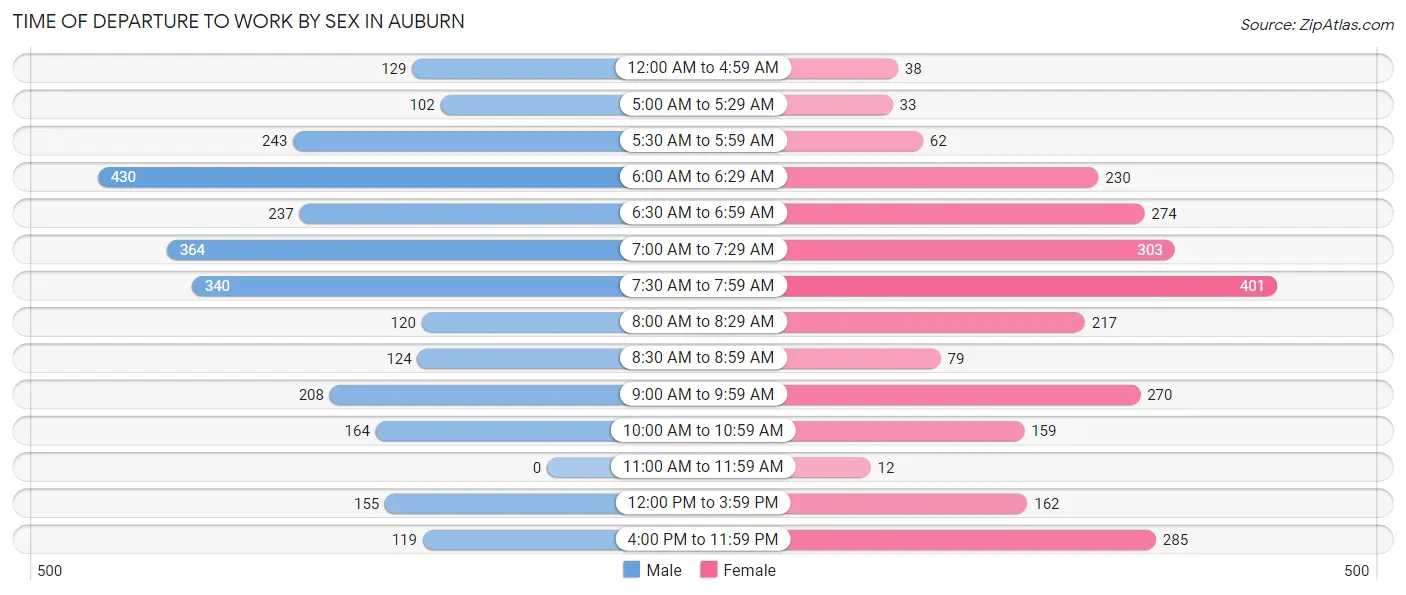
| Time of Departure | Male | Female |
| 12:00 AM to 4:59 AM | 129 (4.7%) | 38 (1.5%) |
| 5:00 AM to 5:29 AM | 102 (3.7%) | 33 (1.3%) |
| 5:30 AM to 5:59 AM | 243 (8.9%) | 62 (2.5%) |
| 6:00 AM to 6:29 AM | 430 (15.7%) | 230 (9.1%) |
| 6:30 AM to 6:59 AM | 237 (8.7%) | 274 (10.8%) |
| 7:00 AM to 7:29 AM | 364 (13.3%) | 303 (12.0%) |
| 7:30 AM to 7:59 AM | 340 (12.4%) | 401 (15.9%) |
| 8:00 AM to 8:29 AM | 120 (4.4%) | 217 (8.6%) |
| 8:30 AM to 8:59 AM | 124 (4.5%) | 79 (3.1%) |
| 9:00 AM to 9:59 AM | 208 (7.6%) | 270 (10.7%) |
| 10:00 AM to 10:59 AM | 164 (6.0%) | 159 (6.3%) |
| 11:00 AM to 11:59 AM | 0 (0.0%) | 12 (0.5%) |
| 12:00 PM to 3:59 PM | 155 (5.7%) | 162 (6.4%) |
| 4:00 PM to 11:59 PM | 119 (4.3%) | 285 (11.3%) |
| Total | 2,735 (100.0%) | 2,525 (100.0%) |
Housing Occupancy in Auburn
Occupancy by Ownership in Auburn
Of the total 6,328 dwellings in Auburn, owner-occupied units account for 3,759 (59.4%), while renter-occupied units make up 2,569 (40.6%).
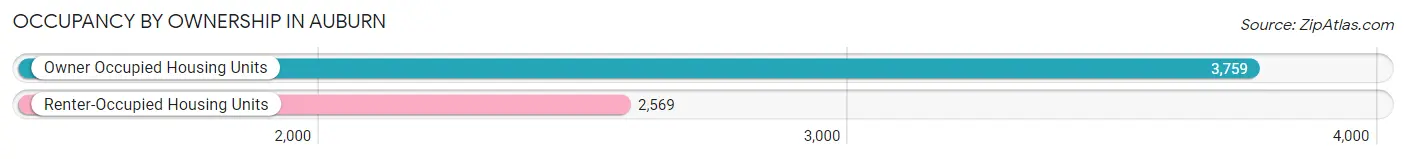
| Occupancy | # Housing Units | % Housing Units |
| Owner Occupied Housing Units | 3,759 | 59.4% |
| Renter-Occupied Housing Units | 2,569 | 40.6% |
| Total Occupied Housing Units | 6,328 | 100.0% |
Occupancy by Household Size in Auburn
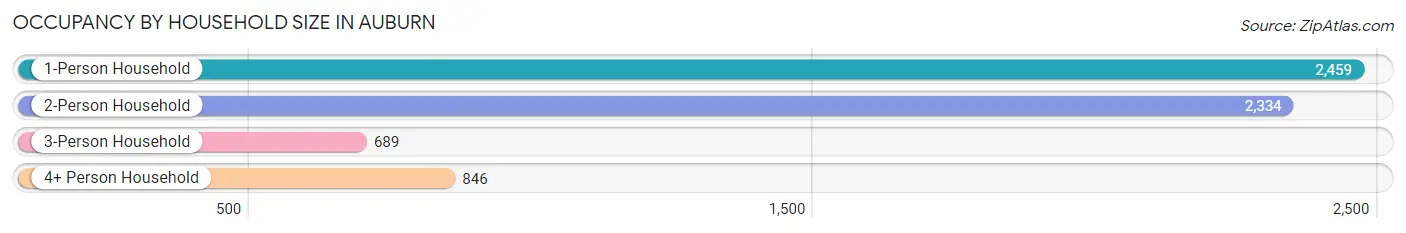
| Household Size | # Housing Units | % Housing Units |
| 1-Person Household | 2,459 | 38.9% |
| 2-Person Household | 2,334 | 36.9% |
| 3-Person Household | 689 | 10.9% |
| 4+ Person Household | 846 | 13.4% |
| Total Housing Units | 6,328 | 100.0% |
Occupancy by Ownership by Household Size in Auburn
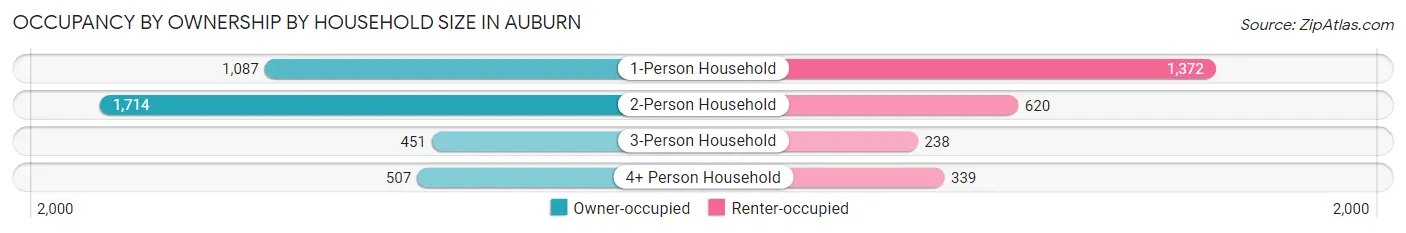
| Household Size | Owner-occupied | Renter-occupied |
| 1-Person Household | 1,087 (44.2%) | 1,372 (55.8%) |
| 2-Person Household | 1,714 (73.4%) | 620 (26.6%) |
| 3-Person Household | 451 (65.5%) | 238 (34.5%) |
| 4+ Person Household | 507 (59.9%) | 339 (40.1%) |
| Total Housing Units | 3,759 (59.4%) | 2,569 (40.6%) |
Occupancy by Educational Attainment in Auburn
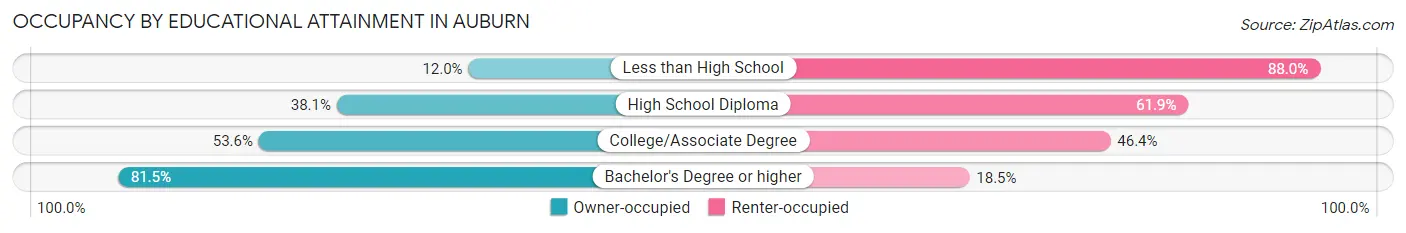
| Household Size | Owner-occupied | Renter-occupied |
| Less than High School | 60 (12.0%) | 440 (88.0%) |
| High School Diploma | 319 (38.1%) | 518 (61.9%) |
| College/Associate Degree | 1,320 (53.6%) | 1,144 (46.4%) |
| Bachelor's Degree or higher | 2,060 (81.5%) | 467 (18.5%) |
Occupancy by Age of Householder in Auburn
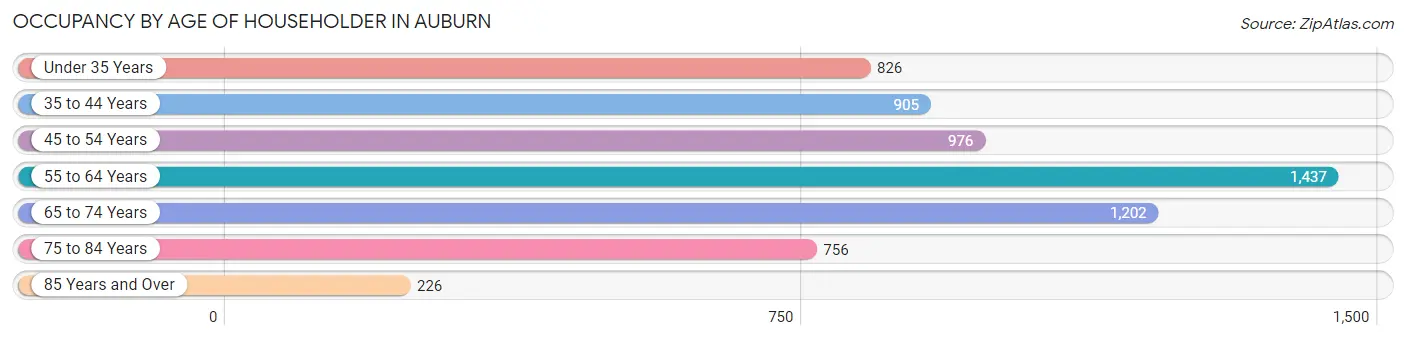
| Age Bracket | # Households | % Households |
| Under 35 Years | 826 | 13.1% |
| 35 to 44 Years | 905 | 14.3% |
| 45 to 54 Years | 976 | 15.4% |
| 55 to 64 Years | 1,437 | 22.7% |
| 65 to 74 Years | 1,202 | 19.0% |
| 75 to 84 Years | 756 | 11.9% |
| 85 Years and Over | 226 | 3.6% |
| Total | 6,328 | 100.0% |
Housing Finances in Auburn
Median Income by Occupancy in Auburn
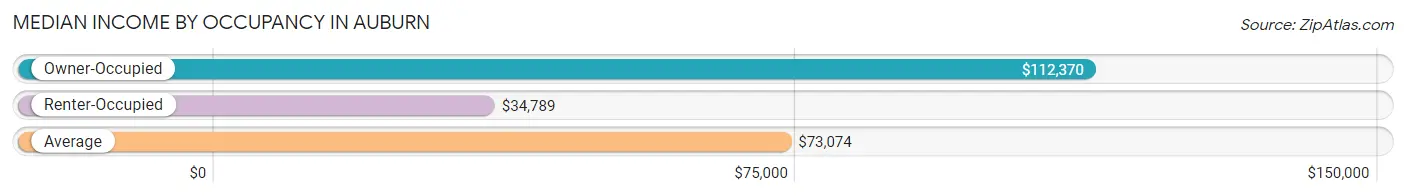
| Occupancy Type | # Households | Median Income |
| Owner-Occupied | 3,759 (59.4%) | $112,370 |
| Renter-Occupied | 2,569 (40.6%) | $34,789 |
| Average | 6,328 (100.0%) | $73,074 |
Occupancy by Householder Income Bracket in Auburn
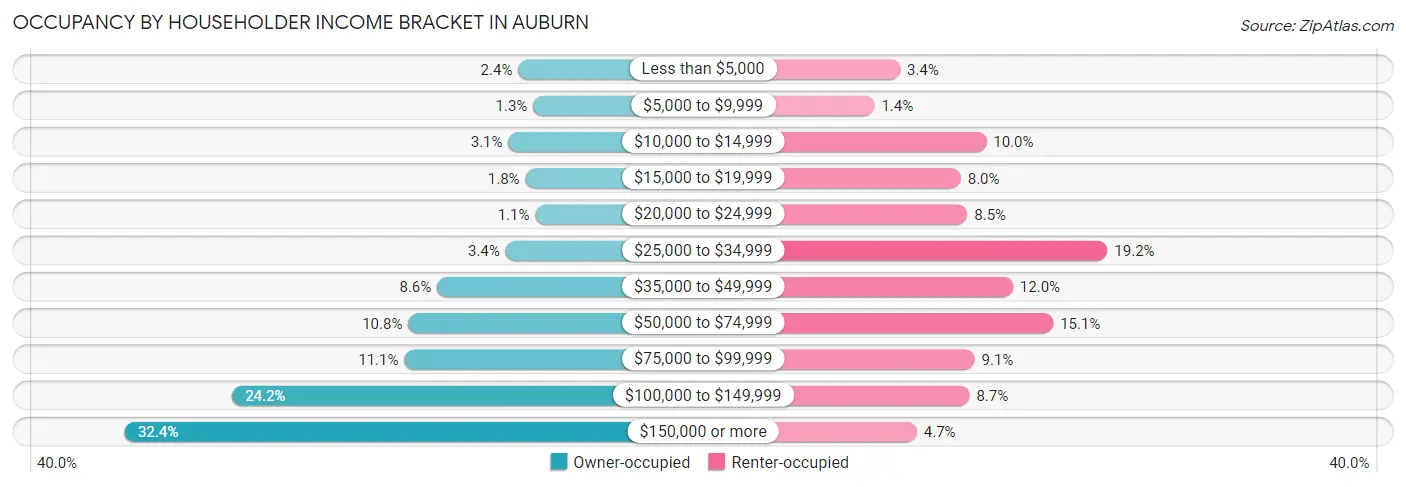
| Income Bracket | Owner-occupied | Renter-occupied |
| Less than $5,000 | 90 (2.4%) | 87 (3.4%) |
| $5,000 to $9,999 | 47 (1.3%) | 37 (1.4%) |
| $10,000 to $14,999 | 118 (3.1%) | 256 (10.0%) |
| $15,000 to $19,999 | 69 (1.8%) | 206 (8.0%) |
| $20,000 to $24,999 | 41 (1.1%) | 219 (8.5%) |
| $25,000 to $34,999 | 126 (3.4%) | 493 (19.2%) |
| $35,000 to $49,999 | 322 (8.6%) | 308 (12.0%) |
| $50,000 to $74,999 | 405 (10.8%) | 387 (15.1%) |
| $75,000 to $99,999 | 416 (11.1%) | 233 (9.1%) |
| $100,000 to $149,999 | 909 (24.2%) | 223 (8.7%) |
| $150,000 or more | 1,216 (32.4%) | 120 (4.7%) |
| Total | 3,759 (100.0%) | 2,569 (100.0%) |
Monthly Housing Cost Tiers in Auburn
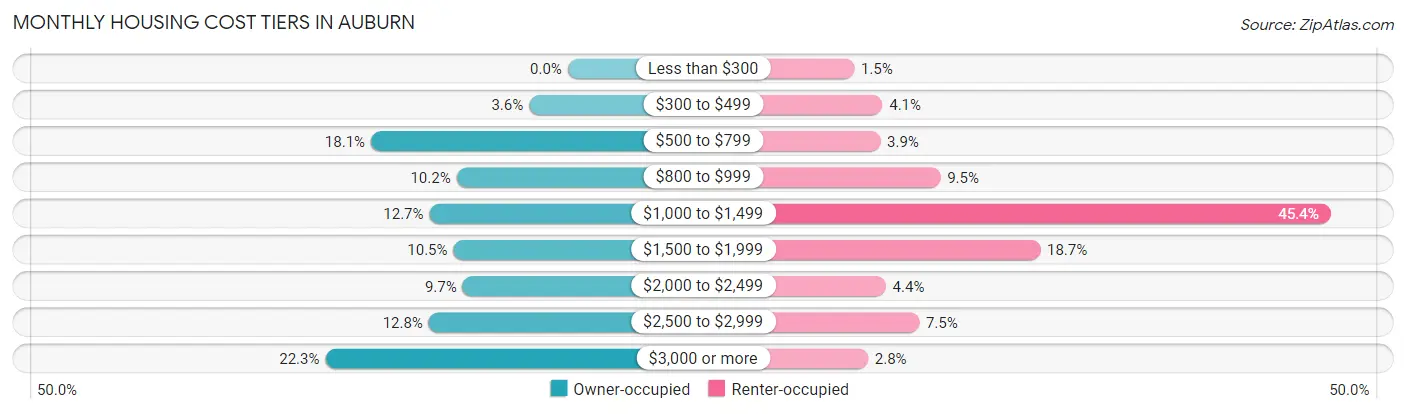
| Monthly Cost | Owner-occupied | Renter-occupied |
| Less than $300 | 0 (0.0%) | 39 (1.5%) |
| $300 to $499 | 134 (3.6%) | 106 (4.1%) |
| $500 to $799 | 681 (18.1%) | 101 (3.9%) |
| $800 to $999 | 385 (10.2%) | 243 (9.5%) |
| $1,000 to $1,499 | 479 (12.7%) | 1,166 (45.4%) |
| $1,500 to $1,999 | 396 (10.5%) | 479 (18.6%) |
| $2,000 to $2,499 | 364 (9.7%) | 114 (4.4%) |
| $2,500 to $2,999 | 481 (12.8%) | 193 (7.5%) |
| $3,000 or more | 839 (22.3%) | 72 (2.8%) |
| Total | 3,759 (100.0%) | 2,569 (100.0%) |
Physical Housing Characteristics in Auburn
Housing Structures in Auburn
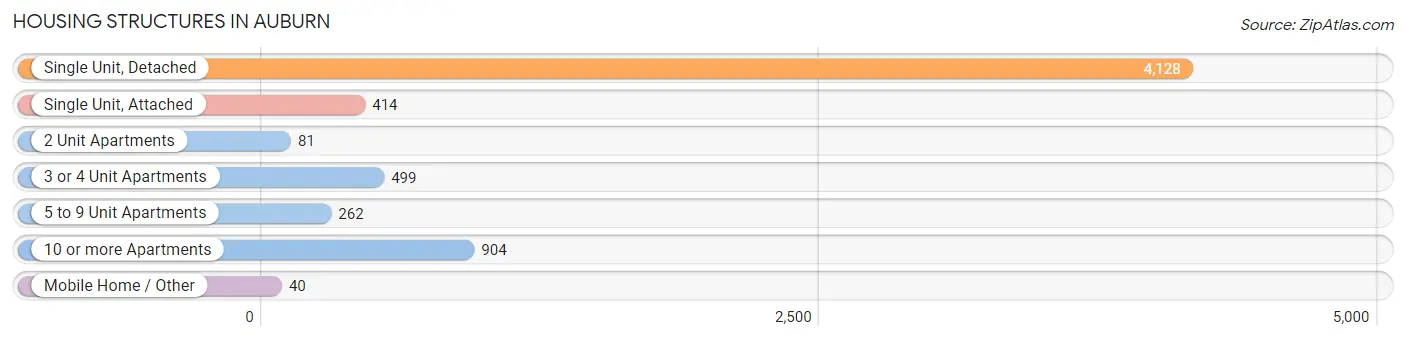
| Structure Type | # Housing Units | % Housing Units |
| Single Unit, Detached | 4,128 | 65.2% |
| Single Unit, Attached | 414 | 6.5% |
| 2 Unit Apartments | 81 | 1.3% |
| 3 or 4 Unit Apartments | 499 | 7.9% |
| 5 to 9 Unit Apartments | 262 | 4.1% |
| 10 or more Apartments | 904 | 14.3% |
| Mobile Home / Other | 40 | 0.6% |
| Total | 6,328 | 100.0% |
Housing Structures by Occupancy in Auburn
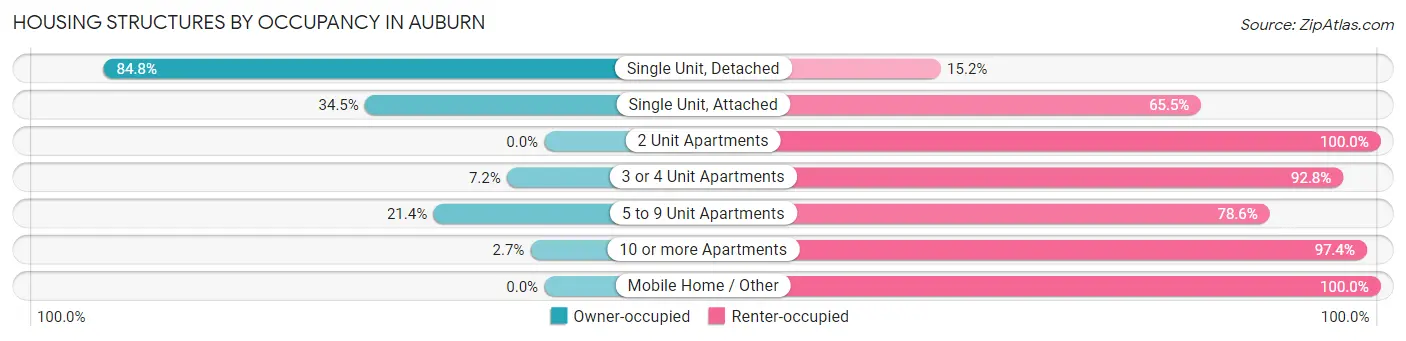
| Structure Type | Owner-occupied | Renter-occupied |
| Single Unit, Detached | 3,500 (84.8%) | 628 (15.2%) |
| Single Unit, Attached | 143 (34.5%) | 271 (65.5%) |
| 2 Unit Apartments | 0 (0.0%) | 81 (100.0%) |
| 3 or 4 Unit Apartments | 36 (7.2%) | 463 (92.8%) |
| 5 to 9 Unit Apartments | 56 (21.4%) | 206 (78.6%) |
| 10 or more Apartments | 24 (2.6%) | 880 (97.4%) |
| Mobile Home / Other | 0 (0.0%) | 40 (100.0%) |
| Total | 3,759 (59.4%) | 2,569 (40.6%) |
Housing Structures by Number of Rooms in Auburn
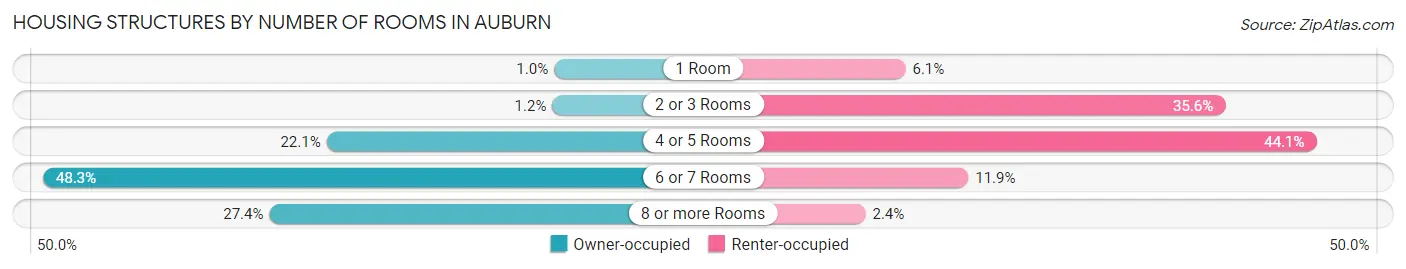
| Number of Rooms | Owner-occupied | Renter-occupied |
| 1 Room | 39 (1.0%) | 156 (6.1%) |
| 2 or 3 Rooms | 45 (1.2%) | 915 (35.6%) |
| 4 or 5 Rooms | 830 (22.1%) | 1,132 (44.1%) |
| 6 or 7 Rooms | 1,816 (48.3%) | 305 (11.9%) |
| 8 or more Rooms | 1,029 (27.4%) | 61 (2.4%) |
| Total | 3,759 (100.0%) | 2,569 (100.0%) |
Housing Structure by Heating Type in Auburn
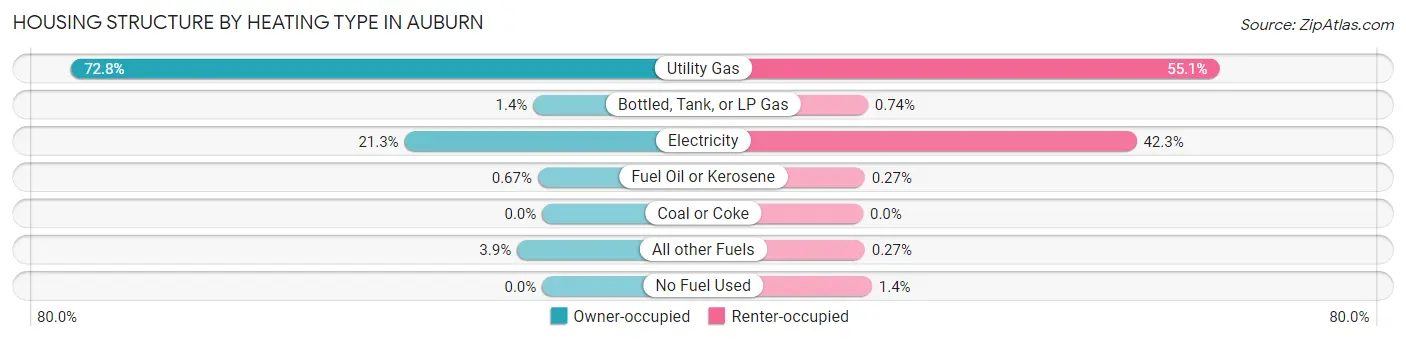
| Heating Type | Owner-occupied | Renter-occupied |
| Utility Gas | 2,736 (72.8%) | 1,415 (55.1%) |
| Bottled, Tank, or LP Gas | 52 (1.4%) | 19 (0.7%) |
| Electricity | 800 (21.3%) | 1,086 (42.3%) |
| Fuel Oil or Kerosene | 25 (0.7%) | 7 (0.3%) |
| Coal or Coke | 0 (0.0%) | 0 (0.0%) |
| All other Fuels | 146 (3.9%) | 7 (0.3%) |
| No Fuel Used | 0 (0.0%) | 35 (1.4%) |
| Total | 3,759 (100.0%) | 2,569 (100.0%) |
Household Vehicle Usage in Auburn
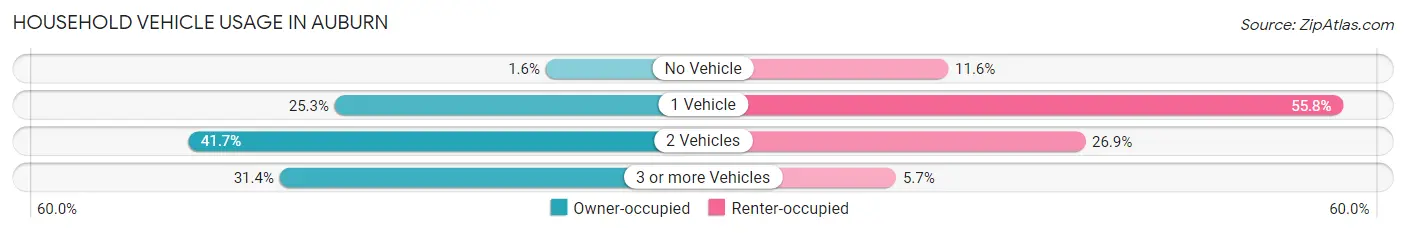
| Vehicles per Household | Owner-occupied | Renter-occupied |
| No Vehicle | 61 (1.6%) | 297 (11.6%) |
| 1 Vehicle | 949 (25.3%) | 1,434 (55.8%) |
| 2 Vehicles | 1,568 (41.7%) | 691 (26.9%) |
| 3 or more Vehicles | 1,181 (31.4%) | 147 (5.7%) |
| Total | 3,759 (100.0%) | 2,569 (100.0%) |
Real Estate & Mortgages in Auburn
Real Estate and Mortgage Overview in Auburn
| Characteristic | Without Mortgage | With Mortgage |
| Housing Units | 1,385 | 2,374 |
| Median Property Value | $558,000 | $650,300 |
| Median Household Income | $74,967 | $942 |
| Monthly Housing Costs | $790 | $839 |
| Real Estate Taxes | $4,446 | $27 |
Property Value by Mortgage Status in Auburn
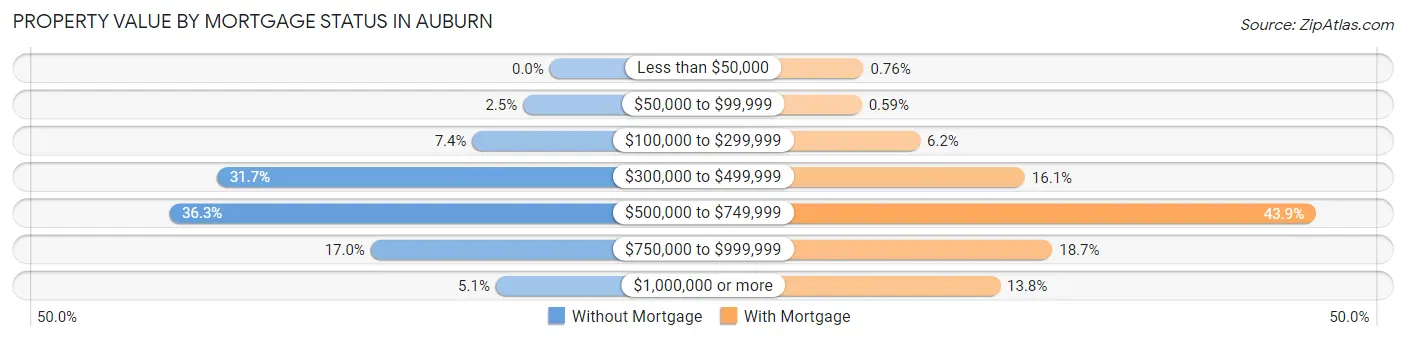
| Property Value | Without Mortgage | With Mortgage |
| Less than $50,000 | 0 (0.0%) | 18 (0.8%) |
| $50,000 to $99,999 | 35 (2.5%) | 14 (0.6%) |
| $100,000 to $299,999 | 102 (7.4%) | 146 (6.1%) |
| $300,000 to $499,999 | 439 (31.7%) | 383 (16.1%) |
| $500,000 to $749,999 | 502 (36.2%) | 1,041 (43.9%) |
| $750,000 to $999,999 | 236 (17.0%) | 445 (18.7%) |
| $1,000,000 or more | 71 (5.1%) | 327 (13.8%) |
| Total | 1,385 (100.0%) | 2,374 (100.0%) |
Household Income by Mortgage Status in Auburn
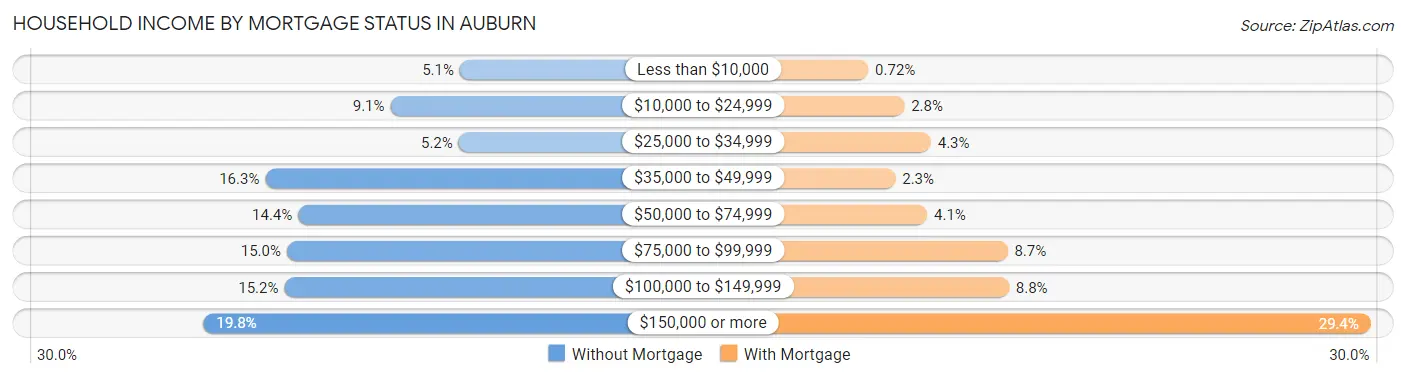
| Household Income | Without Mortgage | With Mortgage |
| Less than $10,000 | 71 (5.1%) | 17 (0.7%) |
| $10,000 to $24,999 | 126 (9.1%) | 66 (2.8%) |
| $25,000 to $34,999 | 72 (5.2%) | 102 (4.3%) |
| $35,000 to $49,999 | 225 (16.3%) | 54 (2.3%) |
| $50,000 to $74,999 | 199 (14.4%) | 97 (4.1%) |
| $75,000 to $99,999 | 208 (15.0%) | 206 (8.7%) |
| $100,000 to $149,999 | 210 (15.2%) | 208 (8.8%) |
| $150,000 or more | 274 (19.8%) | 699 (29.4%) |
| Total | 1,385 (100.0%) | 2,374 (100.0%) |
Property Value to Household Income Ratio in Auburn
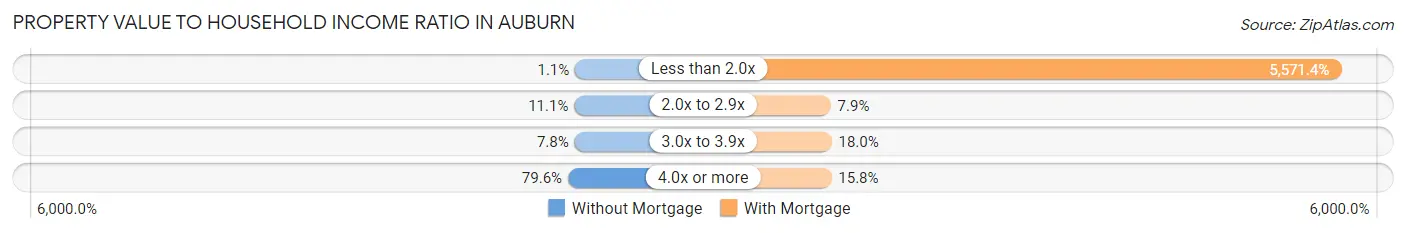
| Value-to-Income Ratio | Without Mortgage | With Mortgage |
| Less than 2.0x | 15 (1.1%) | 132,264 (5,571.4%) |
| 2.0x to 2.9x | 153 (11.1%) | 188 (7.9%) |
| 3.0x to 3.9x | 108 (7.8%) | 428 (18.0%) |
| 4.0x or more | 1,103 (79.6%) | 376 (15.8%) |
| Total | 1,385 (100.0%) | 2,374 (100.0%) |
Real Estate Taxes by Mortgage Status in Auburn
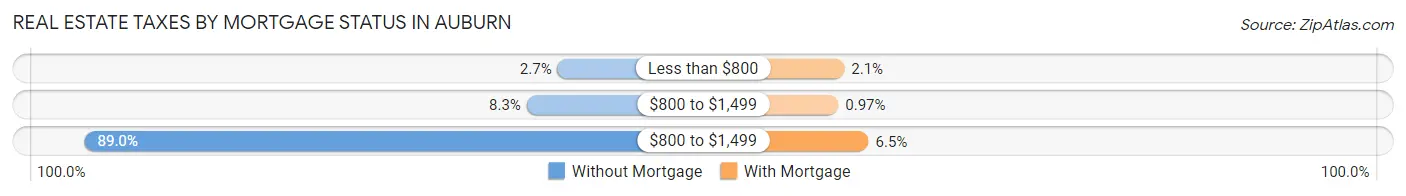
| Property Taxes | Without Mortgage | With Mortgage |
| Less than $800 | 37 (2.7%) | 49 (2.1%) |
| $800 to $1,499 | 115 (8.3%) | 23 (1.0%) |
| $800 to $1,499 | 1,233 (89.0%) | 154 (6.5%) |
| Total | 1,385 (100.0%) | 2,374 (100.0%) |
Health & Disability in Auburn
Health Insurance Coverage by Age in Auburn
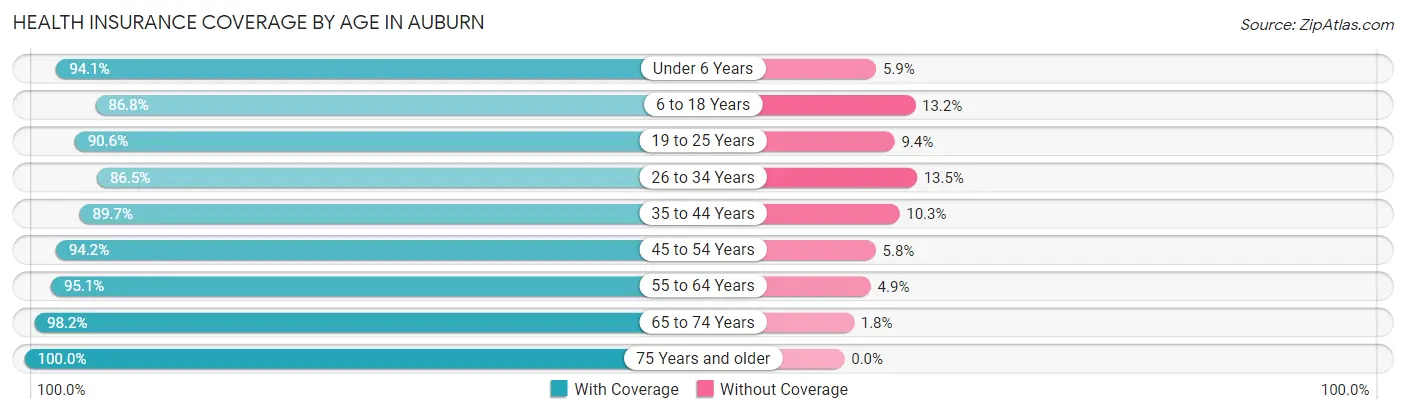
| Age Bracket | With Coverage | Without Coverage |
| Under 6 Years | 572 (94.1%) | 36 (5.9%) |
| 6 to 18 Years | 1,454 (86.8%) | 221 (13.2%) |
| 19 to 25 Years | 997 (90.6%) | 103 (9.4%) |
| 26 to 34 Years | 1,128 (86.5%) | 176 (13.5%) |
| 35 to 44 Years | 1,539 (89.7%) | 176 (10.3%) |
| 45 to 54 Years | 1,420 (94.2%) | 88 (5.8%) |
| 55 to 64 Years | 2,185 (95.1%) | 113 (4.9%) |
| 65 to 74 Years | 2,050 (98.2%) | 37 (1.8%) |
| 75 Years and older | 1,291 (100.0%) | 0 (0.0%) |
| Total | 12,636 (93.0%) | 950 (7.0%) |
Health Insurance Coverage by Citizenship Status in Auburn
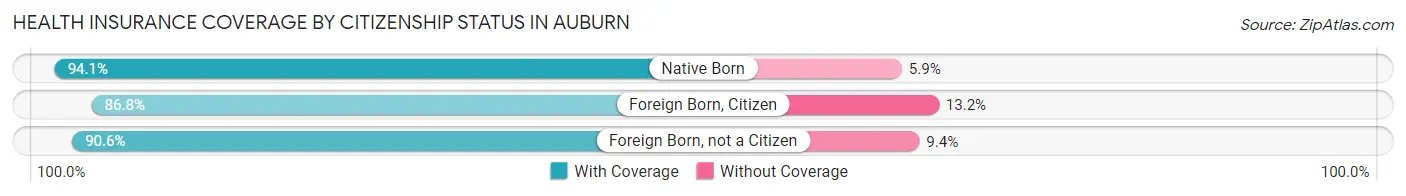
| Citizenship Status | With Coverage | Without Coverage |
| Native Born | 572 (94.1%) | 36 (5.9%) |
| Foreign Born, Citizen | 1,454 (86.8%) | 221 (13.2%) |
| Foreign Born, not a Citizen | 997 (90.6%) | 103 (9.4%) |
Health Insurance Coverage by Household Income in Auburn
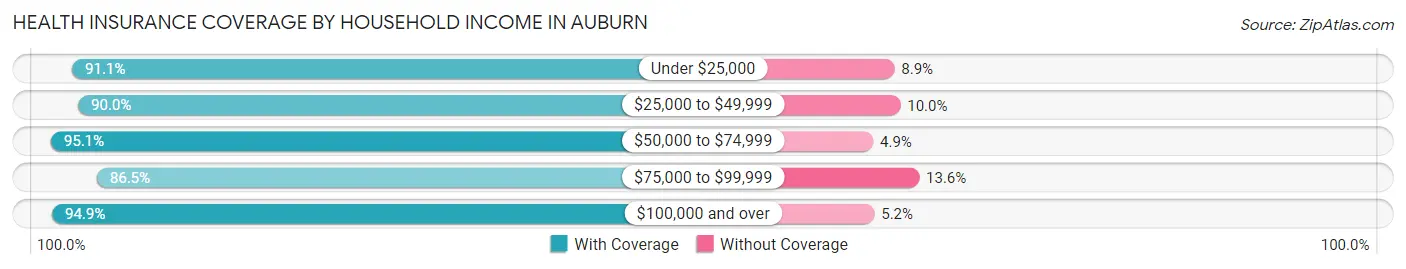
| Household Income | With Coverage | Without Coverage |
| Under $25,000 | 1,727 (91.1%) | 169 (8.9%) |
| $25,000 to $49,999 | 1,632 (90.0%) | 182 (10.0%) |
| $50,000 to $74,999 | 1,734 (95.1%) | 90 (4.9%) |
| $75,000 to $99,999 | 1,110 (86.5%) | 174 (13.6%) |
| $100,000 and over | 6,165 (94.9%) | 335 (5.1%) |
Public vs Private Health Insurance Coverage by Age in Auburn
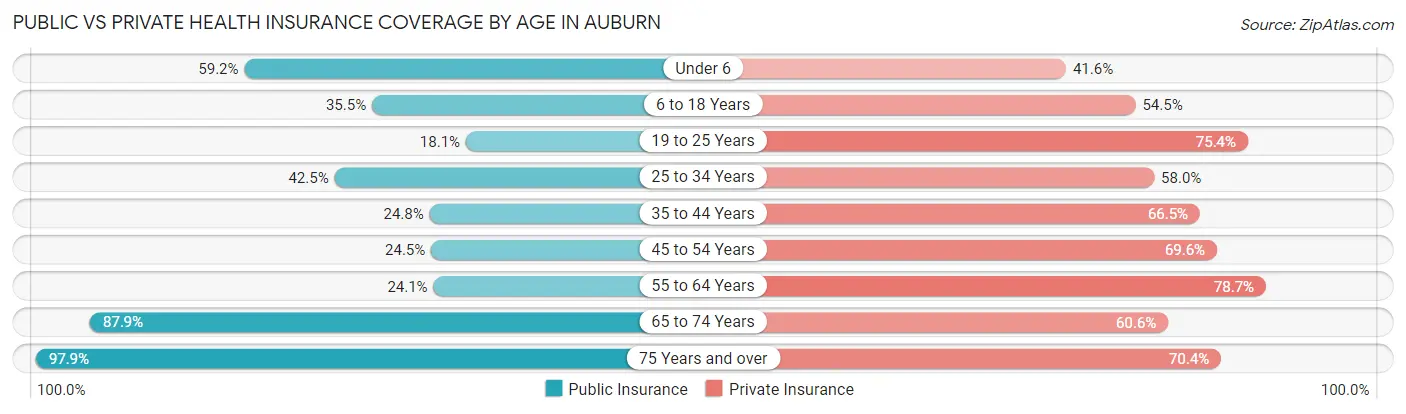
| Age Bracket | Public Insurance | Private Insurance |
| Under 6 | 360 (59.2%) | 253 (41.6%) |
| 6 to 18 Years | 595 (35.5%) | 913 (54.5%) |
| 19 to 25 Years | 199 (18.1%) | 829 (75.4%) |
| 25 to 34 Years | 554 (42.5%) | 756 (58.0%) |
| 35 to 44 Years | 426 (24.8%) | 1,140 (66.5%) |
| 45 to 54 Years | 370 (24.5%) | 1,050 (69.6%) |
| 55 to 64 Years | 554 (24.1%) | 1,809 (78.7%) |
| 65 to 74 Years | 1,834 (87.9%) | 1,264 (60.6%) |
| 75 Years and over | 1,264 (97.9%) | 909 (70.4%) |
| Total | 6,156 (45.3%) | 8,923 (65.7%) |
Disability Status by Sex by Age in Auburn
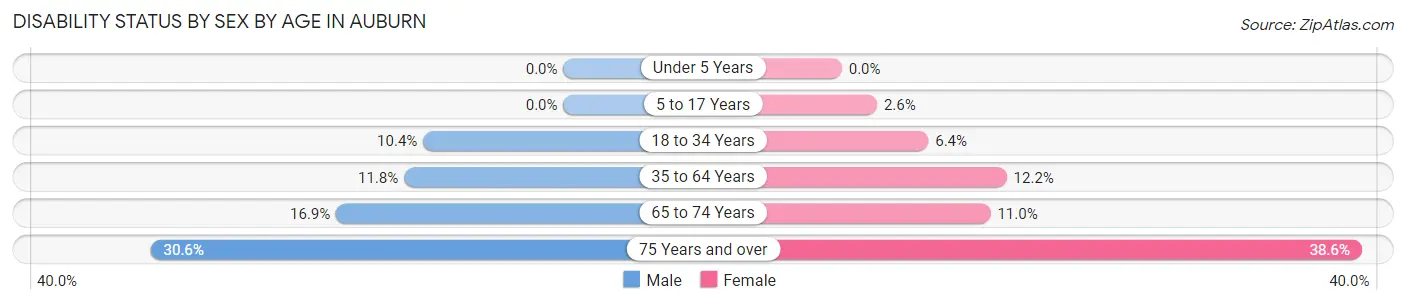
| Age Bracket | Male | Female |
| Under 5 Years | 0 (0.0%) | 0 (0.0%) |
| 5 to 17 Years | 0 (0.0%) | 25 (2.6%) |
| 18 to 34 Years | 126 (10.4%) | 84 (6.4%) |
| 35 to 64 Years | 310 (11.8%) | 355 (12.2%) |
| 65 to 74 Years | 155 (16.9%) | 129 (11.0%) |
| 75 Years and over | 159 (30.6%) | 298 (38.6%) |
Disability Class by Sex by Age in Auburn
Disability Class: Hearing Difficulty
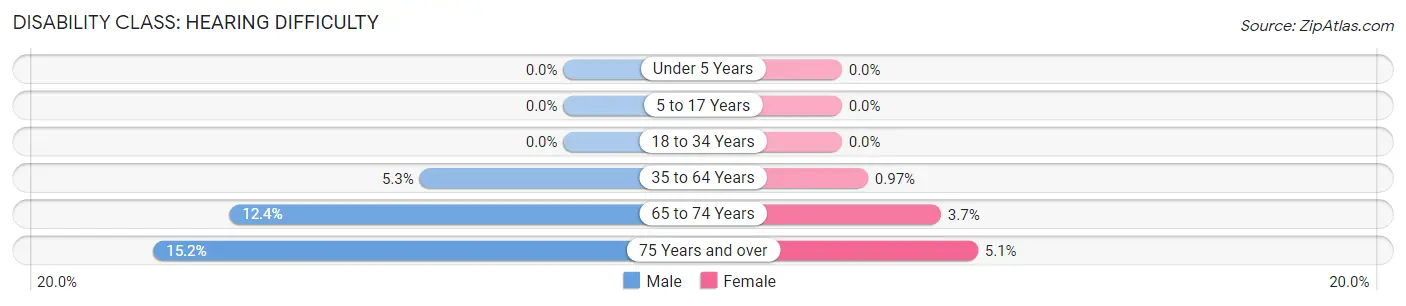
| Age Bracket | Male | Female |
| Under 5 Years | 0 (0.0%) | 0 (0.0%) |
| 5 to 17 Years | 0 (0.0%) | 0 (0.0%) |
| 18 to 34 Years | 0 (0.0%) | 0 (0.0%) |
| 35 to 64 Years | 140 (5.3%) | 28 (1.0%) |
| 65 to 74 Years | 114 (12.4%) | 43 (3.7%) |
| 75 Years and over | 79 (15.2%) | 39 (5.1%) |
Disability Class: Vision Difficulty
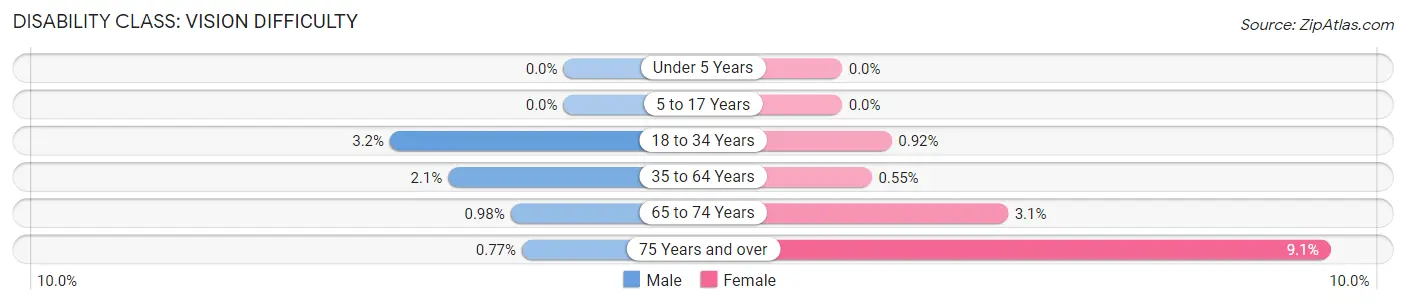
| Age Bracket | Male | Female |
| Under 5 Years | 0 (0.0%) | 0 (0.0%) |
| 5 to 17 Years | 0 (0.0%) | 0 (0.0%) |
| 18 to 34 Years | 39 (3.2%) | 12 (0.9%) |
| 35 to 64 Years | 56 (2.1%) | 16 (0.5%) |
| 65 to 74 Years | 9 (1.0%) | 36 (3.1%) |
| 75 Years and over | 4 (0.8%) | 70 (9.1%) |
Disability Class: Cognitive Difficulty
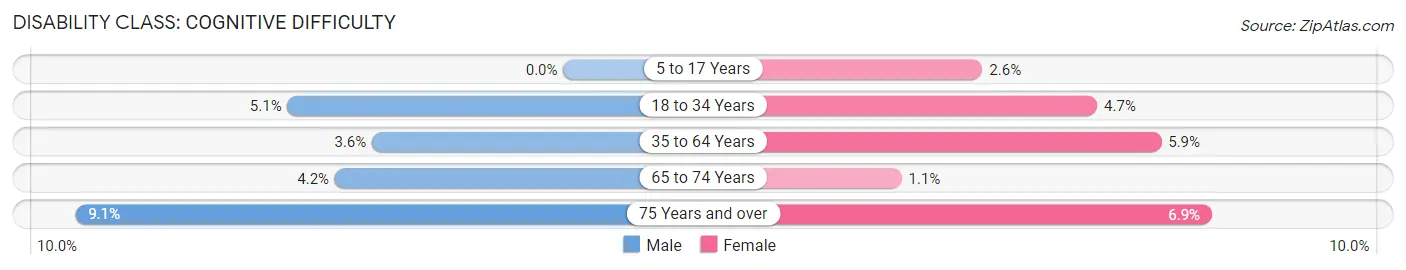
| Age Bracket | Male | Female |
| 5 to 17 Years | 0 (0.0%) | 25 (2.6%) |
| 18 to 34 Years | 62 (5.1%) | 62 (4.7%) |
| 35 to 64 Years | 93 (3.5%) | 172 (5.9%) |
| 65 to 74 Years | 39 (4.2%) | 13 (1.1%) |
| 75 Years and over | 47 (9.1%) | 53 (6.9%) |
Disability Class: Ambulatory Difficulty
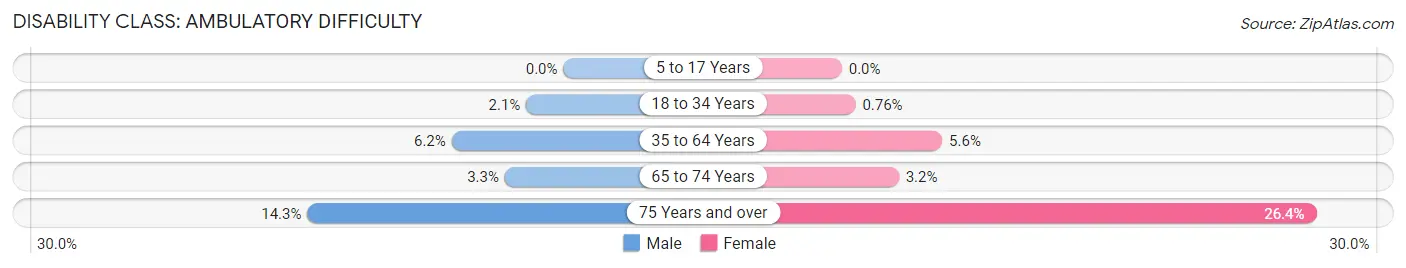
| Age Bracket | Male | Female |
| 5 to 17 Years | 0 (0.0%) | 0 (0.0%) |
| 18 to 34 Years | 25 (2.1%) | 10 (0.8%) |
| 35 to 64 Years | 163 (6.2%) | 162 (5.6%) |
| 65 to 74 Years | 30 (3.3%) | 37 (3.2%) |
| 75 Years and over | 74 (14.3%) | 204 (26.4%) |
Disability Class: Self-Care Difficulty
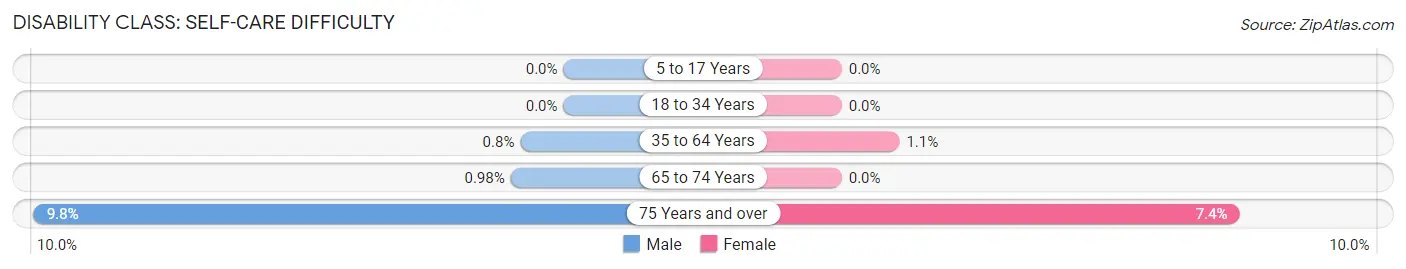
| Age Bracket | Male | Female |
| 5 to 17 Years | 0 (0.0%) | 0 (0.0%) |
| 18 to 34 Years | 0 (0.0%) | 0 (0.0%) |
| 35 to 64 Years | 21 (0.8%) | 31 (1.1%) |
| 65 to 74 Years | 9 (1.0%) | 0 (0.0%) |
| 75 Years and over | 51 (9.8%) | 57 (7.4%) |
Technology Access in Auburn
Computing Device Access in Auburn
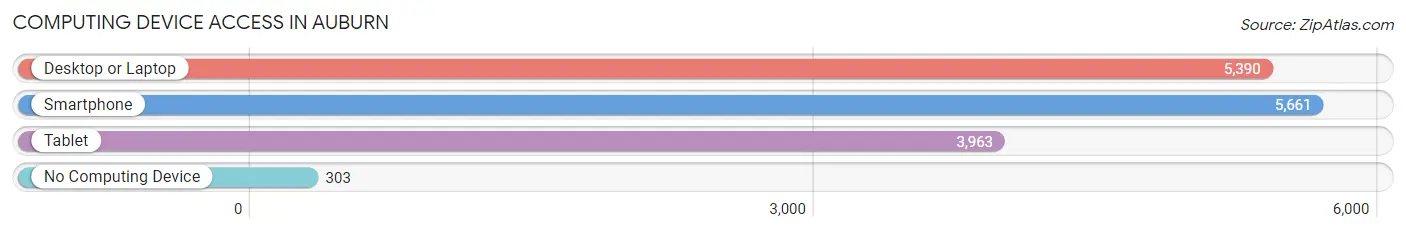
| Device Type | # Households | % Households |
| Desktop or Laptop | 5,390 | 85.2% |
| Smartphone | 5,661 | 89.5% |
| Tablet | 3,963 | 62.6% |
| No Computing Device | 303 | 4.8% |
| Total | 6,328 | 100.0% |
Internet Access in Auburn
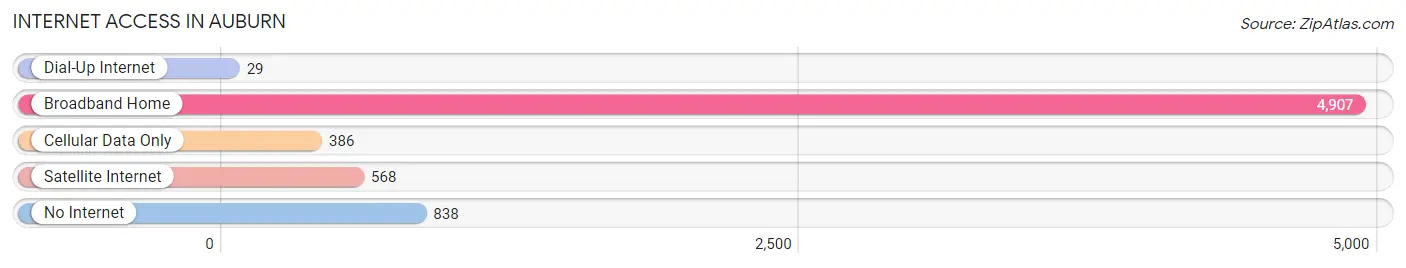
| Internet Type | # Households | % Households |
| Dial-Up Internet | 29 | 0.5% |
| Broadband Home | 4,907 | 77.5% |
| Cellular Data Only | 386 | 6.1% |
| Satellite Internet | 568 | 9.0% |
| No Internet | 838 | 13.2% |
| Total | 6,328 | 100.0% |
Auburn Summary
Auburn, California is a city located in Placer County, California, United States. It is situated in the foothills of the Sierra Nevada Mountains, approximately 40 miles northeast of Sacramento. The population was 13,330 at the 2010 census. Auburn is known for its historic downtown area, which features a variety of shops, restaurants, and other businesses.
History
The area around Auburn was originally inhabited by the Maidu and Miwok Native American tribes. The first European settlers arrived in the area in the early 1850s, and the town of Auburn was officially founded in 1848. The town was named after Auburn, New York, which was the hometown of one of the first settlers.
In the late 19th century, Auburn became a popular destination for gold miners, and the town experienced a period of rapid growth. The Auburn Dam was built in the early 20th century, providing water for the area and helping to spur further growth.
Geography
Auburn is located at 39°2'15"N 120°56'52"W (39.03750, -120.94778). According to the United States Census Bureau, the city has a total area of 7.2 square miles (18.6 km2), all of it land.
Economy
Auburn’s economy is largely based on tourism, with many visitors coming to the area to enjoy the nearby outdoor recreation opportunities. The city is also home to a number of businesses, including manufacturing, retail, and healthcare.
Demographics
As of the 2010 census, there were 13,330 people, 5,717 households, and 3,541 families residing in the city. The population density was 1,845.2 people per square mile (715.2/km2). The racial makeup of the city was 87.2% White, 1.2% African American, 0.8% Native American, 2.2% Asian, 0.2% Pacific Islander, 5.2% from other races, and 3.2% from two or more races. Hispanic or Latino of any race were 11.2% of the population.
The median income for a household in the city was $50,919, and the median income for a family was $60,919. Males had a median income of $45,919 versus $31,919 for females. The per capita income for the city was $25,919. About 6.2% of families and 8.2% of the population were below the poverty line, including 11.2% of those under age 18 and 6.2% of those age 65 or over.
Common Questions
What is Per Capita Income in Auburn?
Per Capita income in Auburn is $51,036.
What is the Median Family Income in Auburn?
Median Family Income in Auburn is $104,764.
What is the Median Household income in Auburn?
Median Household Income in Auburn is $73,074.
What is Income or Wage Gap in Auburn?
Income or Wage Gap in Auburn is 35.7%.
Women in Auburn earn 64.3 cents for every dollar earned by a man.
What is Inequality or Gini Index in Auburn?
Inequality or Gini Index in Auburn is 0.51.
What is the Total Population of Auburn?
Total Population of Auburn is 13,773.
What is the Total Male Population of Auburn?
Total Male Population of Auburn is 6,373.
What is the Total Female Population of Auburn?
Total Female Population of Auburn is 7,400.
What is the Ratio of Males per 100 Females in Auburn?
There are 86.12 Males per 100 Females in Auburn.
What is the Ratio of Females per 100 Males in Auburn?
There are 116.11 Females per 100 Males in Auburn.
What is the Median Population Age in Auburn?
Median Population Age in Auburn is 47.3 Years.
What is the Average Family Size in Auburn
Average Family Size in Auburn is 2.7 People.
What is the Average Household Size in Auburn
Average Household Size in Auburn is 2.1 People.
How Large is the Labor Force in Auburn?
There are 6,446 People in the Labor Forcein in Auburn.
What is the Percentage of People in the Labor Force in Auburn?
54.3% of People are in the Labor Force in Auburn.
What is the Unemployment Rate in Auburn?
Unemployment Rate in Auburn is 2.9%.