Short Hills, NJ Map & Demographics
Short Hills Map
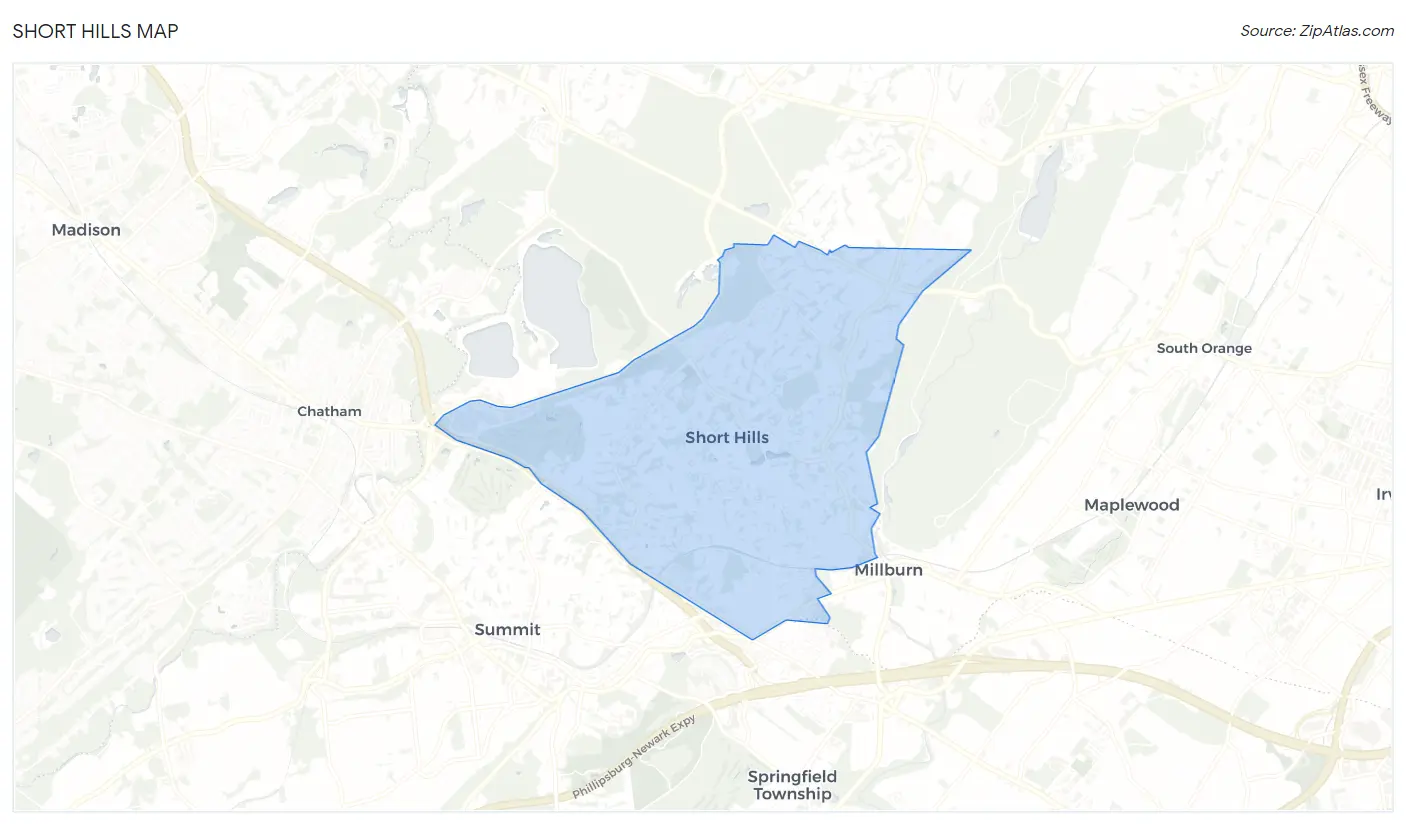
Short Hills Overview
$153,214
PER CAPITA INCOME
$250,001
AVG FAMILY INCOME
$250,001
AVG HOUSEHOLD INCOME
55.6%
WAGE / INCOME GAP [ % ]
44.4¢/ $1
WAGE / INCOME GAP [ $ ]
0.45
INEQUALITY / GINI INDEX
14,448
TOTAL POPULATION
7,253
MALE POPULATION
7,195
FEMALE POPULATION
100.81
MALES / 100 FEMALES
99.20
FEMALES / 100 MALES
41.6
MEDIAN AGE
3.3
AVG FAMILY SIZE
3.2
AVG HOUSEHOLD SIZE
6,841
LABOR FORCE [ PEOPLE ]
65.4%
PERCENT IN LABOR FORCE
4.8%
UNEMPLOYMENT RATE
Short Hills Zip Codes
Short Hills Area Codes
Income in Short Hills
Income Overview in Short Hills
Per Capita Income in Short Hills is $153,214, while median incomes of families and households are $250,001 and $250,001 respectively.
| Characteristic | Number | Measure |
| Per Capita Income | 14,448 | $153,214 |
| Median Family Income | 4,154 | $250,001 |
| Mean Family Income | 4,154 | $504,884 |
| Median Household Income | 4,575 | $250,001 |
| Mean Household Income | 4,575 | $481,717 |
| Income Deficit | 4,154 | $0 |
| Wage / Income Gap (%) | 14,448 | 55.63% |
| Wage / Income Gap ($) | 14,448 | 44.37¢ per $1 |
| Gini / Inequality Index | 14,448 | 0.45 |
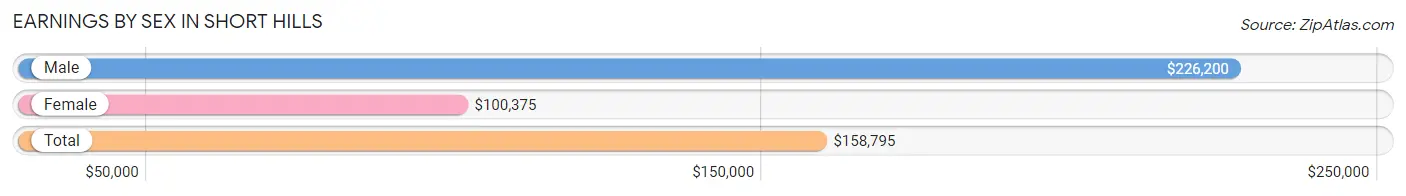
Earnings by Sex in Short Hills
Average Earnings in Short Hills are $158,795, $226,200 for men and $100,375 for women, a difference of 55.6%.
| Sex | Number | Average Earnings |
| Male | 4,210 (58.6%) | $226,200 |
| Female | 2,975 (41.4%) | $100,375 |
| Total | 7,185 (100.0%) | $158,795 |
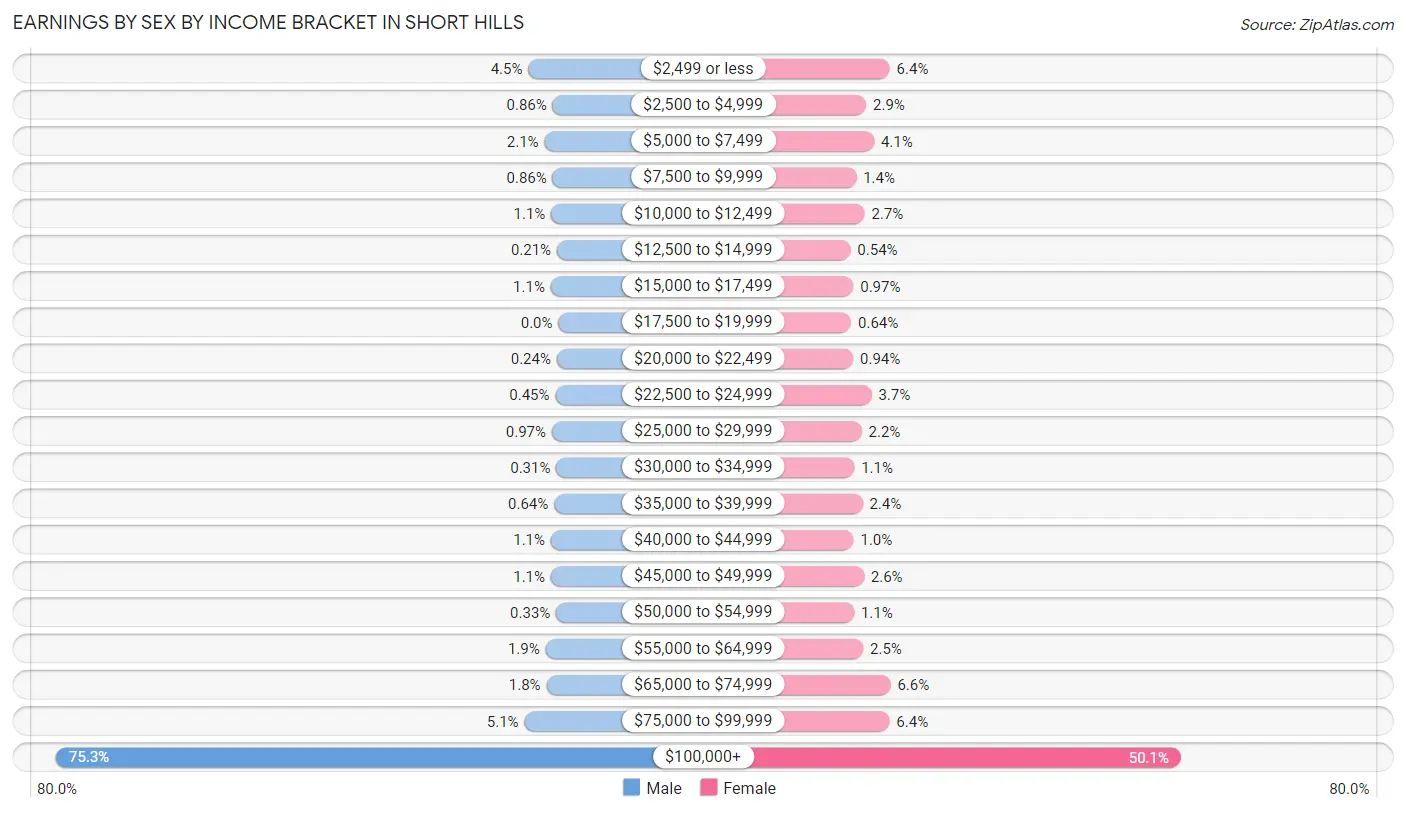
Earnings by Sex by Income Bracket in Short Hills
The most common earnings brackets in Short Hills are $100,000+ for men (3,170 | 75.3%) and $100,000+ for women (1,489 | 50.0%).
| Income | Male | Female |
| $2,499 or less | 190 (4.5%) | 191 (6.4%) |
| $2,500 to $4,999 | 36 (0.9%) | 86 (2.9%) |
| $5,000 to $7,499 | 88 (2.1%) | 121 (4.1%) |
| $7,500 to $9,999 | 36 (0.9%) | 42 (1.4%) |
| $10,000 to $12,499 | 45 (1.1%) | 79 (2.7%) |
| $12,500 to $14,999 | 9 (0.2%) | 16 (0.5%) |
| $15,000 to $17,499 | 48 (1.1%) | 29 (1.0%) |
| $17,500 to $19,999 | 0 (0.0%) | 19 (0.6%) |
| $20,000 to $22,499 | 10 (0.2%) | 28 (0.9%) |
| $22,500 to $24,999 | 19 (0.4%) | 110 (3.7%) |
| $25,000 to $29,999 | 41 (1.0%) | 66 (2.2%) |
| $30,000 to $34,999 | 13 (0.3%) | 33 (1.1%) |
| $35,000 to $39,999 | 27 (0.6%) | 70 (2.4%) |
| $40,000 to $44,999 | 47 (1.1%) | 30 (1.0%) |
| $45,000 to $49,999 | 47 (1.1%) | 76 (2.5%) |
| $50,000 to $54,999 | 14 (0.3%) | 32 (1.1%) |
| $55,000 to $64,999 | 81 (1.9%) | 73 (2.5%) |
| $65,000 to $74,999 | 75 (1.8%) | 195 (6.6%) |
| $75,000 to $99,999 | 214 (5.1%) | 190 (6.4%) |
| $100,000+ | 3,170 (75.3%) | 1,489 (50.0%) |
| Total | 4,210 (100.0%) | 2,975 (100.0%) |
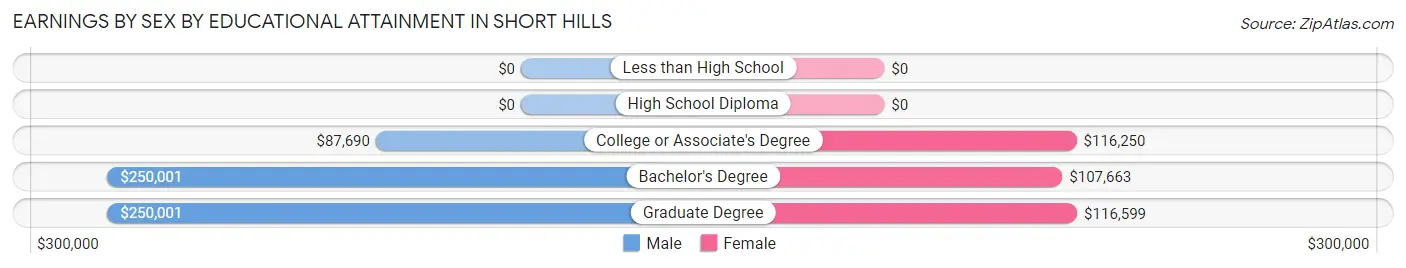
Earnings by Sex by Educational Attainment in Short Hills
Average earnings in Short Hills are $241,250 for men and $113,698 for women, a difference of 52.9%. Men with an educational attainment of bachelor's degree enjoy the highest average annual earnings of $250,001, while those with college or associate's degree education earn the least with $87,690. Women with an educational attainment of graduate degree earn the most with the average annual earnings of $116,599, while those with bachelor's degree education have the smallest earnings of $107,663.
| Educational Attainment | Male Income | Female Income |
| Less than High School | - | - |
| High School Diploma | - | - |
| College or Associate's Degree | $87,690 | $116,250 |
| Bachelor's Degree | $250,001 | $107,663 |
| Graduate Degree | $250,001 | $116,599 |
| Total | $241,250 | $113,698 |
Family Income in Short Hills
Family Income Brackets in Short Hills
According to the Short Hills family income data, there are 3,165 families falling into the $200,000+ income range, which is the most common income bracket and makes up 76.2% of all families.
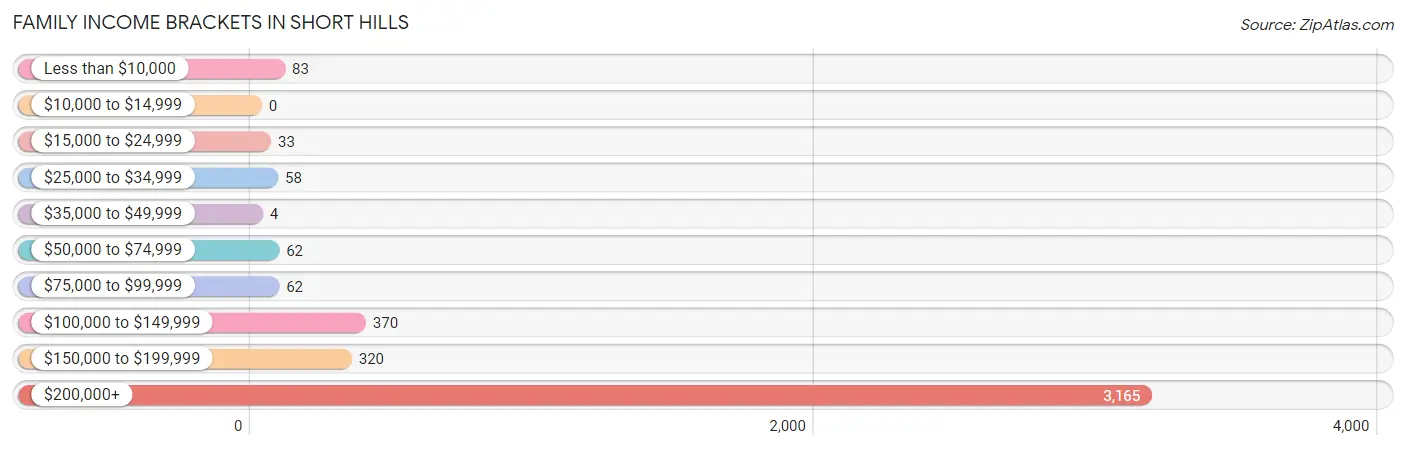
| Income Bracket | # Families | % Families |
| Less than $10,000 | 83 | 2.0% |
| $10,000 to $14,999 | 0 | 0.0% |
| $15,000 to $24,999 | 33 | 0.8% |
| $25,000 to $34,999 | 58 | 1.4% |
| $35,000 to $49,999 | 4 | 0.1% |
| $50,000 to $74,999 | 62 | 1.5% |
| $75,000 to $99,999 | 62 | 1.5% |
| $100,000 to $149,999 | 370 | 8.9% |
| $150,000 to $199,999 | 320 | 7.7% |
| $200,000+ | 3,165 | 76.2% |
Family Income by Famaliy Size in Short Hills
2-person families (1,185 | 28.5%) account for the highest median family income in Short Hills with $250,001 per family, while 2-person families (1,185 | 28.5%) have the highest median income of $125,000 per family member.
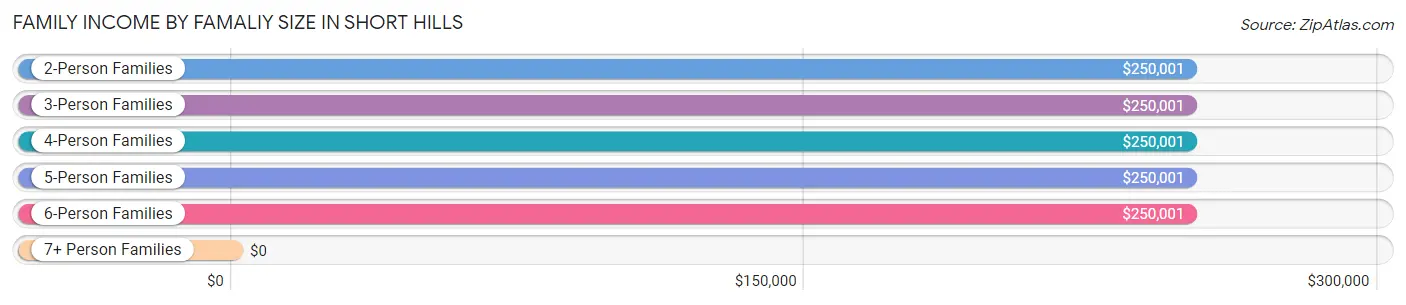
| Income Bracket | # Families | Median Income |
| 2-Person Families | 1,185 (28.5%) | $250,001 |
| 3-Person Families | 888 (21.4%) | $250,001 |
| 4-Person Families | 1,494 (36.0%) | $250,001 |
| 5-Person Families | 480 (11.6%) | $250,001 |
| 6-Person Families | 90 (2.2%) | $250,001 |
| 7+ Person Families | 17 (0.4%) | $0 |
| Total | 4,154 (100.0%) | $250,001 |
Family Income by Number of Earners in Short Hills
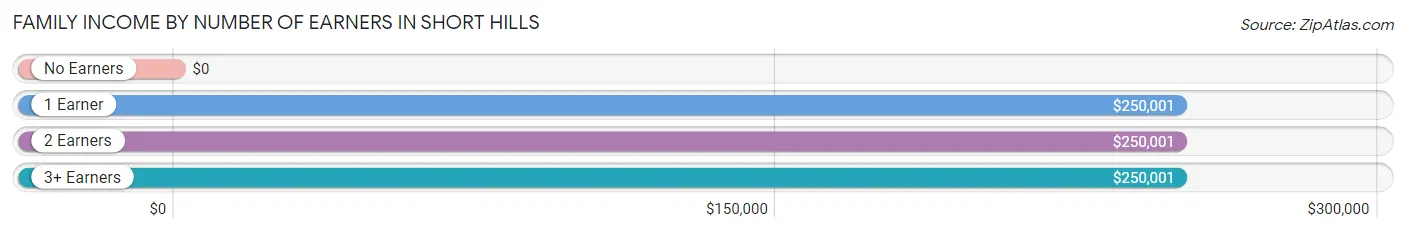
| Number of Earners | # Families | Median Income |
| No Earners | 257 (6.2%) | $0 |
| 1 Earner | 1,489 (35.8%) | $250,001 |
| 2 Earners | 2,060 (49.6%) | $250,001 |
| 3+ Earners | 348 (8.4%) | $250,001 |
| Total | 4,154 (100.0%) | $250,001 |
Household Income in Short Hills
Household Income Brackets in Short Hills
With 3,335 households falling in the category, the $200,000+ income range is the most frequent in Short Hills, accounting for 72.9% of all households. In contrast, only 14 households (0.3%) fall into the $10,000 to $14,999 income bracket, making it the least populous group.
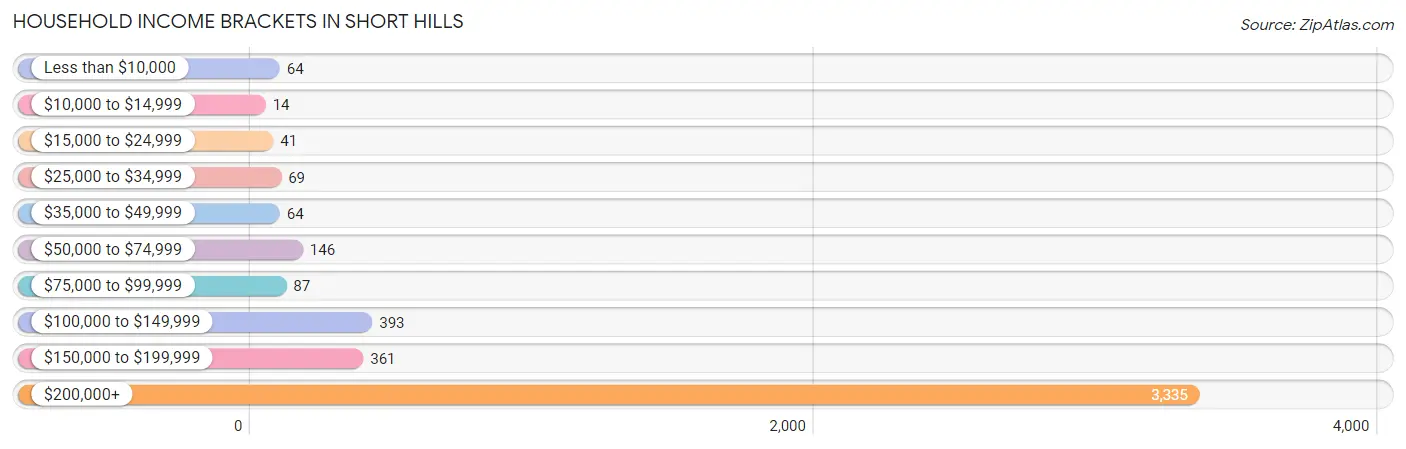
| Income Bracket | # Households | % Households |
| Less than $10,000 | 64 | 1.4% |
| $10,000 to $14,999 | 14 | 0.3% |
| $15,000 to $24,999 | 41 | 0.9% |
| $25,000 to $34,999 | 69 | 1.5% |
| $35,000 to $49,999 | 64 | 1.4% |
| $50,000 to $74,999 | 146 | 3.2% |
| $75,000 to $99,999 | 87 | 1.9% |
| $100,000 to $149,999 | 393 | 8.6% |
| $150,000 to $199,999 | 361 | 7.9% |
| $200,000+ | 3,335 | 72.9% |
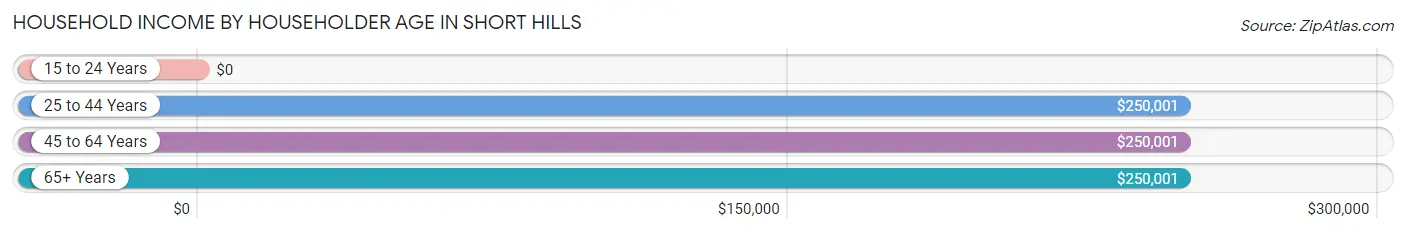
Household Income by Householder Age in Short Hills
The median household income in Short Hills is $250,001, with the highest median household income of $250,001 found in the 25 to 44 years age bracket for the primary householder. A total of 1,249 households (27.3%) fall into this category. Meanwhile, the 15 to 24 years age bracket for the primary householder has the lowest median household income of $0, with 28 households (0.6%) in this group.
| Income Bracket | # Households | Median Income |
| 15 to 24 Years | 28 (0.6%) | $0 |
| 25 to 44 Years | 1,249 (27.3%) | $250,001 |
| 45 to 64 Years | 2,443 (53.4%) | $250,001 |
| 65+ Years | 855 (18.7%) | $250,001 |
| Total | 4,575 (100.0%) | $250,001 |
Poverty in Short Hills
Income Below Poverty by Sex and Age in Short Hills
With 4.1% poverty level for males and 3.8% for females among the residents of Short Hills, 25 to 34 year old males and 18 to 24 year old females are the most vulnerable to poverty, with 47 males (21.5%) and 71 females (19.7%) in their respective age groups living below the poverty level.
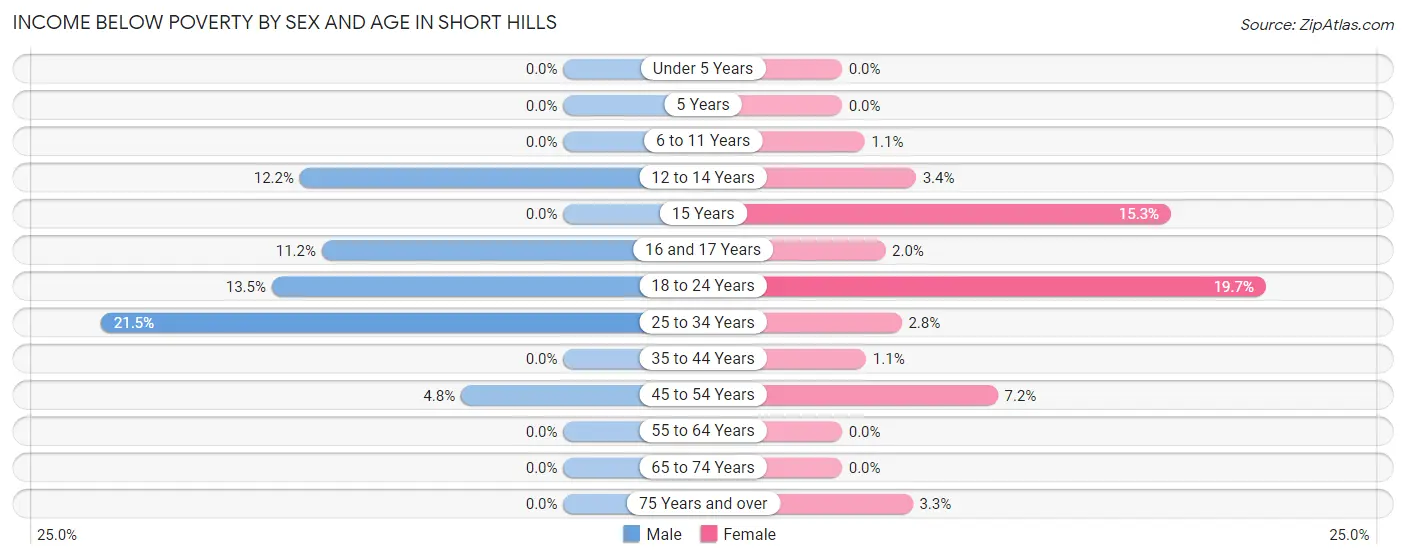
| Age Bracket | Male | Female |
| Under 5 Years | 0 (0.0%) | 0 (0.0%) |
| 5 Years | 0 (0.0%) | 0 (0.0%) |
| 6 to 11 Years | 0 (0.0%) | 8 (1.1%) |
| 12 to 14 Years | 69 (12.2%) | 21 (3.4%) |
| 15 Years | 0 (0.0%) | 31 (15.3%) |
| 16 and 17 Years | 39 (11.2%) | 7 (2.0%) |
| 18 to 24 Years | 64 (13.5%) | 71 (19.7%) |
| 25 to 34 Years | 47 (21.5%) | 11 (2.8%) |
| 35 to 44 Years | 0 (0.0%) | 12 (1.1%) |
| 45 to 54 Years | 78 (4.8%) | 101 (7.2%) |
| 55 to 64 Years | 0 (0.0%) | 0 (0.0%) |
| 65 to 74 Years | 0 (0.0%) | 0 (0.0%) |
| 75 Years and over | 0 (0.0%) | 10 (3.3%) |
| Total | 297 (4.1%) | 272 (3.8%) |
Income Above Poverty by Sex and Age in Short Hills
According to the poverty statistics in Short Hills, males aged under 5 years and females aged under 5 years are the age groups that are most secure financially, with 100.0% of males and 100.0% of females in these age groups living above the poverty line.
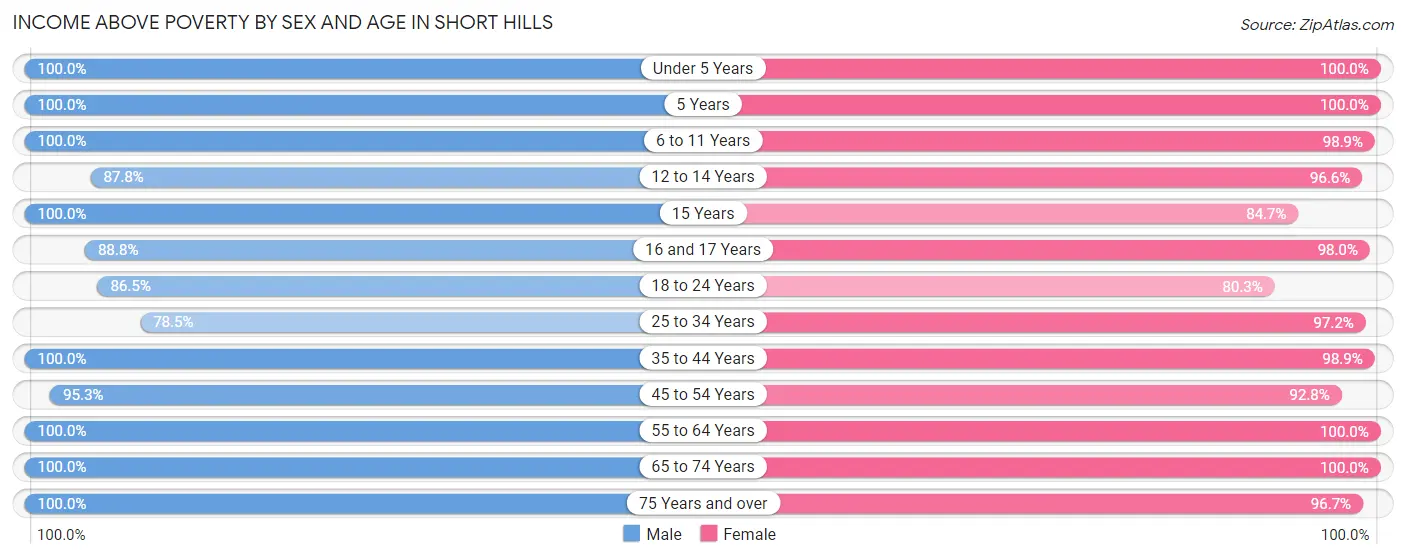
| Age Bracket | Male | Female |
| Under 5 Years | 472 (100.0%) | 306 (100.0%) |
| 5 Years | 104 (100.0%) | 54 (100.0%) |
| 6 to 11 Years | 793 (100.0%) | 749 (98.9%) |
| 12 to 14 Years | 495 (87.8%) | 592 (96.6%) |
| 15 Years | 122 (100.0%) | 172 (84.7%) |
| 16 and 17 Years | 309 (88.8%) | 342 (98.0%) |
| 18 to 24 Years | 409 (86.5%) | 290 (80.3%) |
| 25 to 34 Years | 172 (78.5%) | 386 (97.2%) |
| 35 to 44 Years | 1,007 (100.0%) | 1,060 (98.9%) |
| 45 to 54 Years | 1,564 (95.3%) | 1,296 (92.8%) |
| 55 to 64 Years | 732 (100.0%) | 767 (100.0%) |
| 65 to 74 Years | 497 (100.0%) | 614 (100.0%) |
| 75 Years and over | 280 (100.0%) | 295 (96.7%) |
| Total | 6,956 (95.9%) | 6,923 (96.2%) |
Income Below Poverty Among Married-Couple Families in Short Hills
The poverty statistics for married-couple families in Short Hills show that 1.7% or 64 of the total 3,801 families live below the poverty line. Families with 3 or 4 children have the highest poverty rate of 2.9%, comprising of 9 families. On the other hand, families with no children have the lowest poverty rate of 0.0%, which includes 0 families.
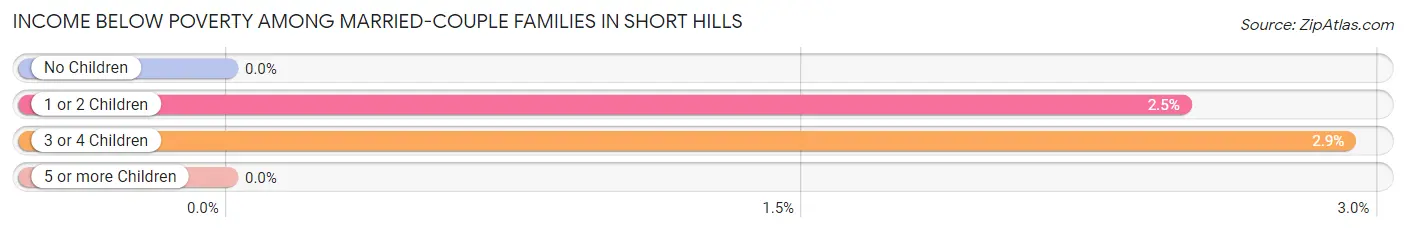
| Children | Above Poverty | Below Poverty |
| No Children | 1,284 (100.0%) | 0 (0.0%) |
| 1 or 2 Children | 2,154 (97.5%) | 55 (2.5%) |
| 3 or 4 Children | 299 (97.1%) | 9 (2.9%) |
| 5 or more Children | 0 (0.0%) | 0 (0.0%) |
| Total | 3,737 (98.3%) | 64 (1.7%) |
Income Below Poverty Among Single-Parent Households in Short Hills
According to the poverty data in Short Hills, 29.6% or 56 single-father households and 8.5% or 14 single-mother households are living below the poverty line. Among single-father households, those with 1 or 2 children have the highest poverty rate, with 56 households (31.6%) experiencing poverty. Likewise, among single-mother households, those with no children have the highest poverty rate, with 4 households (14.3%) falling below the poverty line.
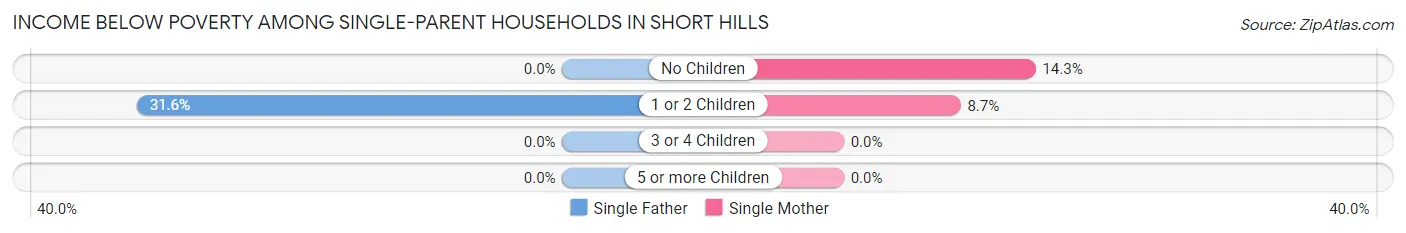
| Children | Single Father | Single Mother |
| No Children | 0 (0.0%) | 4 (14.3%) |
| 1 or 2 Children | 56 (31.6%) | 10 (8.7%) |
| 3 or 4 Children | 0 (0.0%) | 0 (0.0%) |
| 5 or more Children | 0 (0.0%) | 0 (0.0%) |
| Total | 56 (29.6%) | 14 (8.5%) |
Income Below Poverty Among Married-Couple vs Single-Parent Households in Short Hills
The poverty data for Short Hills shows that 64 of the married-couple family households (1.7%) and 70 of the single-parent households (19.8%) are living below the poverty level. Within the married-couple family households, those with 3 or 4 children have the highest poverty rate, with 9 households (2.9%) falling below the poverty line. Among the single-parent households, those with 1 or 2 children have the highest poverty rate, with 66 household (22.6%) living below poverty.
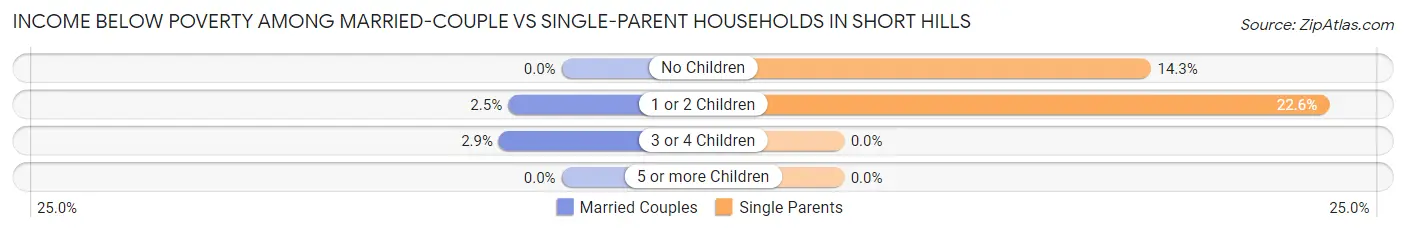
| Children | Married-Couple Families | Single-Parent Households |
| No Children | 0 (0.0%) | 4 (14.3%) |
| 1 or 2 Children | 55 (2.5%) | 66 (22.6%) |
| 3 or 4 Children | 9 (2.9%) | 0 (0.0%) |
| 5 or more Children | 0 (0.0%) | 0 (0.0%) |
| Total | 64 (1.7%) | 70 (19.8%) |
Race in Short Hills
The most populous races in Short Hills are White / Caucasian (7,586 | 52.5%), Asian (5,707 | 39.5%), and Two or more Races (553 | 3.8%).
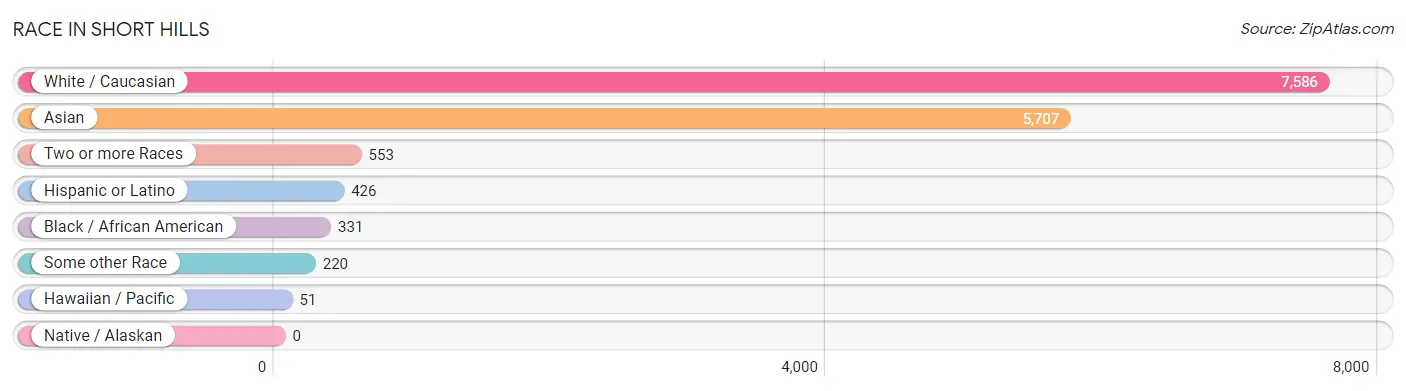
| Race | # Population | % Population |
| Asian | 5,707 | 39.5% |
| Black / African American | 331 | 2.3% |
| Hawaiian / Pacific | 51 | 0.4% |
| Hispanic or Latino | 426 | 2.9% |
| Native / Alaskan | 0 | 0.0% |
| White / Caucasian | 7,586 | 52.5% |
| Two or more Races | 553 | 3.8% |
| Some other Race | 220 | 1.5% |
| Total | 14,448 | 100.0% |
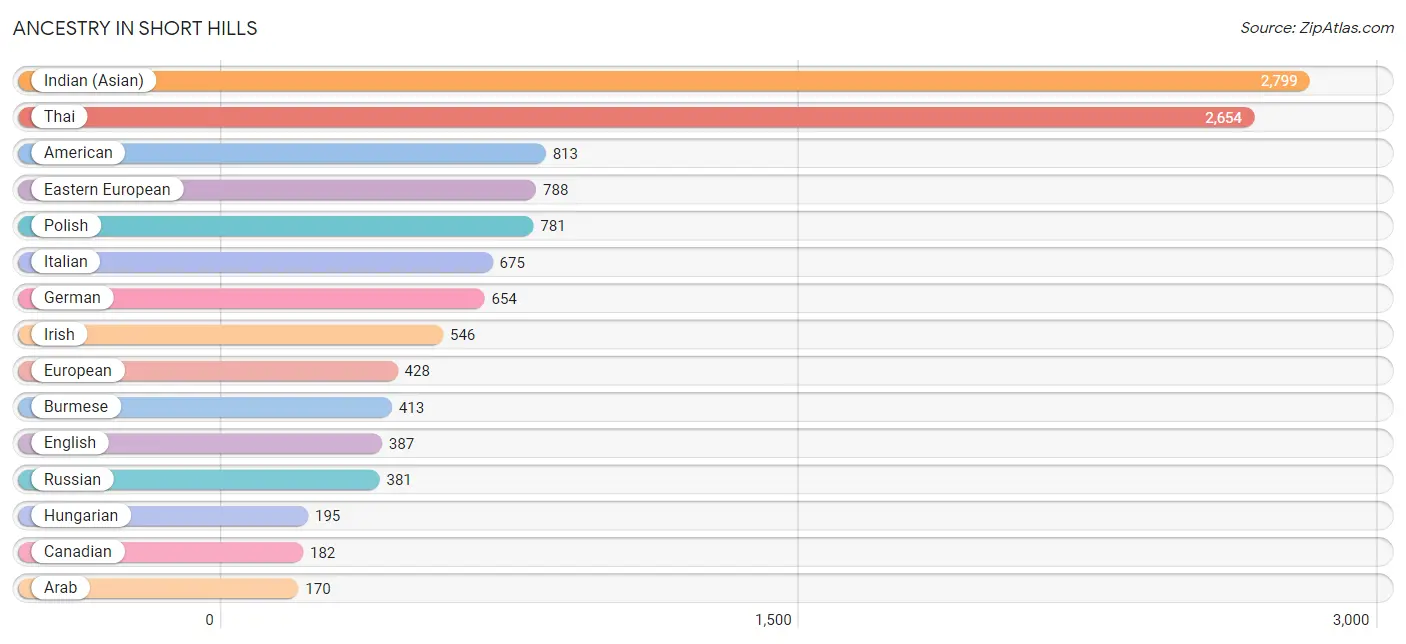
Ancestry in Short Hills
The most populous ancestries reported in Short Hills are Indian (Asian) (2,799 | 19.4%), Thai (2,654 | 18.4%), American (813 | 5.6%), Eastern European (788 | 5.4%), and Polish (781 | 5.4%), together accounting for 54.2% of all Short Hills residents.
| Ancestry | # Population | % Population |
| American | 813 | 5.6% |
| Arab | 170 | 1.2% |
| Argentinean | 29 | 0.2% |
| Australian | 45 | 0.3% |
| Austrian | 8 | 0.1% |
| Belgian | 31 | 0.2% |
| Bhutanese | 19 | 0.1% |
| Brazilian | 40 | 0.3% |
| British | 44 | 0.3% |
| Burmese | 413 | 2.9% |
| Canadian | 182 | 1.3% |
| Cape Verdean | 13 | 0.1% |
| Croatian | 9 | 0.1% |
| Czech | 103 | 0.7% |
| Czechoslovakian | 10 | 0.1% |
| Danish | 42 | 0.3% |
| Dominican | 140 | 1.0% |
| Dutch | 17 | 0.1% |
| Eastern European | 788 | 5.4% |
| Ecuadorian | 25 | 0.2% |
| Egyptian | 56 | 0.4% |
| English | 387 | 2.7% |
| European | 428 | 3.0% |
| Filipino | 57 | 0.4% |
| French | 130 | 0.9% |
| German | 654 | 4.5% |
| Ghanaian | 85 | 0.6% |
| Guyanese | 49 | 0.3% |
| Hungarian | 195 | 1.3% |
| Indian (Asian) | 2,799 | 19.4% |
| Iranian | 36 | 0.3% |
| Irish | 546 | 3.8% |
| Israeli | 22 | 0.2% |
| Italian | 675 | 4.7% |
| Jamaican | 12 | 0.1% |
| Korean | 97 | 0.7% |
| Latvian | 10 | 0.1% |
| Lebanese | 6 | 0.0% |
| Lithuanian | 20 | 0.1% |
| Mexican | 140 | 1.0% |
| Norwegian | 41 | 0.3% |
| Peruvian | 11 | 0.1% |
| Polish | 781 | 5.4% |
| Portuguese | 5 | 0.0% |
| Puerto Rican | 45 | 0.3% |
| Romanian | 77 | 0.5% |
| Russian | 381 | 2.6% |
| Samoan | 51 | 0.4% |
| Scotch-Irish | 36 | 0.3% |
| Scottish | 19 | 0.1% |
| Slovak | 20 | 0.1% |
| South American | 65 | 0.4% |
| Spaniard | 25 | 0.2% |
| Spanish | 11 | 0.1% |
| Subsaharan African | 98 | 0.7% |
| Swedish | 73 | 0.5% |
| Syrian | 92 | 0.6% |
| Thai | 2,654 | 18.4% |
| Ukrainian | 124 | 0.9% |
| Welsh | 7 | 0.1% | View All 60 Rows |
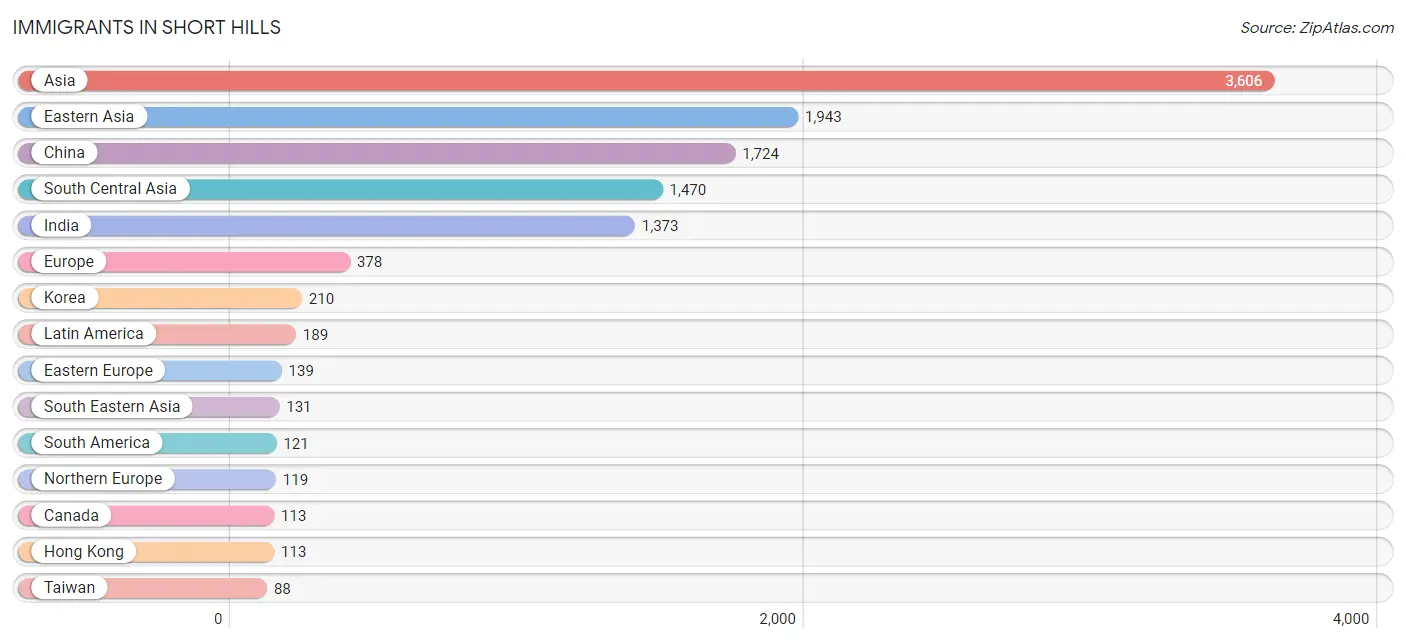
Immigrants in Short Hills
The most numerous immigrant groups reported in Short Hills came from Asia (3,606 | 25.0%), Eastern Asia (1,943 | 13.5%), China (1,724 | 11.9%), South Central Asia (1,470 | 10.2%), and India (1,373 | 9.5%), together accounting for 70.0% of all Short Hills residents.
| Immigration Origin | # Population | % Population |
| Africa | 75 | 0.5% |
| Argentina | 23 | 0.2% |
| Asia | 3,606 | 25.0% |
| Australia | 17 | 0.1% |
| Brazil | 49 | 0.3% |
| Canada | 113 | 0.8% |
| Central America | 68 | 0.5% |
| China | 1,724 | 11.9% |
| Croatia | 9 | 0.1% |
| Czechoslovakia | 34 | 0.2% |
| Denmark | 26 | 0.2% |
| Eastern Asia | 1,943 | 13.5% |
| Eastern Europe | 139 | 1.0% |
| Ecuador | 10 | 0.1% |
| Egypt | 22 | 0.2% |
| England | 7 | 0.1% |
| Europe | 378 | 2.6% |
| France | 76 | 0.5% |
| Germany | 4 | 0.0% |
| Ghana | 40 | 0.3% |
| Guyana | 26 | 0.2% |
| Hong Kong | 113 | 0.8% |
| Hungary | 24 | 0.2% |
| India | 1,373 | 9.5% |
| Indonesia | 10 | 0.1% |
| Iran | 22 | 0.2% |
| Ireland | 32 | 0.2% |
| Israel | 43 | 0.3% |
| Italy | 32 | 0.2% |
| Japan | 9 | 0.1% |
| Korea | 210 | 1.5% |
| Latin America | 189 | 1.3% |
| Latvia | 10 | 0.1% |
| Malaysia | 13 | 0.1% |
| Mexico | 68 | 0.5% |
| Middle Africa | 13 | 0.1% |
| Netherlands | 8 | 0.1% |
| Northern Africa | 22 | 0.2% |
| Northern Europe | 119 | 0.8% |
| Norway | 13 | 0.1% |
| Oceania | 17 | 0.1% |
| Pakistan | 64 | 0.4% |
| Philippines | 43 | 0.3% |
| Poland | 29 | 0.2% |
| Russia | 24 | 0.2% |
| Singapore | 58 | 0.4% |
| South America | 121 | 0.8% |
| South Central Asia | 1,470 | 10.2% |
| South Eastern Asia | 131 | 0.9% |
| Southern Europe | 32 | 0.2% |
| Taiwan | 88 | 0.6% |
| Ukraine | 9 | 0.1% |
| Uzbekistan | 11 | 0.1% |
| Venezuela | 13 | 0.1% |
| Vietnam | 7 | 0.1% |
| Western Africa | 40 | 0.3% |
| Western Asia | 62 | 0.4% |
| Western Europe | 88 | 0.6% | View All 58 Rows |
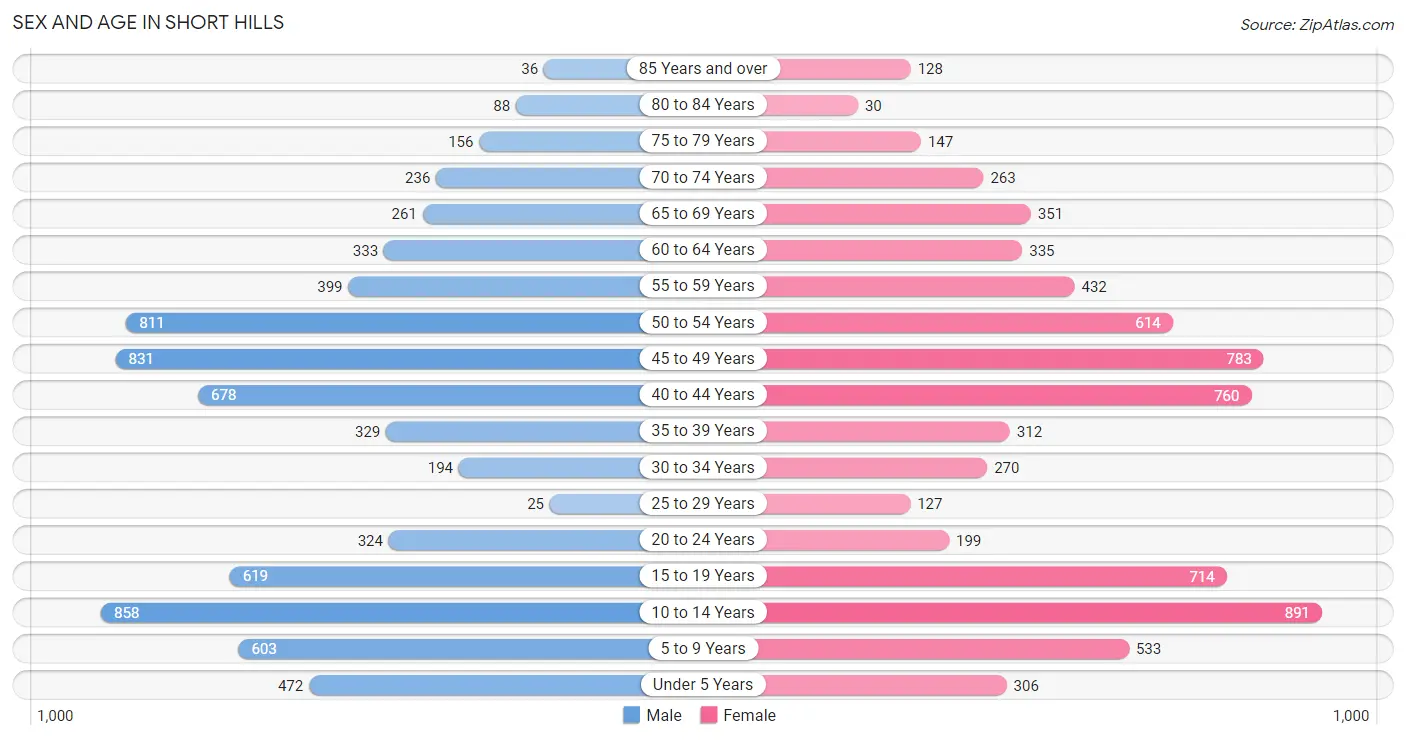
Sex and Age in Short Hills
Sex and Age in Short Hills
The most populous age groups in Short Hills are 10 to 14 Years (858 | 11.8%) for men and 10 to 14 Years (891 | 12.4%) for women.
| Age Bracket | Male | Female |
| Under 5 Years | 472 (6.5%) | 306 (4.3%) |
| 5 to 9 Years | 603 (8.3%) | 533 (7.4%) |
| 10 to 14 Years | 858 (11.8%) | 891 (12.4%) |
| 15 to 19 Years | 619 (8.5%) | 714 (9.9%) |
| 20 to 24 Years | 324 (4.5%) | 199 (2.8%) |
| 25 to 29 Years | 25 (0.3%) | 127 (1.8%) |
| 30 to 34 Years | 194 (2.7%) | 270 (3.7%) |
| 35 to 39 Years | 329 (4.5%) | 312 (4.3%) |
| 40 to 44 Years | 678 (9.3%) | 760 (10.6%) |
| 45 to 49 Years | 831 (11.5%) | 783 (10.9%) |
| 50 to 54 Years | 811 (11.2%) | 614 (8.5%) |
| 55 to 59 Years | 399 (5.5%) | 432 (6.0%) |
| 60 to 64 Years | 333 (4.6%) | 335 (4.7%) |
| 65 to 69 Years | 261 (3.6%) | 351 (4.9%) |
| 70 to 74 Years | 236 (3.3%) | 263 (3.7%) |
| 75 to 79 Years | 156 (2.1%) | 147 (2.0%) |
| 80 to 84 Years | 88 (1.2%) | 30 (0.4%) |
| 85 Years and over | 36 (0.5%) | 128 (1.8%) |
| Total | 7,253 (100.0%) | 7,195 (100.0%) |
Families and Households in Short Hills
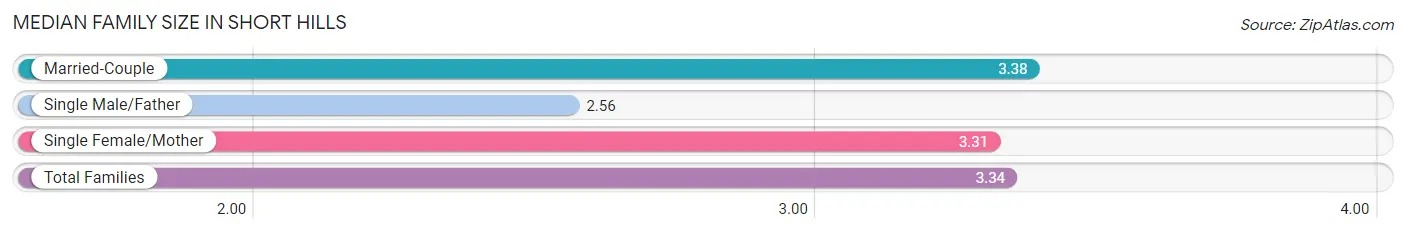
Median Family Size in Short Hills
The median family size in Short Hills is 3.34 persons per family, with married-couple families (3,801 | 91.5%) accounting for the largest median family size of 3.38 persons per family. On the other hand, single male/father families (189 | 4.5%) represent the smallest median family size with 2.56 persons per family.
| Family Type | # Families | Family Size |
| Married-Couple | 3,801 (91.5%) | 3.38 |
| Single Male/Father | 189 (4.5%) | 2.56 |
| Single Female/Mother | 164 (4.0%) | 3.31 |
| Total Families | 4,154 (100.0%) | 3.34 |
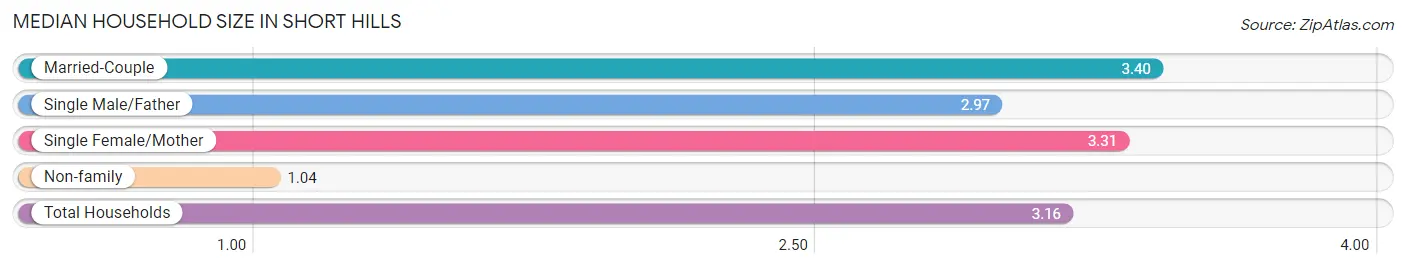
Median Household Size in Short Hills
The median household size in Short Hills is 3.16 persons per household, with married-couple households (3,801 | 83.1%) accounting for the largest median household size of 3.4 persons per household. non-family households (421 | 9.2%) represent the smallest median household size with 1.04 persons per household.
| Household Type | # Households | Household Size |
| Married-Couple | 3,801 (83.1%) | 3.40 |
| Single Male/Father | 189 (4.1%) | 2.97 |
| Single Female/Mother | 164 (3.6%) | 3.31 |
| Non-family | 421 (9.2%) | 1.04 |
| Total Households | 4,575 (100.0%) | 3.16 |
Household Size by Marriage Status in Short Hills
Out of a total of 4,575 households in Short Hills, 4,154 (90.8%) are family households, while 421 (9.2%) are nonfamily households. The most numerous type of family households are 4-person households, comprising 1,529, and the most common type of nonfamily households are 1-person households, comprising 402.
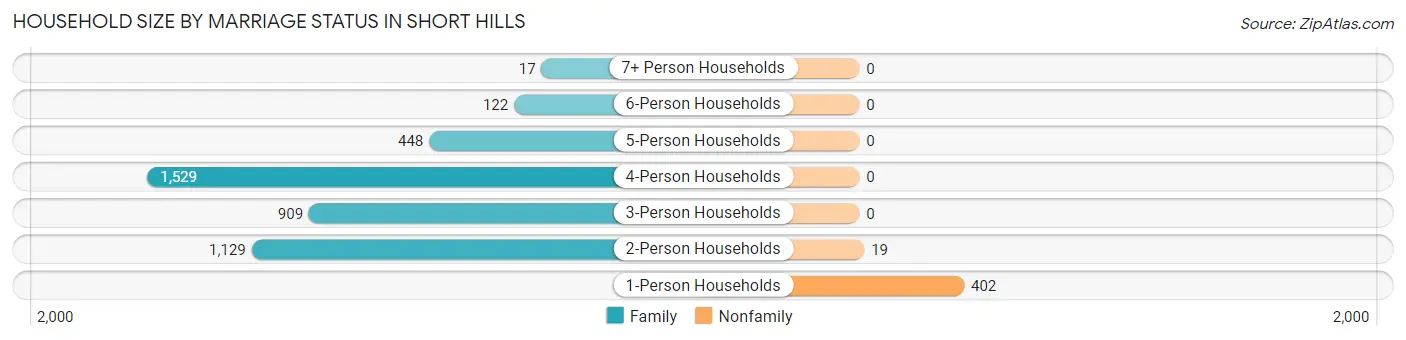
| Household Size | Family Households | Nonfamily Households |
| 1-Person Households | - | 402 (8.8%) |
| 2-Person Households | 1,129 (24.7%) | 19 (0.4%) |
| 3-Person Households | 909 (19.9%) | 0 (0.0%) |
| 4-Person Households | 1,529 (33.4%) | 0 (0.0%) |
| 5-Person Households | 448 (9.8%) | 0 (0.0%) |
| 6-Person Households | 122 (2.7%) | 0 (0.0%) |
| 7+ Person Households | 17 (0.4%) | 0 (0.0%) |
| Total | 4,154 (90.8%) | 421 (9.2%) |
Female Fertility in Short Hills
Fertility by Age in Short Hills
Average fertility rate in Short Hills is 47.0 births per 1,000 women. Women in the age bracket of 20 to 34 years have the highest fertility rate with 77.0 births per 1,000 women. Women in the age bracket of 35 to 50 years acount for 70.1% of all women with births.
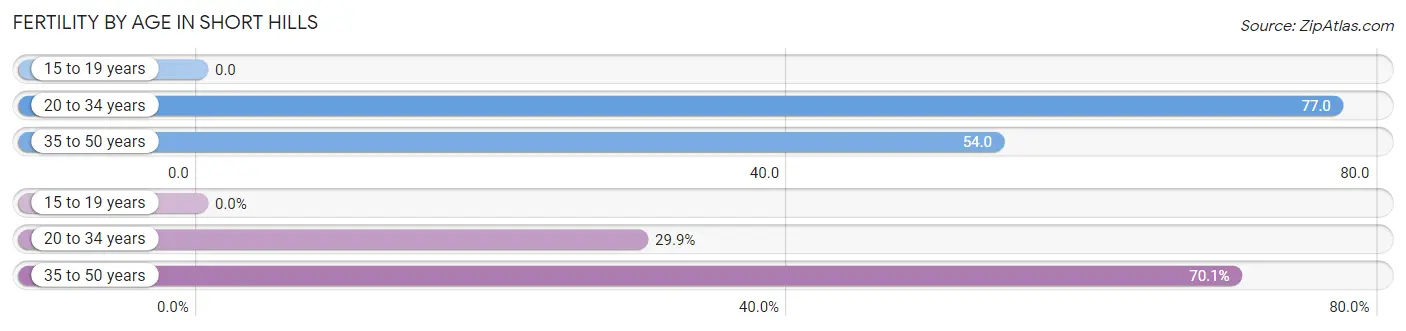
| Age Bracket | Women with Births | Births / 1,000 Women |
| 15 to 19 years | 0 (0.0%) | 0.0 |
| 20 to 34 years | 46 (29.9%) | 77.0 |
| 35 to 50 years | 108 (70.1%) | 54.0 |
| Total | 154 (100.0%) | 47.0 |
Fertility by Age by Marriage Status in Short Hills
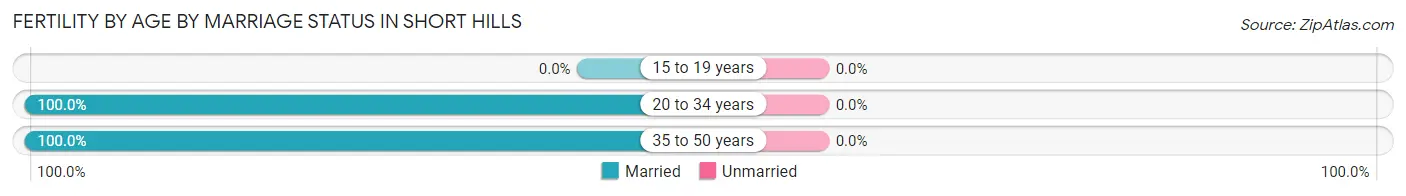
| Age Bracket | Married | Unmarried |
| 15 to 19 years | 0 (0.0%) | 0 (0.0%) |
| 20 to 34 years | 46 (100.0%) | 0 (0.0%) |
| 35 to 50 years | 108 (100.0%) | 0 (0.0%) |
| Total | 154 (100.0%) | 0 (0.0%) |
Fertility by Education in Short Hills
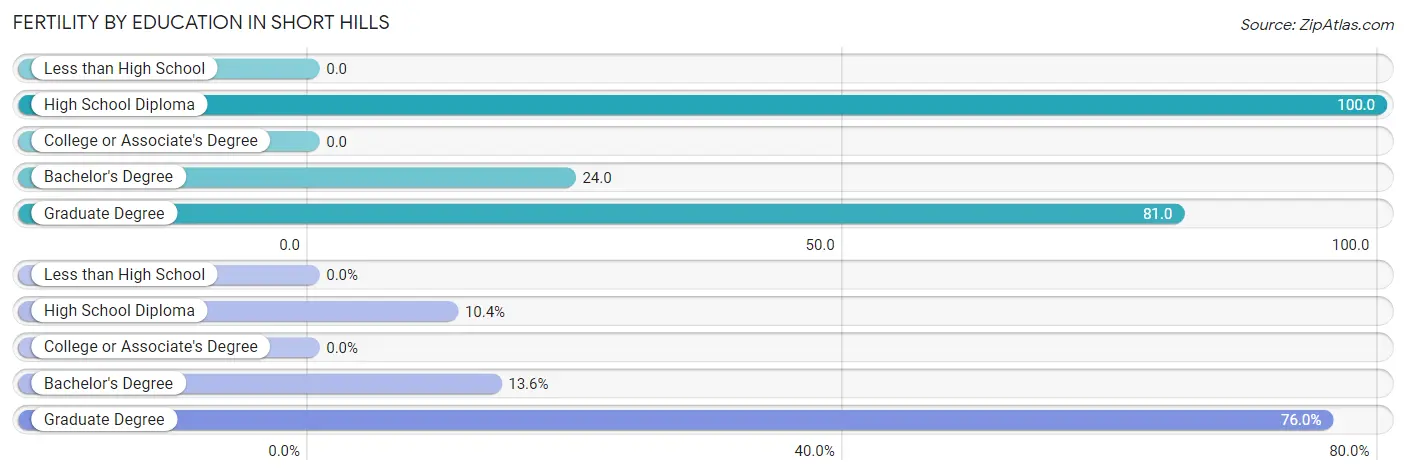
| Educational Attainment | Women with Births | Births / 1,000 Women |
| Less than High School | 0 (0.0%) | 0.0 |
| High School Diploma | 16 (10.4%) | 100.0 |
| College or Associate's Degree | 0 (0.0%) | 0.0 |
| Bachelor's Degree | 21 (13.6%) | 24.0 |
| Graduate Degree | 117 (76.0%) | 81.0 |
| Total | 154 (100.0%) | 47.0 |
Fertility by Education by Marriage Status in Short Hills
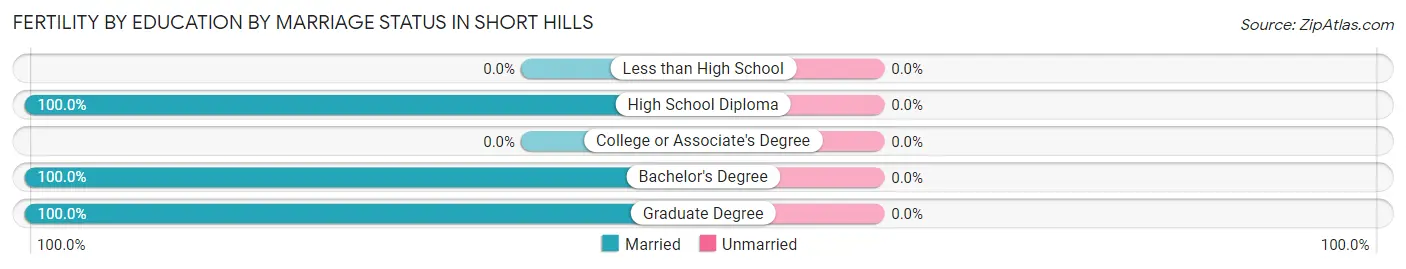
| Educational Attainment | Married | Unmarried |
| Less than High School | 0 (0.0%) | 0 (0.0%) |
| High School Diploma | 16 (100.0%) | 0 (0.0%) |
| College or Associate's Degree | 0 (0.0%) | 0 (0.0%) |
| Bachelor's Degree | 21 (100.0%) | 0 (0.0%) |
| Graduate Degree | 117 (100.0%) | 0 (0.0%) |
| Total | 154 (100.0%) | 0 (0.0%) |
Employment Characteristics in Short Hills
Employment by Class of Employer in Short Hills
Among the 6,437 employed individuals in Short Hills, private company employees (4,752 | 73.8%), self-employed (incorporated) (544 | 8.5%), and not-for-profit organizations (507 | 7.9%) make up the most common classes of employment.
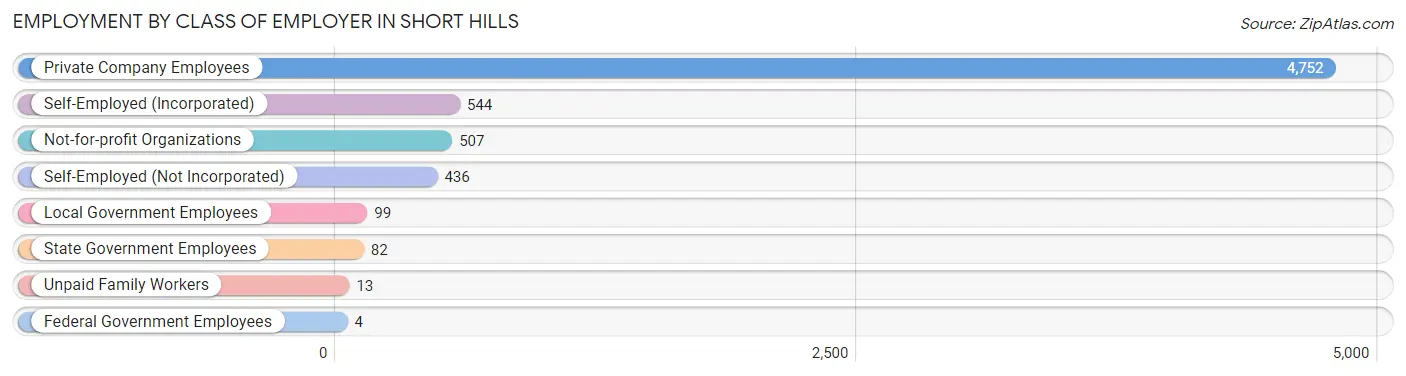
| Employer Class | # Employees | % Employees |
| Private Company Employees | 4,752 | 73.8% |
| Self-Employed (Incorporated) | 544 | 8.5% |
| Self-Employed (Not Incorporated) | 436 | 6.8% |
| Not-for-profit Organizations | 507 | 7.9% |
| Local Government Employees | 99 | 1.5% |
| State Government Employees | 82 | 1.3% |
| Federal Government Employees | 4 | 0.1% |
| Unpaid Family Workers | 13 | 0.2% |
| Total | 6,437 | 100.0% |
Employment Status by Age in Short Hills
According to the labor force statistics for Short Hills, out of the total population over 16 years of age (10,460), 65.4% or 6,841 individuals are in the labor force, with 4.8% or 328 of them unemployed. The age group with the highest labor force participation rate is 35 to 44 years, with 87.6% or 1,821 individuals in the labor force. Within the labor force, the 20 to 24 years age range has the highest percentage of unemployed individuals, with 23.4% or 65 of them being unemployed.

| Age Bracket | In Labor Force | Unemployed |
| 16 to 19 Years | 142 (14.1%) | 30 (21.1%) |
| 20 to 24 Years | 278 (53.2%) | 65 (23.4%) |
| 25 to 29 Years | 105 (69.1%) | 0 (0.0%) |
| 30 to 34 Years | 332 (71.6%) | 47 (14.2%) |
| 35 to 44 Years | 1,821 (87.6%) | 29 (1.6%) |
| 45 to 54 Years | 2,456 (80.8%) | 96 (3.9%) |
| 55 to 59 Years | 638 (76.8%) | 32 (5.0%) |
| 60 to 64 Years | 467 (69.9%) | 0 (0.0%) |
| 65 to 74 Years | 509 (45.8%) | 18 (3.5%) |
| 75 Years and over | 90 (15.4%) | 10 (11.1%) |
| Total | 6,841 (65.4%) | 328 (4.8%) |
Employment Status by Educational Attainment in Short Hills
According to labor force statistics for Short Hills, 80.4% of individuals (5,815) out of the total population between 25 and 64 years of age (7,233) are in the labor force, with 3.5% or 204 of them being unemployed. The group with the highest labor force participation rate are those with the educational attainment of bachelor's degree or higher, with 81.3% or 5,345 individuals in the labor force. Within the labor force, individuals with high school diploma education have the highest percentage of unemployment, with 30.9% or 47 of them being unemployed.
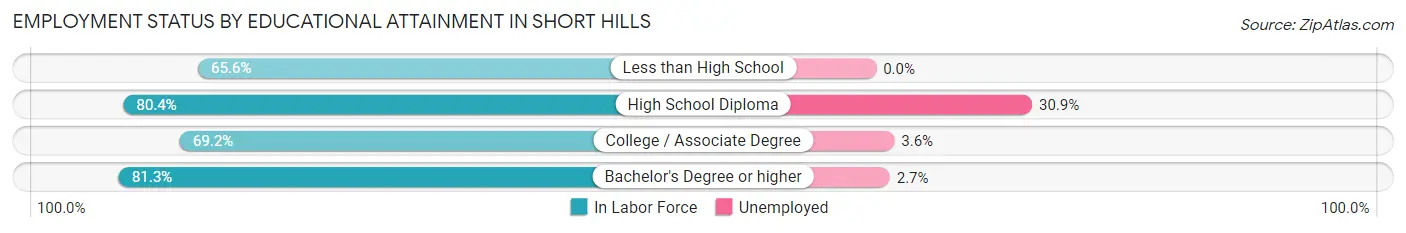
| Educational Attainment | In Labor Force | Unemployed |
| Less than High School | 21 (65.6%) | 0 (0.0%) |
| High School Diploma | 152 (80.4%) | 58 (30.9%) |
| College / Associate Degree | 303 (69.2%) | 16 (3.6%) |
| Bachelor's Degree or higher | 5,345 (81.3%) | 177 (2.7%) |
| Total | 5,815 (80.4%) | 253 (3.5%) |
Employment Occupations by Sex in Short Hills
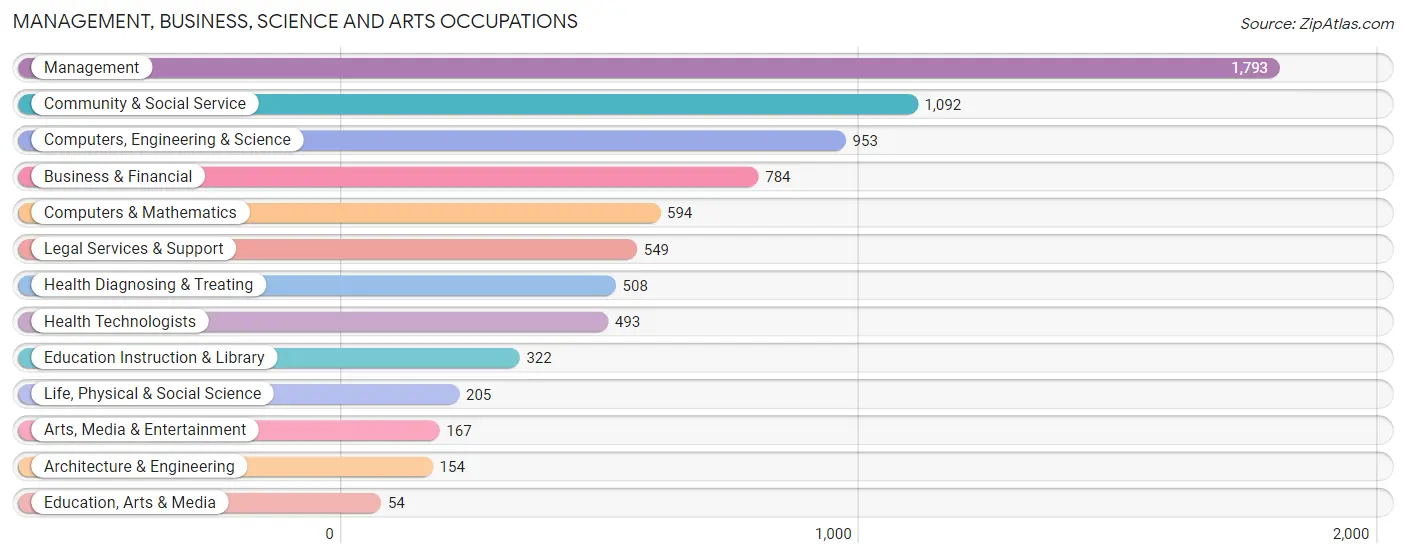
Management, Business, Science and Arts Occupations
The most common Management, Business, Science and Arts occupations in Short Hills are Management (1,793 | 27.5%), Community & Social Service (1,092 | 16.8%), Computers, Engineering & Science (953 | 14.6%), Business & Financial (784 | 12.0%), and Computers & Mathematics (594 | 9.1%).
Management, Business, Science and Arts Occupations by Sex
Within the Management, Business, Science and Arts occupations in Short Hills, the most male-oriented occupations are Management (69.2%), Business & Financial (67.3%), and Computers & Mathematics (64.6%), while the most female-oriented occupations are Education, Arts & Media (81.5%), Education Instruction & Library (75.2%), and Community & Social Service (53.5%).
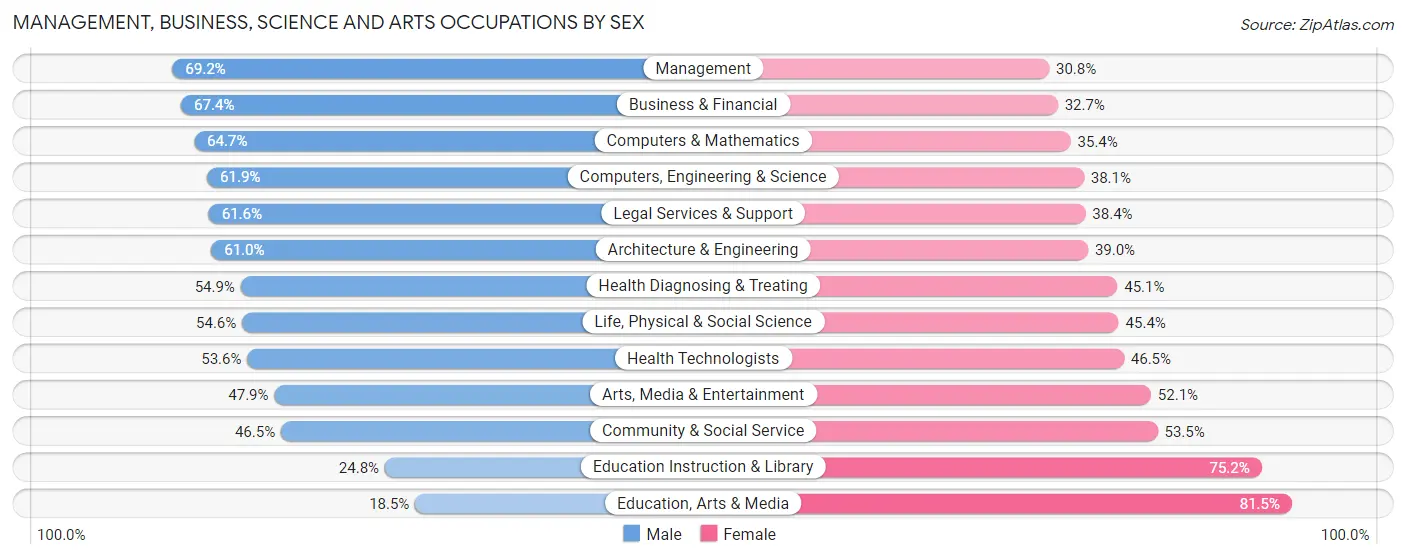
| Occupation | Male | Female |
| Management | 1,240 (69.2%) | 553 (30.8%) |
| Business & Financial | 528 (67.3%) | 256 (32.7%) |
| Computers, Engineering & Science | 590 (61.9%) | 363 (38.1%) |
| Computers & Mathematics | 384 (64.6%) | 210 (35.3%) |
| Architecture & Engineering | 94 (61.0%) | 60 (39.0%) |
| Life, Physical & Social Science | 112 (54.6%) | 93 (45.4%) |
| Community & Social Service | 508 (46.5%) | 584 (53.5%) |
| Education, Arts & Media | 10 (18.5%) | 44 (81.5%) |
| Legal Services & Support | 338 (61.6%) | 211 (38.4%) |
| Education Instruction & Library | 80 (24.8%) | 242 (75.2%) |
| Arts, Media & Entertainment | 80 (47.9%) | 87 (52.1%) |
| Health Diagnosing & Treating | 279 (54.9%) | 229 (45.1%) |
| Health Technologists | 264 (53.5%) | 229 (46.5%) |
| Total (Category) | 3,145 (61.3%) | 1,985 (38.7%) |
| Total (Overall) | 3,909 (60.1%) | 2,601 (40.0%) |
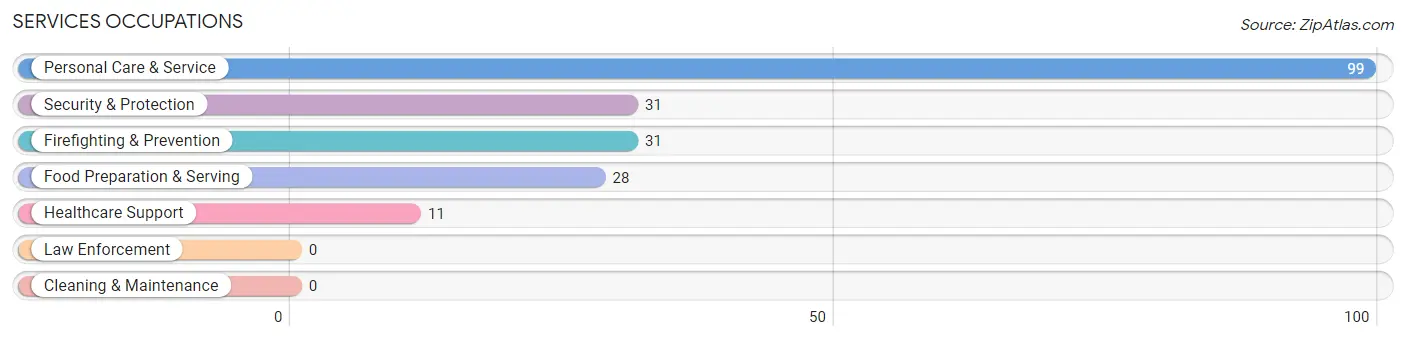
Services Occupations
The most common Services occupations in Short Hills are Personal Care & Service (99 | 1.5%), Security & Protection (31 | 0.5%), Firefighting & Prevention (31 | 0.5%), Food Preparation & Serving (28 | 0.4%), and Healthcare Support (11 | 0.2%).
Services Occupations by Sex
Within the Services occupations in Short Hills, the most male-oriented occupations are Healthcare Support (100.0%), Security & Protection (100.0%), and Firefighting & Prevention (100.0%), while the most female-oriented occupations are Personal Care & Service (80.8%), and Food Preparation & Serving (28.6%).
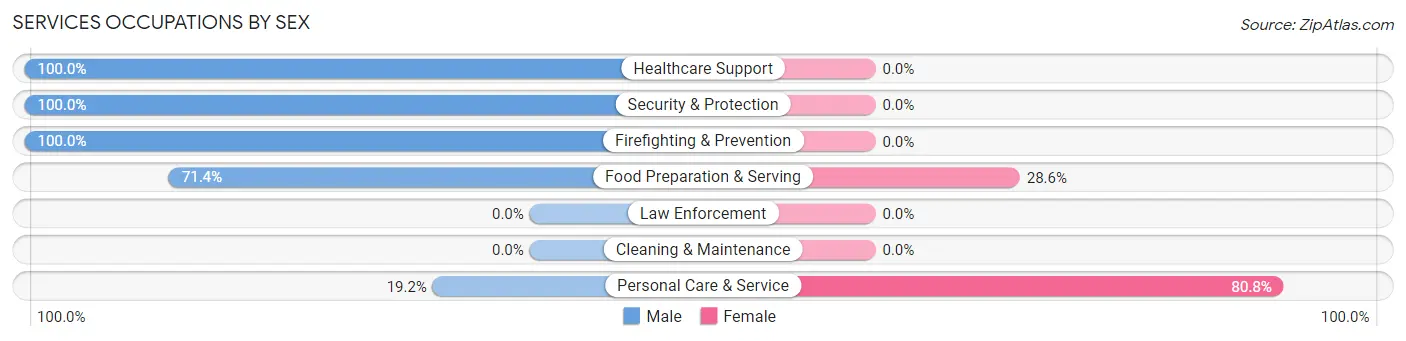
| Occupation | Male | Female |
| Healthcare Support | 11 (100.0%) | 0 (0.0%) |
| Security & Protection | 31 (100.0%) | 0 (0.0%) |
| Firefighting & Prevention | 31 (100.0%) | 0 (0.0%) |
| Law Enforcement | 0 (0.0%) | 0 (0.0%) |
| Food Preparation & Serving | 20 (71.4%) | 8 (28.6%) |
| Cleaning & Maintenance | 0 (0.0%) | 0 (0.0%) |
| Personal Care & Service | 19 (19.2%) | 80 (80.8%) |
| Total (Category) | 81 (47.9%) | 88 (52.1%) |
| Total (Overall) | 3,909 (60.1%) | 2,601 (40.0%) |
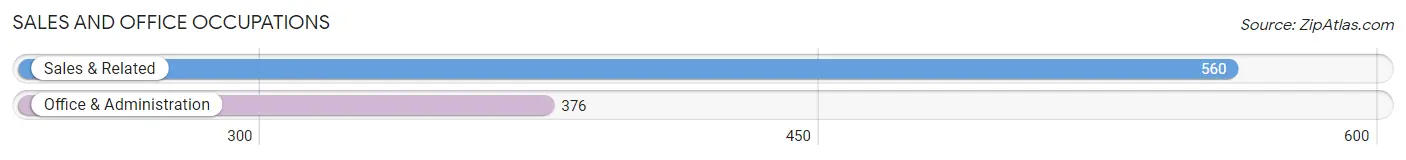
Sales and Office Occupations
The most common Sales and Office occupations in Short Hills are Sales & Related (560 | 8.6%), and Office & Administration (376 | 5.8%).
Sales and Office Occupations by Sex
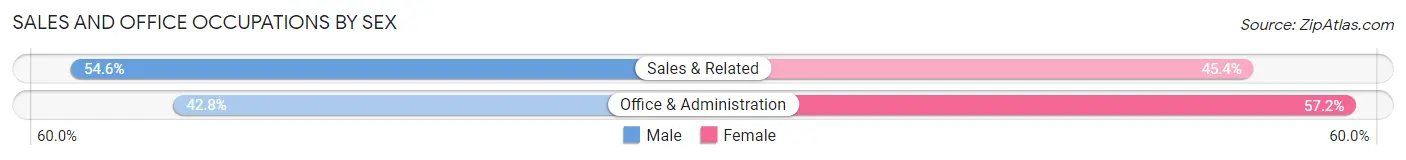
| Occupation | Male | Female |
| Sales & Related | 306 (54.6%) | 254 (45.4%) |
| Office & Administration | 161 (42.8%) | 215 (57.2%) |
| Total (Category) | 467 (49.9%) | 469 (50.1%) |
| Total (Overall) | 3,909 (60.1%) | 2,601 (40.0%) |
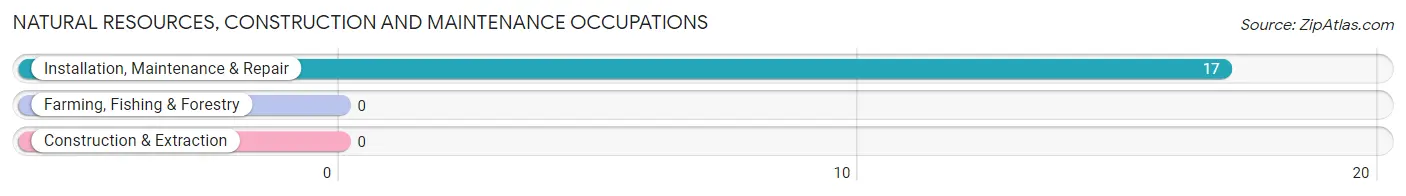
Natural Resources, Construction and Maintenance Occupations
The most common Natural Resources, Construction and Maintenance occupations in Short Hills are , and Installation, Maintenance & Repair (17 | 0.3%).
Natural Resources, Construction and Maintenance Occupations by Sex
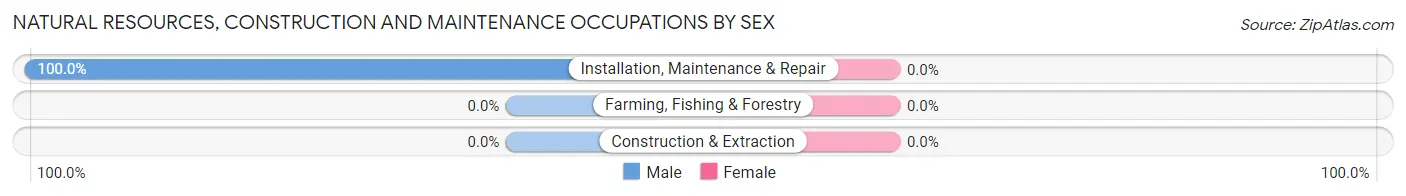
| Occupation | Male | Female |
| Farming, Fishing & Forestry | 0 (0.0%) | 0 (0.0%) |
| Construction & Extraction | 0 (0.0%) | 0 (0.0%) |
| Installation, Maintenance & Repair | 17 (100.0%) | 0 (0.0%) |
| Total (Category) | 17 (100.0%) | 0 (0.0%) |
| Total (Overall) | 3,909 (60.1%) | 2,601 (40.0%) |
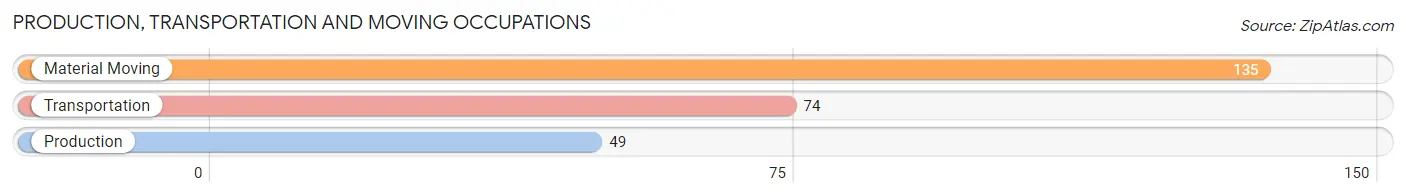
Production, Transportation and Moving Occupations
The most common Production, Transportation and Moving occupations in Short Hills are Material Moving (135 | 2.1%), Transportation (74 | 1.1%), and Production (49 | 0.7%).
Production, Transportation and Moving Occupations by Sex
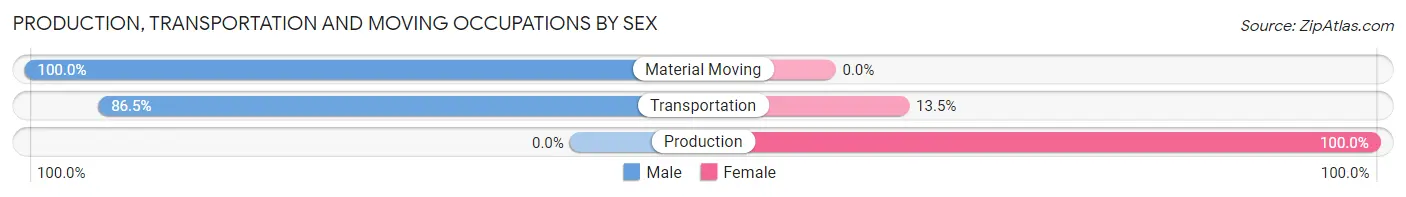
| Occupation | Male | Female |
| Production | 0 (0.0%) | 49 (100.0%) |
| Transportation | 64 (86.5%) | 10 (13.5%) |
| Material Moving | 135 (100.0%) | 0 (0.0%) |
| Total (Category) | 199 (77.1%) | 59 (22.9%) |
| Total (Overall) | 3,909 (60.1%) | 2,601 (40.0%) |
Employment Industries by Sex in Short Hills
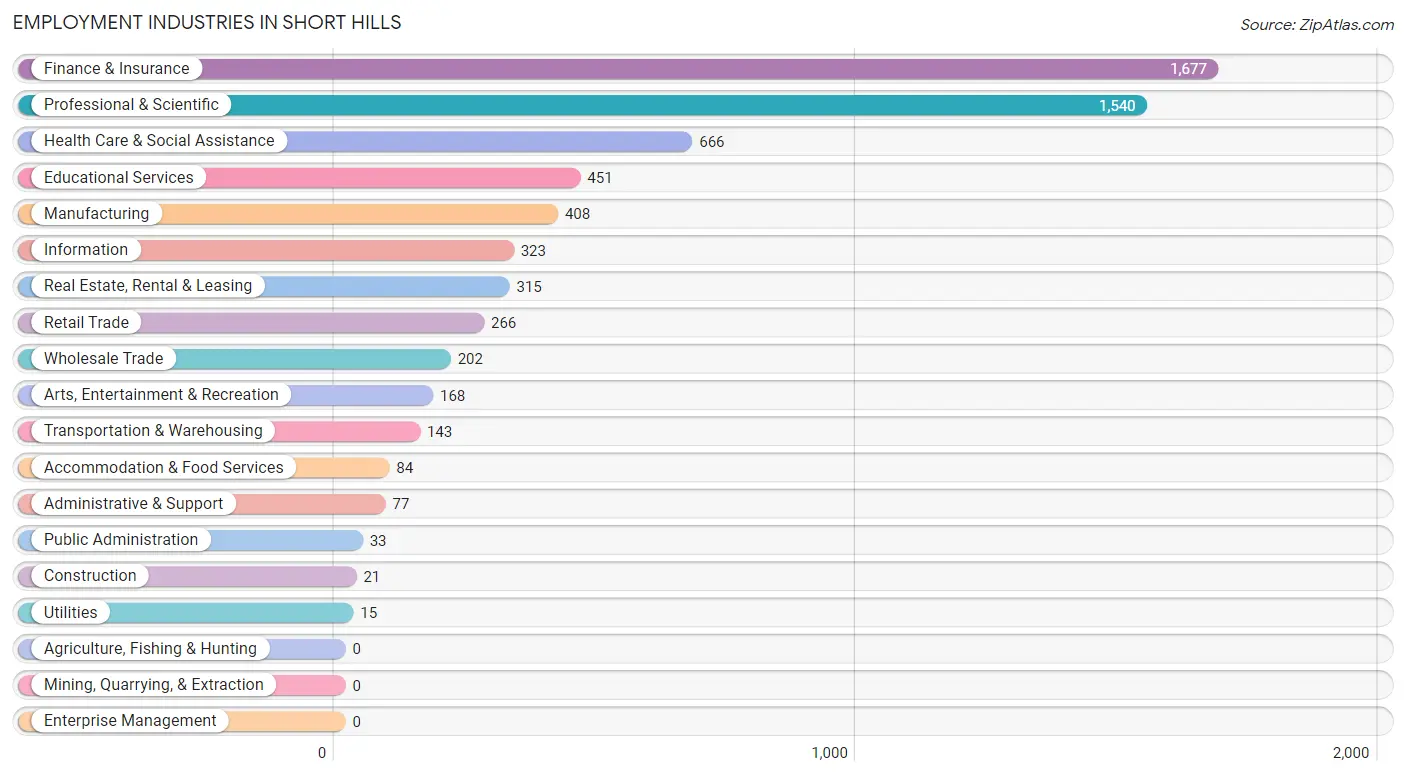
Employment Industries in Short Hills
The major employment industries in Short Hills include Finance & Insurance (1,677 | 25.8%), Professional & Scientific (1,540 | 23.7%), Health Care & Social Assistance (666 | 10.2%), Educational Services (451 | 6.9%), and Manufacturing (408 | 6.3%).
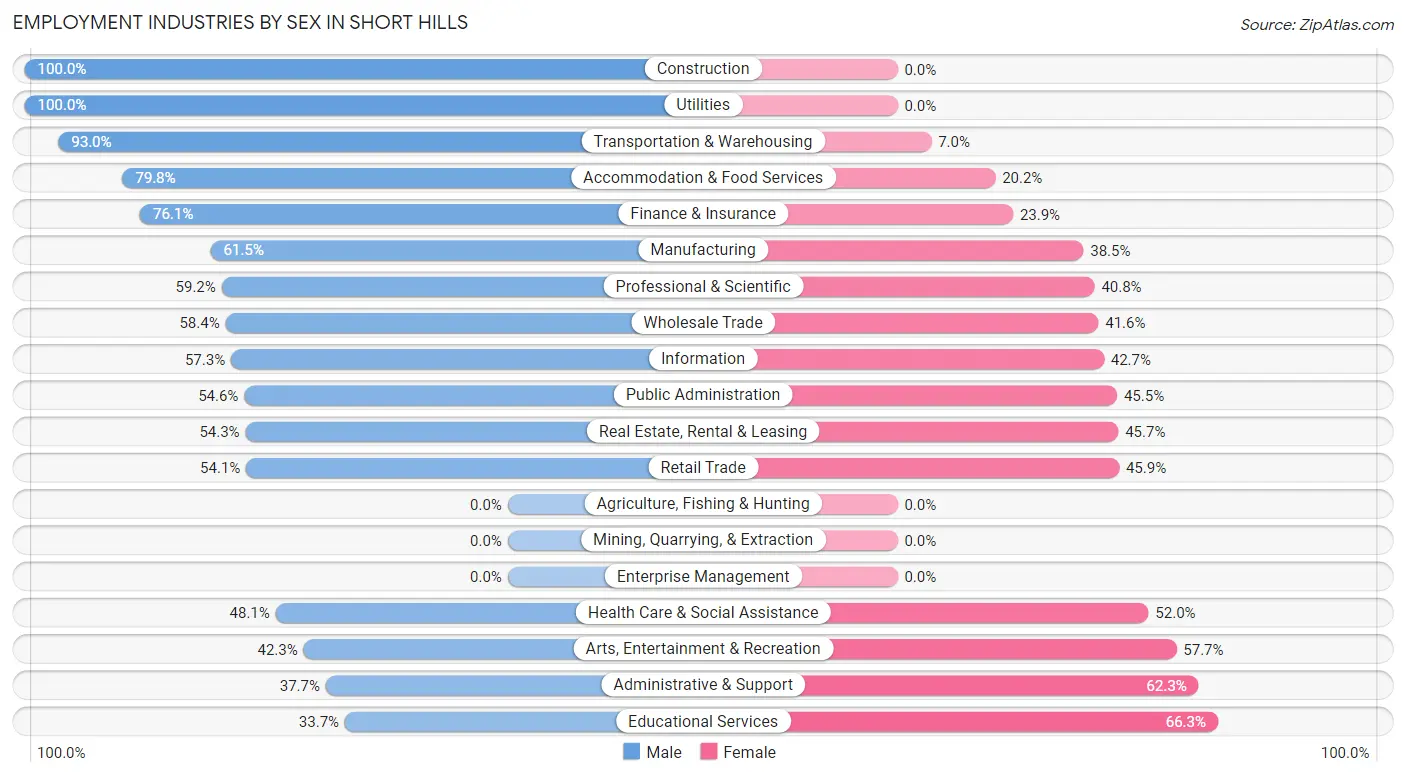
Employment Industries by Sex in Short Hills
The Short Hills industries that see more men than women are Construction (100.0%), Utilities (100.0%), and Transportation & Warehousing (93.0%), whereas the industries that tend to have a higher number of women are Educational Services (66.3%), Administrative & Support (62.3%), and Arts, Entertainment & Recreation (57.7%).
| Industry | Male | Female |
| Agriculture, Fishing & Hunting | 0 (0.0%) | 0 (0.0%) |
| Mining, Quarrying, & Extraction | 0 (0.0%) | 0 (0.0%) |
| Construction | 21 (100.0%) | 0 (0.0%) |
| Manufacturing | 251 (61.5%) | 157 (38.5%) |
| Wholesale Trade | 118 (58.4%) | 84 (41.6%) |
| Retail Trade | 144 (54.1%) | 122 (45.9%) |
| Transportation & Warehousing | 133 (93.0%) | 10 (7.0%) |
| Utilities | 15 (100.0%) | 0 (0.0%) |
| Information | 185 (57.3%) | 138 (42.7%) |
| Finance & Insurance | 1,276 (76.1%) | 401 (23.9%) |
| Real Estate, Rental & Leasing | 171 (54.3%) | 144 (45.7%) |
| Professional & Scientific | 912 (59.2%) | 628 (40.8%) |
| Enterprise Management | 0 (0.0%) | 0 (0.0%) |
| Administrative & Support | 29 (37.7%) | 48 (62.3%) |
| Educational Services | 152 (33.7%) | 299 (66.3%) |
| Health Care & Social Assistance | 320 (48.0%) | 346 (51.9%) |
| Arts, Entertainment & Recreation | 71 (42.3%) | 97 (57.7%) |
| Accommodation & Food Services | 67 (79.8%) | 17 (20.2%) |
| Public Administration | 18 (54.5%) | 15 (45.5%) |
| Total | 3,909 (60.1%) | 2,601 (40.0%) |
Education in Short Hills
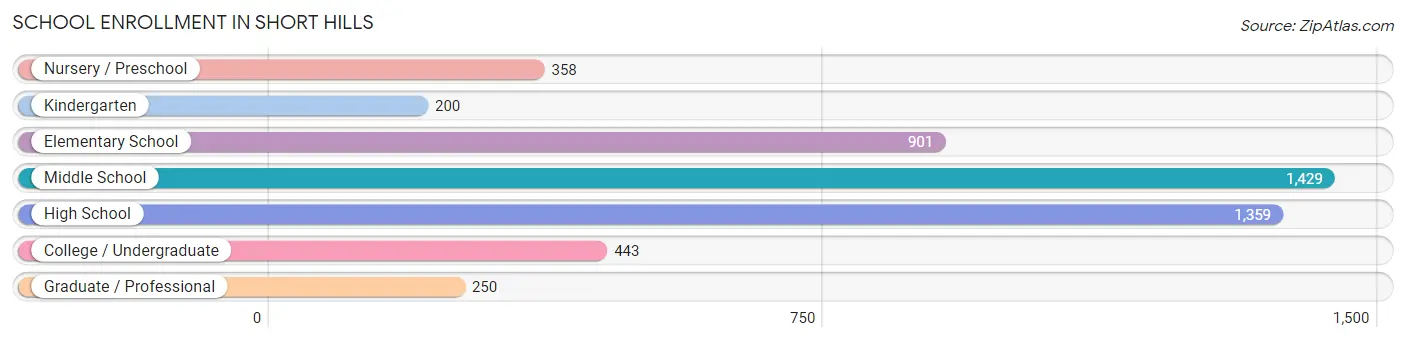
School Enrollment in Short Hills
The most common levels of schooling among the 4,940 students in Short Hills are middle school (1,429 | 28.9%), high school (1,359 | 27.5%), and elementary school (901 | 18.2%).
| School Level | # Students | % Students |
| Nursery / Preschool | 358 | 7.2% |
| Kindergarten | 200 | 4.1% |
| Elementary School | 901 | 18.2% |
| Middle School | 1,429 | 28.9% |
| High School | 1,359 | 27.5% |
| College / Undergraduate | 443 | 9.0% |
| Graduate / Professional | 250 | 5.1% |
| Total | 4,940 | 100.0% |
School Enrollment by Age by Funding Source in Short Hills
Out of a total of 4,940 students who are enrolled in schools in Short Hills, 1,329 (26.9%) attend a private institution, while the remaining 3,611 (73.1%) are enrolled in public schools. The age group of 25 to 34 year olds has the highest likelihood of being enrolled in private schools, with 160 (83.3% in the age bracket) enrolled. Conversely, the age group of 10 to 14 year olds has the lowest likelihood of being enrolled in a private school, with 1,536 (88.2% in the age bracket) attending a public institution.
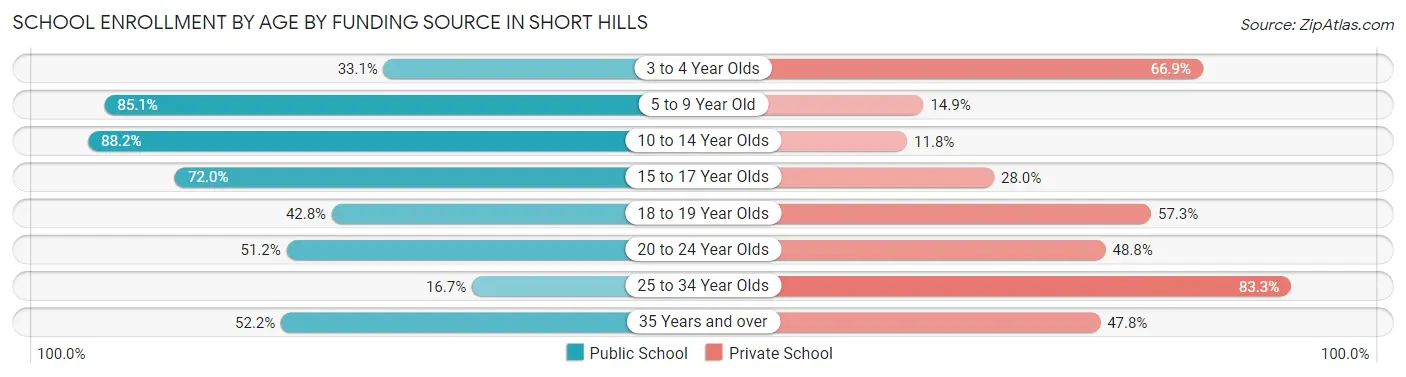
| Age Bracket | Public School | Private School |
| 3 to 4 Year Olds | 99 (33.1%) | 200 (66.9%) |
| 5 to 9 Year Old | 922 (85.1%) | 161 (14.9%) |
| 10 to 14 Year Olds | 1,536 (88.2%) | 206 (11.8%) |
| 15 to 17 Year Olds | 732 (72.0%) | 285 (28.0%) |
| 18 to 19 Year Olds | 115 (42.7%) | 154 (57.3%) |
| 20 to 24 Year Olds | 127 (51.2%) | 121 (48.8%) |
| 25 to 34 Year Olds | 32 (16.7%) | 160 (83.3%) |
| 35 Years and over | 47 (52.2%) | 43 (47.8%) |
| Total | 3,611 (73.1%) | 1,329 (26.9%) |
Educational Attainment by Field of Study in Short Hills
Business (1,562 | 18.5%), social sciences (1,488 | 17.6%), engineering (1,128 | 13.3%), computers & mathematics (663 | 7.8%), and bio, nature & agricultural (581 | 6.9%) are the most common fields of study among 8,454 individuals in Short Hills who have obtained a bachelor's degree or higher.
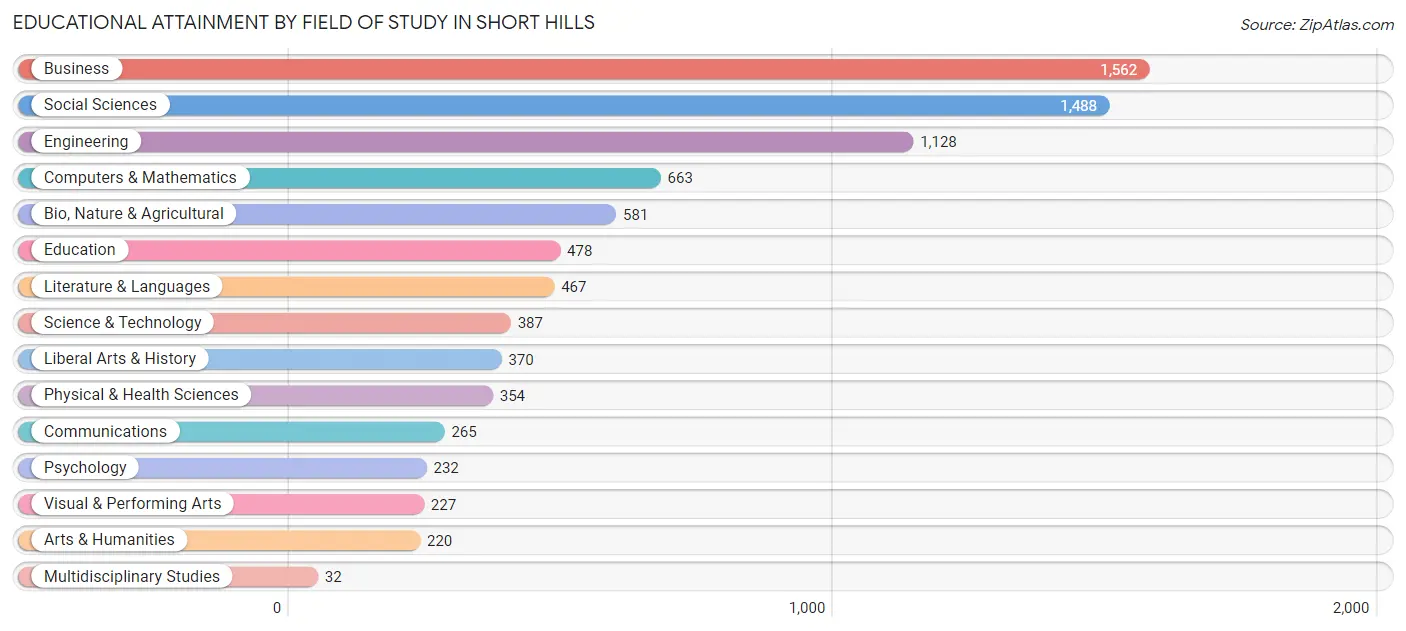
| Field of Study | # Graduates | % Graduates |
| Computers & Mathematics | 663 | 7.8% |
| Bio, Nature & Agricultural | 581 | 6.9% |
| Physical & Health Sciences | 354 | 4.2% |
| Psychology | 232 | 2.7% |
| Social Sciences | 1,488 | 17.6% |
| Engineering | 1,128 | 13.3% |
| Multidisciplinary Studies | 32 | 0.4% |
| Science & Technology | 387 | 4.6% |
| Business | 1,562 | 18.5% |
| Education | 478 | 5.7% |
| Literature & Languages | 467 | 5.5% |
| Liberal Arts & History | 370 | 4.4% |
| Visual & Performing Arts | 227 | 2.7% |
| Communications | 265 | 3.1% |
| Arts & Humanities | 220 | 2.6% |
| Total | 8,454 | 100.0% |
Transportation & Commute in Short Hills
Vehicle Availability by Sex in Short Hills
The most prevalent vehicle ownership categories in Short Hills are males with 2 vehicles (2,233, accounting for 57.3%) and females with 2 vehicles (1,361, making up 88.0%).
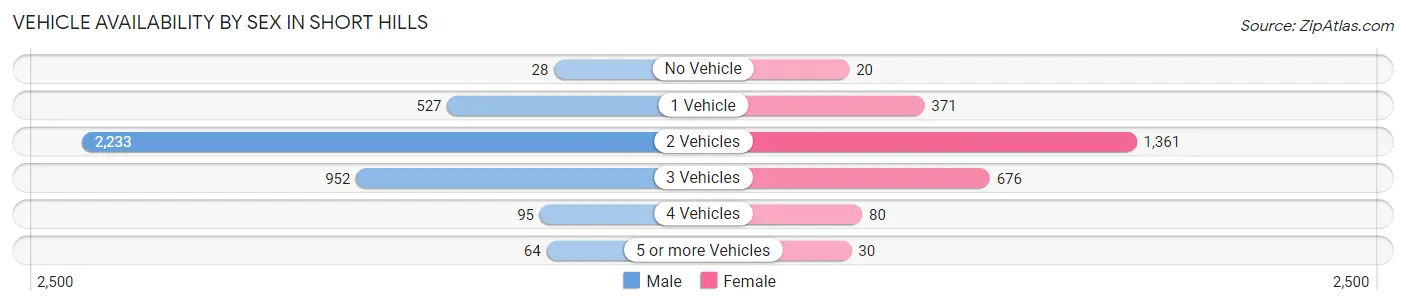
| Vehicles Available | Male | Female |
| No Vehicle | 28 (0.7%) | 20 (0.8%) |
| 1 Vehicle | 527 (13.5%) | 371 (14.6%) |
| 2 Vehicles | 2,233 (57.3%) | 1,361 (53.6%) |
| 3 Vehicles | 952 (24.4%) | 676 (26.6%) |
| 4 Vehicles | 95 (2.4%) | 80 (3.2%) |
| 5 or more Vehicles | 64 (1.6%) | 30 (1.2%) |
| Total | 3,899 (100.0%) | 2,538 (100.0%) |
Commute Time in Short Hills
The most frequently occuring commute durations in Short Hills are 60 to 89 minutes (1,269 commuters, 30.7%), 45 to 59 minutes (549 commuters, 13.3%), and 90 or more minutes (392 commuters, 9.5%).
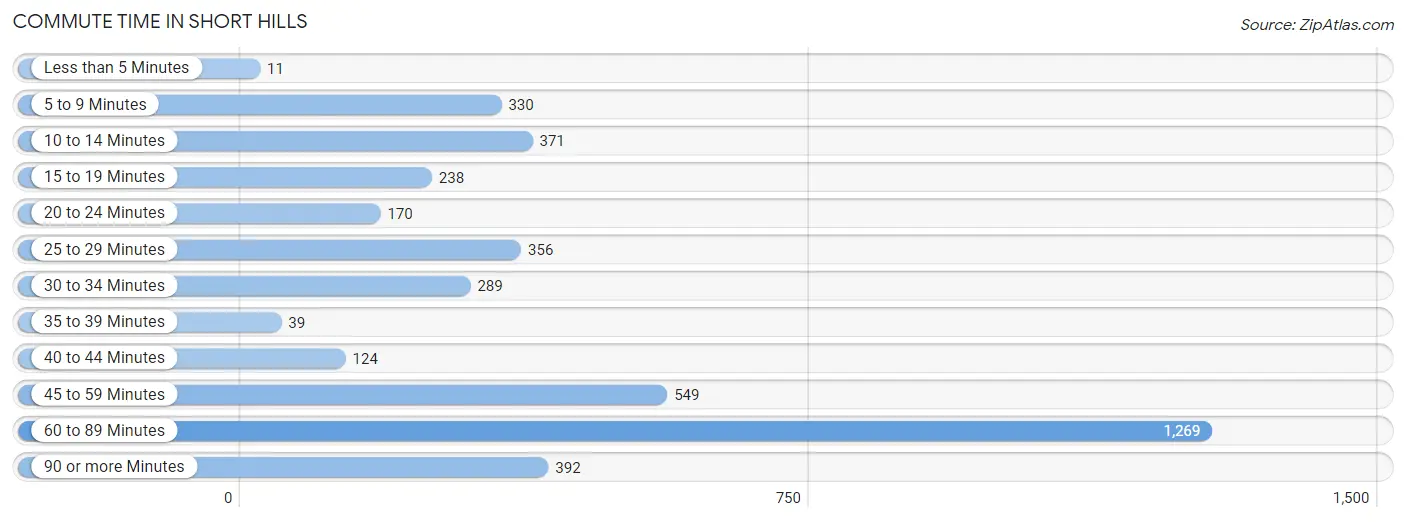
| Commute Time | # Commuters | % Commuters |
| Less than 5 Minutes | 11 | 0.3% |
| 5 to 9 Minutes | 330 | 8.0% |
| 10 to 14 Minutes | 371 | 9.0% |
| 15 to 19 Minutes | 238 | 5.8% |
| 20 to 24 Minutes | 170 | 4.1% |
| 25 to 29 Minutes | 356 | 8.6% |
| 30 to 34 Minutes | 289 | 7.0% |
| 35 to 39 Minutes | 39 | 0.9% |
| 40 to 44 Minutes | 124 | 3.0% |
| 45 to 59 Minutes | 549 | 13.3% |
| 60 to 89 Minutes | 1,269 | 30.7% |
| 90 or more Minutes | 392 | 9.5% |
Commute Time by Sex in Short Hills
The most common commute times in Short Hills are 60 to 89 minutes (830 commuters, 32.4%) for males and 60 to 89 minutes (439 commuters, 27.8%) for females.
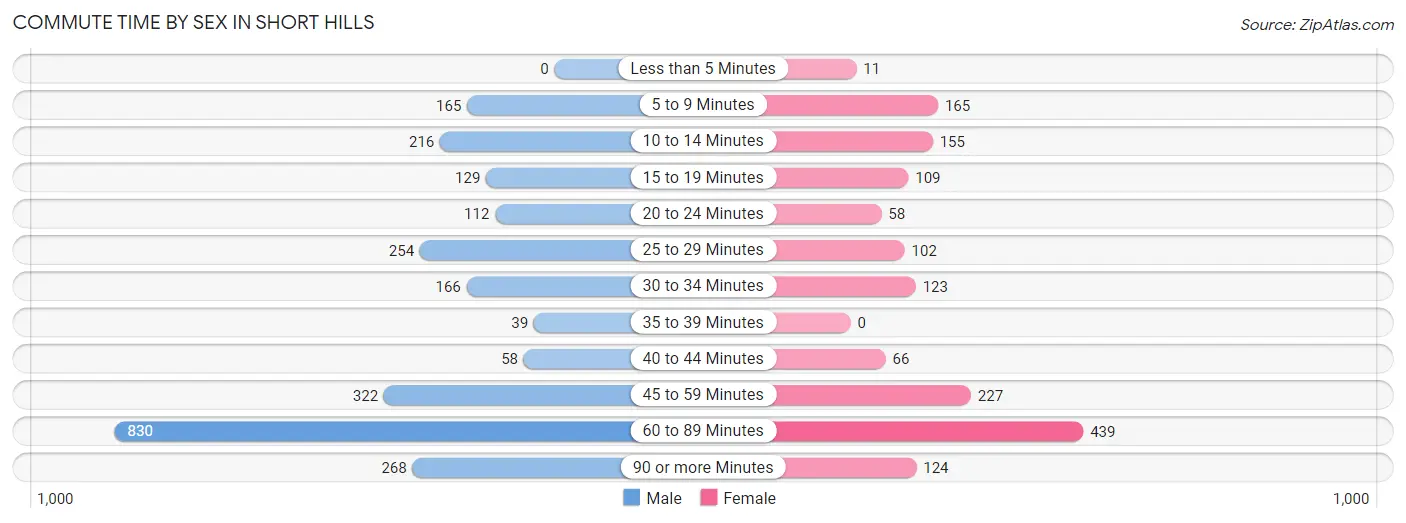
| Commute Time | Male | Female |
| Less than 5 Minutes | 0 (0.0%) | 11 (0.7%) |
| 5 to 9 Minutes | 165 (6.5%) | 165 (10.4%) |
| 10 to 14 Minutes | 216 (8.4%) | 155 (9.8%) |
| 15 to 19 Minutes | 129 (5.0%) | 109 (6.9%) |
| 20 to 24 Minutes | 112 (4.4%) | 58 (3.7%) |
| 25 to 29 Minutes | 254 (9.9%) | 102 (6.5%) |
| 30 to 34 Minutes | 166 (6.5%) | 123 (7.8%) |
| 35 to 39 Minutes | 39 (1.5%) | 0 (0.0%) |
| 40 to 44 Minutes | 58 (2.3%) | 66 (4.2%) |
| 45 to 59 Minutes | 322 (12.6%) | 227 (14.4%) |
| 60 to 89 Minutes | 830 (32.4%) | 439 (27.8%) |
| 90 or more Minutes | 268 (10.5%) | 124 (7.9%) |
Time of Departure to Work by Sex in Short Hills
The most frequent times of departure to work in Short Hills are 7:00 AM to 7:29 AM (489, 19.1%) for males and 7:00 AM to 7:29 AM (288, 18.2%) for females.
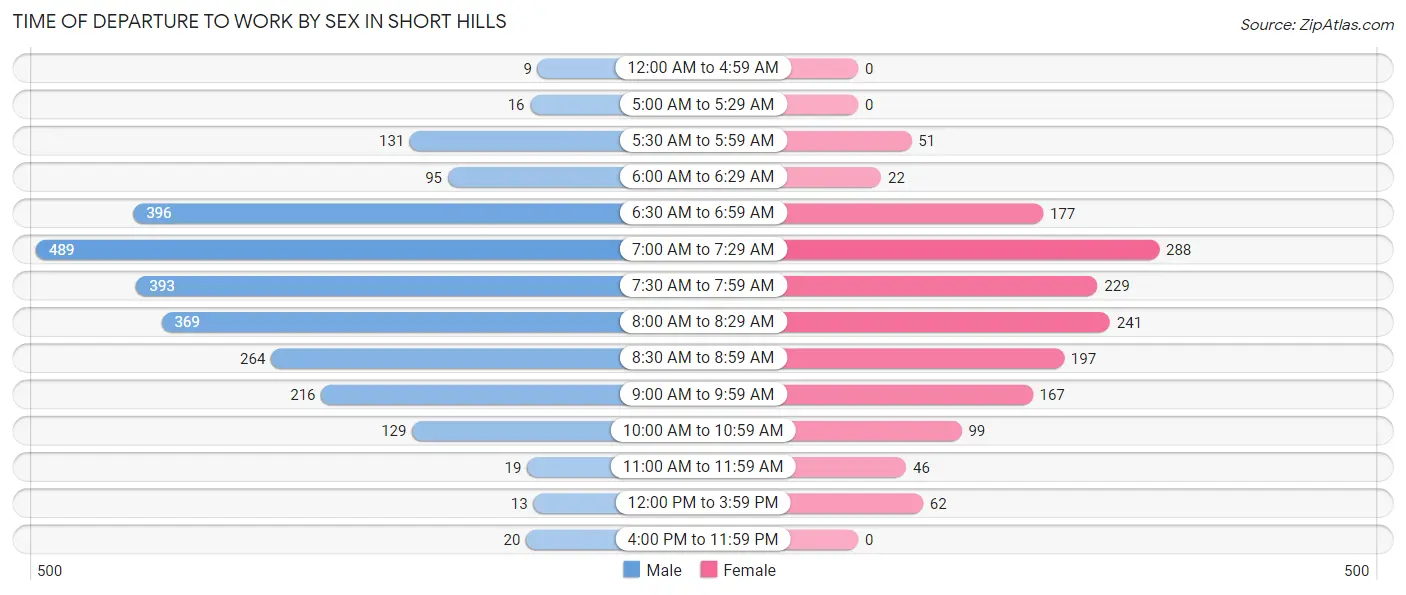
| Time of Departure | Male | Female |
| 12:00 AM to 4:59 AM | 9 (0.4%) | 0 (0.0%) |
| 5:00 AM to 5:29 AM | 16 (0.6%) | 0 (0.0%) |
| 5:30 AM to 5:59 AM | 131 (5.1%) | 51 (3.2%) |
| 6:00 AM to 6:29 AM | 95 (3.7%) | 22 (1.4%) |
| 6:30 AM to 6:59 AM | 396 (15.5%) | 177 (11.2%) |
| 7:00 AM to 7:29 AM | 489 (19.1%) | 288 (18.2%) |
| 7:30 AM to 7:59 AM | 393 (15.4%) | 229 (14.5%) |
| 8:00 AM to 8:29 AM | 369 (14.4%) | 241 (15.3%) |
| 8:30 AM to 8:59 AM | 264 (10.3%) | 197 (12.5%) |
| 9:00 AM to 9:59 AM | 216 (8.4%) | 167 (10.6%) |
| 10:00 AM to 10:59 AM | 129 (5.0%) | 99 (6.3%) |
| 11:00 AM to 11:59 AM | 19 (0.7%) | 46 (2.9%) |
| 12:00 PM to 3:59 PM | 13 (0.5%) | 62 (3.9%) |
| 4:00 PM to 11:59 PM | 20 (0.8%) | 0 (0.0%) |
| Total | 2,559 (100.0%) | 1,579 (100.0%) |
Housing Occupancy in Short Hills
Occupancy by Ownership in Short Hills
Of the total 4,575 dwellings in Short Hills, owner-occupied units account for 3,950 (86.3%), while renter-occupied units make up 625 (13.7%).
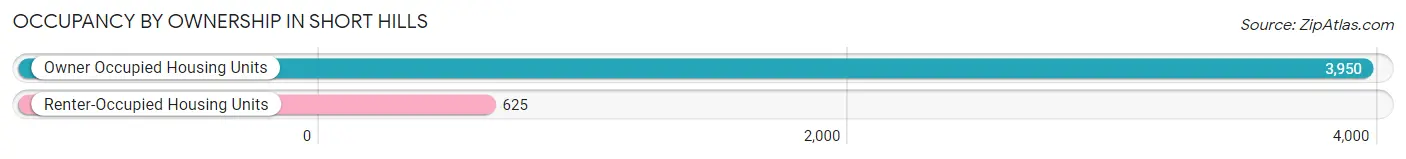
| Occupancy | # Housing Units | % Housing Units |
| Owner Occupied Housing Units | 3,950 | 86.3% |
| Renter-Occupied Housing Units | 625 | 13.7% |
| Total Occupied Housing Units | 4,575 | 100.0% |
Occupancy by Household Size in Short Hills
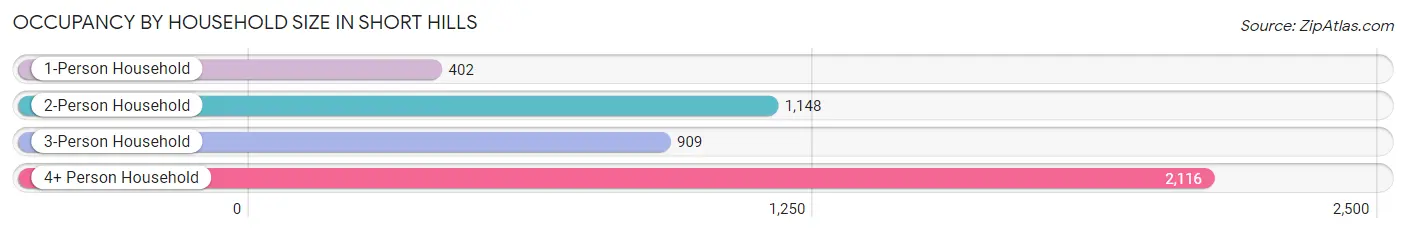
| Household Size | # Housing Units | % Housing Units |
| 1-Person Household | 402 | 8.8% |
| 2-Person Household | 1,148 | 25.1% |
| 3-Person Household | 909 | 19.9% |
| 4+ Person Household | 2,116 | 46.3% |
| Total Housing Units | 4,575 | 100.0% |
Occupancy by Ownership by Household Size in Short Hills
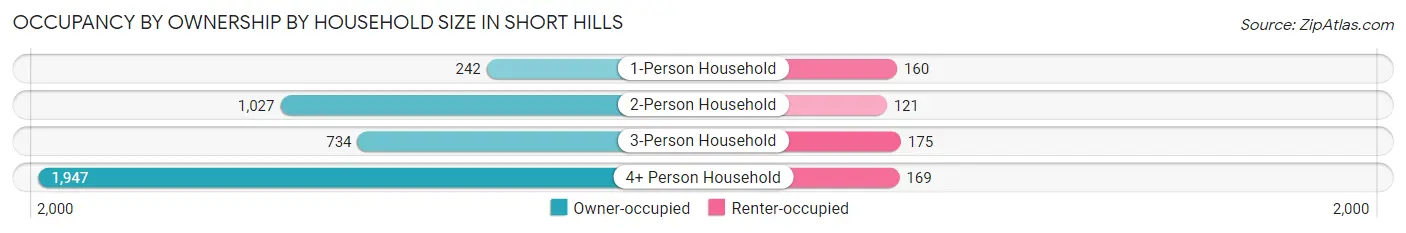
| Household Size | Owner-occupied | Renter-occupied |
| 1-Person Household | 242 (60.2%) | 160 (39.8%) |
| 2-Person Household | 1,027 (89.5%) | 121 (10.5%) |
| 3-Person Household | 734 (80.7%) | 175 (19.3%) |
| 4+ Person Household | 1,947 (92.0%) | 169 (8.0%) |
| Total Housing Units | 3,950 (86.3%) | 625 (13.7%) |
Occupancy by Educational Attainment in Short Hills
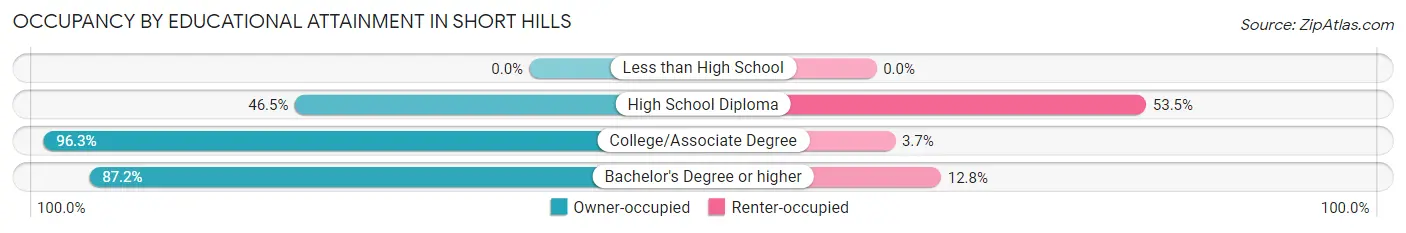
| Household Size | Owner-occupied | Renter-occupied |
| Less than High School | 0 (0.0%) | 0 (0.0%) |
| High School Diploma | 67 (46.5%) | 77 (53.5%) |
| College/Associate Degree | 207 (96.3%) | 8 (3.7%) |
| Bachelor's Degree or higher | 3,676 (87.2%) | 540 (12.8%) |
Occupancy by Age of Householder in Short Hills
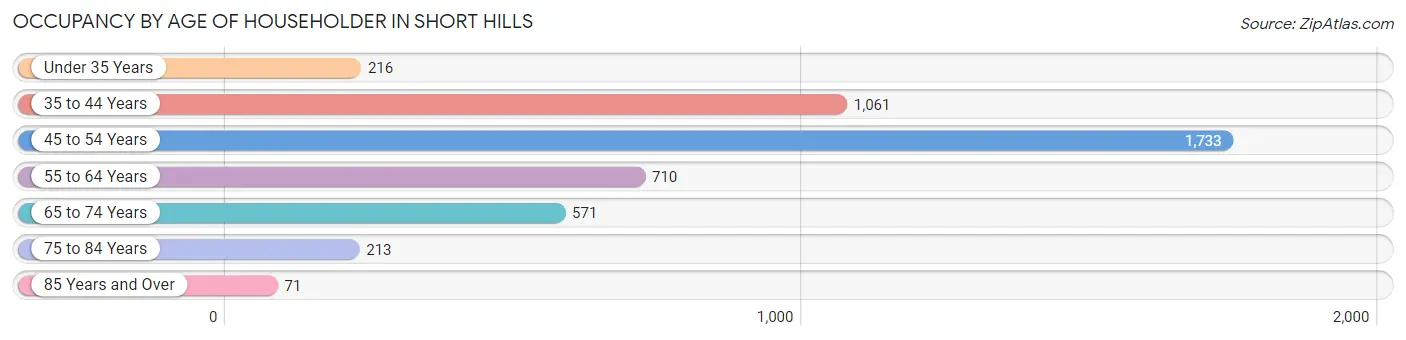
| Age Bracket | # Households | % Households |
| Under 35 Years | 216 | 4.7% |
| 35 to 44 Years | 1,061 | 23.2% |
| 45 to 54 Years | 1,733 | 37.9% |
| 55 to 64 Years | 710 | 15.5% |
| 65 to 74 Years | 571 | 12.5% |
| 75 to 84 Years | 213 | 4.7% |
| 85 Years and Over | 71 | 1.5% |
| Total | 4,575 | 100.0% |
Housing Finances in Short Hills
Median Income by Occupancy in Short Hills
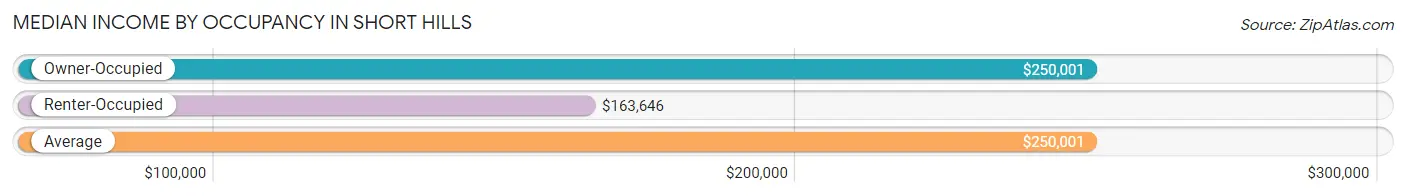
| Occupancy Type | # Households | Median Income |
| Owner-Occupied | 3,950 (86.3%) | $250,001 |
| Renter-Occupied | 625 (13.7%) | $163,646 |
| Average | 4,575 (100.0%) | $250,001 |
Occupancy by Householder Income Bracket in Short Hills
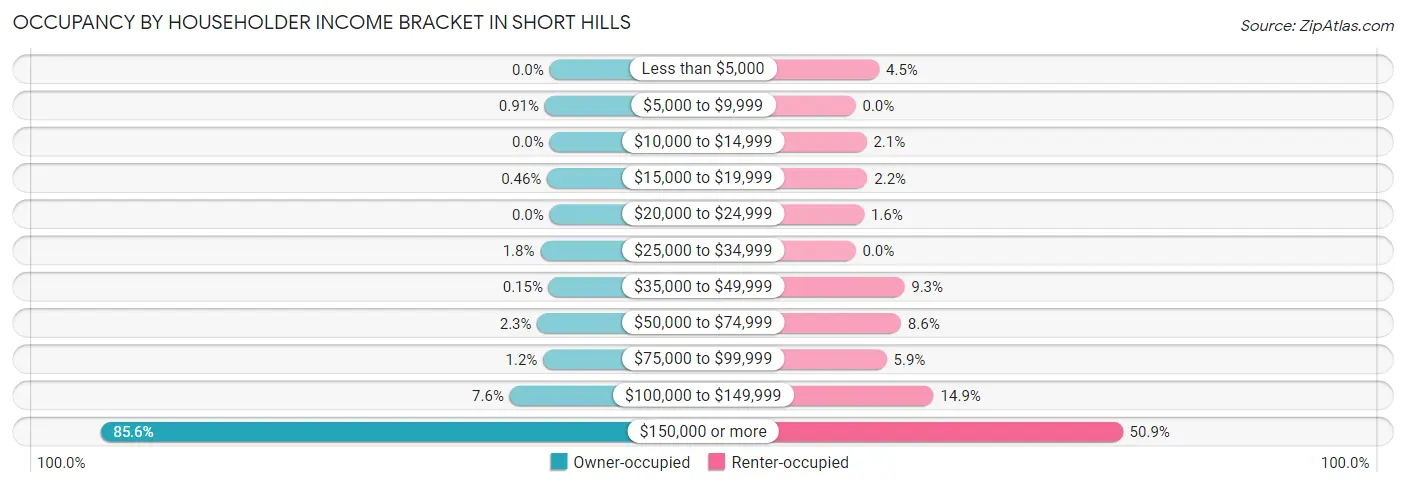
| Income Bracket | Owner-occupied | Renter-occupied |
| Less than $5,000 | 0 (0.0%) | 28 (4.5%) |
| $5,000 to $9,999 | 36 (0.9%) | 0 (0.0%) |
| $10,000 to $14,999 | 0 (0.0%) | 13 (2.1%) |
| $15,000 to $19,999 | 18 (0.5%) | 14 (2.2%) |
| $20,000 to $24,999 | 0 (0.0%) | 10 (1.6%) |
| $25,000 to $34,999 | 70 (1.8%) | 0 (0.0%) |
| $35,000 to $49,999 | 6 (0.2%) | 58 (9.3%) |
| $50,000 to $74,999 | 92 (2.3%) | 54 (8.6%) |
| $75,000 to $99,999 | 48 (1.2%) | 37 (5.9%) |
| $100,000 to $149,999 | 300 (7.6%) | 93 (14.9%) |
| $150,000 or more | 3,380 (85.6%) | 318 (50.9%) |
| Total | 3,950 (100.0%) | 625 (100.0%) |
Monthly Housing Cost Tiers in Short Hills
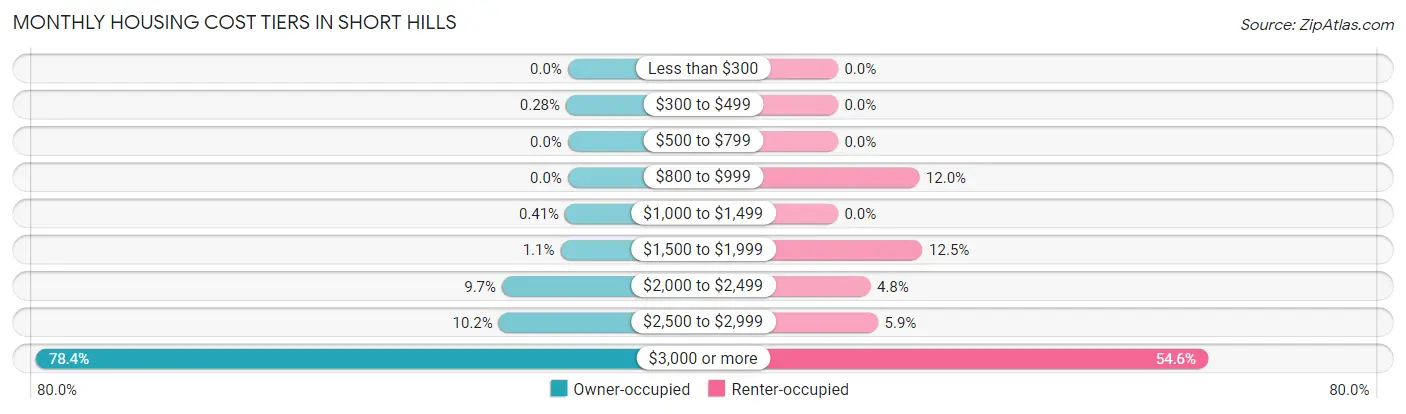
| Monthly Cost | Owner-occupied | Renter-occupied |
| Less than $300 | 0 (0.0%) | 0 (0.0%) |
| $300 to $499 | 11 (0.3%) | 0 (0.0%) |
| $500 to $799 | 0 (0.0%) | 0 (0.0%) |
| $800 to $999 | 0 (0.0%) | 75 (12.0%) |
| $1,000 to $1,499 | 16 (0.4%) | 0 (0.0%) |
| $1,500 to $1,999 | 43 (1.1%) | 78 (12.5%) |
| $2,000 to $2,499 | 383 (9.7%) | 30 (4.8%) |
| $2,500 to $2,999 | 402 (10.2%) | 37 (5.9%) |
| $3,000 or more | 3,095 (78.3%) | 341 (54.6%) |
| Total | 3,950 (100.0%) | 625 (100.0%) |
Physical Housing Characteristics in Short Hills
Housing Structures in Short Hills
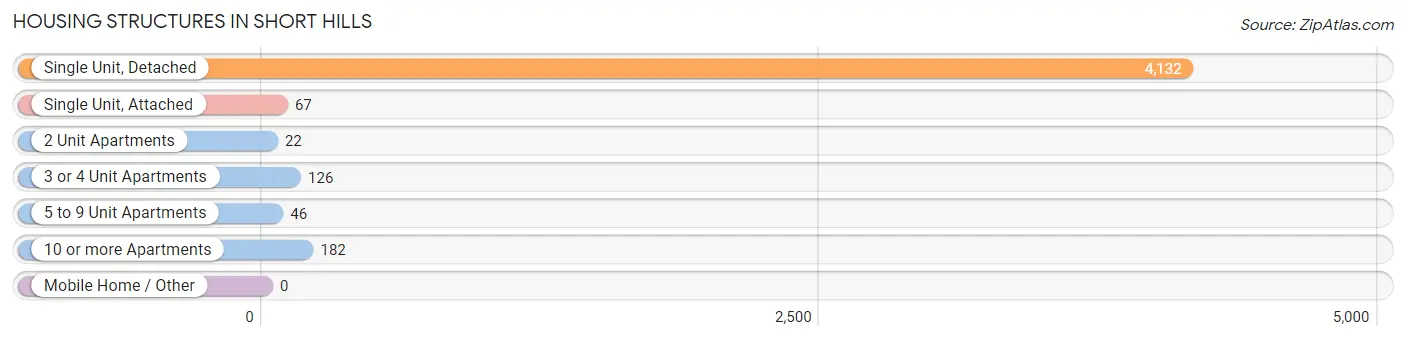
| Structure Type | # Housing Units | % Housing Units |
| Single Unit, Detached | 4,132 | 90.3% |
| Single Unit, Attached | 67 | 1.5% |
| 2 Unit Apartments | 22 | 0.5% |
| 3 or 4 Unit Apartments | 126 | 2.8% |
| 5 to 9 Unit Apartments | 46 | 1.0% |
| 10 or more Apartments | 182 | 4.0% |
| Mobile Home / Other | 0 | 0.0% |
| Total | 4,575 | 100.0% |
Housing Structures by Occupancy in Short Hills
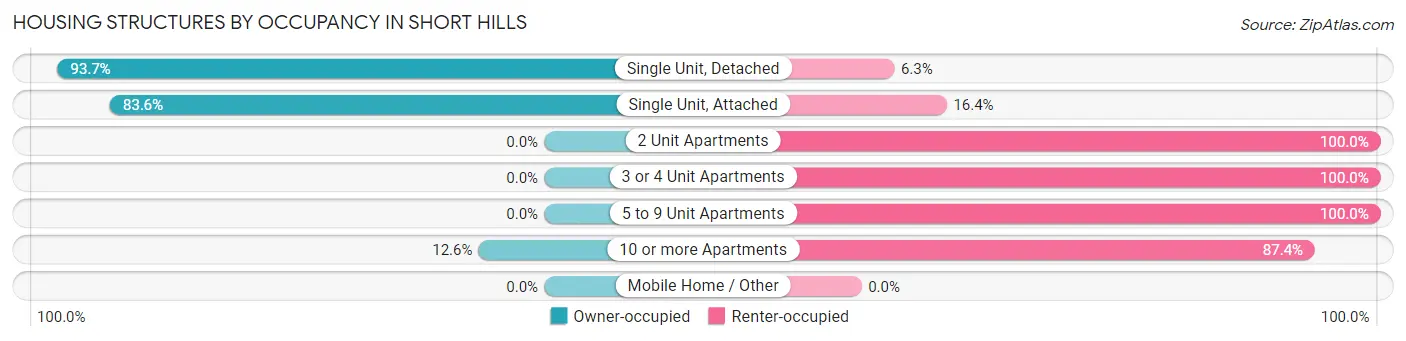
| Structure Type | Owner-occupied | Renter-occupied |
| Single Unit, Detached | 3,871 (93.7%) | 261 (6.3%) |
| Single Unit, Attached | 56 (83.6%) | 11 (16.4%) |
| 2 Unit Apartments | 0 (0.0%) | 22 (100.0%) |
| 3 or 4 Unit Apartments | 0 (0.0%) | 126 (100.0%) |
| 5 to 9 Unit Apartments | 0 (0.0%) | 46 (100.0%) |
| 10 or more Apartments | 23 (12.6%) | 159 (87.4%) |
| Mobile Home / Other | 0 (0.0%) | 0 (0.0%) |
| Total | 3,950 (86.3%) | 625 (13.7%) |
Housing Structures by Number of Rooms in Short Hills
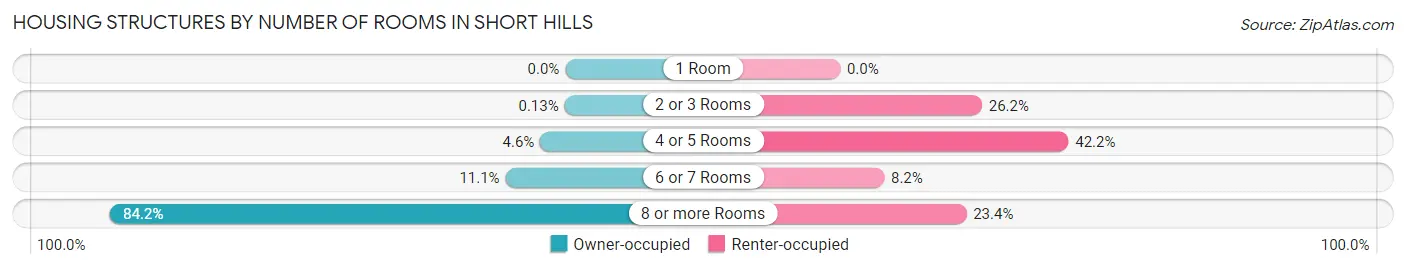
| Number of Rooms | Owner-occupied | Renter-occupied |
| 1 Room | 0 (0.0%) | 0 (0.0%) |
| 2 or 3 Rooms | 5 (0.1%) | 164 (26.2%) |
| 4 or 5 Rooms | 183 (4.6%) | 264 (42.2%) |
| 6 or 7 Rooms | 437 (11.1%) | 51 (8.2%) |
| 8 or more Rooms | 3,325 (84.2%) | 146 (23.4%) |
| Total | 3,950 (100.0%) | 625 (100.0%) |
Housing Structure by Heating Type in Short Hills
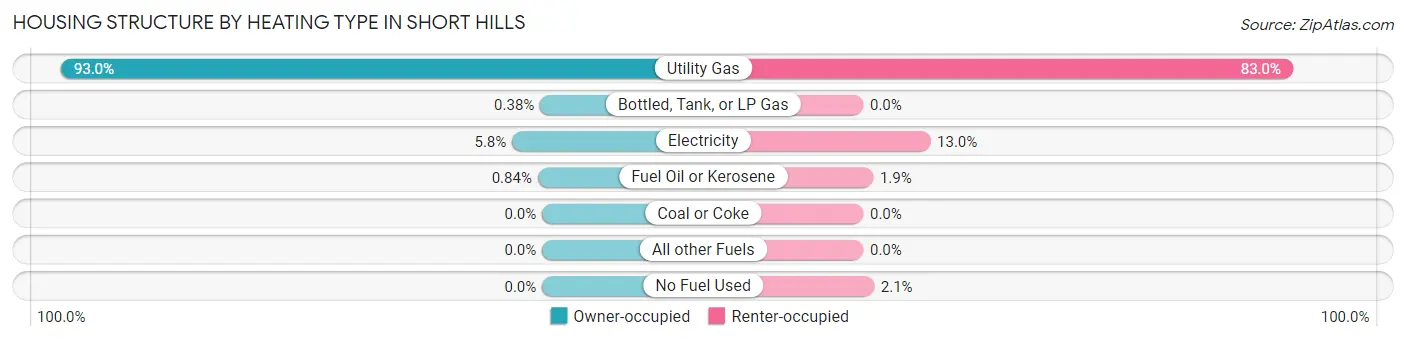
| Heating Type | Owner-occupied | Renter-occupied |
| Utility Gas | 3,673 (93.0%) | 519 (83.0%) |
| Bottled, Tank, or LP Gas | 15 (0.4%) | 0 (0.0%) |
| Electricity | 229 (5.8%) | 81 (13.0%) |
| Fuel Oil or Kerosene | 33 (0.8%) | 12 (1.9%) |
| Coal or Coke | 0 (0.0%) | 0 (0.0%) |
| All other Fuels | 0 (0.0%) | 0 (0.0%) |
| No Fuel Used | 0 (0.0%) | 13 (2.1%) |
| Total | 3,950 (100.0%) | 625 (100.0%) |
Household Vehicle Usage in Short Hills
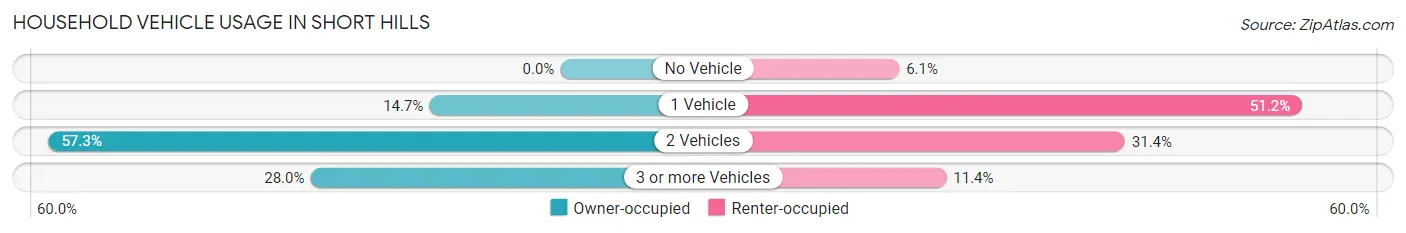
| Vehicles per Household | Owner-occupied | Renter-occupied |
| No Vehicle | 0 (0.0%) | 38 (6.1%) |
| 1 Vehicle | 580 (14.7%) | 320 (51.2%) |
| 2 Vehicles | 2,264 (57.3%) | 196 (31.4%) |
| 3 or more Vehicles | 1,106 (28.0%) | 71 (11.4%) |
| Total | 3,950 (100.0%) | 625 (100.0%) |
Real Estate & Mortgages in Short Hills
Real Estate and Mortgage Overview in Short Hills
| Characteristic | Without Mortgage | With Mortgage |
| Housing Units | 1,276 | 2,674 |
| Median Property Value | $1,539,700 | $1,583,300 |
| Median Household Income | $250,001 | $2,422 |
| Monthly Housing Costs | $1,501 | $2,569 |
| Real Estate Taxes | $10,001 | $0 |
Property Value by Mortgage Status in Short Hills
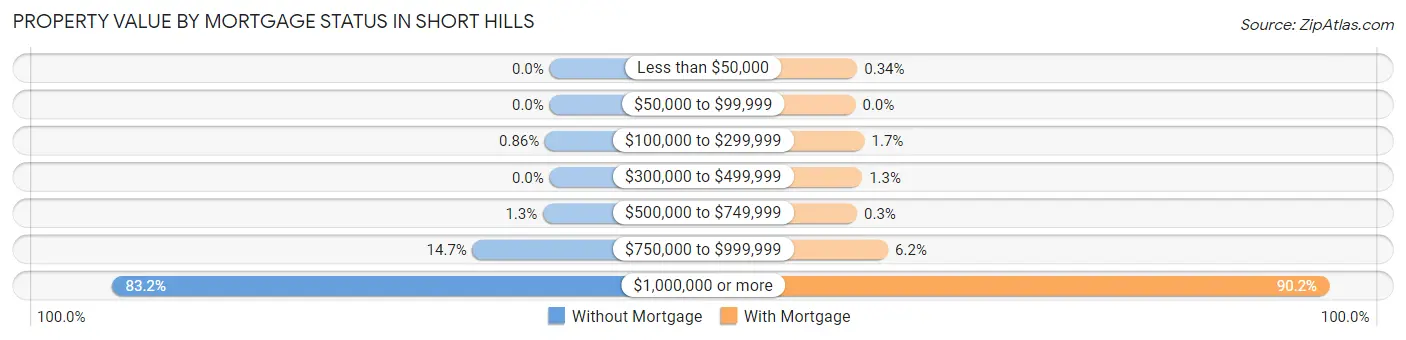
| Property Value | Without Mortgage | With Mortgage |
| Less than $50,000 | 0 (0.0%) | 9 (0.3%) |
| $50,000 to $99,999 | 0 (0.0%) | 0 (0.0%) |
| $100,000 to $299,999 | 11 (0.9%) | 46 (1.7%) |
| $300,000 to $499,999 | 0 (0.0%) | 34 (1.3%) |
| $500,000 to $749,999 | 16 (1.3%) | 8 (0.3%) |
| $750,000 to $999,999 | 187 (14.7%) | 166 (6.2%) |
| $1,000,000 or more | 1,062 (83.2%) | 2,411 (90.2%) |
| Total | 1,276 (100.0%) | 2,674 (100.0%) |
Household Income by Mortgage Status in Short Hills
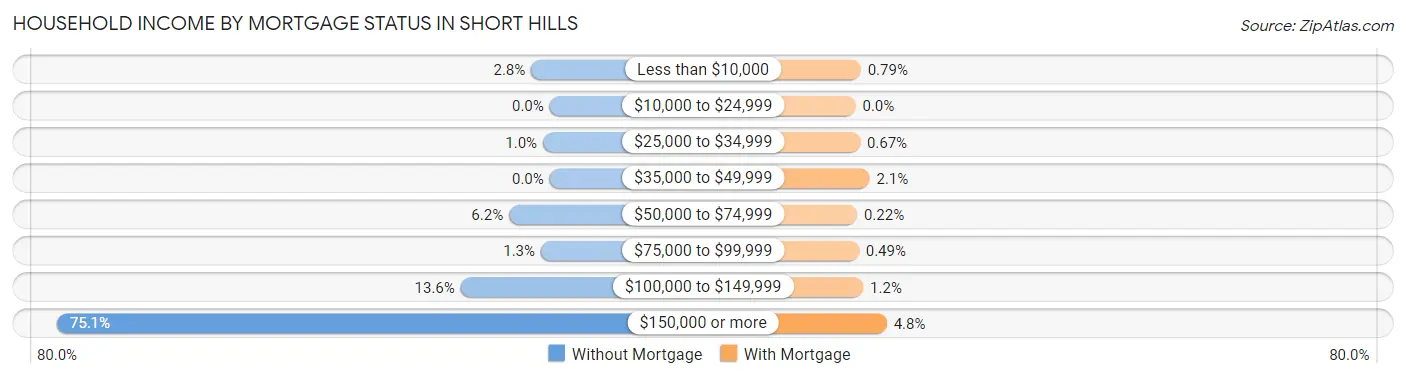
| Household Income | Without Mortgage | With Mortgage |
| Less than $10,000 | 36 (2.8%) | 21 (0.8%) |
| $10,000 to $24,999 | 0 (0.0%) | 0 (0.0%) |
| $25,000 to $34,999 | 13 (1.0%) | 18 (0.7%) |
| $35,000 to $49,999 | 0 (0.0%) | 57 (2.1%) |
| $50,000 to $74,999 | 79 (6.2%) | 6 (0.2%) |
| $75,000 to $99,999 | 17 (1.3%) | 13 (0.5%) |
| $100,000 to $149,999 | 173 (13.6%) | 31 (1.2%) |
| $150,000 or more | 958 (75.1%) | 127 (4.8%) |
| Total | 1,276 (100.0%) | 2,674 (100.0%) |
Property Value to Household Income Ratio in Short Hills
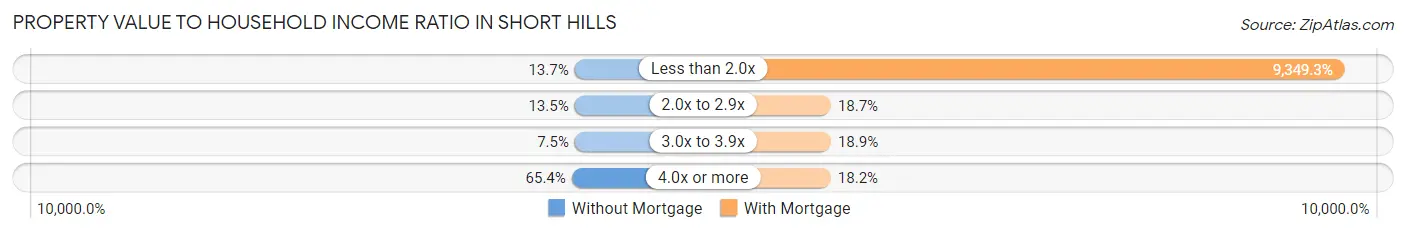
| Value-to-Income Ratio | Without Mortgage | With Mortgage |
| Less than 2.0x | 175 (13.7%) | 250,001 (9,349.3%) |
| 2.0x to 2.9x | 172 (13.5%) | 499 (18.7%) |
| 3.0x to 3.9x | 95 (7.4%) | 505 (18.9%) |
| 4.0x or more | 834 (65.4%) | 486 (18.2%) |
| Total | 1,276 (100.0%) | 2,674 (100.0%) |
Real Estate Taxes by Mortgage Status in Short Hills
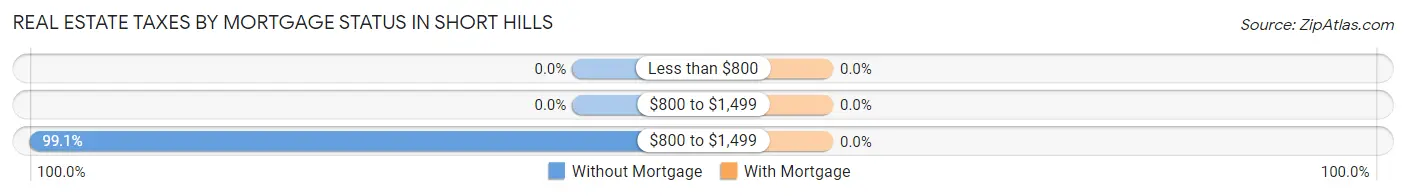
| Property Taxes | Without Mortgage | With Mortgage |
| Less than $800 | 0 (0.0%) | 0 (0.0%) |
| $800 to $1,499 | 0 (0.0%) | 0 (0.0%) |
| $800 to $1,499 | 1,265 (99.1%) | 0 (0.0%) |
| Total | 1,276 (100.0%) | 2,674 (100.0%) |
Health & Disability in Short Hills
Health Insurance Coverage by Age in Short Hills
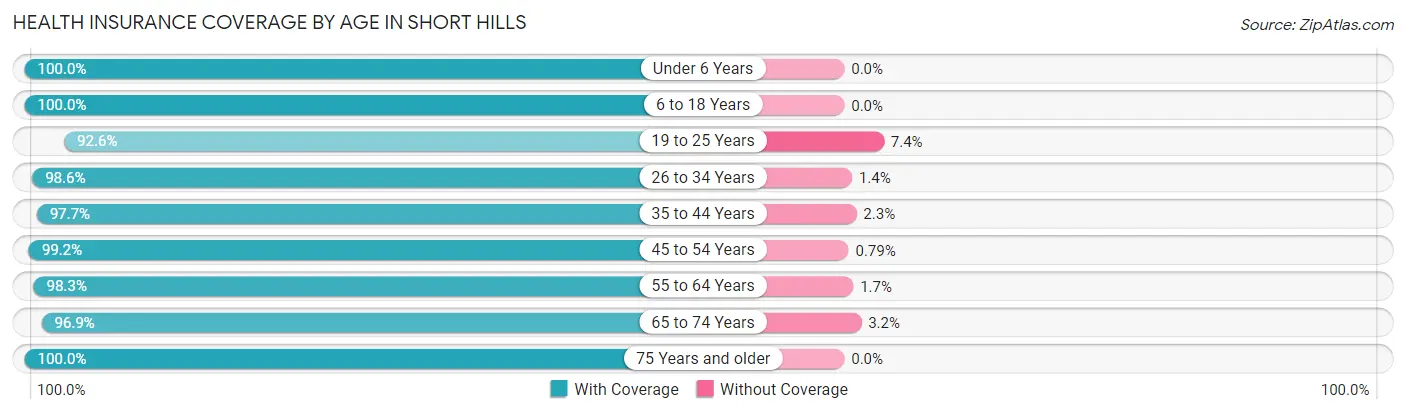
| Age Bracket | With Coverage | Without Coverage |
| Under 6 Years | 936 (100.0%) | 0 (0.0%) |
| 6 to 18 Years | 3,932 (100.0%) | 0 (0.0%) |
| 19 to 25 Years | 654 (92.6%) | 52 (7.4%) |
| 26 to 34 Years | 553 (98.6%) | 8 (1.4%) |
| 35 to 44 Years | 2,032 (97.7%) | 47 (2.3%) |
| 45 to 54 Years | 3,015 (99.2%) | 24 (0.8%) |
| 55 to 64 Years | 1,474 (98.3%) | 25 (1.7%) |
| 65 to 74 Years | 1,076 (96.9%) | 35 (3.2%) |
| 75 Years and older | 585 (100.0%) | 0 (0.0%) |
| Total | 14,257 (98.7%) | 191 (1.3%) |
Health Insurance Coverage by Citizenship Status in Short Hills
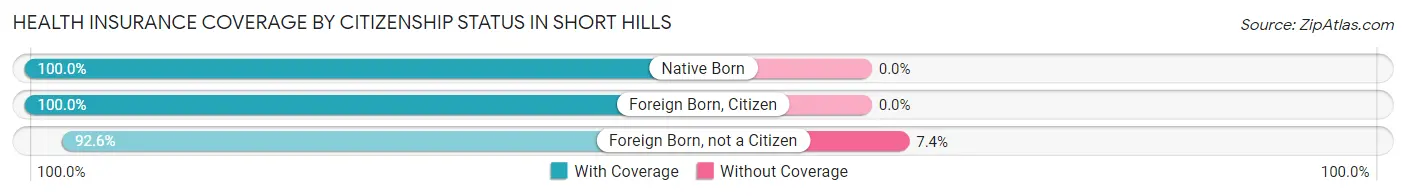
| Citizenship Status | With Coverage | Without Coverage |
| Native Born | 936 (100.0%) | 0 (0.0%) |
| Foreign Born, Citizen | 3,932 (100.0%) | 0 (0.0%) |
| Foreign Born, not a Citizen | 654 (92.6%) | 52 (7.4%) |
Health Insurance Coverage by Household Income in Short Hills
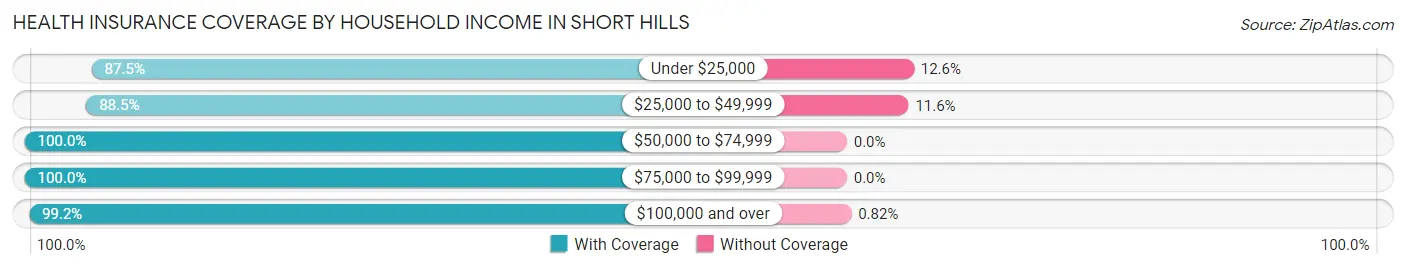
| Household Income | With Coverage | Without Coverage |
| Under $25,000 | 237 (87.5%) | 34 (12.6%) |
| $25,000 to $49,999 | 360 (88.4%) | 47 (11.6%) |
| $50,000 to $74,999 | 242 (100.0%) | 0 (0.0%) |
| $75,000 to $99,999 | 180 (100.0%) | 0 (0.0%) |
| $100,000 and over | 13,238 (99.2%) | 110 (0.8%) |
Public vs Private Health Insurance Coverage by Age in Short Hills
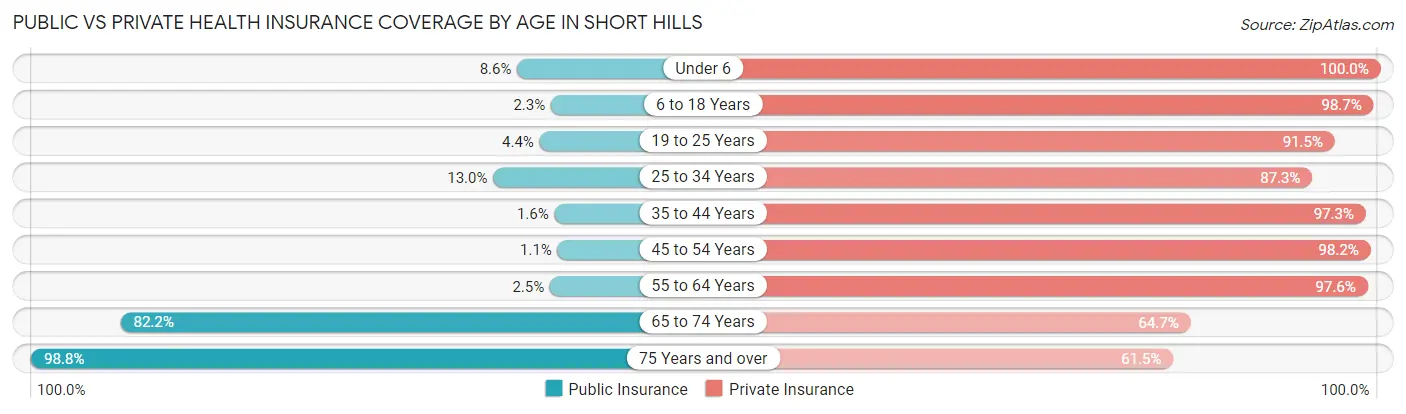
| Age Bracket | Public Insurance | Private Insurance |
| Under 6 | 80 (8.6%) | 936 (100.0%) |
| 6 to 18 Years | 90 (2.3%) | 3,881 (98.7%) |
| 19 to 25 Years | 31 (4.4%) | 646 (91.5%) |
| 25 to 34 Years | 73 (13.0%) | 490 (87.3%) |
| 35 to 44 Years | 34 (1.6%) | 2,022 (97.3%) |
| 45 to 54 Years | 32 (1.1%) | 2,983 (98.2%) |
| 55 to 64 Years | 37 (2.5%) | 1,463 (97.6%) |
| 65 to 74 Years | 913 (82.2%) | 719 (64.7%) |
| 75 Years and over | 578 (98.8%) | 360 (61.5%) |
| Total | 1,868 (12.9%) | 13,500 (93.4%) |
Disability Status by Sex by Age in Short Hills
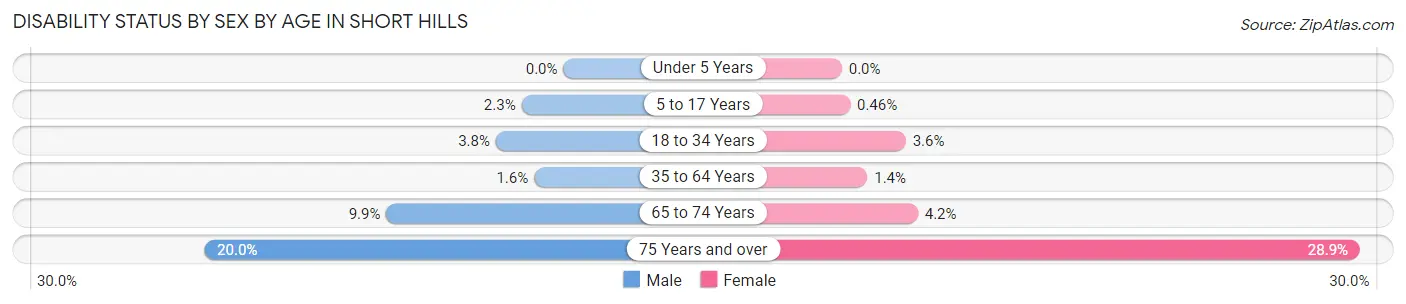
| Age Bracket | Male | Female |
| Under 5 Years | 0 (0.0%) | 0 (0.0%) |
| 5 to 17 Years | 45 (2.3%) | 9 (0.5%) |
| 18 to 34 Years | 26 (3.8%) | 27 (3.6%) |
| 35 to 64 Years | 55 (1.6%) | 46 (1.4%) |
| 65 to 74 Years | 49 (9.9%) | 26 (4.2%) |
| 75 Years and over | 56 (20.0%) | 88 (28.8%) |
Disability Class by Sex by Age in Short Hills
Disability Class: Hearing Difficulty
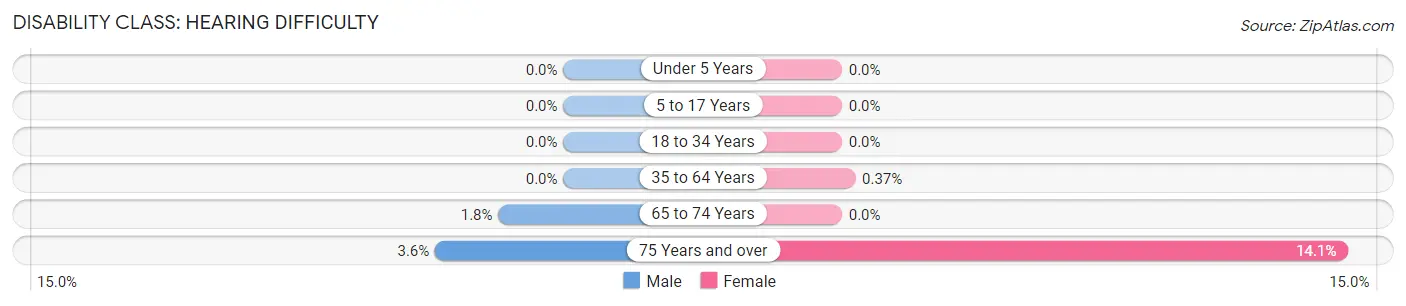
| Age Bracket | Male | Female |
| Under 5 Years | 0 (0.0%) | 0 (0.0%) |
| 5 to 17 Years | 0 (0.0%) | 0 (0.0%) |
| 18 to 34 Years | 0 (0.0%) | 0 (0.0%) |
| 35 to 64 Years | 0 (0.0%) | 12 (0.4%) |
| 65 to 74 Years | 9 (1.8%) | 0 (0.0%) |
| 75 Years and over | 10 (3.6%) | 43 (14.1%) |
Disability Class: Vision Difficulty
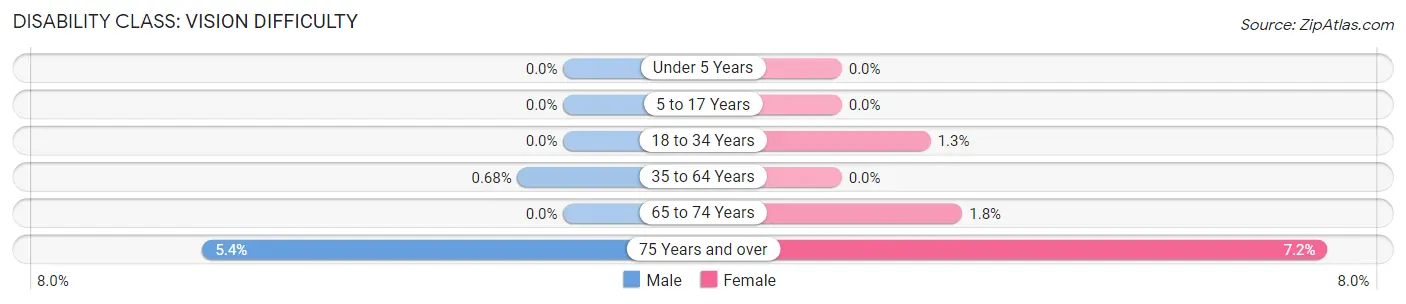
| Age Bracket | Male | Female |
| Under 5 Years | 0 (0.0%) | 0 (0.0%) |
| 5 to 17 Years | 0 (0.0%) | 0 (0.0%) |
| 18 to 34 Years | 0 (0.0%) | 10 (1.3%) |
| 35 to 64 Years | 23 (0.7%) | 0 (0.0%) |
| 65 to 74 Years | 0 (0.0%) | 11 (1.8%) |
| 75 Years and over | 15 (5.4%) | 22 (7.2%) |
Disability Class: Cognitive Difficulty
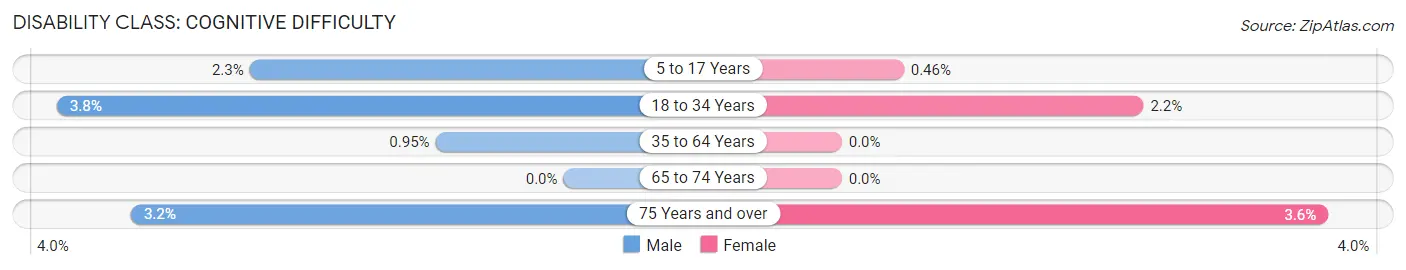
| Age Bracket | Male | Female |
| 5 to 17 Years | 45 (2.3%) | 9 (0.5%) |
| 18 to 34 Years | 26 (3.8%) | 17 (2.2%) |
| 35 to 64 Years | 32 (0.9%) | 0 (0.0%) |
| 65 to 74 Years | 0 (0.0%) | 0 (0.0%) |
| 75 Years and over | 9 (3.2%) | 11 (3.6%) |
Disability Class: Ambulatory Difficulty
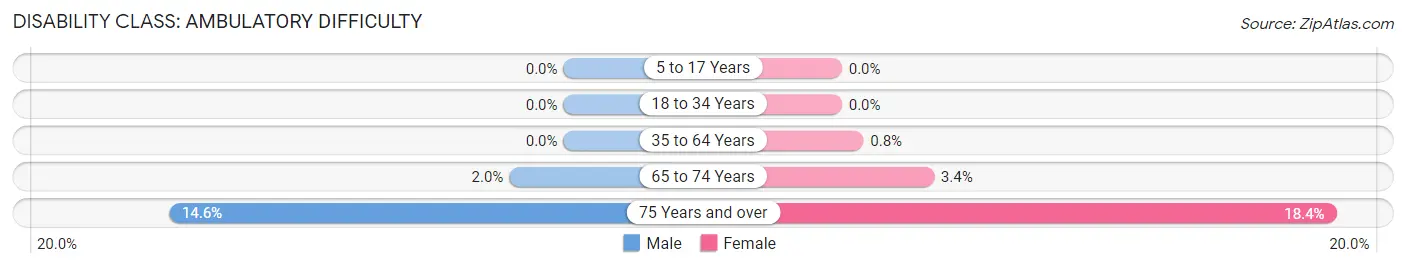
| Age Bracket | Male | Female |
| 5 to 17 Years | 0 (0.0%) | 0 (0.0%) |
| 18 to 34 Years | 0 (0.0%) | 0 (0.0%) |
| 35 to 64 Years | 0 (0.0%) | 26 (0.8%) |
| 65 to 74 Years | 10 (2.0%) | 21 (3.4%) |
| 75 Years and over | 41 (14.6%) | 56 (18.4%) |
Disability Class: Self-Care Difficulty
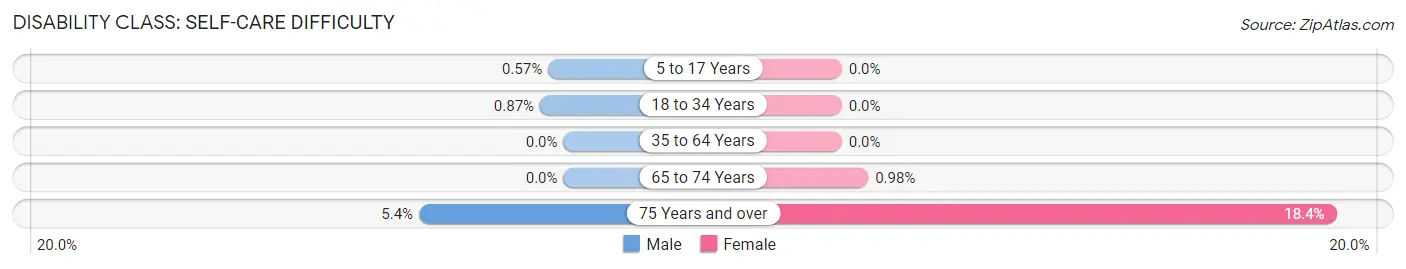
| Age Bracket | Male | Female |
| 5 to 17 Years | 11 (0.6%) | 0 (0.0%) |
| 18 to 34 Years | 6 (0.9%) | 0 (0.0%) |
| 35 to 64 Years | 0 (0.0%) | 0 (0.0%) |
| 65 to 74 Years | 0 (0.0%) | 6 (1.0%) |
| 75 Years and over | 15 (5.4%) | 56 (18.4%) |
Technology Access in Short Hills
Computing Device Access in Short Hills
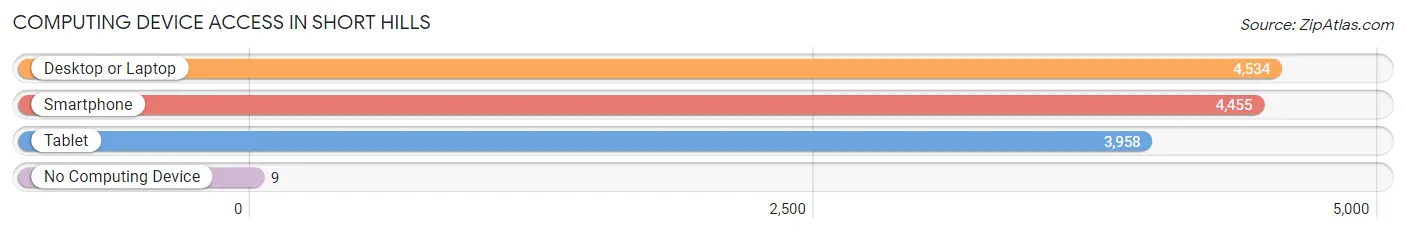
| Device Type | # Households | % Households |
| Desktop or Laptop | 4,534 | 99.1% |
| Smartphone | 4,455 | 97.4% |
| Tablet | 3,958 | 86.5% |
| No Computing Device | 9 | 0.2% |
| Total | 4,575 | 100.0% |
Internet Access in Short Hills
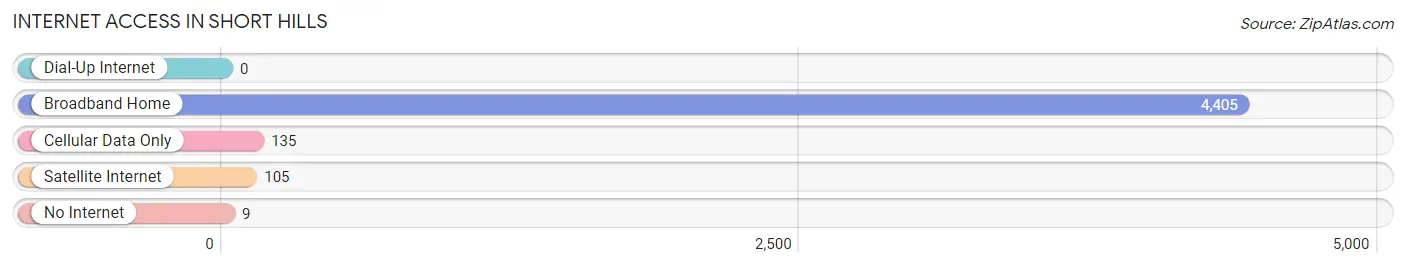
| Internet Type | # Households | % Households |
| Dial-Up Internet | 0 | 0.0% |
| Broadband Home | 4,405 | 96.3% |
| Cellular Data Only | 135 | 2.9% |
| Satellite Internet | 105 | 2.3% |
| No Internet | 9 | 0.2% |
| Total | 4,575 | 100.0% |
Short Hills Summary
Short Hills is a small, affluent suburban community located in Essex County, New Jersey. It is situated within the Millburn Township and is part of the New York metropolitan area. The community is known for its upscale shopping, dining, and residential areas.
History
Short Hills was originally part of the Horseneck Tract, a large parcel of land purchased by a group of settlers from Newark in 1666. The area was known as the Short Hills District, and was part of the larger Livingston Township. In 1806, the area was split off from Livingston and became its own township, known as Millburn Township.
The area was largely rural until the late 19th century, when the railroad was built through the area. This allowed for the development of the area, and by the early 20th century, Short Hills had become a popular summer resort destination for wealthy New Yorkers. The area was known for its luxurious hotels, golf courses, and country clubs.
In the 1950s, the area began to transition from a resort destination to a residential community. The area was developed with large, luxurious homes, and the population began to grow. By the 1970s, Short Hills had become a wealthy, affluent community.
Geography
Short Hills is located in Essex County, New Jersey. It is situated within the Millburn Township and is part of the New York metropolitan area. The community is bordered by the towns of Maplewood, South Orange, and Millburn.
The area is characterized by rolling hills and wooded areas. The Passaic River runs through the area, and there are several small lakes and ponds in the area.
Economy
Short Hills is a wealthy, affluent community. The median household income is over $200,000, and the median home value is over $1 million. The area is known for its upscale shopping, dining, and residential areas.
The area is home to several corporate headquarters, including Prudential Financial, Investors Bank, and Bed Bath & Beyond. The area is also home to several large shopping centers, including The Mall at Short Hills and The Mall at Millburn.
Demographics
As of the 2010 census, the population of Short Hills was 13,165. The racial makeup of the area was 79.3% White, 8.2% Asian, 6.7% African American, and 5.8% Hispanic or Latino.
The median age of the population is 44.3 years, and the median household income is $203,813. The median home value is $1,072,845.
Short Hills is a wealthy, affluent community. The area is known for its upscale shopping, dining, and residential areas. The area is home to several corporate headquarters, and is a popular destination for wealthy New Yorkers. The area is characterized by rolling hills and wooded areas, and is a desirable place to live for those looking for a luxurious lifestyle.
Common Questions
What is Per Capita Income in Short Hills?
Per Capita income in Short Hills is $153,214.
What is the Median Family Income in Short Hills?
Median Family Income in Short Hills is $250,001.
What is the Median Household income in Short Hills?
Median Household Income in Short Hills is $250,001.
What is Income or Wage Gap in Short Hills?
Income or Wage Gap in Short Hills is 55.6%.
Women in Short Hills earn 44.4 cents for every dollar earned by a man.
What is Inequality or Gini Index in Short Hills?
Inequality or Gini Index in Short Hills is 0.45.
What is the Total Population of Short Hills?
Total Population of Short Hills is 14,448.
What is the Total Male Population of Short Hills?
Total Male Population of Short Hills is 7,253.
What is the Total Female Population of Short Hills?
Total Female Population of Short Hills is 7,195.
What is the Ratio of Males per 100 Females in Short Hills?
There are 100.81 Males per 100 Females in Short Hills.
What is the Ratio of Females per 100 Males in Short Hills?
There are 99.20 Females per 100 Males in Short Hills.
What is the Median Population Age in Short Hills?
Median Population Age in Short Hills is 41.6 Years.
What is the Average Family Size in Short Hills
Average Family Size in Short Hills is 3.3 People.
What is the Average Household Size in Short Hills
Average Household Size in Short Hills is 3.2 People.
How Large is the Labor Force in Short Hills?
There are 6,841 People in the Labor Forcein in Short Hills.
What is the Percentage of People in the Labor Force in Short Hills?
65.4% of People are in the Labor Force in Short Hills.
What is the Unemployment Rate in Short Hills?
Unemployment Rate in Short Hills is 4.8%.