Kendall Park, NJ Map & Demographics
Kendall Park Map
Kendall Park Overview
$64,129
PER CAPITA INCOME
$180,891
AVG FAMILY INCOME
$159,362
AVG HOUSEHOLD INCOME
57.3%
WAGE / INCOME GAP [ % ]
42.7¢/ $1
WAGE / INCOME GAP [ $ ]
0.42
INEQUALITY / GINI INDEX
10,624
TOTAL POPULATION
4,852
MALE POPULATION
5,772
FEMALE POPULATION
84.06
MALES / 100 FEMALES
118.96
FEMALES / 100 MALES
44.5
MEDIAN AGE
3.2
AVG FAMILY SIZE
2.9
AVG HOUSEHOLD SIZE
6,150
LABOR FORCE [ PEOPLE ]
71.8%
PERCENT IN LABOR FORCE
6.4%
UNEMPLOYMENT RATE
Kendall Park Zip Codes
Kendall Park Area Codes
Income in Kendall Park
Income Overview in Kendall Park
Per Capita Income in Kendall Park is $64,129, while median incomes of families and households are $180,891 and $159,362 respectively.
| Characteristic | Number | Measure |
| Per Capita Income | 10,624 | $64,129 |
| Median Family Income | 2,936 | $180,891 |
| Mean Family Income | 2,936 | $214,061 |
| Median Household Income | 3,620 | $159,362 |
| Mean Household Income | 3,620 | $187,858 |
| Income Deficit | 2,936 | $0 |
| Wage / Income Gap (%) | 10,624 | 57.26% |
| Wage / Income Gap ($) | 10,624 | 42.74¢ per $1 |
| Gini / Inequality Index | 10,624 | 0.42 |
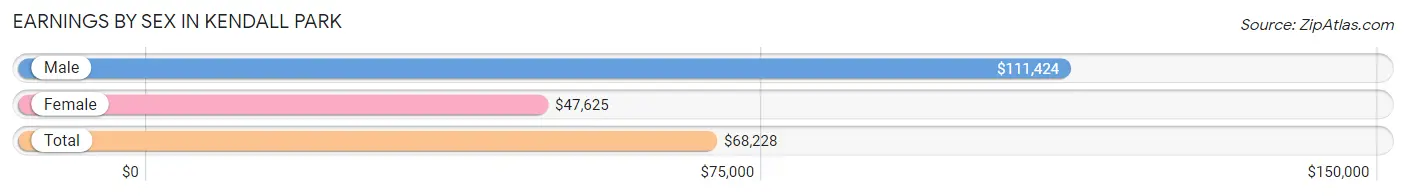
Earnings by Sex in Kendall Park
Average Earnings in Kendall Park are $68,228, $111,424 for men and $47,625 for women, a difference of 57.3%.
| Sex | Number | Average Earnings |
| Male | 3,189 (50.6%) | $111,424 |
| Female | 3,110 (49.4%) | $47,625 |
| Total | 6,299 (100.0%) | $68,228 |
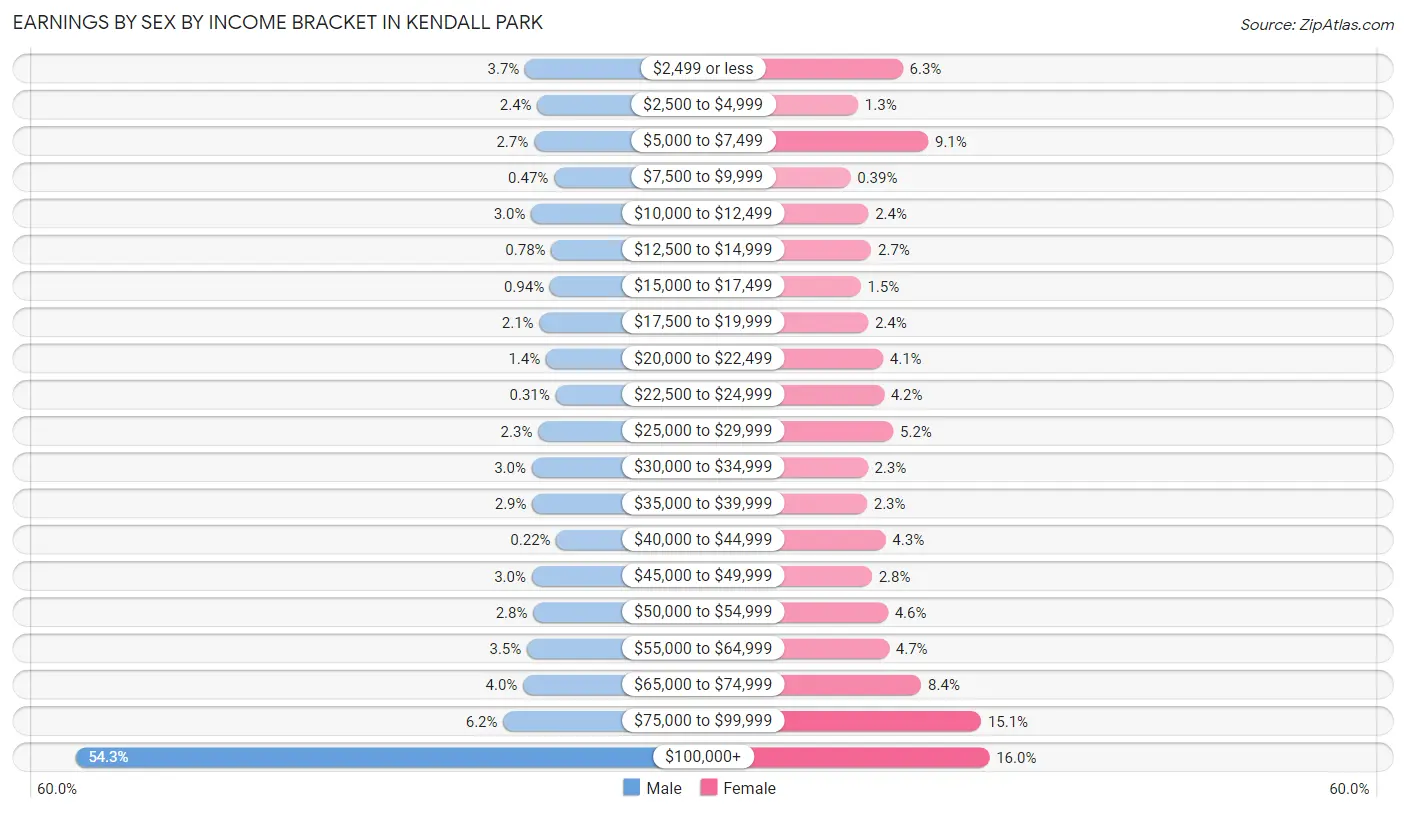
Earnings by Sex by Income Bracket in Kendall Park
The most common earnings brackets in Kendall Park are $100,000+ for men (1,732 | 54.3%) and $100,000+ for women (498 | 16.0%).
| Income | Male | Female |
| $2,499 or less | 119 (3.7%) | 195 (6.3%) |
| $2,500 to $4,999 | 75 (2.4%) | 39 (1.3%) |
| $5,000 to $7,499 | 87 (2.7%) | 284 (9.1%) |
| $7,500 to $9,999 | 15 (0.5%) | 12 (0.4%) |
| $10,000 to $12,499 | 97 (3.0%) | 75 (2.4%) |
| $12,500 to $14,999 | 25 (0.8%) | 85 (2.7%) |
| $15,000 to $17,499 | 30 (0.9%) | 48 (1.5%) |
| $17,500 to $19,999 | 68 (2.1%) | 74 (2.4%) |
| $20,000 to $22,499 | 44 (1.4%) | 126 (4.1%) |
| $22,500 to $24,999 | 10 (0.3%) | 129 (4.2%) |
| $25,000 to $29,999 | 72 (2.3%) | 162 (5.2%) |
| $30,000 to $34,999 | 95 (3.0%) | 72 (2.3%) |
| $35,000 to $39,999 | 93 (2.9%) | 70 (2.2%) |
| $40,000 to $44,999 | 7 (0.2%) | 135 (4.3%) |
| $45,000 to $49,999 | 95 (3.0%) | 87 (2.8%) |
| $50,000 to $54,999 | 90 (2.8%) | 143 (4.6%) |
| $55,000 to $64,999 | 112 (3.5%) | 147 (4.7%) |
| $65,000 to $74,999 | 126 (4.0%) | 260 (8.4%) |
| $75,000 to $99,999 | 197 (6.2%) | 469 (15.1%) |
| $100,000+ | 1,732 (54.3%) | 498 (16.0%) |
| Total | 3,189 (100.0%) | 3,110 (100.0%) |
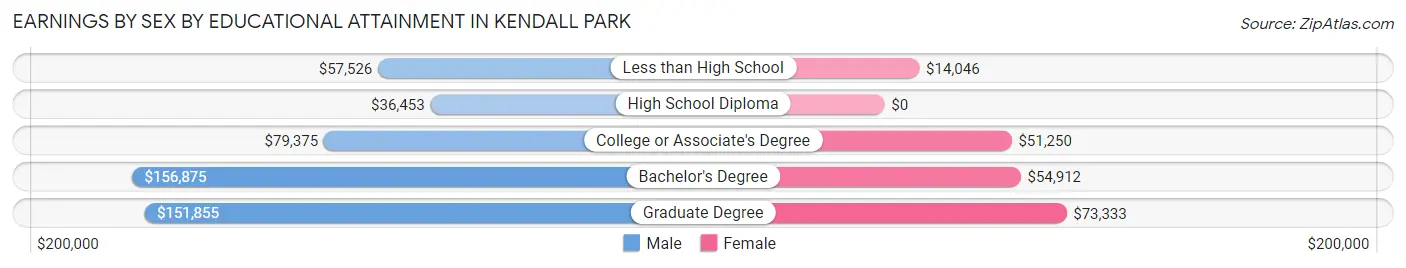
Earnings by Sex by Educational Attainment in Kendall Park
Average earnings in Kendall Park are $125,744 for men and $57,481 for women, a difference of 54.3%. Men with an educational attainment of bachelor's degree enjoy the highest average annual earnings of $156,875, while those with high school diploma education earn the least with $36,453. Women with an educational attainment of graduate degree earn the most with the average annual earnings of $73,333, while those with less than high school education have the smallest earnings of $14,046.
| Educational Attainment | Male Income | Female Income |
| Less than High School | $57,526 | $14,046 |
| High School Diploma | $36,453 | $0 |
| College or Associate's Degree | $79,375 | $51,250 |
| Bachelor's Degree | $156,875 | $54,912 |
| Graduate Degree | $151,855 | $73,333 |
| Total | $125,744 | $57,481 |
Family Income in Kendall Park
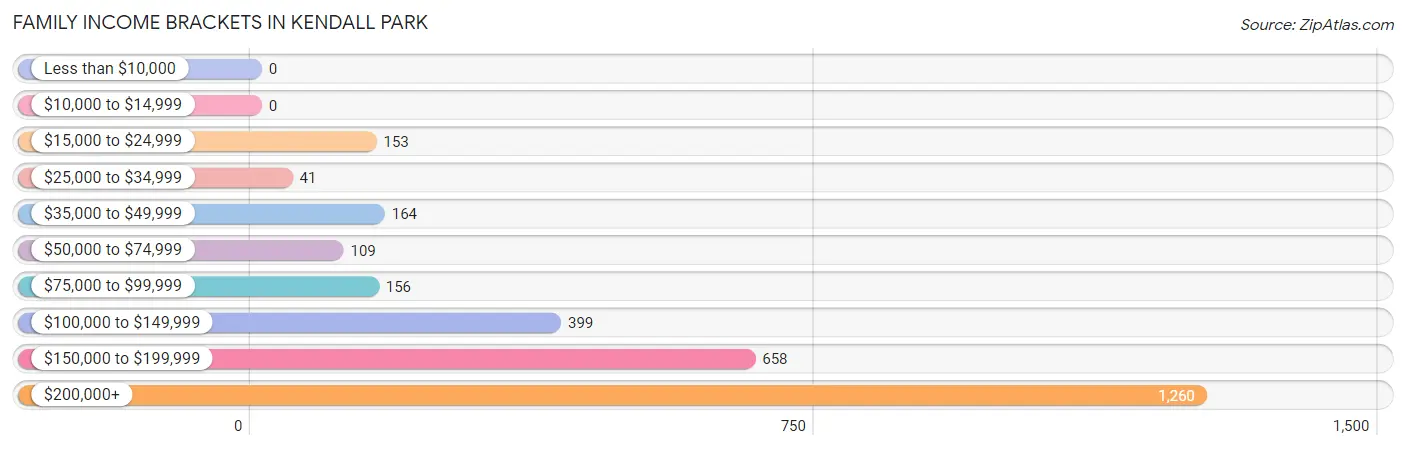
Family Income Brackets in Kendall Park
According to the Kendall Park family income data, there are 1,260 families falling into the $200,000+ income range, which is the most common income bracket and makes up 42.9% of all families.
| Income Bracket | # Families | % Families |
| Less than $10,000 | 0 | 0.0% |
| $10,000 to $14,999 | 0 | 0.0% |
| $15,000 to $24,999 | 153 | 5.2% |
| $25,000 to $34,999 | 41 | 1.4% |
| $35,000 to $49,999 | 164 | 5.6% |
| $50,000 to $74,999 | 109 | 3.7% |
| $75,000 to $99,999 | 156 | 5.3% |
| $100,000 to $149,999 | 399 | 13.6% |
| $150,000 to $199,999 | 658 | 22.4% |
| $200,000+ | 1,260 | 42.9% |
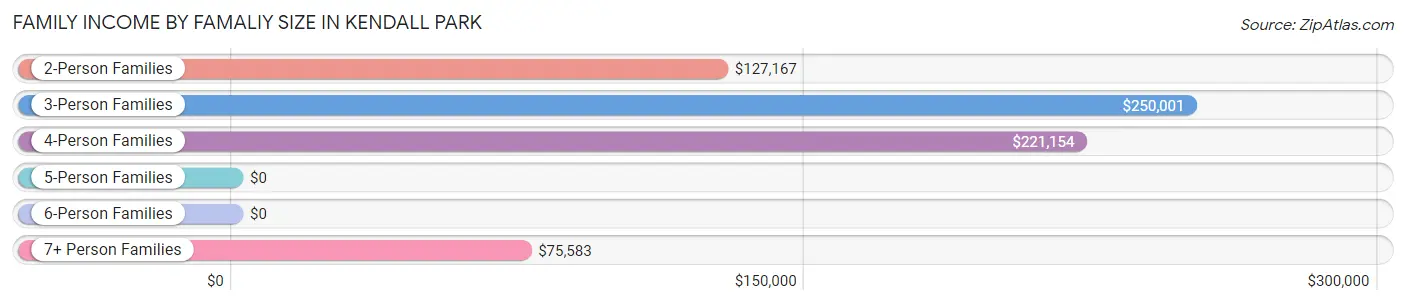
Family Income by Famaliy Size in Kendall Park
3-person families (707 | 24.1%) account for the highest median family income in Kendall Park with $250,001 per family, while 3-person families (707 | 24.1%) have the highest median income of $83,334 per family member.
| Income Bracket | # Families | Median Income |
| 2-Person Families | 964 (32.8%) | $127,167 |
| 3-Person Families | 707 (24.1%) | $250,001 |
| 4-Person Families | 962 (32.8%) | $221,154 |
| 5-Person Families | 165 (5.6%) | $0 |
| 6-Person Families | 101 (3.4%) | $0 |
| 7+ Person Families | 37 (1.3%) | $75,583 |
| Total | 2,936 (100.0%) | $180,891 |
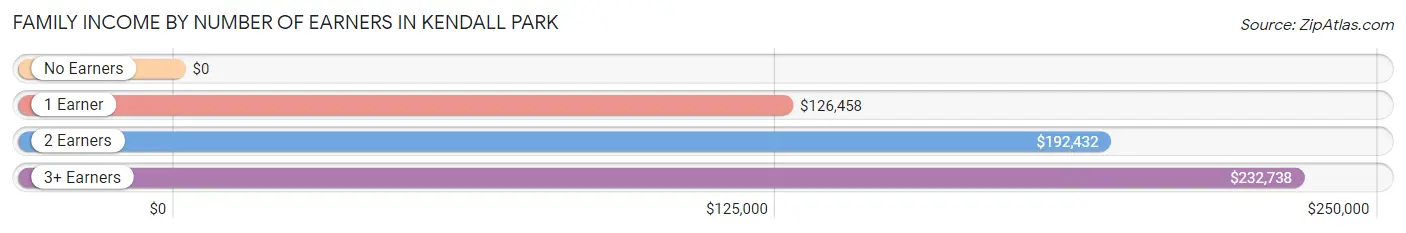
Family Income by Number of Earners in Kendall Park
| Number of Earners | # Families | Median Income |
| No Earners | 163 (5.6%) | $0 |
| 1 Earner | 651 (22.2%) | $126,458 |
| 2 Earners | 1,338 (45.6%) | $192,432 |
| 3+ Earners | 784 (26.7%) | $232,738 |
| Total | 2,936 (100.0%) | $180,891 |
Household Income in Kendall Park
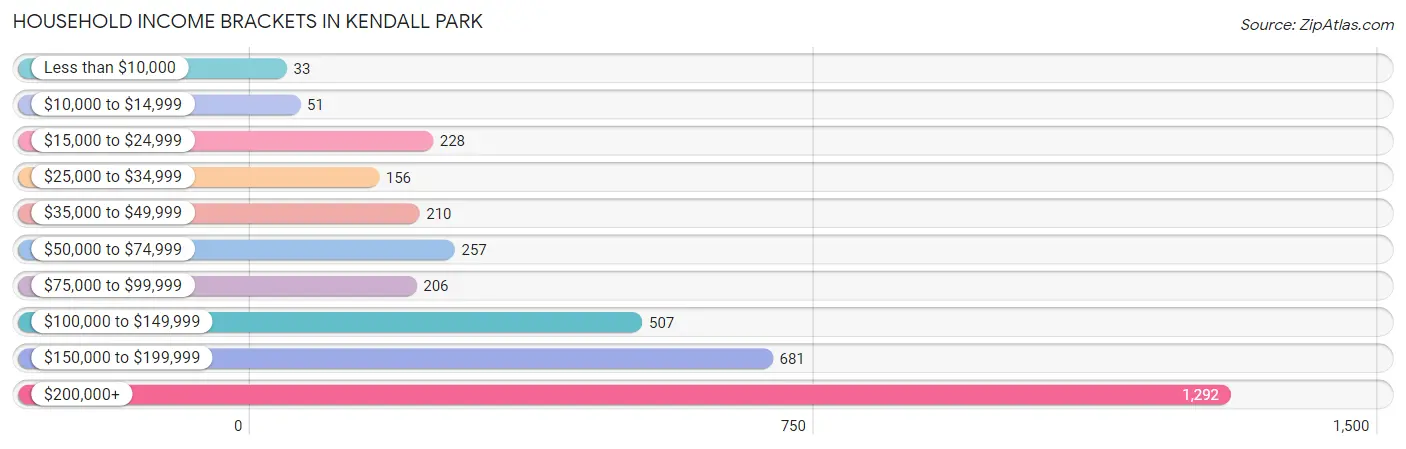
Household Income Brackets in Kendall Park
With 1,292 households falling in the category, the $200,000+ income range is the most frequent in Kendall Park, accounting for 35.7% of all households. In contrast, only 33 households (0.9%) fall into the less than $10,000 income bracket, making it the least populous group.
| Income Bracket | # Households | % Households |
| Less than $10,000 | 33 | 0.9% |
| $10,000 to $14,999 | 51 | 1.4% |
| $15,000 to $24,999 | 228 | 6.3% |
| $25,000 to $34,999 | 156 | 4.3% |
| $35,000 to $49,999 | 210 | 5.8% |
| $50,000 to $74,999 | 257 | 7.1% |
| $75,000 to $99,999 | 206 | 5.7% |
| $100,000 to $149,999 | 507 | 14.0% |
| $150,000 to $199,999 | 681 | 18.8% |
| $200,000+ | 1,292 | 35.7% |
Household Income by Householder Age in Kendall Park
The median household income in Kendall Park is $159,362, with the highest median household income of $185,703 found in the 45 to 64 years age bracket for the primary householder. A total of 2,092 households (57.8%) fall into this category.
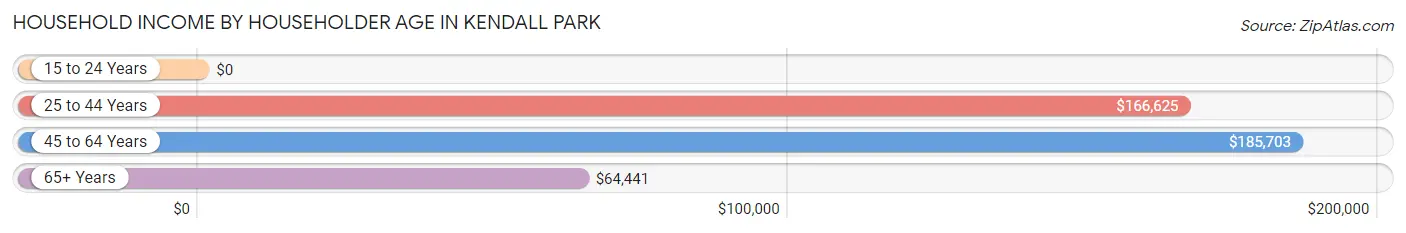
| Income Bracket | # Households | Median Income |
| 15 to 24 Years | 0 (0.0%) | $0 |
| 25 to 44 Years | 699 (19.3%) | $166,625 |
| 45 to 64 Years | 2,092 (57.8%) | $185,703 |
| 65+ Years | 829 (22.9%) | $64,441 |
| Total | 3,620 (100.0%) | $159,362 |
Poverty in Kendall Park
Income Below Poverty by Sex and Age in Kendall Park
With 3.5% poverty level for males and 5.2% for females among the residents of Kendall Park, 5 year old males and under 5 year old females are the most vulnerable to poverty, with 26 males (31.3%) and 72 females (23.2%) in their respective age groups living below the poverty level.
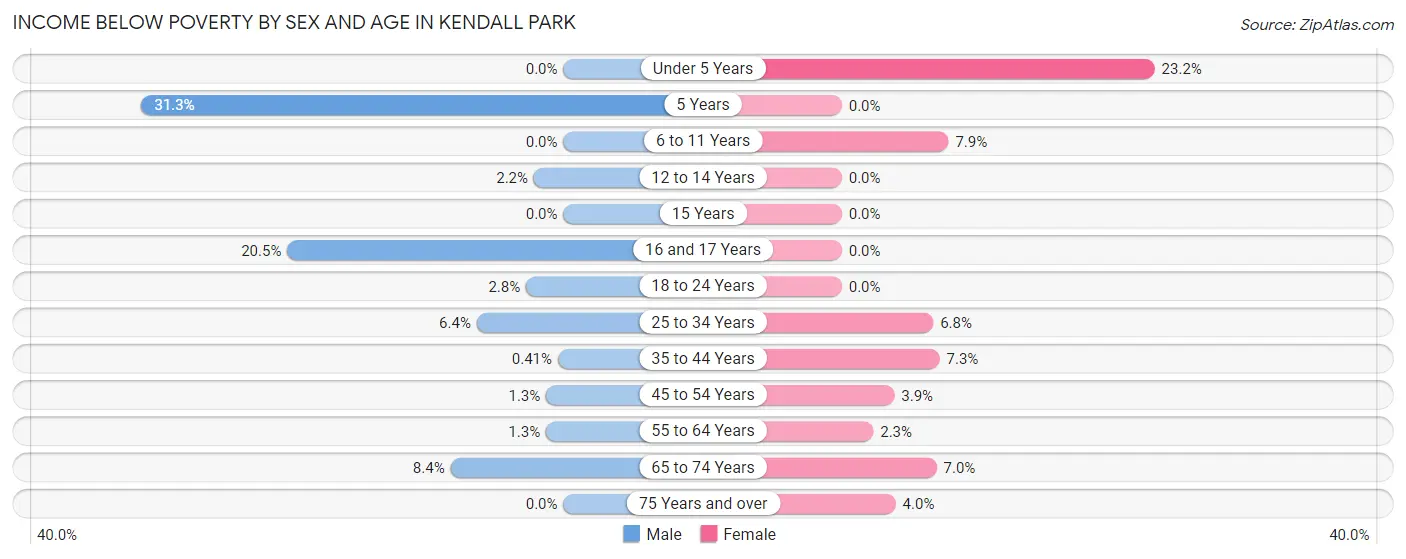
| Age Bracket | Male | Female |
| Under 5 Years | 0 (0.0%) | 72 (23.2%) |
| 5 Years | 26 (31.3%) | 0 (0.0%) |
| 6 to 11 Years | 0 (0.0%) | 32 (7.9%) |
| 12 to 14 Years | 4 (2.2%) | 0 (0.0%) |
| 15 Years | 0 (0.0%) | 0 (0.0%) |
| 16 and 17 Years | 41 (20.5%) | 0 (0.0%) |
| 18 to 24 Years | 13 (2.8%) | 0 (0.0%) |
| 25 to 34 Years | 29 (6.4%) | 36 (6.8%) |
| 35 to 44 Years | 2 (0.4%) | 41 (7.3%) |
| 45 to 54 Years | 14 (1.3%) | 42 (3.9%) |
| 55 to 64 Years | 9 (1.3%) | 20 (2.3%) |
| 65 to 74 Years | 30 (8.4%) | 39 (7.0%) |
| 75 Years and over | 0 (0.0%) | 15 (4.0%) |
| Total | 168 (3.5%) | 297 (5.2%) |
Income Above Poverty by Sex and Age in Kendall Park
According to the poverty statistics in Kendall Park, males aged under 5 years and females aged 5 years are the age groups that are most secure financially, with 100.0% of males and 100.0% of females in these age groups living above the poverty line.
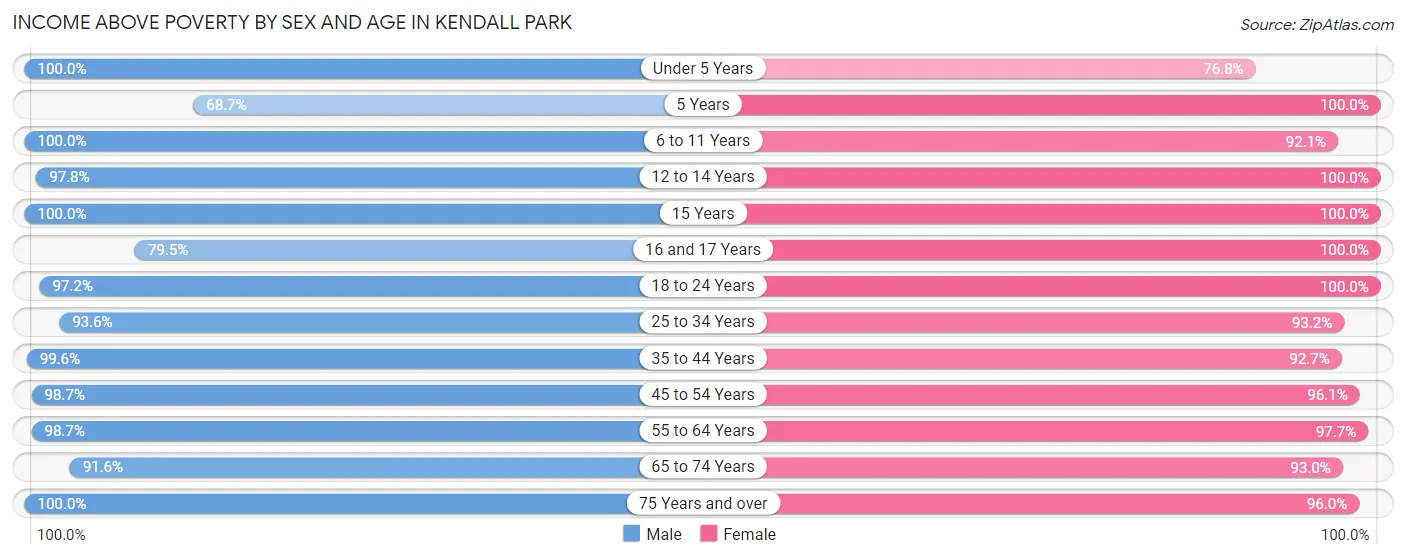
| Age Bracket | Male | Female |
| Under 5 Years | 155 (100.0%) | 238 (76.8%) |
| 5 Years | 57 (68.7%) | 24 (100.0%) |
| 6 to 11 Years | 384 (100.0%) | 372 (92.1%) |
| 12 to 14 Years | 179 (97.8%) | 235 (100.0%) |
| 15 Years | 88 (100.0%) | 112 (100.0%) |
| 16 and 17 Years | 159 (79.5%) | 119 (100.0%) |
| 18 to 24 Years | 456 (97.2%) | 532 (100.0%) |
| 25 to 34 Years | 422 (93.6%) | 494 (93.2%) |
| 35 to 44 Years | 485 (99.6%) | 524 (92.7%) |
| 45 to 54 Years | 1,082 (98.7%) | 1,036 (96.1%) |
| 55 to 64 Years | 689 (98.7%) | 834 (97.7%) |
| 65 to 74 Years | 328 (91.6%) | 515 (93.0%) |
| 75 Years and over | 200 (100.0%) | 360 (96.0%) |
| Total | 4,684 (96.5%) | 5,395 (94.8%) |
Income Below Poverty Among Married-Couple Families in Kendall Park
The poverty statistics for married-couple families in Kendall Park show that 2.5% or 64 of the total 2,556 families live below the poverty line. Families with 3 or 4 children have the highest poverty rate of 16.2%, comprising of 21 families. On the other hand, families with 1 or 2 children have the lowest poverty rate of 0.4%, which includes 4 families.
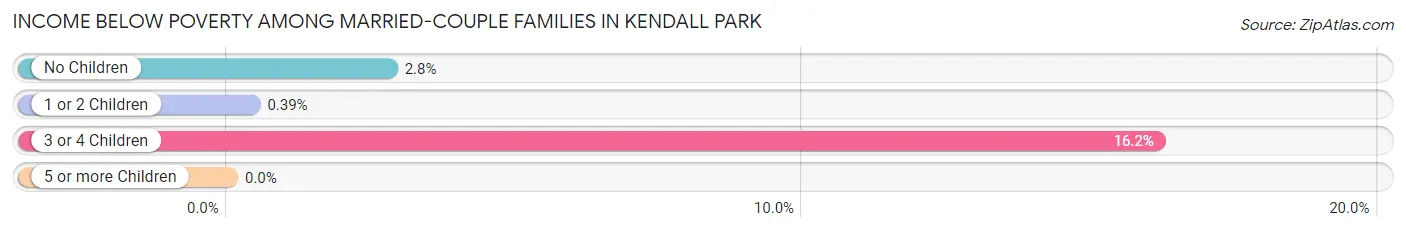
| Children | Above Poverty | Below Poverty |
| No Children | 1,362 (97.2%) | 39 (2.8%) |
| 1 or 2 Children | 1,021 (99.6%) | 4 (0.4%) |
| 3 or 4 Children | 109 (83.9%) | 21 (16.2%) |
| 5 or more Children | 0 (0.0%) | 0 (0.0%) |
| Total | 2,492 (97.5%) | 64 (2.5%) |
Income Below Poverty Among Single-Parent Households in Kendall Park
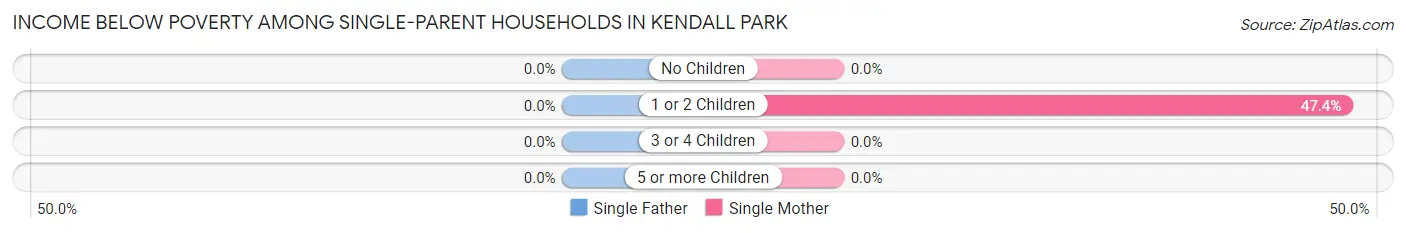
| Children | Single Father | Single Mother |
| No Children | 0 (0.0%) | 0 (0.0%) |
| 1 or 2 Children | 0 (0.0%) | 37 (47.4%) |
| 3 or 4 Children | 0 (0.0%) | 0 (0.0%) |
| 5 or more Children | 0 (0.0%) | 0 (0.0%) |
| Total | 0 (0.0%) | 37 (14.5%) |
Income Below Poverty Among Married-Couple vs Single-Parent Households in Kendall Park
The poverty data for Kendall Park shows that 64 of the married-couple family households (2.5%) and 37 of the single-parent households (9.7%) are living below the poverty level. Within the married-couple family households, those with 3 or 4 children have the highest poverty rate, with 21 households (16.2%) falling below the poverty line. Among the single-parent households, those with 1 or 2 children have the highest poverty rate, with 37 household (23.9%) living below poverty.
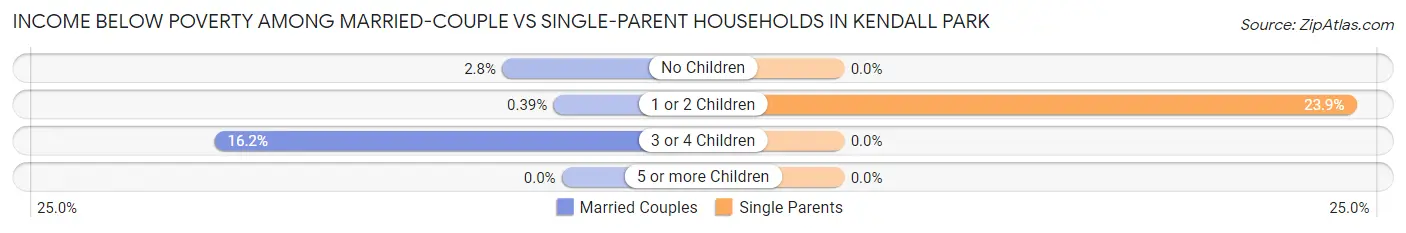
| Children | Married-Couple Families | Single-Parent Households |
| No Children | 39 (2.8%) | 0 (0.0%) |
| 1 or 2 Children | 4 (0.4%) | 37 (23.9%) |
| 3 or 4 Children | 21 (16.2%) | 0 (0.0%) |
| 5 or more Children | 0 (0.0%) | 0 (0.0%) |
| Total | 64 (2.5%) | 37 (9.7%) |
Race in Kendall Park
The most populous races in Kendall Park are White / Caucasian (5,687 | 53.5%), Asian (3,283 | 30.9%), and Hispanic or Latino (1,534 | 14.4%).
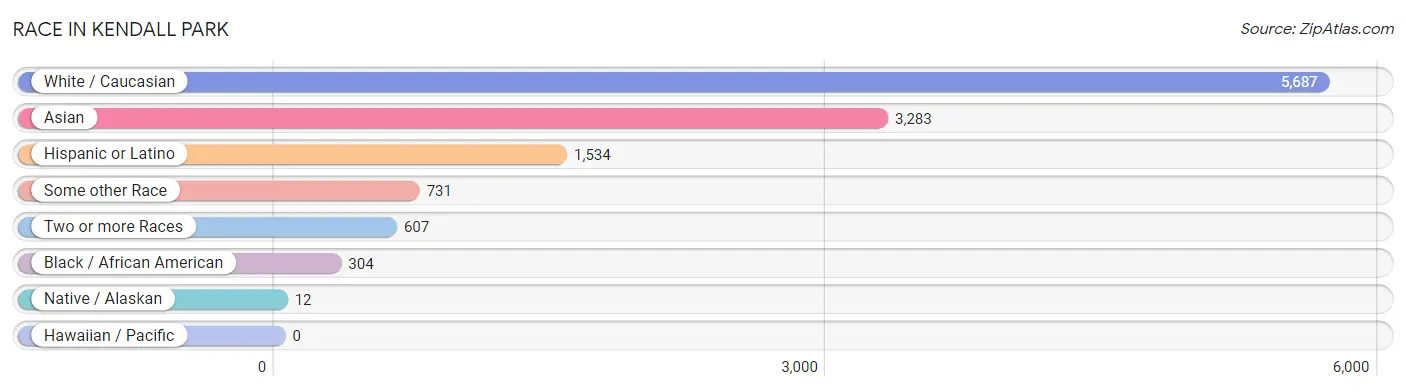
| Race | # Population | % Population |
| Asian | 3,283 | 30.9% |
| Black / African American | 304 | 2.9% |
| Hawaiian / Pacific | 0 | 0.0% |
| Hispanic or Latino | 1,534 | 14.4% |
| Native / Alaskan | 12 | 0.1% |
| White / Caucasian | 5,687 | 53.5% |
| Two or more Races | 607 | 5.7% |
| Some other Race | 731 | 6.9% |
| Total | 10,624 | 100.0% |
Ancestry in Kendall Park
The most populous ancestries reported in Kendall Park are Thai (2,295 | 21.6%), Italian (2,028 | 19.1%), German (1,197 | 11.3%), Irish (1,135 | 10.7%), and Mexican (773 | 7.3%), together accounting for 69.9% of all Kendall Park residents.
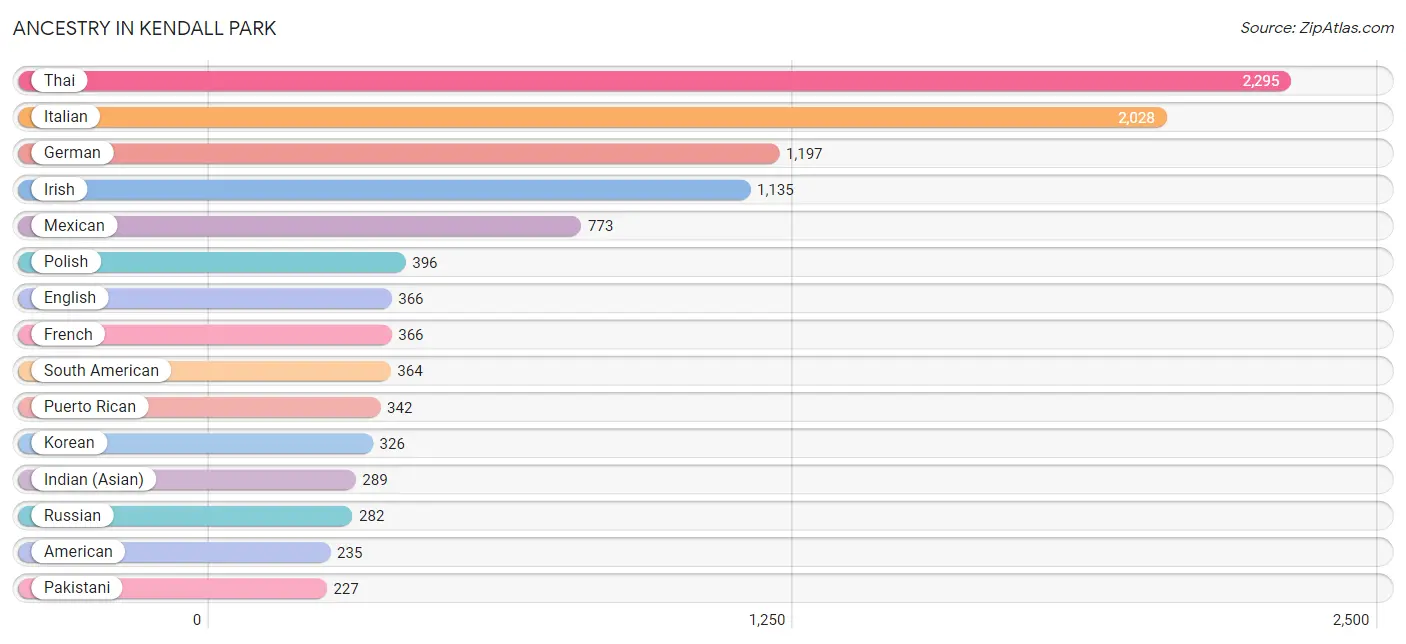
| Ancestry | # Population | % Population |
| African | 53 | 0.5% |
| American | 235 | 2.2% |
| Arab | 131 | 1.2% |
| Argentinean | 17 | 0.2% |
| Austrian | 17 | 0.2% |
| Belgian | 25 | 0.2% |
| Blackfeet | 12 | 0.1% |
| Brazilian | 13 | 0.1% |
| British | 104 | 1.0% |
| Bulgarian | 11 | 0.1% |
| Burmese | 10 | 0.1% |
| Central American Indian | 12 | 0.1% |
| Colombian | 100 | 0.9% |
| Cuban | 20 | 0.2% |
| Czech | 29 | 0.3% |
| Dominican | 18 | 0.2% |
| Dutch | 12 | 0.1% |
| Eastern European | 36 | 0.3% |
| Egyptian | 120 | 1.1% |
| English | 366 | 3.5% |
| European | 10 | 0.1% |
| Filipino | 87 | 0.8% |
| French | 366 | 3.5% |
| French Canadian | 55 | 0.5% |
| German | 1,197 | 11.3% |
| Greek | 63 | 0.6% |
| Guyanese | 37 | 0.4% |
| Hungarian | 213 | 2.0% |
| Indian (Asian) | 289 | 2.7% |
| Irish | 1,135 | 10.7% |
| Iroquois | 12 | 0.1% |
| Italian | 2,028 | 19.1% |
| Jamaican | 11 | 0.1% |
| Korean | 326 | 3.1% |
| Lebanese | 11 | 0.1% |
| Lithuanian | 36 | 0.3% |
| Mexican | 773 | 7.3% |
| Norwegian | 46 | 0.4% |
| Pakistani | 227 | 2.1% |
| Peruvian | 146 | 1.4% |
| Polish | 396 | 3.7% |
| Portuguese | 60 | 0.6% |
| Puerto Rican | 342 | 3.2% |
| Romanian | 33 | 0.3% |
| Russian | 282 | 2.6% |
| Scotch-Irish | 32 | 0.3% |
| Scottish | 48 | 0.4% |
| Serbian | 27 | 0.3% |
| Slovak | 8 | 0.1% |
| South American | 364 | 3.4% |
| Sri Lankan | 62 | 0.6% |
| Subsaharan African | 53 | 0.5% |
| Swedish | 20 | 0.2% |
| Thai | 2,295 | 21.6% |
| Turkish | 76 | 0.7% |
| Ukrainian | 18 | 0.2% |
| Venezuelan | 58 | 0.5% |
| Welsh | 9 | 0.1% |
| West Indian | 11 | 0.1% |
| Yugoslavian | 10 | 0.1% | View All 60 Rows |
Immigrants in Kendall Park
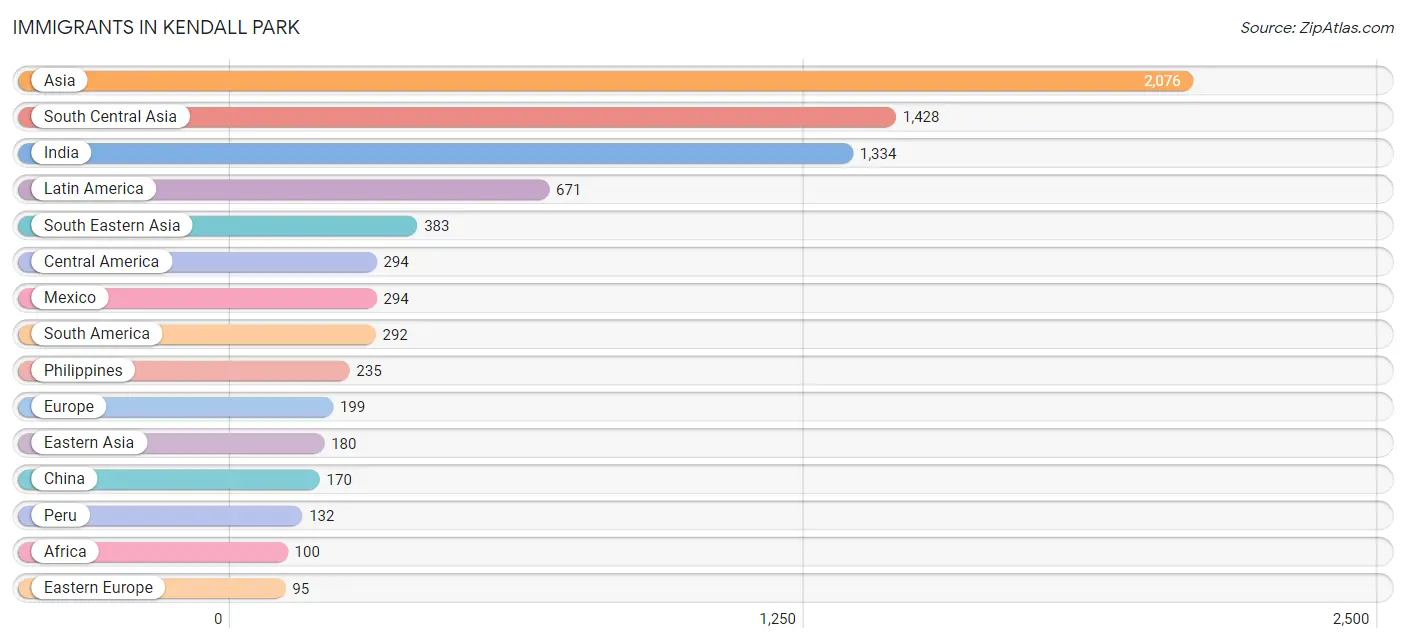
The most numerous immigrant groups reported in Kendall Park came from Asia (2,076 | 19.5%), South Central Asia (1,428 | 13.4%), India (1,334 | 12.6%), Latin America (671 | 6.3%), and South Eastern Asia (383 | 3.6%), together accounting for 55.5% of all Kendall Park residents.
| Immigration Origin | # Population | % Population |
| Africa | 100 | 0.9% |
| Argentina | 17 | 0.2% |
| Asia | 2,076 | 19.5% |
| Australia | 27 | 0.3% |
| Bangladesh | 16 | 0.2% |
| Barbados | 11 | 0.1% |
| Brazil | 24 | 0.2% |
| Bulgaria | 11 | 0.1% |
| Caribbean | 85 | 0.8% |
| Central America | 294 | 2.8% |
| China | 170 | 1.6% |
| Colombia | 3 | 0.0% |
| Cuba | 20 | 0.2% |
| Eastern Africa | 6 | 0.1% |
| Eastern Asia | 180 | 1.7% |
| Eastern Europe | 95 | 0.9% |
| Ecuador | 15 | 0.1% |
| Egypt | 80 | 0.7% |
| England | 22 | 0.2% |
| Europe | 199 | 1.9% |
| France | 26 | 0.2% |
| Greece | 19 | 0.2% |
| Guyana | 37 | 0.4% |
| Hong Kong | 69 | 0.6% |
| Hungary | 44 | 0.4% |
| India | 1,334 | 12.6% |
| Israel | 35 | 0.3% |
| Jamaica | 11 | 0.1% |
| Kenya | 6 | 0.1% |
| Korea | 10 | 0.1% |
| Latin America | 671 | 6.3% |
| Malaysia | 20 | 0.2% |
| Mexico | 294 | 2.8% |
| Northern Africa | 80 | 0.7% |
| Northern Europe | 44 | 0.4% |
| Oceania | 27 | 0.3% |
| Pakistan | 66 | 0.6% |
| Peru | 132 | 1.2% |
| Philippines | 235 | 2.2% |
| Poland | 13 | 0.1% |
| Saudi Arabia | 25 | 0.2% |
| South America | 292 | 2.8% |
| South Central Asia | 1,428 | 13.4% |
| South Eastern Asia | 383 | 3.6% |
| Southern Europe | 19 | 0.2% |
| Sri Lanka | 12 | 0.1% |
| Switzerland | 15 | 0.1% |
| Taiwan | 37 | 0.4% |
| Thailand | 74 | 0.7% |
| Turkey | 13 | 0.1% |
| Venezuela | 64 | 0.6% |
| Vietnam | 54 | 0.5% |
| Western Asia | 85 | 0.8% |
| Western Europe | 41 | 0.4% | View All 54 Rows |
Sex and Age in Kendall Park
Sex and Age in Kendall Park
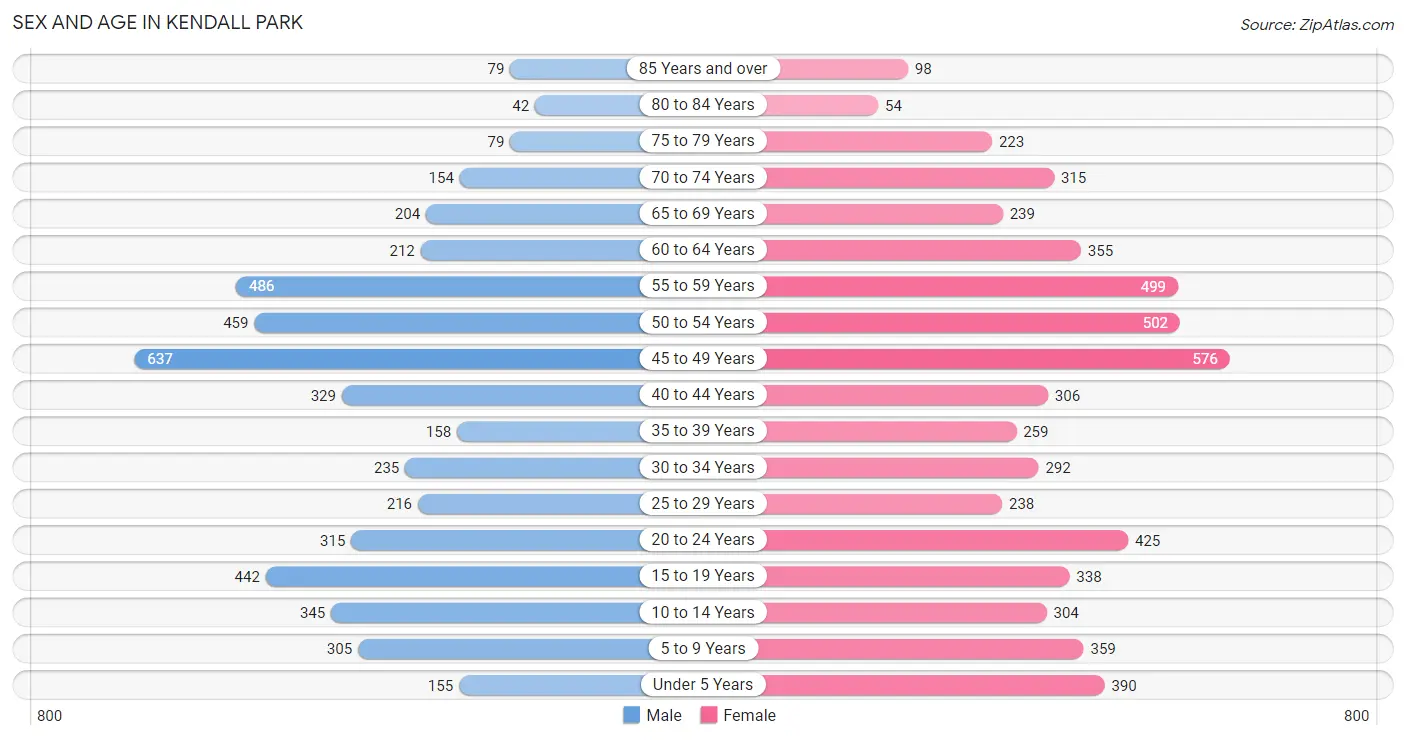
The most populous age groups in Kendall Park are 45 to 49 Years (637 | 13.1%) for men and 45 to 49 Years (576 | 10.0%) for women.
| Age Bracket | Male | Female |
| Under 5 Years | 155 (3.2%) | 390 (6.8%) |
| 5 to 9 Years | 305 (6.3%) | 359 (6.2%) |
| 10 to 14 Years | 345 (7.1%) | 304 (5.3%) |
| 15 to 19 Years | 442 (9.1%) | 338 (5.9%) |
| 20 to 24 Years | 315 (6.5%) | 425 (7.4%) |
| 25 to 29 Years | 216 (4.4%) | 238 (4.1%) |
| 30 to 34 Years | 235 (4.8%) | 292 (5.1%) |
| 35 to 39 Years | 158 (3.3%) | 259 (4.5%) |
| 40 to 44 Years | 329 (6.8%) | 306 (5.3%) |
| 45 to 49 Years | 637 (13.1%) | 576 (10.0%) |
| 50 to 54 Years | 459 (9.5%) | 502 (8.7%) |
| 55 to 59 Years | 486 (10.0%) | 499 (8.6%) |
| 60 to 64 Years | 212 (4.4%) | 355 (6.1%) |
| 65 to 69 Years | 204 (4.2%) | 239 (4.1%) |
| 70 to 74 Years | 154 (3.2%) | 315 (5.5%) |
| 75 to 79 Years | 79 (1.6%) | 223 (3.9%) |
| 80 to 84 Years | 42 (0.9%) | 54 (0.9%) |
| 85 Years and over | 79 (1.6%) | 98 (1.7%) |
| Total | 4,852 (100.0%) | 5,772 (100.0%) |
Families and Households in Kendall Park
Median Family Size in Kendall Park
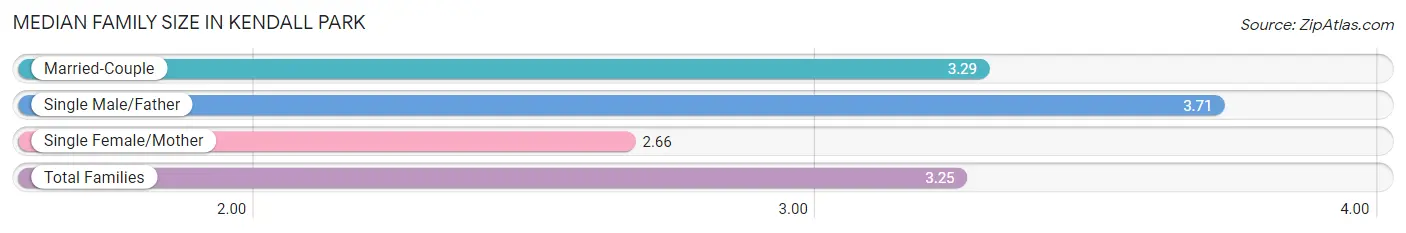
The median family size in Kendall Park is 3.25 persons per family, with single male/father families (125 | 4.3%) accounting for the largest median family size of 3.71 persons per family. On the other hand, single female/mother families (255 | 8.7%) represent the smallest median family size with 2.66 persons per family.
| Family Type | # Families | Family Size |
| Married-Couple | 2,556 (87.1%) | 3.29 |
| Single Male/Father | 125 (4.3%) | 3.71 |
| Single Female/Mother | 255 (8.7%) | 2.66 |
| Total Families | 2,936 (100.0%) | 3.25 |
Median Household Size in Kendall Park
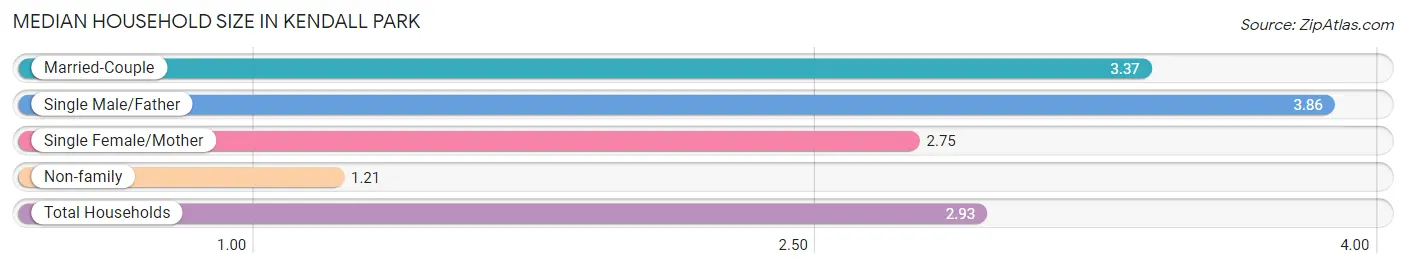
The median household size in Kendall Park is 2.93 persons per household, with single male/father households (125 | 3.5%) accounting for the largest median household size of 3.86 persons per household. non-family households (684 | 18.9%) represent the smallest median household size with 1.21 persons per household.
| Household Type | # Households | Household Size |
| Married-Couple | 2,556 (70.6%) | 3.37 |
| Single Male/Father | 125 (3.5%) | 3.86 |
| Single Female/Mother | 255 (7.0%) | 2.75 |
| Non-family | 684 (18.9%) | 1.21 |
| Total Households | 3,620 (100.0%) | 2.93 |
Household Size by Marriage Status in Kendall Park
Out of a total of 3,620 households in Kendall Park, 2,936 (81.1%) are family households, while 684 (18.9%) are nonfamily households. The most numerous type of family households are 2-person households, comprising 942, and the most common type of nonfamily households are 1-person households, comprising 580.
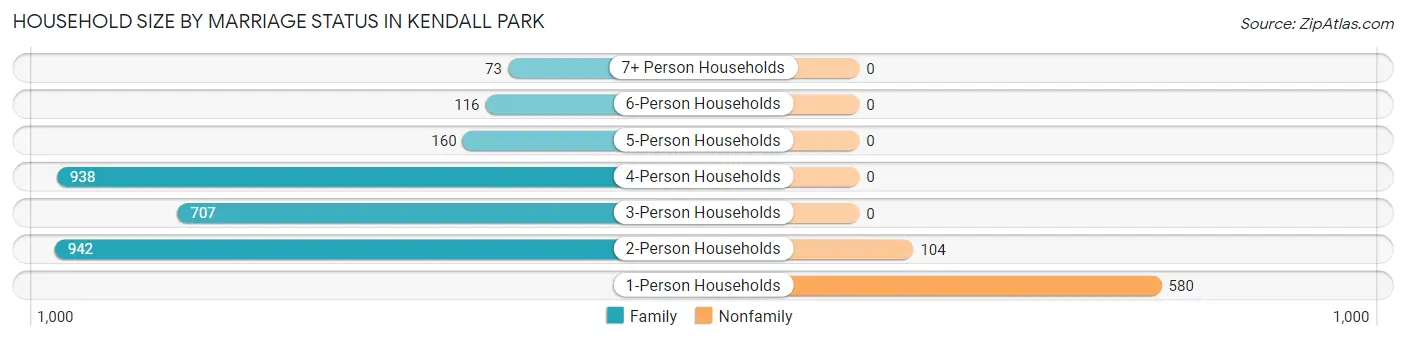
| Household Size | Family Households | Nonfamily Households |
| 1-Person Households | - | 580 (16.0%) |
| 2-Person Households | 942 (26.0%) | 104 (2.9%) |
| 3-Person Households | 707 (19.5%) | 0 (0.0%) |
| 4-Person Households | 938 (25.9%) | 0 (0.0%) |
| 5-Person Households | 160 (4.4%) | 0 (0.0%) |
| 6-Person Households | 116 (3.2%) | 0 (0.0%) |
| 7+ Person Households | 73 (2.0%) | 0 (0.0%) |
| Total | 2,936 (81.1%) | 684 (18.9%) |
Female Fertility in Kendall Park
Fertility by Age in Kendall Park
Average fertility rate in Kendall Park is 19.0 births per 1,000 women. Women in the age bracket of 20 to 34 years have the highest fertility rate with 28.0 births per 1,000 women. Women in the age bracket of 20 to 34 years acount for 56.2% of all women with births.
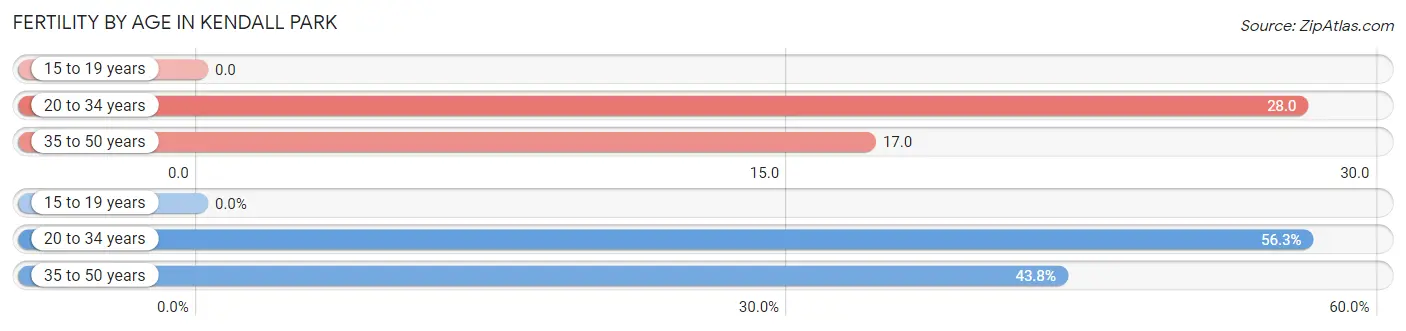
| Age Bracket | Women with Births | Births / 1,000 Women |
| 15 to 19 years | 0 (0.0%) | 0.0 |
| 20 to 34 years | 27 (56.2%) | 28.0 |
| 35 to 50 years | 21 (43.8%) | 17.0 |
| Total | 48 (100.0%) | 19.0 |
Fertility by Age by Marriage Status in Kendall Park
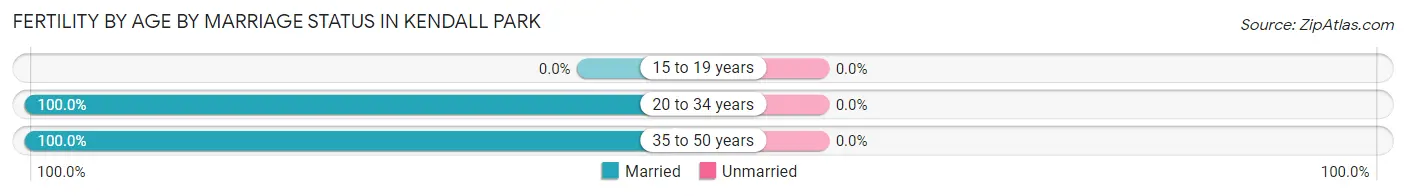
| Age Bracket | Married | Unmarried |
| 15 to 19 years | 0 (0.0%) | 0 (0.0%) |
| 20 to 34 years | 27 (100.0%) | 0 (0.0%) |
| 35 to 50 years | 21 (100.0%) | 0 (0.0%) |
| Total | 48 (100.0%) | 0 (0.0%) |
Fertility by Education in Kendall Park
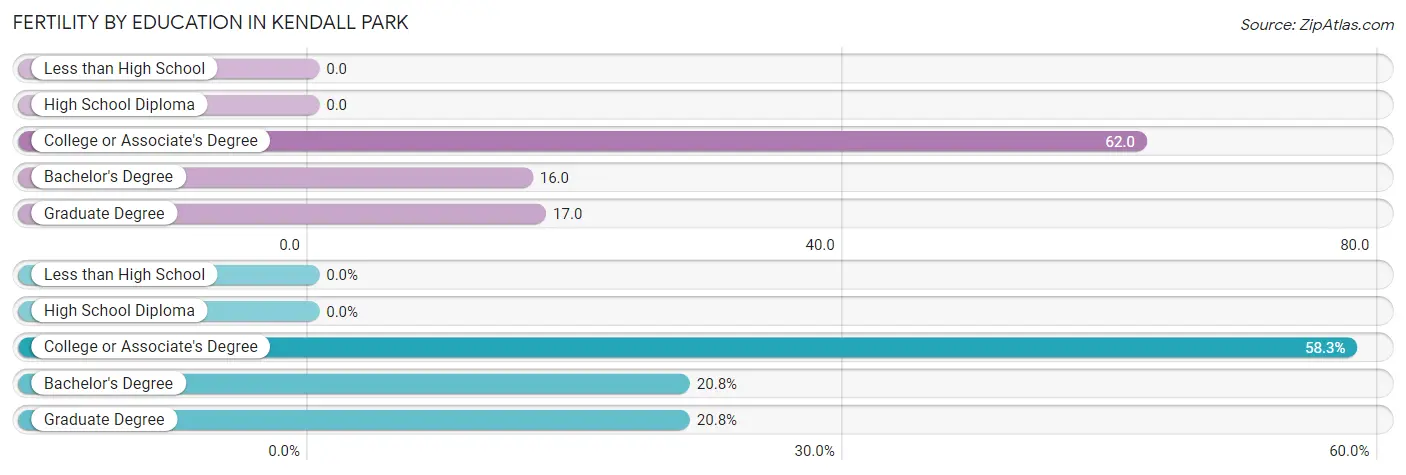
| Educational Attainment | Women with Births | Births / 1,000 Women |
| Less than High School | 0 (0.0%) | 0.0 |
| High School Diploma | 0 (0.0%) | 0.0 |
| College or Associate's Degree | 28 (58.3%) | 62.0 |
| Bachelor's Degree | 10 (20.8%) | 16.0 |
| Graduate Degree | 10 (20.8%) | 17.0 |
| Total | 48 (100.0%) | 19.0 |
Fertility by Education by Marriage Status in Kendall Park
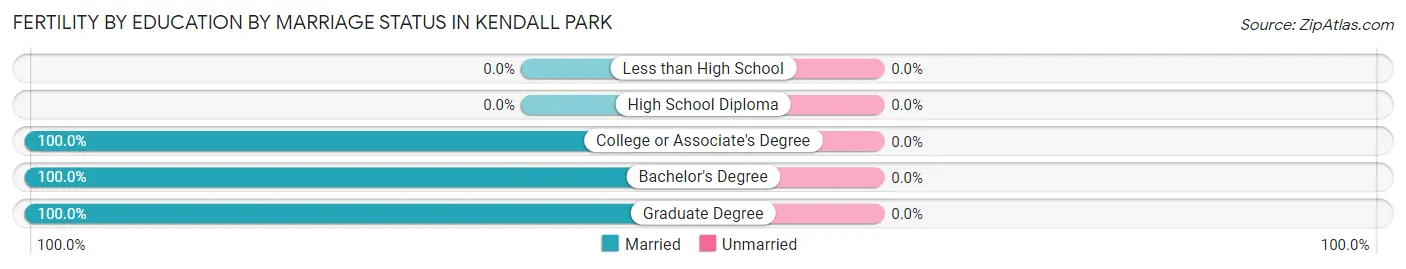
| Educational Attainment | Married | Unmarried |
| Less than High School | 0 (0.0%) | 0 (0.0%) |
| High School Diploma | 0 (0.0%) | 0 (0.0%) |
| College or Associate's Degree | 28 (100.0%) | 0 (0.0%) |
| Bachelor's Degree | 10 (100.0%) | 0 (0.0%) |
| Graduate Degree | 10 (100.0%) | 0 (0.0%) |
| Total | 48 (100.0%) | 0 (0.0%) |
Employment Characteristics in Kendall Park
Employment by Class of Employer in Kendall Park
Among the 5,667 employed individuals in Kendall Park, private company employees (3,947 | 69.7%), not-for-profit organizations (560 | 9.9%), and local government employees (437 | 7.7%) make up the most common classes of employment.
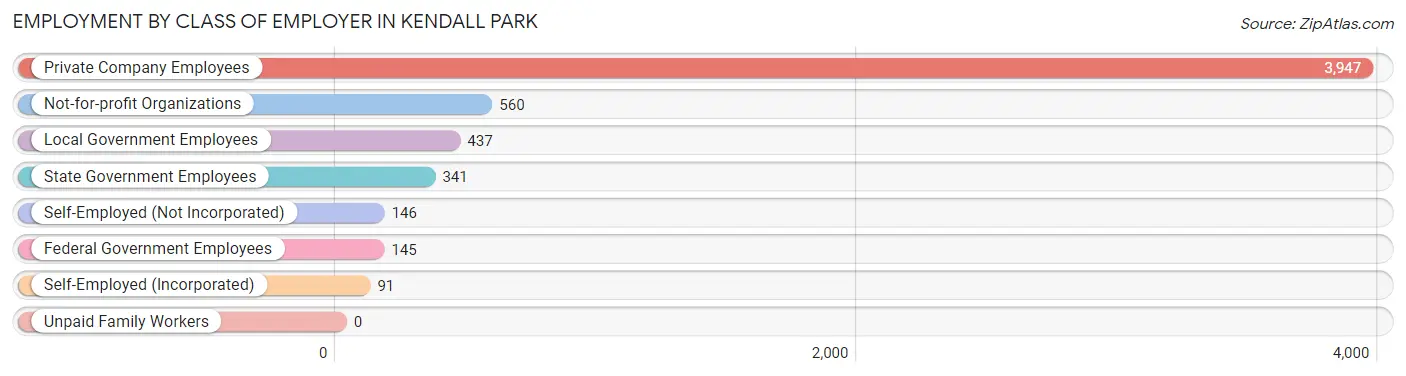
| Employer Class | # Employees | % Employees |
| Private Company Employees | 3,947 | 69.7% |
| Self-Employed (Incorporated) | 91 | 1.6% |
| Self-Employed (Not Incorporated) | 146 | 2.6% |
| Not-for-profit Organizations | 560 | 9.9% |
| Local Government Employees | 437 | 7.7% |
| State Government Employees | 341 | 6.0% |
| Federal Government Employees | 145 | 2.6% |
| Unpaid Family Workers | 0 | 0.0% |
| Total | 5,667 | 100.0% |
Employment Status by Age in Kendall Park
According to the labor force statistics for Kendall Park, out of the total population over 16 years of age (8,566), 71.8% or 6,150 individuals are in the labor force, with 6.4% or 394 of them unemployed. The age group with the highest labor force participation rate is 25 to 29 years, with 92.5% or 420 individuals in the labor force. Within the labor force, the 75 years and over age range has the highest percentage of unemployed individuals, with 45.6% or 88 of them being unemployed.
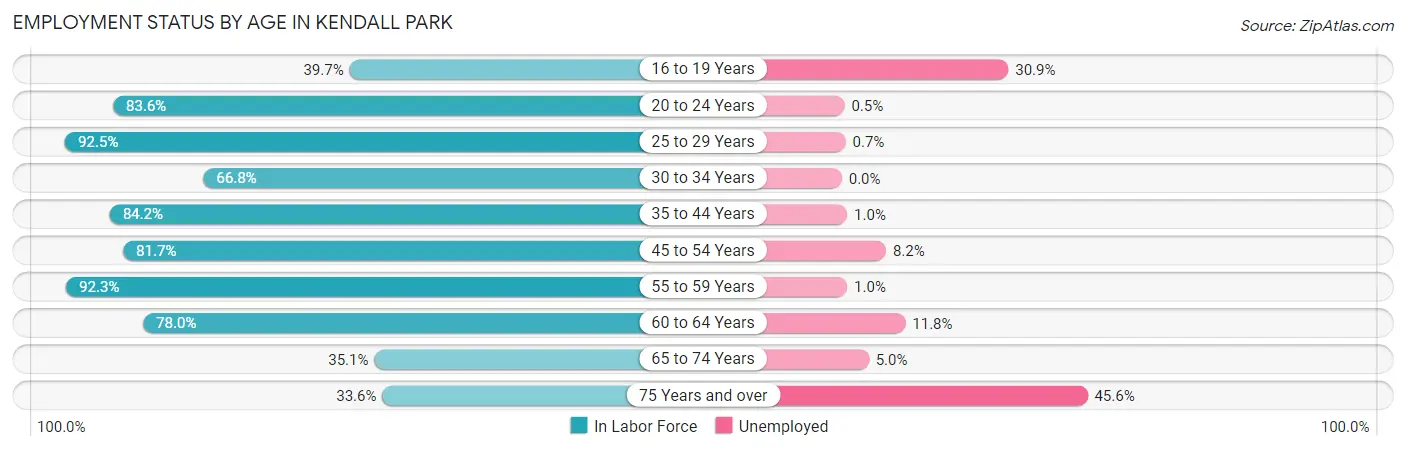
| Age Bracket | In Labor Force | Unemployed |
| 16 to 19 Years | 230 (39.7%) | 71 (30.9%) |
| 20 to 24 Years | 619 (83.6%) | 3 (0.5%) |
| 25 to 29 Years | 420 (92.5%) | 3 (0.7%) |
| 30 to 34 Years | 352 (66.8%) | 0 (0.0%) |
| 35 to 44 Years | 886 (84.2%) | 9 (1.0%) |
| 45 to 54 Years | 1,776 (81.7%) | 146 (8.2%) |
| 55 to 59 Years | 909 (92.3%) | 9 (1.0%) |
| 60 to 64 Years | 442 (78.0%) | 52 (11.8%) |
| 65 to 74 Years | 320 (35.1%) | 16 (5.0%) |
| 75 Years and over | 193 (33.6%) | 88 (45.6%) |
| Total | 6,150 (71.8%) | 394 (6.4%) |
Employment Status by Educational Attainment in Kendall Park
According to labor force statistics for Kendall Park, 83.1% of individuals (4,786) out of the total population between 25 and 64 years of age (5,759) are in the labor force, with 4.6% or 220 of them being unemployed. The group with the highest labor force participation rate are those with the educational attainment of bachelor's degree or higher, with 89.0% or 3,021 individuals in the labor force. Within the labor force, individuals with bachelor's degree or higher education have the highest percentage of unemployment, with 5.6% or 169 of them being unemployed.
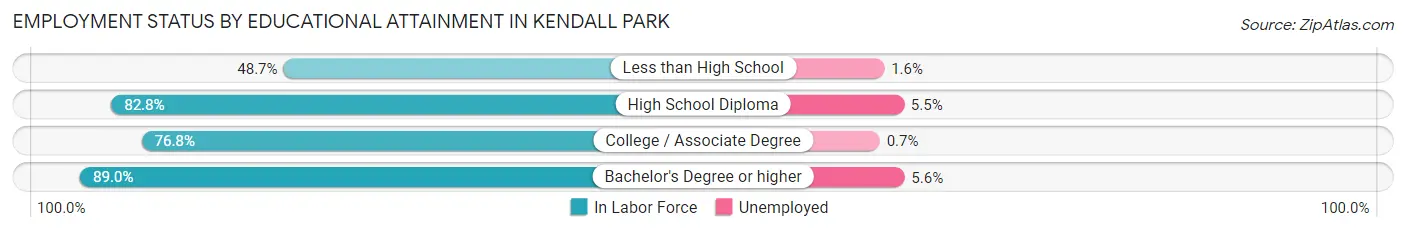
| Educational Attainment | In Labor Force | Unemployed |
| Less than High School | 187 (48.7%) | 6 (1.6%) |
| High School Diploma | 751 (82.8%) | 50 (5.5%) |
| College / Associate Degree | 825 (76.8%) | 8 (0.7%) |
| Bachelor's Degree or higher | 3,021 (89.0%) | 190 (5.6%) |
| Total | 4,786 (83.1%) | 265 (4.6%) |
Employment Occupations by Sex in Kendall Park
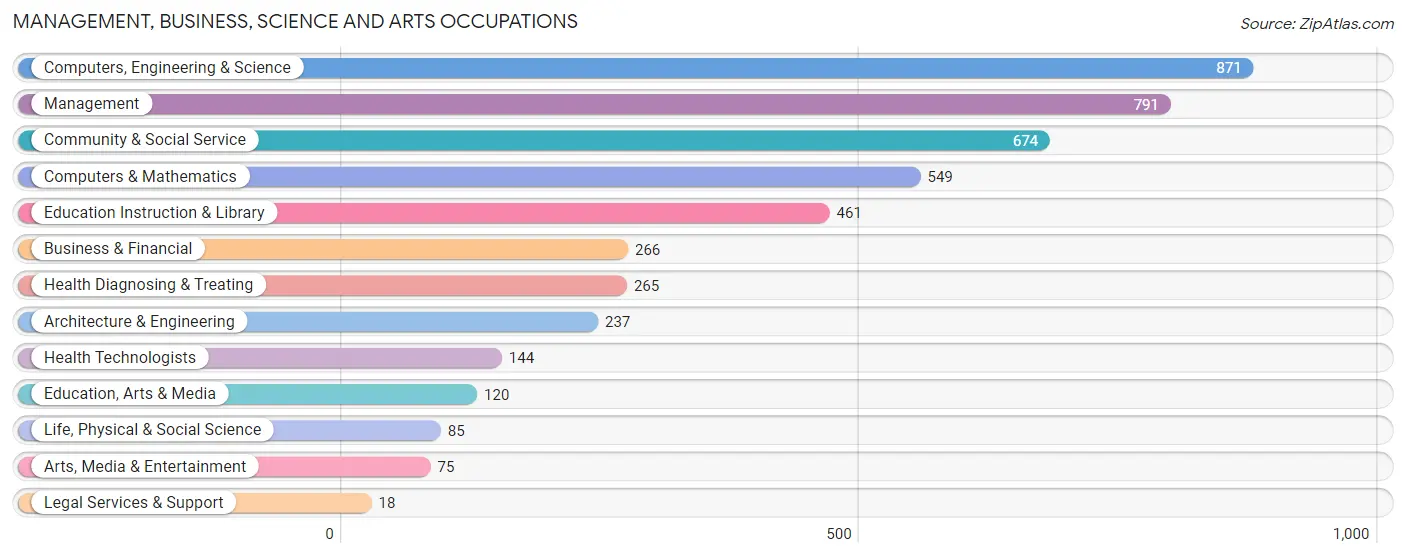
Management, Business, Science and Arts Occupations
The most common Management, Business, Science and Arts occupations in Kendall Park are Computers, Engineering & Science (871 | 15.1%), Management (791 | 13.8%), Community & Social Service (674 | 11.7%), Computers & Mathematics (549 | 9.6%), and Education Instruction & Library (461 | 8.0%).
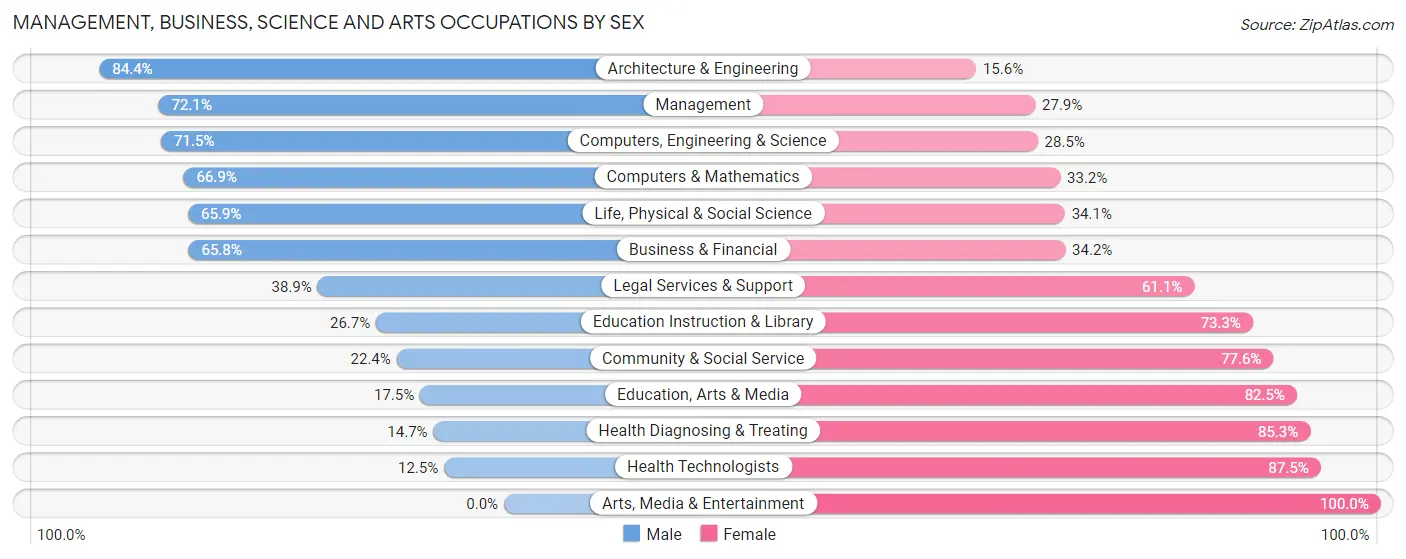
Management, Business, Science and Arts Occupations by Sex
Within the Management, Business, Science and Arts occupations in Kendall Park, the most male-oriented occupations are Architecture & Engineering (84.4%), Management (72.1%), and Computers, Engineering & Science (71.5%), while the most female-oriented occupations are Arts, Media & Entertainment (100.0%), Health Technologists (87.5%), and Health Diagnosing & Treating (85.3%).
| Occupation | Male | Female |
| Management | 570 (72.1%) | 221 (27.9%) |
| Business & Financial | 175 (65.8%) | 91 (34.2%) |
| Computers, Engineering & Science | 623 (71.5%) | 248 (28.5%) |
| Computers & Mathematics | 367 (66.8%) | 182 (33.2%) |
| Architecture & Engineering | 200 (84.4%) | 37 (15.6%) |
| Life, Physical & Social Science | 56 (65.9%) | 29 (34.1%) |
| Community & Social Service | 151 (22.4%) | 523 (77.6%) |
| Education, Arts & Media | 21 (17.5%) | 99 (82.5%) |
| Legal Services & Support | 7 (38.9%) | 11 (61.1%) |
| Education Instruction & Library | 123 (26.7%) | 338 (73.3%) |
| Arts, Media & Entertainment | 0 (0.0%) | 75 (100.0%) |
| Health Diagnosing & Treating | 39 (14.7%) | 226 (85.3%) |
| Health Technologists | 18 (12.5%) | 126 (87.5%) |
| Total (Category) | 1,558 (54.3%) | 1,309 (45.7%) |
| Total (Overall) | 2,911 (50.6%) | 2,840 (49.4%) |
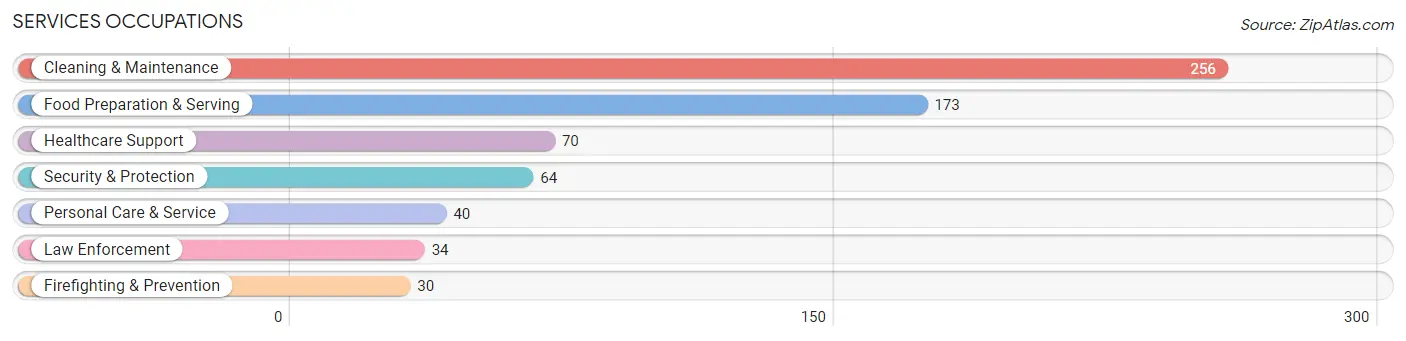
Services Occupations
The most common Services occupations in Kendall Park are Cleaning & Maintenance (256 | 4.4%), Food Preparation & Serving (173 | 3.0%), Healthcare Support (70 | 1.2%), Security & Protection (64 | 1.1%), and Personal Care & Service (40 | 0.7%).
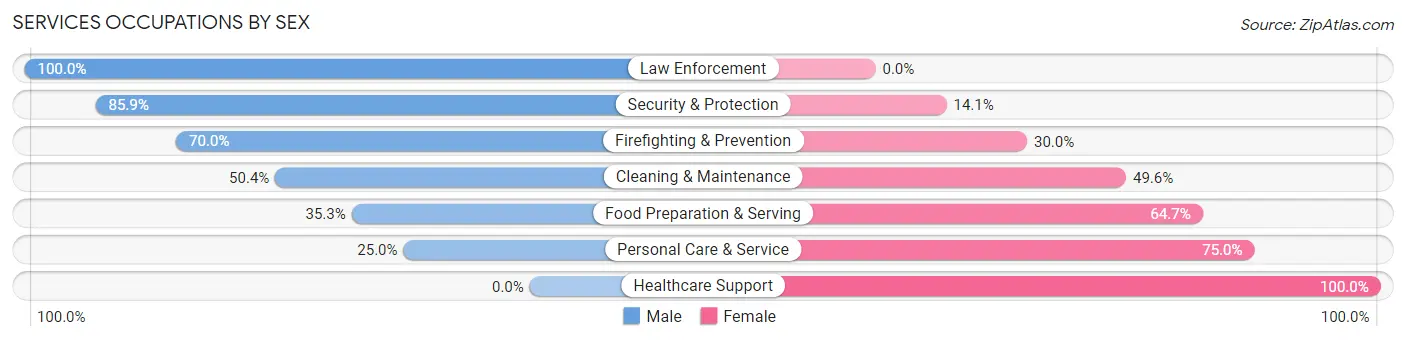
Services Occupations by Sex
Within the Services occupations in Kendall Park, the most male-oriented occupations are Law Enforcement (100.0%), Security & Protection (85.9%), and Firefighting & Prevention (70.0%), while the most female-oriented occupations are Healthcare Support (100.0%), Personal Care & Service (75.0%), and Food Preparation & Serving (64.7%).
| Occupation | Male | Female |
| Healthcare Support | 0 (0.0%) | 70 (100.0%) |
| Security & Protection | 55 (85.9%) | 9 (14.1%) |
| Firefighting & Prevention | 21 (70.0%) | 9 (30.0%) |
| Law Enforcement | 34 (100.0%) | 0 (0.0%) |
| Food Preparation & Serving | 61 (35.3%) | 112 (64.7%) |
| Cleaning & Maintenance | 129 (50.4%) | 127 (49.6%) |
| Personal Care & Service | 10 (25.0%) | 30 (75.0%) |
| Total (Category) | 255 (42.3%) | 348 (57.7%) |
| Total (Overall) | 2,911 (50.6%) | 2,840 (49.4%) |
Sales and Office Occupations
The most common Sales and Office occupations in Kendall Park are Office & Administration (957 | 16.6%), and Sales & Related (702 | 12.2%).
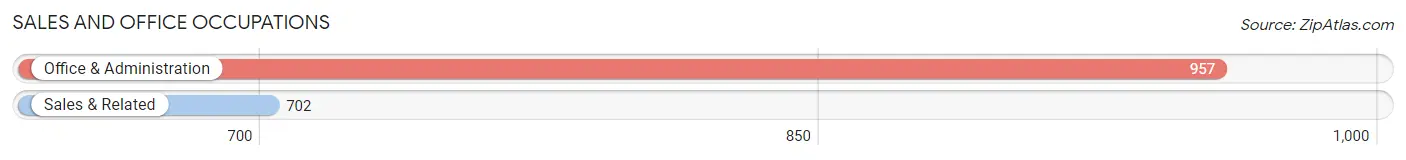
Sales and Office Occupations by Sex
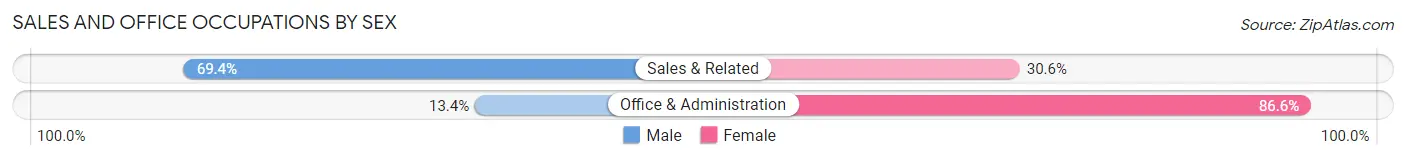
| Occupation | Male | Female |
| Sales & Related | 487 (69.4%) | 215 (30.6%) |
| Office & Administration | 128 (13.4%) | 829 (86.6%) |
| Total (Category) | 615 (37.1%) | 1,044 (62.9%) |
| Total (Overall) | 2,911 (50.6%) | 2,840 (49.4%) |
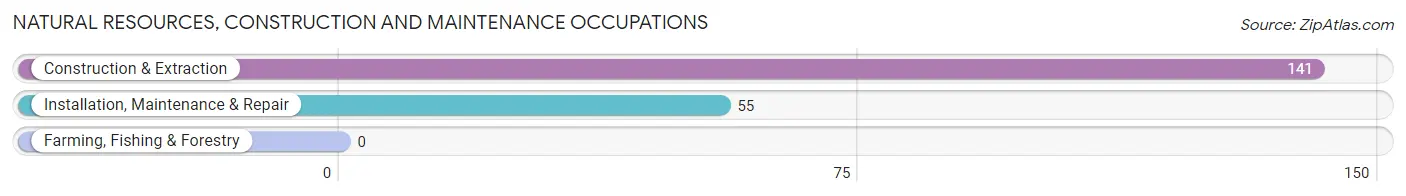
Natural Resources, Construction and Maintenance Occupations
The most common Natural Resources, Construction and Maintenance occupations in Kendall Park are Construction & Extraction (141 | 2.5%), and Installation, Maintenance & Repair (55 | 1.0%).
Natural Resources, Construction and Maintenance Occupations by Sex
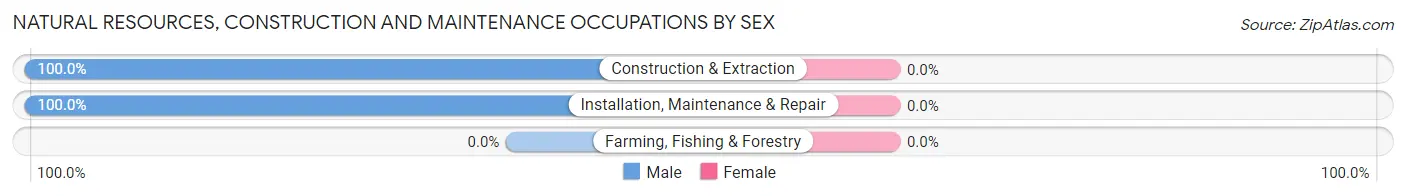
| Occupation | Male | Female |
| Farming, Fishing & Forestry | 0 (0.0%) | 0 (0.0%) |
| Construction & Extraction | 141 (100.0%) | 0 (0.0%) |
| Installation, Maintenance & Repair | 55 (100.0%) | 0 (0.0%) |
| Total (Category) | 196 (100.0%) | 0 (0.0%) |
| Total (Overall) | 2,911 (50.6%) | 2,840 (49.4%) |
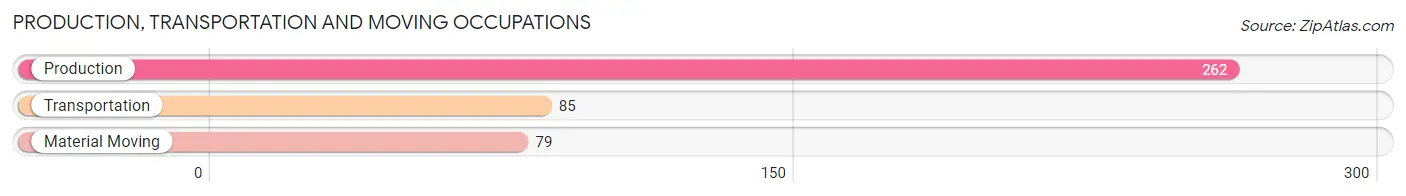
Production, Transportation and Moving Occupations
The most common Production, Transportation and Moving occupations in Kendall Park are Production (262 | 4.6%), Transportation (85 | 1.5%), and Material Moving (79 | 1.4%).
Production, Transportation and Moving Occupations by Sex
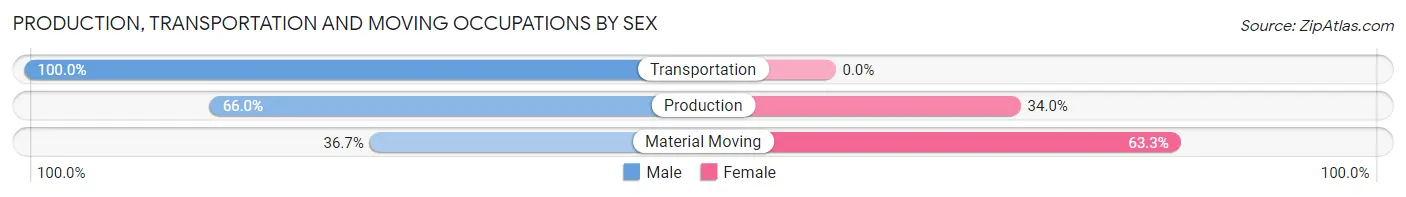
| Occupation | Male | Female |
| Production | 173 (66.0%) | 89 (34.0%) |
| Transportation | 85 (100.0%) | 0 (0.0%) |
| Material Moving | 29 (36.7%) | 50 (63.3%) |
| Total (Category) | 287 (67.4%) | 139 (32.6%) |
| Total (Overall) | 2,911 (50.6%) | 2,840 (49.4%) |
Employment Industries by Sex in Kendall Park
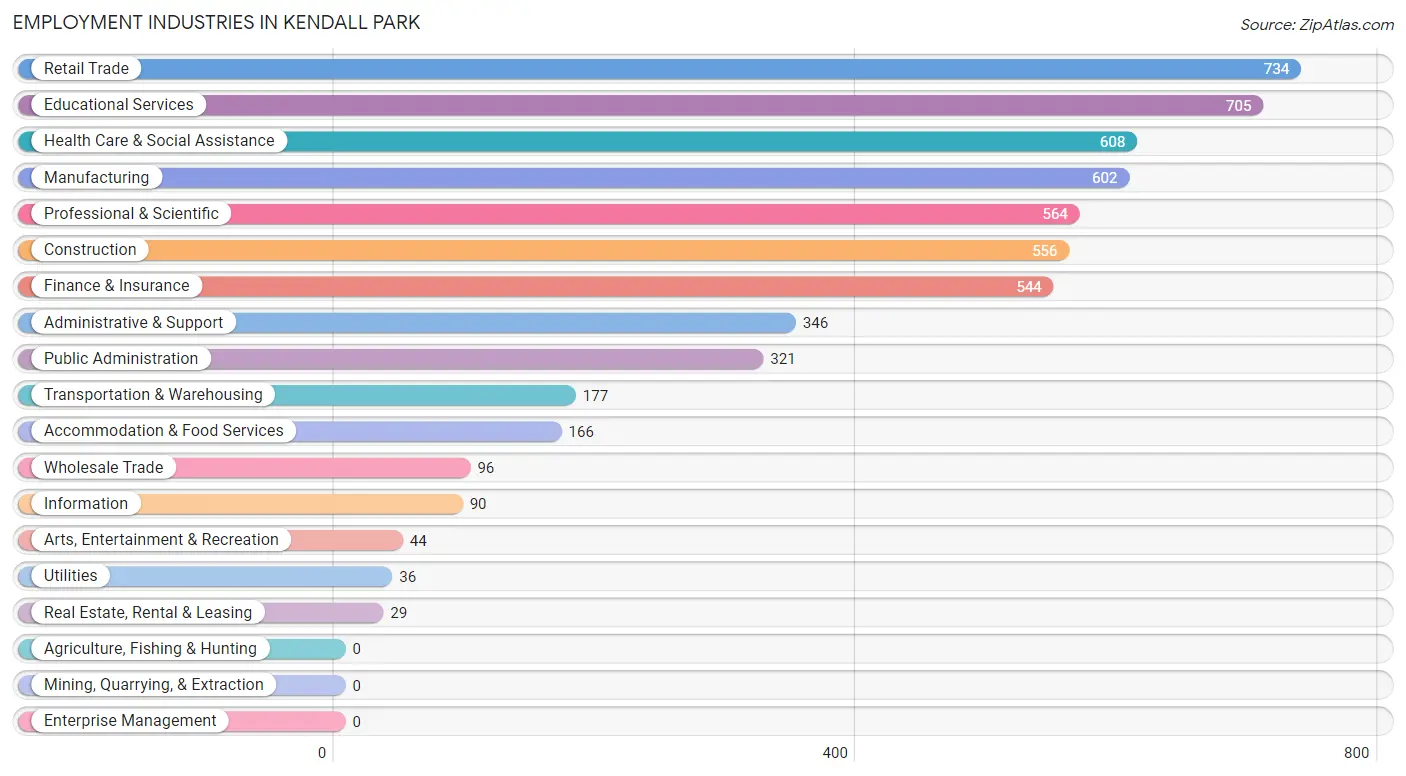
Employment Industries in Kendall Park
The major employment industries in Kendall Park include Retail Trade (734 | 12.8%), Educational Services (705 | 12.3%), Health Care & Social Assistance (608 | 10.6%), Manufacturing (602 | 10.5%), and Professional & Scientific (564 | 9.8%).
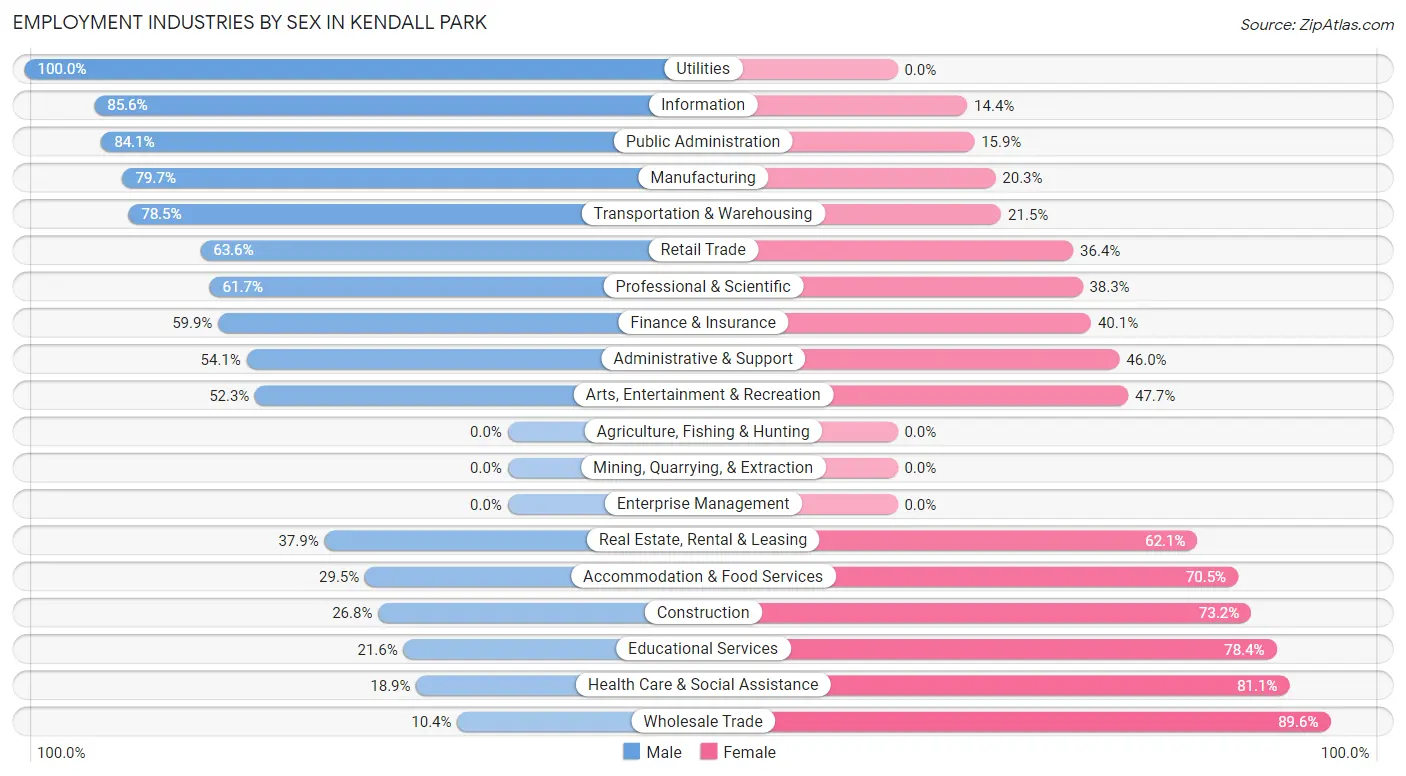
Employment Industries by Sex in Kendall Park
The Kendall Park industries that see more men than women are Utilities (100.0%), Information (85.6%), and Public Administration (84.1%), whereas the industries that tend to have a higher number of women are Wholesale Trade (89.6%), Health Care & Social Assistance (81.1%), and Educational Services (78.4%).
| Industry | Male | Female |
| Agriculture, Fishing & Hunting | 0 (0.0%) | 0 (0.0%) |
| Mining, Quarrying, & Extraction | 0 (0.0%) | 0 (0.0%) |
| Construction | 149 (26.8%) | 407 (73.2%) |
| Manufacturing | 480 (79.7%) | 122 (20.3%) |
| Wholesale Trade | 10 (10.4%) | 86 (89.6%) |
| Retail Trade | 467 (63.6%) | 267 (36.4%) |
| Transportation & Warehousing | 139 (78.5%) | 38 (21.5%) |
| Utilities | 36 (100.0%) | 0 (0.0%) |
| Information | 77 (85.6%) | 13 (14.4%) |
| Finance & Insurance | 326 (59.9%) | 218 (40.1%) |
| Real Estate, Rental & Leasing | 11 (37.9%) | 18 (62.1%) |
| Professional & Scientific | 348 (61.7%) | 216 (38.3%) |
| Enterprise Management | 0 (0.0%) | 0 (0.0%) |
| Administrative & Support | 187 (54.0%) | 159 (46.0%) |
| Educational Services | 152 (21.6%) | 553 (78.4%) |
| Health Care & Social Assistance | 115 (18.9%) | 493 (81.1%) |
| Arts, Entertainment & Recreation | 23 (52.3%) | 21 (47.7%) |
| Accommodation & Food Services | 49 (29.5%) | 117 (70.5%) |
| Public Administration | 270 (84.1%) | 51 (15.9%) |
| Total | 2,911 (50.6%) | 2,840 (49.4%) |
Education in Kendall Park
School Enrollment in Kendall Park
The most common levels of schooling among the 2,797 students in Kendall Park are college / undergraduate (737 | 26.4%), high school (686 | 24.5%), and elementary school (519 | 18.6%).
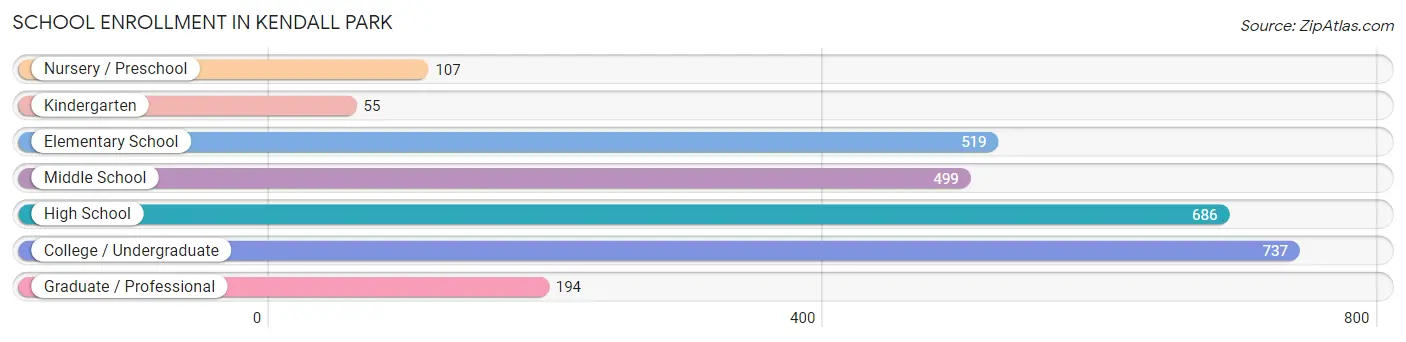
| School Level | # Students | % Students |
| Nursery / Preschool | 107 | 3.8% |
| Kindergarten | 55 | 2.0% |
| Elementary School | 519 | 18.6% |
| Middle School | 499 | 17.8% |
| High School | 686 | 24.5% |
| College / Undergraduate | 737 | 26.4% |
| Graduate / Professional | 194 | 6.9% |
| Total | 2,797 | 100.0% |
School Enrollment by Age by Funding Source in Kendall Park
Out of a total of 2,797 students who are enrolled in schools in Kendall Park, 565 (20.2%) attend a private institution, while the remaining 2,232 (79.8%) are enrolled in public schools. The age group of 3 to 4 year olds has the highest likelihood of being enrolled in private schools, with 41 (100.0% in the age bracket) enrolled. Conversely, the age group of 15 to 17 year olds has the lowest likelihood of being enrolled in a private school, with 492 (94.8% in the age bracket) attending a public institution.
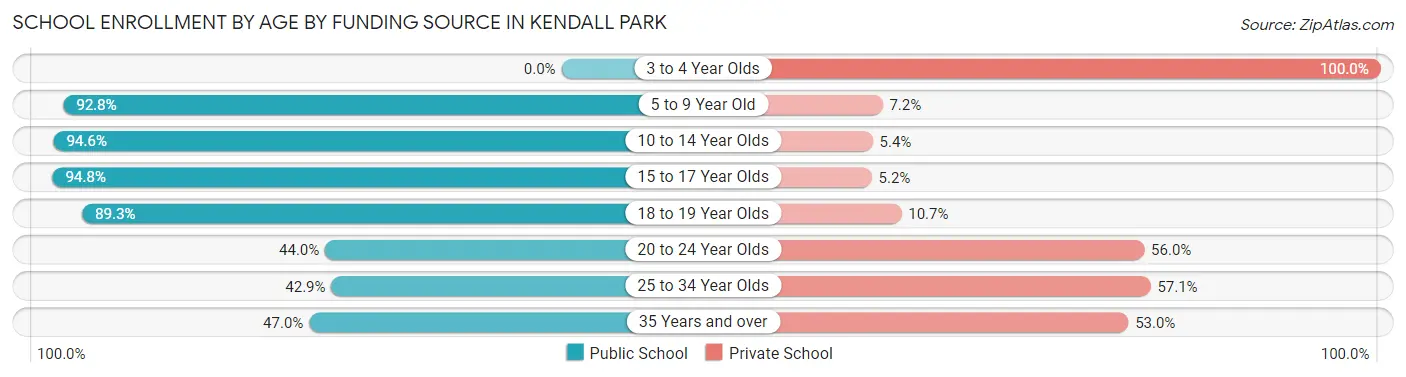
| Age Bracket | Public School | Private School |
| 3 to 4 Year Olds | 0 (0.0%) | 41 (100.0%) |
| 5 to 9 Year Old | 578 (92.8%) | 45 (7.2%) |
| 10 to 14 Year Olds | 614 (94.6%) | 35 (5.4%) |
| 15 to 17 Year Olds | 492 (94.8%) | 27 (5.2%) |
| 18 to 19 Year Olds | 233 (89.3%) | 28 (10.7%) |
| 20 to 24 Year Olds | 188 (44.0%) | 239 (56.0%) |
| 25 to 34 Year Olds | 33 (42.9%) | 44 (57.1%) |
| 35 Years and over | 94 (47.0%) | 106 (53.0%) |
| Total | 2,232 (79.8%) | 565 (20.2%) |
Educational Attainment by Field of Study in Kendall Park
Business (800 | 18.2%), computers & mathematics (590 | 13.4%), engineering (464 | 10.6%), communications (390 | 8.9%), and social sciences (372 | 8.5%) are the most common fields of study among 4,391 individuals in Kendall Park who have obtained a bachelor's degree or higher.
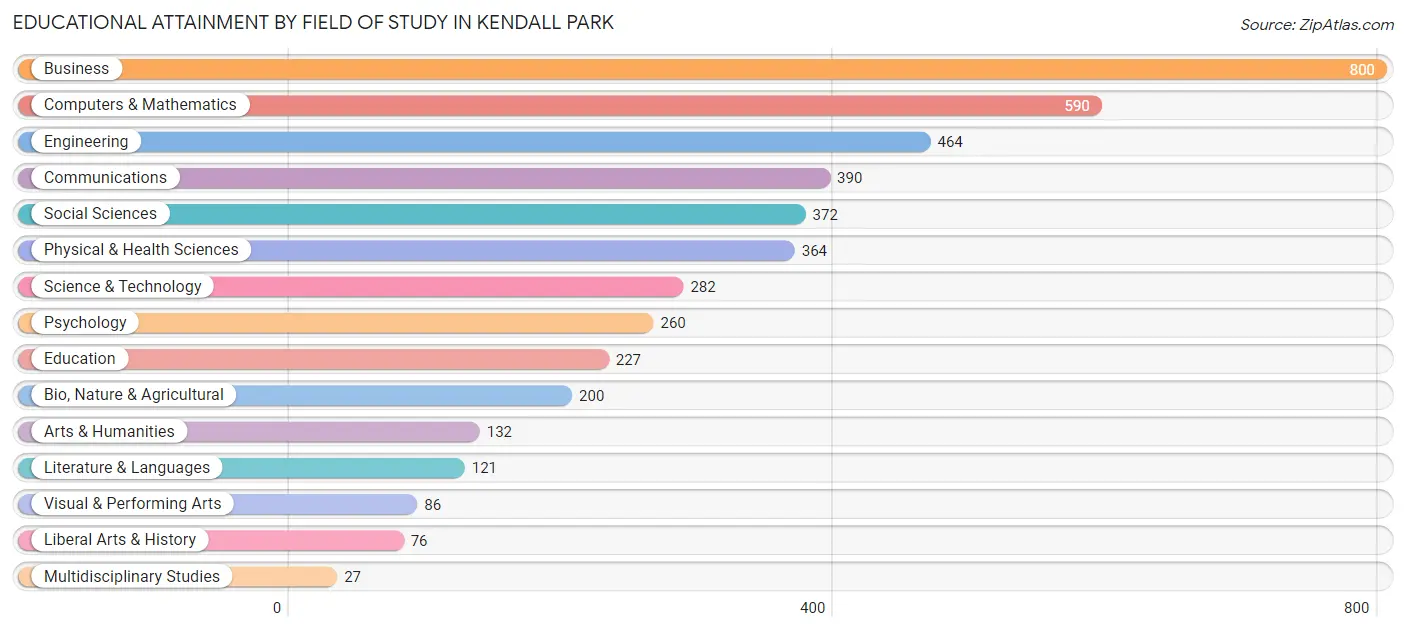
| Field of Study | # Graduates | % Graduates |
| Computers & Mathematics | 590 | 13.4% |
| Bio, Nature & Agricultural | 200 | 4.5% |
| Physical & Health Sciences | 364 | 8.3% |
| Psychology | 260 | 5.9% |
| Social Sciences | 372 | 8.5% |
| Engineering | 464 | 10.6% |
| Multidisciplinary Studies | 27 | 0.6% |
| Science & Technology | 282 | 6.4% |
| Business | 800 | 18.2% |
| Education | 227 | 5.2% |
| Literature & Languages | 121 | 2.8% |
| Liberal Arts & History | 76 | 1.7% |
| Visual & Performing Arts | 86 | 2.0% |
| Communications | 390 | 8.9% |
| Arts & Humanities | 132 | 3.0% |
| Total | 4,391 | 100.0% |
Transportation & Commute in Kendall Park
Vehicle Availability by Sex in Kendall Park
The most prevalent vehicle ownership categories in Kendall Park are males with 2 vehicles (1,136, accounting for 39.5%) and females with 2 vehicles (1,045, making up 40.7%).
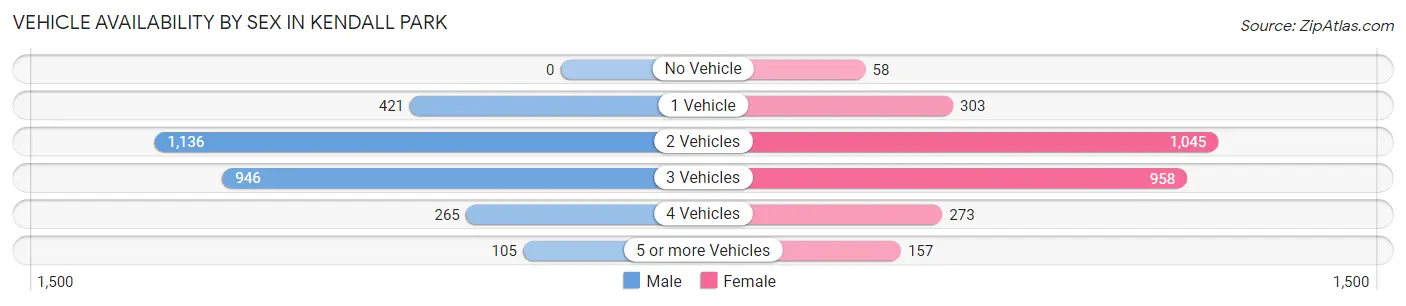
| Vehicles Available | Male | Female |
| No Vehicle | 0 (0.0%) | 58 (2.1%) |
| 1 Vehicle | 421 (14.6%) | 303 (10.8%) |
| 2 Vehicles | 1,136 (39.5%) | 1,045 (37.4%) |
| 3 Vehicles | 946 (32.9%) | 958 (34.3%) |
| 4 Vehicles | 265 (9.2%) | 273 (9.8%) |
| 5 or more Vehicles | 105 (3.6%) | 157 (5.6%) |
| Total | 2,873 (100.0%) | 2,794 (100.0%) |
Commute Time in Kendall Park
The most frequently occuring commute durations in Kendall Park are 30 to 34 minutes (801 commuters, 17.4%), 20 to 24 minutes (776 commuters, 16.9%), and 15 to 19 minutes (534 commuters, 11.6%).
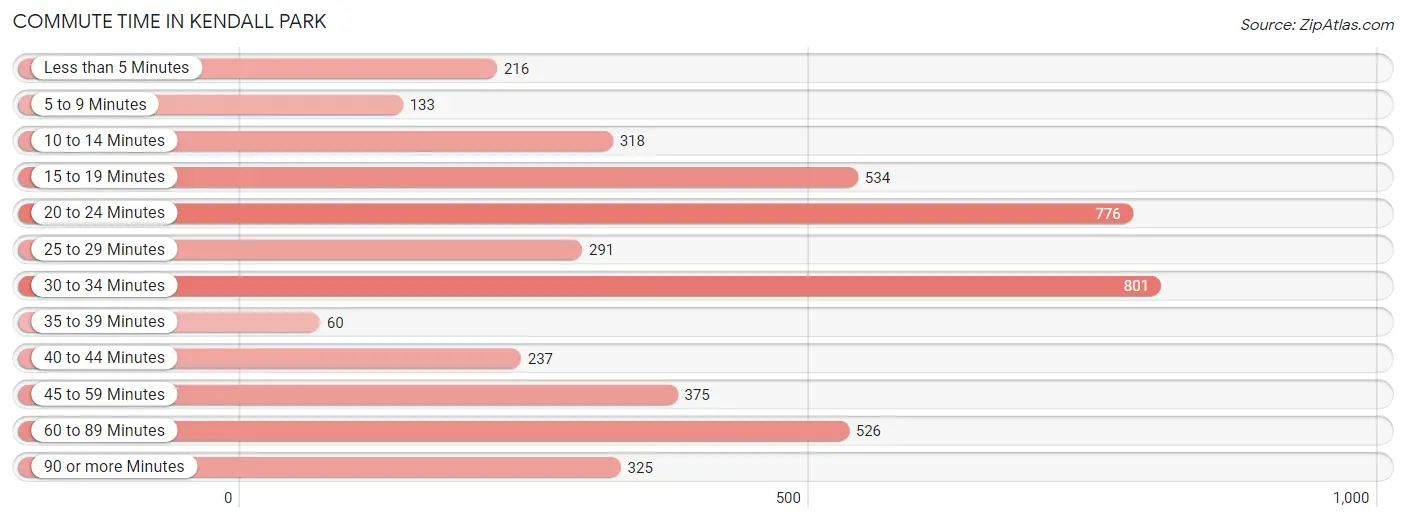
| Commute Time | # Commuters | % Commuters |
| Less than 5 Minutes | 216 | 4.7% |
| 5 to 9 Minutes | 133 | 2.9% |
| 10 to 14 Minutes | 318 | 6.9% |
| 15 to 19 Minutes | 534 | 11.6% |
| 20 to 24 Minutes | 776 | 16.9% |
| 25 to 29 Minutes | 291 | 6.3% |
| 30 to 34 Minutes | 801 | 17.4% |
| 35 to 39 Minutes | 60 | 1.3% |
| 40 to 44 Minutes | 237 | 5.2% |
| 45 to 59 Minutes | 375 | 8.2% |
| 60 to 89 Minutes | 526 | 11.5% |
| 90 or more Minutes | 325 | 7.1% |
Commute Time by Sex in Kendall Park
The most common commute times in Kendall Park are 60 to 89 minutes (451 commuters, 19.9%) for males and 30 to 34 minutes (576 commuters, 24.8%) for females.
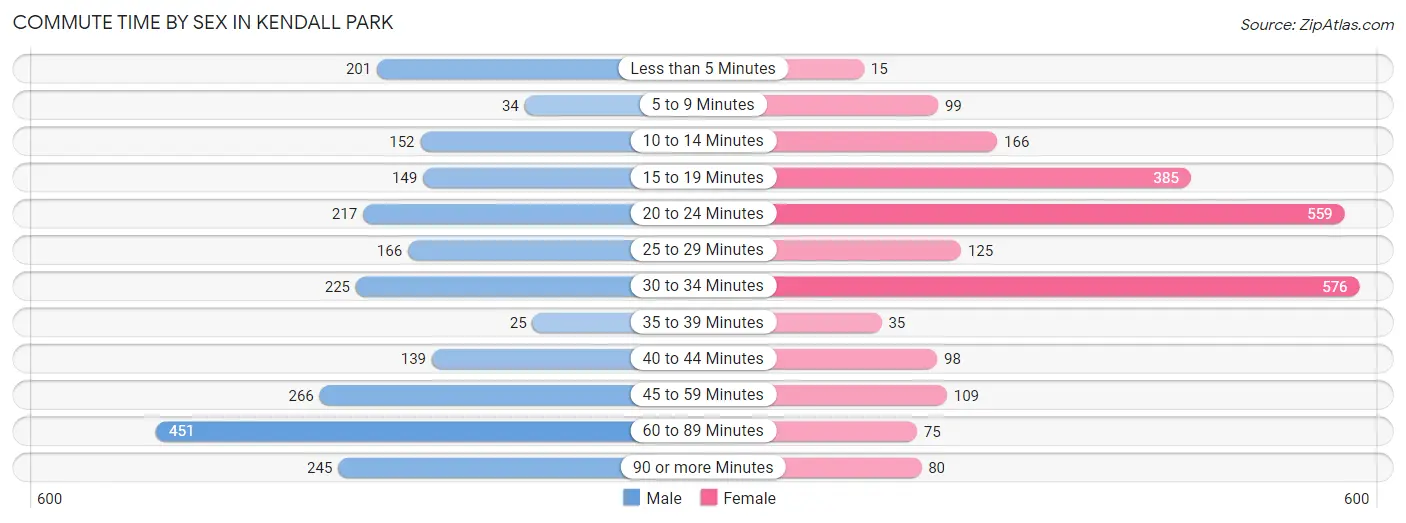
| Commute Time | Male | Female |
| Less than 5 Minutes | 201 (8.8%) | 15 (0.6%) |
| 5 to 9 Minutes | 34 (1.5%) | 99 (4.3%) |
| 10 to 14 Minutes | 152 (6.7%) | 166 (7.1%) |
| 15 to 19 Minutes | 149 (6.6%) | 385 (16.6%) |
| 20 to 24 Minutes | 217 (9.6%) | 559 (24.1%) |
| 25 to 29 Minutes | 166 (7.3%) | 125 (5.4%) |
| 30 to 34 Minutes | 225 (9.9%) | 576 (24.8%) |
| 35 to 39 Minutes | 25 (1.1%) | 35 (1.5%) |
| 40 to 44 Minutes | 139 (6.1%) | 98 (4.2%) |
| 45 to 59 Minutes | 266 (11.7%) | 109 (4.7%) |
| 60 to 89 Minutes | 451 (19.9%) | 75 (3.2%) |
| 90 or more Minutes | 245 (10.8%) | 80 (3.5%) |
Time of Departure to Work by Sex in Kendall Park
The most frequent times of departure to work in Kendall Park are 6:30 AM to 6:59 AM (472, 20.8%) for males and 9:00 AM to 9:59 AM (527, 22.7%) for females.
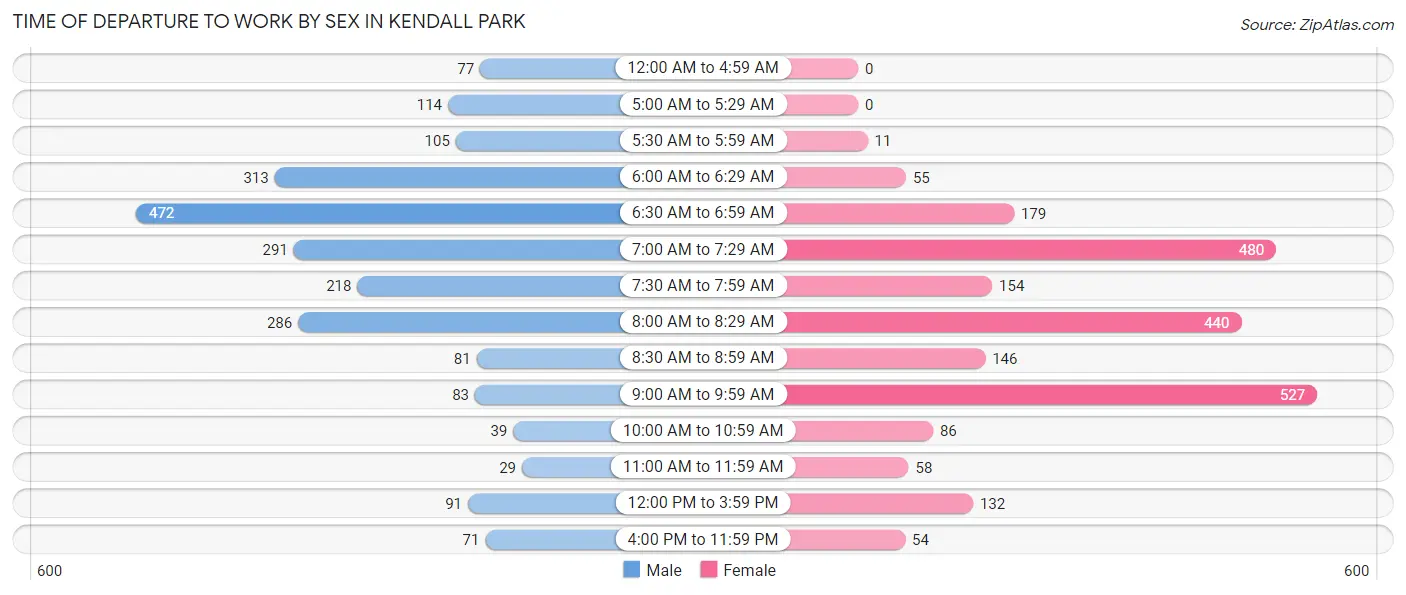
| Time of Departure | Male | Female |
| 12:00 AM to 4:59 AM | 77 (3.4%) | 0 (0.0%) |
| 5:00 AM to 5:29 AM | 114 (5.0%) | 0 (0.0%) |
| 5:30 AM to 5:59 AM | 105 (4.6%) | 11 (0.5%) |
| 6:00 AM to 6:29 AM | 313 (13.8%) | 55 (2.4%) |
| 6:30 AM to 6:59 AM | 472 (20.8%) | 179 (7.7%) |
| 7:00 AM to 7:29 AM | 291 (12.8%) | 480 (20.7%) |
| 7:30 AM to 7:59 AM | 218 (9.6%) | 154 (6.6%) |
| 8:00 AM to 8:29 AM | 286 (12.6%) | 440 (19.0%) |
| 8:30 AM to 8:59 AM | 81 (3.6%) | 146 (6.3%) |
| 9:00 AM to 9:59 AM | 83 (3.7%) | 527 (22.7%) |
| 10:00 AM to 10:59 AM | 39 (1.7%) | 86 (3.7%) |
| 11:00 AM to 11:59 AM | 29 (1.3%) | 58 (2.5%) |
| 12:00 PM to 3:59 PM | 91 (4.0%) | 132 (5.7%) |
| 4:00 PM to 11:59 PM | 71 (3.1%) | 54 (2.3%) |
| Total | 2,270 (100.0%) | 2,322 (100.0%) |
Housing Occupancy in Kendall Park
Occupancy by Ownership in Kendall Park
Of the total 3,620 dwellings in Kendall Park, owner-occupied units account for 3,086 (85.3%), while renter-occupied units make up 534 (14.7%).
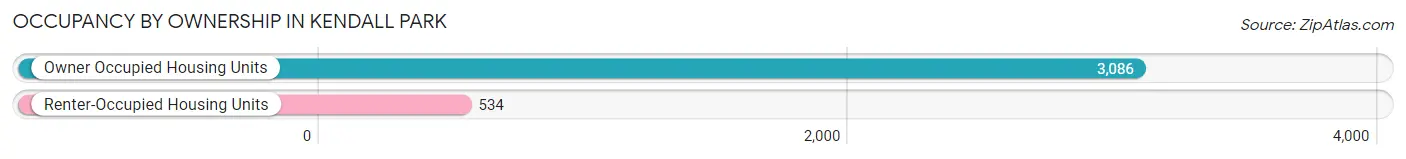
| Occupancy | # Housing Units | % Housing Units |
| Owner Occupied Housing Units | 3,086 | 85.3% |
| Renter-Occupied Housing Units | 534 | 14.7% |
| Total Occupied Housing Units | 3,620 | 100.0% |
Occupancy by Household Size in Kendall Park
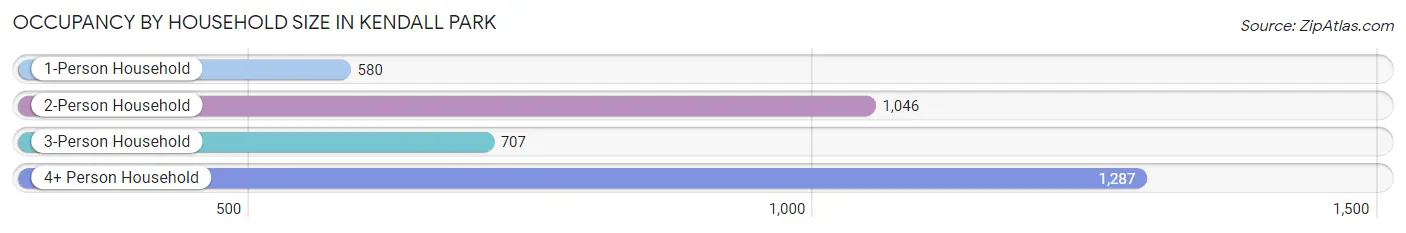
| Household Size | # Housing Units | % Housing Units |
| 1-Person Household | 580 | 16.0% |
| 2-Person Household | 1,046 | 28.9% |
| 3-Person Household | 707 | 19.5% |
| 4+ Person Household | 1,287 | 35.5% |
| Total Housing Units | 3,620 | 100.0% |
Occupancy by Ownership by Household Size in Kendall Park
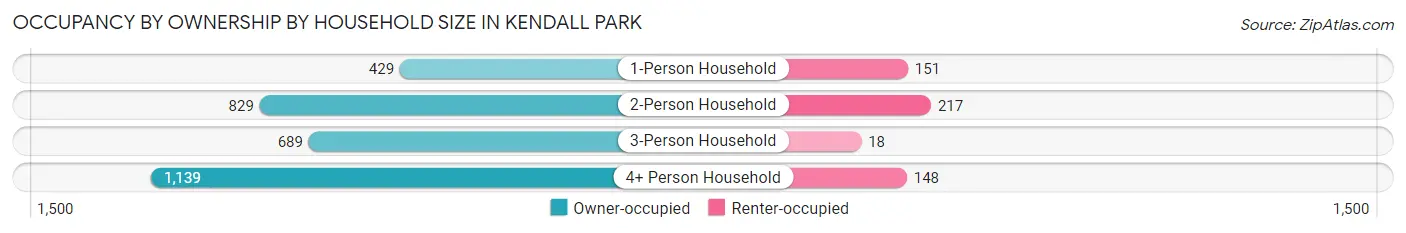
| Household Size | Owner-occupied | Renter-occupied |
| 1-Person Household | 429 (74.0%) | 151 (26.0%) |
| 2-Person Household | 829 (79.2%) | 217 (20.7%) |
| 3-Person Household | 689 (97.5%) | 18 (2.5%) |
| 4+ Person Household | 1,139 (88.5%) | 148 (11.5%) |
| Total Housing Units | 3,086 (85.3%) | 534 (14.7%) |
Occupancy by Educational Attainment in Kendall Park
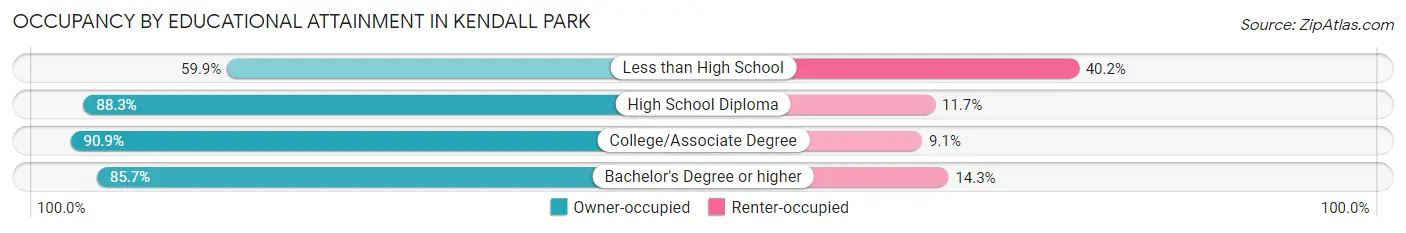
| Household Size | Owner-occupied | Renter-occupied |
| Less than High School | 155 (59.9%) | 104 (40.2%) |
| High School Diploma | 689 (88.3%) | 91 (11.7%) |
| College/Associate Degree | 538 (90.9%) | 54 (9.1%) |
| Bachelor's Degree or higher | 1,704 (85.7%) | 285 (14.3%) |
Occupancy by Age of Householder in Kendall Park
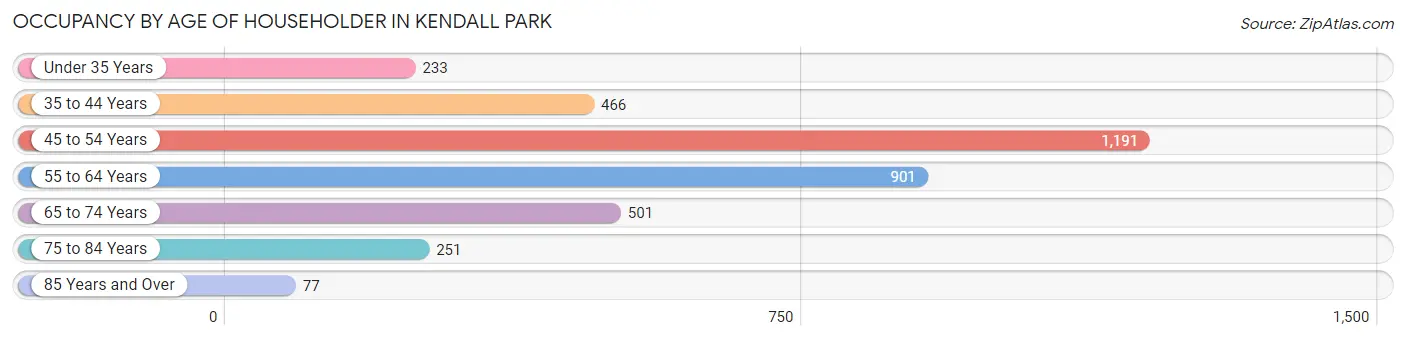
| Age Bracket | # Households | % Households |
| Under 35 Years | 233 | 6.4% |
| 35 to 44 Years | 466 | 12.9% |
| 45 to 54 Years | 1,191 | 32.9% |
| 55 to 64 Years | 901 | 24.9% |
| 65 to 74 Years | 501 | 13.8% |
| 75 to 84 Years | 251 | 6.9% |
| 85 Years and Over | 77 | 2.1% |
| Total | 3,620 | 100.0% |
Housing Finances in Kendall Park
Median Income by Occupancy in Kendall Park
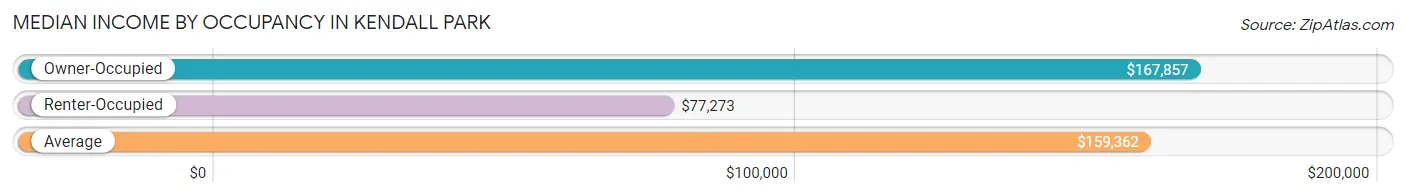
| Occupancy Type | # Households | Median Income |
| Owner-Occupied | 3,086 (85.3%) | $167,857 |
| Renter-Occupied | 534 (14.7%) | $77,273 |
| Average | 3,620 (100.0%) | $159,362 |
Occupancy by Householder Income Bracket in Kendall Park
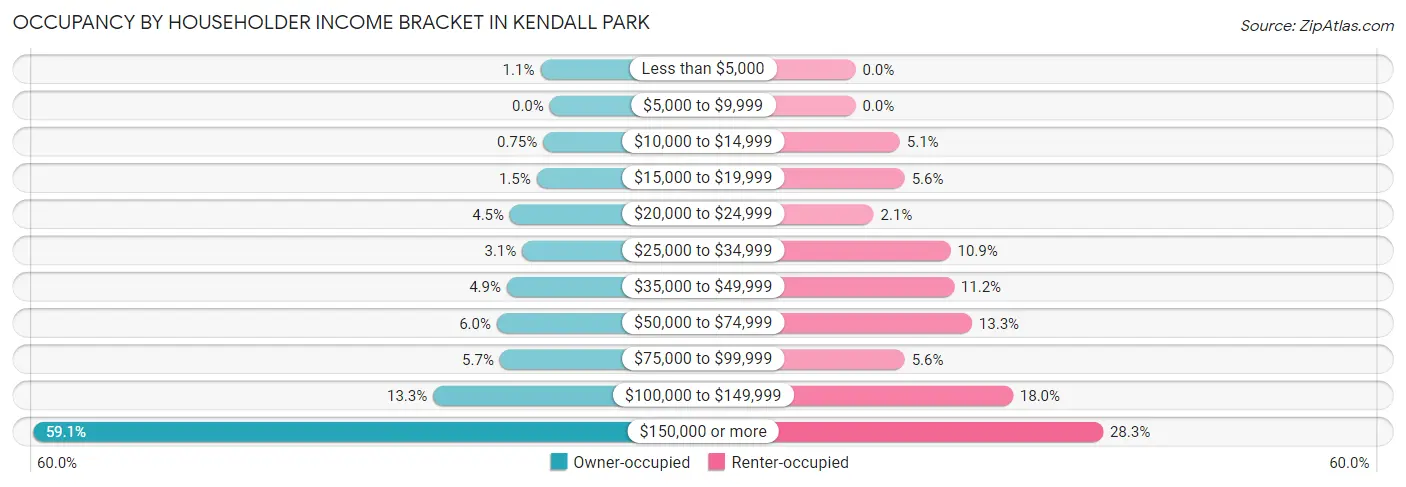
| Income Bracket | Owner-occupied | Renter-occupied |
| Less than $5,000 | 33 (1.1%) | 0 (0.0%) |
| $5,000 to $9,999 | 0 (0.0%) | 0 (0.0%) |
| $10,000 to $14,999 | 23 (0.7%) | 27 (5.1%) |
| $15,000 to $19,999 | 46 (1.5%) | 30 (5.6%) |
| $20,000 to $24,999 | 140 (4.5%) | 11 (2.1%) |
| $25,000 to $34,999 | 97 (3.1%) | 58 (10.9%) |
| $35,000 to $49,999 | 151 (4.9%) | 60 (11.2%) |
| $50,000 to $74,999 | 186 (6.0%) | 71 (13.3%) |
| $75,000 to $99,999 | 176 (5.7%) | 30 (5.6%) |
| $100,000 to $149,999 | 411 (13.3%) | 96 (18.0%) |
| $150,000 or more | 1,823 (59.1%) | 151 (28.3%) |
| Total | 3,086 (100.0%) | 534 (100.0%) |
Monthly Housing Cost Tiers in Kendall Park
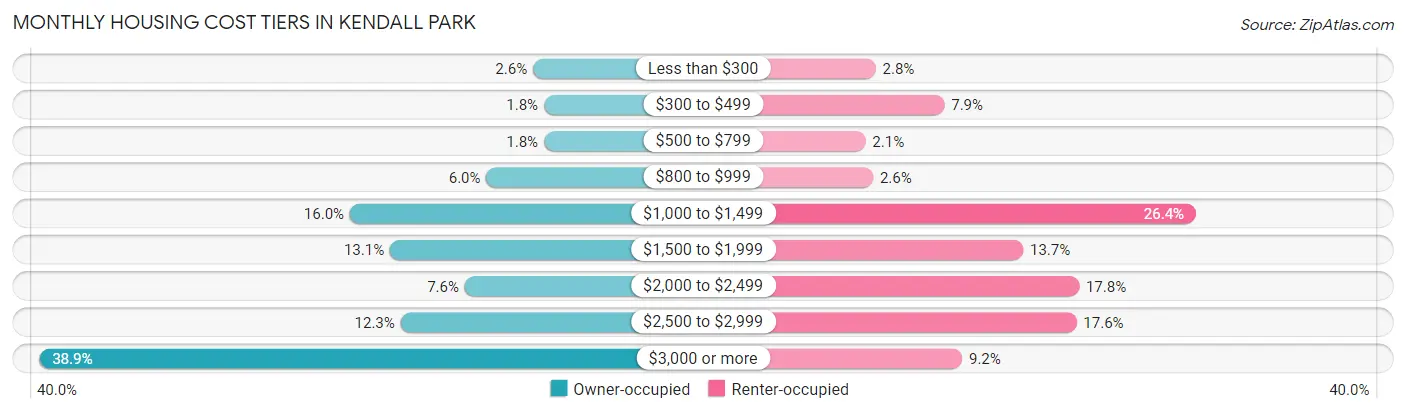
| Monthly Cost | Owner-occupied | Renter-occupied |
| Less than $300 | 79 (2.6%) | 15 (2.8%) |
| $300 to $499 | 54 (1.8%) | 42 (7.9%) |
| $500 to $799 | 54 (1.8%) | 11 (2.1%) |
| $800 to $999 | 185 (6.0%) | 14 (2.6%) |
| $1,000 to $1,499 | 495 (16.0%) | 141 (26.4%) |
| $1,500 to $1,999 | 404 (13.1%) | 73 (13.7%) |
| $2,000 to $2,499 | 234 (7.6%) | 95 (17.8%) |
| $2,500 to $2,999 | 380 (12.3%) | 94 (17.6%) |
| $3,000 or more | 1,201 (38.9%) | 49 (9.2%) |
| Total | 3,086 (100.0%) | 534 (100.0%) |
Physical Housing Characteristics in Kendall Park
Housing Structures in Kendall Park
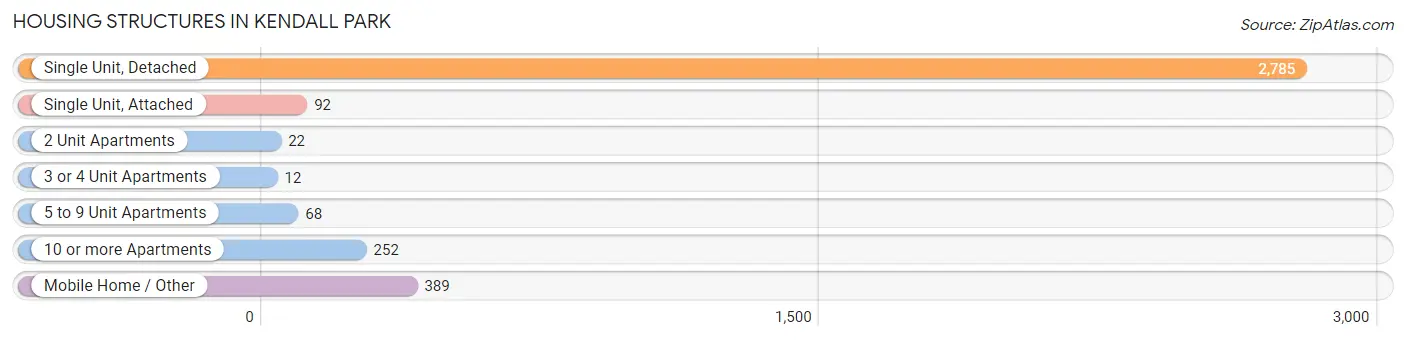
| Structure Type | # Housing Units | % Housing Units |
| Single Unit, Detached | 2,785 | 76.9% |
| Single Unit, Attached | 92 | 2.5% |
| 2 Unit Apartments | 22 | 0.6% |
| 3 or 4 Unit Apartments | 12 | 0.3% |
| 5 to 9 Unit Apartments | 68 | 1.9% |
| 10 or more Apartments | 252 | 7.0% |
| Mobile Home / Other | 389 | 10.7% |
| Total | 3,620 | 100.0% |
Housing Structures by Occupancy in Kendall Park
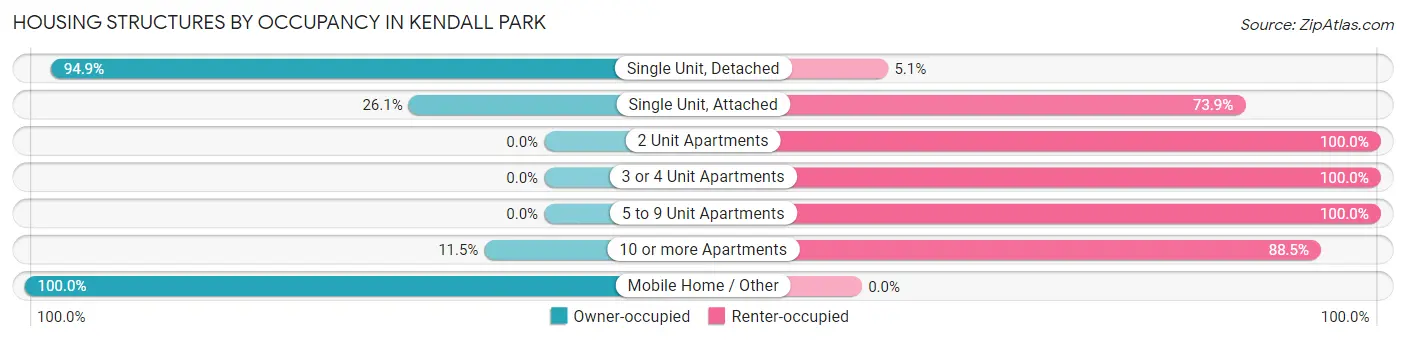
| Structure Type | Owner-occupied | Renter-occupied |
| Single Unit, Detached | 2,644 (94.9%) | 141 (5.1%) |
| Single Unit, Attached | 24 (26.1%) | 68 (73.9%) |
| 2 Unit Apartments | 0 (0.0%) | 22 (100.0%) |
| 3 or 4 Unit Apartments | 0 (0.0%) | 12 (100.0%) |
| 5 to 9 Unit Apartments | 0 (0.0%) | 68 (100.0%) |
| 10 or more Apartments | 29 (11.5%) | 223 (88.5%) |
| Mobile Home / Other | 389 (100.0%) | 0 (0.0%) |
| Total | 3,086 (85.3%) | 534 (14.7%) |
Housing Structures by Number of Rooms in Kendall Park
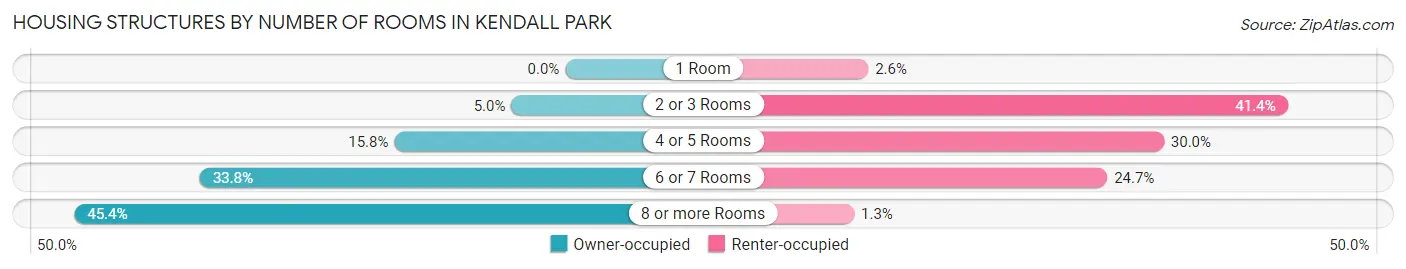
| Number of Rooms | Owner-occupied | Renter-occupied |
| 1 Room | 0 (0.0%) | 14 (2.6%) |
| 2 or 3 Rooms | 154 (5.0%) | 221 (41.4%) |
| 4 or 5 Rooms | 488 (15.8%) | 160 (30.0%) |
| 6 or 7 Rooms | 1,043 (33.8%) | 132 (24.7%) |
| 8 or more Rooms | 1,401 (45.4%) | 7 (1.3%) |
| Total | 3,086 (100.0%) | 534 (100.0%) |
Housing Structure by Heating Type in Kendall Park
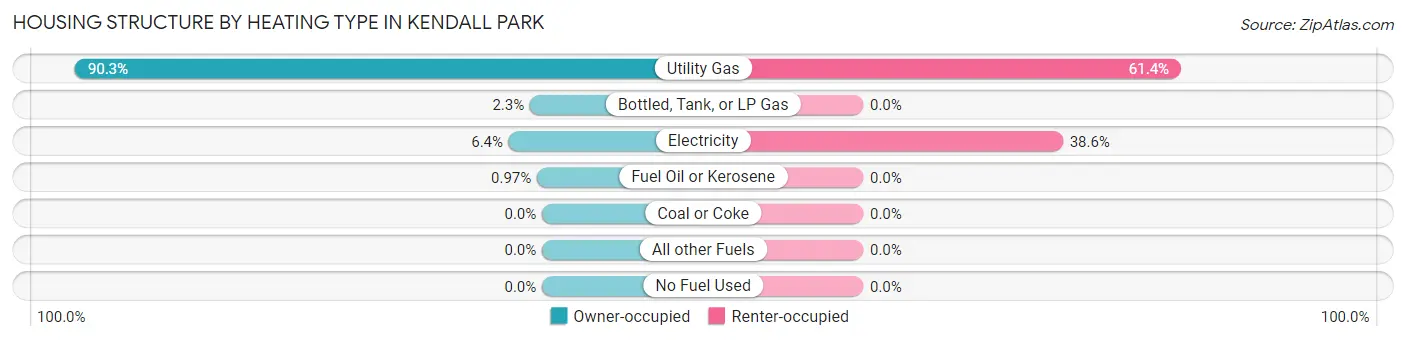
| Heating Type | Owner-occupied | Renter-occupied |
| Utility Gas | 2,786 (90.3%) | 328 (61.4%) |
| Bottled, Tank, or LP Gas | 72 (2.3%) | 0 (0.0%) |
| Electricity | 198 (6.4%) | 206 (38.6%) |
| Fuel Oil or Kerosene | 30 (1.0%) | 0 (0.0%) |
| Coal or Coke | 0 (0.0%) | 0 (0.0%) |
| All other Fuels | 0 (0.0%) | 0 (0.0%) |
| No Fuel Used | 0 (0.0%) | 0 (0.0%) |
| Total | 3,086 (100.0%) | 534 (100.0%) |
Household Vehicle Usage in Kendall Park
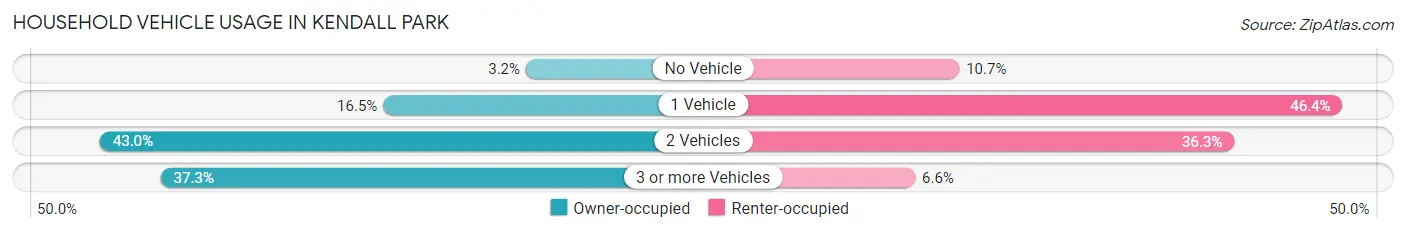
| Vehicles per Household | Owner-occupied | Renter-occupied |
| No Vehicle | 99 (3.2%) | 57 (10.7%) |
| 1 Vehicle | 510 (16.5%) | 248 (46.4%) |
| 2 Vehicles | 1,326 (43.0%) | 194 (36.3%) |
| 3 or more Vehicles | 1,151 (37.3%) | 35 (6.6%) |
| Total | 3,086 (100.0%) | 534 (100.0%) |
Real Estate & Mortgages in Kendall Park
Real Estate and Mortgage Overview in Kendall Park
| Characteristic | Without Mortgage | With Mortgage |
| Housing Units | 1,159 | 1,927 |
| Median Property Value | $404,200 | $581,800 |
| Median Household Income | $78,472 | $1,487 |
| Monthly Housing Costs | $1,144 | $1,192 |
| Real Estate Taxes | $10,001 | $10 |
Property Value by Mortgage Status in Kendall Park
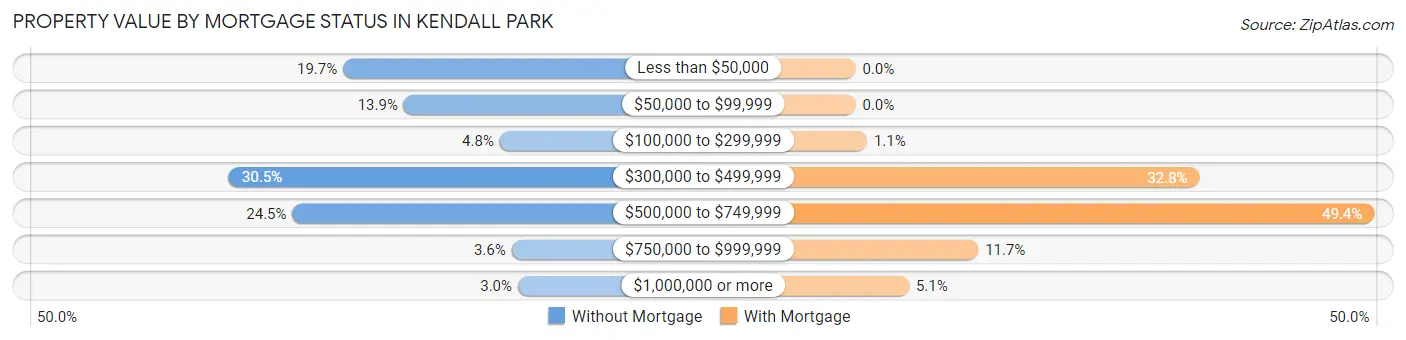
| Property Value | Without Mortgage | With Mortgage |
| Less than $50,000 | 228 (19.7%) | 0 (0.0%) |
| $50,000 to $99,999 | 161 (13.9%) | 0 (0.0%) |
| $100,000 to $299,999 | 55 (4.8%) | 21 (1.1%) |
| $300,000 to $499,999 | 354 (30.5%) | 631 (32.8%) |
| $500,000 to $749,999 | 284 (24.5%) | 952 (49.4%) |
| $750,000 to $999,999 | 42 (3.6%) | 225 (11.7%) |
| $1,000,000 or more | 35 (3.0%) | 98 (5.1%) |
| Total | 1,159 (100.0%) | 1,927 (100.0%) |
Household Income by Mortgage Status in Kendall Park
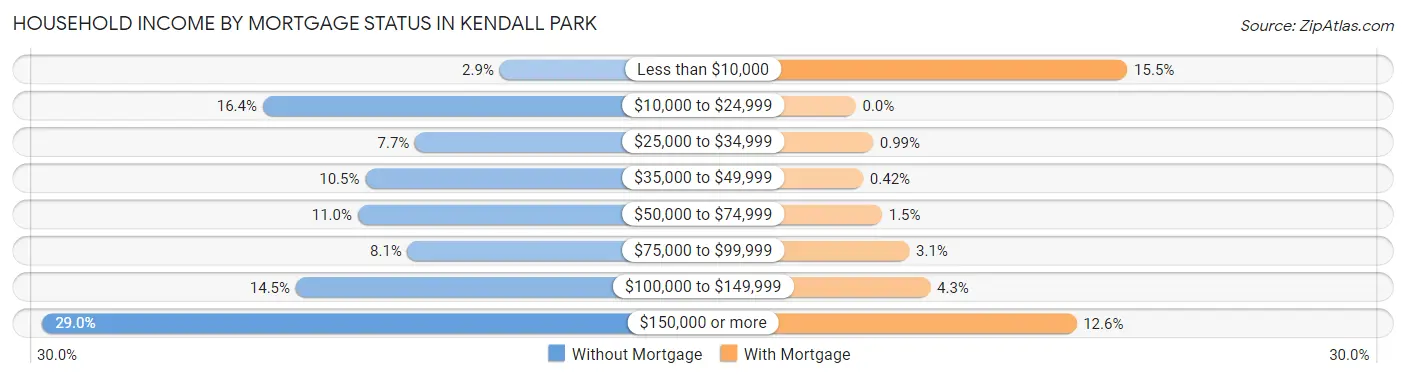
| Household Income | Without Mortgage | With Mortgage |
| Less than $10,000 | 33 (2.9%) | 299 (15.5%) |
| $10,000 to $24,999 | 190 (16.4%) | 0 (0.0%) |
| $25,000 to $34,999 | 89 (7.7%) | 19 (1.0%) |
| $35,000 to $49,999 | 122 (10.5%) | 8 (0.4%) |
| $50,000 to $74,999 | 127 (11.0%) | 29 (1.5%) |
| $75,000 to $99,999 | 94 (8.1%) | 59 (3.1%) |
| $100,000 to $149,999 | 168 (14.5%) | 82 (4.3%) |
| $150,000 or more | 336 (29.0%) | 243 (12.6%) |
| Total | 1,159 (100.0%) | 1,927 (100.0%) |
Property Value to Household Income Ratio in Kendall Park
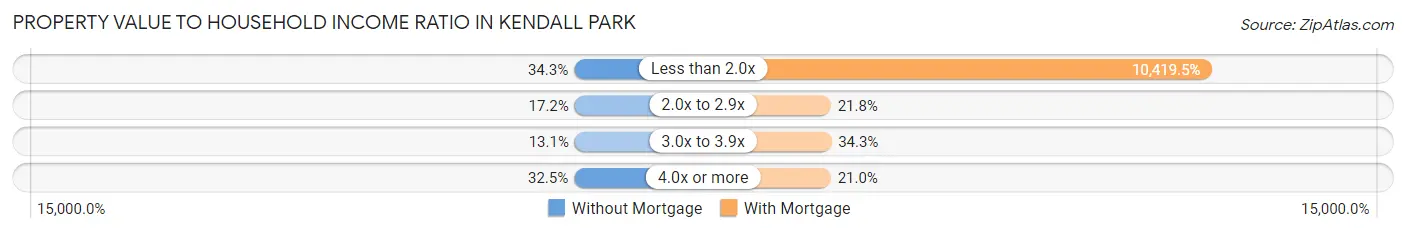
| Value-to-Income Ratio | Without Mortgage | With Mortgage |
| Less than 2.0x | 398 (34.3%) | 200,784 (10,419.5%) |
| 2.0x to 2.9x | 199 (17.2%) | 420 (21.8%) |
| 3.0x to 3.9x | 152 (13.1%) | 660 (34.3%) |
| 4.0x or more | 377 (32.5%) | 404 (21.0%) |
| Total | 1,159 (100.0%) | 1,927 (100.0%) |
Real Estate Taxes by Mortgage Status in Kendall Park
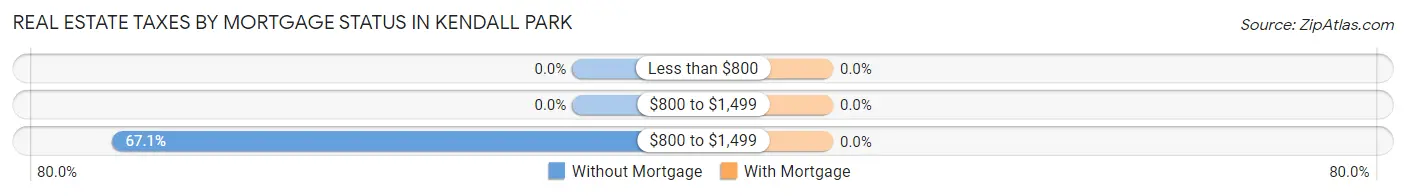
| Property Taxes | Without Mortgage | With Mortgage |
| Less than $800 | 0 (0.0%) | 0 (0.0%) |
| $800 to $1,499 | 0 (0.0%) | 0 (0.0%) |
| $800 to $1,499 | 778 (67.1%) | 0 (0.0%) |
| Total | 1,159 (100.0%) | 1,927 (100.0%) |
Health & Disability in Kendall Park
Health Insurance Coverage by Age in Kendall Park
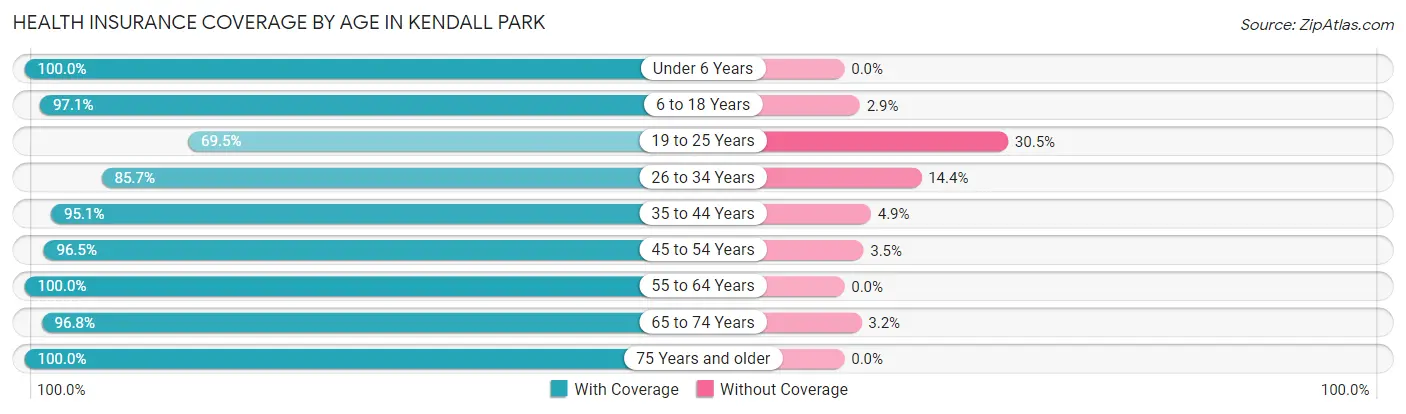
| Age Bracket | With Coverage | Without Coverage |
| Under 6 Years | 652 (100.0%) | 0 (0.0%) |
| 6 to 18 Years | 1,818 (97.1%) | 54 (2.9%) |
| 19 to 25 Years | 631 (69.5%) | 277 (30.5%) |
| 26 to 34 Years | 794 (85.7%) | 133 (14.3%) |
| 35 to 44 Years | 1,000 (95.1%) | 52 (4.9%) |
| 45 to 54 Years | 2,097 (96.5%) | 77 (3.5%) |
| 55 to 64 Years | 1,552 (100.0%) | 0 (0.0%) |
| 65 to 74 Years | 883 (96.8%) | 29 (3.2%) |
| 75 Years and older | 575 (100.0%) | 0 (0.0%) |
| Total | 10,002 (94.2%) | 622 (5.9%) |
Health Insurance Coverage by Citizenship Status in Kendall Park
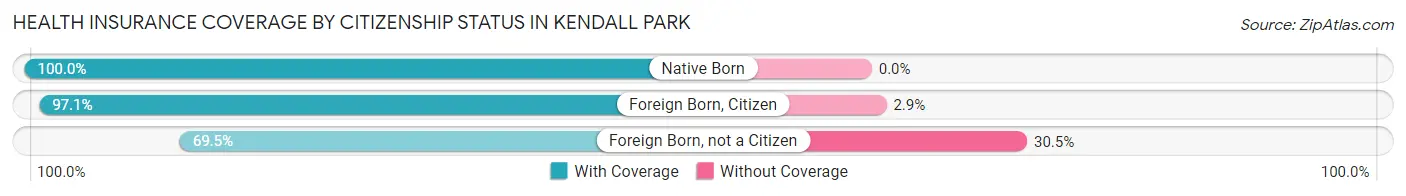
| Citizenship Status | With Coverage | Without Coverage |
| Native Born | 652 (100.0%) | 0 (0.0%) |
| Foreign Born, Citizen | 1,818 (97.1%) | 54 (2.9%) |
| Foreign Born, not a Citizen | 631 (69.5%) | 277 (30.5%) |
Health Insurance Coverage by Household Income in Kendall Park
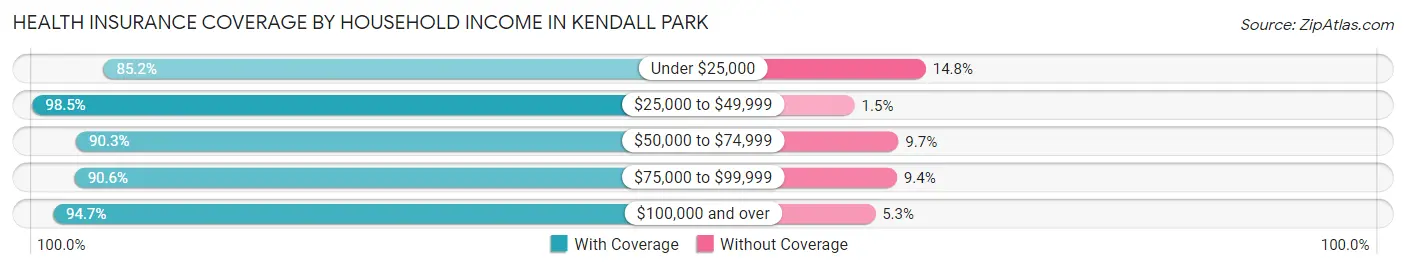
| Household Income | With Coverage | Without Coverage |
| Under $25,000 | 403 (85.2%) | 70 (14.8%) |
| $25,000 to $49,999 | 869 (98.5%) | 13 (1.5%) |
| $50,000 to $74,999 | 411 (90.3%) | 44 (9.7%) |
| $75,000 to $99,999 | 560 (90.6%) | 58 (9.4%) |
| $100,000 and over | 7,755 (94.7%) | 437 (5.3%) |
Public vs Private Health Insurance Coverage by Age in Kendall Park
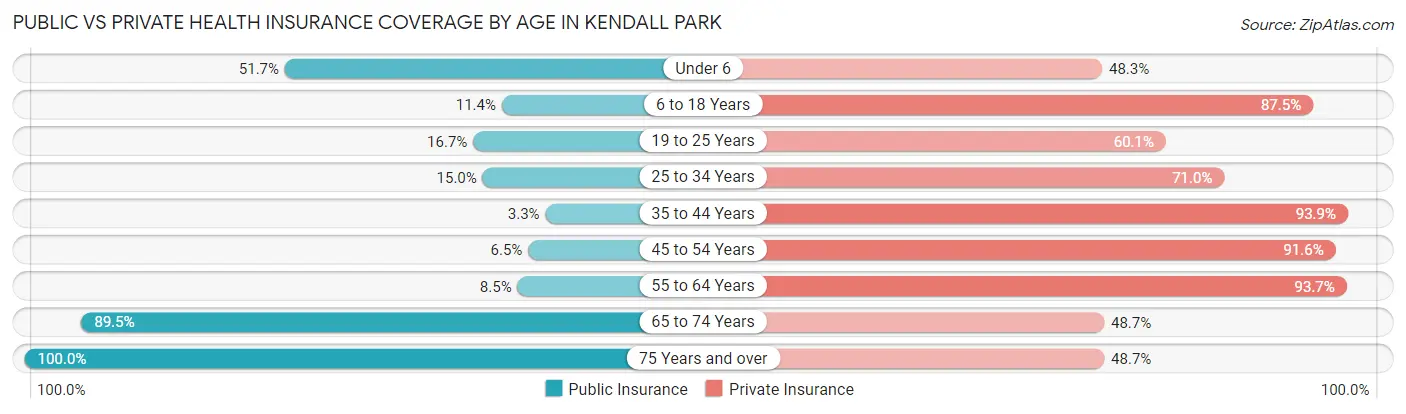
| Age Bracket | Public Insurance | Private Insurance |
| Under 6 | 337 (51.7%) | 315 (48.3%) |
| 6 to 18 Years | 214 (11.4%) | 1,637 (87.5%) |
| 19 to 25 Years | 152 (16.7%) | 546 (60.1%) |
| 25 to 34 Years | 139 (15.0%) | 658 (71.0%) |
| 35 to 44 Years | 35 (3.3%) | 988 (93.9%) |
| 45 to 54 Years | 142 (6.5%) | 1,992 (91.6%) |
| 55 to 64 Years | 132 (8.5%) | 1,454 (93.7%) |
| 65 to 74 Years | 816 (89.5%) | 444 (48.7%) |
| 75 Years and over | 575 (100.0%) | 280 (48.7%) |
| Total | 2,542 (23.9%) | 8,314 (78.3%) |
Disability Status by Sex by Age in Kendall Park
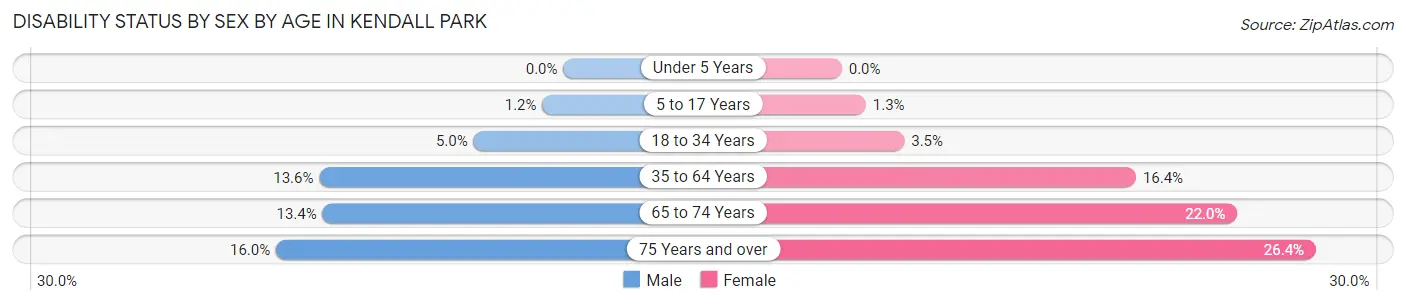
| Age Bracket | Male | Female |
| Under 5 Years | 0 (0.0%) | 0 (0.0%) |
| 5 to 17 Years | 11 (1.2%) | 12 (1.3%) |
| 18 to 34 Years | 46 (5.0%) | 37 (3.5%) |
| 35 to 64 Years | 310 (13.6%) | 409 (16.4%) |
| 65 to 74 Years | 48 (13.4%) | 122 (22.0%) |
| 75 Years and over | 32 (16.0%) | 99 (26.4%) |
Disability Class by Sex by Age in Kendall Park
Disability Class: Hearing Difficulty
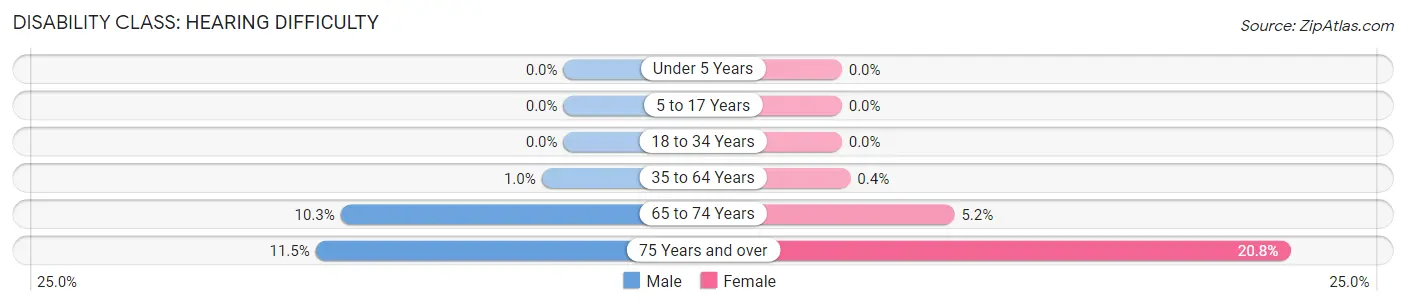
| Age Bracket | Male | Female |
| Under 5 Years | 0 (0.0%) | 0 (0.0%) |
| 5 to 17 Years | 0 (0.0%) | 0 (0.0%) |
| 18 to 34 Years | 0 (0.0%) | 0 (0.0%) |
| 35 to 64 Years | 23 (1.0%) | 10 (0.4%) |
| 65 to 74 Years | 37 (10.3%) | 29 (5.2%) |
| 75 Years and over | 23 (11.5%) | 78 (20.8%) |
Disability Class: Vision Difficulty
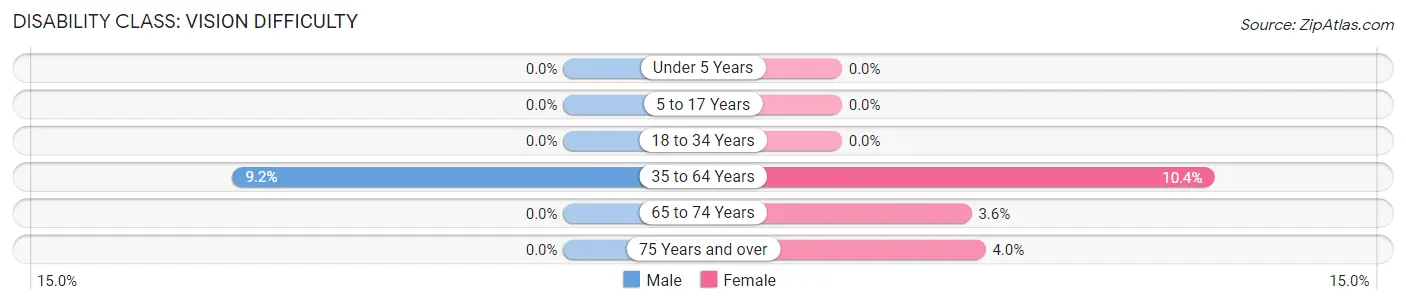
| Age Bracket | Male | Female |
| Under 5 Years | 0 (0.0%) | 0 (0.0%) |
| 5 to 17 Years | 0 (0.0%) | 0 (0.0%) |
| 18 to 34 Years | 0 (0.0%) | 0 (0.0%) |
| 35 to 64 Years | 210 (9.2%) | 259 (10.4%) |
| 65 to 74 Years | 0 (0.0%) | 20 (3.6%) |
| 75 Years and over | 0 (0.0%) | 15 (4.0%) |
Disability Class: Cognitive Difficulty
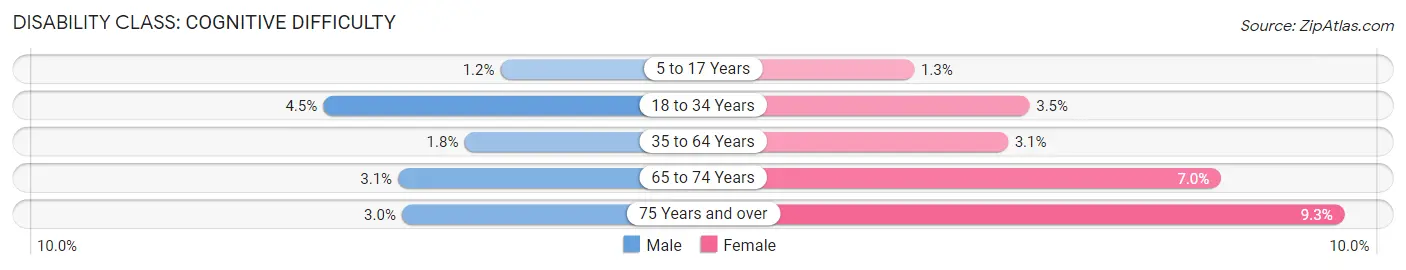
| Age Bracket | Male | Female |
| 5 to 17 Years | 11 (1.2%) | 12 (1.3%) |
| 18 to 34 Years | 41 (4.5%) | 37 (3.5%) |
| 35 to 64 Years | 42 (1.8%) | 77 (3.1%) |
| 65 to 74 Years | 11 (3.1%) | 39 (7.0%) |
| 75 Years and over | 6 (3.0%) | 35 (9.3%) |
Disability Class: Ambulatory Difficulty
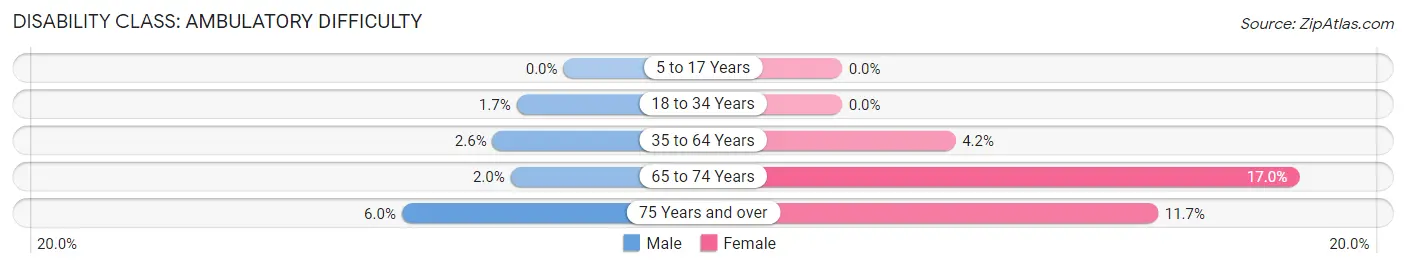
| Age Bracket | Male | Female |
| 5 to 17 Years | 0 (0.0%) | 0 (0.0%) |
| 18 to 34 Years | 16 (1.7%) | 0 (0.0%) |
| 35 to 64 Years | 60 (2.6%) | 105 (4.2%) |
| 65 to 74 Years | 7 (2.0%) | 94 (17.0%) |
| 75 Years and over | 12 (6.0%) | 44 (11.7%) |
Disability Class: Self-Care Difficulty
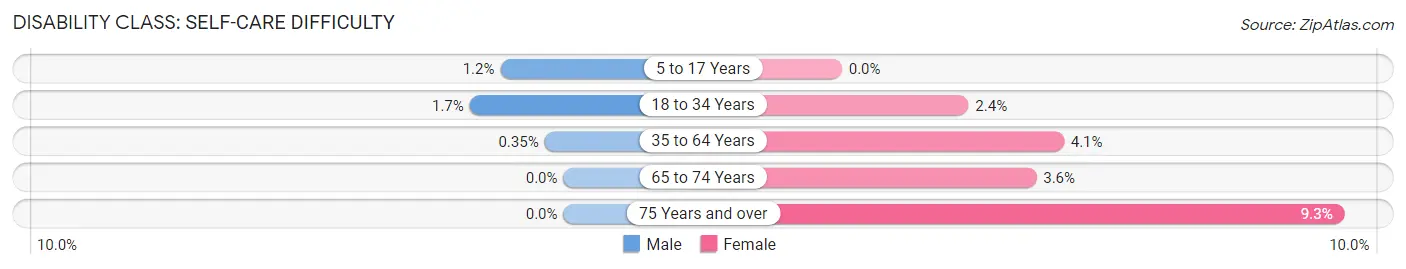
| Age Bracket | Male | Female |
| 5 to 17 Years | 11 (1.2%) | 0 (0.0%) |
| 18 to 34 Years | 16 (1.7%) | 25 (2.4%) |
| 35 to 64 Years | 8 (0.4%) | 103 (4.1%) |
| 65 to 74 Years | 0 (0.0%) | 20 (3.6%) |
| 75 Years and over | 0 (0.0%) | 35 (9.3%) |
Technology Access in Kendall Park
Computing Device Access in Kendall Park
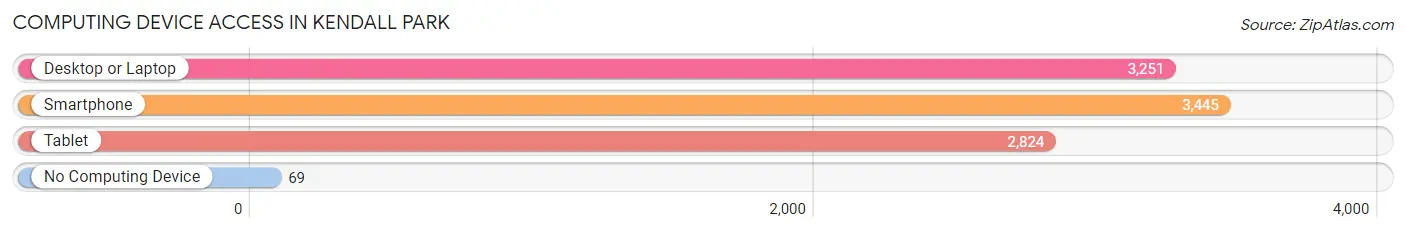
| Device Type | # Households | % Households |
| Desktop or Laptop | 3,251 | 89.8% |
| Smartphone | 3,445 | 95.2% |
| Tablet | 2,824 | 78.0% |
| No Computing Device | 69 | 1.9% |
| Total | 3,620 | 100.0% |
Internet Access in Kendall Park
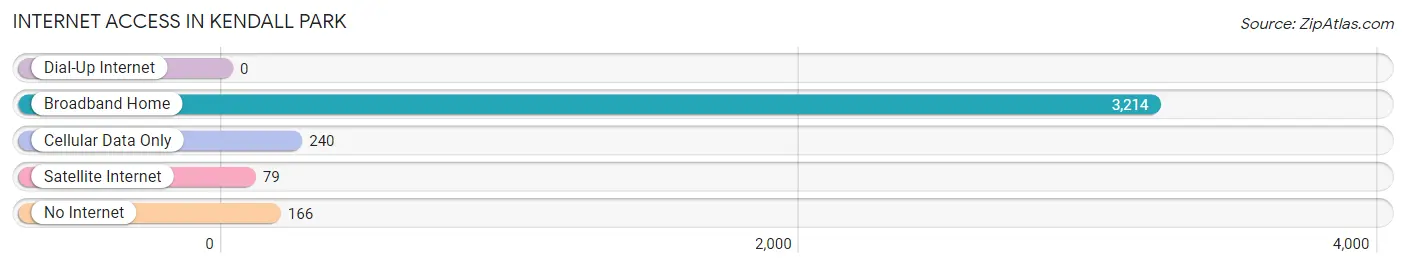
| Internet Type | # Households | % Households |
| Dial-Up Internet | 0 | 0.0% |
| Broadband Home | 3,214 | 88.8% |
| Cellular Data Only | 240 | 6.6% |
| Satellite Internet | 79 | 2.2% |
| No Internet | 166 | 4.6% |
| Total | 3,620 | 100.0% |
Kendall Park Summary
Kendall Park is a census-designated place (CDP) located in South Brunswick Township, in Middlesex County, New Jersey. It is located approximately 25 miles south of Newark and 25 miles northeast of Philadelphia. As of the 2010 United States Census, the CDP's population was 13,752.
History
Kendall Park was originally part of South Brunswick Township, which was established in 1798. The area was first settled in the late 1700s by Dutch and English settlers. The area was known as "Kendall's Crossroads" after the family of John Kendall, who owned a large farm in the area. The area was later renamed "Kendall Park" in the early 1900s.
Geography
Kendall Park is located at 40°22'25" North, 74°30'45" West (40.373611, -74.5125). According to the United States Census Bureau, the CDP has a total area of 4.2 square miles, all of which is land.
Economy
Kendall Park is home to a variety of businesses, including retail stores, restaurants, and professional services. The largest employers in the area are the South Brunswick School District, the South Brunswick Township government, and the South Brunswick Public Library.
Demographics
As of the 2010 United States Census, there were 13,752 people, 4,945 households, and 3,717 families residing in the CDP. The population density was 3,279.2 people per square mile. The racial makeup of the CDP was 74.2% White, 8.2% African American, 0.2% Native American, 13.2% Asian, 0.1% Pacific Islander, 1.7% from other races, and 2.5% from two or more races. Hispanic or Latino of any race were 6.7% of the population.
There were 4,945 households, out of which 37.2% had children under the age of 18 living with them, 61.2% were married couples living together, 9.7% had a female householder with no husband present, and 25.2% were non-families. 20.2% of all households were made up of individuals, and 8.2% had someone living alone who was 65 years of age or older. The average household size was 2.77 and the average family size was 3.24.
In the CDP, the population was spread out, with 25.7% under the age of 18, 6.2% from 18 to 24, 28.2% from 25 to 44, 28.2% from 45 to 64, and 11.7% who were 65 years of age or older. The median age was 39.2 years. For every 100 females, there were 94.2 males. For every 100 females age 18 and over, there were 91.2 males.
The median income for a household in the CDP was $90,945, and the median income for a family was $103,945. Males had a median income of $71,945 versus $50,945 for females. The per capita income for the CDP was $37,945. About 2.2% of families and 3.2% of the population were below the poverty line, including 3.2% of those under age 18 and 4.2% of those age 65 or over.
Common Questions
What is Per Capita Income in Kendall Park?
Per Capita income in Kendall Park is $64,129.
What is the Median Family Income in Kendall Park?
Median Family Income in Kendall Park is $180,891.
What is the Median Household income in Kendall Park?
Median Household Income in Kendall Park is $159,362.
What is Income or Wage Gap in Kendall Park?
Income or Wage Gap in Kendall Park is 57.3%.
Women in Kendall Park earn 42.7 cents for every dollar earned by a man.
What is Inequality or Gini Index in Kendall Park?
Inequality or Gini Index in Kendall Park is 0.42.
What is the Total Population of Kendall Park?
Total Population of Kendall Park is 10,624.
What is the Total Male Population of Kendall Park?
Total Male Population of Kendall Park is 4,852.
What is the Total Female Population of Kendall Park?
Total Female Population of Kendall Park is 5,772.
What is the Ratio of Males per 100 Females in Kendall Park?
There are 84.06 Males per 100 Females in Kendall Park.
What is the Ratio of Females per 100 Males in Kendall Park?
There are 118.96 Females per 100 Males in Kendall Park.
What is the Median Population Age in Kendall Park?
Median Population Age in Kendall Park is 44.5 Years.
What is the Average Family Size in Kendall Park
Average Family Size in Kendall Park is 3.2 People.
What is the Average Household Size in Kendall Park
Average Household Size in Kendall Park is 2.9 People.
How Large is the Labor Force in Kendall Park?
There are 6,150 People in the Labor Forcein in Kendall Park.
What is the Percentage of People in the Labor Force in Kendall Park?
71.8% of People are in the Labor Force in Kendall Park.
What is the Unemployment Rate in Kendall Park?
Unemployment Rate in Kendall Park is 6.4%.