Cities with the Highest Percentage of Immigrants from India in Washington
RELATED REPORTS & OPTIONS
India
Washington
Compare Cities
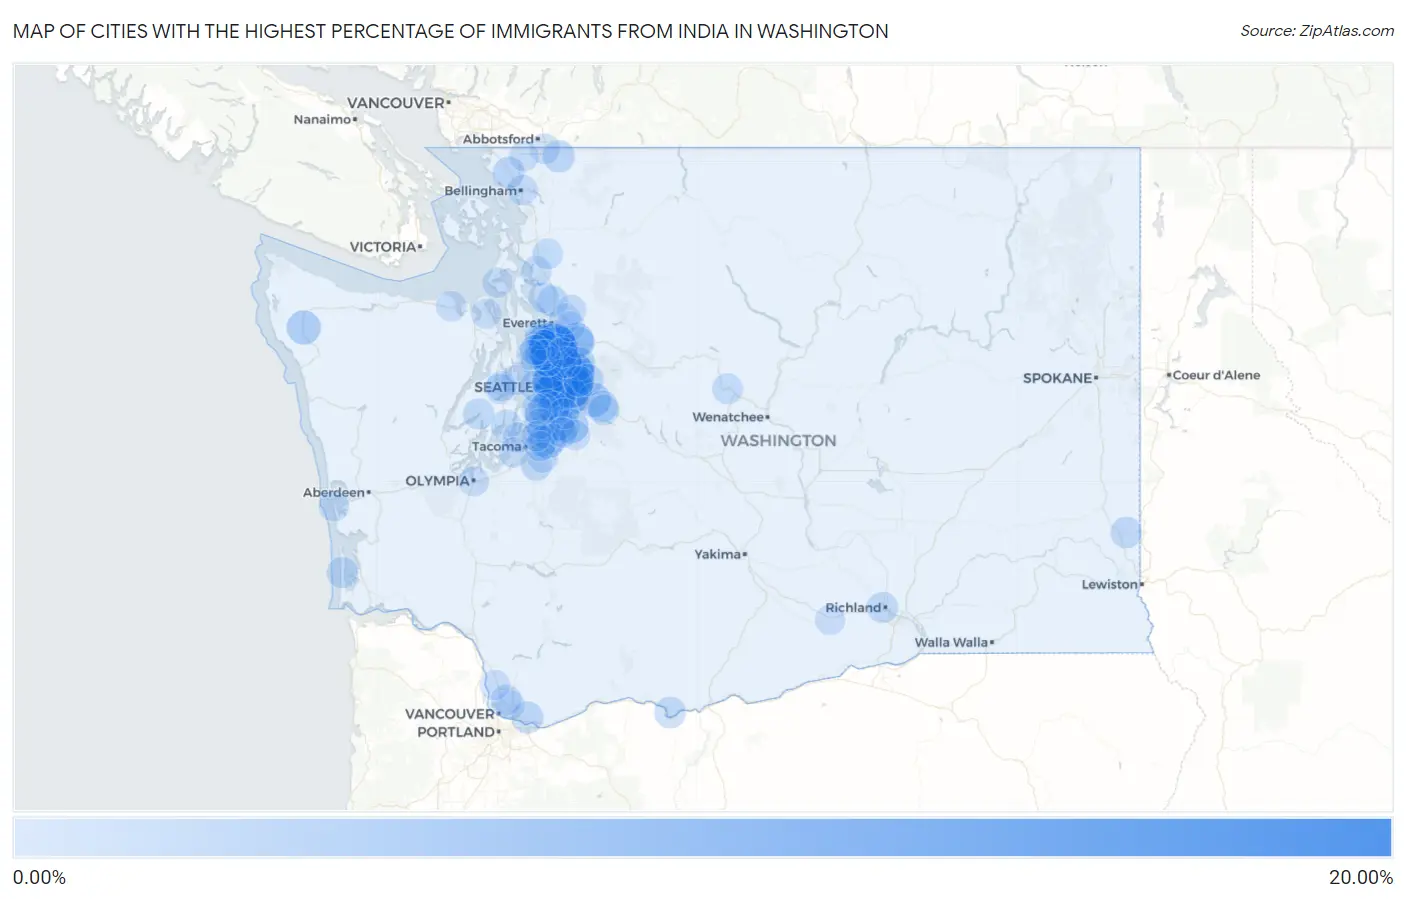
Map of Cities with the Highest Percentage of Immigrants from India in Washington
0.00%
20.00%
Cities with the Highest Percentage of Immigrants from India in Washington
| City | India | vs State | vs National | |
| 1. | Bothell East | 17.59% | 1.32%(+16.3)#-1 | 0.83%(+16.8)#0 |
| 2. | Redmond | 16.34% | 1.32%(+15.0)#0 | 0.83%(+15.5)#1 |
| 3. | Mill Creek East | 15.13% | 1.32%(+13.8)#1 | 0.83%(+14.3)#2 |
| 4. | Union Hill Novelty Hill | 12.14% | 1.32%(+10.8)#2 | 0.83%(+11.3)#3 |
| 5. | Sammamish | 11.37% | 1.32%(+10.1)#3 | 0.83%(+10.5)#4 |
| 6. | Bellevue | 10.56% | 1.32%(+9.24)#4 | 0.83%(+9.74)#5 |
| 7. | Issaquah | 6.97% | 1.32%(+5.65)#5 | 0.83%(+6.14)#6 |
| 8. | Bothell West | 6.05% | 1.32%(+4.74)#6 | 0.83%(+5.23)#7 |
| 9. | Clyde Hill | 5.86% | 1.32%(+4.54)#7 | 0.83%(+5.03)#8 |
| 10. | Newcastle | 5.20% | 1.32%(+3.89)#8 | 0.83%(+4.38)#9 |
| 11. | Lake Stickney | 5.01% | 1.32%(+3.69)#9 | 0.83%(+4.19)#10 |
| 12. | Bothell | 4.29% | 1.32%(+2.97)#10 | 0.83%(+3.47)#11 |
| 13. | Monroe North | 4.26% | 1.32%(+2.94)#11 | 0.83%(+3.43)#12 |
| 14. | Woodinville | 4.18% | 1.32%(+2.86)#12 | 0.83%(+3.35)#13 |
| 15. | Snoqualmie | 4.01% | 1.32%(+2.69)#13 | 0.83%(+3.19)#104 |
| 16. | Algona | 3.98% | 1.32%(+2.66)#14 | 0.83%(+3.16)#105 |
| 17. | Maple Valley | 3.90% | 1.32%(+2.59)#15 | 0.83%(+3.08)#106 |
| 18. | Forks | 3.76% | 1.32%(+2.44)#16 | 0.83%(+2.93)#107 |
| 19. | Martha Lake | 3.65% | 1.32%(+2.34)#17 | 0.83%(+2.83)#108 |
| 20. | Yarrow Point | 3.36% | 1.32%(+2.04)#18 | 0.83%(+2.53)#109 |
| 21. | Kent | 3.21% | 1.32%(+1.90)#19 | 0.83%(+2.39)#110 |
| 22. | Larch Way | 3.14% | 1.32%(+1.82)#20 | 0.83%(+2.31)#111 |
| 23. | Kirkland | 3.08% | 1.32%(+1.76)#21 | 0.83%(+2.25)#190 |
| 24. | Duvall | 3.06% | 1.32%(+1.75)#22 | 0.83%(+2.24)#191 |
| 25. | Mill Creek | 2.86% | 1.32%(+1.54)#23 | 0.83%(+2.03)#192 |
| 26. | Lakeland North | 2.79% | 1.32%(+1.48)#24 | 0.83%(+1.97)#193 |
| 27. | Silver Firs | 2.77% | 1.32%(+1.45)#25 | 0.83%(+1.94)#194 |
| 28. | Seatac | 2.54% | 1.32%(+1.22)#26 | 0.83%(+1.72)#195 |
| 29. | Peaceful Valley | 2.17% | 1.32%(+0.855)#27 | 0.83%(+1.35)#196 |
| 30. | Carnation | 2.15% | 1.32%(+0.829)#28 | 0.83%(+1.32)#197 |
| 31. | Covington | 2.05% | 1.32%(+0.728)#29 | 0.83%(+1.22)#198 |
| 32. | Mercer Island | 2.04% | 1.32%(+0.720)#30 | 0.83%(+1.21)#199 |
| 33. | Seattle | 2.03% | 1.32%(+0.715)#31 | 0.83%(+1.21)#200 |
| 34. | Lynnwood | 1.96% | 1.32%(+0.646)#32 | 0.83%(+1.14)#201 |
| 35. | Camas | 1.89% | 1.32%(+0.569)#33 | 0.83%(+1.06)#202 |
| 36. | Monroe | 1.83% | 1.32%(+0.510)#34 | 0.83%(+1.00)#203 |
| 37. | Renton | 1.80% | 1.32%(+0.486)#35 | 0.83%(+0.979)#204 |
| 38. | Ferndale | 1.73% | 1.32%(+0.407)#36 | 0.83%(+0.900)#205 |
| 39. | Dallesport | 1.54% | 1.32%(+0.225)#37 | 0.83%(+0.717)#206 |
| 40. | Pullman | 1.53% | 1.32%(+0.211)#38 | 0.83%(+0.704)#207 |
| 41. | Ocean Park | 1.47% | 1.32%(+0.151)#39 | 0.83%(+0.644)#208 |
| 42. | Fairwood Cdp King County | 1.44% | 1.32%(+0.122)#40 | 0.83%(+0.615)#209 |
| 43. | Cottage Lake | 1.36% | 1.32%(+0.046)#41 | 0.83%(+0.539)#210 |
| 44. | North Bend | 1.32% | 1.32%(+0.006)#42 | 0.83%(+0.499)#211 |
| 45. | Belfair | 1.32% | 1.32%(-0.001)#43 | 0.83%(+0.492)#212 |
| 46. | Richland | 1.29% | 1.32%(-0.032)#44 | 0.83%(+0.461)#213 |
| 47. | Fairwood Cdp Spokane County | 1.22% | 1.32%(-0.096)#45 | 0.83%(+0.397)#214 |
| 48. | Eastmont | 1.22% | 1.32%(-0.097)#46 | 0.83%(+0.396)#215 |
| 49. | Marysville | 1.13% | 1.32%(-0.185)#47 | 0.83%(+0.308)#216 |
| 50. | Medina | 1.13% | 1.32%(-0.189)#48 | 0.83%(+0.304)#217 |
| 51. | Lake Goodwin | 1.11% | 1.32%(-0.207)#49 | 0.83%(+0.286)#218 |
| 52. | Bryn Mawr Skyway | 1.09% | 1.32%(-0.231)#50 | 0.83%(+0.262)#219 |
| 53. | Summit View | 1.09% | 1.32%(-0.232)#51 | 0.83%(+0.261)#220 |
| 54. | Picnic Point | 1.03% | 1.32%(-0.293)#52 | 0.83%(+0.200)#221 |
| 55. | Auburn | 1.02% | 1.32%(-0.301)#53 | 0.83%(+0.192)#222 |
| 56. | Barberton | 0.99% | 1.32%(-0.324)#54 | 0.83%(+0.169)#223 |
| 57. | Ames Lake | 0.99% | 1.32%(-0.325)#55 | 0.83%(+0.167)#224 |
| 58. | Mountlake Terrace | 0.97% | 1.32%(-0.349)#56 | 0.83%(+0.144)#225 |
| 59. | Shoreline | 0.96% | 1.32%(-0.355)#57 | 0.83%(+0.138)#226 |
| 60. | Leavenworth | 0.95% | 1.32%(-0.364)#58 | 0.83%(+0.129)#227 |
| 61. | Lake Stevens | 0.95% | 1.32%(-0.368)#59 | 0.83%(+0.125)#228 |
| 62. | Canterwood | 0.94% | 1.32%(-0.382)#60 | 0.83%(+0.111)#229 |
| 63. | Maple Heights Lake Desire | 0.93% | 1.32%(-0.387)#61 | 0.83%(+0.106)#230 |
| 64. | Riverbend | 0.93% | 1.32%(-0.387)#62 | 0.83%(+0.106)#231 |
| 65. | Lake Ketchum | 0.93% | 1.32%(-0.391)#63 | 0.83%(+0.102)#232 |
| 66. | Big Lake | 0.88% | 1.32%(-0.436)#64 | 0.83%(+0.057)#233 |
| 67. | Tukwila | 0.84% | 1.32%(-0.474)#65 | 0.83%(+0.019)#234 |
| 68. | Lakeland South | 0.80% | 1.32%(-0.517)#66 | 0.83%(-0.024)#235 |
| 69. | Kenmore | 0.79% | 1.32%(-0.530)#67 | 0.83%(-0.038)#236 |
| 70. | Mukilteo | 0.78% | 1.32%(-0.541)#68 | 0.83%(-0.048)#237 |
| 71. | Puyallup | 0.74% | 1.32%(-0.577)#69 | 0.83%(-0.084)#238 |
| 72. | Sumas | 0.72% | 1.32%(-0.602)#70 | 0.83%(-0.109)#239 |
| 73. | Ruston | 0.71% | 1.32%(-0.610)#71 | 0.83%(-0.117)#240 |
| 74. | Des Moines | 0.70% | 1.32%(-0.620)#72 | 0.83%(-0.127)#241 |
| 75. | Black Diamond | 0.70% | 1.32%(-0.622)#73 | 0.83%(-0.129)#242 |
| 76. | North Lynnwood | 0.67% | 1.32%(-0.650)#74 | 0.83%(-0.157)#243 |
| 77. | Bainbridge Island | 0.66% | 1.32%(-0.662)#75 | 0.83%(-0.169)#244 |
| 78. | Bellingham | 0.65% | 1.32%(-0.664)#76 | 0.83%(-0.171)#245 |
| 79. | Sequim | 0.63% | 1.32%(-0.686)#77 | 0.83%(-0.194)#246 |
| 80. | Olympia | 0.58% | 1.32%(-0.734)#78 | 0.83%(-0.241)#247 |
| 81. | Rocky Point | 0.58% | 1.32%(-0.736)#79 | 0.83%(-0.243)#248 |
| 82. | Lochsloy | 0.56% | 1.32%(-0.758)#80 | 0.83%(-0.265)#249 |
| 83. | Brier | 0.55% | 1.32%(-0.768)#81 | 0.83%(-0.275)#250 |
| 84. | Woodway | 0.54% | 1.32%(-0.782)#82 | 0.83%(-0.289)#251 |
| 85. | Tracyton | 0.53% | 1.32%(-0.784)#83 | 0.83%(-0.291)#252 |
| 86. | Port Hadlock Irondale | 0.51% | 1.32%(-0.807)#84 | 0.83%(-0.314)#253 |
| 87. | Maltby | 0.49% | 1.32%(-0.825)#85 | 0.83%(-0.332)#254 |
| 88. | Westport | 0.48% | 1.32%(-0.838)#86 | 0.83%(-0.345)#255 |
| 89. | Burien | 0.48% | 1.32%(-0.839)#87 | 0.83%(-0.346)#256 |
| 90. | Edmonds | 0.45% | 1.32%(-0.864)#88 | 0.83%(-0.371)#257 |
| 91. | Coupeville | 0.44% | 1.32%(-0.877)#89 | 0.83%(-0.384)#258 |
| 92. | Lake Morton Berrydale | 0.44% | 1.32%(-0.878)#90 | 0.83%(-0.385)#259 |
| 93. | Everett | 0.43% | 1.32%(-0.886)#91 | 0.83%(-0.393)#260 |
| 94. | Milton | 0.42% | 1.32%(-0.897)#92 | 0.83%(-0.404)#261 |
| 95. | Lynden | 0.41% | 1.32%(-0.905)#93 | 0.83%(-0.412)#262 |
| 96. | University Place | 0.41% | 1.32%(-0.909)#94 | 0.83%(-0.416)#263 |
| 97. | Prosser | 0.39% | 1.32%(-0.927)#95 | 0.83%(-0.434)#264 |
| 98. | Federal Way | 0.39% | 1.32%(-0.928)#96 | 0.83%(-0.435)#265 |
| 99. | Five Corners | 0.39% | 1.32%(-0.931)#97 | 0.83%(-0.438)#266 |
| 100. | Ridgefield | 0.38% | 1.32%(-0.935)#98 | 0.83%(-0.442)#267 |
Common Questions
What are the Top 10 Cities with the Highest Percentage of Immigrants from India in Washington?
Top 10 Cities with the Highest Percentage of Immigrants from India in Washington are:
#1
17.59%
#2
16.34%
#3
15.13%
#4
12.14%
#5
11.37%
#6
10.56%
#7
6.97%
#8
6.05%
#9
5.86%
#10
5.20%
What city has the Highest Percentage of Immigrants from India in Washington?
Bothell East has the Highest Percentage of Immigrants from India in Washington with 17.59%.
What is the Percentage of Immigrants from India in the State of Washington?
Percentage of Immigrants from India in Washington is 1.32%.
What is the Percentage of Immigrants from India in the United States?
Percentage of Immigrants from India in the United States is 0.83%.