Sunnyvale, TX Map & Demographics
Sunnyvale Map
Sunnyvale Overview
$59,789
PER CAPITA INCOME
$159,464
AVG FAMILY INCOME
$152,632
AVG HOUSEHOLD INCOME
42.9%
WAGE / INCOME GAP [ % ]
57.1¢/ $1
WAGE / INCOME GAP [ $ ]
0.38
INEQUALITY / GINI INDEX
7,873
TOTAL POPULATION
4,094
MALE POPULATION
3,779
FEMALE POPULATION
108.34
MALES / 100 FEMALES
92.31
FEMALES / 100 MALES
43.1
MEDIAN AGE
3.1
AVG FAMILY SIZE
3.0
AVG HOUSEHOLD SIZE
4,302
LABOR FORCE [ PEOPLE ]
71.6%
PERCENT IN LABOR FORCE
5.9%
UNEMPLOYMENT RATE
Sunnyvale Zip Codes
Income in Sunnyvale
Income Overview in Sunnyvale
Per Capita Income in Sunnyvale is $59,789, while median incomes of families and households are $159,464 and $152,632 respectively.
| Characteristic | Number | Measure |
| Per Capita Income | 7,873 | $59,789 |
| Median Family Income | 2,463 | $159,464 |
| Mean Family Income | 2,463 | $180,216 |
| Median Household Income | 2,624 | $152,632 |
| Mean Household Income | 2,624 | $177,749 |
| Income Deficit | 2,463 | $0 |
| Wage / Income Gap (%) | 7,873 | 42.91% |
| Wage / Income Gap ($) | 7,873 | 57.09¢ per $1 |
| Gini / Inequality Index | 7,873 | 0.38 |
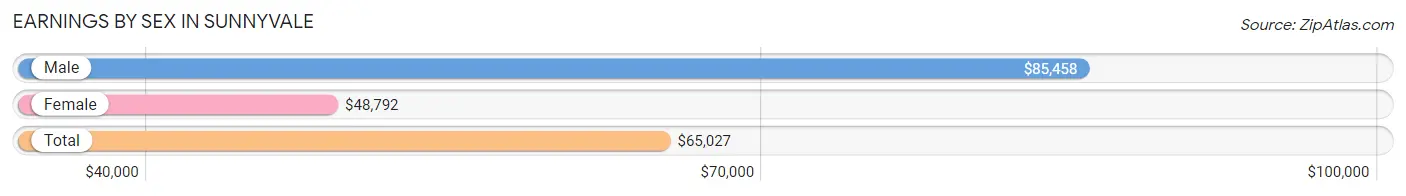
Earnings by Sex in Sunnyvale
Average Earnings in Sunnyvale are $65,027, $85,458 for men and $48,792 for women, a difference of 42.9%.
| Sex | Number | Average Earnings |
| Male | 2,239 (51.0%) | $85,458 |
| Female | 2,153 (49.0%) | $48,792 |
| Total | 4,392 (100.0%) | $65,027 |
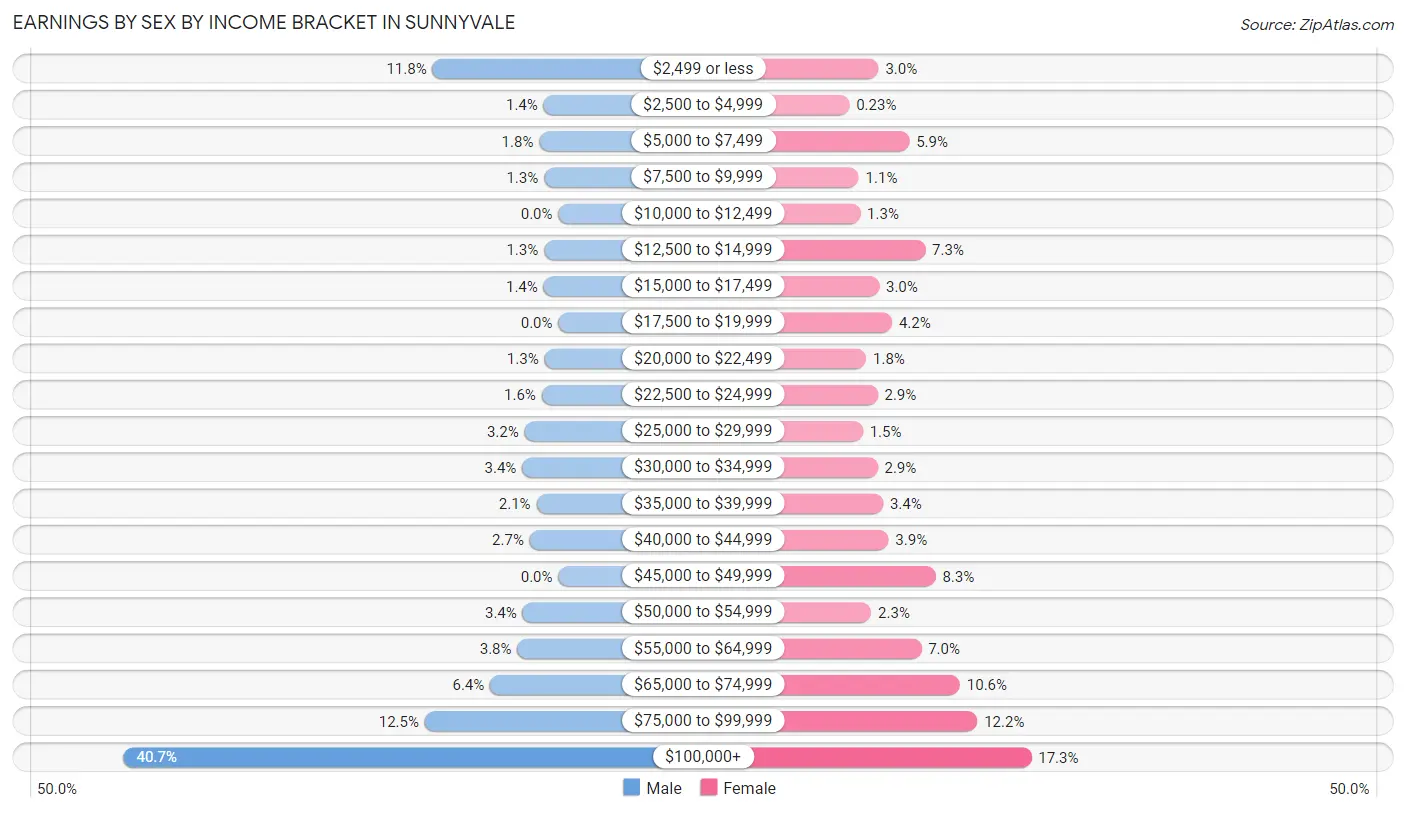
Earnings by Sex by Income Bracket in Sunnyvale
The most common earnings brackets in Sunnyvale are $100,000+ for men (912 | 40.7%) and $100,000+ for women (372 | 17.3%).
| Income | Male | Female |
| $2,499 or less | 264 (11.8%) | 64 (3.0%) |
| $2,500 to $4,999 | 31 (1.4%) | 5 (0.2%) |
| $5,000 to $7,499 | 40 (1.8%) | 126 (5.9%) |
| $7,500 to $9,999 | 30 (1.3%) | 24 (1.1%) |
| $10,000 to $12,499 | 0 (0.0%) | 27 (1.3%) |
| $12,500 to $14,999 | 30 (1.3%) | 158 (7.3%) |
| $15,000 to $17,499 | 31 (1.4%) | 65 (3.0%) |
| $17,500 to $19,999 | 0 (0.0%) | 91 (4.2%) |
| $20,000 to $22,499 | 29 (1.3%) | 39 (1.8%) |
| $22,500 to $24,999 | 35 (1.6%) | 62 (2.9%) |
| $25,000 to $29,999 | 71 (3.2%) | 32 (1.5%) |
| $30,000 to $34,999 | 76 (3.4%) | 62 (2.9%) |
| $35,000 to $39,999 | 46 (2.1%) | 73 (3.4%) |
| $40,000 to $44,999 | 60 (2.7%) | 84 (3.9%) |
| $45,000 to $49,999 | 0 (0.0%) | 179 (8.3%) |
| $50,000 to $54,999 | 75 (3.4%) | 49 (2.3%) |
| $55,000 to $64,999 | 86 (3.8%) | 150 (7.0%) |
| $65,000 to $74,999 | 143 (6.4%) | 228 (10.6%) |
| $75,000 to $99,999 | 280 (12.5%) | 263 (12.2%) |
| $100,000+ | 912 (40.7%) | 372 (17.3%) |
| Total | 2,239 (100.0%) | 2,153 (100.0%) |
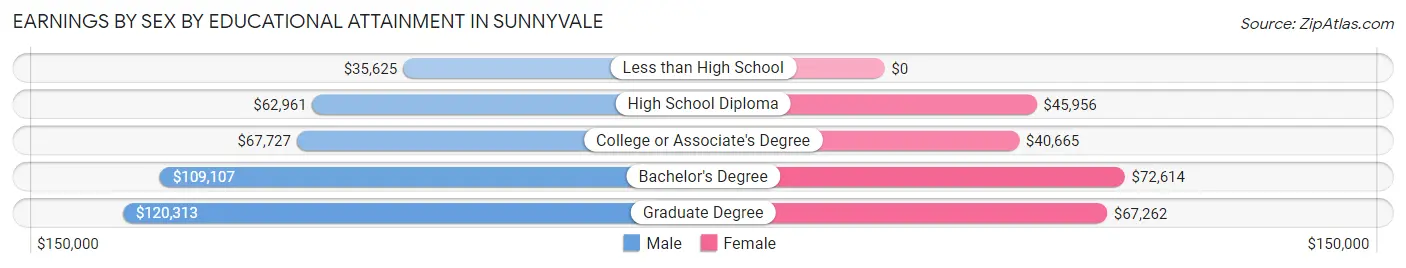
Earnings by Sex by Educational Attainment in Sunnyvale
Average earnings in Sunnyvale are $98,356 for men and $56,250 for women, a difference of 42.8%. Men with an educational attainment of graduate degree enjoy the highest average annual earnings of $120,313, while those with less than high school education earn the least with $35,625. Women with an educational attainment of bachelor's degree earn the most with the average annual earnings of $72,614, while those with college or associate's degree education have the smallest earnings of $40,665.
| Educational Attainment | Male Income | Female Income |
| Less than High School | $35,625 | $0 |
| High School Diploma | $62,961 | $45,956 |
| College or Associate's Degree | $67,727 | $40,665 |
| Bachelor's Degree | $109,107 | $72,614 |
| Graduate Degree | $120,313 | $67,262 |
| Total | $98,356 | $56,250 |
Family Income in Sunnyvale
Family Income Brackets in Sunnyvale
According to the Sunnyvale family income data, there are 837 families falling into the $200,000+ income range, which is the most common income bracket and makes up 34.0% of all families.
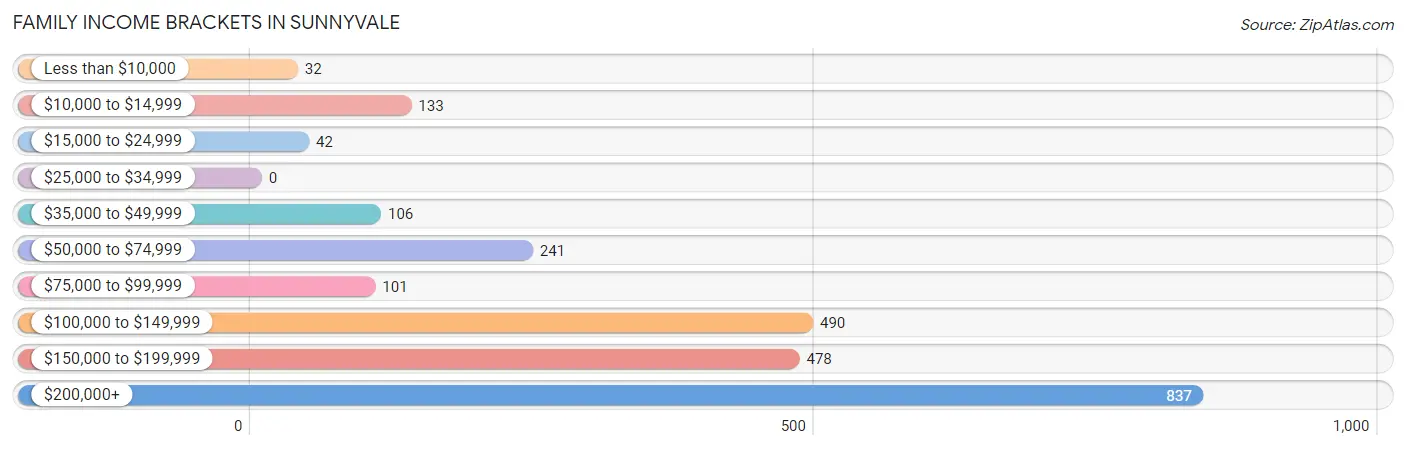
| Income Bracket | # Families | % Families |
| Less than $10,000 | 32 | 1.3% |
| $10,000 to $14,999 | 133 | 5.4% |
| $15,000 to $24,999 | 42 | 1.7% |
| $25,000 to $34,999 | 0 | 0.0% |
| $35,000 to $49,999 | 106 | 4.3% |
| $50,000 to $74,999 | 241 | 9.8% |
| $75,000 to $99,999 | 101 | 4.1% |
| $100,000 to $149,999 | 490 | 19.9% |
| $150,000 to $199,999 | 478 | 19.4% |
| $200,000+ | 837 | 34.0% |
Family Income by Famaliy Size in Sunnyvale
6-person families (60 | 2.4%) account for the highest median family income in Sunnyvale with $224,318 per family, while 2-person families (1,106 | 44.9%) have the highest median income of $54,706 per family member.
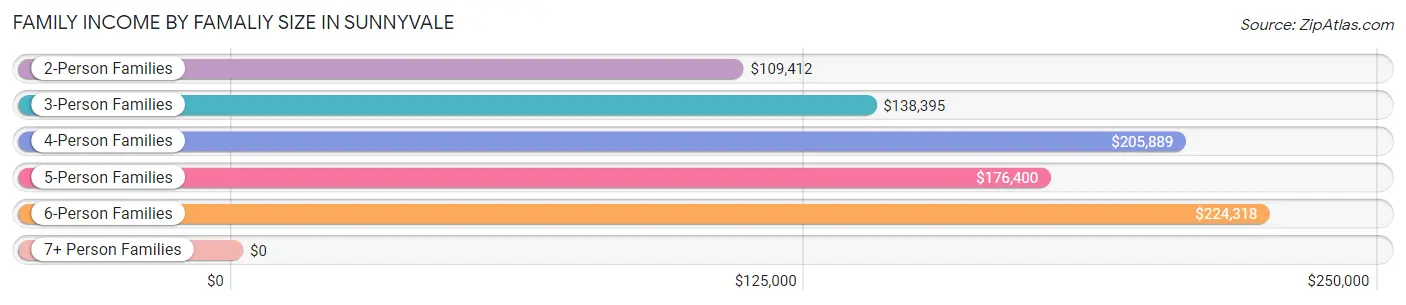
| Income Bracket | # Families | Median Income |
| 2-Person Families | 1,106 (44.9%) | $109,412 |
| 3-Person Families | 499 (20.3%) | $138,395 |
| 4-Person Families | 619 (25.1%) | $205,889 |
| 5-Person Families | 156 (6.3%) | $176,400 |
| 6-Person Families | 60 (2.4%) | $224,318 |
| 7+ Person Families | 23 (0.9%) | $0 |
| Total | 2,463 (100.0%) | $159,464 |
Family Income by Number of Earners in Sunnyvale
The median family income in Sunnyvale is $159,464, with families comprising 3+ earners (357) having the highest median family income of $203,661, while families with no earners (215) have the lowest median family income of $67,008, accounting for 14.5% and 8.7% of families, respectively.
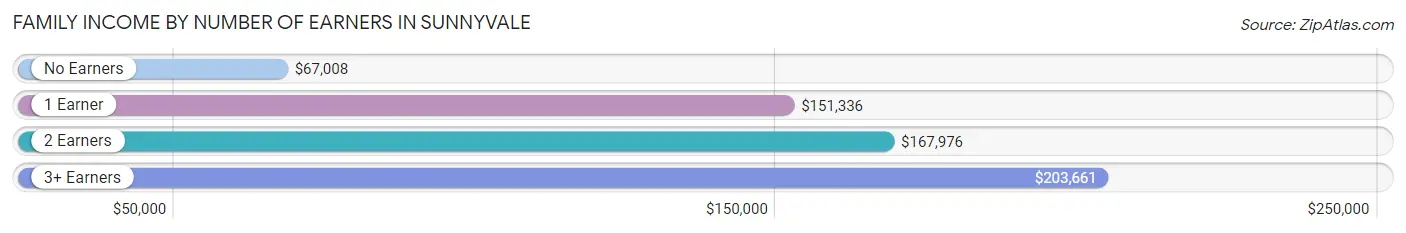
| Number of Earners | # Families | Median Income |
| No Earners | 215 (8.7%) | $67,008 |
| 1 Earner | 825 (33.5%) | $151,336 |
| 2 Earners | 1,066 (43.3%) | $167,976 |
| 3+ Earners | 357 (14.5%) | $203,661 |
| Total | 2,463 (100.0%) | $159,464 |
Household Income in Sunnyvale
Household Income Brackets in Sunnyvale
With 913 households falling in the category, the $200,000+ income range is the most frequent in Sunnyvale, accounting for 34.8% of all households. In contrast, only 31 households (1.2%) fall into the $15,000 to $24,999 income bracket, making it the least populous group.
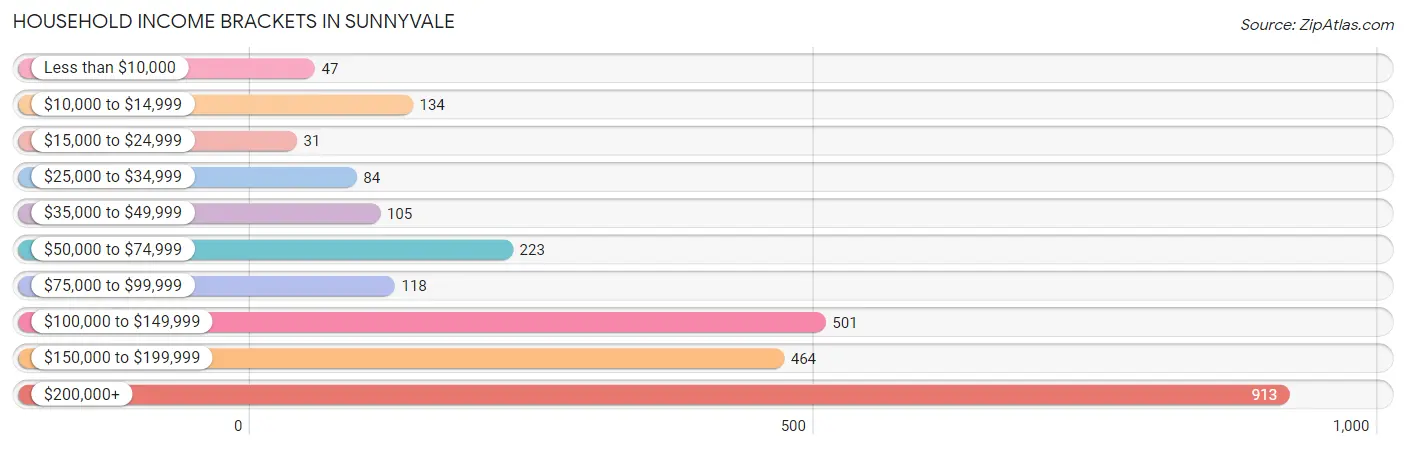
| Income Bracket | # Households | % Households |
| Less than $10,000 | 47 | 1.8% |
| $10,000 to $14,999 | 134 | 5.1% |
| $15,000 to $24,999 | 31 | 1.2% |
| $25,000 to $34,999 | 84 | 3.2% |
| $35,000 to $49,999 | 105 | 4.0% |
| $50,000 to $74,999 | 223 | 8.5% |
| $75,000 to $99,999 | 118 | 4.5% |
| $100,000 to $149,999 | 501 | 19.1% |
| $150,000 to $199,999 | 464 | 17.7% |
| $200,000+ | 913 | 34.8% |
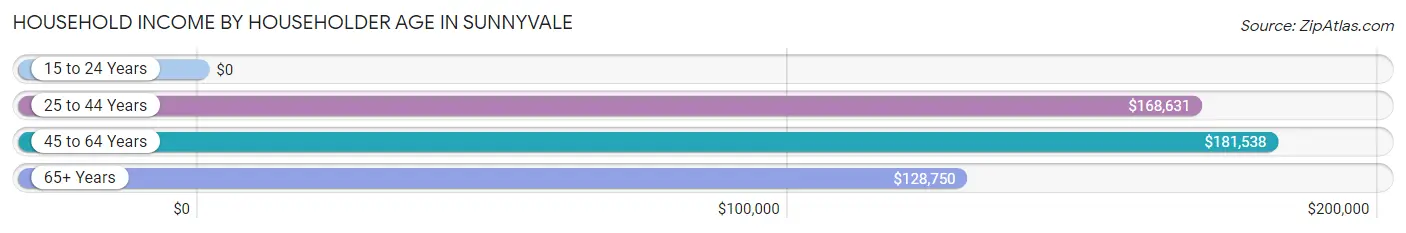
Household Income by Householder Age in Sunnyvale
The median household income in Sunnyvale is $152,632, with the highest median household income of $181,538 found in the 45 to 64 years age bracket for the primary householder. A total of 1,400 households (53.3%) fall into this category. Meanwhile, the 15 to 24 years age bracket for the primary householder has the lowest median household income of $0, with 85 households (3.2%) in this group.
| Income Bracket | # Households | Median Income |
| 15 to 24 Years | 85 (3.2%) | $0 |
| 25 to 44 Years | 597 (22.8%) | $168,631 |
| 45 to 64 Years | 1,400 (53.3%) | $181,538 |
| 65+ Years | 542 (20.7%) | $128,750 |
| Total | 2,624 (100.0%) | $152,632 |
Poverty in Sunnyvale
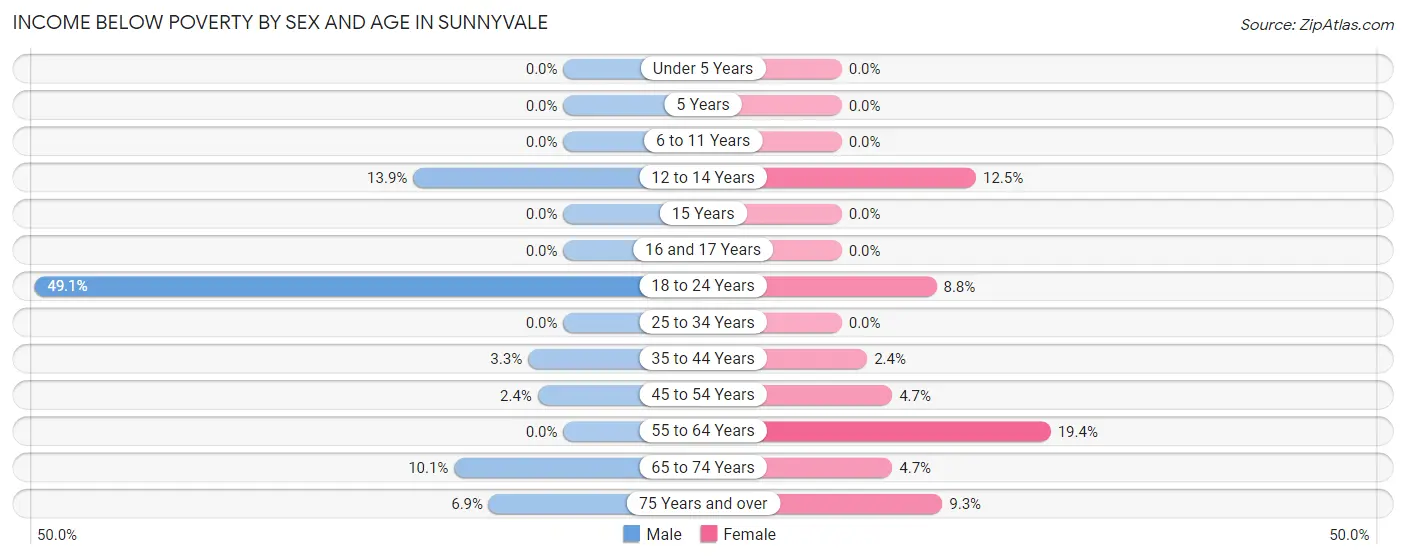
Income Below Poverty by Sex and Age in Sunnyvale
With 7.7% poverty level for males and 6.8% for females among the residents of Sunnyvale, 18 to 24 year old males and 55 to 64 year old females are the most vulnerable to poverty, with 191 males (49.1%) and 121 females (19.4%) in their respective age groups living below the poverty level.
| Age Bracket | Male | Female |
| Under 5 Years | 0 (0.0%) | 0 (0.0%) |
| 5 Years | 0 (0.0%) | 0 (0.0%) |
| 6 to 11 Years | 0 (0.0%) | 0 (0.0%) |
| 12 to 14 Years | 40 (13.9%) | 39 (12.5%) |
| 15 Years | 0 (0.0%) | 0 (0.0%) |
| 16 and 17 Years | 0 (0.0%) | 0 (0.0%) |
| 18 to 24 Years | 191 (49.1%) | 21 (8.8%) |
| 25 to 34 Years | 0 (0.0%) | 0 (0.0%) |
| 35 to 44 Years | 13 (3.3%) | 11 (2.4%) |
| 45 to 54 Years | 15 (2.4%) | 32 (4.7%) |
| 55 to 64 Years | 0 (0.0%) | 121 (19.4%) |
| 65 to 74 Years | 40 (10.1%) | 18 (4.7%) |
| 75 Years and over | 15 (6.9%) | 14 (9.3%) |
| Total | 314 (7.7%) | 256 (6.8%) |
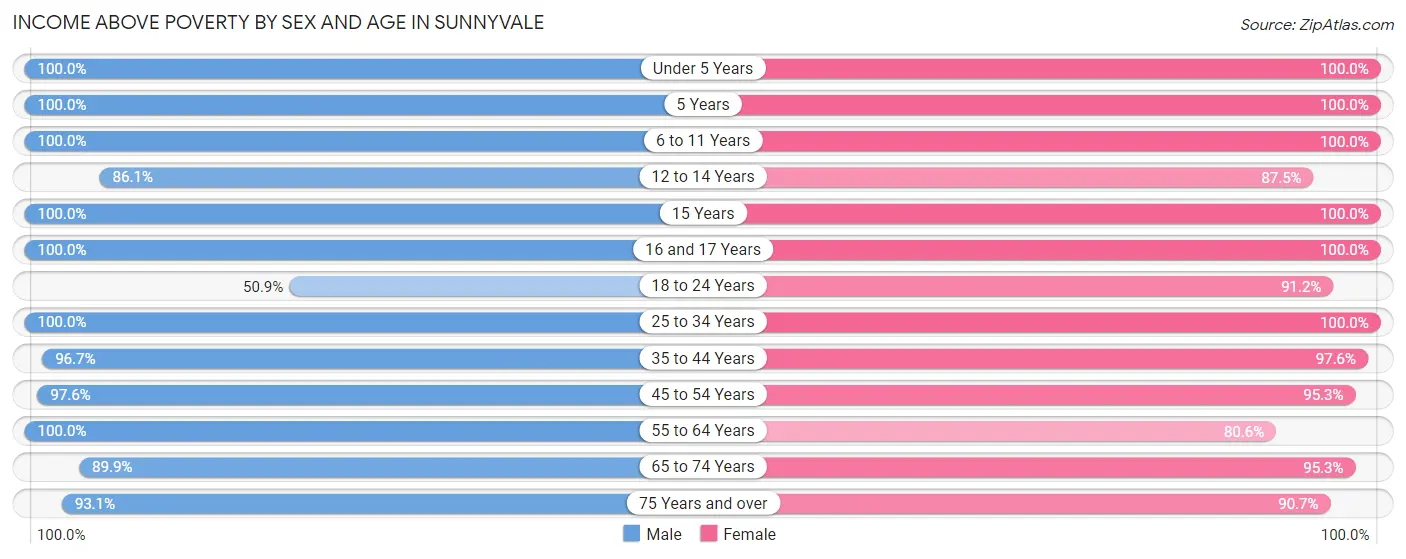
Income Above Poverty by Sex and Age in Sunnyvale
According to the poverty statistics in Sunnyvale, males aged under 5 years and females aged under 5 years are the age groups that are most secure financially, with 100.0% of males and 100.0% of females in these age groups living above the poverty line.
| Age Bracket | Male | Female |
| Under 5 Years | 39 (100.0%) | 236 (100.0%) |
| 5 Years | 72 (100.0%) | 11 (100.0%) |
| 6 to 11 Years | 590 (100.0%) | 277 (100.0%) |
| 12 to 14 Years | 247 (86.1%) | 274 (87.5%) |
| 15 Years | 37 (100.0%) | 3 (100.0%) |
| 16 and 17 Years | 170 (100.0%) | 88 (100.0%) |
| 18 to 24 Years | 198 (50.9%) | 218 (91.2%) |
| 25 to 34 Years | 313 (100.0%) | 303 (100.0%) |
| 35 to 44 Years | 383 (96.7%) | 456 (97.6%) |
| 45 to 54 Years | 614 (97.6%) | 652 (95.3%) |
| 55 to 64 Years | 560 (100.0%) | 503 (80.6%) |
| 65 to 74 Years | 355 (89.9%) | 366 (95.3%) |
| 75 Years and over | 202 (93.1%) | 136 (90.7%) |
| Total | 3,780 (92.3%) | 3,523 (93.2%) |
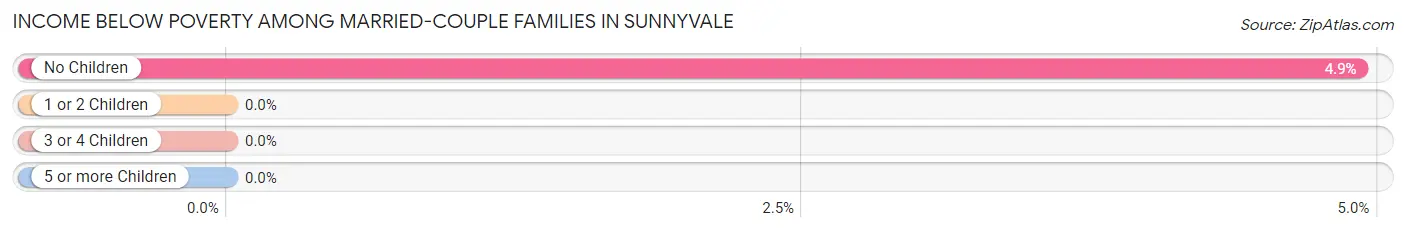
Income Below Poverty Among Married-Couple Families in Sunnyvale
The poverty statistics for married-couple families in Sunnyvale show that 2.6% or 51 of the total 1,996 families live below the poverty line. Families with no children have the highest poverty rate of 4.9%, comprising of 51 families. On the other hand, families with 1 or 2 children have the lowest poverty rate of 0.0%, which includes 0 families.
| Children | Above Poverty | Below Poverty |
| No Children | 985 (95.1%) | 51 (4.9%) |
| 1 or 2 Children | 805 (100.0%) | 0 (0.0%) |
| 3 or 4 Children | 146 (100.0%) | 0 (0.0%) |
| 5 or more Children | 9 (100.0%) | 0 (0.0%) |
| Total | 1,945 (97.4%) | 51 (2.6%) |
Income Below Poverty Among Single-Parent Households in Sunnyvale
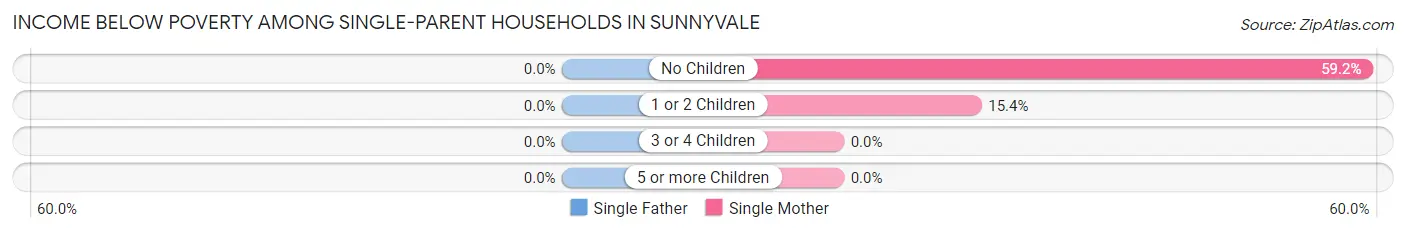
| Children | Single Father | Single Mother |
| No Children | 0 (0.0%) | 116 (59.2%) |
| 1 or 2 Children | 0 (0.0%) | 32 (15.4%) |
| 3 or 4 Children | 0 (0.0%) | 0 (0.0%) |
| 5 or more Children | 0 (0.0%) | 0 (0.0%) |
| Total | 0 (0.0%) | 148 (36.6%) |
Income Below Poverty Among Married-Couple vs Single-Parent Households in Sunnyvale
The poverty data for Sunnyvale shows that 51 of the married-couple family households (2.6%) and 148 of the single-parent households (31.7%) are living below the poverty level. Within the married-couple family households, those with no children have the highest poverty rate, with 51 households (4.9%) falling below the poverty line. Among the single-parent households, those with no children have the highest poverty rate, with 116 household (55.8%) living below poverty.
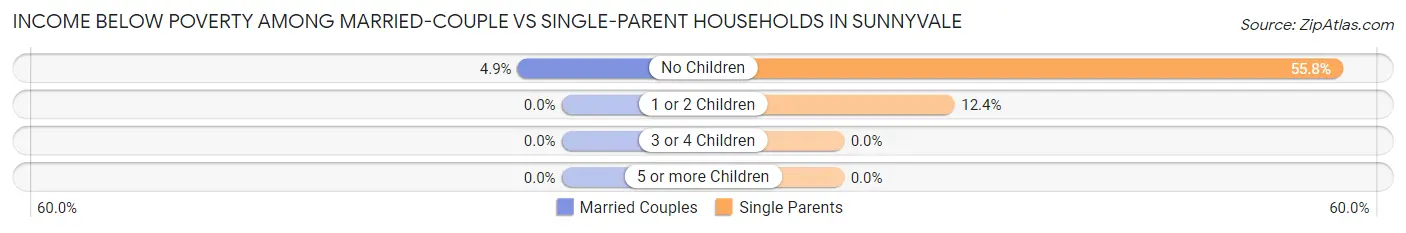
| Children | Married-Couple Families | Single-Parent Households |
| No Children | 51 (4.9%) | 116 (55.8%) |
| 1 or 2 Children | 0 (0.0%) | 32 (12.4%) |
| 3 or 4 Children | 0 (0.0%) | 0 (0.0%) |
| 5 or more Children | 0 (0.0%) | 0 (0.0%) |
| Total | 51 (2.6%) | 148 (31.7%) |
Race in Sunnyvale
The most populous races in Sunnyvale are White / Caucasian (4,762 | 60.5%), Asian (1,574 | 20.0%), and Black / African American (994 | 12.6%).
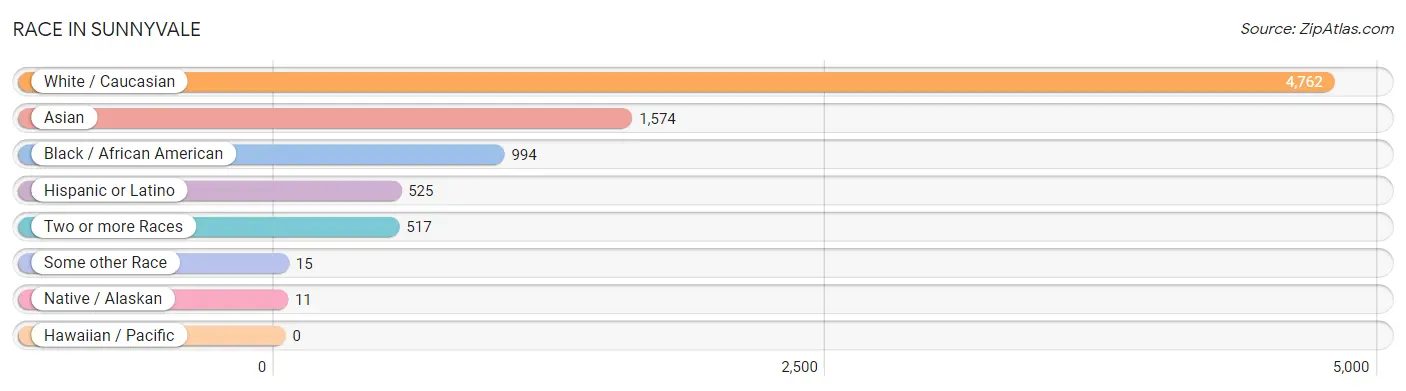
| Race | # Population | % Population |
| Asian | 1,574 | 20.0% |
| Black / African American | 994 | 12.6% |
| Hawaiian / Pacific | 0 | 0.0% |
| Hispanic or Latino | 525 | 6.7% |
| Native / Alaskan | 11 | 0.1% |
| White / Caucasian | 4,762 | 60.5% |
| Two or more Races | 517 | 6.6% |
| Some other Race | 15 | 0.2% |
| Total | 7,873 | 100.0% |
Ancestry in Sunnyvale
The most populous ancestries reported in Sunnyvale are Thai (1,574 | 20.0%), English (1,063 | 13.5%), German (796 | 10.1%), American (708 | 9.0%), and Irish (537 | 6.8%), together accounting for 59.4% of all Sunnyvale residents.
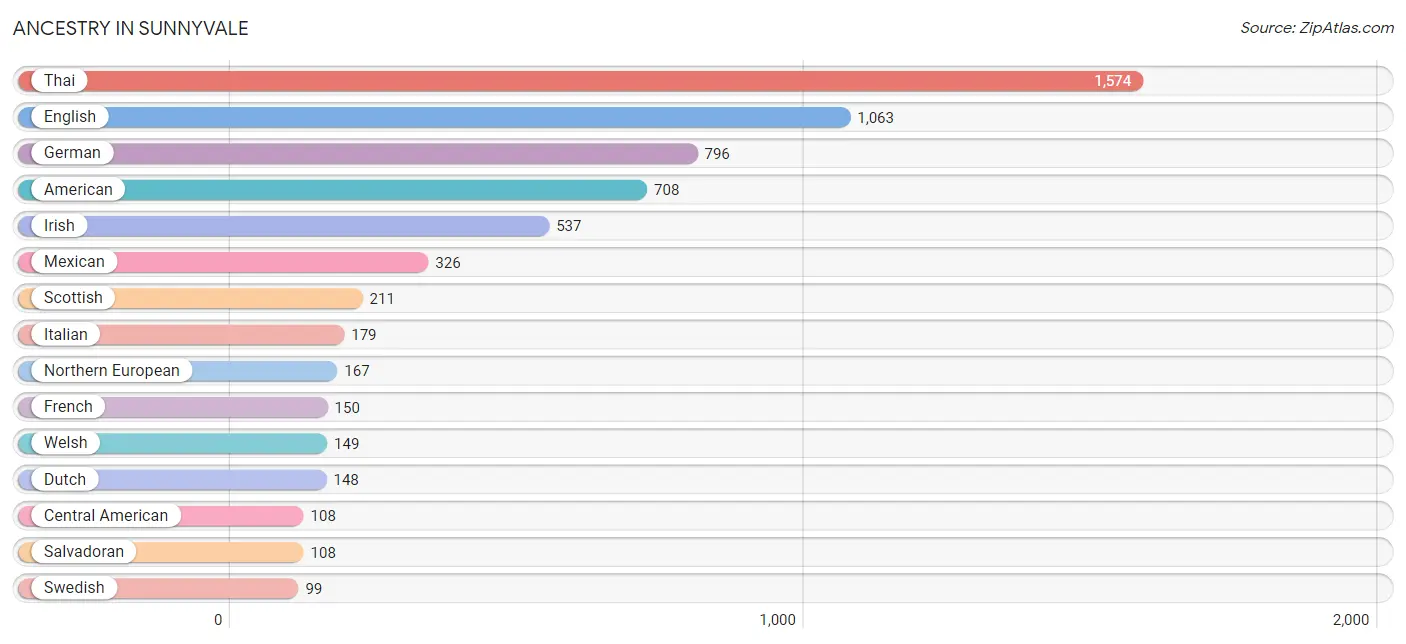
| Ancestry | # Population | % Population |
| American | 708 | 9.0% |
| Apache | 12 | 0.2% |
| Arab | 58 | 0.7% |
| Bolivian | 8 | 0.1% |
| British | 37 | 0.5% |
| Cajun | 11 | 0.1% |
| Central American | 108 | 1.4% |
| Cherokee | 12 | 0.2% |
| Chickasaw | 11 | 0.1% |
| Chilean | 54 | 0.7% |
| Czech | 15 | 0.2% |
| Danish | 15 | 0.2% |
| Dutch | 148 | 1.9% |
| Ecuadorian | 19 | 0.2% |
| English | 1,063 | 13.5% |
| European | 57 | 0.7% |
| French | 150 | 1.9% |
| German | 796 | 10.1% |
| Indian (Asian) | 32 | 0.4% |
| Iraqi | 21 | 0.3% |
| Irish | 537 | 6.8% |
| Italian | 179 | 2.3% |
| Korean | 32 | 0.4% |
| Mexican | 326 | 4.1% |
| Northern European | 167 | 2.1% |
| Norwegian | 15 | 0.2% |
| Osage | 43 | 0.5% |
| Polish | 22 | 0.3% |
| Salvadoran | 108 | 1.4% |
| Scotch-Irish | 77 | 1.0% |
| Scottish | 211 | 2.7% |
| South American | 81 | 1.0% |
| Sri Lankan | 88 | 1.1% |
| Swedish | 99 | 1.3% |
| Thai | 1,574 | 20.0% |
| Welsh | 149 | 1.9% | View All 36 Rows |
Immigrants in Sunnyvale
The most numerous immigrant groups reported in Sunnyvale came from Asia (1,185 | 15.0%), South Central Asia (1,012 | 12.9%), India (991 | 12.6%), Latin America (91 | 1.2%), and South Eastern Asia (87 | 1.1%), together accounting for 42.8% of all Sunnyvale residents.
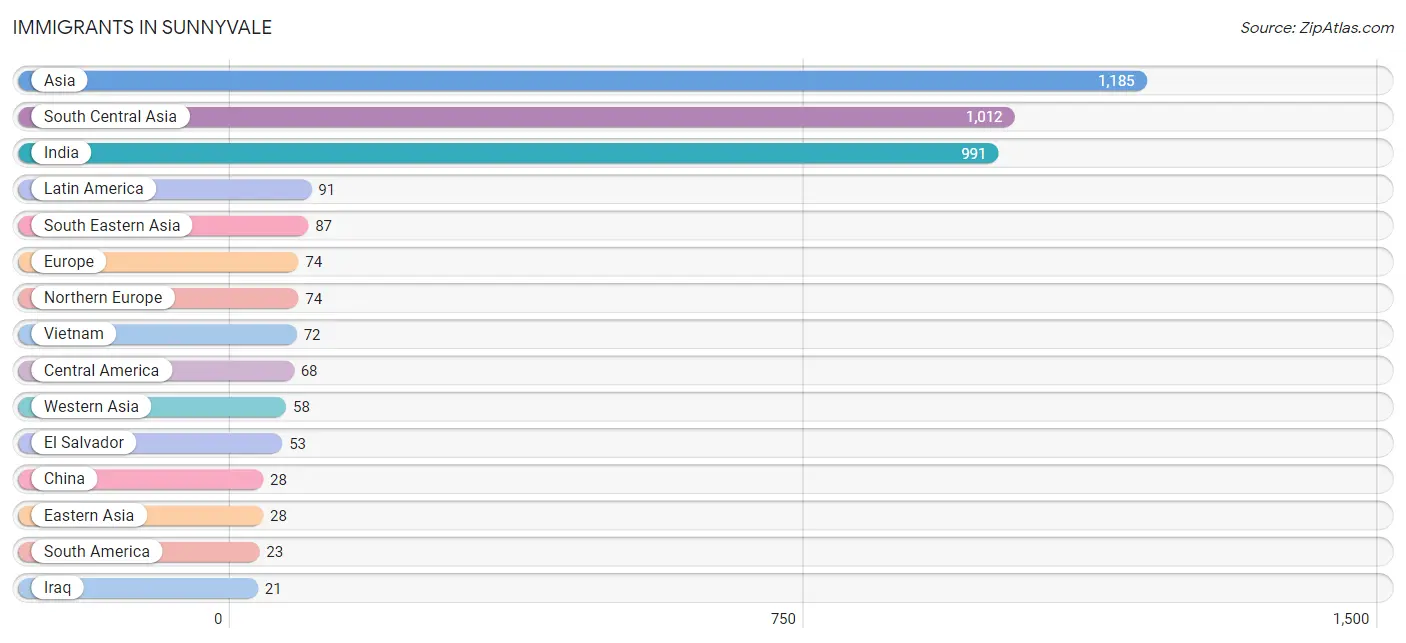
| Immigration Origin | # Population | % Population |
| Africa | 20 | 0.3% |
| Asia | 1,185 | 15.0% |
| Bolivia | 4 | 0.1% |
| Central America | 68 | 0.9% |
| Chile | 19 | 0.2% |
| China | 28 | 0.4% |
| Eastern Asia | 28 | 0.4% |
| El Salvador | 53 | 0.7% |
| Europe | 74 | 0.9% |
| India | 991 | 12.6% |
| Iraq | 21 | 0.3% |
| Kazakhstan | 21 | 0.3% |
| Latin America | 91 | 1.2% |
| Mexico | 15 | 0.2% |
| Northern Europe | 74 | 0.9% |
| Philippines | 15 | 0.2% |
| South Africa | 20 | 0.3% |
| South America | 23 | 0.3% |
| South Central Asia | 1,012 | 12.9% |
| South Eastern Asia | 87 | 1.1% |
| Vietnam | 72 | 0.9% |
| Western Asia | 58 | 0.7% | View All 22 Rows |
Sex and Age in Sunnyvale
Sex and Age in Sunnyvale
The most populous age groups in Sunnyvale are 10 to 14 Years (616 | 15.0%) for men and 10 to 14 Years (435 | 11.5%) for women.
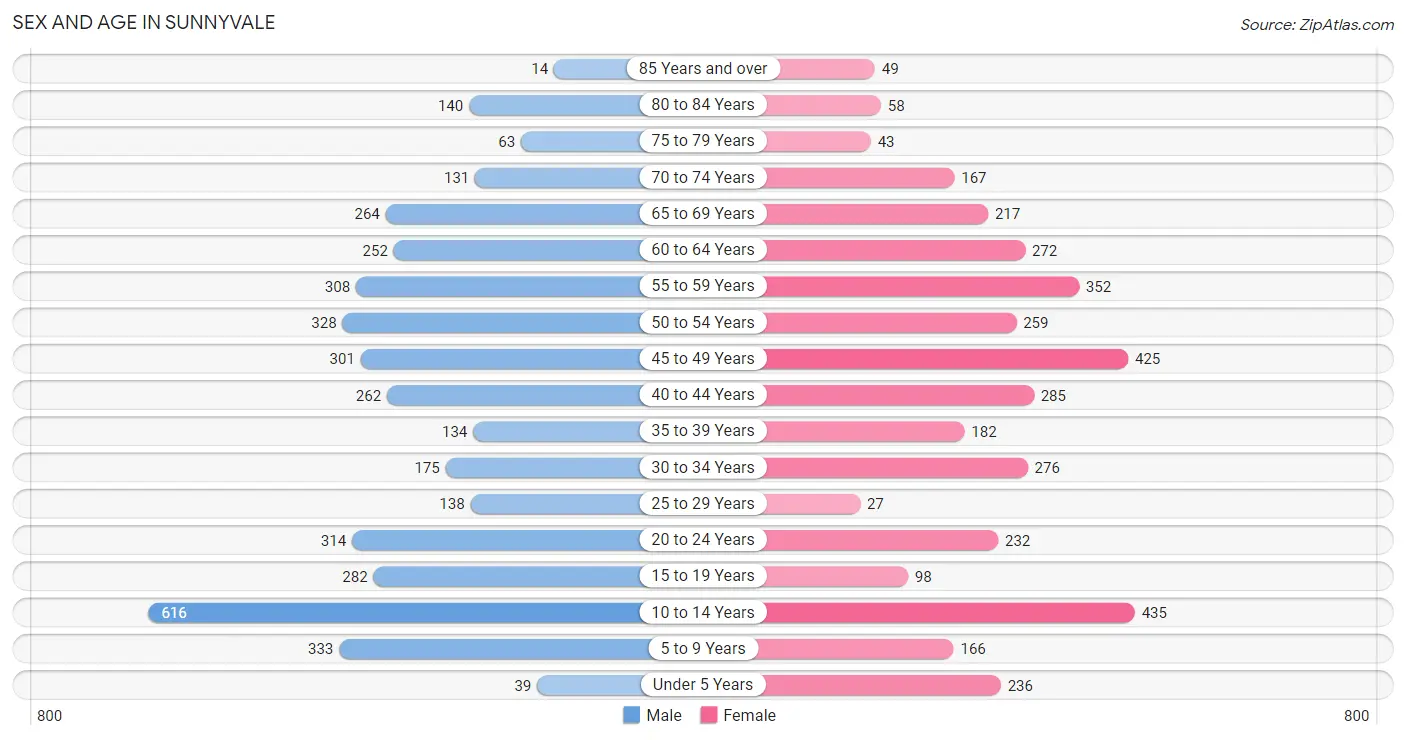
| Age Bracket | Male | Female |
| Under 5 Years | 39 (0.9%) | 236 (6.2%) |
| 5 to 9 Years | 333 (8.1%) | 166 (4.4%) |
| 10 to 14 Years | 616 (15.0%) | 435 (11.5%) |
| 15 to 19 Years | 282 (6.9%) | 98 (2.6%) |
| 20 to 24 Years | 314 (7.7%) | 232 (6.1%) |
| 25 to 29 Years | 138 (3.4%) | 27 (0.7%) |
| 30 to 34 Years | 175 (4.3%) | 276 (7.3%) |
| 35 to 39 Years | 134 (3.3%) | 182 (4.8%) |
| 40 to 44 Years | 262 (6.4%) | 285 (7.5%) |
| 45 to 49 Years | 301 (7.3%) | 425 (11.3%) |
| 50 to 54 Years | 328 (8.0%) | 259 (6.9%) |
| 55 to 59 Years | 308 (7.5%) | 352 (9.3%) |
| 60 to 64 Years | 252 (6.2%) | 272 (7.2%) |
| 65 to 69 Years | 264 (6.5%) | 217 (5.7%) |
| 70 to 74 Years | 131 (3.2%) | 167 (4.4%) |
| 75 to 79 Years | 63 (1.5%) | 43 (1.1%) |
| 80 to 84 Years | 140 (3.4%) | 58 (1.5%) |
| 85 Years and over | 14 (0.3%) | 49 (1.3%) |
| Total | 4,094 (100.0%) | 3,779 (100.0%) |
Families and Households in Sunnyvale
Median Family Size in Sunnyvale
The median family size in Sunnyvale is 3.08 persons per family, with married-couple families (1,996 | 81.0%) accounting for the largest median family size of 3.19 persons per family. On the other hand, single male/father families (63 | 2.6%) represent the smallest median family size with 2.16 persons per family.

| Family Type | # Families | Family Size |
| Married-Couple | 1,996 (81.0%) | 3.19 |
| Single Male/Father | 63 (2.6%) | 2.16 |
| Single Female/Mother | 404 (16.4%) | 2.67 |
| Total Families | 2,463 (100.0%) | 3.08 |
Median Household Size in Sunnyvale
The median household size in Sunnyvale is 3.00 persons per household, with married-couple households (1,996 | 76.1%) accounting for the largest median household size of 3.2 persons per household. non-family households (161 | 6.1%) represent the smallest median household size with 1.14 persons per household.
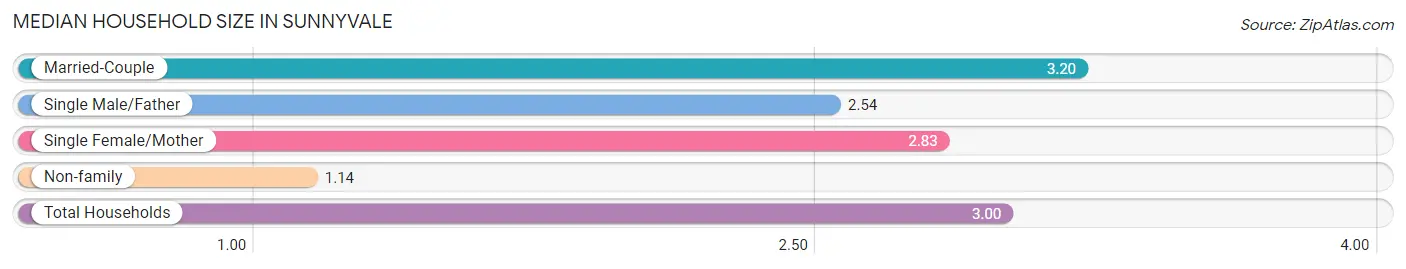
| Household Type | # Households | Household Size |
| Married-Couple | 1,996 (76.1%) | 3.20 |
| Single Male/Father | 63 (2.4%) | 2.54 |
| Single Female/Mother | 404 (15.4%) | 2.83 |
| Non-family | 161 (6.1%) | 1.14 |
| Total Households | 2,624 (100.0%) | 3.00 |
Household Size by Marriage Status in Sunnyvale
Out of a total of 2,624 households in Sunnyvale, 2,463 (93.9%) are family households, while 161 (6.1%) are nonfamily households. The most numerous type of family households are 2-person households, comprising 1,034, and the most common type of nonfamily households are 1-person households, comprising 142.
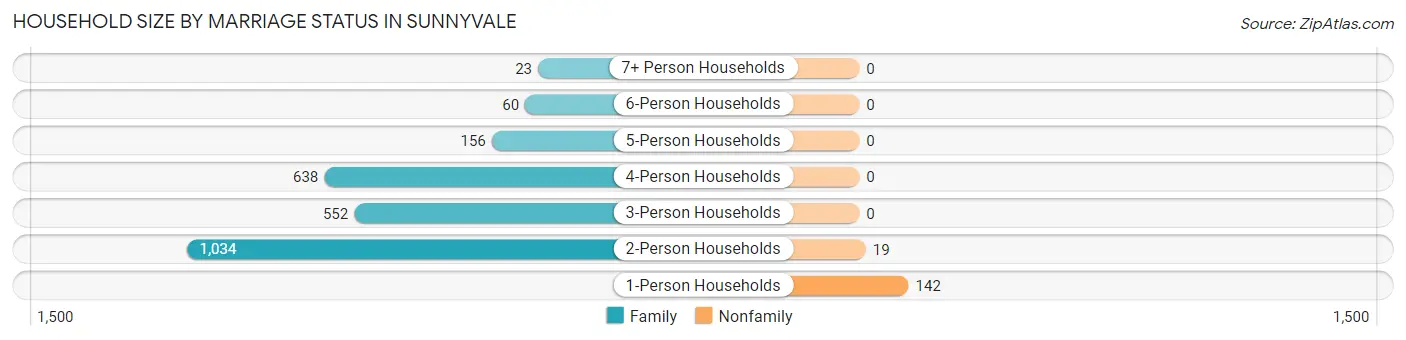
| Household Size | Family Households | Nonfamily Households |
| 1-Person Households | - | 142 (5.4%) |
| 2-Person Households | 1,034 (39.4%) | 19 (0.7%) |
| 3-Person Households | 552 (21.0%) | 0 (0.0%) |
| 4-Person Households | 638 (24.3%) | 0 (0.0%) |
| 5-Person Households | 156 (5.9%) | 0 (0.0%) |
| 6-Person Households | 60 (2.3%) | 0 (0.0%) |
| 7+ Person Households | 23 (0.9%) | 0 (0.0%) |
| Total | 2,463 (93.9%) | 161 (6.1%) |
Female Fertility in Sunnyvale
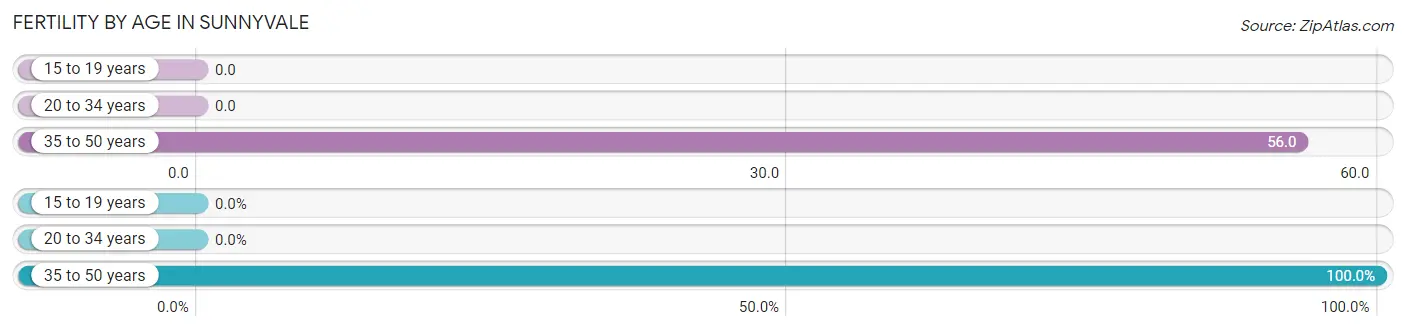
Fertility by Age in Sunnyvale
Average fertility rate in Sunnyvale is 34.0 births per 1,000 women. Women in the age bracket of 35 to 50 years have the highest fertility rate with 56.0 births per 1,000 women. Women in the age bracket of 35 to 50 years acount for 100.0% of all women with births.
| Age Bracket | Women with Births | Births / 1,000 Women |
| 15 to 19 years | 0 (0.0%) | 0.0 |
| 20 to 34 years | 0 (0.0%) | 0.0 |
| 35 to 50 years | 55 (100.0%) | 56.0 |
| Total | 55 (100.0%) | 34.0 |
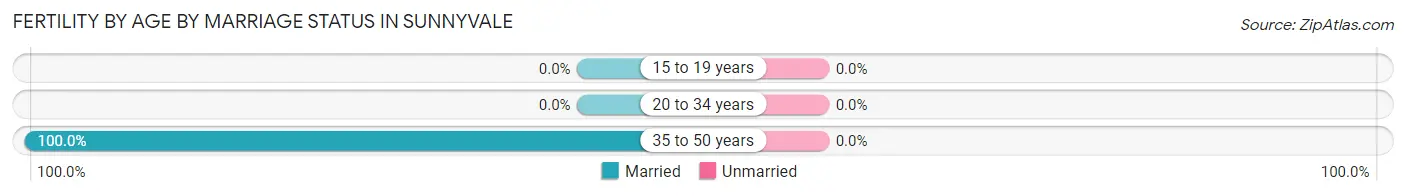
Fertility by Age by Marriage Status in Sunnyvale
| Age Bracket | Married | Unmarried |
| 15 to 19 years | 0 (0.0%) | 0 (0.0%) |
| 20 to 34 years | 0 (0.0%) | 0 (0.0%) |
| 35 to 50 years | 55 (100.0%) | 0 (0.0%) |
| Total | 55 (100.0%) | 0 (0.0%) |
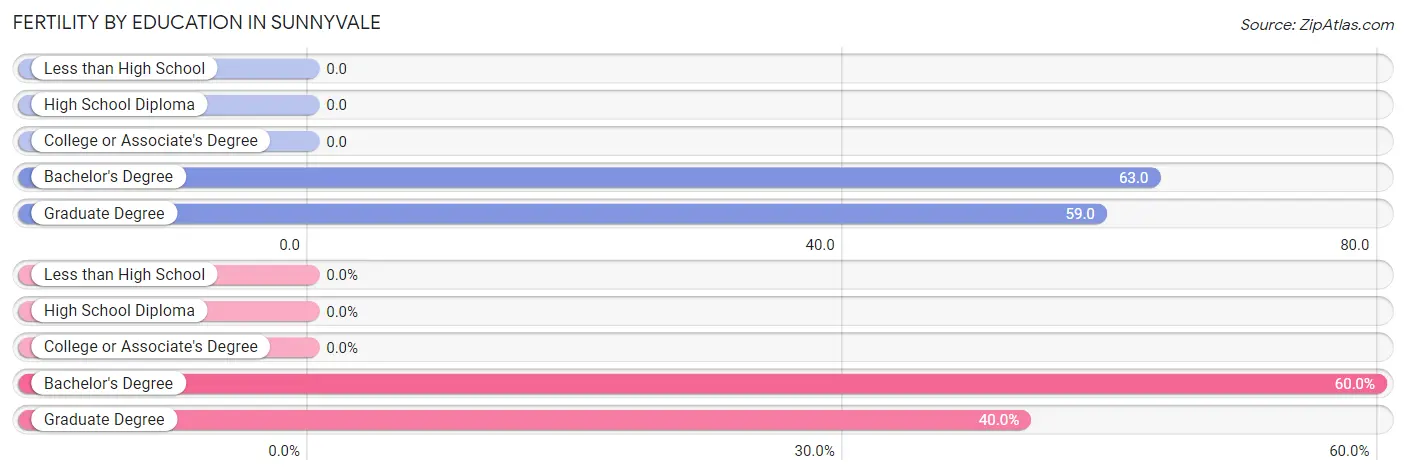
Fertility by Education in Sunnyvale
| Educational Attainment | Women with Births | Births / 1,000 Women |
| Less than High School | 0 (0.0%) | 0.0 |
| High School Diploma | 0 (0.0%) | 0.0 |
| College or Associate's Degree | 0 (0.0%) | 0.0 |
| Bachelor's Degree | 33 (60.0%) | 63.0 |
| Graduate Degree | 22 (40.0%) | 59.0 |
| Total | 55 (100.0%) | 34.0 |
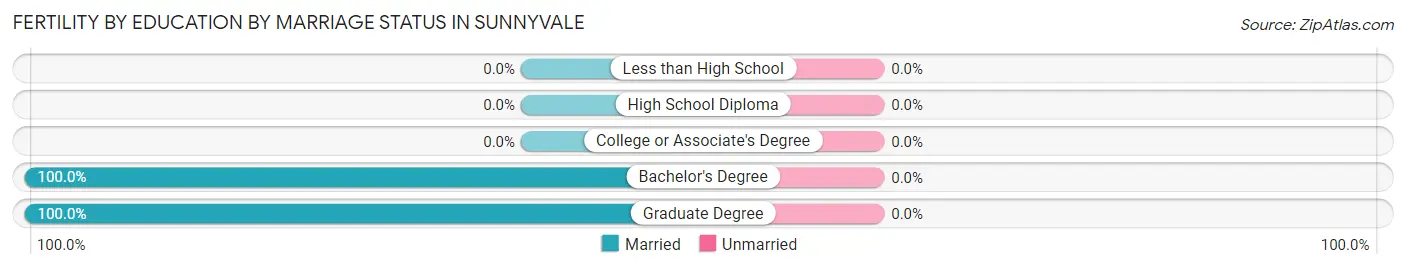
Fertility by Education by Marriage Status in Sunnyvale
| Educational Attainment | Married | Unmarried |
| Less than High School | 0 (0.0%) | 0 (0.0%) |
| High School Diploma | 0 (0.0%) | 0 (0.0%) |
| College or Associate's Degree | 0 (0.0%) | 0 (0.0%) |
| Bachelor's Degree | 33 (100.0%) | 0 (0.0%) |
| Graduate Degree | 22 (100.0%) | 0 (0.0%) |
| Total | 55 (100.0%) | 0 (0.0%) |
Employment Characteristics in Sunnyvale
Employment by Class of Employer in Sunnyvale
Among the 3,992 employed individuals in Sunnyvale, private company employees (2,516 | 63.0%), local government employees (320 | 8.0%), and not-for-profit organizations (304 | 7.6%) make up the most common classes of employment.
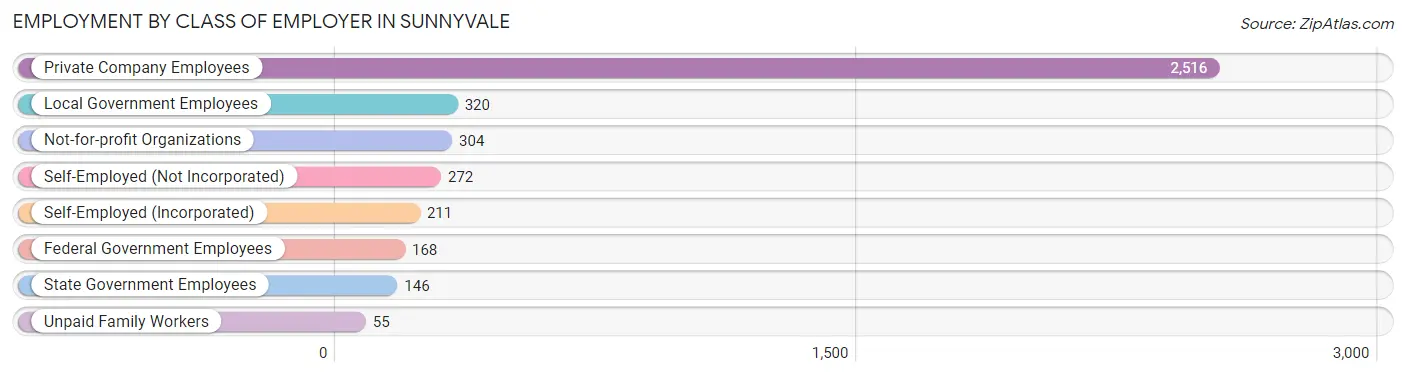
| Employer Class | # Employees | % Employees |
| Private Company Employees | 2,516 | 63.0% |
| Self-Employed (Incorporated) | 211 | 5.3% |
| Self-Employed (Not Incorporated) | 272 | 6.8% |
| Not-for-profit Organizations | 304 | 7.6% |
| Local Government Employees | 320 | 8.0% |
| State Government Employees | 146 | 3.7% |
| Federal Government Employees | 168 | 4.2% |
| Unpaid Family Workers | 55 | 1.4% |
| Total | 3,992 | 100.0% |
Employment Status by Age in Sunnyvale
According to the labor force statistics for Sunnyvale, out of the total population over 16 years of age (6,008), 71.6% or 4,302 individuals are in the labor force, with 5.9% or 254 of them unemployed. The age group with the highest labor force participation rate is 25 to 29 years, with 100.0% or 165 individuals in the labor force. Within the labor force, the 20 to 24 years age range has the highest percentage of unemployed individuals, with 45.7% or 206 of them being unemployed.
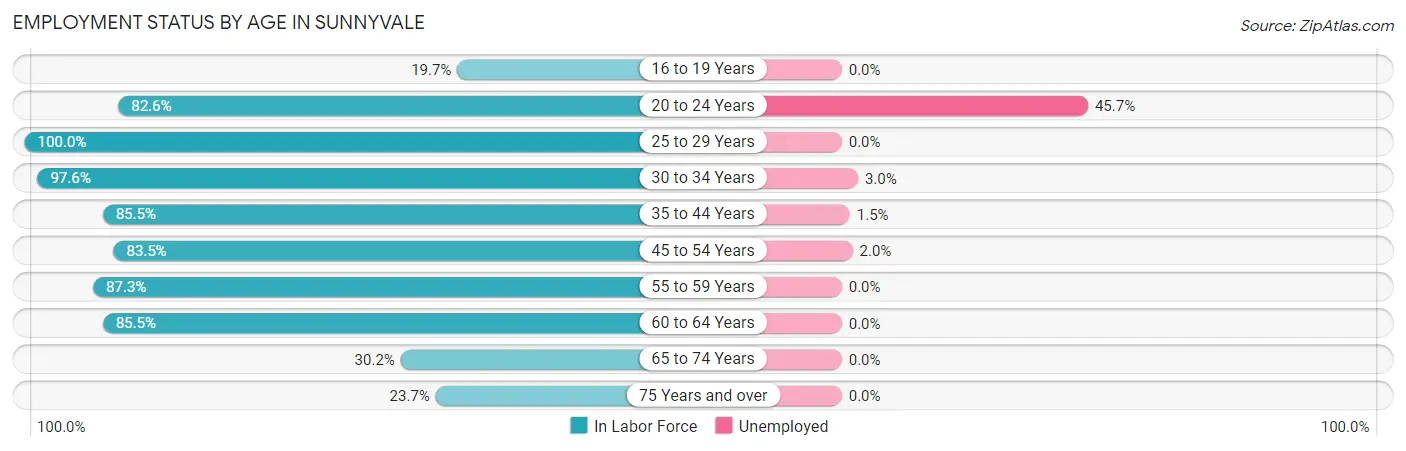
| Age Bracket | In Labor Force | Unemployed |
| 16 to 19 Years | 67 (19.7%) | 0 (0.0%) |
| 20 to 24 Years | 451 (82.6%) | 206 (45.7%) |
| 25 to 29 Years | 165 (100.0%) | 0 (0.0%) |
| 30 to 34 Years | 440 (97.6%) | 13 (3.0%) |
| 35 to 44 Years | 738 (85.5%) | 11 (1.5%) |
| 45 to 54 Years | 1,096 (83.5%) | 22 (2.0%) |
| 55 to 59 Years | 576 (87.3%) | 0 (0.0%) |
| 60 to 64 Years | 448 (85.5%) | 0 (0.0%) |
| 65 to 74 Years | 235 (30.2%) | 0 (0.0%) |
| 75 Years and over | 87 (23.7%) | 0 (0.0%) |
| Total | 4,302 (71.6%) | 254 (5.9%) |
Employment Status by Educational Attainment in Sunnyvale
According to labor force statistics for Sunnyvale, 87.1% of individuals (3,463) out of the total population between 25 and 64 years of age (3,976) are in the labor force, with 1.3% or 45 of them being unemployed. The group with the highest labor force participation rate are those with the educational attainment of bachelor's degree or higher, with 90.8% or 2,200 individuals in the labor force. Within the labor force, individuals with less than high school education have the highest percentage of unemployment, with 21.7% or 15 of them being unemployed.
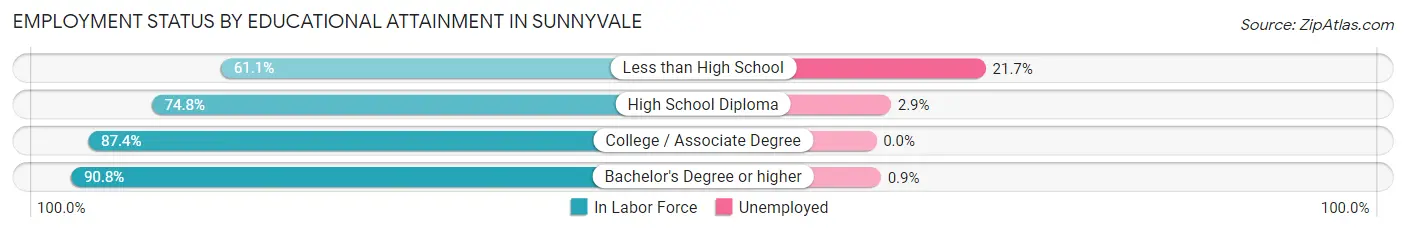
| Educational Attainment | In Labor Force | Unemployed |
| Less than High School | 69 (61.1%) | 25 (21.7%) |
| High School Diploma | 376 (74.8%) | 15 (2.9%) |
| College / Associate Degree | 819 (87.4%) | 0 (0.0%) |
| Bachelor's Degree or higher | 2,200 (90.8%) | 22 (0.9%) |
| Total | 3,463 (87.1%) | 52 (1.3%) |
Employment Occupations by Sex in Sunnyvale
Management, Business, Science and Arts Occupations
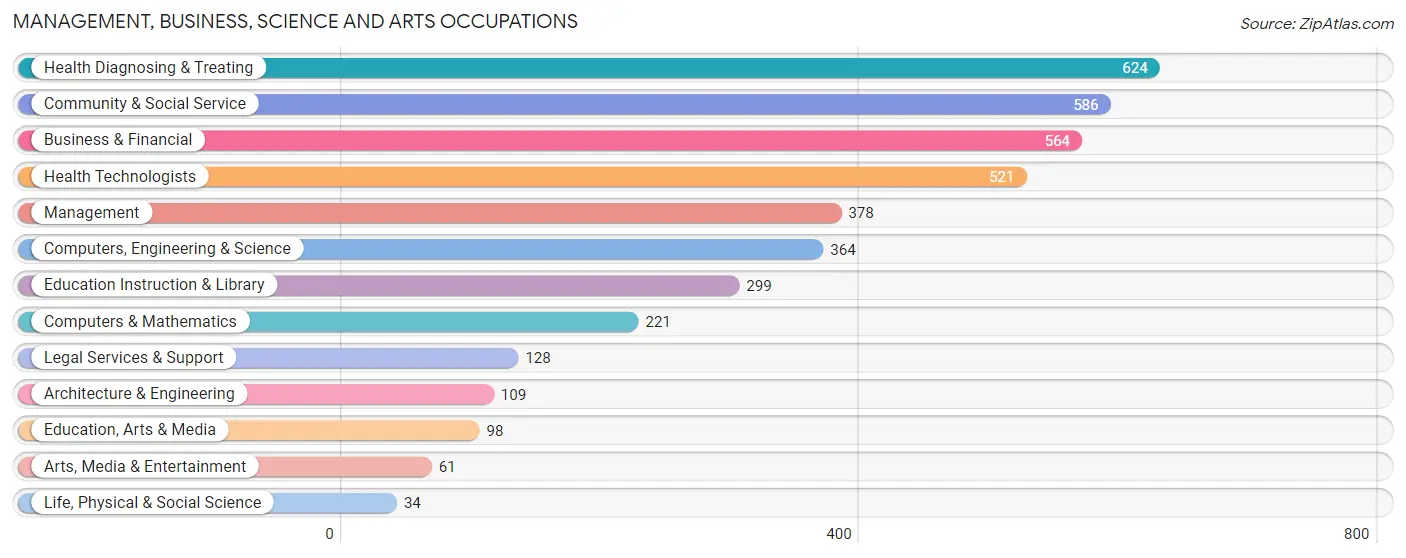
The most common Management, Business, Science and Arts occupations in Sunnyvale are Health Diagnosing & Treating (624 | 15.4%), Community & Social Service (586 | 14.5%), Business & Financial (564 | 13.9%), Health Technologists (521 | 12.9%), and Management (378 | 9.3%).
Management, Business, Science and Arts Occupations by Sex
Within the Management, Business, Science and Arts occupations in Sunnyvale, the most male-oriented occupations are Life, Physical & Social Science (100.0%), Architecture & Engineering (90.8%), and Arts, Media & Entertainment (85.3%), while the most female-oriented occupations are Education Instruction & Library (72.6%), Health Diagnosing & Treating (67.6%), and Health Technologists (63.5%).
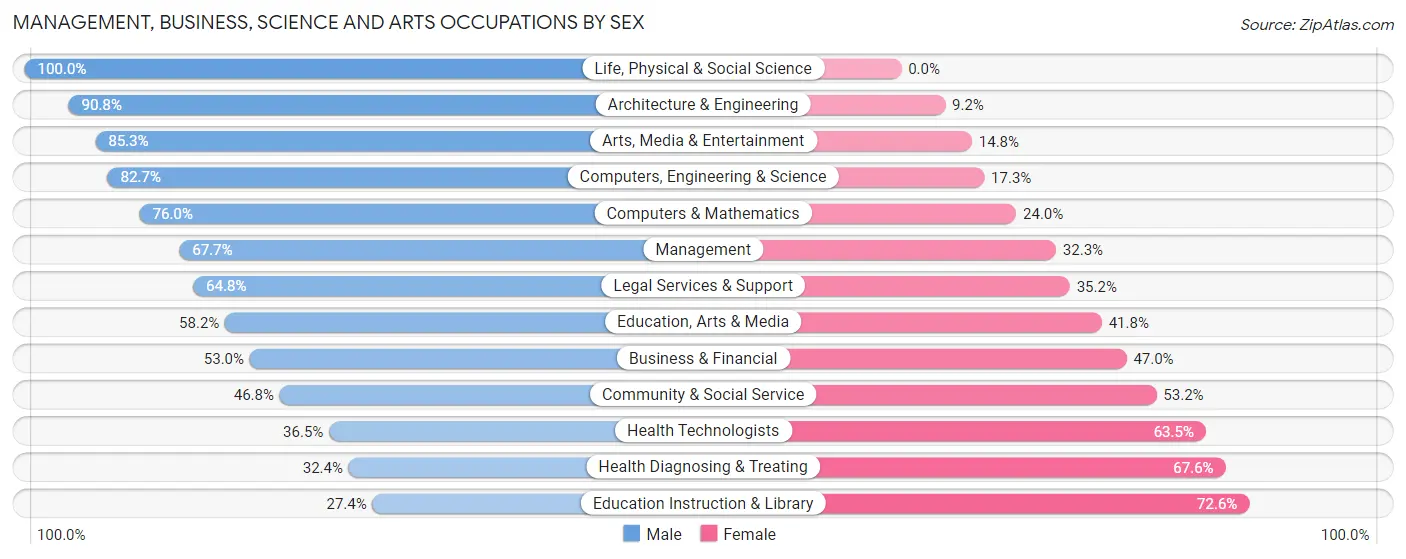
| Occupation | Male | Female |
| Management | 256 (67.7%) | 122 (32.3%) |
| Business & Financial | 299 (53.0%) | 265 (47.0%) |
| Computers, Engineering & Science | 301 (82.7%) | 63 (17.3%) |
| Computers & Mathematics | 168 (76.0%) | 53 (24.0%) |
| Architecture & Engineering | 99 (90.8%) | 10 (9.2%) |
| Life, Physical & Social Science | 34 (100.0%) | 0 (0.0%) |
| Community & Social Service | 274 (46.8%) | 312 (53.2%) |
| Education, Arts & Media | 57 (58.2%) | 41 (41.8%) |
| Legal Services & Support | 83 (64.8%) | 45 (35.2%) |
| Education Instruction & Library | 82 (27.4%) | 217 (72.6%) |
| Arts, Media & Entertainment | 52 (85.3%) | 9 (14.7%) |
| Health Diagnosing & Treating | 202 (32.4%) | 422 (67.6%) |
| Health Technologists | 190 (36.5%) | 331 (63.5%) |
| Total (Category) | 1,332 (52.9%) | 1,184 (47.1%) |
| Total (Overall) | 1,970 (48.6%) | 2,081 (51.4%) |
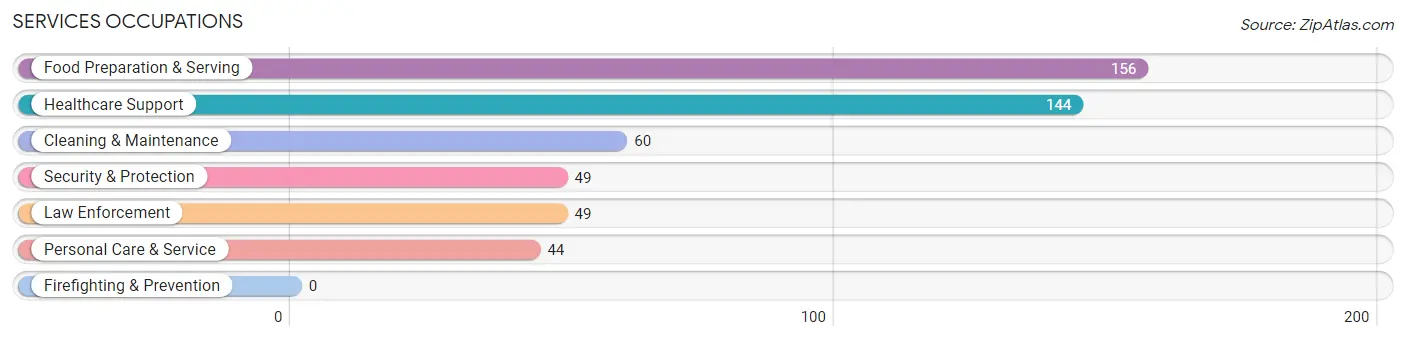
Services Occupations
The most common Services occupations in Sunnyvale are Food Preparation & Serving (156 | 3.8%), Healthcare Support (144 | 3.5%), Cleaning & Maintenance (60 | 1.5%), Security & Protection (49 | 1.2%), and Law Enforcement (49 | 1.2%).
Services Occupations by Sex
Within the Services occupations in Sunnyvale, the most male-oriented occupations are Cleaning & Maintenance (78.3%), Food Preparation & Serving (75.6%), and Security & Protection (44.9%), while the most female-oriented occupations are Personal Care & Service (100.0%), Healthcare Support (89.6%), and Security & Protection (55.1%).
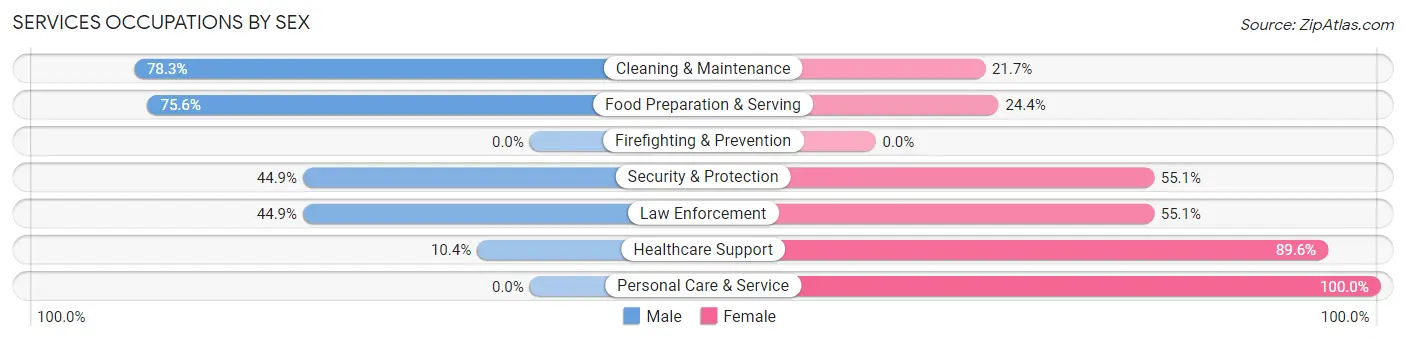
| Occupation | Male | Female |
| Healthcare Support | 15 (10.4%) | 129 (89.6%) |
| Security & Protection | 22 (44.9%) | 27 (55.1%) |
| Firefighting & Prevention | 0 (0.0%) | 0 (0.0%) |
| Law Enforcement | 22 (44.9%) | 27 (55.1%) |
| Food Preparation & Serving | 118 (75.6%) | 38 (24.4%) |
| Cleaning & Maintenance | 47 (78.3%) | 13 (21.7%) |
| Personal Care & Service | 0 (0.0%) | 44 (100.0%) |
| Total (Category) | 202 (44.6%) | 251 (55.4%) |
| Total (Overall) | 1,970 (48.6%) | 2,081 (51.4%) |
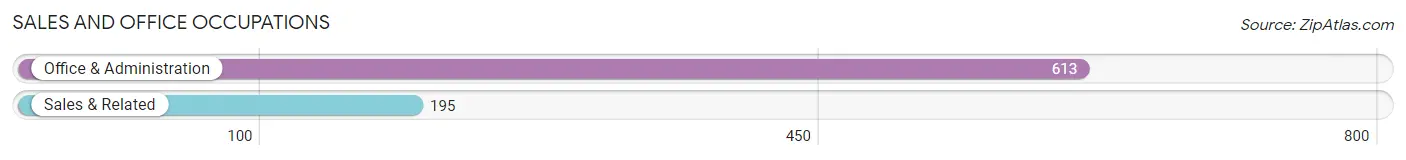
Sales and Office Occupations
The most common Sales and Office occupations in Sunnyvale are Office & Administration (613 | 15.1%), and Sales & Related (195 | 4.8%).
Sales and Office Occupations by Sex
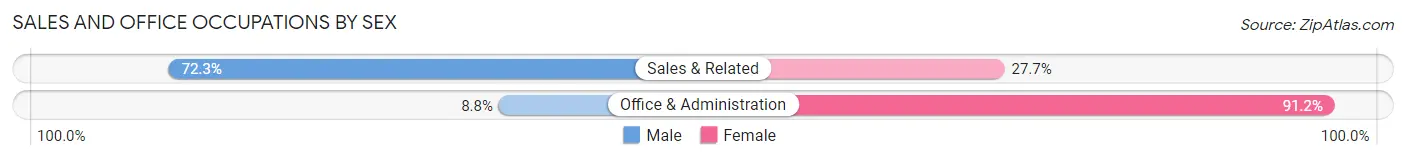
| Occupation | Male | Female |
| Sales & Related | 141 (72.3%) | 54 (27.7%) |
| Office & Administration | 54 (8.8%) | 559 (91.2%) |
| Total (Category) | 195 (24.1%) | 613 (75.9%) |
| Total (Overall) | 1,970 (48.6%) | 2,081 (51.4%) |
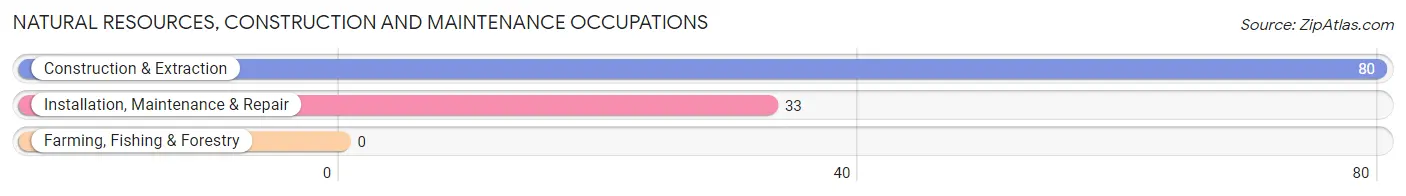
Natural Resources, Construction and Maintenance Occupations
The most common Natural Resources, Construction and Maintenance occupations in Sunnyvale are Construction & Extraction (80 | 2.0%), and Installation, Maintenance & Repair (33 | 0.8%).
Natural Resources, Construction and Maintenance Occupations by Sex
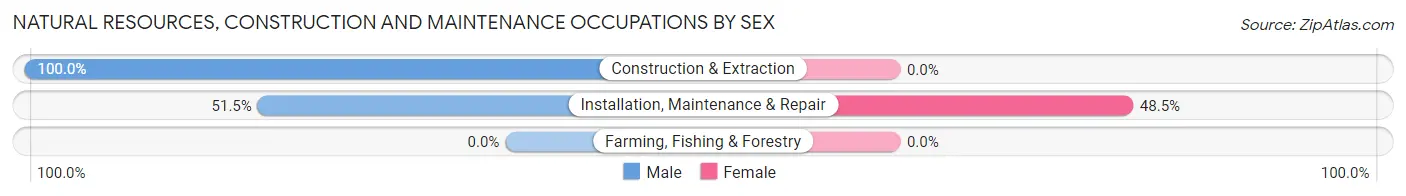
| Occupation | Male | Female |
| Farming, Fishing & Forestry | 0 (0.0%) | 0 (0.0%) |
| Construction & Extraction | 80 (100.0%) | 0 (0.0%) |
| Installation, Maintenance & Repair | 17 (51.5%) | 16 (48.5%) |
| Total (Category) | 97 (85.8%) | 16 (14.2%) |
| Total (Overall) | 1,970 (48.6%) | 2,081 (51.4%) |
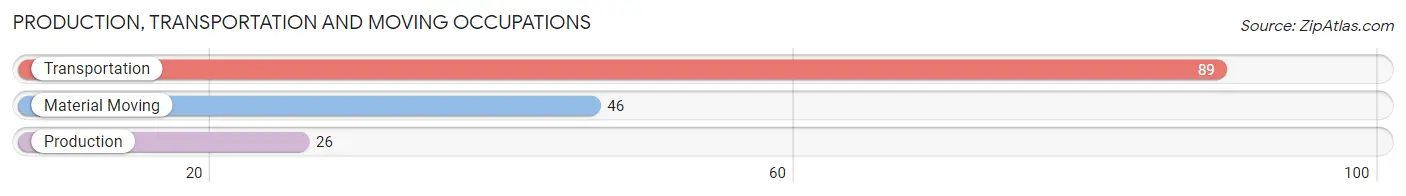
Production, Transportation and Moving Occupations
The most common Production, Transportation and Moving occupations in Sunnyvale are Transportation (89 | 2.2%), Material Moving (46 | 1.1%), and Production (26 | 0.6%).
Production, Transportation and Moving Occupations by Sex
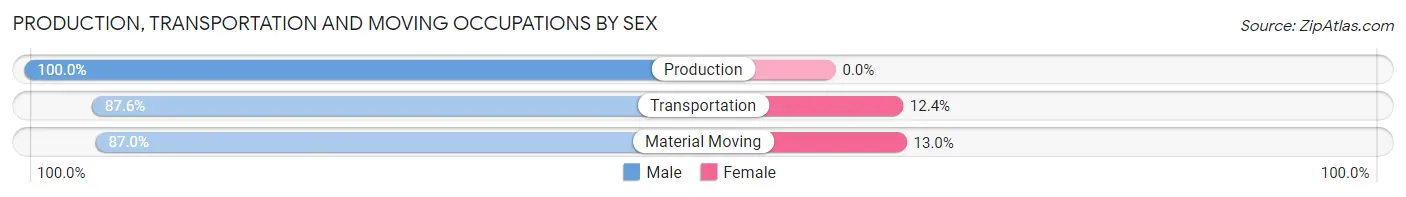
| Occupation | Male | Female |
| Production | 26 (100.0%) | 0 (0.0%) |
| Transportation | 78 (87.6%) | 11 (12.4%) |
| Material Moving | 40 (87.0%) | 6 (13.0%) |
| Total (Category) | 144 (89.4%) | 17 (10.6%) |
| Total (Overall) | 1,970 (48.6%) | 2,081 (51.4%) |
Employment Industries by Sex in Sunnyvale
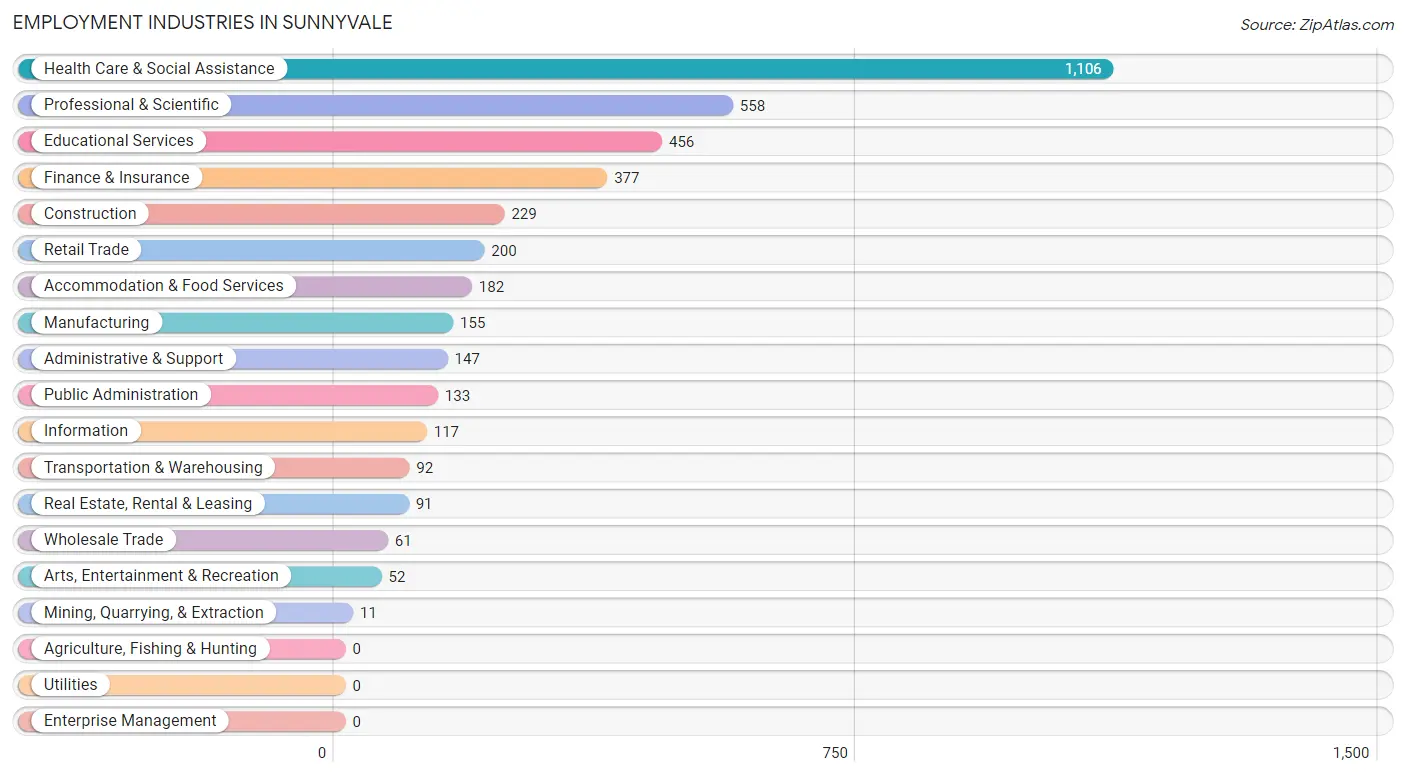
Employment Industries in Sunnyvale
The major employment industries in Sunnyvale include Health Care & Social Assistance (1,106 | 27.3%), Professional & Scientific (558 | 13.8%), Educational Services (456 | 11.3%), Finance & Insurance (377 | 9.3%), and Construction (229 | 5.7%).
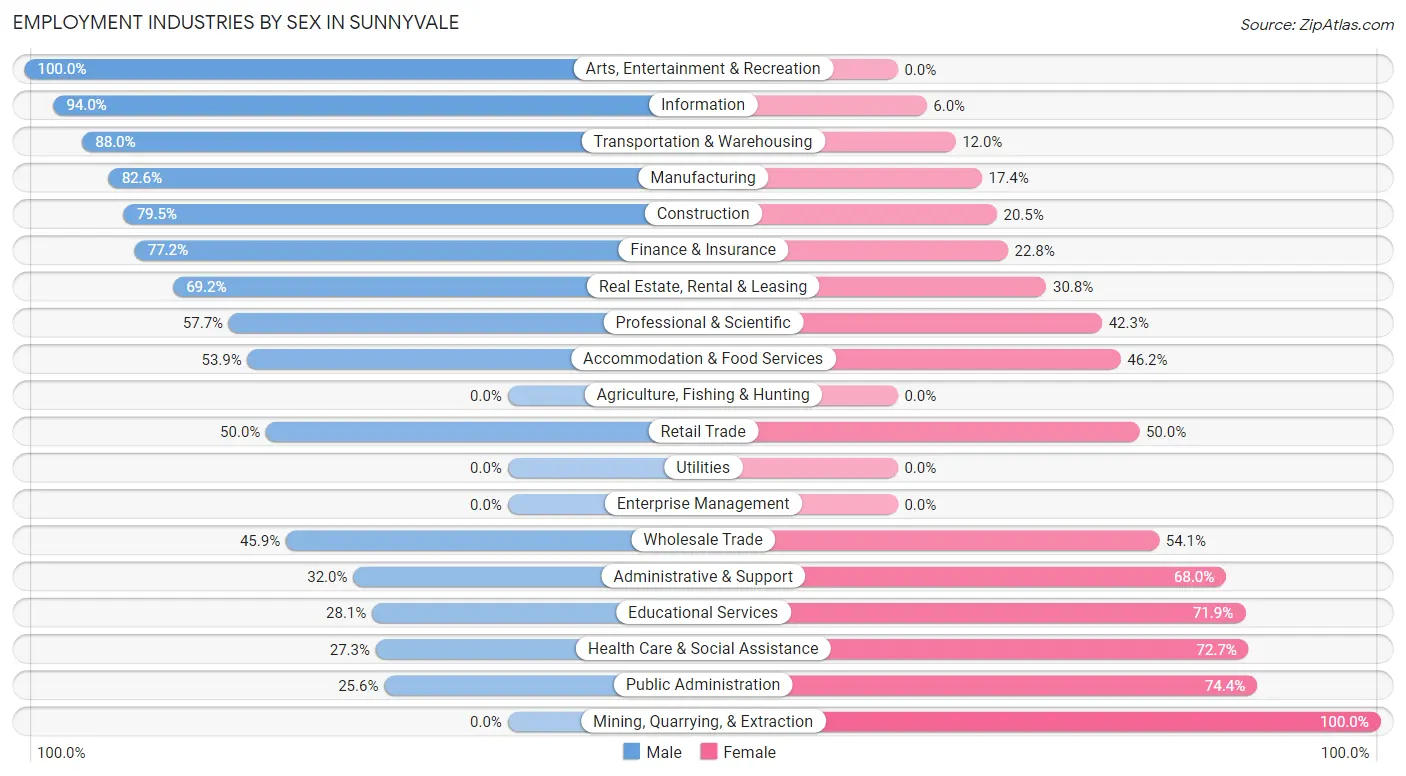
Employment Industries by Sex in Sunnyvale
The Sunnyvale industries that see more men than women are Arts, Entertainment & Recreation (100.0%), Information (94.0%), and Transportation & Warehousing (88.0%), whereas the industries that tend to have a higher number of women are Mining, Quarrying, & Extraction (100.0%), Public Administration (74.4%), and Health Care & Social Assistance (72.7%).
| Industry | Male | Female |
| Agriculture, Fishing & Hunting | 0 (0.0%) | 0 (0.0%) |
| Mining, Quarrying, & Extraction | 0 (0.0%) | 11 (100.0%) |
| Construction | 182 (79.5%) | 47 (20.5%) |
| Manufacturing | 128 (82.6%) | 27 (17.4%) |
| Wholesale Trade | 28 (45.9%) | 33 (54.1%) |
| Retail Trade | 100 (50.0%) | 100 (50.0%) |
| Transportation & Warehousing | 81 (88.0%) | 11 (12.0%) |
| Utilities | 0 (0.0%) | 0 (0.0%) |
| Information | 110 (94.0%) | 7 (6.0%) |
| Finance & Insurance | 291 (77.2%) | 86 (22.8%) |
| Real Estate, Rental & Leasing | 63 (69.2%) | 28 (30.8%) |
| Professional & Scientific | 322 (57.7%) | 236 (42.3%) |
| Enterprise Management | 0 (0.0%) | 0 (0.0%) |
| Administrative & Support | 47 (32.0%) | 100 (68.0%) |
| Educational Services | 128 (28.1%) | 328 (71.9%) |
| Health Care & Social Assistance | 302 (27.3%) | 804 (72.7%) |
| Arts, Entertainment & Recreation | 52 (100.0%) | 0 (0.0%) |
| Accommodation & Food Services | 98 (53.8%) | 84 (46.2%) |
| Public Administration | 34 (25.6%) | 99 (74.4%) |
| Total | 1,970 (48.6%) | 2,081 (51.4%) |
Education in Sunnyvale
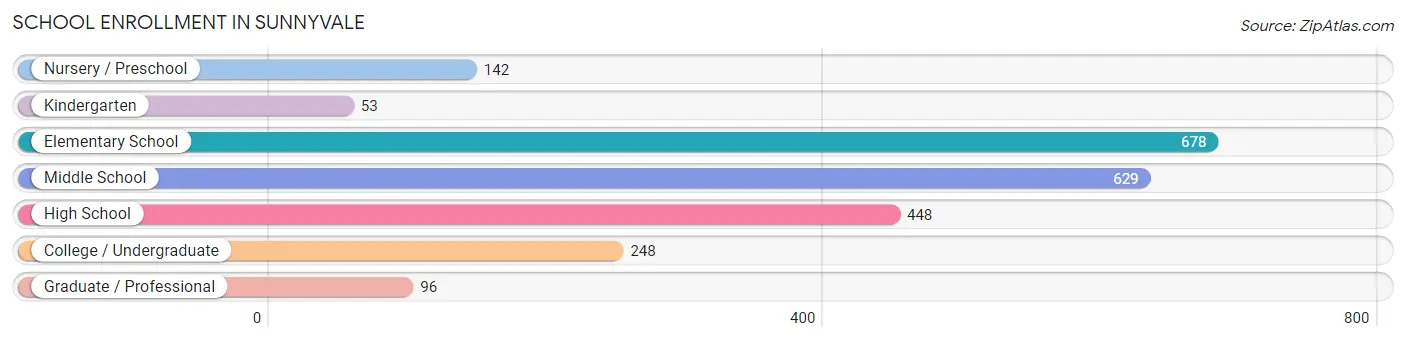
School Enrollment in Sunnyvale
The most common levels of schooling among the 2,294 students in Sunnyvale are elementary school (678 | 29.6%), middle school (629 | 27.4%), and high school (448 | 19.5%).
| School Level | # Students | % Students |
| Nursery / Preschool | 142 | 6.2% |
| Kindergarten | 53 | 2.3% |
| Elementary School | 678 | 29.6% |
| Middle School | 629 | 27.4% |
| High School | 448 | 19.5% |
| College / Undergraduate | 248 | 10.8% |
| Graduate / Professional | 96 | 4.2% |
| Total | 2,294 | 100.0% |
School Enrollment by Age by Funding Source in Sunnyvale
Out of a total of 2,294 students who are enrolled in schools in Sunnyvale, 374 (16.3%) attend a private institution, while the remaining 1,920 (83.7%) are enrolled in public schools. The age group of 25 to 34 year olds has the highest likelihood of being enrolled in private schools, with 15 (100.0% in the age bracket) enrolled. Conversely, the age group of 15 to 17 year olds has the lowest likelihood of being enrolled in a private school, with 298 (100.0% in the age bracket) attending a public institution.
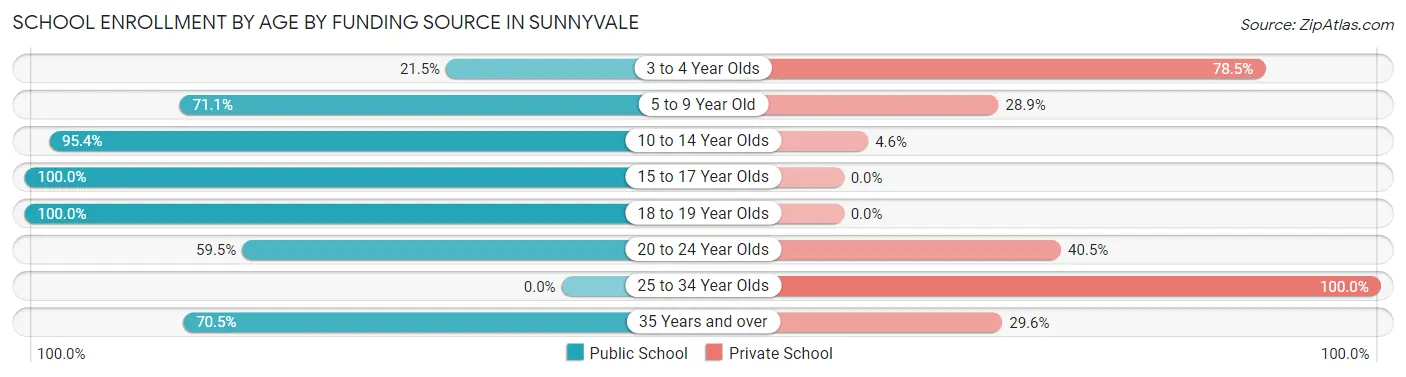
| Age Bracket | Public School | Private School |
| 3 to 4 Year Olds | 17 (21.5%) | 62 (78.5%) |
| 5 to 9 Year Old | 355 (71.1%) | 144 (28.9%) |
| 10 to 14 Year Olds | 1,003 (95.4%) | 48 (4.6%) |
| 15 to 17 Year Olds | 298 (100.0%) | 0 (0.0%) |
| 18 to 19 Year Olds | 69 (100.0%) | 0 (0.0%) |
| 20 to 24 Year Olds | 116 (59.5%) | 79 (40.5%) |
| 25 to 34 Year Olds | 0 (0.0%) | 15 (100.0%) |
| 35 Years and over | 62 (70.5%) | 26 (29.5%) |
| Total | 1,920 (83.7%) | 374 (16.3%) |
Educational Attainment by Field of Study in Sunnyvale
Business (1,035 | 31.7%), science & technology (420 | 12.9%), education (397 | 12.1%), social sciences (291 | 8.9%), and psychology (190 | 5.8%) are the most common fields of study among 3,267 individuals in Sunnyvale who have obtained a bachelor's degree or higher.
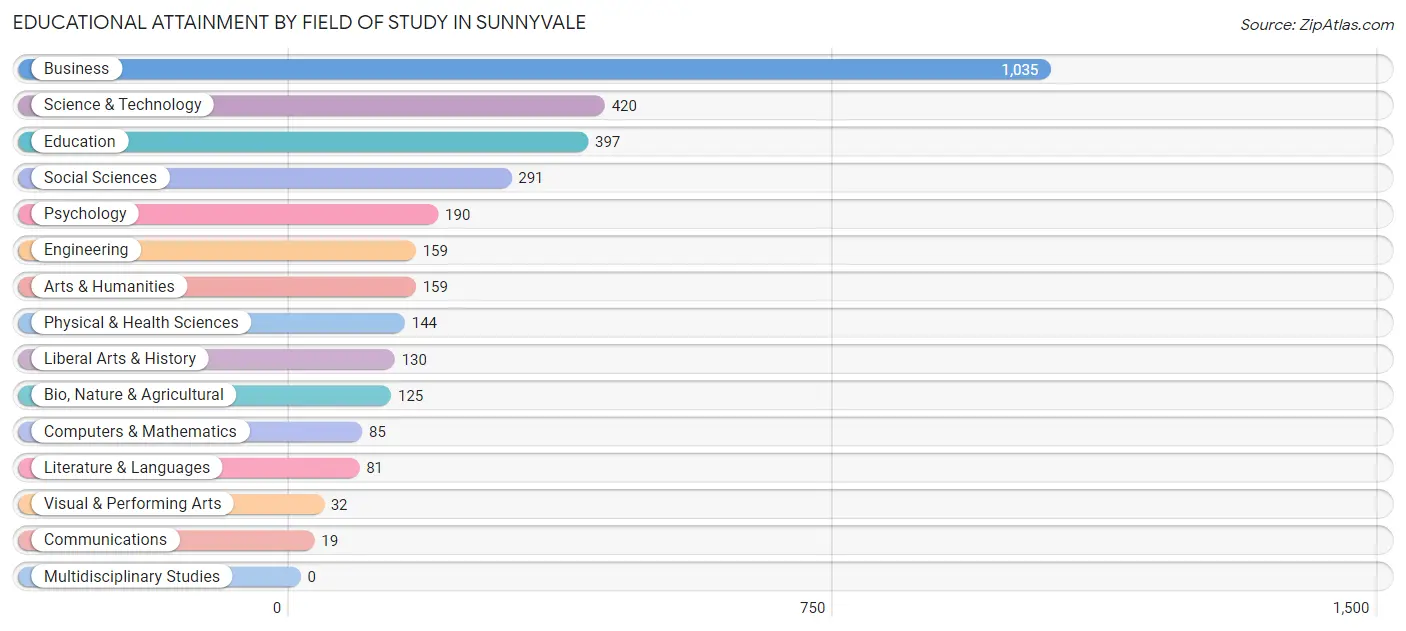
| Field of Study | # Graduates | % Graduates |
| Computers & Mathematics | 85 | 2.6% |
| Bio, Nature & Agricultural | 125 | 3.8% |
| Physical & Health Sciences | 144 | 4.4% |
| Psychology | 190 | 5.8% |
| Social Sciences | 291 | 8.9% |
| Engineering | 159 | 4.9% |
| Multidisciplinary Studies | 0 | 0.0% |
| Science & Technology | 420 | 12.9% |
| Business | 1,035 | 31.7% |
| Education | 397 | 12.1% |
| Literature & Languages | 81 | 2.5% |
| Liberal Arts & History | 130 | 4.0% |
| Visual & Performing Arts | 32 | 1.0% |
| Communications | 19 | 0.6% |
| Arts & Humanities | 159 | 4.9% |
| Total | 3,267 | 100.0% |
Transportation & Commute in Sunnyvale
Vehicle Availability by Sex in Sunnyvale
The most prevalent vehicle ownership categories in Sunnyvale are males with 2 vehicles (811, accounting for 42.1%) and females with 2 vehicles (699, making up 39.3%).
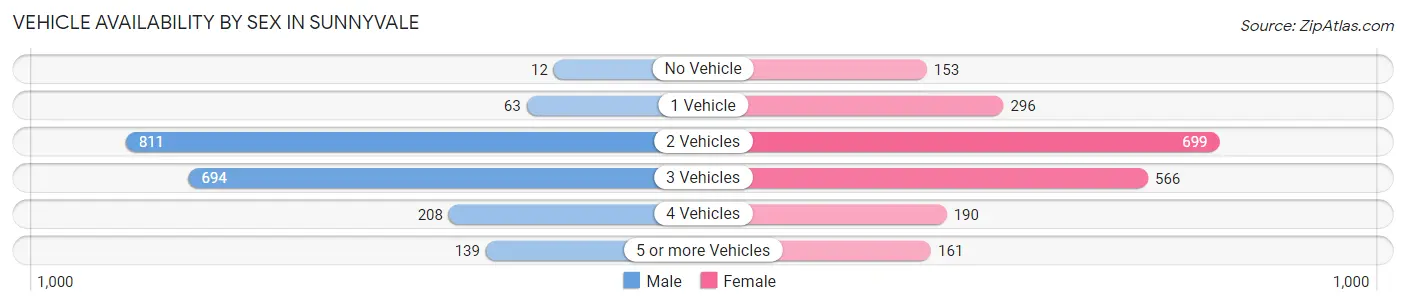
| Vehicles Available | Male | Female |
| No Vehicle | 12 (0.6%) | 153 (7.4%) |
| 1 Vehicle | 63 (3.3%) | 296 (14.3%) |
| 2 Vehicles | 811 (42.1%) | 699 (33.9%) |
| 3 Vehicles | 694 (36.0%) | 566 (27.4%) |
| 4 Vehicles | 208 (10.8%) | 190 (9.2%) |
| 5 or more Vehicles | 139 (7.2%) | 161 (7.8%) |
| Total | 1,927 (100.0%) | 2,065 (100.0%) |
Commute Time in Sunnyvale
The most frequently occuring commute durations in Sunnyvale are 30 to 34 minutes (746 commuters, 21.1%), 20 to 24 minutes (503 commuters, 14.2%), and 45 to 59 minutes (499 commuters, 14.1%).
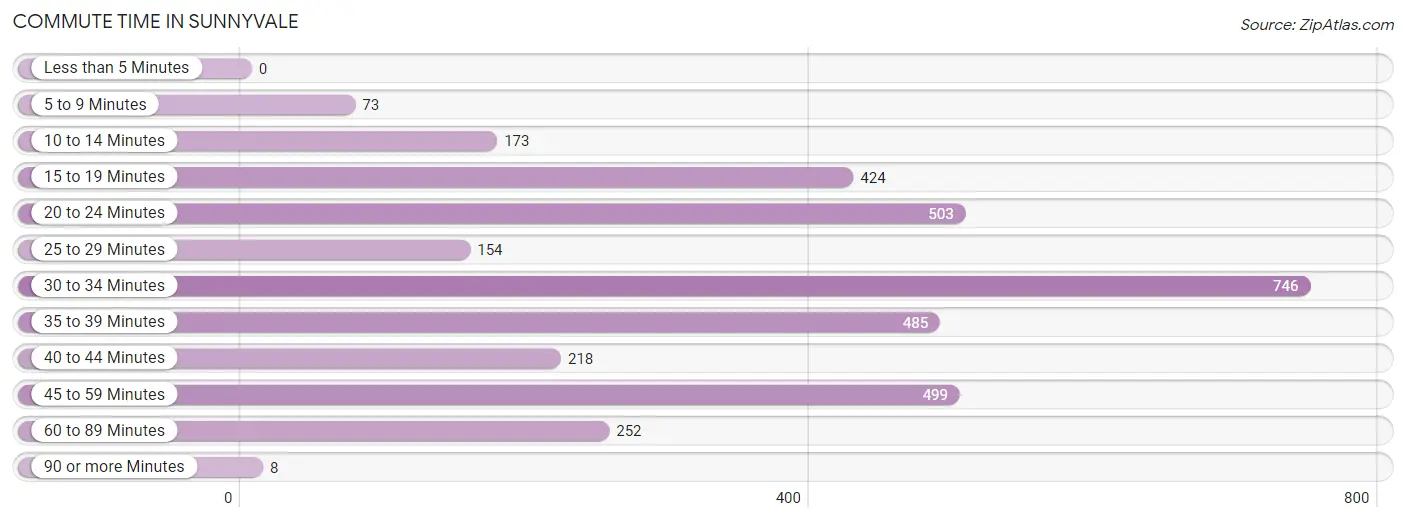
| Commute Time | # Commuters | % Commuters |
| Less than 5 Minutes | 0 | 0.0% |
| 5 to 9 Minutes | 73 | 2.1% |
| 10 to 14 Minutes | 173 | 4.9% |
| 15 to 19 Minutes | 424 | 12.0% |
| 20 to 24 Minutes | 503 | 14.2% |
| 25 to 29 Minutes | 154 | 4.4% |
| 30 to 34 Minutes | 746 | 21.1% |
| 35 to 39 Minutes | 485 | 13.7% |
| 40 to 44 Minutes | 218 | 6.2% |
| 45 to 59 Minutes | 499 | 14.1% |
| 60 to 89 Minutes | 252 | 7.1% |
| 90 or more Minutes | 8 | 0.2% |
Commute Time by Sex in Sunnyvale
The most common commute times in Sunnyvale are 30 to 34 minutes (344 commuters, 19.8%) for males and 30 to 34 minutes (402 commuters, 22.3%) for females.
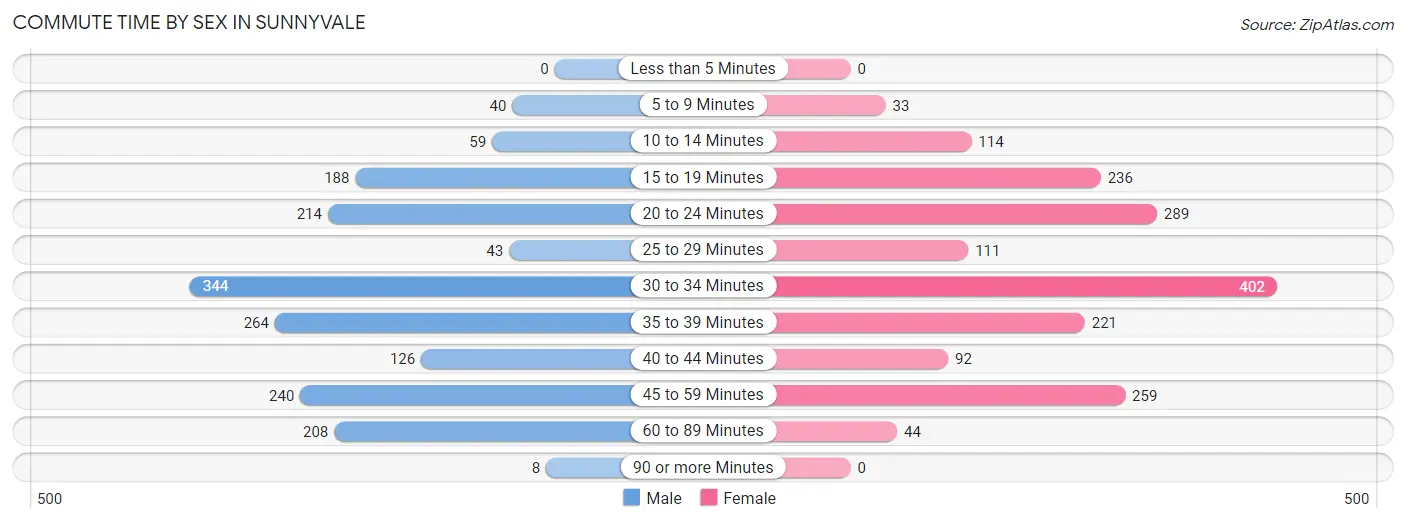
| Commute Time | Male | Female |
| Less than 5 Minutes | 0 (0.0%) | 0 (0.0%) |
| 5 to 9 Minutes | 40 (2.3%) | 33 (1.8%) |
| 10 to 14 Minutes | 59 (3.4%) | 114 (6.3%) |
| 15 to 19 Minutes | 188 (10.8%) | 236 (13.1%) |
| 20 to 24 Minutes | 214 (12.3%) | 289 (16.1%) |
| 25 to 29 Minutes | 43 (2.5%) | 111 (6.2%) |
| 30 to 34 Minutes | 344 (19.8%) | 402 (22.3%) |
| 35 to 39 Minutes | 264 (15.2%) | 221 (12.3%) |
| 40 to 44 Minutes | 126 (7.3%) | 92 (5.1%) |
| 45 to 59 Minutes | 240 (13.8%) | 259 (14.4%) |
| 60 to 89 Minutes | 208 (12.0%) | 44 (2.4%) |
| 90 or more Minutes | 8 (0.5%) | 0 (0.0%) |
Time of Departure to Work by Sex in Sunnyvale
The most frequent times of departure to work in Sunnyvale are 6:30 AM to 6:59 AM (304, 17.5%) for males and 7:00 AM to 7:29 AM (506, 28.1%) for females.
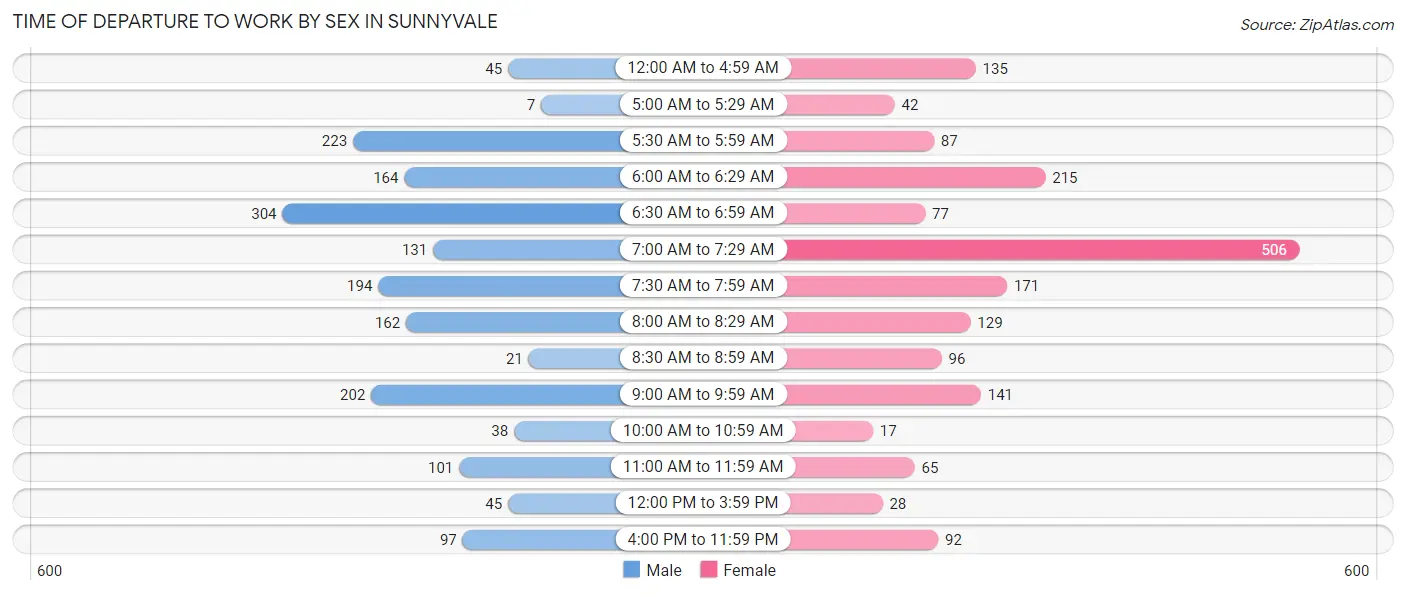
| Time of Departure | Male | Female |
| 12:00 AM to 4:59 AM | 45 (2.6%) | 135 (7.5%) |
| 5:00 AM to 5:29 AM | 7 (0.4%) | 42 (2.3%) |
| 5:30 AM to 5:59 AM | 223 (12.9%) | 87 (4.8%) |
| 6:00 AM to 6:29 AM | 164 (9.5%) | 215 (11.9%) |
| 6:30 AM to 6:59 AM | 304 (17.5%) | 77 (4.3%) |
| 7:00 AM to 7:29 AM | 131 (7.5%) | 506 (28.1%) |
| 7:30 AM to 7:59 AM | 194 (11.2%) | 171 (9.5%) |
| 8:00 AM to 8:29 AM | 162 (9.3%) | 129 (7.2%) |
| 8:30 AM to 8:59 AM | 21 (1.2%) | 96 (5.3%) |
| 9:00 AM to 9:59 AM | 202 (11.7%) | 141 (7.8%) |
| 10:00 AM to 10:59 AM | 38 (2.2%) | 17 (0.9%) |
| 11:00 AM to 11:59 AM | 101 (5.8%) | 65 (3.6%) |
| 12:00 PM to 3:59 PM | 45 (2.6%) | 28 (1.5%) |
| 4:00 PM to 11:59 PM | 97 (5.6%) | 92 (5.1%) |
| Total | 1,734 (100.0%) | 1,801 (100.0%) |
Housing Occupancy in Sunnyvale
Occupancy by Ownership in Sunnyvale
Of the total 2,624 dwellings in Sunnyvale, owner-occupied units account for 2,218 (84.5%), while renter-occupied units make up 406 (15.5%).
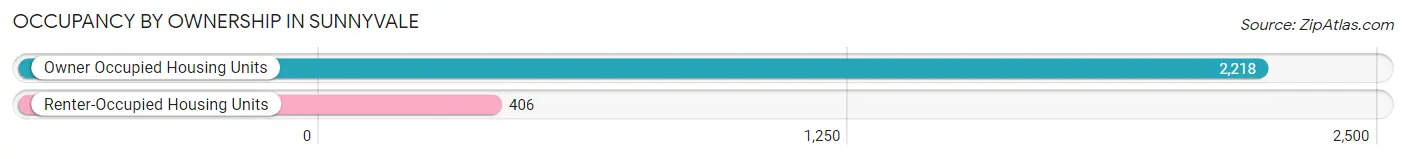
| Occupancy | # Housing Units | % Housing Units |
| Owner Occupied Housing Units | 2,218 | 84.5% |
| Renter-Occupied Housing Units | 406 | 15.5% |
| Total Occupied Housing Units | 2,624 | 100.0% |
Occupancy by Household Size in Sunnyvale
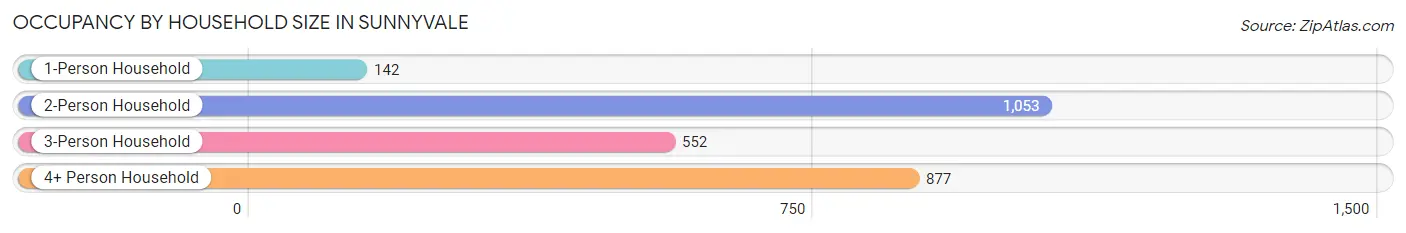
| Household Size | # Housing Units | % Housing Units |
| 1-Person Household | 142 | 5.4% |
| 2-Person Household | 1,053 | 40.1% |
| 3-Person Household | 552 | 21.0% |
| 4+ Person Household | 877 | 33.4% |
| Total Housing Units | 2,624 | 100.0% |
Occupancy by Ownership by Household Size in Sunnyvale
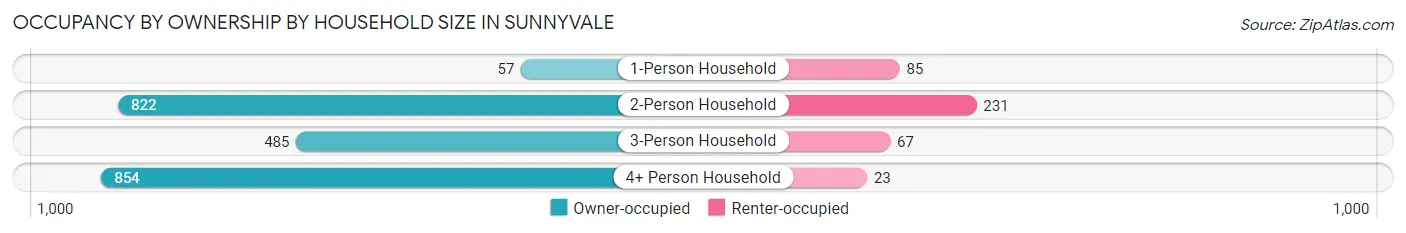
| Household Size | Owner-occupied | Renter-occupied |
| 1-Person Household | 57 (40.1%) | 85 (59.9%) |
| 2-Person Household | 822 (78.1%) | 231 (21.9%) |
| 3-Person Household | 485 (87.9%) | 67 (12.1%) |
| 4+ Person Household | 854 (97.4%) | 23 (2.6%) |
| Total Housing Units | 2,218 (84.5%) | 406 (15.5%) |
Occupancy by Educational Attainment in Sunnyvale
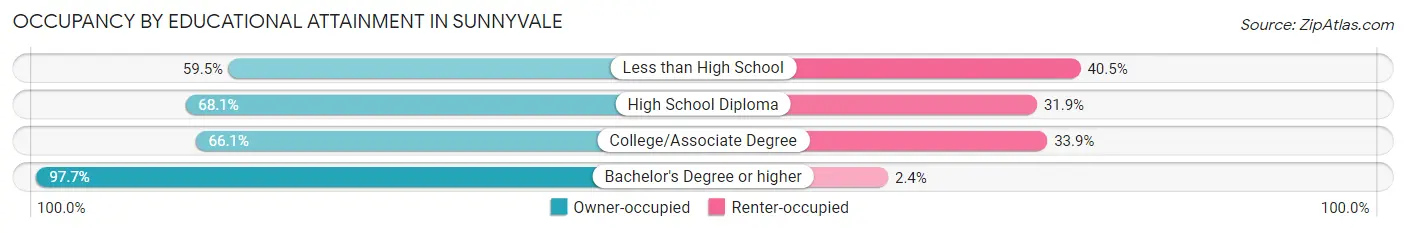
| Household Size | Owner-occupied | Renter-occupied |
| Less than High School | 47 (59.5%) | 32 (40.5%) |
| High School Diploma | 218 (68.1%) | 102 (31.9%) |
| College/Associate Degree | 460 (66.1%) | 236 (33.9%) |
| Bachelor's Degree or higher | 1,493 (97.7%) | 36 (2.4%) |
Occupancy by Age of Householder in Sunnyvale
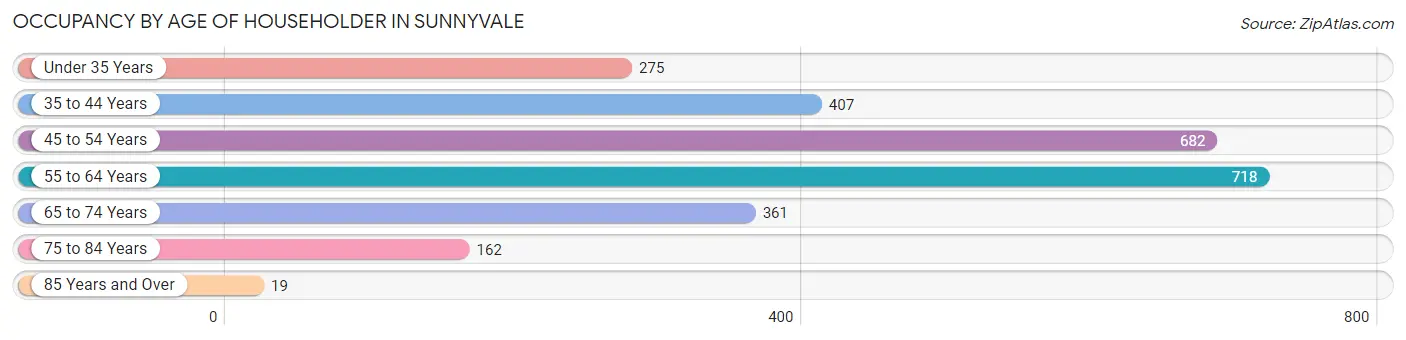
| Age Bracket | # Households | % Households |
| Under 35 Years | 275 | 10.5% |
| 35 to 44 Years | 407 | 15.5% |
| 45 to 54 Years | 682 | 26.0% |
| 55 to 64 Years | 718 | 27.4% |
| 65 to 74 Years | 361 | 13.8% |
| 75 to 84 Years | 162 | 6.2% |
| 85 Years and Over | 19 | 0.7% |
| Total | 2,624 | 100.0% |
Housing Finances in Sunnyvale
Median Income by Occupancy in Sunnyvale
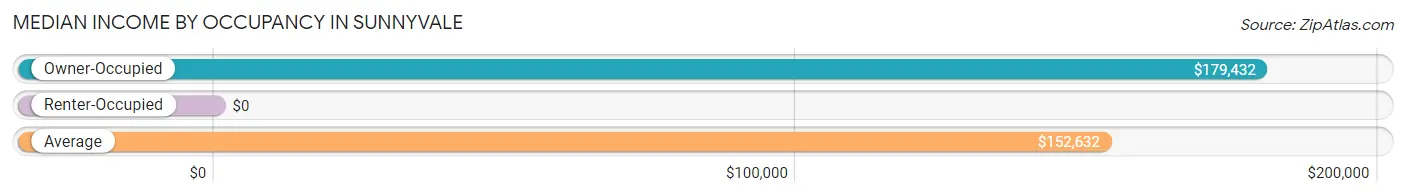
| Occupancy Type | # Households | Median Income |
| Owner-Occupied | 2,218 (84.5%) | $179,432 |
| Renter-Occupied | 406 (15.5%) | $0 |
| Average | 2,624 (100.0%) | $152,632 |
Occupancy by Householder Income Bracket in Sunnyvale
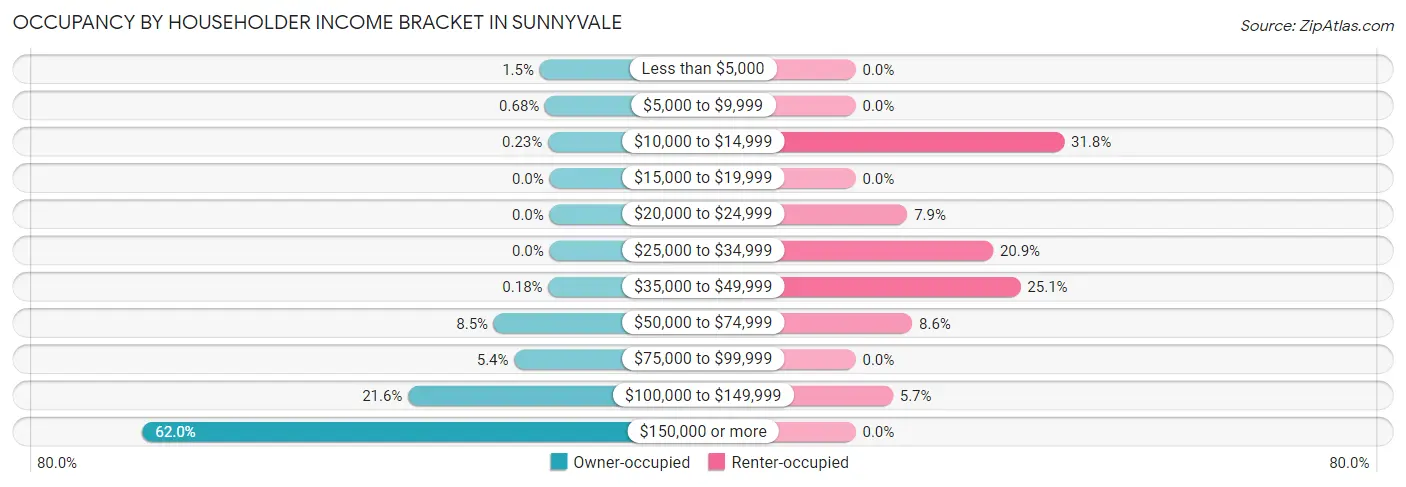
| Income Bracket | Owner-occupied | Renter-occupied |
| Less than $5,000 | 33 (1.5%) | 0 (0.0%) |
| $5,000 to $9,999 | 15 (0.7%) | 0 (0.0%) |
| $10,000 to $14,999 | 5 (0.2%) | 129 (31.8%) |
| $15,000 to $19,999 | 0 (0.0%) | 0 (0.0%) |
| $20,000 to $24,999 | 0 (0.0%) | 32 (7.9%) |
| $25,000 to $34,999 | 0 (0.0%) | 85 (20.9%) |
| $35,000 to $49,999 | 4 (0.2%) | 102 (25.1%) |
| $50,000 to $74,999 | 188 (8.5%) | 35 (8.6%) |
| $75,000 to $99,999 | 119 (5.4%) | 0 (0.0%) |
| $100,000 to $149,999 | 478 (21.5%) | 23 (5.7%) |
| $150,000 or more | 1,376 (62.0%) | 0 (0.0%) |
| Total | 2,218 (100.0%) | 406 (100.0%) |
Monthly Housing Cost Tiers in Sunnyvale
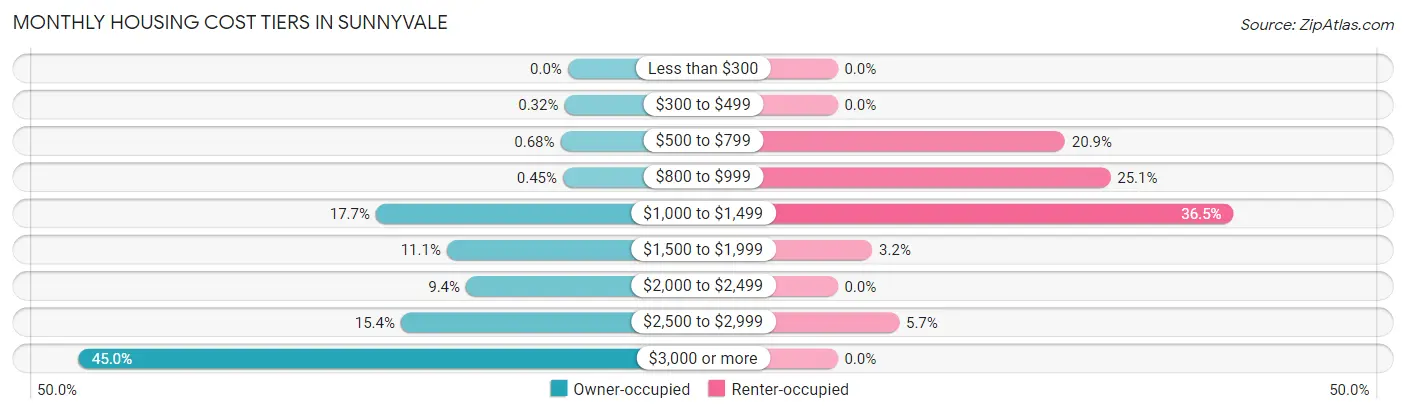
| Monthly Cost | Owner-occupied | Renter-occupied |
| Less than $300 | 0 (0.0%) | 0 (0.0%) |
| $300 to $499 | 7 (0.3%) | 0 (0.0%) |
| $500 to $799 | 15 (0.7%) | 85 (20.9%) |
| $800 to $999 | 10 (0.4%) | 102 (25.1%) |
| $1,000 to $1,499 | 392 (17.7%) | 148 (36.4%) |
| $1,500 to $1,999 | 247 (11.1%) | 13 (3.2%) |
| $2,000 to $2,499 | 208 (9.4%) | 0 (0.0%) |
| $2,500 to $2,999 | 341 (15.4%) | 23 (5.7%) |
| $3,000 or more | 998 (45.0%) | 0 (0.0%) |
| Total | 2,218 (100.0%) | 406 (100.0%) |
Physical Housing Characteristics in Sunnyvale
Housing Structures in Sunnyvale
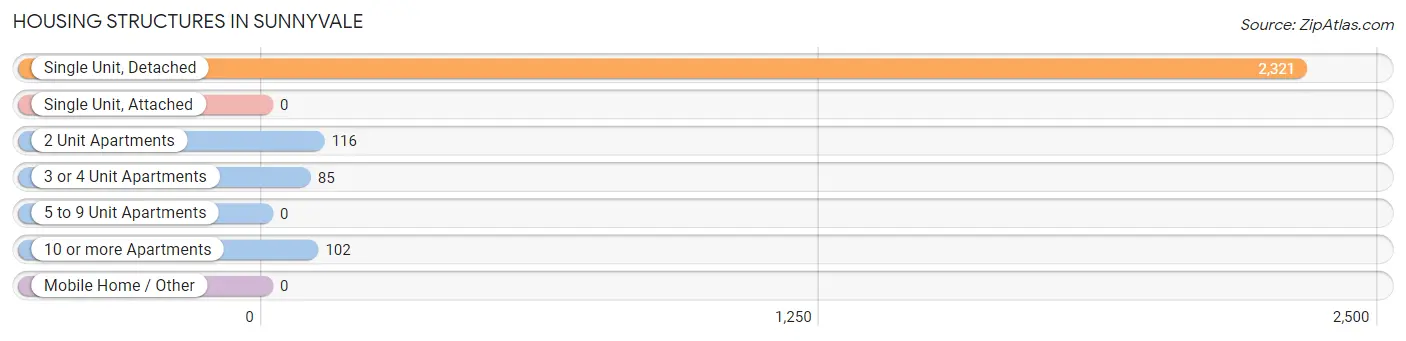
| Structure Type | # Housing Units | % Housing Units |
| Single Unit, Detached | 2,321 | 88.4% |
| Single Unit, Attached | 0 | 0.0% |
| 2 Unit Apartments | 116 | 4.4% |
| 3 or 4 Unit Apartments | 85 | 3.2% |
| 5 to 9 Unit Apartments | 0 | 0.0% |
| 10 or more Apartments | 102 | 3.9% |
| Mobile Home / Other | 0 | 0.0% |
| Total | 2,624 | 100.0% |
Housing Structures by Occupancy in Sunnyvale
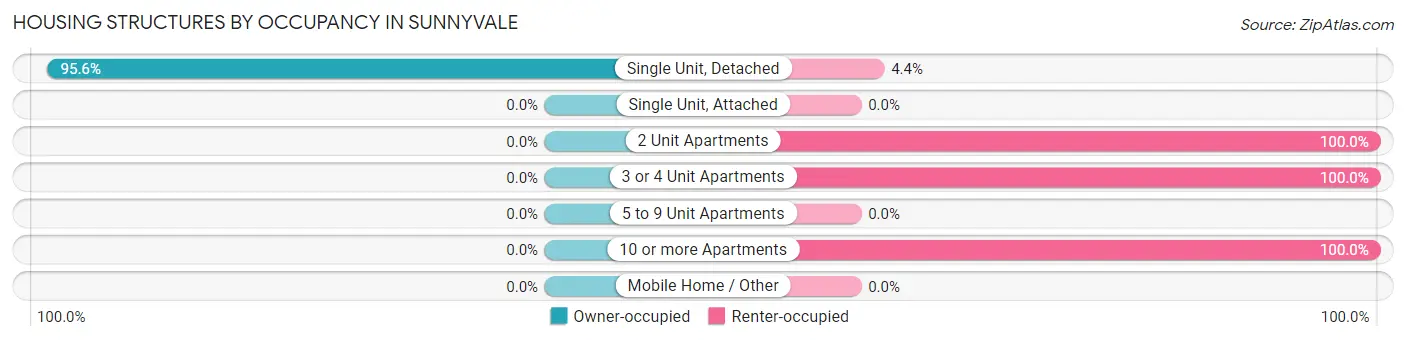
| Structure Type | Owner-occupied | Renter-occupied |
| Single Unit, Detached | 2,218 (95.6%) | 103 (4.4%) |
| Single Unit, Attached | 0 (0.0%) | 0 (0.0%) |
| 2 Unit Apartments | 0 (0.0%) | 116 (100.0%) |
| 3 or 4 Unit Apartments | 0 (0.0%) | 85 (100.0%) |
| 5 to 9 Unit Apartments | 0 (0.0%) | 0 (0.0%) |
| 10 or more Apartments | 0 (0.0%) | 102 (100.0%) |
| Mobile Home / Other | 0 (0.0%) | 0 (0.0%) |
| Total | 2,218 (84.5%) | 406 (15.5%) |
Housing Structures by Number of Rooms in Sunnyvale
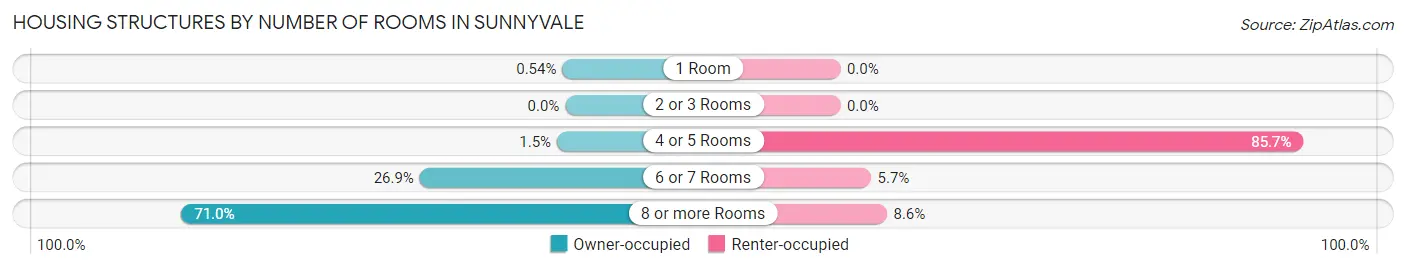
| Number of Rooms | Owner-occupied | Renter-occupied |
| 1 Room | 12 (0.5%) | 0 (0.0%) |
| 2 or 3 Rooms | 0 (0.0%) | 0 (0.0%) |
| 4 or 5 Rooms | 34 (1.5%) | 348 (85.7%) |
| 6 or 7 Rooms | 597 (26.9%) | 23 (5.7%) |
| 8 or more Rooms | 1,575 (71.0%) | 35 (8.6%) |
| Total | 2,218 (100.0%) | 406 (100.0%) |
Housing Structure by Heating Type in Sunnyvale
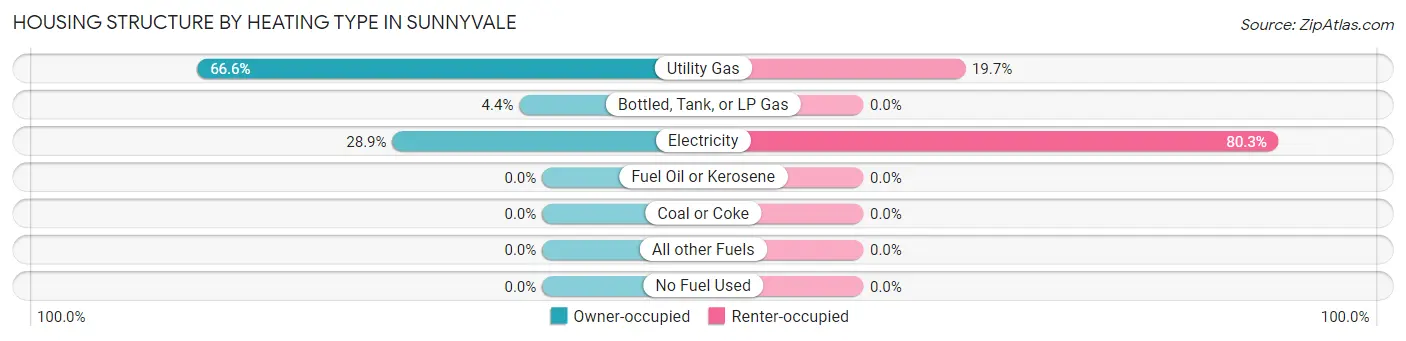
| Heating Type | Owner-occupied | Renter-occupied |
| Utility Gas | 1,478 (66.6%) | 80 (19.7%) |
| Bottled, Tank, or LP Gas | 98 (4.4%) | 0 (0.0%) |
| Electricity | 642 (28.9%) | 326 (80.3%) |
| Fuel Oil or Kerosene | 0 (0.0%) | 0 (0.0%) |
| Coal or Coke | 0 (0.0%) | 0 (0.0%) |
| All other Fuels | 0 (0.0%) | 0 (0.0%) |
| No Fuel Used | 0 (0.0%) | 0 (0.0%) |
| Total | 2,218 (100.0%) | 406 (100.0%) |
Household Vehicle Usage in Sunnyvale
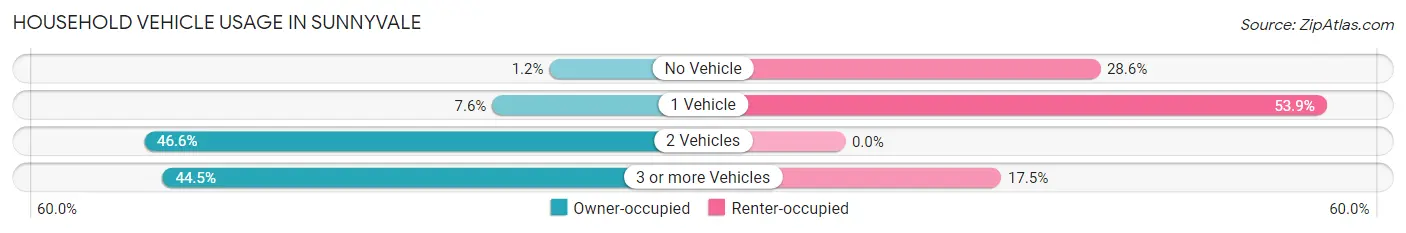
| Vehicles per Household | Owner-occupied | Renter-occupied |
| No Vehicle | 27 (1.2%) | 116 (28.6%) |
| 1 Vehicle | 169 (7.6%) | 219 (53.9%) |
| 2 Vehicles | 1,034 (46.6%) | 0 (0.0%) |
| 3 or more Vehicles | 988 (44.5%) | 71 (17.5%) |
| Total | 2,218 (100.0%) | 406 (100.0%) |
Real Estate & Mortgages in Sunnyvale
Real Estate and Mortgage Overview in Sunnyvale
| Characteristic | Without Mortgage | With Mortgage |
| Housing Units | 588 | 1,630 |
| Median Property Value | $446,900 | $525,700 |
| Median Household Income | $205,743 | $966 |
| Monthly Housing Costs | $1,299 | $976 |
| Real Estate Taxes | $8,315 | $15 |
Property Value by Mortgage Status in Sunnyvale
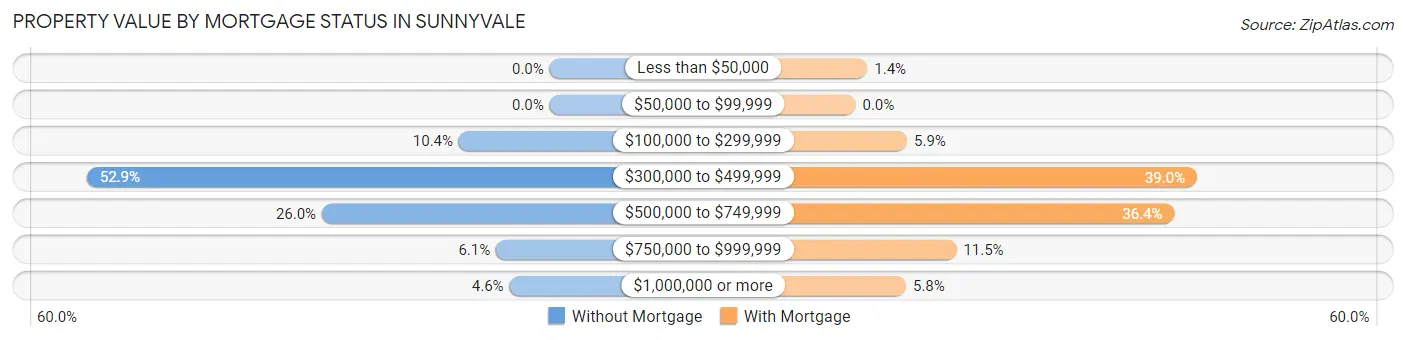
| Property Value | Without Mortgage | With Mortgage |
| Less than $50,000 | 0 (0.0%) | 22 (1.3%) |
| $50,000 to $99,999 | 0 (0.0%) | 0 (0.0%) |
| $100,000 to $299,999 | 61 (10.4%) | 96 (5.9%) |
| $300,000 to $499,999 | 311 (52.9%) | 636 (39.0%) |
| $500,000 to $749,999 | 153 (26.0%) | 594 (36.4%) |
| $750,000 to $999,999 | 36 (6.1%) | 188 (11.5%) |
| $1,000,000 or more | 27 (4.6%) | 94 (5.8%) |
| Total | 588 (100.0%) | 1,630 (100.0%) |
Household Income by Mortgage Status in Sunnyvale
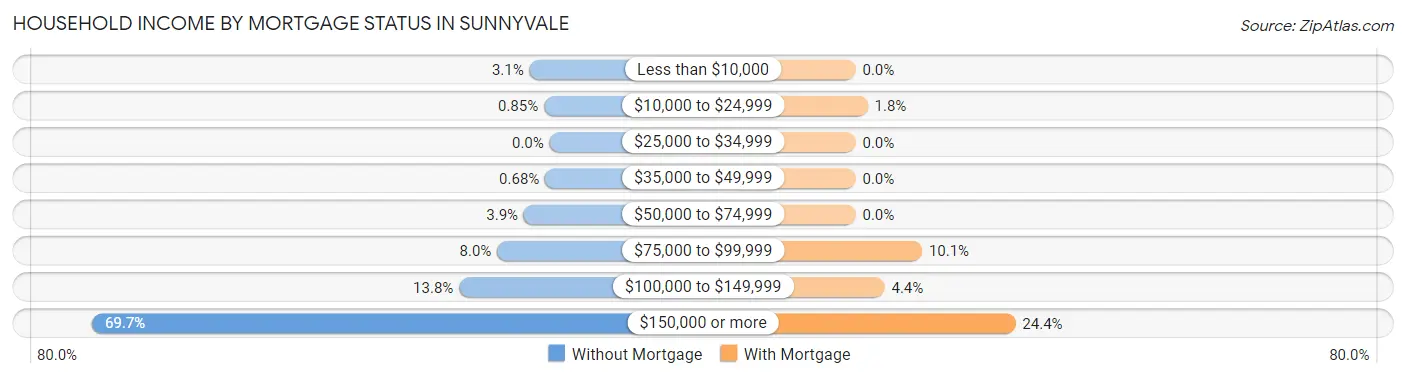
| Household Income | Without Mortgage | With Mortgage |
| Less than $10,000 | 18 (3.1%) | 0 (0.0%) |
| $10,000 to $24,999 | 5 (0.9%) | 30 (1.8%) |
| $25,000 to $34,999 | 0 (0.0%) | 0 (0.0%) |
| $35,000 to $49,999 | 4 (0.7%) | 0 (0.0%) |
| $50,000 to $74,999 | 23 (3.9%) | 0 (0.0%) |
| $75,000 to $99,999 | 47 (8.0%) | 165 (10.1%) |
| $100,000 to $149,999 | 81 (13.8%) | 72 (4.4%) |
| $150,000 or more | 410 (69.7%) | 397 (24.4%) |
| Total | 588 (100.0%) | 1,630 (100.0%) |
Property Value to Household Income Ratio in Sunnyvale
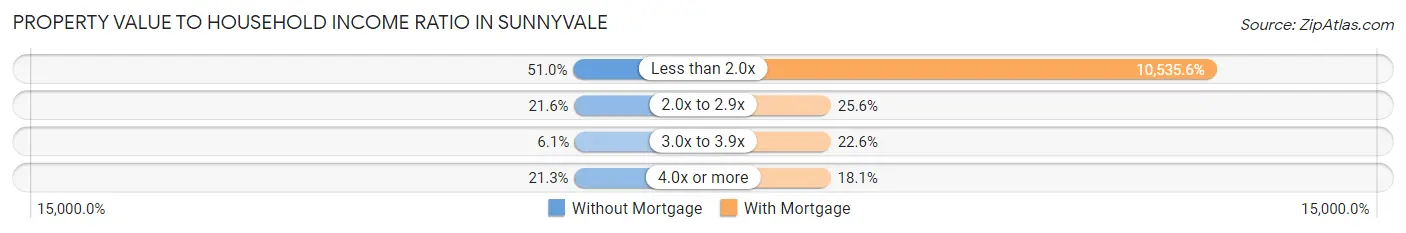
| Value-to-Income Ratio | Without Mortgage | With Mortgage |
| Less than 2.0x | 300 (51.0%) | 171,731 (10,535.6%) |
| 2.0x to 2.9x | 127 (21.6%) | 417 (25.6%) |
| 3.0x to 3.9x | 36 (6.1%) | 368 (22.6%) |
| 4.0x or more | 125 (21.3%) | 295 (18.1%) |
| Total | 588 (100.0%) | 1,630 (100.0%) |
Real Estate Taxes by Mortgage Status in Sunnyvale
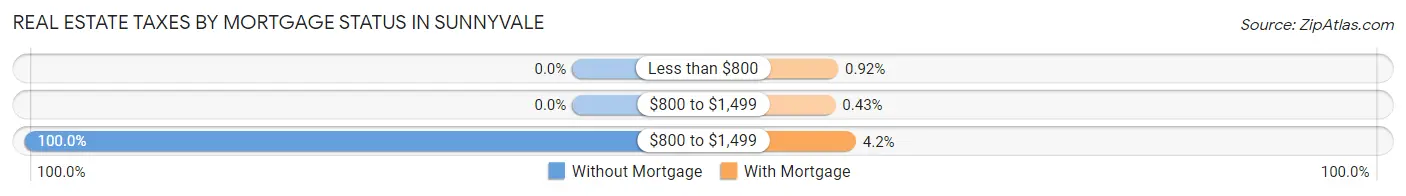
| Property Taxes | Without Mortgage | With Mortgage |
| Less than $800 | 0 (0.0%) | 15 (0.9%) |
| $800 to $1,499 | 0 (0.0%) | 7 (0.4%) |
| $800 to $1,499 | 588 (100.0%) | 68 (4.2%) |
| Total | 588 (100.0%) | 1,630 (100.0%) |
Health & Disability in Sunnyvale
Health Insurance Coverage by Age in Sunnyvale
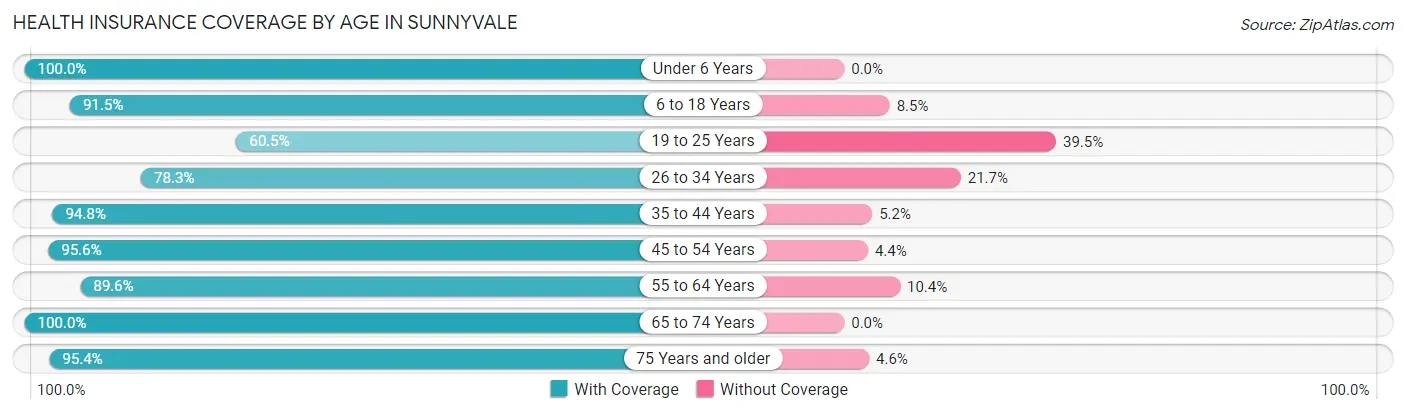
| Age Bracket | With Coverage | Without Coverage |
| Under 6 Years | 358 (100.0%) | 0 (0.0%) |
| 6 to 18 Years | 1,675 (91.5%) | 155 (8.5%) |
| 19 to 25 Years | 354 (60.5%) | 231 (39.5%) |
| 26 to 34 Years | 465 (78.3%) | 129 (21.7%) |
| 35 to 44 Years | 818 (94.8%) | 45 (5.2%) |
| 45 to 54 Years | 1,255 (95.6%) | 58 (4.4%) |
| 55 to 64 Years | 1,061 (89.6%) | 123 (10.4%) |
| 65 to 74 Years | 779 (100.0%) | 0 (0.0%) |
| 75 Years and older | 350 (95.4%) | 17 (4.6%) |
| Total | 7,115 (90.4%) | 758 (9.6%) |
Health Insurance Coverage by Citizenship Status in Sunnyvale
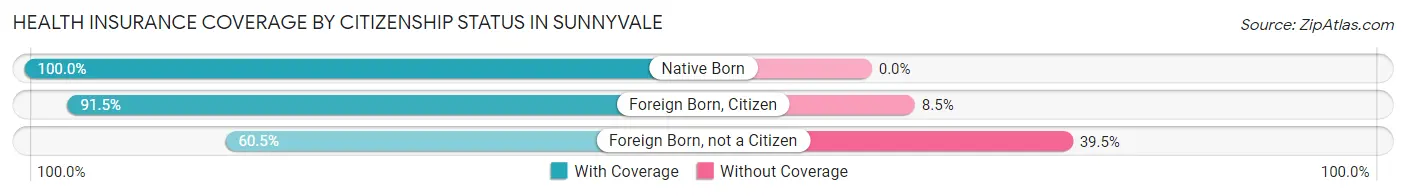
| Citizenship Status | With Coverage | Without Coverage |
| Native Born | 358 (100.0%) | 0 (0.0%) |
| Foreign Born, Citizen | 1,675 (91.5%) | 155 (8.5%) |
| Foreign Born, not a Citizen | 354 (60.5%) | 231 (39.5%) |
Health Insurance Coverage by Household Income in Sunnyvale
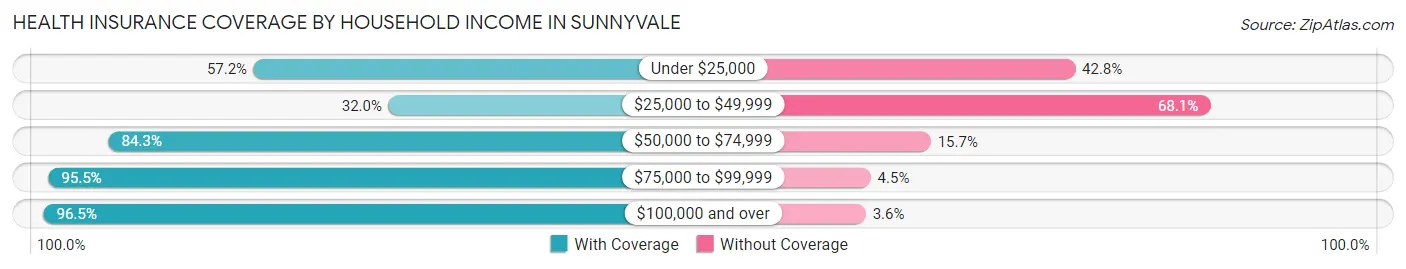
| Household Income | With Coverage | Without Coverage |
| Under $25,000 | 305 (57.2%) | 228 (42.8%) |
| $25,000 to $49,999 | 100 (32.0%) | 213 (68.0%) |
| $50,000 to $74,999 | 450 (84.3%) | 84 (15.7%) |
| $75,000 to $99,999 | 278 (95.5%) | 13 (4.5%) |
| $100,000 and over | 5,982 (96.5%) | 220 (3.5%) |
Public vs Private Health Insurance Coverage by Age in Sunnyvale
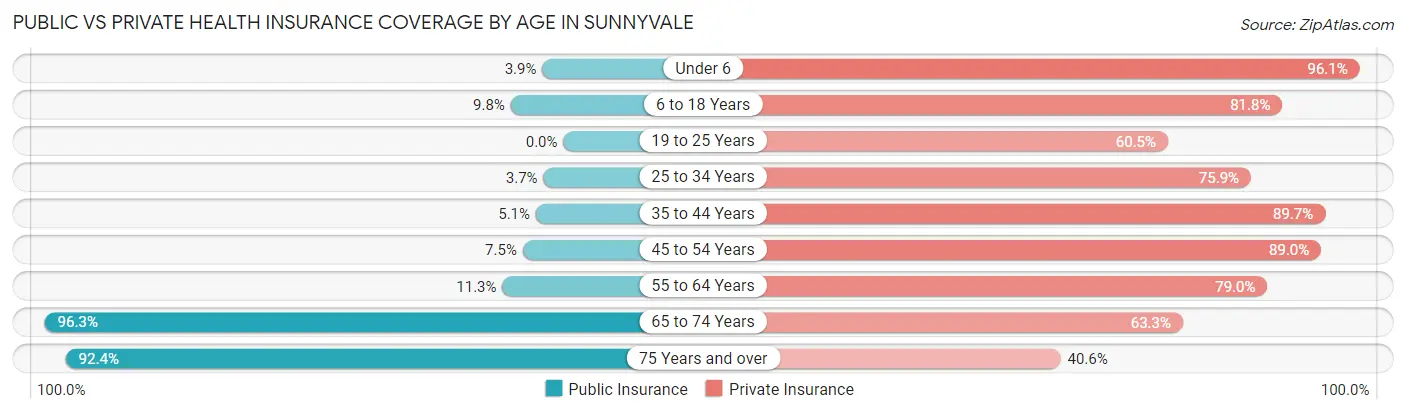
| Age Bracket | Public Insurance | Private Insurance |
| Under 6 | 14 (3.9%) | 344 (96.1%) |
| 6 to 18 Years | 179 (9.8%) | 1,496 (81.8%) |
| 19 to 25 Years | 0 (0.0%) | 354 (60.5%) |
| 25 to 34 Years | 22 (3.7%) | 451 (75.9%) |
| 35 to 44 Years | 44 (5.1%) | 774 (89.7%) |
| 45 to 54 Years | 99 (7.5%) | 1,168 (89.0%) |
| 55 to 64 Years | 134 (11.3%) | 935 (79.0%) |
| 65 to 74 Years | 750 (96.3%) | 493 (63.3%) |
| 75 Years and over | 339 (92.4%) | 149 (40.6%) |
| Total | 1,581 (20.1%) | 6,164 (78.3%) |
Disability Status by Sex by Age in Sunnyvale
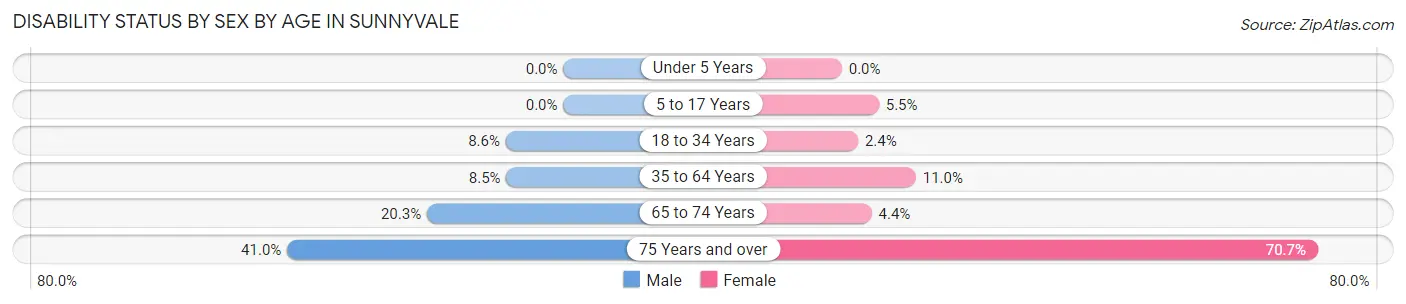
| Age Bracket | Male | Female |
| Under 5 Years | 0 (0.0%) | 0 (0.0%) |
| 5 to 17 Years | 0 (0.0%) | 38 (5.5%) |
| 18 to 34 Years | 60 (8.6%) | 13 (2.4%) |
| 35 to 64 Years | 134 (8.5%) | 195 (11.0%) |
| 65 to 74 Years | 80 (20.3%) | 17 (4.4%) |
| 75 Years and over | 89 (41.0%) | 106 (70.7%) |
Disability Class by Sex by Age in Sunnyvale
Disability Class: Hearing Difficulty
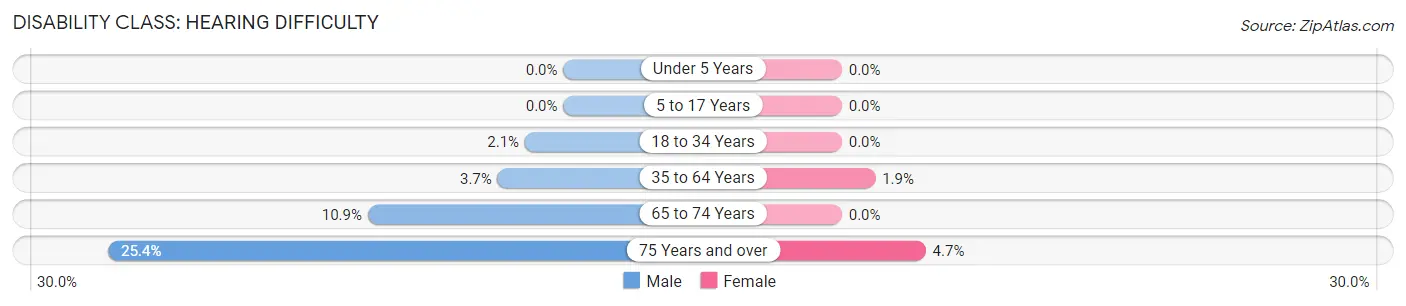
| Age Bracket | Male | Female |
| Under 5 Years | 0 (0.0%) | 0 (0.0%) |
| 5 to 17 Years | 0 (0.0%) | 0 (0.0%) |
| 18 to 34 Years | 15 (2.1%) | 0 (0.0%) |
| 35 to 64 Years | 58 (3.7%) | 33 (1.9%) |
| 65 to 74 Years | 43 (10.9%) | 0 (0.0%) |
| 75 Years and over | 55 (25.4%) | 7 (4.7%) |
Disability Class: Vision Difficulty
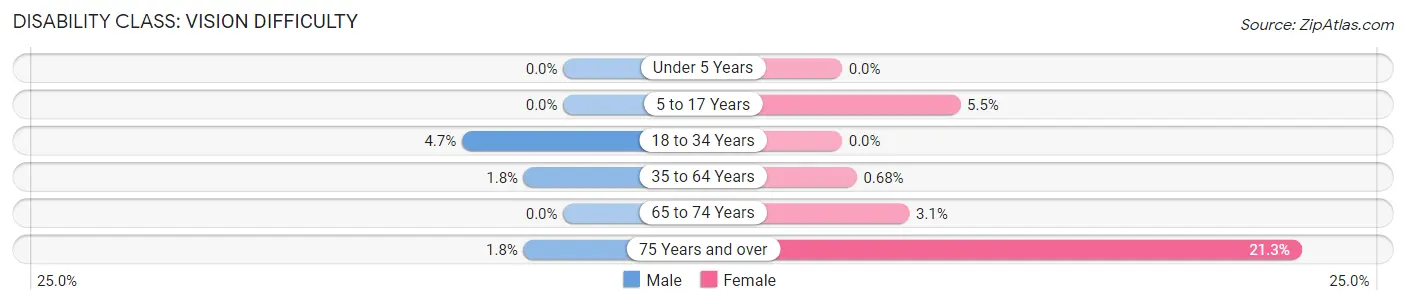
| Age Bracket | Male | Female |
| Under 5 Years | 0 (0.0%) | 0 (0.0%) |
| 5 to 17 Years | 0 (0.0%) | 38 (5.5%) |
| 18 to 34 Years | 33 (4.7%) | 0 (0.0%) |
| 35 to 64 Years | 29 (1.8%) | 12 (0.7%) |
| 65 to 74 Years | 0 (0.0%) | 12 (3.1%) |
| 75 Years and over | 4 (1.8%) | 32 (21.3%) |
Disability Class: Cognitive Difficulty
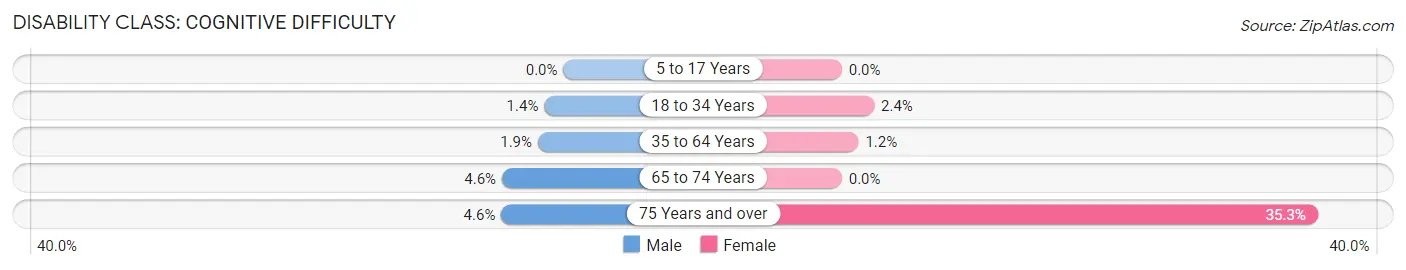
| Age Bracket | Male | Female |
| 5 to 17 Years | 0 (0.0%) | 0 (0.0%) |
| 18 to 34 Years | 10 (1.4%) | 13 (2.4%) |
| 35 to 64 Years | 30 (1.9%) | 22 (1.2%) |
| 65 to 74 Years | 18 (4.6%) | 0 (0.0%) |
| 75 Years and over | 10 (4.6%) | 53 (35.3%) |
Disability Class: Ambulatory Difficulty
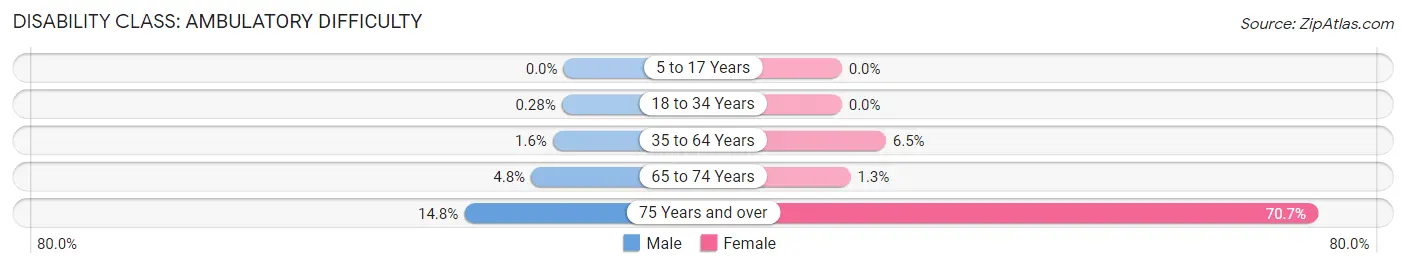
| Age Bracket | Male | Female |
| 5 to 17 Years | 0 (0.0%) | 0 (0.0%) |
| 18 to 34 Years | 2 (0.3%) | 0 (0.0%) |
| 35 to 64 Years | 25 (1.6%) | 116 (6.5%) |
| 65 to 74 Years | 19 (4.8%) | 5 (1.3%) |
| 75 Years and over | 32 (14.7%) | 106 (70.7%) |
Disability Class: Self-Care Difficulty
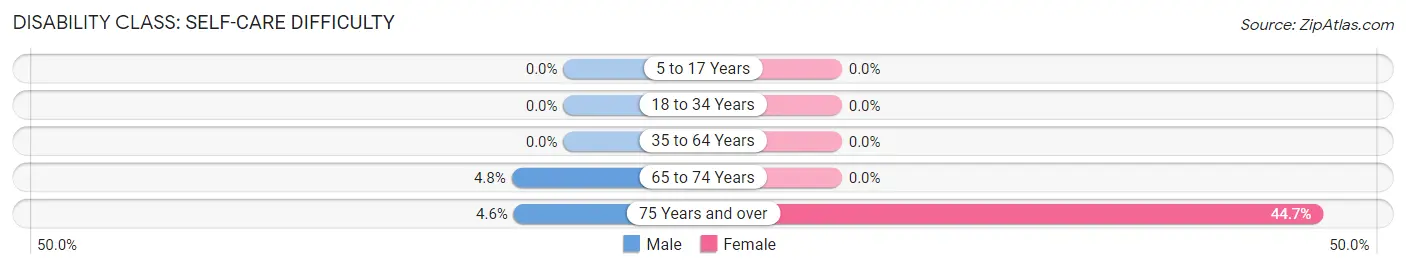
| Age Bracket | Male | Female |
| 5 to 17 Years | 0 (0.0%) | 0 (0.0%) |
| 18 to 34 Years | 0 (0.0%) | 0 (0.0%) |
| 35 to 64 Years | 0 (0.0%) | 0 (0.0%) |
| 65 to 74 Years | 19 (4.8%) | 0 (0.0%) |
| 75 Years and over | 10 (4.6%) | 67 (44.7%) |
Technology Access in Sunnyvale
Computing Device Access in Sunnyvale
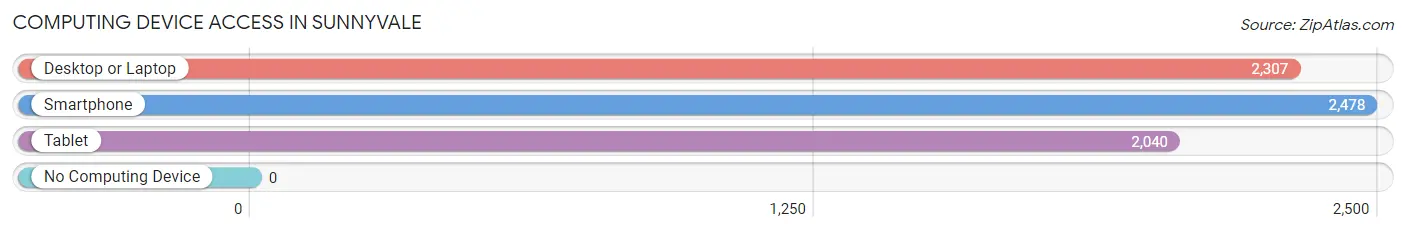
| Device Type | # Households | % Households |
| Desktop or Laptop | 2,307 | 87.9% |
| Smartphone | 2,478 | 94.4% |
| Tablet | 2,040 | 77.7% |
| No Computing Device | 0 | 0.0% |
| Total | 2,624 | 100.0% |
Internet Access in Sunnyvale
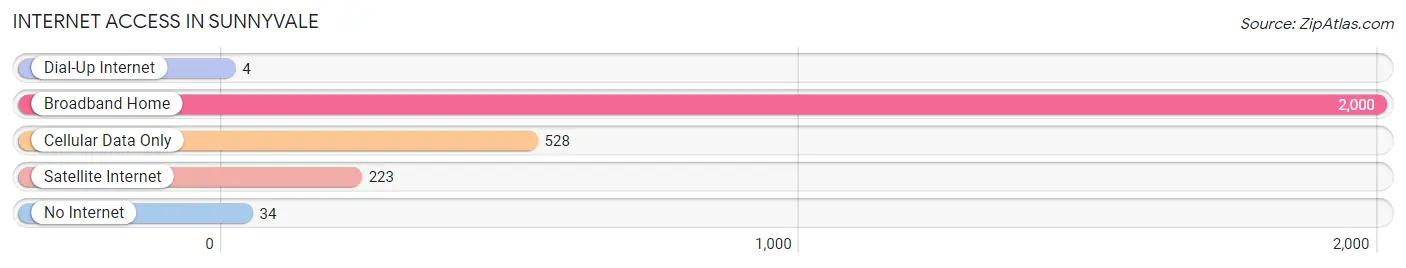
| Internet Type | # Households | % Households |
| Dial-Up Internet | 4 | 0.2% |
| Broadband Home | 2,000 | 76.2% |
| Cellular Data Only | 528 | 20.1% |
| Satellite Internet | 223 | 8.5% |
| No Internet | 34 | 1.3% |
| Total | 2,624 | 100.0% |
Sunnyvale Summary
Sunnyvale is a small town located in Dallas County, Texas, United States. It is situated in the southeastern corner of the county, approximately 20 miles east of downtown Dallas. The town has a population of approximately 6,000 people and is part of the Dallas-Fort Worth-Arlington metropolitan area.
History
Sunnyvale was founded in 1845 by settlers from Tennessee and Kentucky. The town was originally known as “Cross Roads” due to its location at the intersection of two major roads. In 1872, the town was renamed “Sunnyvale” after the local postmaster, William Sunny.
The town grew slowly over the years, and by the early 1900s, it had become a thriving agricultural community. Cotton was the main crop grown in the area, and the town was home to several cotton gins. In the 1920s, the town began to experience a population boom as people moved to the area to take advantage of the booming economy.
In the 1950s, the town experienced a period of rapid growth as the Dallas-Fort Worth area began to expand. The population of Sunnyvale increased from 1,000 in 1950 to over 6,000 by 2000.
Geography
Sunnyvale is located in the southeastern corner of Dallas County, approximately 20 miles east of downtown Dallas. The town is situated on rolling hills and is surrounded by farmland. The town is located near several major highways, including Interstate 20, US Highway 80, and State Highway 78.
The climate in Sunnyvale is hot and humid in the summer and mild in the winter. The average annual temperature is around 70 degrees Fahrenheit. The average annual precipitation is around 40 inches.
Economy
Sunnyvale’s economy is largely based on agriculture. Cotton is the main crop grown in the area, and the town is home to several cotton gins. Other crops grown in the area include corn, soybeans, and wheat.
The town is also home to several small businesses, including restaurants, retail stores, and auto repair shops. The town is also home to a number of light industrial businesses, including a plastics factory and a metal fabrication plant.
Demographics
As of the 2010 census, the population of Sunnyvale was 6,000. The racial makeup of the town was 79.3% White, 14.2% African American, 0.7% Native American, 0.7% Asian, and 4.1% from other races. Hispanic or Latino of any race were 8.3% of the population.
The median household income in Sunnyvale was $50,000, and the median family income was $54,000. The per capita income was $21,000. About 11.3% of the population was below the poverty line.
Sunnyvale is a small town with a rich history and a diverse population. The town is home to a thriving agricultural economy and a number of small businesses. The town is also conveniently located near several major highways, making it an ideal place to live and work.
Common Questions
What is Per Capita Income in Sunnyvale?
Per Capita income in Sunnyvale is $59,789.
What is the Median Family Income in Sunnyvale?
Median Family Income in Sunnyvale is $159,464.
What is the Median Household income in Sunnyvale?
Median Household Income in Sunnyvale is $152,632.
What is Income or Wage Gap in Sunnyvale?
Income or Wage Gap in Sunnyvale is 42.9%.
Women in Sunnyvale earn 57.1 cents for every dollar earned by a man.
What is Inequality or Gini Index in Sunnyvale?
Inequality or Gini Index in Sunnyvale is 0.38.
What is the Total Population of Sunnyvale?
Total Population of Sunnyvale is 7,873.
What is the Total Male Population of Sunnyvale?
Total Male Population of Sunnyvale is 4,094.
What is the Total Female Population of Sunnyvale?
Total Female Population of Sunnyvale is 3,779.
What is the Ratio of Males per 100 Females in Sunnyvale?
There are 108.34 Males per 100 Females in Sunnyvale.
What is the Ratio of Females per 100 Males in Sunnyvale?
There are 92.31 Females per 100 Males in Sunnyvale.
What is the Median Population Age in Sunnyvale?
Median Population Age in Sunnyvale is 43.1 Years.
What is the Average Family Size in Sunnyvale
Average Family Size in Sunnyvale is 3.1 People.
What is the Average Household Size in Sunnyvale
Average Household Size in Sunnyvale is 3.0 People.
How Large is the Labor Force in Sunnyvale?
There are 4,302 People in the Labor Forcein in Sunnyvale.
What is the Percentage of People in the Labor Force in Sunnyvale?
71.6% of People are in the Labor Force in Sunnyvale.
What is the Unemployment Rate in Sunnyvale?
Unemployment Rate in Sunnyvale is 5.9%.