Farmington, MI Map & Demographics
Farmington Map
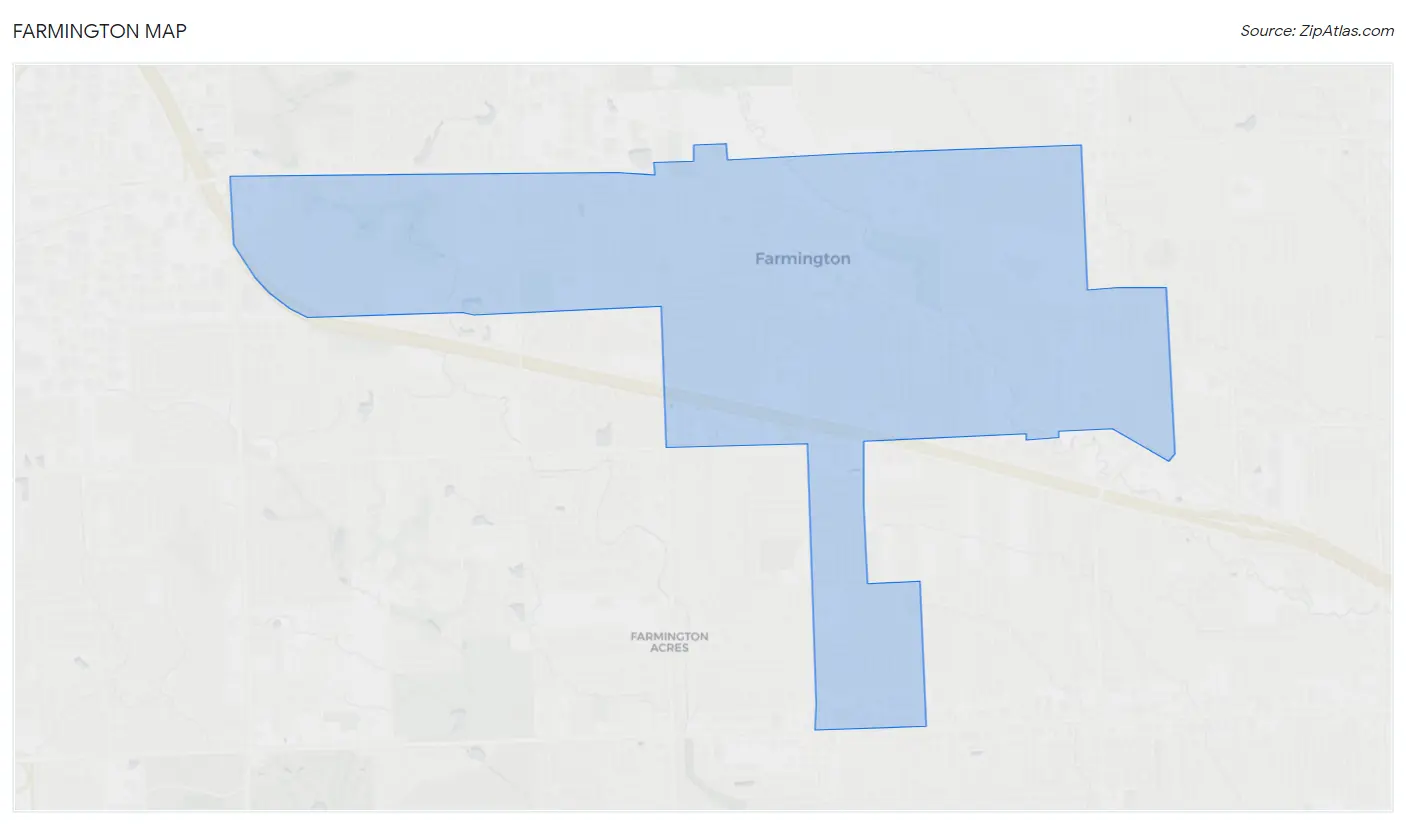
Farmington Overview
$53,511
PER CAPITA INCOME
$113,322
AVG FAMILY INCOME
$92,128
AVG HOUSEHOLD INCOME
44.4%
WAGE / INCOME GAP [ % ]
55.6¢/ $1
WAGE / INCOME GAP [ $ ]
0.41
INEQUALITY / GINI INDEX
11,486
TOTAL POPULATION
5,482
MALE POPULATION
6,004
FEMALE POPULATION
91.31
MALES / 100 FEMALES
109.52
FEMALES / 100 MALES
38.4
MEDIAN AGE
2.9
AVG FAMILY SIZE
2.2
AVG HOUSEHOLD SIZE
6,522
LABOR FORCE [ PEOPLE ]
67.6%
PERCENT IN LABOR FORCE
3.0%
UNEMPLOYMENT RATE
Farmington Area Codes
Income in Farmington
Income Overview in Farmington
Per Capita Income in Farmington is $53,511, while median incomes of families and households are $113,322 and $92,128 respectively.
| Characteristic | Number | Measure |
| Per Capita Income | 11,486 | $53,511 |
| Median Family Income | 2,868 | $113,322 |
| Mean Family Income | 2,868 | $140,531 |
| Median Household Income | 5,207 | $92,128 |
| Mean Household Income | 5,207 | $115,891 |
| Income Deficit | 2,868 | $0 |
| Wage / Income Gap (%) | 11,486 | 44.39% |
| Wage / Income Gap ($) | 11,486 | 55.61¢ per $1 |
| Gini / Inequality Index | 11,486 | 0.41 |
Earnings by Sex in Farmington
Average Earnings in Farmington are $63,085, $81,506 for men and $45,329 for women, a difference of 44.4%.
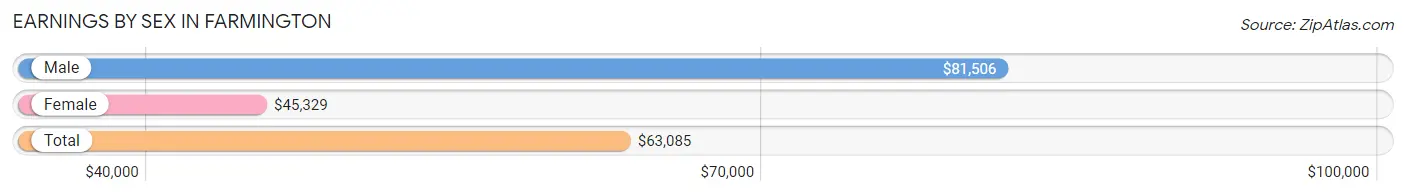
| Sex | Number | Average Earnings |
| Male | 3,487 (51.8%) | $81,506 |
| Female | 3,250 (48.2%) | $45,329 |
| Total | 6,737 (100.0%) | $63,085 |
Earnings by Sex by Income Bracket in Farmington
The most common earnings brackets in Farmington are $100,000+ for men (1,227 | 35.2%) and $75,000 to $99,999 for women (524 | 16.1%).
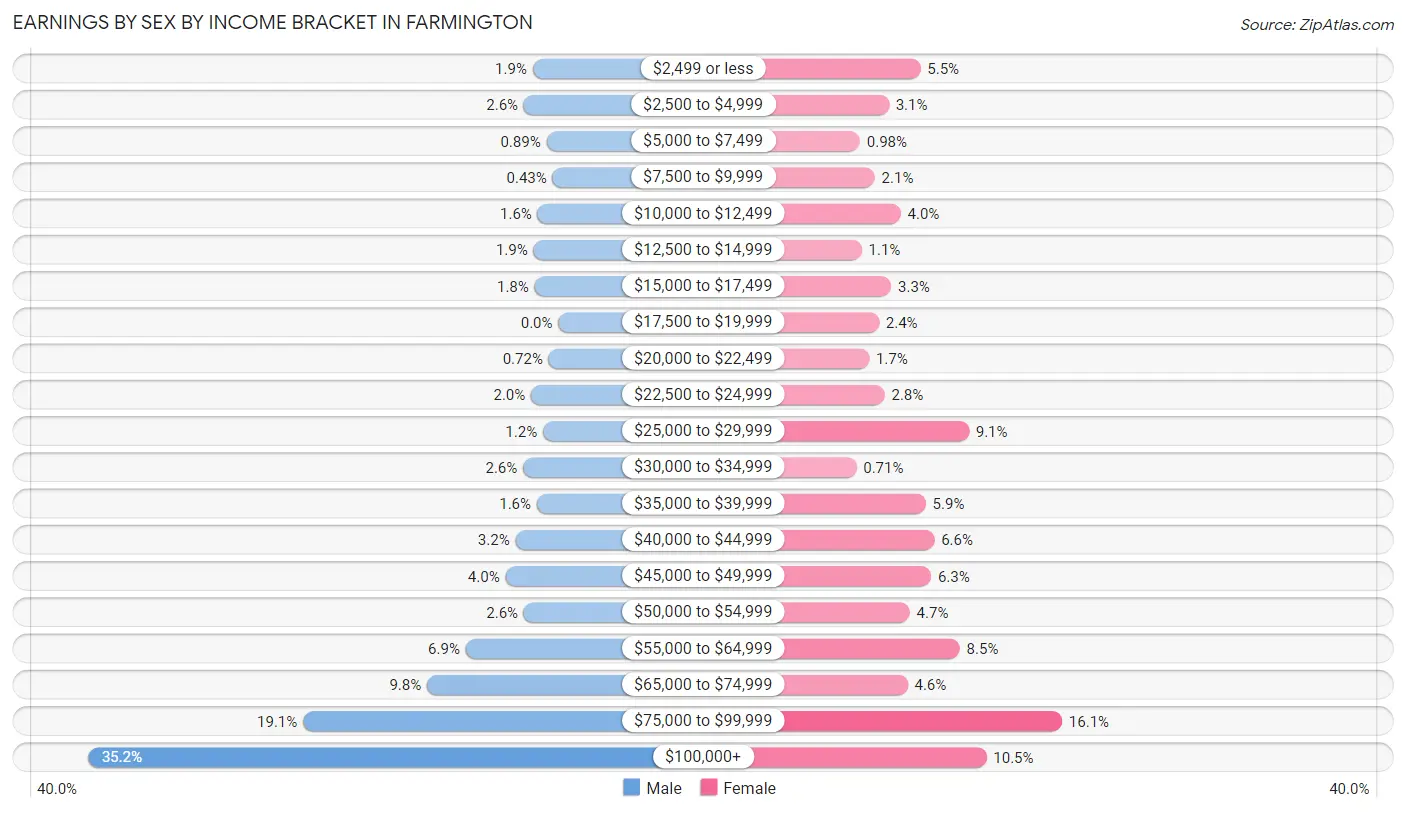
| Income | Male | Female |
| $2,499 or less | 67 (1.9%) | 179 (5.5%) |
| $2,500 to $4,999 | 90 (2.6%) | 102 (3.1%) |
| $5,000 to $7,499 | 31 (0.9%) | 32 (1.0%) |
| $7,500 to $9,999 | 15 (0.4%) | 68 (2.1%) |
| $10,000 to $12,499 | 54 (1.5%) | 131 (4.0%) |
| $12,500 to $14,999 | 65 (1.9%) | 36 (1.1%) |
| $15,000 to $17,499 | 62 (1.8%) | 108 (3.3%) |
| $17,500 to $19,999 | 0 (0.0%) | 78 (2.4%) |
| $20,000 to $22,499 | 25 (0.7%) | 54 (1.7%) |
| $22,500 to $24,999 | 71 (2.0%) | 92 (2.8%) |
| $25,000 to $29,999 | 40 (1.1%) | 297 (9.1%) |
| $30,000 to $34,999 | 92 (2.6%) | 23 (0.7%) |
| $35,000 to $39,999 | 56 (1.6%) | 192 (5.9%) |
| $40,000 to $44,999 | 112 (3.2%) | 213 (6.6%) |
| $45,000 to $49,999 | 138 (4.0%) | 205 (6.3%) |
| $50,000 to $54,999 | 90 (2.6%) | 153 (4.7%) |
| $55,000 to $64,999 | 242 (6.9%) | 275 (8.5%) |
| $65,000 to $74,999 | 343 (9.8%) | 148 (4.5%) |
| $75,000 to $99,999 | 667 (19.1%) | 524 (16.1%) |
| $100,000+ | 1,227 (35.2%) | 340 (10.5%) |
| Total | 3,487 (100.0%) | 3,250 (100.0%) |
Earnings by Sex by Educational Attainment in Farmington
Average earnings in Farmington are $86,288 for men and $50,243 for women, a difference of 41.8%. Men with an educational attainment of graduate degree enjoy the highest average annual earnings of $101,667, while those with less than high school education earn the least with $64,563. Women with an educational attainment of graduate degree earn the most with the average annual earnings of $79,432, while those with college or associate's degree education have the smallest earnings of $26,832.
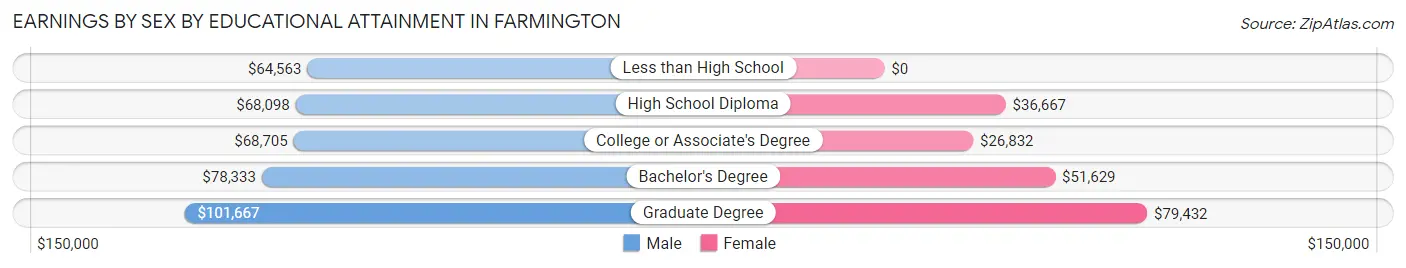
| Educational Attainment | Male Income | Female Income |
| Less than High School | $64,563 | $0 |
| High School Diploma | $68,098 | $36,667 |
| College or Associate's Degree | $68,705 | $26,832 |
| Bachelor's Degree | $78,333 | $51,629 |
| Graduate Degree | $101,667 | $79,432 |
| Total | $86,288 | $50,243 |
Family Income in Farmington
Family Income Brackets in Farmington
According to the Farmington family income data, there are 625 families falling into the $100,000 to $149,999 income range, which is the most common income bracket and makes up 21.8% of all families. Conversely, the $15,000 to $24,999 income bracket is the least frequent group with only 9 families (0.3%) belonging to this category.
| Income Bracket | # Families | % Families |
| Less than $10,000 | 20 | 0.7% |
| $10,000 to $14,999 | 14 | 0.5% |
| $15,000 to $24,999 | 9 | 0.3% |
| $25,000 to $34,999 | 83 | 2.9% |
| $35,000 to $49,999 | 184 | 6.4% |
| $50,000 to $74,999 | 321 | 11.2% |
| $75,000 to $99,999 | 582 | 20.3% |
| $100,000 to $149,999 | 625 | 21.8% |
| $150,000 to $199,999 | 522 | 18.2% |
| $200,000+ | 508 | 17.7% |
Family Income by Famaliy Size in Farmington
6-person families (52 | 1.8%) account for the highest median family income in Farmington with $176,288 per family, while 2-person families (1,519 | 53.0%) have the highest median income of $47,366 per family member.
| Income Bracket | # Families | Median Income |
| 2-Person Families | 1,519 (53.0%) | $94,732 |
| 3-Person Families | 683 (23.8%) | $119,821 |
| 4-Person Families | 422 (14.7%) | $143,750 |
| 5-Person Families | 125 (4.4%) | $0 |
| 6-Person Families | 52 (1.8%) | $176,288 |
| 7+ Person Families | 67 (2.3%) | $0 |
| Total | 2,868 (100.0%) | $113,322 |
Family Income by Number of Earners in Farmington
The median family income in Farmington is $113,322, with families comprising 3+ earners (219) having the highest median family income of $193,558, while families with no earners (392) have the lowest median family income of $72,821, accounting for 7.6% and 13.7% of families, respectively.
| Number of Earners | # Families | Median Income |
| No Earners | 392 (13.7%) | $72,821 |
| 1 Earner | 908 (31.7%) | $92,973 |
| 2 Earners | 1,349 (47.0%) | $150,089 |
| 3+ Earners | 219 (7.6%) | $193,558 |
| Total | 2,868 (100.0%) | $113,322 |
Household Income in Farmington
Household Income Brackets in Farmington
With 1,052 households falling in the category, the $100,000 to $149,999 income range is the most frequent in Farmington, accounting for 20.2% of all households. In contrast, only 94 households (1.8%) fall into the less than $10,000 income bracket, making it the least populous group.
| Income Bracket | # Households | % Households |
| Less than $10,000 | 94 | 1.8% |
| $10,000 to $14,999 | 109 | 2.1% |
| $15,000 to $24,999 | 172 | 3.3% |
| $25,000 to $34,999 | 344 | 6.6% |
| $35,000 to $49,999 | 463 | 8.9% |
| $50,000 to $74,999 | 817 | 15.7% |
| $75,000 to $99,999 | 859 | 16.5% |
| $100,000 to $149,999 | 1,052 | 20.2% |
| $150,000 to $199,999 | 687 | 13.2% |
| $200,000+ | 609 | 11.7% |
Household Income by Householder Age in Farmington
The median household income in Farmington is $92,128, with the highest median household income of $113,125 found in the 45 to 64 years age bracket for the primary householder. A total of 1,706 households (32.8%) fall into this category. Meanwhile, the 65+ years age bracket for the primary householder has the lowest median household income of $53,472, with 1,404 households (27.0%) in this group.
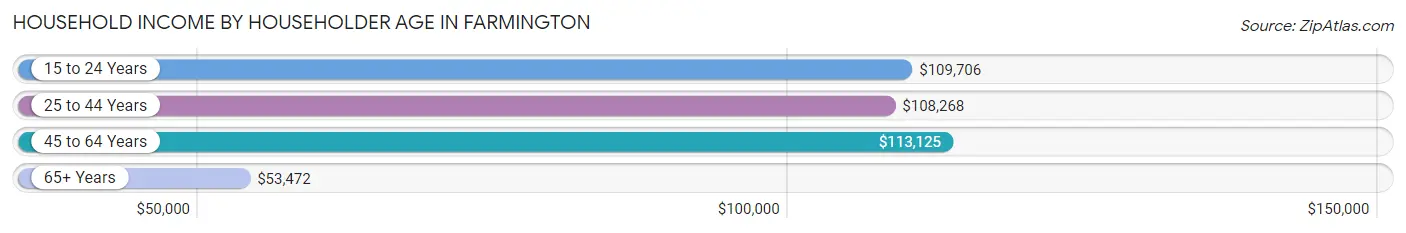
| Income Bracket | # Households | Median Income |
| 15 to 24 Years | 168 (3.2%) | $109,706 |
| 25 to 44 Years | 1,929 (37.0%) | $108,268 |
| 45 to 64 Years | 1,706 (32.8%) | $113,125 |
| 65+ Years | 1,404 (27.0%) | $53,472 |
| Total | 5,207 (100.0%) | $92,128 |
Poverty in Farmington
Income Below Poverty by Sex and Age in Farmington
With 4.4% poverty level for males and 5.3% for females among the residents of Farmington, 75 year old and over males and 18 to 24 year old females are the most vulnerable to poverty, with 38 males (12.7%) and 83 females (18.2%) in their respective age groups living below the poverty level.
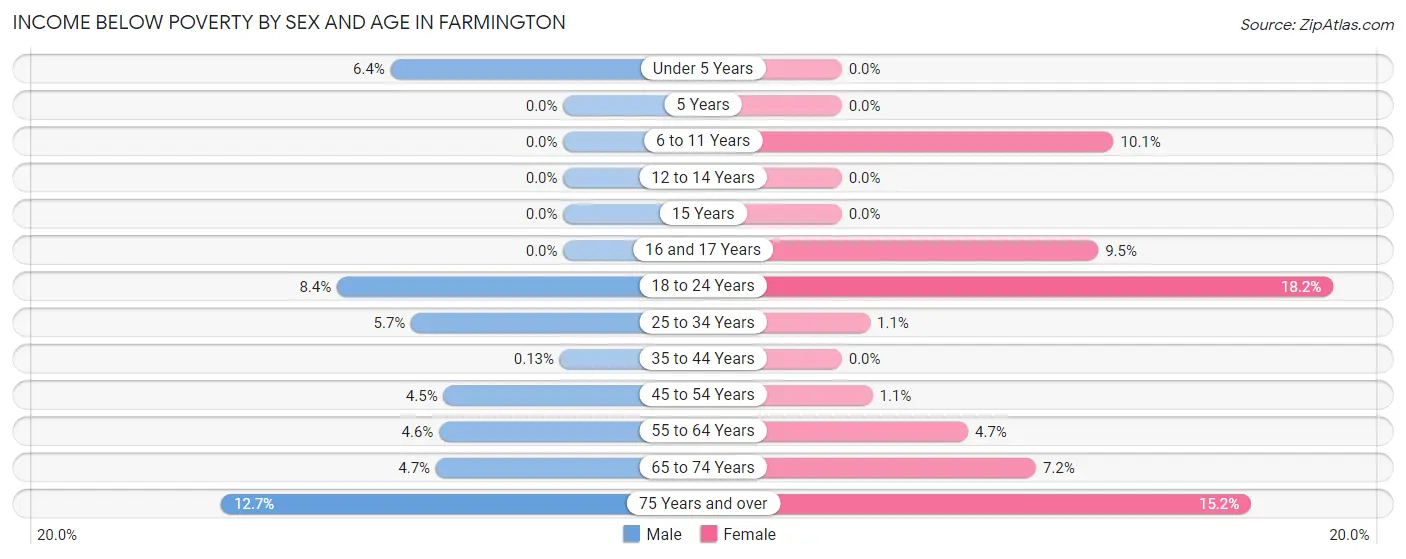
| Age Bracket | Male | Female |
| Under 5 Years | 18 (6.4%) | 0 (0.0%) |
| 5 Years | 0 (0.0%) | 0 (0.0%) |
| 6 to 11 Years | 0 (0.0%) | 33 (10.1%) |
| 12 to 14 Years | 0 (0.0%) | 0 (0.0%) |
| 15 Years | 0 (0.0%) | 0 (0.0%) |
| 16 and 17 Years | 0 (0.0%) | 14 (9.5%) |
| 18 to 24 Years | 30 (8.4%) | 83 (18.2%) |
| 25 to 34 Years | 76 (5.7%) | 10 (1.1%) |
| 35 to 44 Years | 1 (0.1%) | 0 (0.0%) |
| 45 to 54 Years | 22 (4.4%) | 7 (1.1%) |
| 55 to 64 Years | 32 (4.6%) | 47 (4.7%) |
| 65 to 74 Years | 24 (4.7%) | 51 (7.2%) |
| 75 Years and over | 38 (12.7%) | 72 (15.2%) |
| Total | 241 (4.4%) | 317 (5.3%) |
Income Above Poverty by Sex and Age in Farmington
According to the poverty statistics in Farmington, males aged 5 years and females aged under 5 years are the age groups that are most secure financially, with 100.0% of males and 100.0% of females in these age groups living above the poverty line.
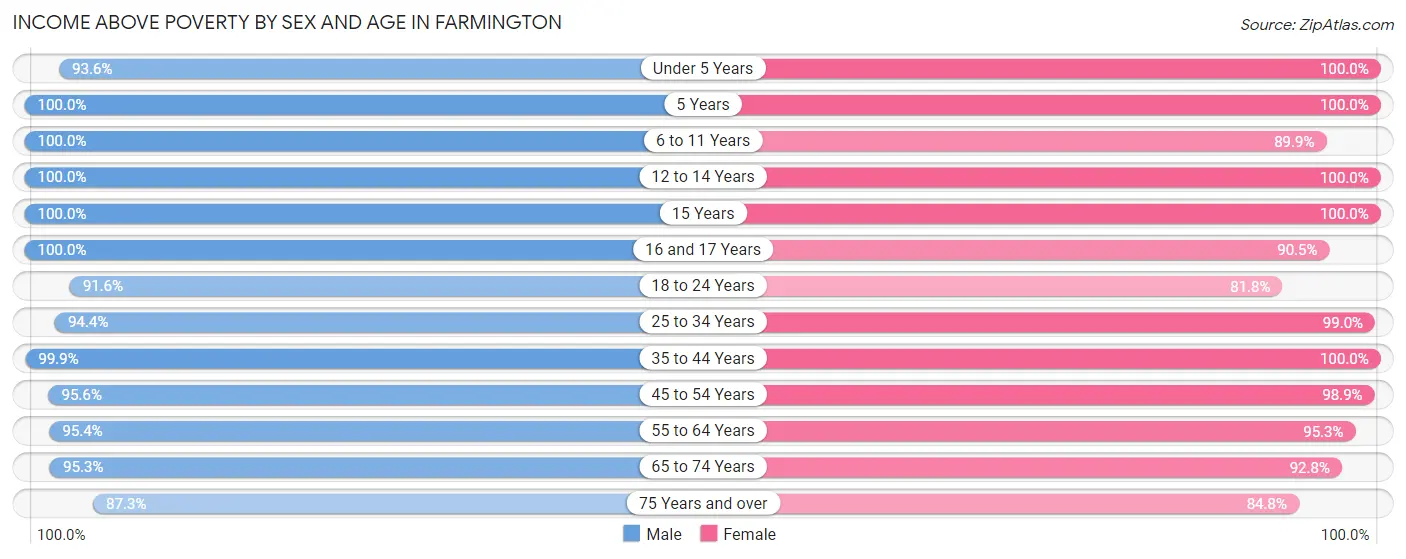
| Age Bracket | Male | Female |
| Under 5 Years | 263 (93.6%) | 375 (100.0%) |
| 5 Years | 79 (100.0%) | 65 (100.0%) |
| 6 to 11 Years | 318 (100.0%) | 294 (89.9%) |
| 12 to 14 Years | 212 (100.0%) | 142 (100.0%) |
| 15 Years | 20 (100.0%) | 19 (100.0%) |
| 16 and 17 Years | 81 (100.0%) | 133 (90.5%) |
| 18 to 24 Years | 327 (91.6%) | 372 (81.8%) |
| 25 to 34 Years | 1,270 (94.4%) | 941 (99.0%) |
| 35 to 44 Years | 761 (99.9%) | 660 (100.0%) |
| 45 to 54 Years | 472 (95.6%) | 609 (98.9%) |
| 55 to 64 Years | 662 (95.4%) | 955 (95.3%) |
| 65 to 74 Years | 483 (95.3%) | 656 (92.8%) |
| 75 Years and over | 261 (87.3%) | 402 (84.8%) |
| Total | 5,209 (95.6%) | 5,623 (94.7%) |
Income Below Poverty Among Married-Couple Families in Farmington
The poverty statistics for married-couple families in Farmington show that 2.1% or 50 of the total 2,367 families live below the poverty line. Families with 3 or 4 children have the highest poverty rate of 8.9%, comprising of 16 families. On the other hand, families with 1 or 2 children have the lowest poverty rate of 0.0%, which includes 0 families.
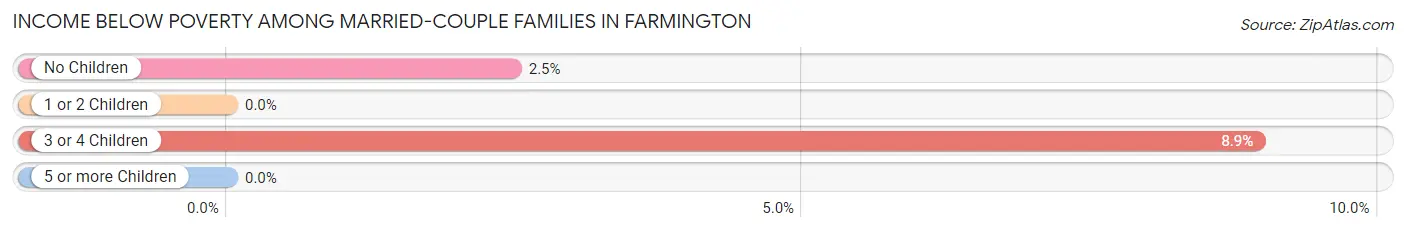
| Children | Above Poverty | Below Poverty |
| No Children | 1,341 (97.5%) | 34 (2.5%) |
| 1 or 2 Children | 776 (100.0%) | 0 (0.0%) |
| 3 or 4 Children | 163 (91.1%) | 16 (8.9%) |
| 5 or more Children | 37 (100.0%) | 0 (0.0%) |
| Total | 2,317 (97.9%) | 50 (2.1%) |
Income Below Poverty Among Single-Parent Households in Farmington
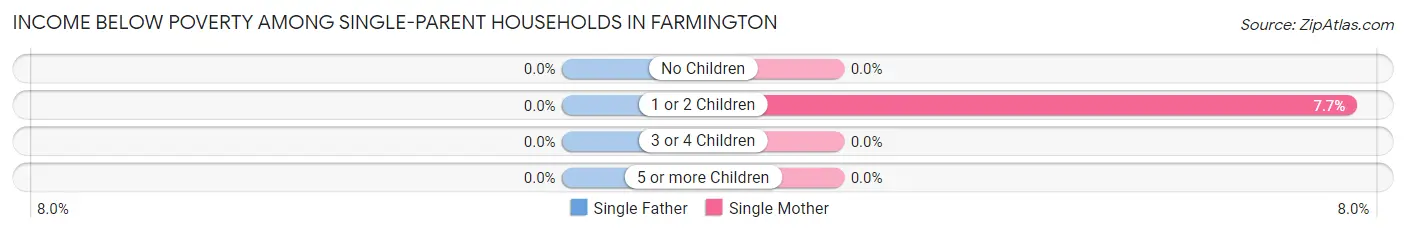
| Children | Single Father | Single Mother |
| No Children | 0 (0.0%) | 0 (0.0%) |
| 1 or 2 Children | 0 (0.0%) | 15 (7.6%) |
| 3 or 4 Children | 0 (0.0%) | 0 (0.0%) |
| 5 or more Children | 0 (0.0%) | 0 (0.0%) |
| Total | 0 (0.0%) | 15 (3.7%) |
Income Below Poverty Among Married-Couple vs Single-Parent Households in Farmington
The poverty data for Farmington shows that 50 of the married-couple family households (2.1%) and 15 of the single-parent households (3.0%) are living below the poverty level. Within the married-couple family households, those with 3 or 4 children have the highest poverty rate, with 16 households (8.9%) falling below the poverty line. Among the single-parent households, those with 1 or 2 children have the highest poverty rate, with 15 household (7.0%) living below poverty.
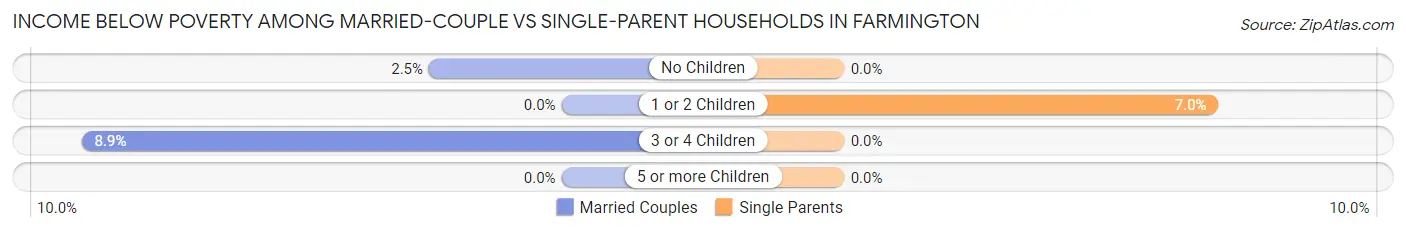
| Children | Married-Couple Families | Single-Parent Households |
| No Children | 34 (2.5%) | 0 (0.0%) |
| 1 or 2 Children | 0 (0.0%) | 15 (7.0%) |
| 3 or 4 Children | 16 (8.9%) | 0 (0.0%) |
| 5 or more Children | 0 (0.0%) | 0 (0.0%) |
| Total | 50 (2.1%) | 15 (3.0%) |
Race in Farmington
The most populous races in Farmington are White / Caucasian (7,489 | 65.2%), Asian (2,136 | 18.6%), and Black / African American (953 | 8.3%).
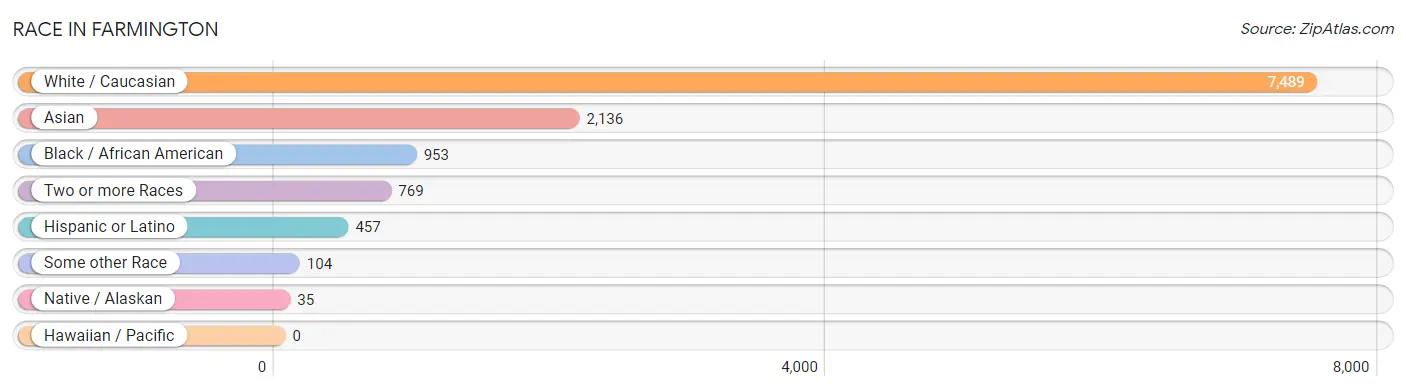
| Race | # Population | % Population |
| Asian | 2,136 | 18.6% |
| Black / African American | 953 | 8.3% |
| Hawaiian / Pacific | 0 | 0.0% |
| Hispanic or Latino | 457 | 4.0% |
| Native / Alaskan | 35 | 0.3% |
| White / Caucasian | 7,489 | 65.2% |
| Two or more Races | 769 | 6.7% |
| Some other Race | 104 | 0.9% |
| Total | 11,486 | 100.0% |
Ancestry in Farmington
The most populous ancestries reported in Farmington are German (2,218 | 19.3%), Thai (1,740 | 15.1%), English (1,454 | 12.7%), Irish (1,411 | 12.3%), and Polish (781 | 6.8%), together accounting for 66.2% of all Farmington residents.
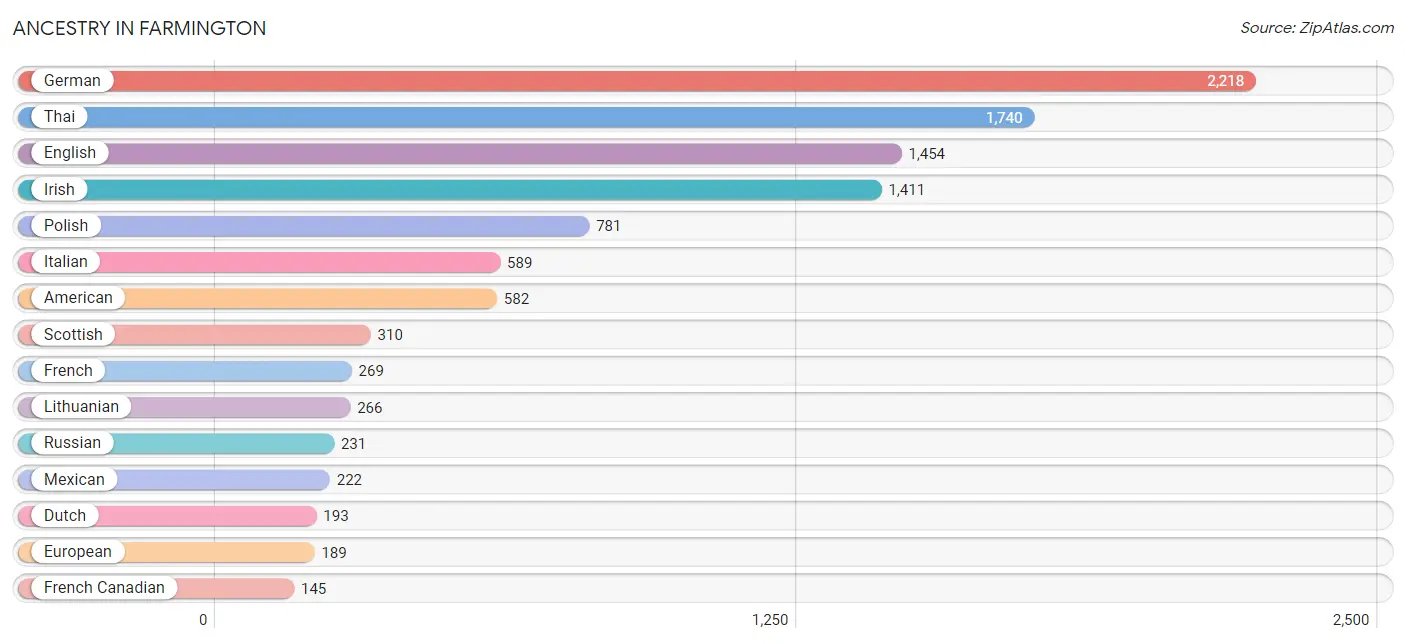
| Ancestry | # Population | % Population |
| Albanian | 19 | 0.2% |
| American | 582 | 5.1% |
| Arab | 117 | 1.0% |
| Armenian | 26 | 0.2% |
| Assyrian / Chaldean / Syriac | 48 | 0.4% |
| Austrian | 58 | 0.5% |
| Belgian | 64 | 0.6% |
| Bhutanese | 138 | 1.2% |
| British | 41 | 0.4% |
| Bulgarian | 81 | 0.7% |
| Burmese | 94 | 0.8% |
| Canadian | 60 | 0.5% |
| Central American | 29 | 0.3% |
| Cherokee | 74 | 0.6% |
| Colombian | 16 | 0.1% |
| Costa Rican | 15 | 0.1% |
| Croatian | 31 | 0.3% |
| Czech | 52 | 0.4% |
| Danish | 60 | 0.5% |
| Dutch | 193 | 1.7% |
| Eastern European | 83 | 0.7% |
| Ecuadorian | 18 | 0.2% |
| English | 1,454 | 12.7% |
| Ethiopian | 10 | 0.1% |
| European | 189 | 1.7% |
| Finnish | 47 | 0.4% |
| French | 269 | 2.3% |
| French Canadian | 145 | 1.3% |
| German | 2,218 | 19.3% |
| Greek | 73 | 0.6% |
| Guatemalan | 14 | 0.1% |
| Hungarian | 49 | 0.4% |
| Indian (Asian) | 132 | 1.1% |
| Irish | 1,411 | 12.3% |
| Italian | 589 | 5.1% |
| Korean | 19 | 0.2% |
| Lebanese | 53 | 0.5% |
| Lithuanian | 266 | 2.3% |
| Macedonian | 14 | 0.1% |
| Maltese | 64 | 0.6% |
| Mexican | 222 | 1.9% |
| Mongolian | 13 | 0.1% |
| Native Hawaiian | 9 | 0.1% |
| Northern European | 6 | 0.1% |
| Norwegian | 54 | 0.5% |
| Pakistani | 20 | 0.2% |
| Polish | 781 | 6.8% |
| Portuguese | 6 | 0.1% |
| Puerto Rican | 45 | 0.4% |
| Romanian | 121 | 1.1% |
| Russian | 231 | 2.0% |
| Scandinavian | 21 | 0.2% |
| Scotch-Irish | 48 | 0.4% |
| Scottish | 310 | 2.7% |
| Serbian | 59 | 0.5% |
| Slovak | 8 | 0.1% |
| Slovene | 9 | 0.1% |
| South American | 34 | 0.3% |
| Spanish | 33 | 0.3% |
| Sri Lankan | 11 | 0.1% |
| Subsaharan African | 10 | 0.1% |
| Swedish | 104 | 0.9% |
| Swiss | 14 | 0.1% |
| Thai | 1,740 | 15.1% |
| Ukrainian | 63 | 0.5% |
| Welsh | 61 | 0.5% | View All 66 Rows |
Immigrants in Farmington
The most numerous immigrant groups reported in Farmington came from Asia (1,690 | 14.7%), South Central Asia (1,517 | 13.2%), India (1,484 | 12.9%), Europe (298 | 2.6%), and Eastern Europe (219 | 1.9%), together accounting for 45.3% of all Farmington residents.
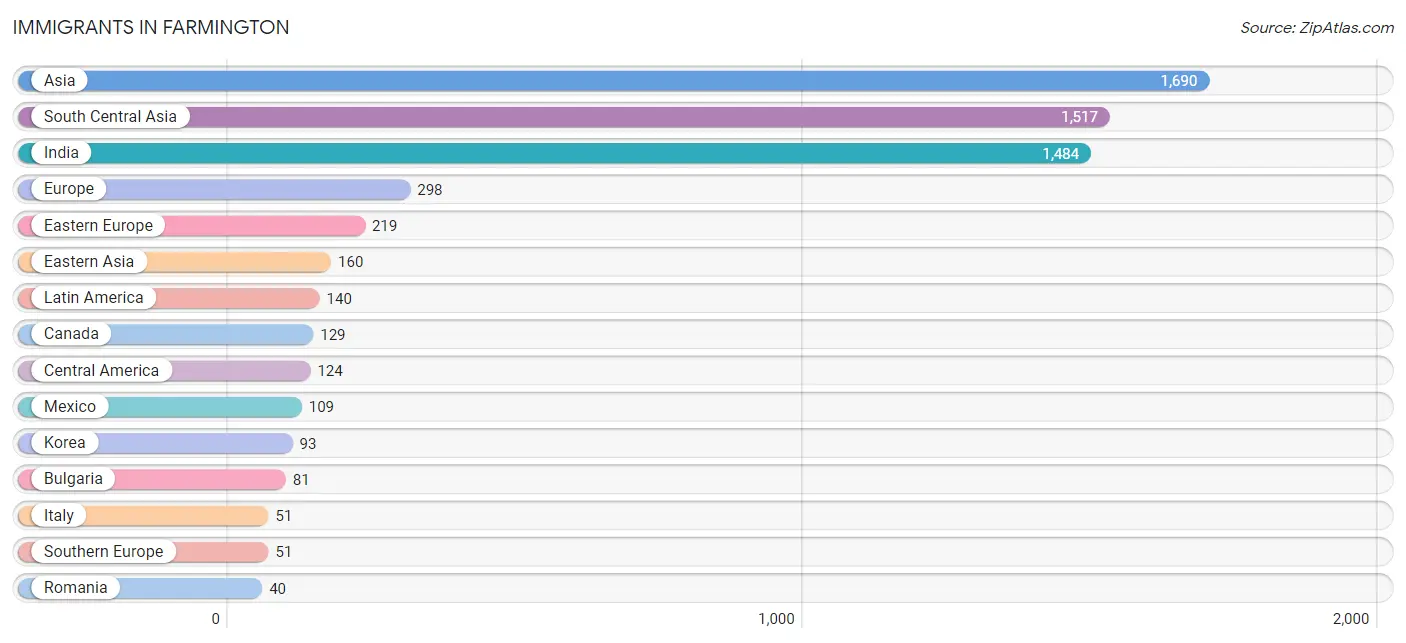
| Immigration Origin | # Population | % Population |
| Africa | 14 | 0.1% |
| Albania | 19 | 0.2% |
| Asia | 1,690 | 14.7% |
| Bulgaria | 81 | 0.7% |
| Canada | 129 | 1.1% |
| Central America | 124 | 1.1% |
| China | 34 | 0.3% |
| Colombia | 16 | 0.1% |
| Costa Rica | 15 | 0.1% |
| Eastern Asia | 160 | 1.4% |
| Eastern Europe | 219 | 1.9% |
| Europe | 298 | 2.6% |
| Germany | 13 | 0.1% |
| India | 1,484 | 12.9% |
| Italy | 51 | 0.4% |
| Japan | 33 | 0.3% |
| Korea | 93 | 0.8% |
| Latin America | 140 | 1.2% |
| Malaysia | 13 | 0.1% |
| Mexico | 109 | 0.9% |
| Northern Africa | 14 | 0.1% |
| Northern Europe | 15 | 0.1% |
| Pakistan | 32 | 0.3% |
| Poland | 28 | 0.2% |
| Romania | 40 | 0.4% |
| Russia | 20 | 0.2% |
| South America | 16 | 0.1% |
| South Central Asia | 1,517 | 13.2% |
| South Eastern Asia | 13 | 0.1% |
| Southern Europe | 51 | 0.4% |
| Sri Lanka | 1 | 0.0% |
| Western Europe | 13 | 0.1% | View All 32 Rows |
Sex and Age in Farmington
Sex and Age in Farmington
The most populous age groups in Farmington are 30 to 34 Years (832 | 15.2%) for men and 55 to 59 Years (560 | 9.3%) for women.
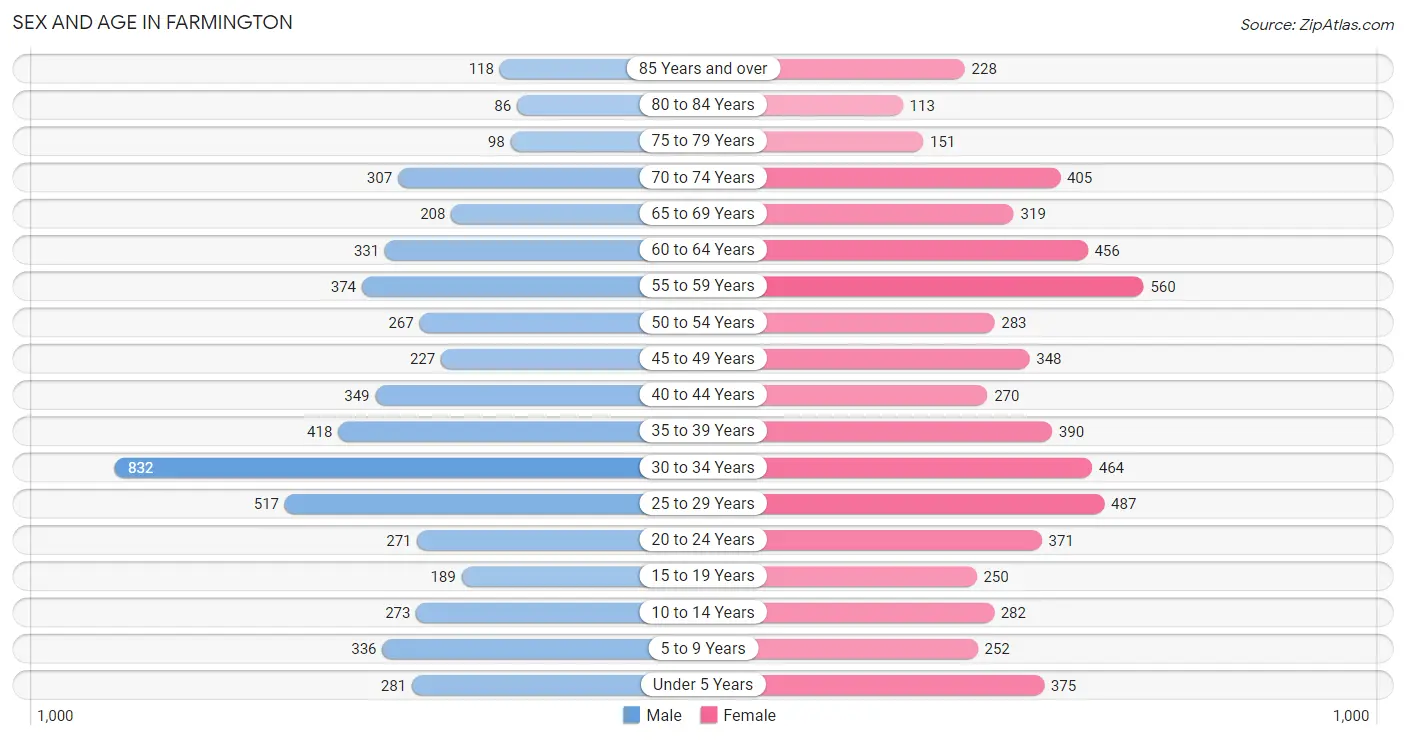
| Age Bracket | Male | Female |
| Under 5 Years | 281 (5.1%) | 375 (6.2%) |
| 5 to 9 Years | 336 (6.1%) | 252 (4.2%) |
| 10 to 14 Years | 273 (5.0%) | 282 (4.7%) |
| 15 to 19 Years | 189 (3.5%) | 250 (4.2%) |
| 20 to 24 Years | 271 (4.9%) | 371 (6.2%) |
| 25 to 29 Years | 517 (9.4%) | 487 (8.1%) |
| 30 to 34 Years | 832 (15.2%) | 464 (7.7%) |
| 35 to 39 Years | 418 (7.6%) | 390 (6.5%) |
| 40 to 44 Years | 349 (6.4%) | 270 (4.5%) |
| 45 to 49 Years | 227 (4.1%) | 348 (5.8%) |
| 50 to 54 Years | 267 (4.9%) | 283 (4.7%) |
| 55 to 59 Years | 374 (6.8%) | 560 (9.3%) |
| 60 to 64 Years | 331 (6.0%) | 456 (7.6%) |
| 65 to 69 Years | 208 (3.8%) | 319 (5.3%) |
| 70 to 74 Years | 307 (5.6%) | 405 (6.8%) |
| 75 to 79 Years | 98 (1.8%) | 151 (2.5%) |
| 80 to 84 Years | 86 (1.6%) | 113 (1.9%) |
| 85 Years and over | 118 (2.1%) | 228 (3.8%) |
| Total | 5,482 (100.0%) | 6,004 (100.0%) |
Families and Households in Farmington
Median Family Size in Farmington
The median family size in Farmington is 2.91 persons per family, with married-couple families (2,367 | 82.5%) accounting for the largest median family size of 3 persons per family. On the other hand, single male/father families (99 | 3.5%) represent the smallest median family size with 2.47 persons per family.
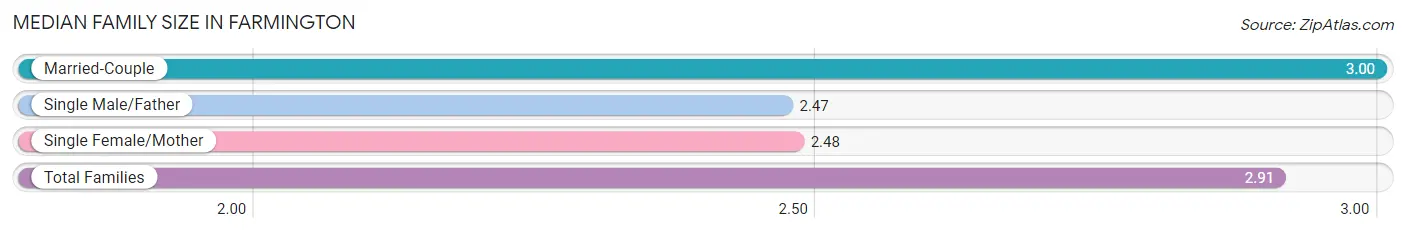
| Family Type | # Families | Family Size |
| Married-Couple | 2,367 (82.5%) | 3.00 |
| Single Male/Father | 99 (3.5%) | 2.47 |
| Single Female/Mother | 402 (14.0%) | 2.48 |
| Total Families | 2,868 (100.0%) | 2.91 |
Median Household Size in Farmington
The median household size in Farmington is 2.18 persons per household, with married-couple households (2,367 | 45.5%) accounting for the largest median household size of 3.01 persons per household. non-family households (2,339 | 44.9%) represent the smallest median household size with 1.26 persons per household.
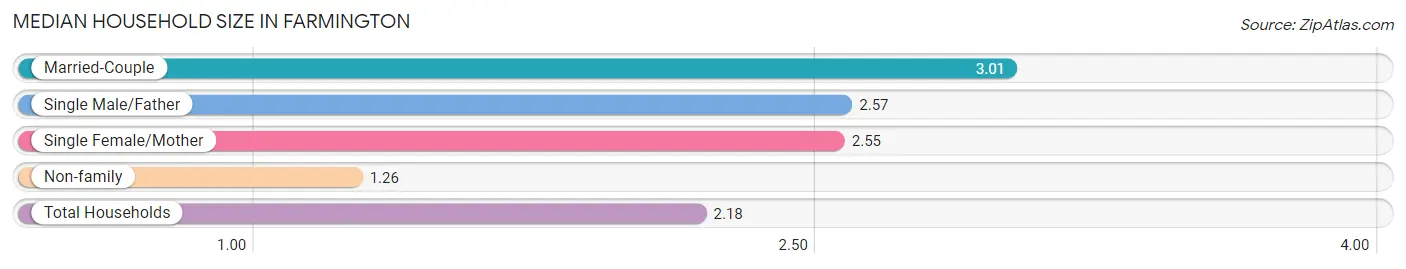
| Household Type | # Households | Household Size |
| Married-Couple | 2,367 (45.5%) | 3.01 |
| Single Male/Father | 99 (1.9%) | 2.57 |
| Single Female/Mother | 402 (7.7%) | 2.55 |
| Non-family | 2,339 (44.9%) | 1.26 |
| Total Households | 5,207 (100.0%) | 2.18 |
Household Size by Marriage Status in Farmington
Out of a total of 5,207 households in Farmington, 2,868 (55.1%) are family households, while 2,339 (44.9%) are nonfamily households. The most numerous type of family households are 2-person households, comprising 1,503, and the most common type of nonfamily households are 1-person households, comprising 1,816.
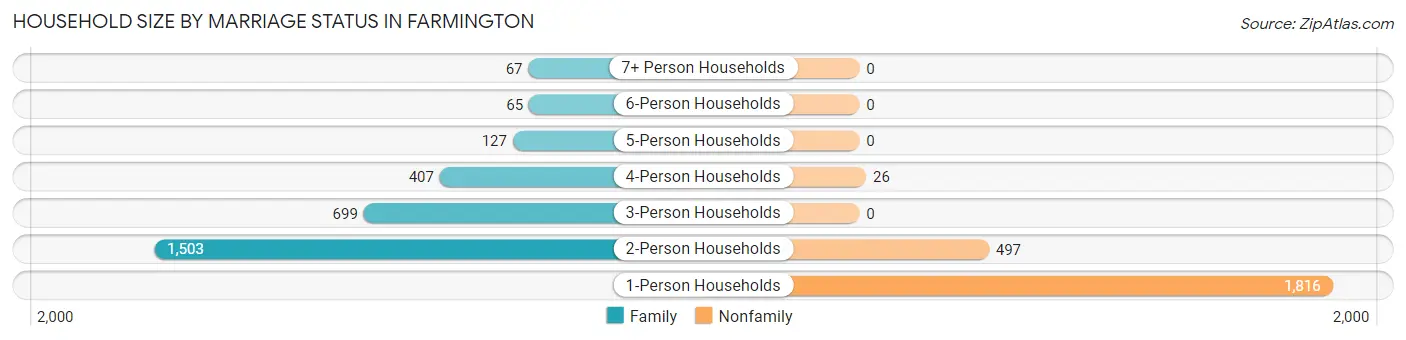
| Household Size | Family Households | Nonfamily Households |
| 1-Person Households | - | 1,816 (34.9%) |
| 2-Person Households | 1,503 (28.9%) | 497 (9.5%) |
| 3-Person Households | 699 (13.4%) | 0 (0.0%) |
| 4-Person Households | 407 (7.8%) | 26 (0.5%) |
| 5-Person Households | 127 (2.4%) | 0 (0.0%) |
| 6-Person Households | 65 (1.3%) | 0 (0.0%) |
| 7+ Person Households | 67 (1.3%) | 0 (0.0%) |
| Total | 2,868 (55.1%) | 2,339 (44.9%) |
Female Fertility in Farmington
Fertility by Age in Farmington
Average fertility rate in Farmington is 47.0 births per 1,000 women. Women in the age bracket of 20 to 34 years have the highest fertility rate with 57.0 births per 1,000 women. Women in the age bracket of 20 to 34 years acount for 61.3% of all women with births.
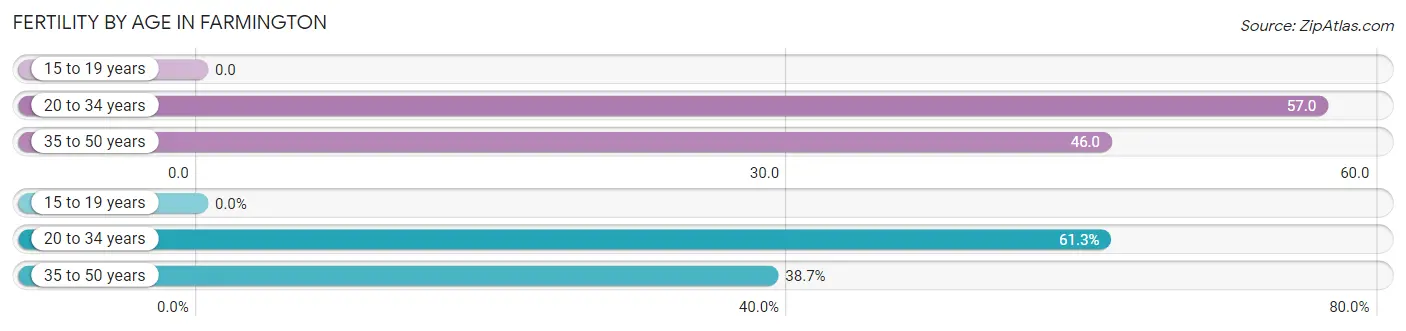
| Age Bracket | Women with Births | Births / 1,000 Women |
| 15 to 19 years | 0 (0.0%) | 0.0 |
| 20 to 34 years | 76 (61.3%) | 57.0 |
| 35 to 50 years | 48 (38.7%) | 46.0 |
| Total | 124 (100.0%) | 47.0 |
Fertility by Age by Marriage Status in Farmington
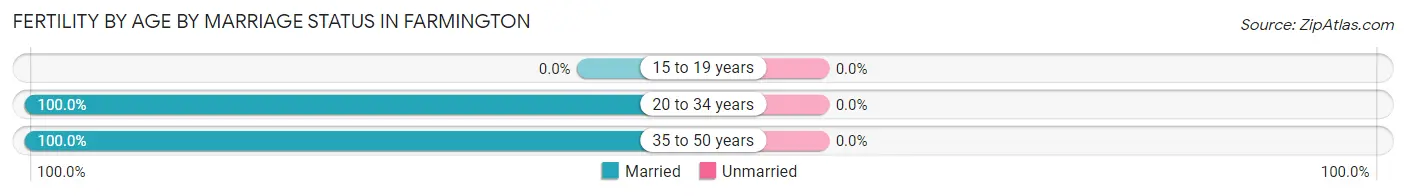
| Age Bracket | Married | Unmarried |
| 15 to 19 years | 0 (0.0%) | 0 (0.0%) |
| 20 to 34 years | 76 (100.0%) | 0 (0.0%) |
| 35 to 50 years | 48 (100.0%) | 0 (0.0%) |
| Total | 124 (100.0%) | 0 (0.0%) |
Fertility by Education in Farmington
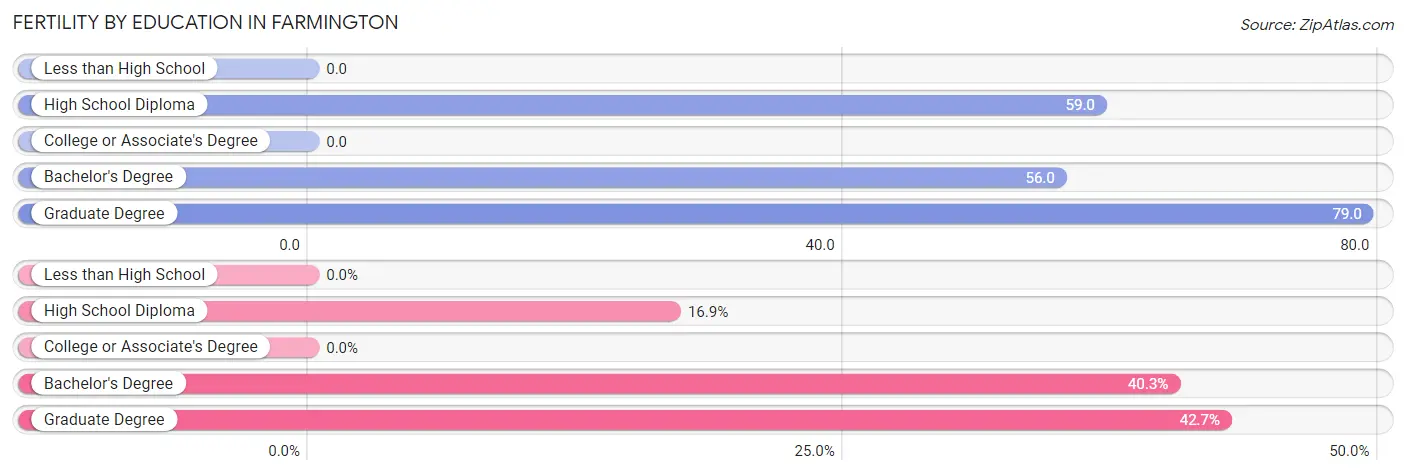
| Educational Attainment | Women with Births | Births / 1,000 Women |
| Less than High School | 0 (0.0%) | 0.0 |
| High School Diploma | 21 (16.9%) | 59.0 |
| College or Associate's Degree | 0 (0.0%) | 0.0 |
| Bachelor's Degree | 50 (40.3%) | 56.0 |
| Graduate Degree | 53 (42.7%) | 79.0 |
| Total | 124 (100.0%) | 47.0 |
Fertility by Education by Marriage Status in Farmington
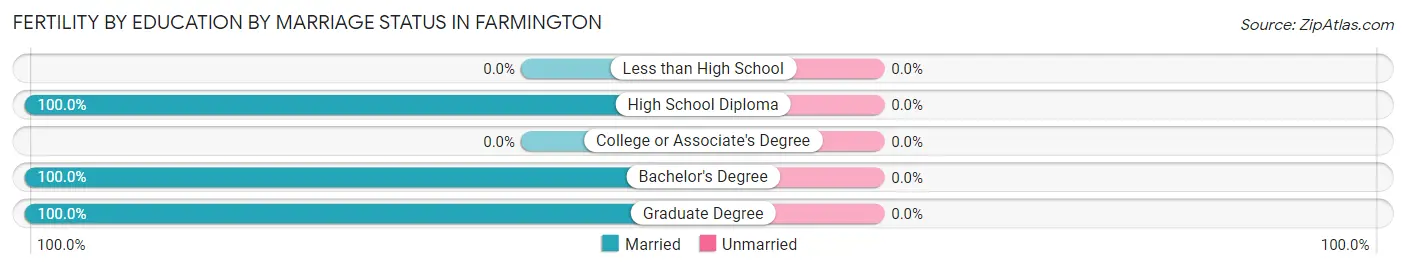
| Educational Attainment | Married | Unmarried |
| Less than High School | 0 (0.0%) | 0 (0.0%) |
| High School Diploma | 21 (100.0%) | 0 (0.0%) |
| College or Associate's Degree | 0 (0.0%) | 0 (0.0%) |
| Bachelor's Degree | 50 (100.0%) | 0 (0.0%) |
| Graduate Degree | 53 (100.0%) | 0 (0.0%) |
| Total | 124 (100.0%) | 0 (0.0%) |
Employment Characteristics in Farmington
Employment by Class of Employer in Farmington
Among the 6,254 employed individuals in Farmington, private company employees (4,680 | 74.8%), not-for-profit organizations (529 | 8.5%), and local government employees (249 | 4.0%) make up the most common classes of employment.
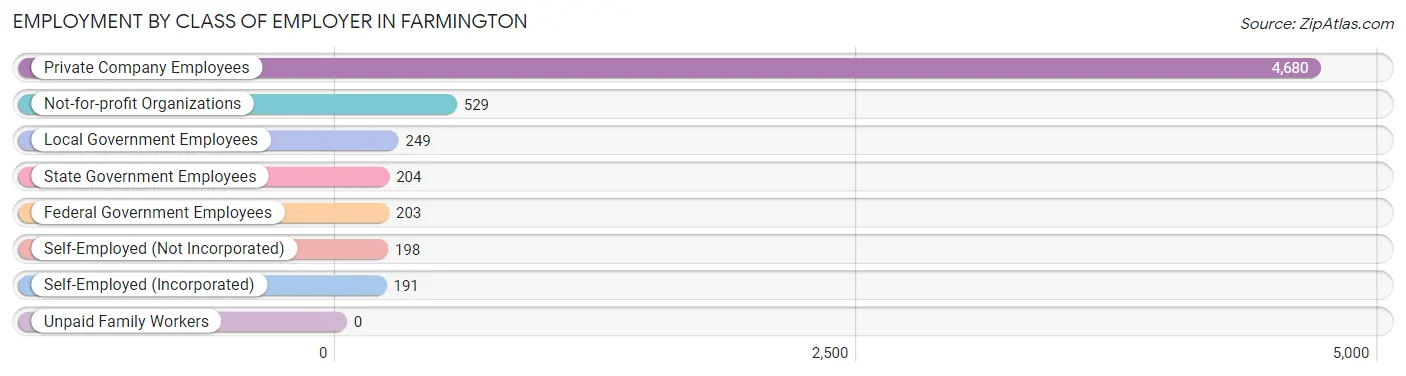
| Employer Class | # Employees | % Employees |
| Private Company Employees | 4,680 | 74.8% |
| Self-Employed (Incorporated) | 191 | 3.0% |
| Self-Employed (Not Incorporated) | 198 | 3.2% |
| Not-for-profit Organizations | 529 | 8.5% |
| Local Government Employees | 249 | 4.0% |
| State Government Employees | 204 | 3.3% |
| Federal Government Employees | 203 | 3.3% |
| Unpaid Family Workers | 0 | 0.0% |
| Total | 6,254 | 100.0% |
Employment Status by Age in Farmington
According to the labor force statistics for Farmington, out of the total population over 16 years of age (9,648), 67.6% or 6,522 individuals are in the labor force, with 3.0% or 196 of them unemployed. The age group with the highest labor force participation rate is 35 to 44 years, with 90.0% or 1,284 individuals in the labor force. Within the labor force, the 16 to 19 years age range has the highest percentage of unemployed individuals, with 35.8% or 39 of them being unemployed.
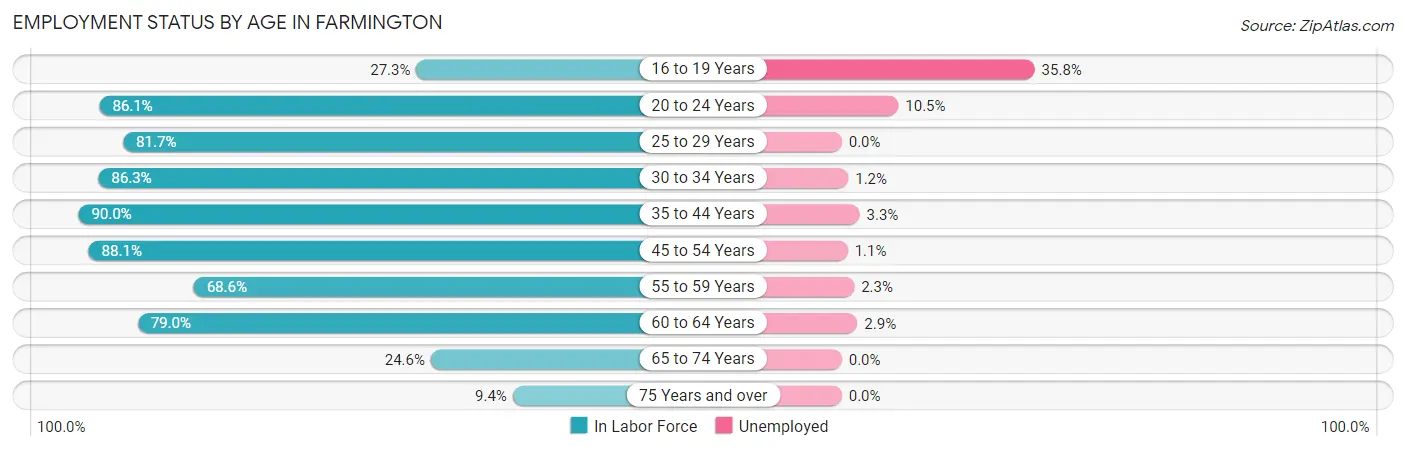
| Age Bracket | In Labor Force | Unemployed |
| 16 to 19 Years | 109 (27.3%) | 39 (35.8%) |
| 20 to 24 Years | 553 (86.1%) | 58 (10.5%) |
| 25 to 29 Years | 820 (81.7%) | 0 (0.0%) |
| 30 to 34 Years | 1,118 (86.3%) | 13 (1.2%) |
| 35 to 44 Years | 1,284 (90.0%) | 42 (3.3%) |
| 45 to 54 Years | 991 (88.1%) | 11 (1.1%) |
| 55 to 59 Years | 641 (68.6%) | 15 (2.3%) |
| 60 to 64 Years | 622 (79.0%) | 18 (2.9%) |
| 65 to 74 Years | 305 (24.6%) | 0 (0.0%) |
| 75 Years and over | 75 (9.4%) | 0 (0.0%) |
| Total | 6,522 (67.6%) | 196 (3.0%) |
Employment Status by Educational Attainment in Farmington
According to labor force statistics for Farmington, 83.3% of individuals (5,475) out of the total population between 25 and 64 years of age (6,573) are in the labor force, with 1.8% or 99 of them being unemployed. The group with the highest labor force participation rate are those with the educational attainment of college / associate degree, with 87.4% or 1,355 individuals in the labor force. Within the labor force, individuals with less than high school education have the highest percentage of unemployment, with 17.9% or 10 of them being unemployed.
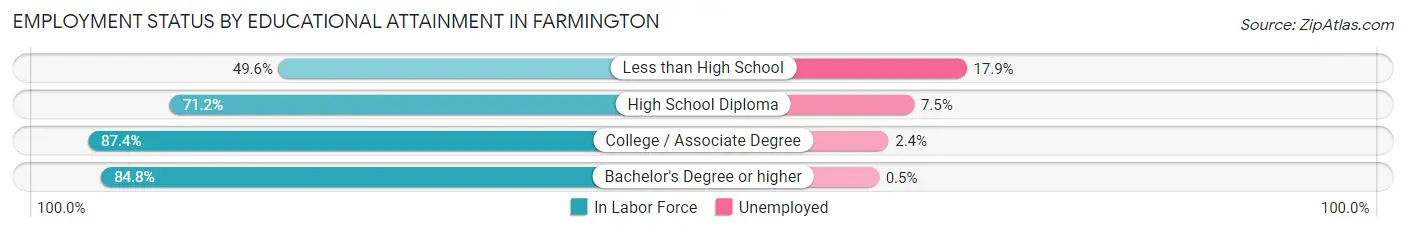
| Educational Attainment | In Labor Force | Unemployed |
| Less than High School | 56 (49.6%) | 20 (17.9%) |
| High School Diploma | 507 (71.2%) | 53 (7.5%) |
| College / Associate Degree | 1,355 (87.4%) | 37 (2.4%) |
| Bachelor's Degree or higher | 3,560 (84.8%) | 21 (0.5%) |
| Total | 5,475 (83.3%) | 118 (1.8%) |
Employment Occupations by Sex in Farmington
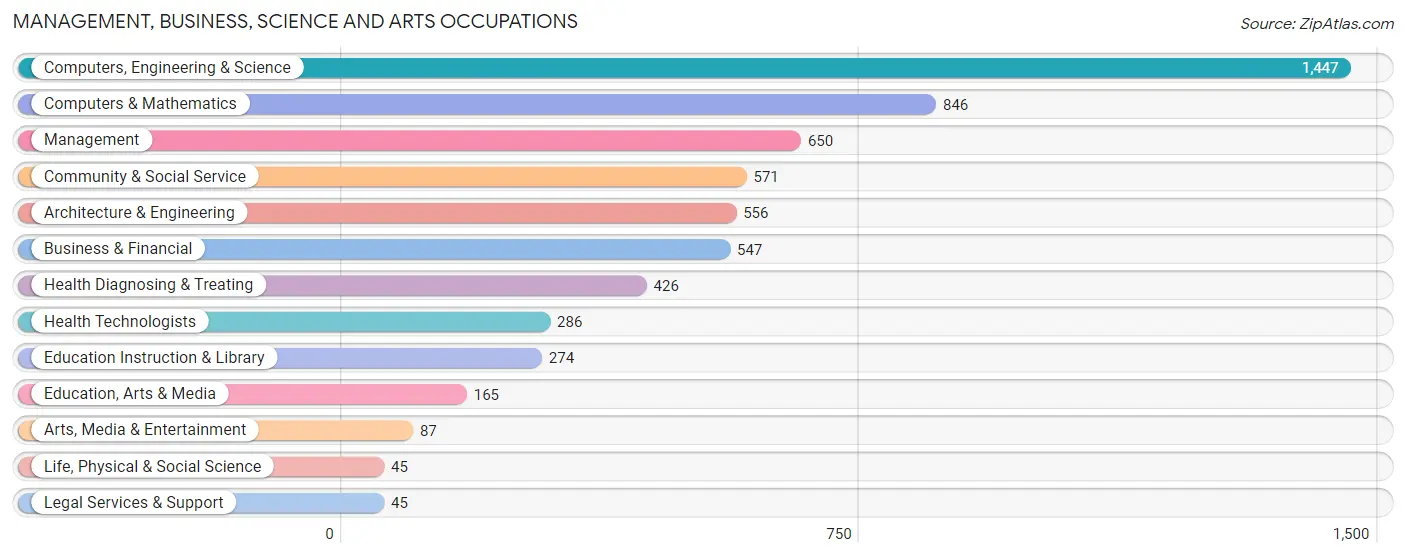
Management, Business, Science and Arts Occupations
The most common Management, Business, Science and Arts occupations in Farmington are Computers, Engineering & Science (1,447 | 22.9%), Computers & Mathematics (846 | 13.4%), Management (650 | 10.3%), Community & Social Service (571 | 9.0%), and Architecture & Engineering (556 | 8.8%).
Management, Business, Science and Arts Occupations by Sex
Within the Management, Business, Science and Arts occupations in Farmington, the most male-oriented occupations are Computers & Mathematics (84.3%), Computers, Engineering & Science (82.9%), and Architecture & Engineering (82.6%), while the most female-oriented occupations are Health Technologists (95.5%), Health Diagnosing & Treating (80.0%), and Legal Services & Support (77.8%).
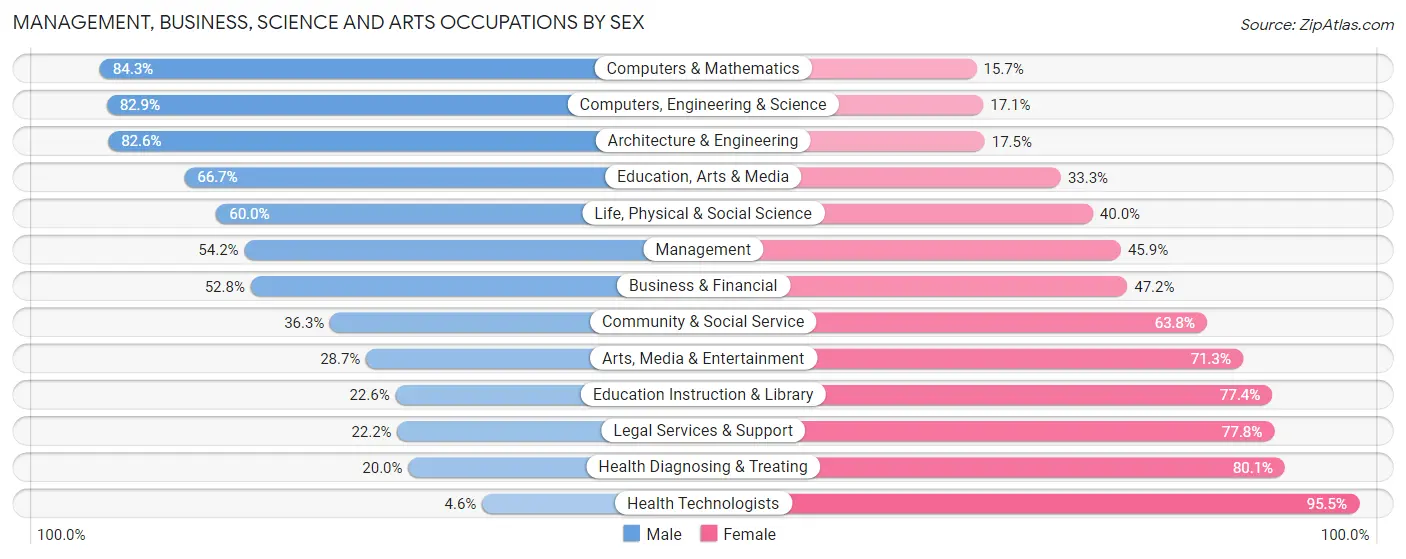
| Occupation | Male | Female |
| Management | 352 (54.1%) | 298 (45.9%) |
| Business & Financial | 289 (52.8%) | 258 (47.2%) |
| Computers, Engineering & Science | 1,199 (82.9%) | 248 (17.1%) |
| Computers & Mathematics | 713 (84.3%) | 133 (15.7%) |
| Architecture & Engineering | 459 (82.6%) | 97 (17.4%) |
| Life, Physical & Social Science | 27 (60.0%) | 18 (40.0%) |
| Community & Social Service | 207 (36.2%) | 364 (63.7%) |
| Education, Arts & Media | 110 (66.7%) | 55 (33.3%) |
| Legal Services & Support | 10 (22.2%) | 35 (77.8%) |
| Education Instruction & Library | 62 (22.6%) | 212 (77.4%) |
| Arts, Media & Entertainment | 25 (28.7%) | 62 (71.3%) |
| Health Diagnosing & Treating | 85 (20.0%) | 341 (80.0%) |
| Health Technologists | 13 (4.5%) | 273 (95.5%) |
| Total (Category) | 2,132 (58.6%) | 1,509 (41.4%) |
| Total (Overall) | 3,325 (52.6%) | 2,997 (47.4%) |
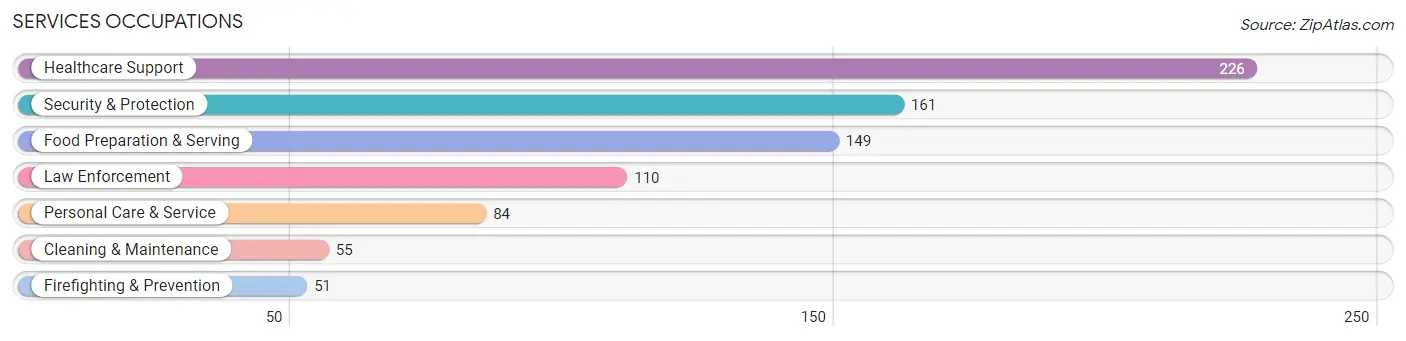
Services Occupations
The most common Services occupations in Farmington are Healthcare Support (226 | 3.6%), Security & Protection (161 | 2.5%), Food Preparation & Serving (149 | 2.4%), Law Enforcement (110 | 1.7%), and Personal Care & Service (84 | 1.3%).
Services Occupations by Sex
Within the Services occupations in Farmington, the most male-oriented occupations are Firefighting & Prevention (68.6%), Security & Protection (67.7%), and Law Enforcement (67.3%), while the most female-oriented occupations are Healthcare Support (100.0%), Personal Care & Service (86.9%), and Food Preparation & Serving (73.2%).
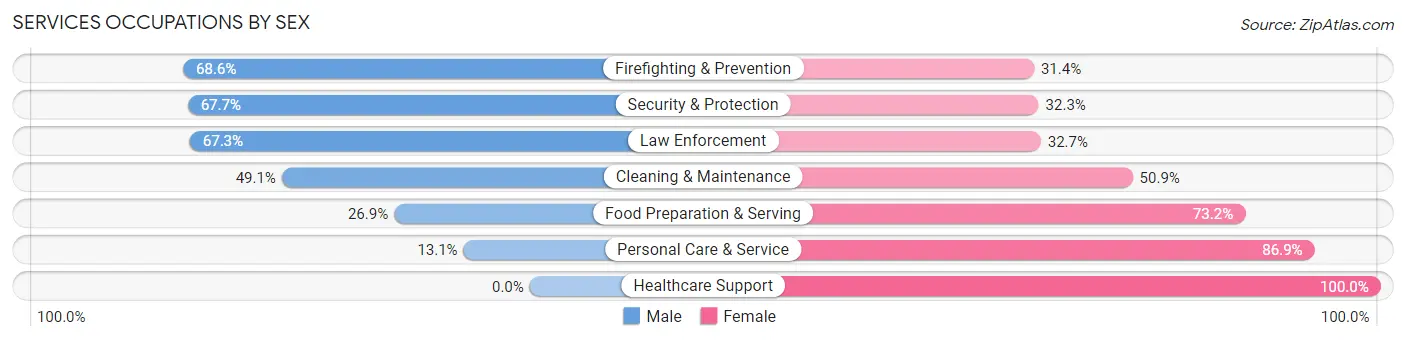
| Occupation | Male | Female |
| Healthcare Support | 0 (0.0%) | 226 (100.0%) |
| Security & Protection | 109 (67.7%) | 52 (32.3%) |
| Firefighting & Prevention | 35 (68.6%) | 16 (31.4%) |
| Law Enforcement | 74 (67.3%) | 36 (32.7%) |
| Food Preparation & Serving | 40 (26.9%) | 109 (73.2%) |
| Cleaning & Maintenance | 27 (49.1%) | 28 (50.9%) |
| Personal Care & Service | 11 (13.1%) | 73 (86.9%) |
| Total (Category) | 187 (27.7%) | 488 (72.3%) |
| Total (Overall) | 3,325 (52.6%) | 2,997 (47.4%) |
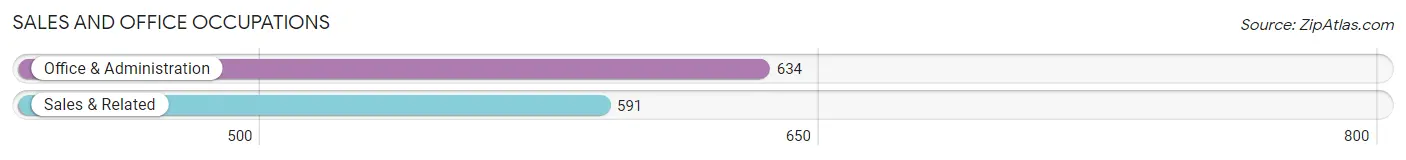
Sales and Office Occupations
The most common Sales and Office occupations in Farmington are Office & Administration (634 | 10.0%), and Sales & Related (591 | 9.3%).
Sales and Office Occupations by Sex
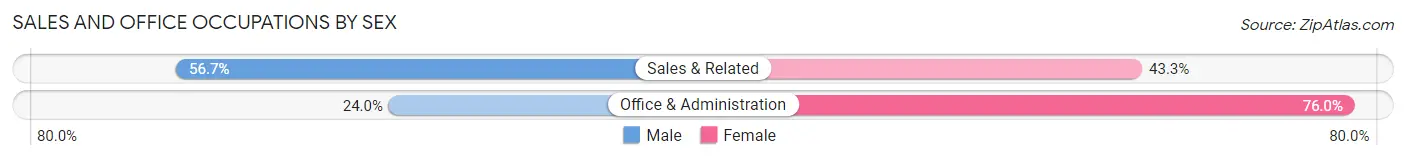
| Occupation | Male | Female |
| Sales & Related | 335 (56.7%) | 256 (43.3%) |
| Office & Administration | 152 (24.0%) | 482 (76.0%) |
| Total (Category) | 487 (39.8%) | 738 (60.2%) |
| Total (Overall) | 3,325 (52.6%) | 2,997 (47.4%) |
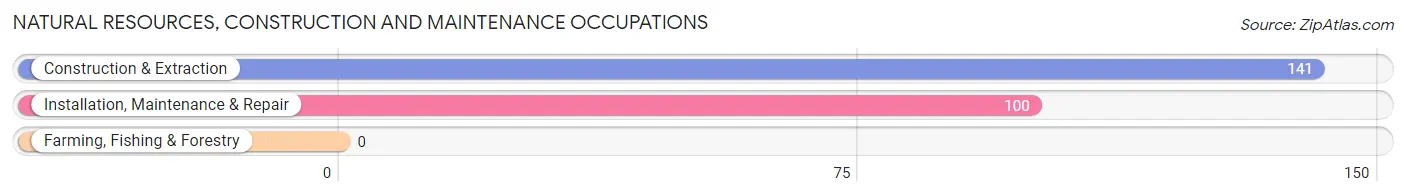
Natural Resources, Construction and Maintenance Occupations
The most common Natural Resources, Construction and Maintenance occupations in Farmington are Construction & Extraction (141 | 2.2%), and Installation, Maintenance & Repair (100 | 1.6%).
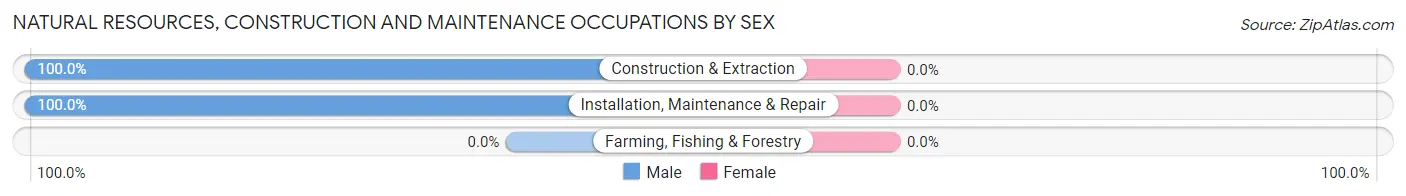
Natural Resources, Construction and Maintenance Occupations by Sex
| Occupation | Male | Female |
| Farming, Fishing & Forestry | 0 (0.0%) | 0 (0.0%) |
| Construction & Extraction | 141 (100.0%) | 0 (0.0%) |
| Installation, Maintenance & Repair | 100 (100.0%) | 0 (0.0%) |
| Total (Category) | 241 (100.0%) | 0 (0.0%) |
| Total (Overall) | 3,325 (52.6%) | 2,997 (47.4%) |
Production, Transportation and Moving Occupations
The most common Production, Transportation and Moving occupations in Farmington are Production (318 | 5.0%), Transportation (149 | 2.4%), and Material Moving (73 | 1.1%).
Production, Transportation and Moving Occupations by Sex
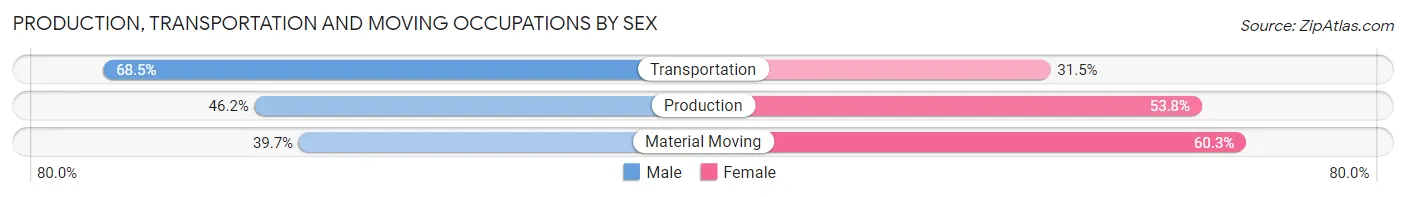
| Occupation | Male | Female |
| Production | 147 (46.2%) | 171 (53.8%) |
| Transportation | 102 (68.5%) | 47 (31.5%) |
| Material Moving | 29 (39.7%) | 44 (60.3%) |
| Total (Category) | 278 (51.5%) | 262 (48.5%) |
| Total (Overall) | 3,325 (52.6%) | 2,997 (47.4%) |
Employment Industries by Sex in Farmington
Employment Industries in Farmington
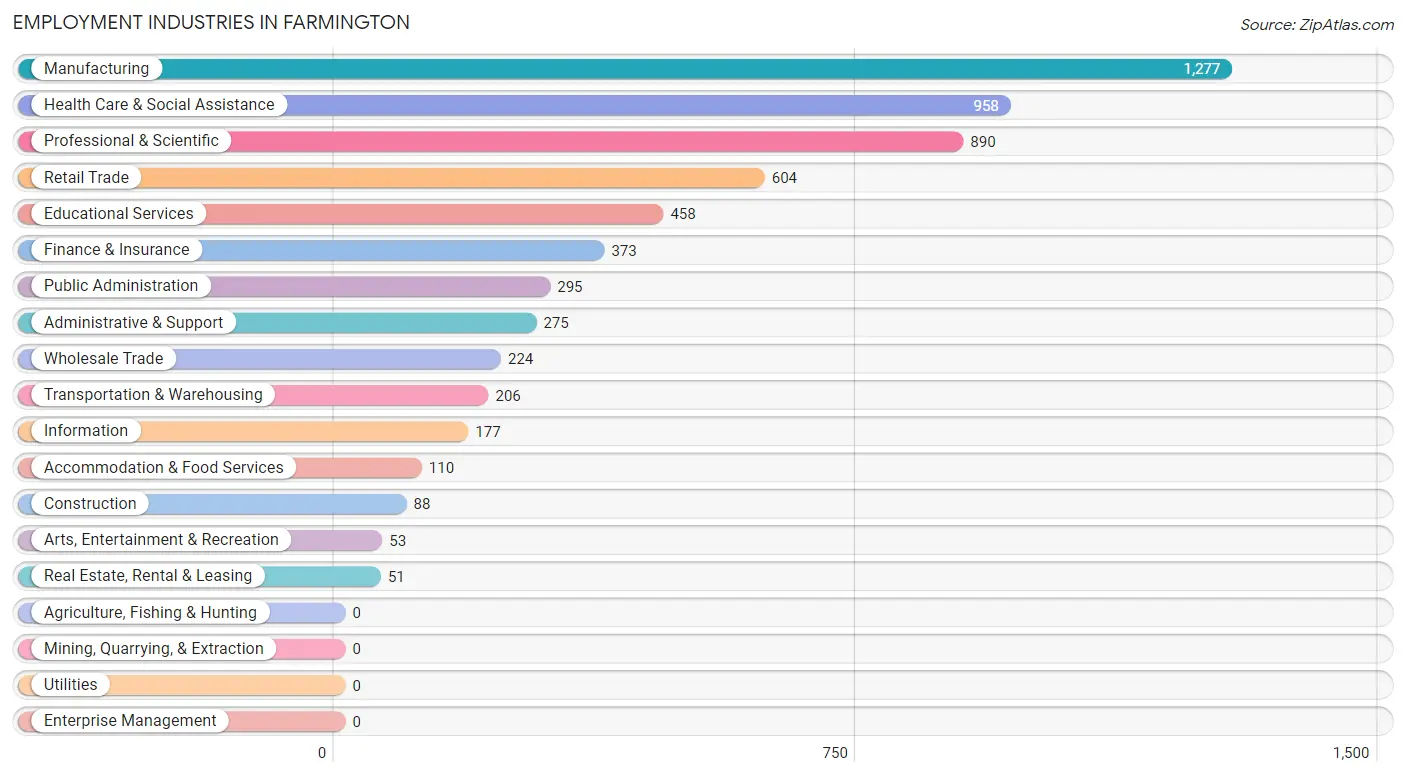
The major employment industries in Farmington include Manufacturing (1,277 | 20.2%), Health Care & Social Assistance (958 | 15.1%), Professional & Scientific (890 | 14.1%), Retail Trade (604 | 9.6%), and Educational Services (458 | 7.2%).
Employment Industries by Sex in Farmington
The Farmington industries that see more men than women are Construction (100.0%), Information (76.3%), and Manufacturing (73.1%), whereas the industries that tend to have a higher number of women are Health Care & Social Assistance (83.7%), Educational Services (75.5%), and Public Administration (59.7%).
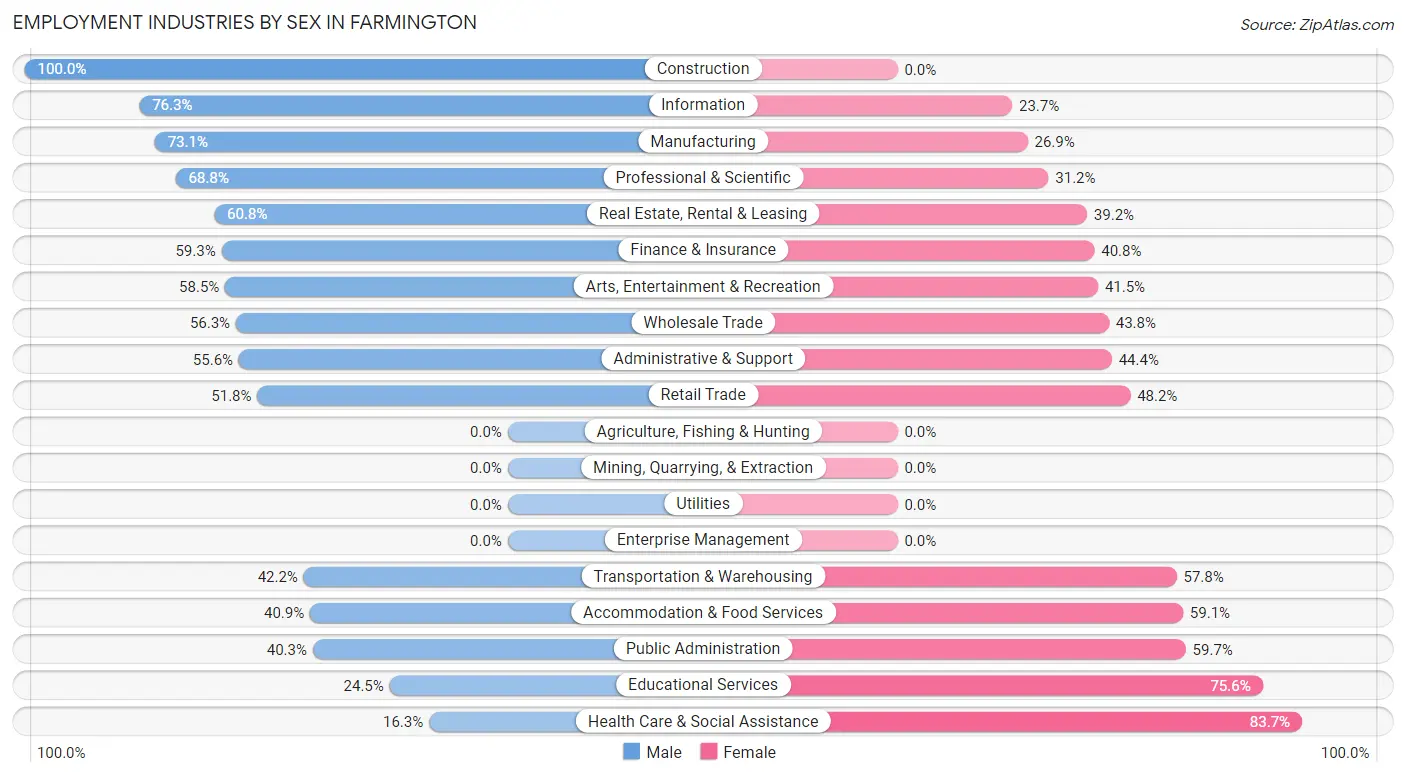
| Industry | Male | Female |
| Agriculture, Fishing & Hunting | 0 (0.0%) | 0 (0.0%) |
| Mining, Quarrying, & Extraction | 0 (0.0%) | 0 (0.0%) |
| Construction | 88 (100.0%) | 0 (0.0%) |
| Manufacturing | 933 (73.1%) | 344 (26.9%) |
| Wholesale Trade | 126 (56.2%) | 98 (43.8%) |
| Retail Trade | 313 (51.8%) | 291 (48.2%) |
| Transportation & Warehousing | 87 (42.2%) | 119 (57.8%) |
| Utilities | 0 (0.0%) | 0 (0.0%) |
| Information | 135 (76.3%) | 42 (23.7%) |
| Finance & Insurance | 221 (59.3%) | 152 (40.7%) |
| Real Estate, Rental & Leasing | 31 (60.8%) | 20 (39.2%) |
| Professional & Scientific | 612 (68.8%) | 278 (31.2%) |
| Enterprise Management | 0 (0.0%) | 0 (0.0%) |
| Administrative & Support | 153 (55.6%) | 122 (44.4%) |
| Educational Services | 112 (24.4%) | 346 (75.5%) |
| Health Care & Social Assistance | 156 (16.3%) | 802 (83.7%) |
| Arts, Entertainment & Recreation | 31 (58.5%) | 22 (41.5%) |
| Accommodation & Food Services | 45 (40.9%) | 65 (59.1%) |
| Public Administration | 119 (40.3%) | 176 (59.7%) |
| Total | 3,325 (52.6%) | 2,997 (47.4%) |
Education in Farmington
School Enrollment in Farmington
The most common levels of schooling among the 2,180 students in Farmington are college / undergraduate (477 | 21.9%), middle school (466 | 21.4%), and elementary school (410 | 18.8%).
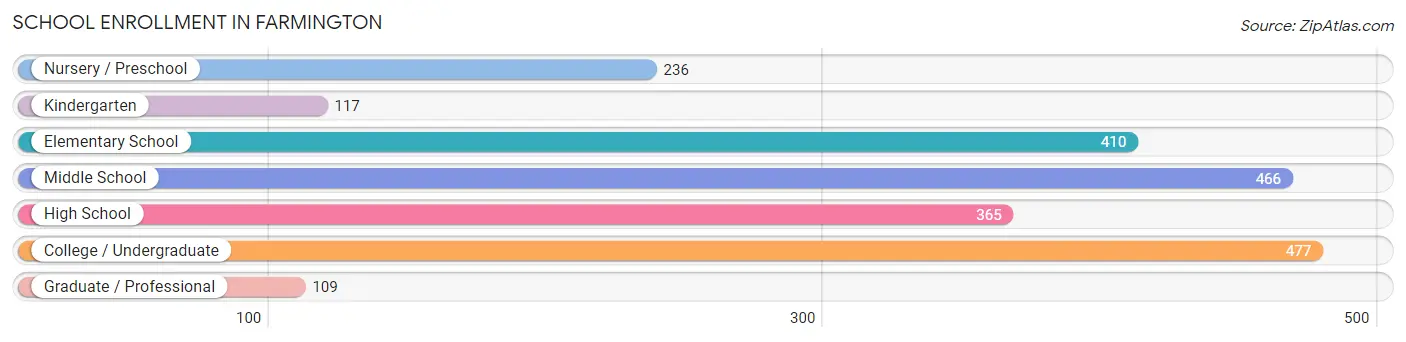
| School Level | # Students | % Students |
| Nursery / Preschool | 236 | 10.8% |
| Kindergarten | 117 | 5.4% |
| Elementary School | 410 | 18.8% |
| Middle School | 466 | 21.4% |
| High School | 365 | 16.7% |
| College / Undergraduate | 477 | 21.9% |
| Graduate / Professional | 109 | 5.0% |
| Total | 2,180 | 100.0% |
School Enrollment by Age by Funding Source in Farmington
Out of a total of 2,180 students who are enrolled in schools in Farmington, 554 (25.4%) attend a private institution, while the remaining 1,626 (74.6%) are enrolled in public schools. The age group of 3 to 4 year olds has the highest likelihood of being enrolled in private schools, with 204 (100.0% in the age bracket) enrolled. Conversely, the age group of 10 to 14 year olds has the lowest likelihood of being enrolled in a private school, with 545 (98.2% in the age bracket) attending a public institution.
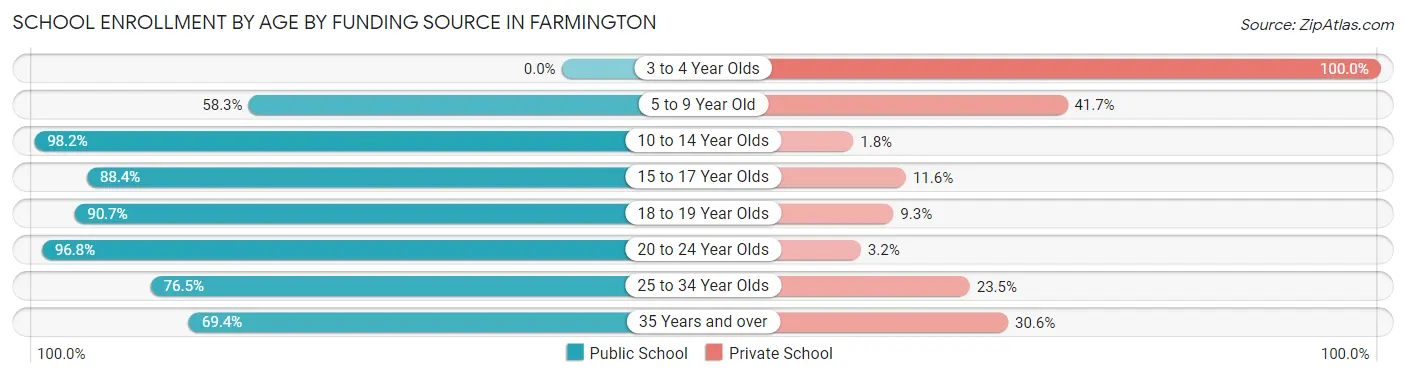
| Age Bracket | Public School | Private School |
| 3 to 4 Year Olds | 0 (0.0%) | 204 (100.0%) |
| 5 to 9 Year Old | 326 (58.3%) | 233 (41.7%) |
| 10 to 14 Year Olds | 545 (98.2%) | 10 (1.8%) |
| 15 to 17 Year Olds | 236 (88.4%) | 31 (11.6%) |
| 18 to 19 Year Olds | 147 (90.7%) | 15 (9.3%) |
| 20 to 24 Year Olds | 211 (96.8%) | 7 (3.2%) |
| 25 to 34 Year Olds | 127 (76.5%) | 39 (23.5%) |
| 35 Years and over | 34 (69.4%) | 15 (30.6%) |
| Total | 1,626 (74.6%) | 554 (25.4%) |
Educational Attainment by Field of Study in Farmington
Engineering (1,236 | 21.8%), business (979 | 17.2%), education (632 | 11.1%), science & technology (551 | 9.7%), and computers & mathematics (447 | 7.9%) are the most common fields of study among 5,675 individuals in Farmington who have obtained a bachelor's degree or higher.
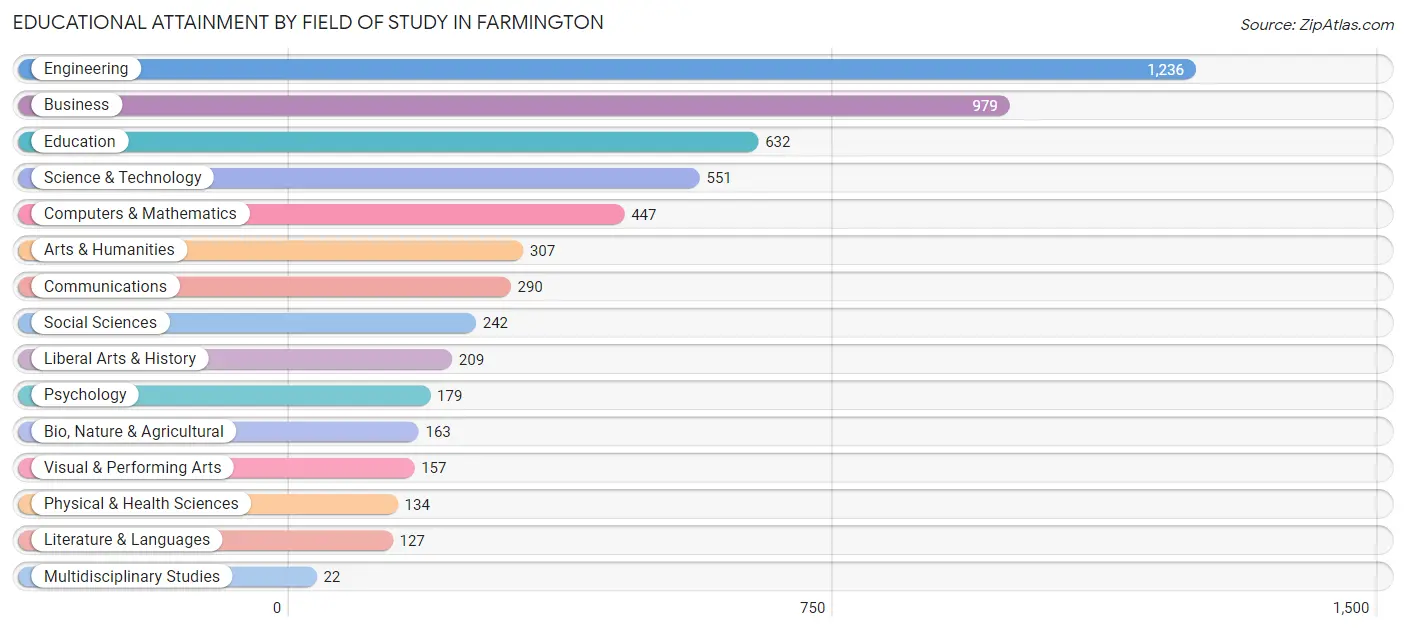
| Field of Study | # Graduates | % Graduates |
| Computers & Mathematics | 447 | 7.9% |
| Bio, Nature & Agricultural | 163 | 2.9% |
| Physical & Health Sciences | 134 | 2.4% |
| Psychology | 179 | 3.2% |
| Social Sciences | 242 | 4.3% |
| Engineering | 1,236 | 21.8% |
| Multidisciplinary Studies | 22 | 0.4% |
| Science & Technology | 551 | 9.7% |
| Business | 979 | 17.2% |
| Education | 632 | 11.1% |
| Literature & Languages | 127 | 2.2% |
| Liberal Arts & History | 209 | 3.7% |
| Visual & Performing Arts | 157 | 2.8% |
| Communications | 290 | 5.1% |
| Arts & Humanities | 307 | 5.4% |
| Total | 5,675 | 100.0% |
Transportation & Commute in Farmington
Vehicle Availability by Sex in Farmington
The most prevalent vehicle ownership categories in Farmington are males with 2 vehicles (1,286, accounting for 38.7%) and females with 2 vehicles (1,183, making up 43.9%).
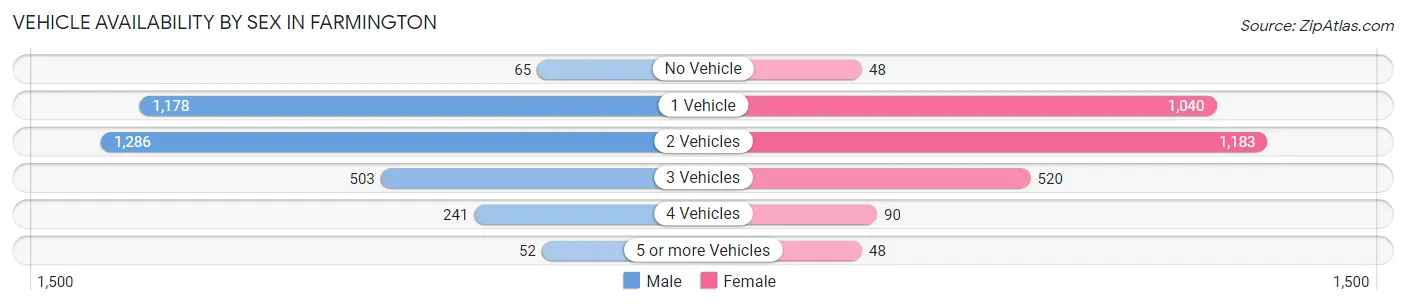
| Vehicles Available | Male | Female |
| No Vehicle | 65 (1.9%) | 48 (1.6%) |
| 1 Vehicle | 1,178 (35.4%) | 1,040 (35.5%) |
| 2 Vehicles | 1,286 (38.7%) | 1,183 (40.4%) |
| 3 Vehicles | 503 (15.1%) | 520 (17.7%) |
| 4 Vehicles | 241 (7.2%) | 90 (3.1%) |
| 5 or more Vehicles | 52 (1.6%) | 48 (1.6%) |
| Total | 3,325 (100.0%) | 2,929 (100.0%) |
Commute Time in Farmington
The most frequently occuring commute durations in Farmington are 10 to 14 minutes (745 commuters, 14.6%), 30 to 34 minutes (743 commuters, 14.6%), and 15 to 19 minutes (736 commuters, 14.5%).
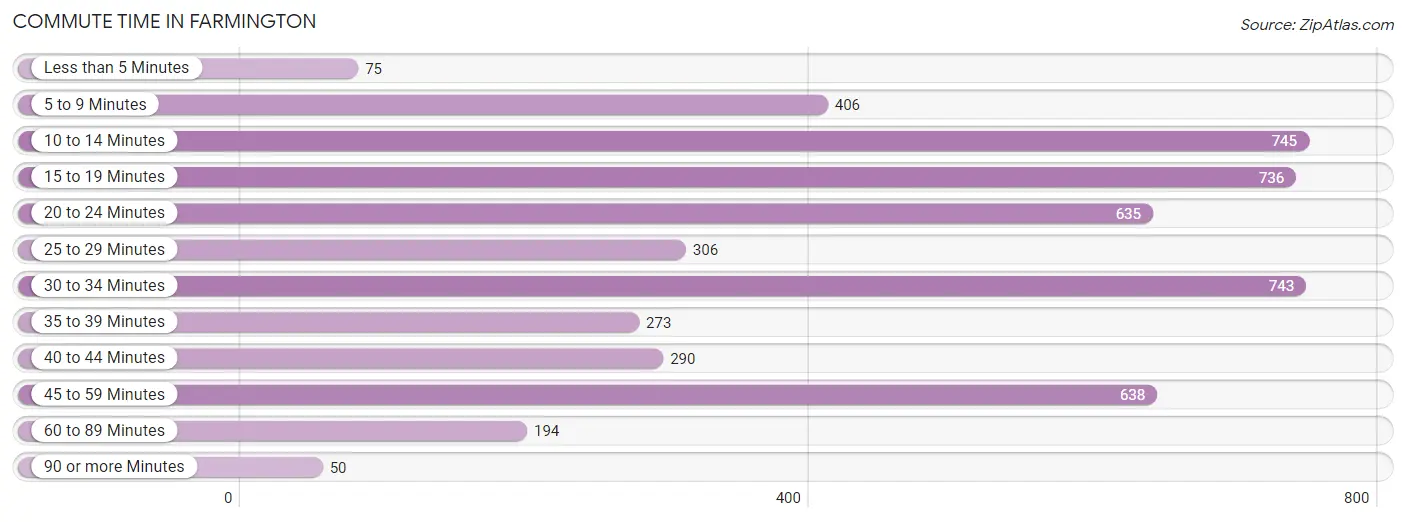
| Commute Time | # Commuters | % Commuters |
| Less than 5 Minutes | 75 | 1.5% |
| 5 to 9 Minutes | 406 | 8.0% |
| 10 to 14 Minutes | 745 | 14.6% |
| 15 to 19 Minutes | 736 | 14.5% |
| 20 to 24 Minutes | 635 | 12.5% |
| 25 to 29 Minutes | 306 | 6.0% |
| 30 to 34 Minutes | 743 | 14.6% |
| 35 to 39 Minutes | 273 | 5.4% |
| 40 to 44 Minutes | 290 | 5.7% |
| 45 to 59 Minutes | 638 | 12.5% |
| 60 to 89 Minutes | 194 | 3.8% |
| 90 or more Minutes | 50 | 1.0% |
Commute Time by Sex in Farmington
The most common commute times in Farmington are 20 to 24 minutes (416 commuters, 15.7%) for males and 10 to 14 minutes (432 commuters, 17.7%) for females.
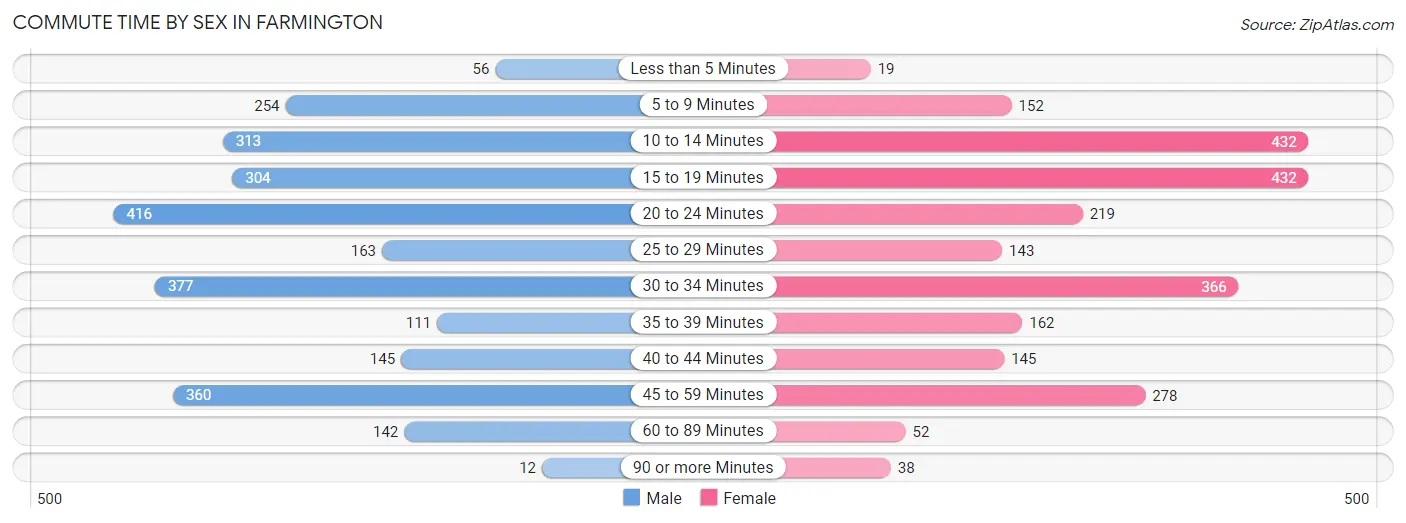
| Commute Time | Male | Female |
| Less than 5 Minutes | 56 (2.1%) | 19 (0.8%) |
| 5 to 9 Minutes | 254 (9.6%) | 152 (6.2%) |
| 10 to 14 Minutes | 313 (11.8%) | 432 (17.7%) |
| 15 to 19 Minutes | 304 (11.5%) | 432 (17.7%) |
| 20 to 24 Minutes | 416 (15.7%) | 219 (9.0%) |
| 25 to 29 Minutes | 163 (6.1%) | 143 (5.9%) |
| 30 to 34 Minutes | 377 (14.2%) | 366 (15.0%) |
| 35 to 39 Minutes | 111 (4.2%) | 162 (6.6%) |
| 40 to 44 Minutes | 145 (5.5%) | 145 (5.9%) |
| 45 to 59 Minutes | 360 (13.6%) | 278 (11.4%) |
| 60 to 89 Minutes | 142 (5.3%) | 52 (2.1%) |
| 90 or more Minutes | 12 (0.4%) | 38 (1.6%) |
Time of Departure to Work by Sex in Farmington
The most frequent times of departure to work in Farmington are 8:00 AM to 8:29 AM (632, 23.8%) for males and 8:00 AM to 8:29 AM (441, 18.1%) for females.
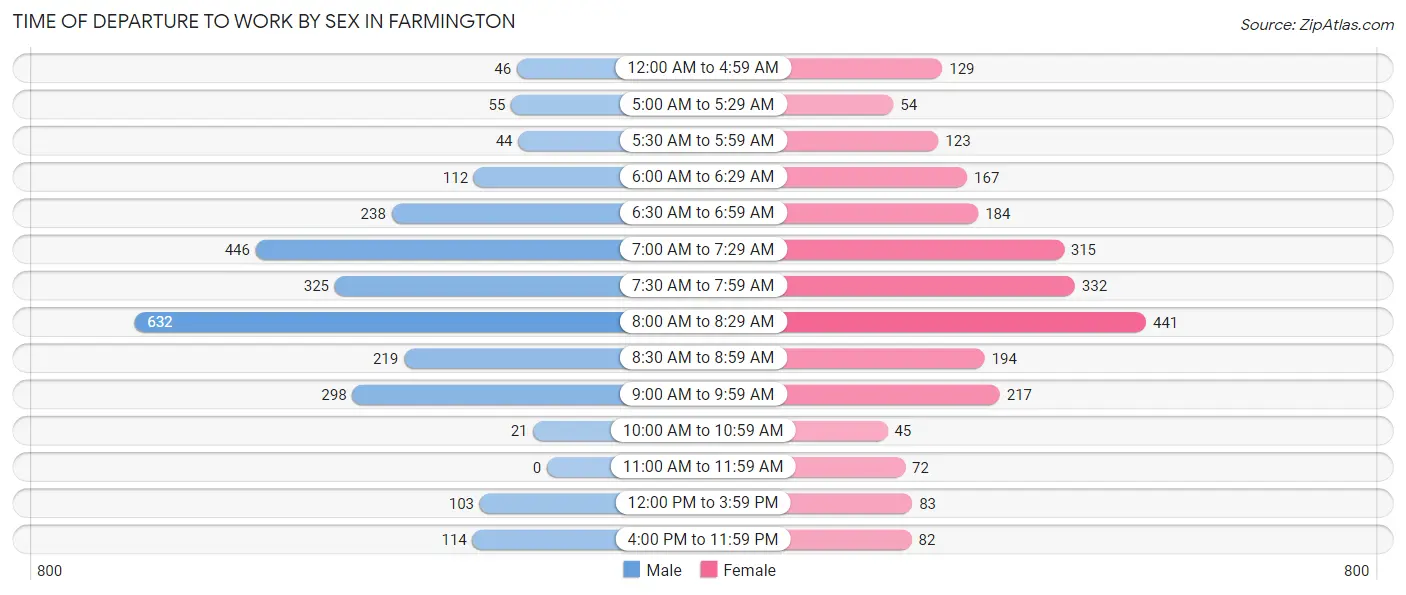
| Time of Departure | Male | Female |
| 12:00 AM to 4:59 AM | 46 (1.7%) | 129 (5.3%) |
| 5:00 AM to 5:29 AM | 55 (2.1%) | 54 (2.2%) |
| 5:30 AM to 5:59 AM | 44 (1.7%) | 123 (5.1%) |
| 6:00 AM to 6:29 AM | 112 (4.2%) | 167 (6.9%) |
| 6:30 AM to 6:59 AM | 238 (9.0%) | 184 (7.5%) |
| 7:00 AM to 7:29 AM | 446 (16.8%) | 315 (12.9%) |
| 7:30 AM to 7:59 AM | 325 (12.2%) | 332 (13.6%) |
| 8:00 AM to 8:29 AM | 632 (23.8%) | 441 (18.1%) |
| 8:30 AM to 8:59 AM | 219 (8.3%) | 194 (8.0%) |
| 9:00 AM to 9:59 AM | 298 (11.2%) | 217 (8.9%) |
| 10:00 AM to 10:59 AM | 21 (0.8%) | 45 (1.8%) |
| 11:00 AM to 11:59 AM | 0 (0.0%) | 72 (2.9%) |
| 12:00 PM to 3:59 PM | 103 (3.9%) | 83 (3.4%) |
| 4:00 PM to 11:59 PM | 114 (4.3%) | 82 (3.4%) |
| Total | 2,653 (100.0%) | 2,438 (100.0%) |
Housing Occupancy in Farmington
Occupancy by Ownership in Farmington
Of the total 5,207 dwellings in Farmington, owner-occupied units account for 3,306 (63.5%), while renter-occupied units make up 1,901 (36.5%).
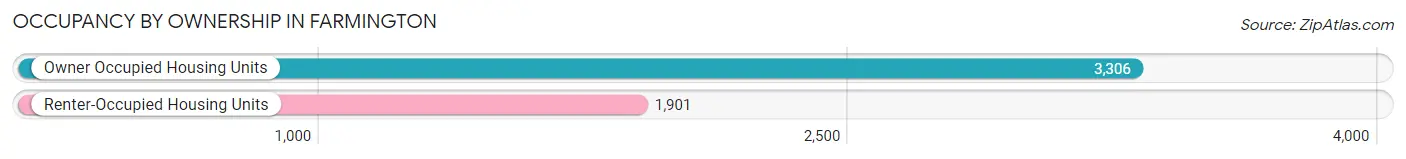
| Occupancy | # Housing Units | % Housing Units |
| Owner Occupied Housing Units | 3,306 | 63.5% |
| Renter-Occupied Housing Units | 1,901 | 36.5% |
| Total Occupied Housing Units | 5,207 | 100.0% |
Occupancy by Household Size in Farmington
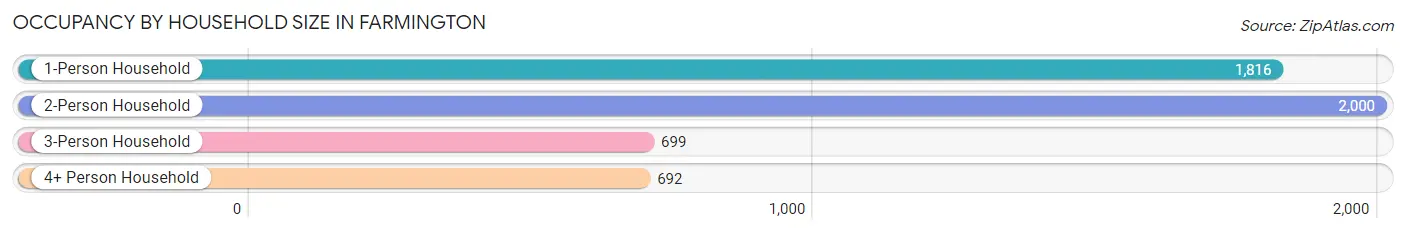
| Household Size | # Housing Units | % Housing Units |
| 1-Person Household | 1,816 | 34.9% |
| 2-Person Household | 2,000 | 38.4% |
| 3-Person Household | 699 | 13.4% |
| 4+ Person Household | 692 | 13.3% |
| Total Housing Units | 5,207 | 100.0% |
Occupancy by Ownership by Household Size in Farmington
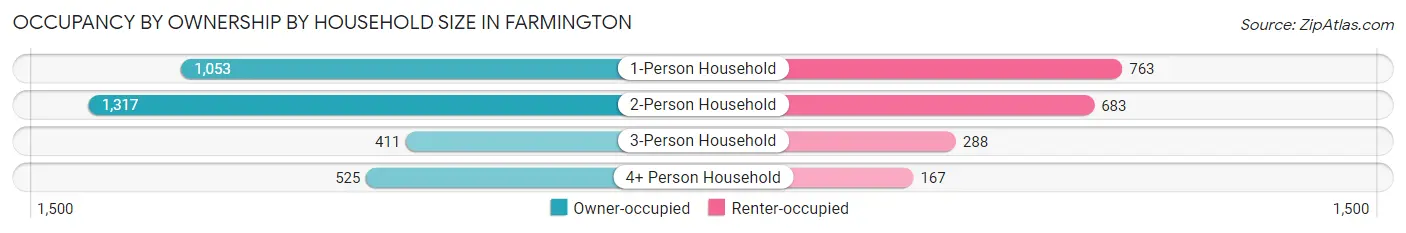
| Household Size | Owner-occupied | Renter-occupied |
| 1-Person Household | 1,053 (58.0%) | 763 (42.0%) |
| 2-Person Household | 1,317 (65.8%) | 683 (34.2%) |
| 3-Person Household | 411 (58.8%) | 288 (41.2%) |
| 4+ Person Household | 525 (75.9%) | 167 (24.1%) |
| Total Housing Units | 3,306 (63.5%) | 1,901 (36.5%) |
Occupancy by Educational Attainment in Farmington
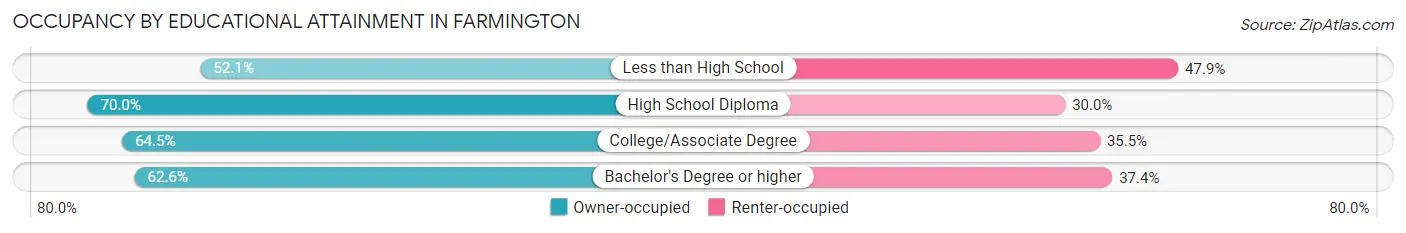
| Household Size | Owner-occupied | Renter-occupied |
| Less than High School | 62 (52.1%) | 57 (47.9%) |
| High School Diploma | 334 (70.0%) | 143 (30.0%) |
| College/Associate Degree | 836 (64.5%) | 460 (35.5%) |
| Bachelor's Degree or higher | 2,074 (62.6%) | 1,241 (37.4%) |
Occupancy by Age of Householder in Farmington
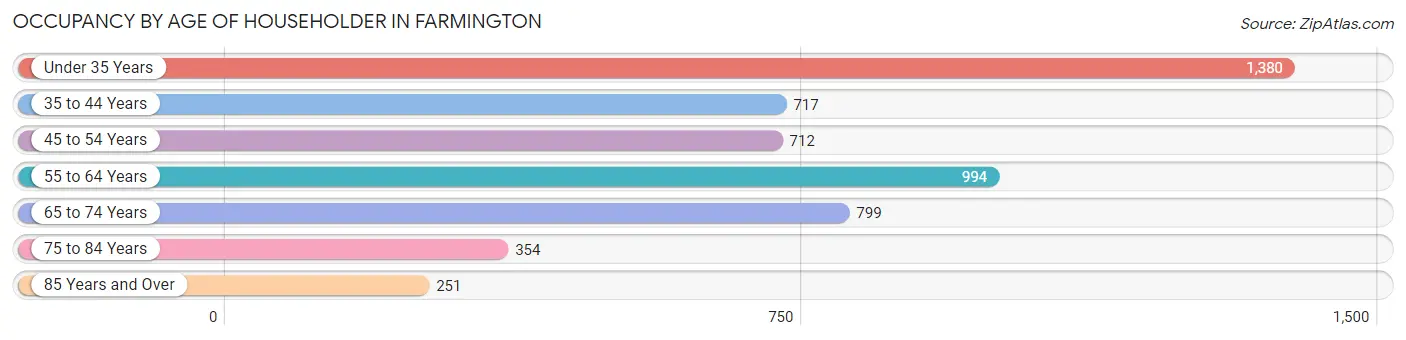
| Age Bracket | # Households | % Households |
| Under 35 Years | 1,380 | 26.5% |
| 35 to 44 Years | 717 | 13.8% |
| 45 to 54 Years | 712 | 13.7% |
| 55 to 64 Years | 994 | 19.1% |
| 65 to 74 Years | 799 | 15.3% |
| 75 to 84 Years | 354 | 6.8% |
| 85 Years and Over | 251 | 4.8% |
| Total | 5,207 | 100.0% |
Housing Finances in Farmington
Median Income by Occupancy in Farmington
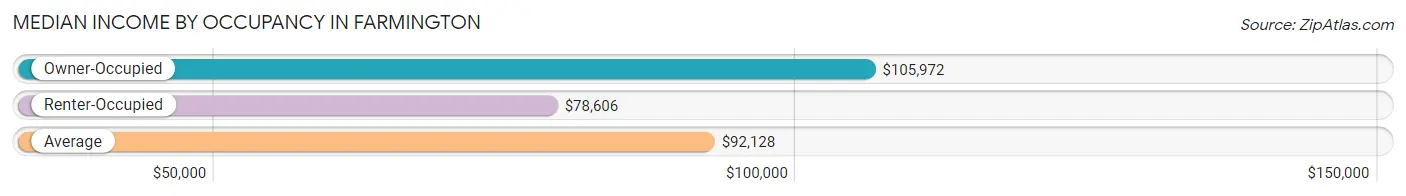
| Occupancy Type | # Households | Median Income |
| Owner-Occupied | 3,306 (63.5%) | $105,972 |
| Renter-Occupied | 1,901 (36.5%) | $78,606 |
| Average | 5,207 (100.0%) | $92,128 |
Occupancy by Householder Income Bracket in Farmington
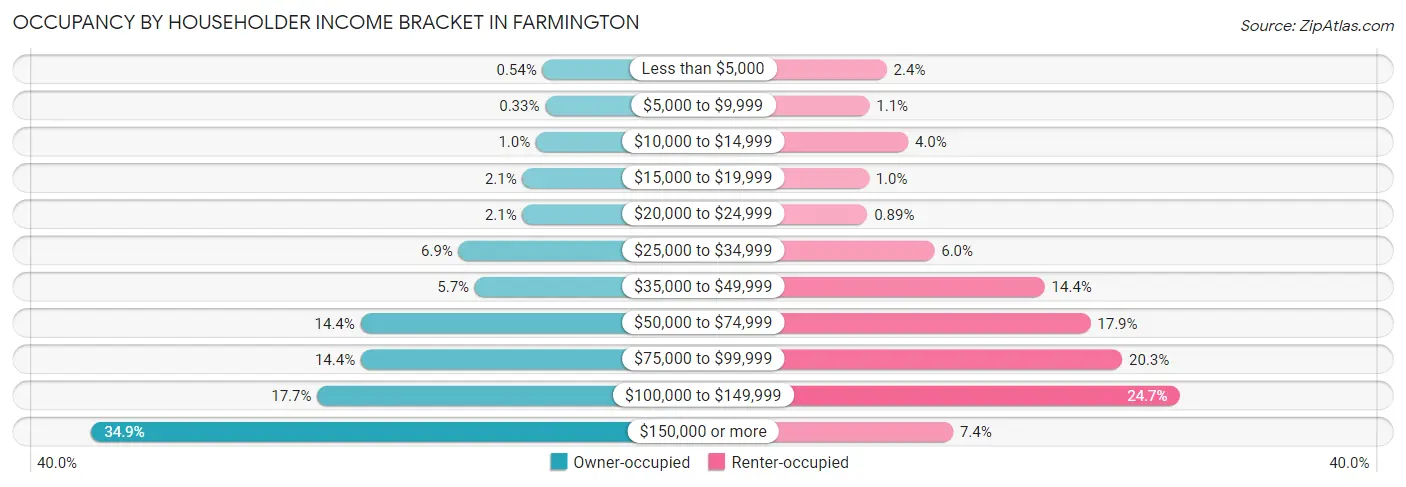
| Income Bracket | Owner-occupied | Renter-occupied |
| Less than $5,000 | 18 (0.5%) | 45 (2.4%) |
| $5,000 to $9,999 | 11 (0.3%) | 20 (1.1%) |
| $10,000 to $14,999 | 34 (1.0%) | 76 (4.0%) |
| $15,000 to $19,999 | 68 (2.1%) | 19 (1.0%) |
| $20,000 to $24,999 | 68 (2.1%) | 17 (0.9%) |
| $25,000 to $34,999 | 229 (6.9%) | 114 (6.0%) |
| $35,000 to $49,999 | 188 (5.7%) | 274 (14.4%) |
| $50,000 to $74,999 | 476 (14.4%) | 340 (17.9%) |
| $75,000 to $99,999 | 475 (14.4%) | 386 (20.3%) |
| $100,000 to $149,999 | 585 (17.7%) | 469 (24.7%) |
| $150,000 or more | 1,154 (34.9%) | 141 (7.4%) |
| Total | 3,306 (100.0%) | 1,901 (100.0%) |
Monthly Housing Cost Tiers in Farmington
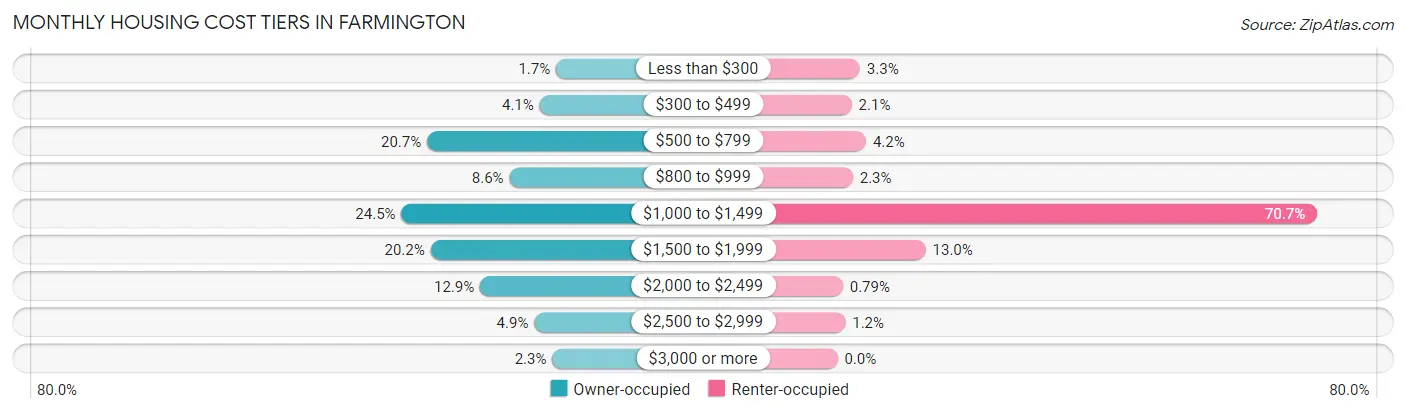
| Monthly Cost | Owner-occupied | Renter-occupied |
| Less than $300 | 57 (1.7%) | 63 (3.3%) |
| $300 to $499 | 137 (4.1%) | 40 (2.1%) |
| $500 to $799 | 685 (20.7%) | 80 (4.2%) |
| $800 to $999 | 284 (8.6%) | 43 (2.3%) |
| $1,000 to $1,499 | 810 (24.5%) | 1,343 (70.7%) |
| $1,500 to $1,999 | 668 (20.2%) | 247 (13.0%) |
| $2,000 to $2,499 | 427 (12.9%) | 15 (0.8%) |
| $2,500 to $2,999 | 163 (4.9%) | 22 (1.2%) |
| $3,000 or more | 75 (2.3%) | 0 (0.0%) |
| Total | 3,306 (100.0%) | 1,901 (100.0%) |
Physical Housing Characteristics in Farmington
Housing Structures in Farmington
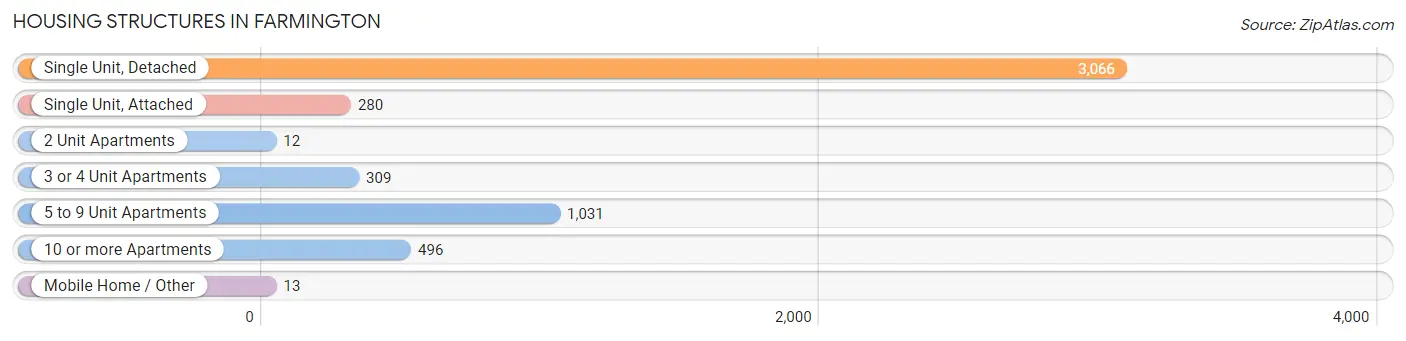
| Structure Type | # Housing Units | % Housing Units |
| Single Unit, Detached | 3,066 | 58.9% |
| Single Unit, Attached | 280 | 5.4% |
| 2 Unit Apartments | 12 | 0.2% |
| 3 or 4 Unit Apartments | 309 | 5.9% |
| 5 to 9 Unit Apartments | 1,031 | 19.8% |
| 10 or more Apartments | 496 | 9.5% |
| Mobile Home / Other | 13 | 0.3% |
| Total | 5,207 | 100.0% |
Housing Structures by Occupancy in Farmington
| Structure Type | Owner-occupied | Renter-occupied |
| Single Unit, Detached | 2,881 (94.0%) | 185 (6.0%) |
| Single Unit, Attached | 247 (88.2%) | 33 (11.8%) |
| 2 Unit Apartments | 0 (0.0%) | 12 (100.0%) |
| 3 or 4 Unit Apartments | 44 (14.2%) | 265 (85.8%) |
| 5 to 9 Unit Apartments | 67 (6.5%) | 964 (93.5%) |
| 10 or more Apartments | 67 (13.5%) | 429 (86.5%) |
| Mobile Home / Other | 0 (0.0%) | 13 (100.0%) |
| Total | 3,306 (63.5%) | 1,901 (36.5%) |
Housing Structures by Number of Rooms in Farmington
| Number of Rooms | Owner-occupied | Renter-occupied |
| 1 Room | 14 (0.4%) | 17 (0.9%) |
| 2 or 3 Rooms | 52 (1.6%) | 798 (42.0%) |
| 4 or 5 Rooms | 756 (22.9%) | 876 (46.1%) |
| 6 or 7 Rooms | 1,386 (41.9%) | 130 (6.8%) |
| 8 or more Rooms | 1,098 (33.2%) | 80 (4.2%) |
| Total | 3,306 (100.0%) | 1,901 (100.0%) |
Housing Structure by Heating Type in Farmington
| Heating Type | Owner-occupied | Renter-occupied |
| Utility Gas | 2,940 (88.9%) | 1,321 (69.5%) |
| Bottled, Tank, or LP Gas | 8 (0.2%) | 74 (3.9%) |
| Electricity | 337 (10.2%) | 470 (24.7%) |
| Fuel Oil or Kerosene | 21 (0.6%) | 0 (0.0%) |
| Coal or Coke | 0 (0.0%) | 0 (0.0%) |
| All other Fuels | 0 (0.0%) | 25 (1.3%) |
| No Fuel Used | 0 (0.0%) | 11 (0.6%) |
| Total | 3,306 (100.0%) | 1,901 (100.0%) |
Household Vehicle Usage in Farmington
| Vehicles per Household | Owner-occupied | Renter-occupied |
| No Vehicle | 101 (3.1%) | 137 (7.2%) |
| 1 Vehicle | 1,127 (34.1%) | 1,313 (69.1%) |
| 2 Vehicles | 1,364 (41.3%) | 382 (20.1%) |
| 3 or more Vehicles | 714 (21.6%) | 69 (3.6%) |
| Total | 3,306 (100.0%) | 1,901 (100.0%) |
Real Estate & Mortgages in Farmington
Real Estate and Mortgage Overview in Farmington
| Characteristic | Without Mortgage | With Mortgage |
| Housing Units | 1,200 | 2,106 |
| Median Property Value | $262,300 | $262,400 |
| Median Household Income | $69,000 | $889 |
| Monthly Housing Costs | $679 | $75 |
| Real Estate Taxes | $3,893 | $10 |
Property Value by Mortgage Status in Farmington
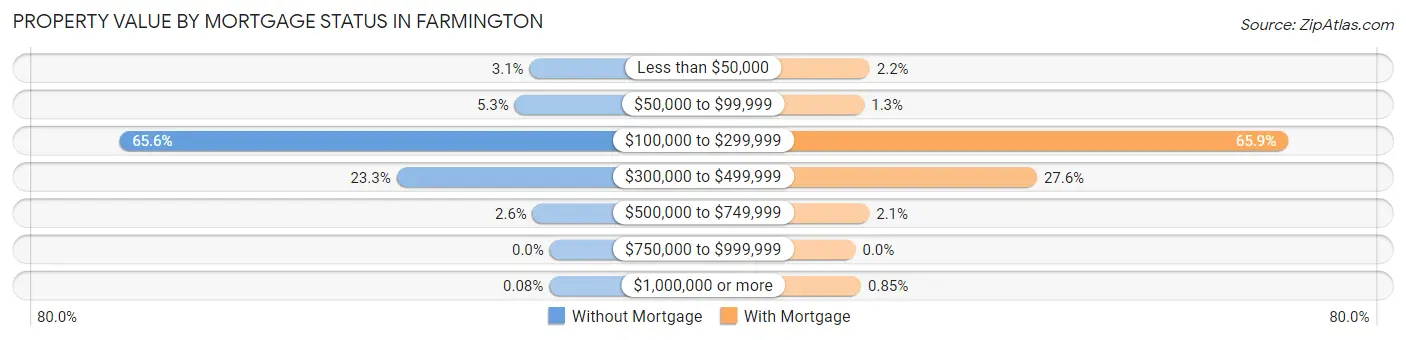
| Property Value | Without Mortgage | With Mortgage |
| Less than $50,000 | 37 (3.1%) | 46 (2.2%) |
| $50,000 to $99,999 | 64 (5.3%) | 28 (1.3%) |
| $100,000 to $299,999 | 787 (65.6%) | 1,388 (65.9%) |
| $300,000 to $499,999 | 280 (23.3%) | 582 (27.6%) |
| $500,000 to $749,999 | 31 (2.6%) | 44 (2.1%) |
| $750,000 to $999,999 | 0 (0.0%) | 0 (0.0%) |
| $1,000,000 or more | 1 (0.1%) | 18 (0.9%) |
| Total | 1,200 (100.0%) | 2,106 (100.0%) |
Household Income by Mortgage Status in Farmington
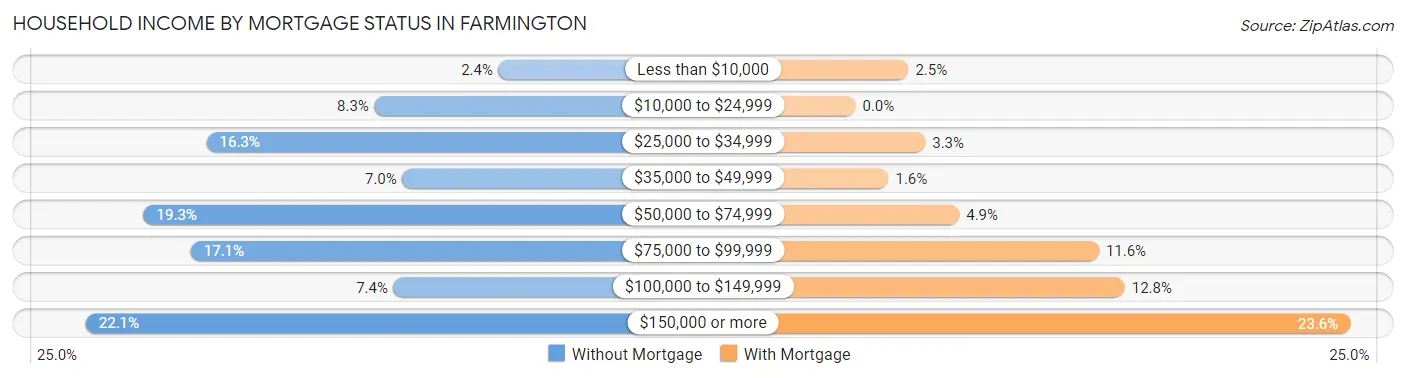
| Household Income | Without Mortgage | With Mortgage |
| Less than $10,000 | 29 (2.4%) | 53 (2.5%) |
| $10,000 to $24,999 | 100 (8.3%) | 0 (0.0%) |
| $25,000 to $34,999 | 196 (16.3%) | 70 (3.3%) |
| $35,000 to $49,999 | 84 (7.0%) | 33 (1.6%) |
| $50,000 to $74,999 | 232 (19.3%) | 104 (4.9%) |
| $75,000 to $99,999 | 205 (17.1%) | 244 (11.6%) |
| $100,000 to $149,999 | 89 (7.4%) | 270 (12.8%) |
| $150,000 or more | 265 (22.1%) | 496 (23.5%) |
| Total | 1,200 (100.0%) | 2,106 (100.0%) |
Property Value to Household Income Ratio in Farmington
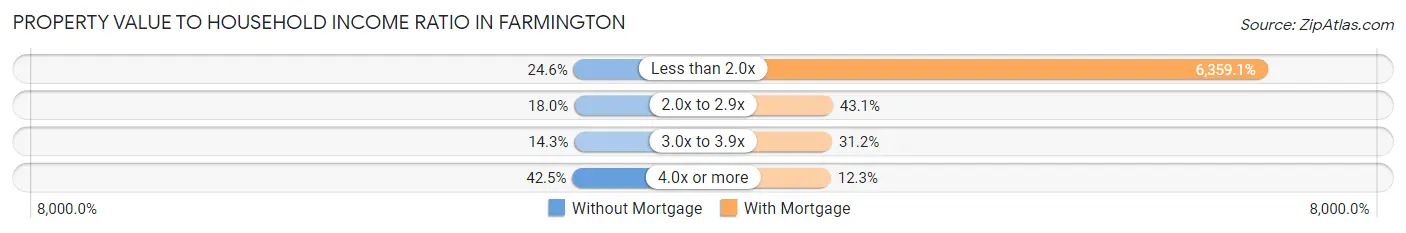
| Value-to-Income Ratio | Without Mortgage | With Mortgage |
| Less than 2.0x | 295 (24.6%) | 133,922 (6,359.1%) |
| 2.0x to 2.9x | 216 (18.0%) | 908 (43.1%) |
| 3.0x to 3.9x | 172 (14.3%) | 657 (31.2%) |
| 4.0x or more | 510 (42.5%) | 258 (12.2%) |
| Total | 1,200 (100.0%) | 2,106 (100.0%) |
Real Estate Taxes by Mortgage Status in Farmington
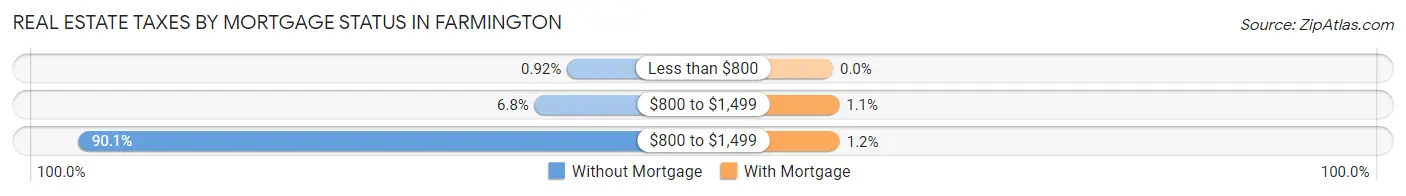
| Property Taxes | Without Mortgage | With Mortgage |
| Less than $800 | 11 (0.9%) | 0 (0.0%) |
| $800 to $1,499 | 82 (6.8%) | 24 (1.1%) |
| $800 to $1,499 | 1,081 (90.1%) | 26 (1.2%) |
| Total | 1,200 (100.0%) | 2,106 (100.0%) |
Health & Disability in Farmington
Health Insurance Coverage by Age in Farmington
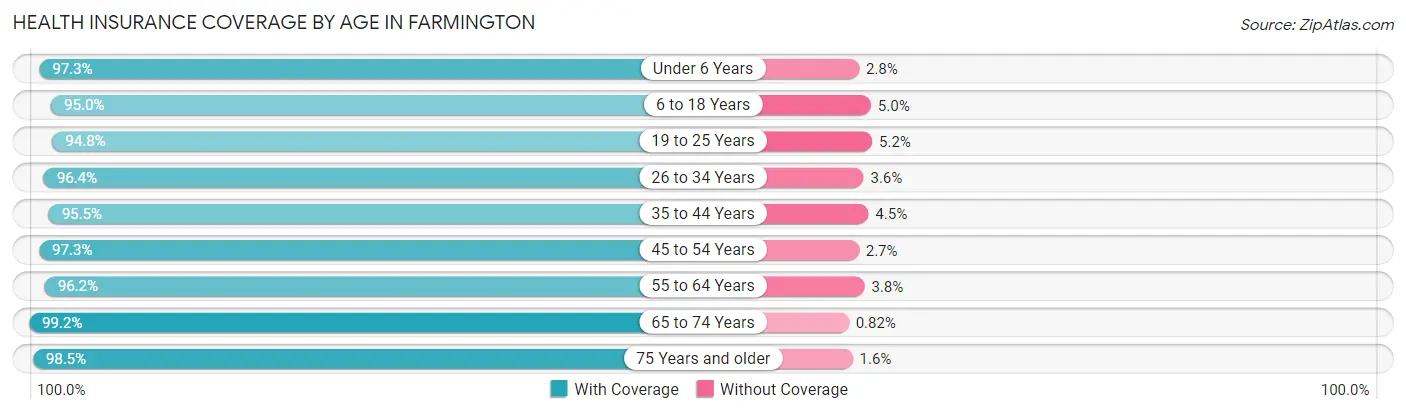
| Age Bracket | With Coverage | Without Coverage |
| Under 6 Years | 778 (97.3%) | 22 (2.8%) |
| 6 to 18 Years | 1,283 (95.0%) | 67 (5.0%) |
| 19 to 25 Years | 914 (94.8%) | 50 (5.2%) |
| 26 to 34 Years | 1,987 (96.4%) | 74 (3.6%) |
| 35 to 44 Years | 1,358 (95.5%) | 64 (4.5%) |
| 45 to 54 Years | 1,080 (97.3%) | 30 (2.7%) |
| 55 to 64 Years | 1,632 (96.2%) | 64 (3.8%) |
| 65 to 74 Years | 1,204 (99.2%) | 10 (0.8%) |
| 75 Years and older | 761 (98.5%) | 12 (1.5%) |
| Total | 10,997 (96.6%) | 393 (3.5%) |
Health Insurance Coverage by Citizenship Status in Farmington
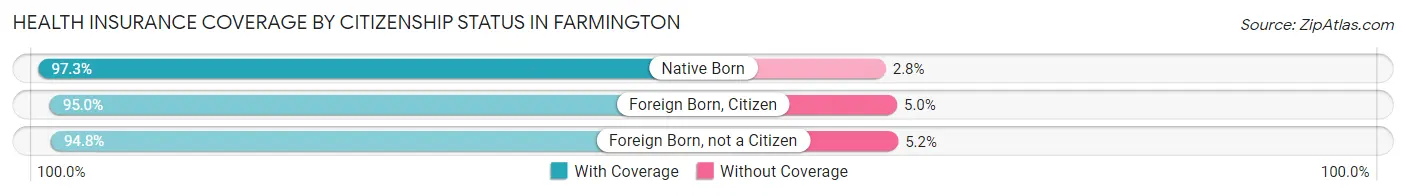
| Citizenship Status | With Coverage | Without Coverage |
| Native Born | 778 (97.3%) | 22 (2.8%) |
| Foreign Born, Citizen | 1,283 (95.0%) | 67 (5.0%) |
| Foreign Born, not a Citizen | 914 (94.8%) | 50 (5.2%) |
Health Insurance Coverage by Household Income in Farmington
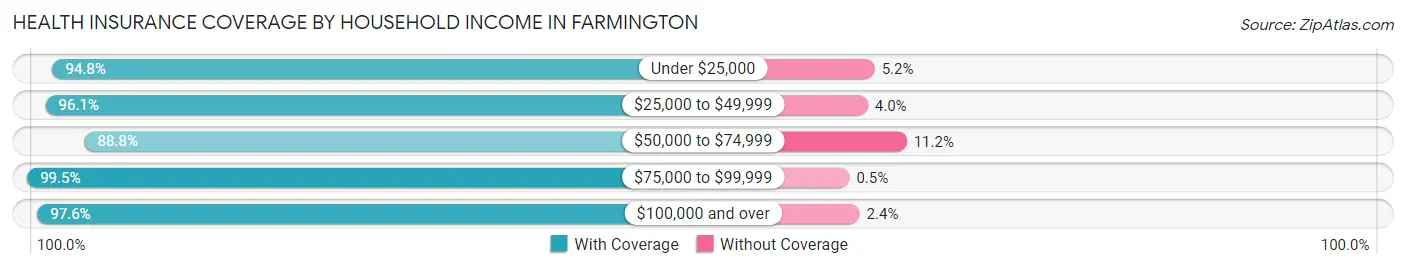
| Household Income | With Coverage | Without Coverage |
| Under $25,000 | 398 (94.8%) | 22 (5.2%) |
| $25,000 to $49,999 | 1,193 (96.1%) | 49 (4.0%) |
| $50,000 to $74,999 | 1,249 (88.8%) | 158 (11.2%) |
| $75,000 to $99,999 | 1,982 (99.5%) | 10 (0.5%) |
| $100,000 and over | 6,149 (97.6%) | 152 (2.4%) |
Public vs Private Health Insurance Coverage by Age in Farmington
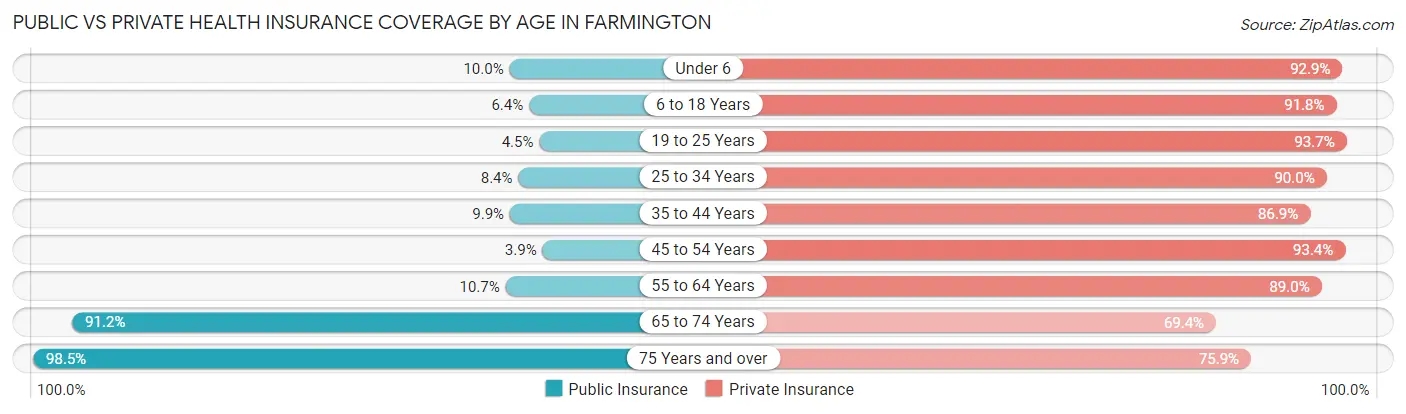
| Age Bracket | Public Insurance | Private Insurance |
| Under 6 | 80 (10.0%) | 743 (92.9%) |
| 6 to 18 Years | 86 (6.4%) | 1,239 (91.8%) |
| 19 to 25 Years | 43 (4.5%) | 903 (93.7%) |
| 25 to 34 Years | 172 (8.4%) | 1,854 (90.0%) |
| 35 to 44 Years | 141 (9.9%) | 1,236 (86.9%) |
| 45 to 54 Years | 43 (3.9%) | 1,037 (93.4%) |
| 55 to 64 Years | 182 (10.7%) | 1,510 (89.0%) |
| 65 to 74 Years | 1,107 (91.2%) | 843 (69.4%) |
| 75 Years and over | 761 (98.5%) | 587 (75.9%) |
| Total | 2,615 (23.0%) | 9,952 (87.4%) |
Disability Status by Sex by Age in Farmington
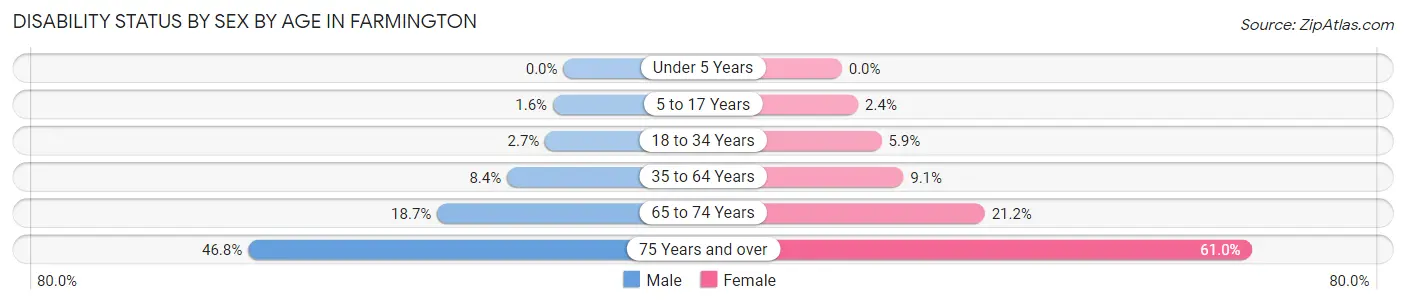
| Age Bracket | Male | Female |
| Under 5 Years | 0 (0.0%) | 0 (0.0%) |
| 5 to 17 Years | 11 (1.5%) | 17 (2.4%) |
| 18 to 34 Years | 46 (2.7%) | 83 (5.9%) |
| 35 to 64 Years | 163 (8.4%) | 208 (9.1%) |
| 65 to 74 Years | 95 (18.7%) | 150 (21.2%) |
| 75 Years and over | 140 (46.8%) | 289 (61.0%) |
Disability Class by Sex by Age in Farmington
Disability Class: Hearing Difficulty
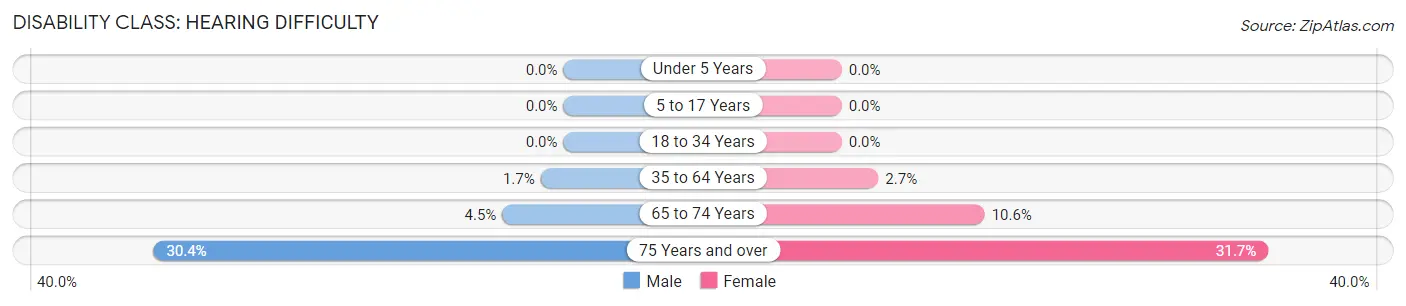
| Age Bracket | Male | Female |
| Under 5 Years | 0 (0.0%) | 0 (0.0%) |
| 5 to 17 Years | 0 (0.0%) | 0 (0.0%) |
| 18 to 34 Years | 0 (0.0%) | 0 (0.0%) |
| 35 to 64 Years | 33 (1.7%) | 62 (2.7%) |
| 65 to 74 Years | 23 (4.5%) | 75 (10.6%) |
| 75 Years and over | 91 (30.4%) | 150 (31.7%) |
Disability Class: Vision Difficulty
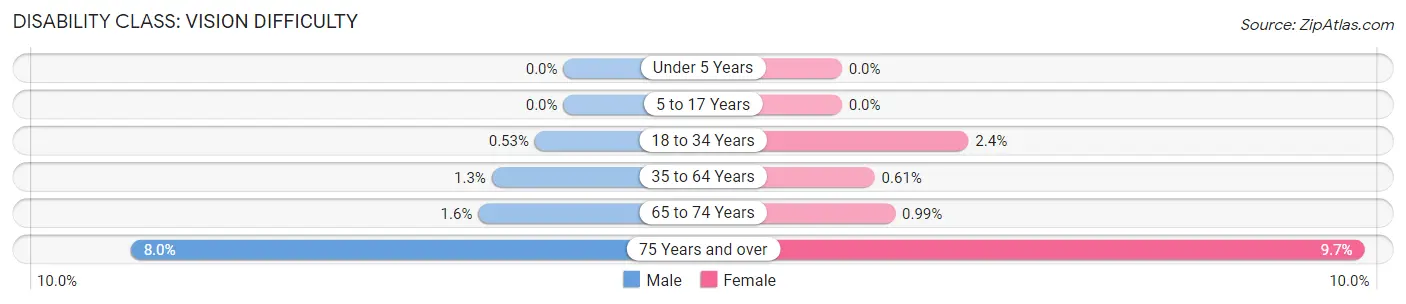
| Age Bracket | Male | Female |
| Under 5 Years | 0 (0.0%) | 0 (0.0%) |
| 5 to 17 Years | 0 (0.0%) | 0 (0.0%) |
| 18 to 34 Years | 9 (0.5%) | 33 (2.4%) |
| 35 to 64 Years | 26 (1.3%) | 14 (0.6%) |
| 65 to 74 Years | 8 (1.6%) | 7 (1.0%) |
| 75 Years and over | 24 (8.0%) | 46 (9.7%) |
Disability Class: Cognitive Difficulty
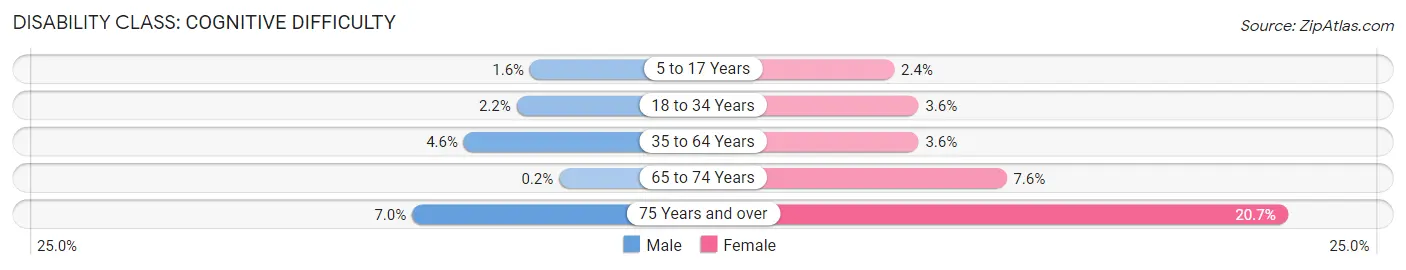
| Age Bracket | Male | Female |
| 5 to 17 Years | 11 (1.5%) | 17 (2.4%) |
| 18 to 34 Years | 37 (2.2%) | 50 (3.6%) |
| 35 to 64 Years | 90 (4.6%) | 81 (3.6%) |
| 65 to 74 Years | 1 (0.2%) | 54 (7.6%) |
| 75 Years and over | 21 (7.0%) | 98 (20.7%) |
Disability Class: Ambulatory Difficulty
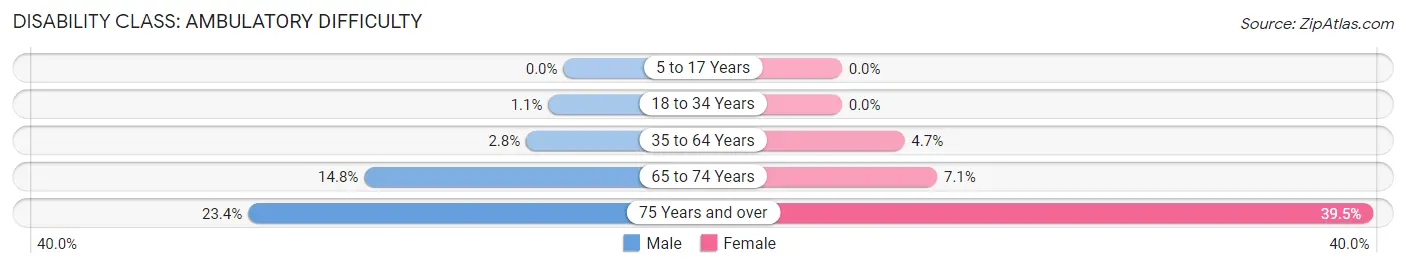
| Age Bracket | Male | Female |
| 5 to 17 Years | 0 (0.0%) | 0 (0.0%) |
| 18 to 34 Years | 19 (1.1%) | 0 (0.0%) |
| 35 to 64 Years | 54 (2.8%) | 106 (4.6%) |
| 65 to 74 Years | 75 (14.8%) | 50 (7.1%) |
| 75 Years and over | 70 (23.4%) | 187 (39.5%) |
Disability Class: Self-Care Difficulty
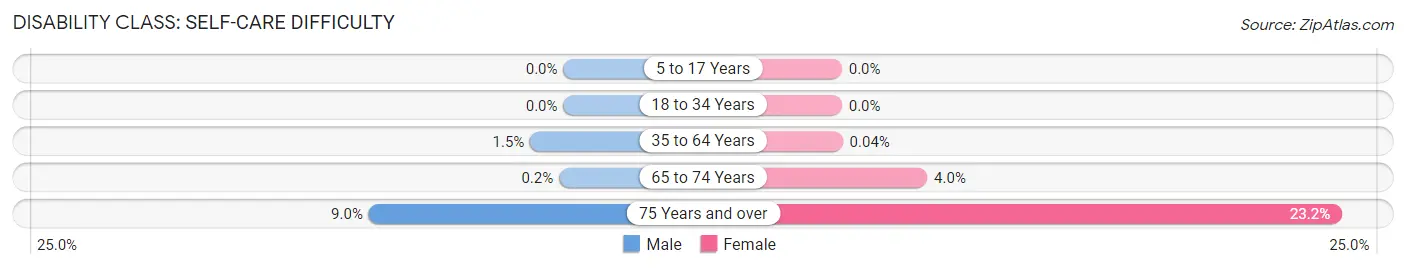
| Age Bracket | Male | Female |
| 5 to 17 Years | 0 (0.0%) | 0 (0.0%) |
| 18 to 34 Years | 0 (0.0%) | 0 (0.0%) |
| 35 to 64 Years | 30 (1.5%) | 1 (0.0%) |
| 65 to 74 Years | 1 (0.2%) | 28 (4.0%) |
| 75 Years and over | 27 (9.0%) | 110 (23.2%) |
Technology Access in Farmington
Computing Device Access in Farmington
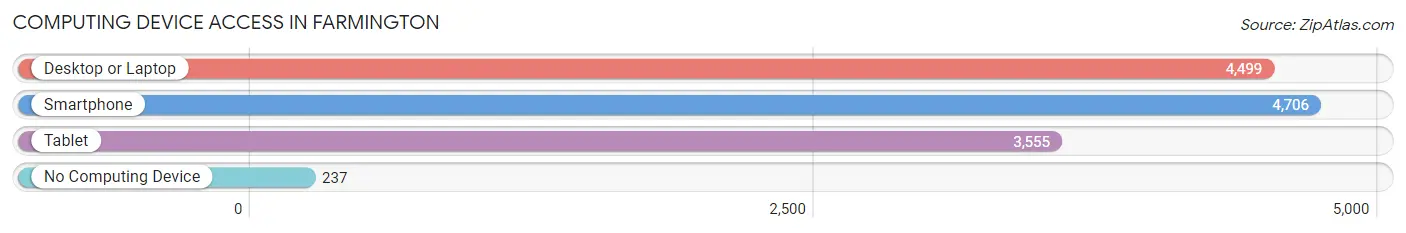
| Device Type | # Households | % Households |
| Desktop or Laptop | 4,499 | 86.4% |
| Smartphone | 4,706 | 90.4% |
| Tablet | 3,555 | 68.3% |
| No Computing Device | 237 | 4.5% |
| Total | 5,207 | 100.0% |
Internet Access in Farmington
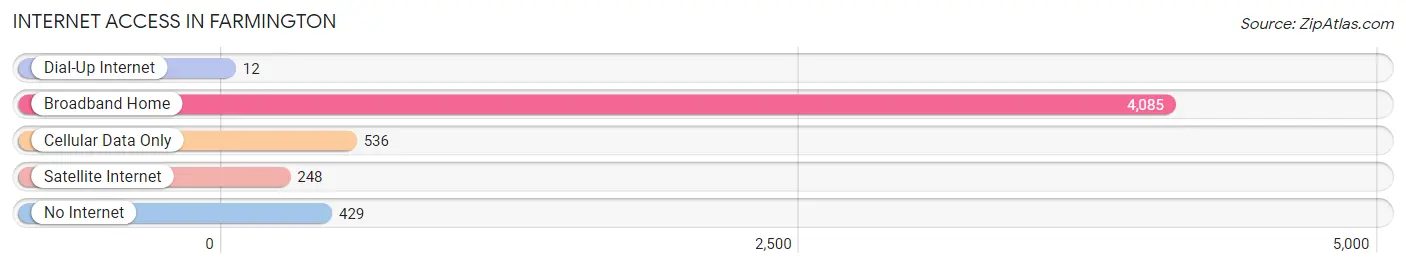
| Internet Type | # Households | % Households |
| Dial-Up Internet | 12 | 0.2% |
| Broadband Home | 4,085 | 78.4% |
| Cellular Data Only | 536 | 10.3% |
| Satellite Internet | 248 | 4.8% |
| No Internet | 429 | 8.2% |
| Total | 5,207 | 100.0% |
Farmington Summary
History
The city of Farmington, Michigan is located in Oakland County, approximately 20 miles northwest of Detroit. The city was first settled in 1824 by a group of settlers from New York, led by William T. Boutwell. The city was originally known as Farmington Township, and was incorporated as a village in 1867. The city was officially incorporated as a city in 1926.
The city of Farmington has a rich history, and has been home to many notable people throughout its history. The city was home to the first public school in Oakland County, which was established in 1827. The city was also home to the first post office in Oakland County, which was established in 1829.
The city of Farmington has also been home to many notable businesses throughout its history. The city was home to the first Ford Motor Company dealership in Oakland County, which was established in 1915. The city was also home to the first shopping center in Oakland County, which was established in 1956.
Geography
The city of Farmington is located in Oakland County, Michigan, approximately 20 miles northwest of Detroit. The city is situated on the banks of the Rouge River, and is bordered by the cities of Livonia, Northville, Novi, and Southfield. The city covers an area of approximately 8.5 square miles, and has a population of approximately 10,372 people.
The city of Farmington is located in a region of Michigan known as the “Thumb”, which is characterized by rolling hills and fertile farmland. The city is located in a region of Michigan known for its lakes, rivers, and streams, and is home to several parks and recreational areas.
Economy
The city of Farmington has a strong and diverse economy. The city is home to several large employers, including Beaumont Health, Farmington Public Schools, and the City of Farmington. The city is also home to several small businesses, including restaurants, retail stores, and professional services.
The city of Farmington is also home to several major shopping centers, including the Twelve Oaks Mall, the Grand River Shopping Center, and the Farmington Hills Shopping Center. The city is also home to several major employers, including the Ford Motor Company, the University of Michigan, and the Detroit Medical Center.
Demographics
The city of Farmington has a population of approximately 10,372 people, according to the 2010 census. The city has a median household income of $60,945, and a median age of 39.7 years. The city is predominantly white, with approximately 79.3% of the population identifying as white. The city is also home to a large African American population, with approximately 14.3% of the population identifying as African American. The city is also home to a large Hispanic population, with approximately 4.2% of the population identifying as Hispanic or Latino.
Common Questions
What is Per Capita Income in Farmington?
Per Capita income in Farmington is $53,511.
What is the Median Family Income in Farmington?
Median Family Income in Farmington is $113,322.
What is the Median Household income in Farmington?
Median Household Income in Farmington is $92,128.
What is Income or Wage Gap in Farmington?
Income or Wage Gap in Farmington is 44.4%.
Women in Farmington earn 55.6 cents for every dollar earned by a man.
What is Inequality or Gini Index in Farmington?
Inequality or Gini Index in Farmington is 0.41.
What is the Total Population of Farmington?
Total Population of Farmington is 11,486.
What is the Total Male Population of Farmington?
Total Male Population of Farmington is 5,482.
What is the Total Female Population of Farmington?
Total Female Population of Farmington is 6,004.
What is the Ratio of Males per 100 Females in Farmington?
There are 91.31 Males per 100 Females in Farmington.
What is the Ratio of Females per 100 Males in Farmington?
There are 109.52 Females per 100 Males in Farmington.
What is the Median Population Age in Farmington?
Median Population Age in Farmington is 38.4 Years.
What is the Average Family Size in Farmington
Average Family Size in Farmington is 2.9 People.
What is the Average Household Size in Farmington
Average Household Size in Farmington is 2.2 People.
How Large is the Labor Force in Farmington?
There are 6,522 People in the Labor Forcein in Farmington.
What is the Percentage of People in the Labor Force in Farmington?
67.6% of People are in the Labor Force in Farmington.
What is the Unemployment Rate in Farmington?
Unemployment Rate in Farmington is 3.0%.