Efland, NC Map & Demographics
Efland Map
Efland Overview
$37,934
PER CAPITA INCOME
$86,361
AVG FAMILY INCOME
$85,248
AVG HOUSEHOLD INCOME
26.8%
WAGE / INCOME GAP [ % ]
73.2¢/ $1
WAGE / INCOME GAP [ $ ]
0.28
INEQUALITY / GINI INDEX
825
TOTAL POPULATION
389
MALE POPULATION
436
FEMALE POPULATION
89.22
MALES / 100 FEMALES
112.08
FEMALES / 100 MALES
44.7
MEDIAN AGE
2.7
AVG FAMILY SIZE
2.2
AVG HOUSEHOLD SIZE
428
LABOR FORCE [ PEOPLE ]
67.7%
PERCENT IN LABOR FORCE
Efland Zip Codes
Efland Area Codes
Income in Efland
Income Overview in Efland
Per Capita Income in Efland is $37,934, while median incomes of families and households are $86,361 and $85,248 respectively.
| Characteristic | Number | Measure |
| Per Capita Income | 825 | $37,934 |
| Median Family Income | 276 | $86,361 |
| Mean Family Income | 276 | $99,057 |
| Median Household Income | 366 | $85,248 |
| Mean Household Income | 366 | $88,337 |
| Income Deficit | 276 | $0 |
| Wage / Income Gap (%) | 825 | 26.83% |
| Wage / Income Gap ($) | 825 | 73.17¢ per $1 |
| Gini / Inequality Index | 825 | 0.28 |
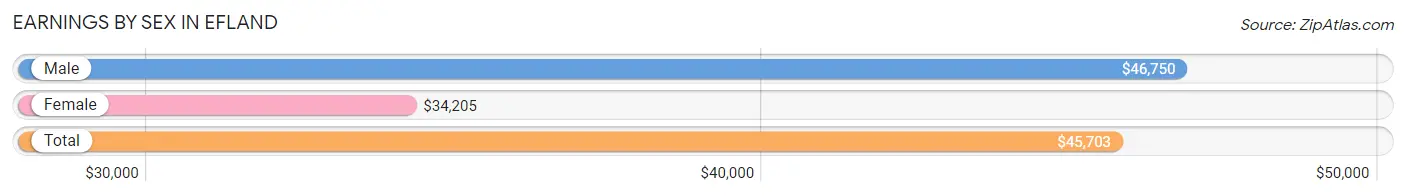
Earnings by Sex in Efland
Average Earnings in Efland are $45,703, $46,750 for men and $34,205 for women, a difference of 26.8%.
| Sex | Number | Average Earnings |
| Male | 204 (38.6%) | $46,750 |
| Female | 325 (61.4%) | $34,205 |
| Total | 529 (100.0%) | $45,703 |
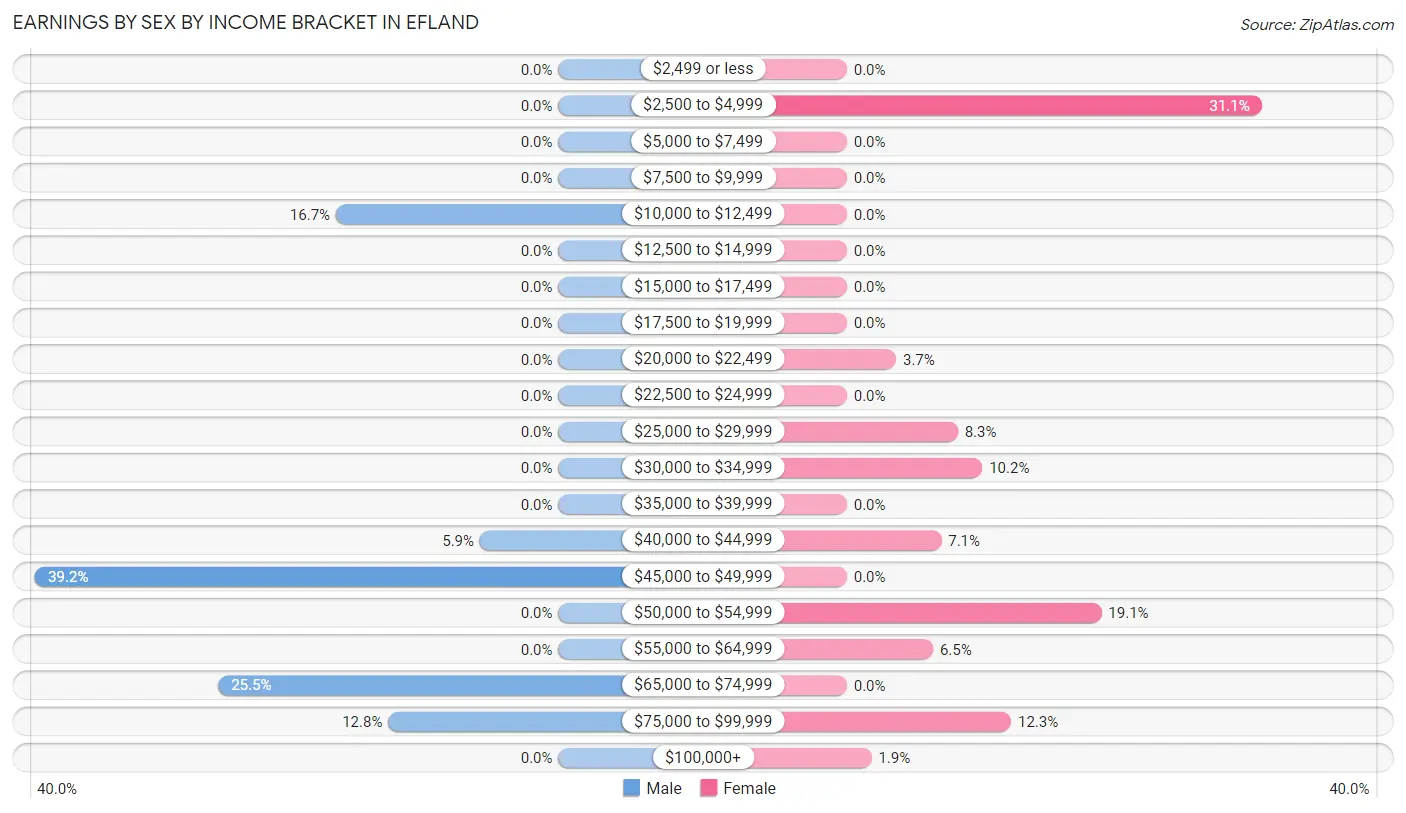
Earnings by Sex by Income Bracket in Efland
The most common earnings brackets in Efland are $45,000 to $49,999 for men (80 | 39.2%) and $2,500 to $4,999 for women (101 | 31.1%).
| Income | Male | Female |
| $2,499 or less | 0 (0.0%) | 0 (0.0%) |
| $2,500 to $4,999 | 0 (0.0%) | 101 (31.1%) |
| $5,000 to $7,499 | 0 (0.0%) | 0 (0.0%) |
| $7,500 to $9,999 | 0 (0.0%) | 0 (0.0%) |
| $10,000 to $12,499 | 34 (16.7%) | 0 (0.0%) |
| $12,500 to $14,999 | 0 (0.0%) | 0 (0.0%) |
| $15,000 to $17,499 | 0 (0.0%) | 0 (0.0%) |
| $17,500 to $19,999 | 0 (0.0%) | 0 (0.0%) |
| $20,000 to $22,499 | 0 (0.0%) | 12 (3.7%) |
| $22,500 to $24,999 | 0 (0.0%) | 0 (0.0%) |
| $25,000 to $29,999 | 0 (0.0%) | 27 (8.3%) |
| $30,000 to $34,999 | 0 (0.0%) | 33 (10.2%) |
| $35,000 to $39,999 | 0 (0.0%) | 0 (0.0%) |
| $40,000 to $44,999 | 12 (5.9%) | 23 (7.1%) |
| $45,000 to $49,999 | 80 (39.2%) | 0 (0.0%) |
| $50,000 to $54,999 | 0 (0.0%) | 62 (19.1%) |
| $55,000 to $64,999 | 0 (0.0%) | 21 (6.5%) |
| $65,000 to $74,999 | 52 (25.5%) | 0 (0.0%) |
| $75,000 to $99,999 | 26 (12.8%) | 40 (12.3%) |
| $100,000+ | 0 (0.0%) | 6 (1.8%) |
| Total | 204 (100.0%) | 325 (100.0%) |
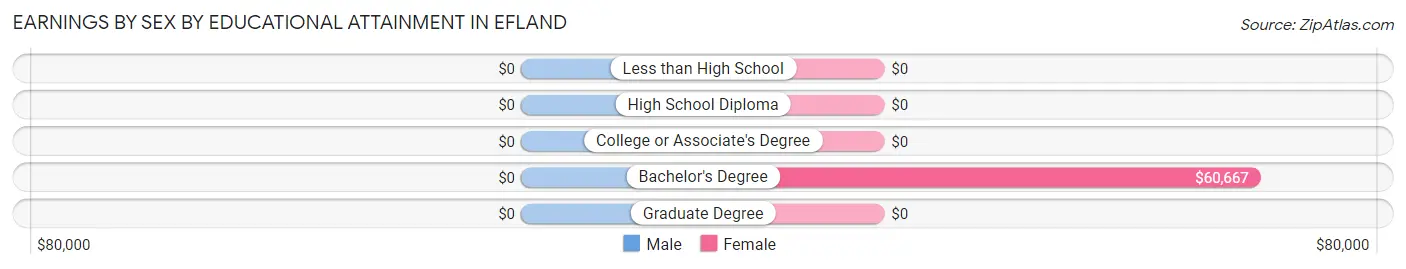
Earnings by Sex by Educational Attainment in Efland
| Educational Attainment | Male Income | Female Income |
| Less than High School | - | - |
| High School Diploma | - | - |
| College or Associate's Degree | - | - |
| Bachelor's Degree | - | - |
| Graduate Degree | - | - |
| Total | $46,750 | $34,205 |
Family Income in Efland
Family Income Brackets in Efland
According to the Efland family income data, there are 113 families falling into the $75,000 to $99,999 income range, which is the most common income bracket and makes up 40.9% of all families.
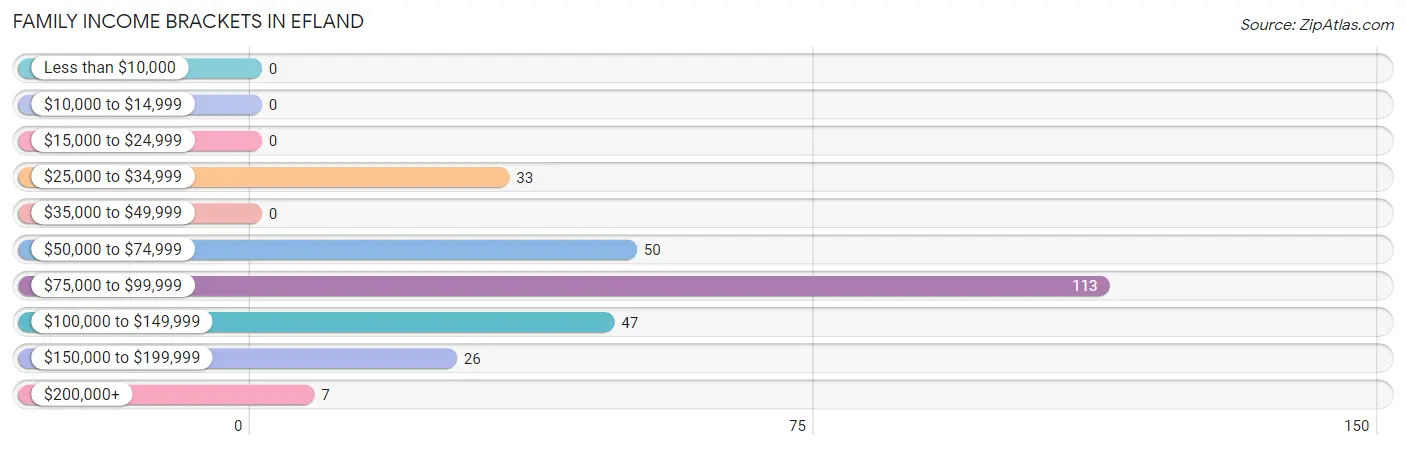
| Income Bracket | # Families | % Families |
| Less than $10,000 | 0 | 0.0% |
| $10,000 to $14,999 | 0 | 0.0% |
| $15,000 to $24,999 | 0 | 0.0% |
| $25,000 to $34,999 | 33 | 12.0% |
| $35,000 to $49,999 | 0 | 0.0% |
| $50,000 to $74,999 | 50 | 18.1% |
| $75,000 to $99,999 | 113 | 40.9% |
| $100,000 to $149,999 | 47 | 17.0% |
| $150,000 to $199,999 | 26 | 9.4% |
| $200,000+ | 7 | 2.5% |
Family Income by Famaliy Size in Efland
2-person families (156 | 56.5%) account for the highest median family income in Efland with $86,114 per family, while 2-person families (156 | 56.5%) have the highest median income of $43,057 per family member.
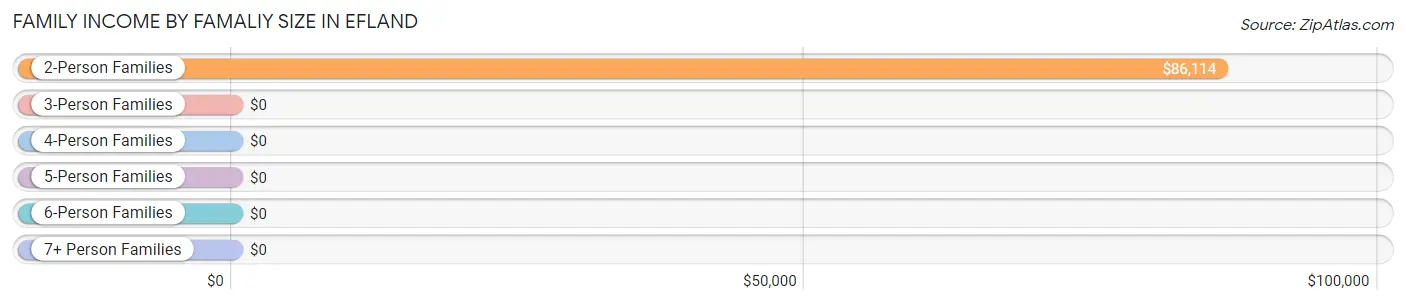
| Income Bracket | # Families | Median Income |
| 2-Person Families | 156 (56.5%) | $86,114 |
| 3-Person Families | 18 (6.5%) | $0 |
| 4-Person Families | 90 (32.6%) | $0 |
| 5-Person Families | 12 (4.3%) | $0 |
| 6-Person Families | 0 (0.0%) | $0 |
| 7+ Person Families | 0 (0.0%) | $0 |
| Total | 276 (100.0%) | $86,361 |
Family Income by Number of Earners in Efland
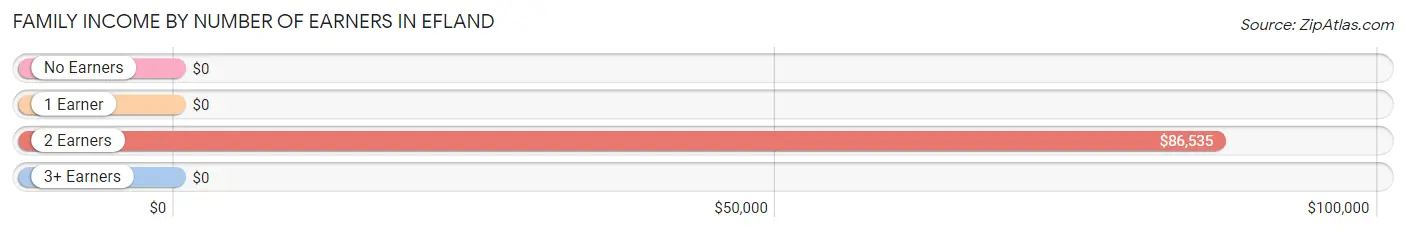
| Number of Earners | # Families | Median Income |
| No Earners | 0 (0.0%) | $0 |
| 1 Earner | 40 (14.5%) | $0 |
| 2 Earners | 224 (81.2%) | $86,535 |
| 3+ Earners | 12 (4.3%) | $0 |
| Total | 276 (100.0%) | $86,361 |
Household Income in Efland
Household Income Brackets in Efland
With 117 households falling in the category, the $50,000 to $74,999 income range is the most frequent in Efland, accounting for 32.0% of all households.
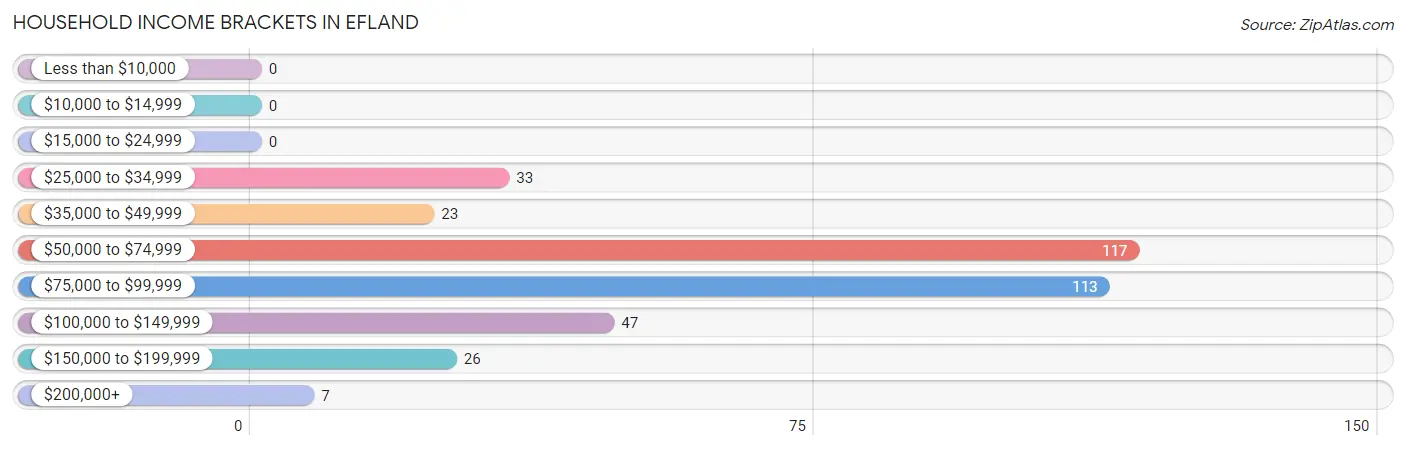
| Income Bracket | # Households | % Households |
| Less than $10,000 | 0 | 0.0% |
| $10,000 to $14,999 | 0 | 0.0% |
| $15,000 to $24,999 | 0 | 0.0% |
| $25,000 to $34,999 | 33 | 9.0% |
| $35,000 to $49,999 | 23 | 6.3% |
| $50,000 to $74,999 | 117 | 32.0% |
| $75,000 to $99,999 | 113 | 30.9% |
| $100,000 to $149,999 | 47 | 12.8% |
| $150,000 to $199,999 | 26 | 7.1% |
| $200,000+ | 7 | 1.9% |
Household Income by Householder Age in Efland
The median household income in Efland is $85,248, with the highest median household income of $86,522 found in the 45 to 64 years age bracket for the primary householder. A total of 169 households (46.2%) fall into this category.
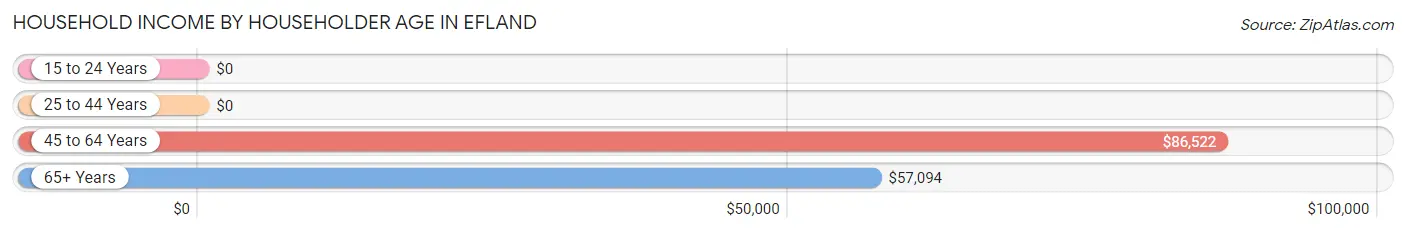
| Income Bracket | # Households | Median Income |
| 15 to 24 Years | 0 (0.0%) | $0 |
| 25 to 44 Years | 130 (35.5%) | $0 |
| 45 to 64 Years | 169 (46.2%) | $86,522 |
| 65+ Years | 67 (18.3%) | $57,094 |
| Total | 366 (100.0%) | $85,248 |
Poverty in Efland
Income Below Poverty by Sex and Age in Efland
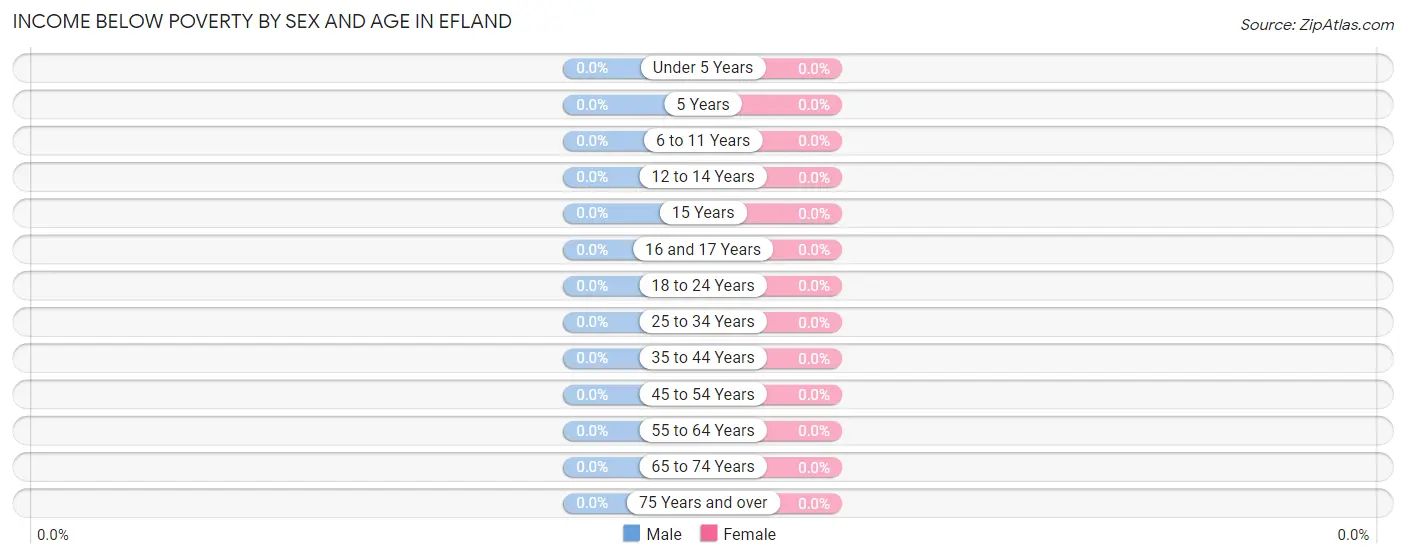
| Age Bracket | Male | Female |
| Under 5 Years | 0 (0.0%) | 0 (0.0%) |
| 5 Years | 0 (0.0%) | 0 (0.0%) |
| 6 to 11 Years | 0 (0.0%) | 0 (0.0%) |
| 12 to 14 Years | 0 (0.0%) | 0 (0.0%) |
| 15 Years | 0 (0.0%) | 0 (0.0%) |
| 16 and 17 Years | 0 (0.0%) | 0 (0.0%) |
| 18 to 24 Years | 0 (0.0%) | 0 (0.0%) |
| 25 to 34 Years | 0 (0.0%) | 0 (0.0%) |
| 35 to 44 Years | 0 (0.0%) | 0 (0.0%) |
| 45 to 54 Years | 0 (0.0%) | 0 (0.0%) |
| 55 to 64 Years | 0 (0.0%) | 0 (0.0%) |
| 65 to 74 Years | 0 (0.0%) | 0 (0.0%) |
| 75 Years and over | 0 (0.0%) | 0 (0.0%) |
| Total | 0 (0.0%) | 0 (0.0%) |
Income Above Poverty by Sex and Age in Efland
According to the poverty statistics in Efland, males aged 5 years and females aged under 5 years are the age groups that are most secure financially, with 100.0% of males and 100.0% of females in these age groups living above the poverty line.
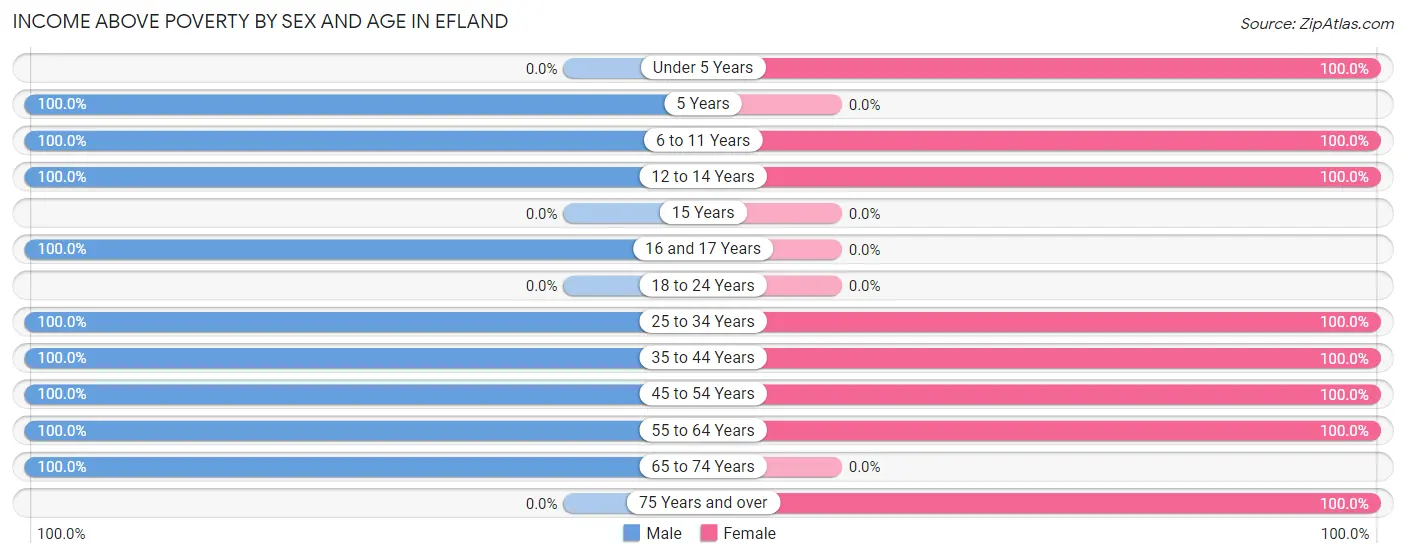
| Age Bracket | Male | Female |
| Under 5 Years | 0 (0.0%) | 11 (100.0%) |
| 5 Years | 39 (100.0%) | 0 (0.0%) |
| 6 to 11 Years | 49 (100.0%) | 44 (100.0%) |
| 12 to 14 Years | 9 (100.0%) | 41 (100.0%) |
| 15 Years | 0 (0.0%) | 0 (0.0%) |
| 16 and 17 Years | 41 (100.0%) | 0 (0.0%) |
| 18 to 24 Years | 0 (0.0%) | 0 (0.0%) |
| 25 to 34 Years | 12 (100.0%) | 39 (100.0%) |
| 35 to 44 Years | 30 (100.0%) | 118 (100.0%) |
| 45 to 54 Years | 54 (100.0%) | 34 (100.0%) |
| 55 to 64 Years | 103 (100.0%) | 134 (100.0%) |
| 65 to 74 Years | 52 (100.0%) | 0 (0.0%) |
| 75 Years and over | 0 (0.0%) | 15 (100.0%) |
| Total | 389 (100.0%) | 436 (100.0%) |
Income Below Poverty Among Married-Couple Families in Efland
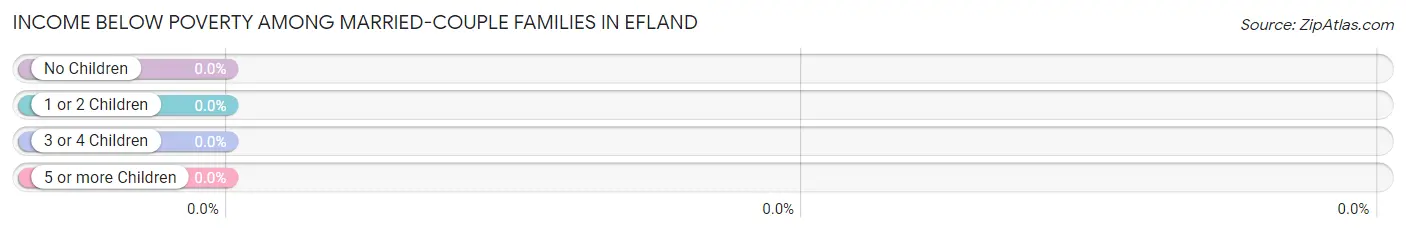
| Children | Above Poverty | Below Poverty |
| No Children | 123 (100.0%) | 0 (0.0%) |
| 1 or 2 Children | 108 (100.0%) | 0 (0.0%) |
| 3 or 4 Children | 0 (0.0%) | 0 (0.0%) |
| 5 or more Children | 0 (0.0%) | 0 (0.0%) |
| Total | 231 (100.0%) | 0 (0.0%) |
Income Below Poverty Among Single-Parent Households in Efland
| Children | Single Father | Single Mother |
| No Children | 0 (0.0%) | 0 (0.0%) |
| 1 or 2 Children | 0 (0.0%) | 0 (0.0%) |
| 3 or 4 Children | 0 (0.0%) | 0 (0.0%) |
| 5 or more Children | 0 (0.0%) | 0 (0.0%) |
| Total | 0 (0.0%) | 0 (0.0%) |
Income Below Poverty Among Married-Couple vs Single-Parent Households in Efland
| Children | Married-Couple Families | Single-Parent Households |
| No Children | 0 (0.0%) | 0 (0.0%) |
| 1 or 2 Children | 0 (0.0%) | 0 (0.0%) |
| 3 or 4 Children | 0 (0.0%) | 0 (0.0%) |
| 5 or more Children | 0 (0.0%) | 0 (0.0%) |
| Total | 0 (0.0%) | 0 (0.0%) |
Race in Efland
The most populous races in Efland are White / Caucasian (591 | 71.6%), Black / African American (219 | 26.6%), and Two or more Races (15 | 1.8%).
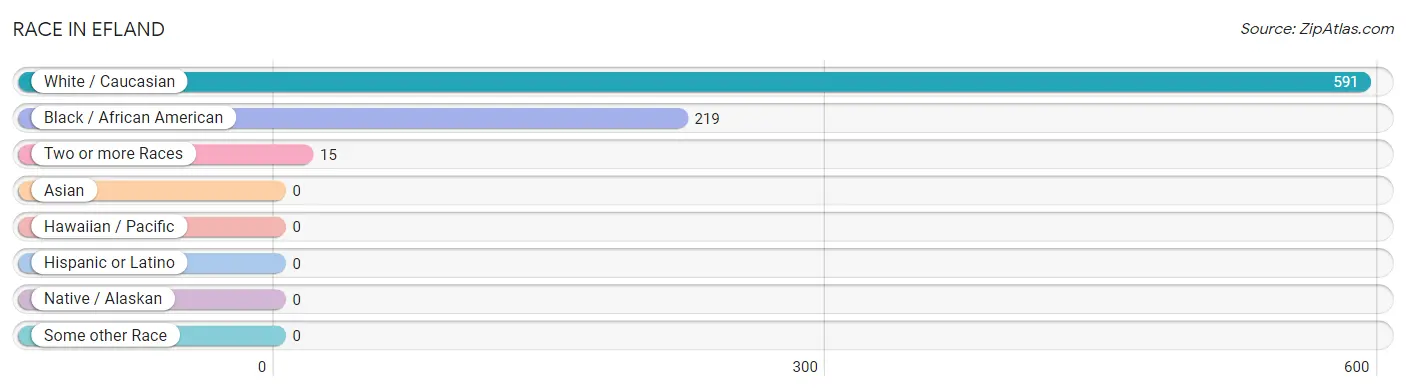
| Race | # Population | % Population |
| Asian | 0 | 0.0% |
| Black / African American | 219 | 26.6% |
| Hawaiian / Pacific | 0 | 0.0% |
| Hispanic or Latino | 0 | 0.0% |
| Native / Alaskan | 0 | 0.0% |
| White / Caucasian | 591 | 71.6% |
| Two or more Races | 15 | 1.8% |
| Some other Race | 0 | 0.0% |
| Total | 825 | 100.0% |
Ancestry in Efland
The most populous ancestries reported in Efland are Arab (132 | 16.0%), English (112 | 13.6%), German (88 | 10.7%), Dutch (66 | 8.0%), and Serbian (61 | 7.4%), together accounting for 55.6% of all Efland residents.
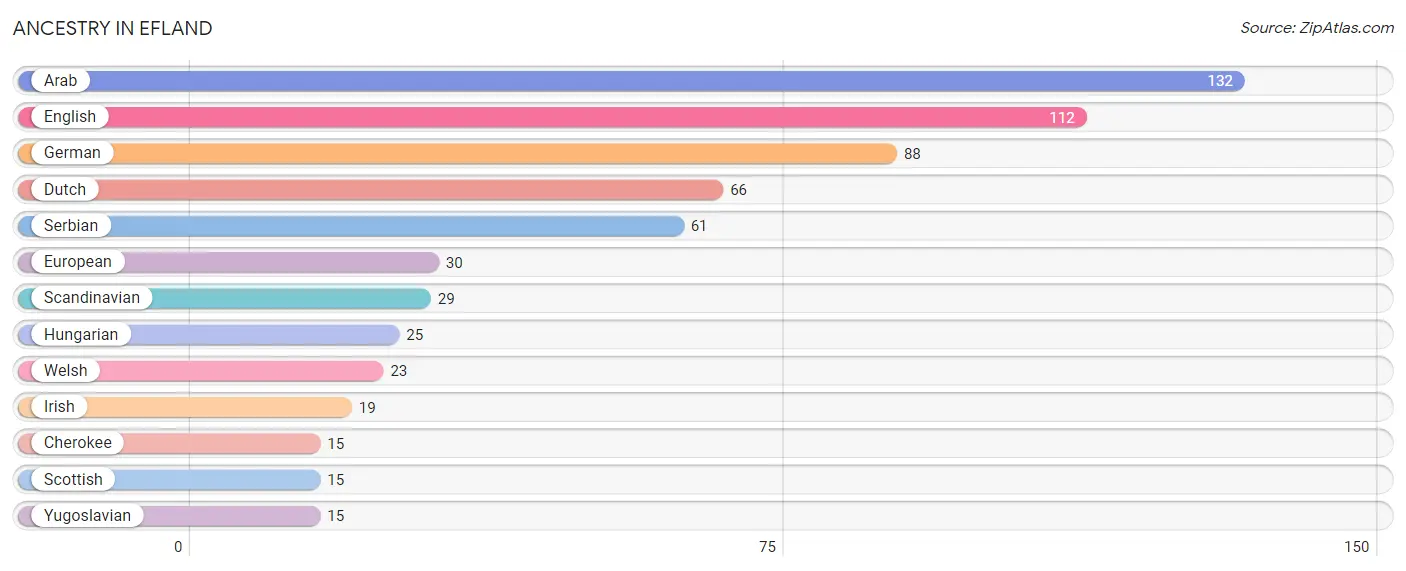
| Ancestry | # Population | % Population |
| Arab | 132 | 16.0% |
| Cherokee | 15 | 1.8% |
| Dutch | 66 | 8.0% |
| English | 112 | 13.6% |
| European | 30 | 3.6% |
| German | 88 | 10.7% |
| Hungarian | 25 | 3.0% |
| Irish | 19 | 2.3% |
| Scandinavian | 29 | 3.5% |
| Scottish | 15 | 1.8% |
| Serbian | 61 | 7.4% |
| Welsh | 23 | 2.8% |
| Yugoslavian | 15 | 1.8% | View All 13 Rows |
Immigrants in Efland
The most numerous immigrant groups reported in Efland came from Africa (166 | 20.1%), Morocco (166 | 20.1%), and Northern Africa (166 | 20.1%), together accounting for 60.4% of all Efland residents.
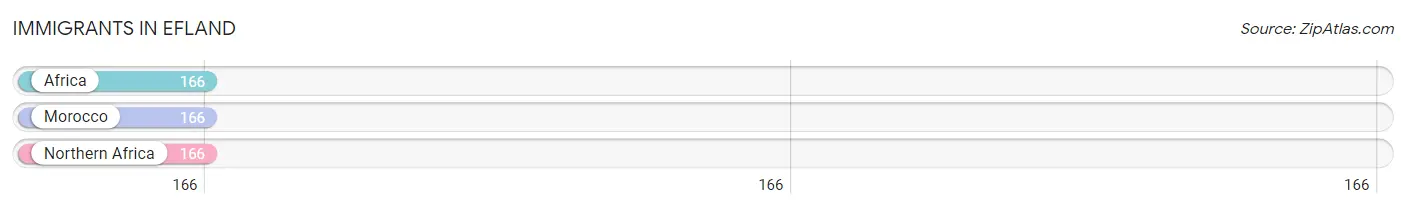
| Immigration Origin | # Population | % Population |
| Africa | 166 | 20.1% |
| Morocco | 166 | 20.1% |
| Northern Africa | 166 | 20.1% | View All 3 Rows |
Sex and Age in Efland
Sex and Age in Efland
The most populous age groups in Efland are 60 to 64 Years (96 | 24.7%) for men and 60 to 64 Years (128 | 29.4%) for women.
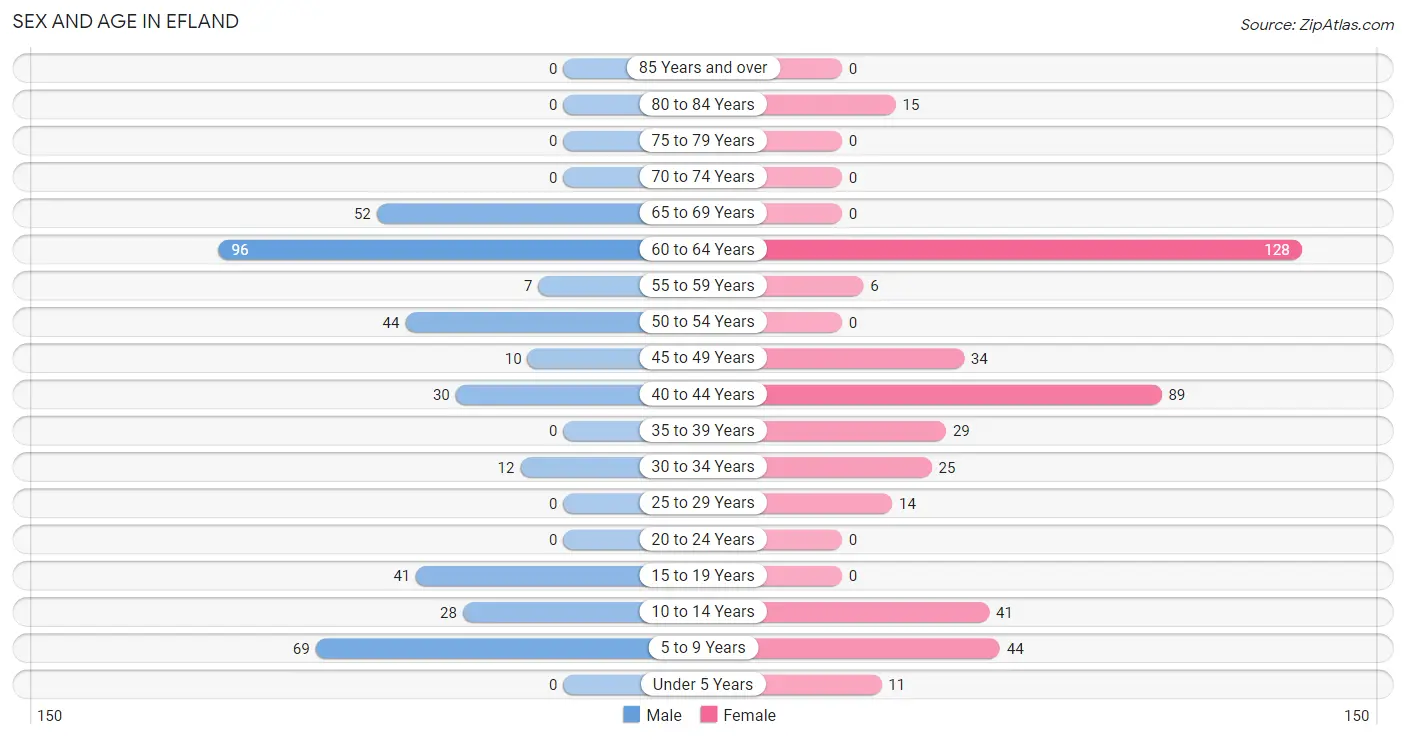
| Age Bracket | Male | Female |
| Under 5 Years | 0 (0.0%) | 11 (2.5%) |
| 5 to 9 Years | 69 (17.7%) | 44 (10.1%) |
| 10 to 14 Years | 28 (7.2%) | 41 (9.4%) |
| 15 to 19 Years | 41 (10.5%) | 0 (0.0%) |
| 20 to 24 Years | 0 (0.0%) | 0 (0.0%) |
| 25 to 29 Years | 0 (0.0%) | 14 (3.2%) |
| 30 to 34 Years | 12 (3.1%) | 25 (5.7%) |
| 35 to 39 Years | 0 (0.0%) | 29 (6.7%) |
| 40 to 44 Years | 30 (7.7%) | 89 (20.4%) |
| 45 to 49 Years | 10 (2.6%) | 34 (7.8%) |
| 50 to 54 Years | 44 (11.3%) | 0 (0.0%) |
| 55 to 59 Years | 7 (1.8%) | 6 (1.4%) |
| 60 to 64 Years | 96 (24.7%) | 128 (29.4%) |
| 65 to 69 Years | 52 (13.4%) | 0 (0.0%) |
| 70 to 74 Years | 0 (0.0%) | 0 (0.0%) |
| 75 to 79 Years | 0 (0.0%) | 0 (0.0%) |
| 80 to 84 Years | 0 (0.0%) | 15 (3.4%) |
| 85 Years and over | 0 (0.0%) | 0 (0.0%) |
| Total | 389 (100.0%) | 436 (100.0%) |
Families and Households in Efland
Median Family Size in Efland
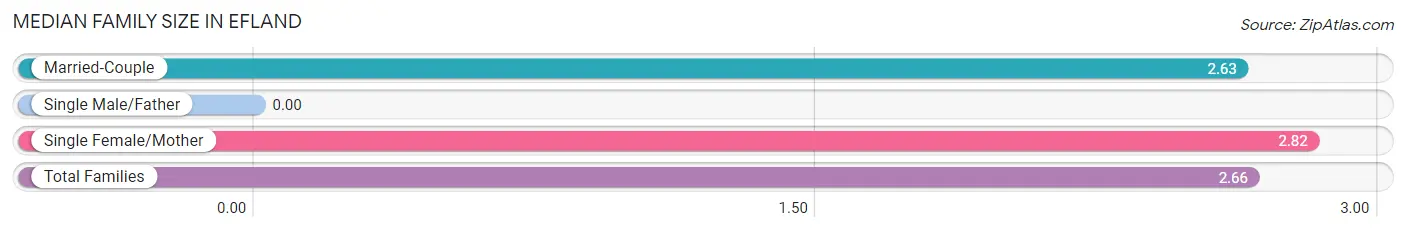
| Family Type | # Families | Family Size |
| Married-Couple | 231 (83.7%) | 2.63 |
| Single Male/Father | 0 (0.0%) | - |
| Single Female/Mother | 45 (16.3%) | 2.82 |
| Total Families | 276 (100.0%) | 2.66 |
Median Household Size in Efland
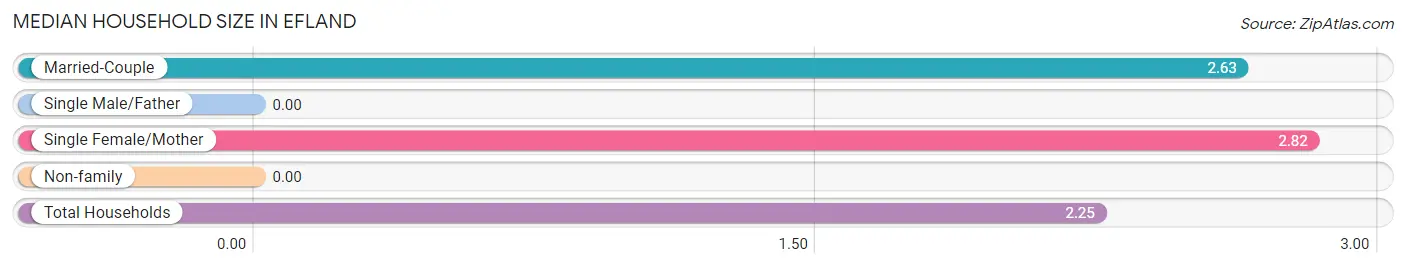
| Household Type | # Households | Household Size |
| Married-Couple | 231 (63.1%) | 2.63 |
| Single Male/Father | 0 (0.0%) | - |
| Single Female/Mother | 45 (12.3%) | 2.82 |
| Non-family | 90 (24.6%) | - |
| Total Households | 366 (100.0%) | 2.25 |
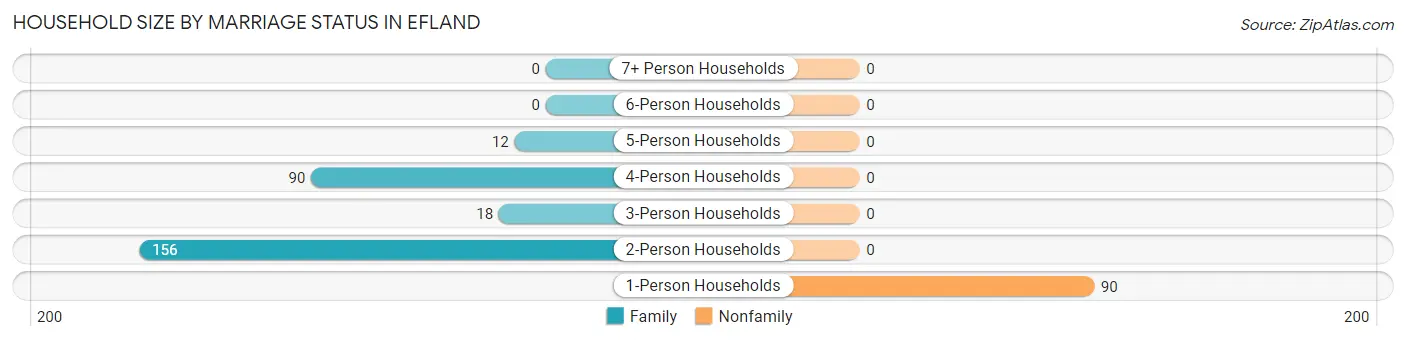
Household Size by Marriage Status in Efland
Out of a total of 366 households in Efland, 276 (75.4%) are family households, while 90 (24.6%) are nonfamily households. The most numerous type of family households are 2-person households, comprising 156, and the most common type of nonfamily households are 1-person households, comprising 90.
| Household Size | Family Households | Nonfamily Households |
| 1-Person Households | - | 90 (24.6%) |
| 2-Person Households | 156 (42.6%) | 0 (0.0%) |
| 3-Person Households | 18 (4.9%) | 0 (0.0%) |
| 4-Person Households | 90 (24.6%) | 0 (0.0%) |
| 5-Person Households | 12 (3.3%) | 0 (0.0%) |
| 6-Person Households | 0 (0.0%) | 0 (0.0%) |
| 7+ Person Households | 0 (0.0%) | 0 (0.0%) |
| Total | 276 (75.4%) | 90 (24.6%) |
Female Fertility in Efland
Fertility by Age in Efland
| Age Bracket | Women with Births | Births / 1,000 Women |
| 15 to 19 years | 0 (0.0%) | 0.0 |
| 20 to 34 years | 0 (0.0%) | 0.0 |
| 35 to 50 years | 0 (0.0%) | 0.0 |
| Total | 0 (0.0%) | 0.0 |
Fertility by Age by Marriage Status in Efland
| Age Bracket | Married | Unmarried |
| 15 to 19 years | 0 (0.0%) | 0 (0.0%) |
| 20 to 34 years | 0 (0.0%) | 0 (0.0%) |
| 35 to 50 years | 0 (0.0%) | 0 (0.0%) |
| Total | 0 (0.0%) | 0 (0.0%) |
Fertility by Education in Efland
| Educational Attainment | Women with Births | Births / 1,000 Women |
| Less than High School | 0 (0.0%) | 0.0 |
| High School Diploma | 0 (0.0%) | 0.0 |
| College or Associate's Degree | 0 (0.0%) | 0.0 |
| Bachelor's Degree | 0 (0.0%) | 0.0 |
| Graduate Degree | 0 (0.0%) | 0.0 |
| Total | 0 (0.0%) | 0.0 |
Fertility by Education by Marriage Status in Efland
| Educational Attainment | Married | Unmarried |
| Less than High School | 0 (0.0%) | 0 (0.0%) |
| High School Diploma | 0 (0.0%) | 0 (0.0%) |
| College or Associate's Degree | 0 (0.0%) | 0 (0.0%) |
| Bachelor's Degree | 0 (0.0%) | 0 (0.0%) |
| Graduate Degree | 0 (0.0%) | 0 (0.0%) |
| Total | 0 (0.0%) | 0 (0.0%) |
Employment Characteristics in Efland
Employment by Class of Employer in Efland
Among the 395 employed individuals in Efland, private company employees (269 | 68.1%), local government employees (52 | 13.2%), and state government employees (45 | 11.4%) make up the most common classes of employment.
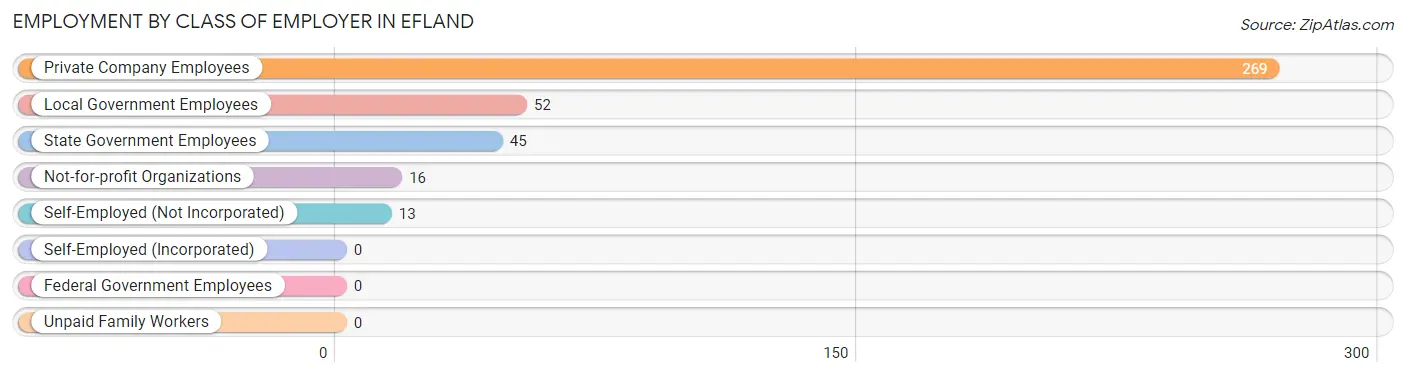
| Employer Class | # Employees | % Employees |
| Private Company Employees | 269 | 68.1% |
| Self-Employed (Incorporated) | 0 | 0.0% |
| Self-Employed (Not Incorporated) | 13 | 3.3% |
| Not-for-profit Organizations | 16 | 4.1% |
| Local Government Employees | 52 | 13.2% |
| State Government Employees | 45 | 11.4% |
| Federal Government Employees | 0 | 0.0% |
| Unpaid Family Workers | 0 | 0.0% |
| Total | 395 | 100.0% |
Employment Status by Age in Efland
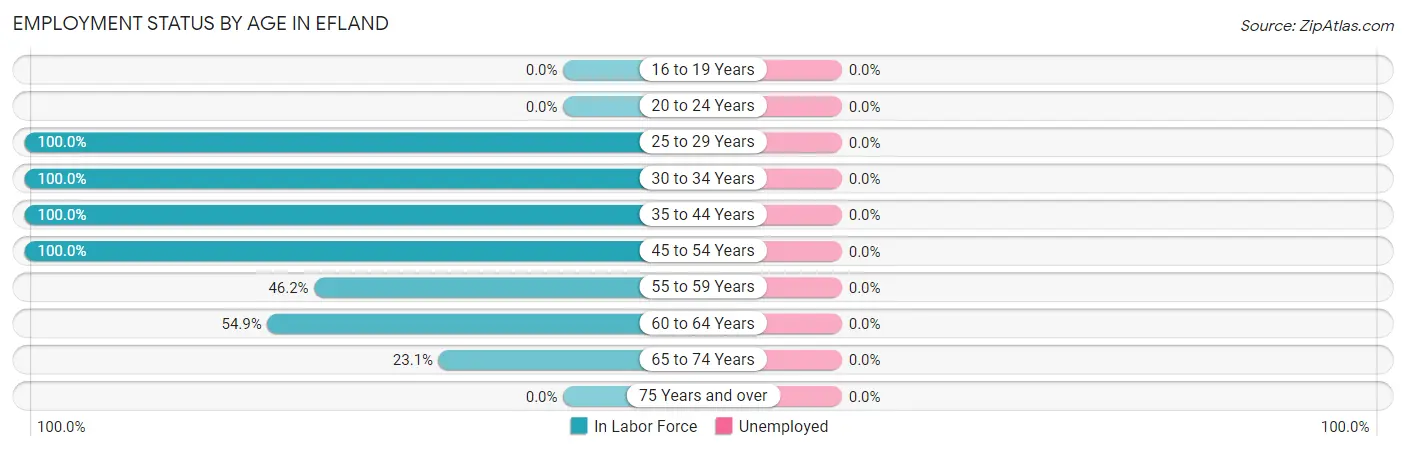
| Age Bracket | In Labor Force | Unemployed |
| 16 to 19 Years | 0 (0.0%) | 0 (0.0%) |
| 20 to 24 Years | 0 (0.0%) | 0 (0.0%) |
| 25 to 29 Years | 14 (100.0%) | 0 (0.0%) |
| 30 to 34 Years | 37 (100.0%) | 0 (0.0%) |
| 35 to 44 Years | 148 (100.0%) | 0 (0.0%) |
| 45 to 54 Years | 88 (100.0%) | 0 (0.0%) |
| 55 to 59 Years | 6 (46.2%) | 0 (0.0%) |
| 60 to 64 Years | 123 (54.9%) | 0 (0.0%) |
| 65 to 74 Years | 12 (23.1%) | 0 (0.0%) |
| 75 Years and over | 0 (0.0%) | 0 (0.0%) |
| Total | 428 (67.7%) | 0 (0.0%) |
Employment Status by Educational Attainment in Efland
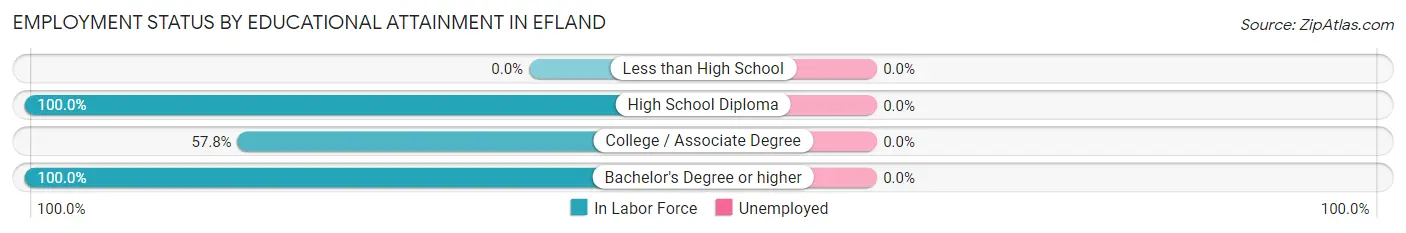
| Educational Attainment | In Labor Force | Unemployed |
| Less than High School | 0 (0.0%) | 0 (0.0%) |
| High School Diploma | 94 (100.0%) | 0 (0.0%) |
| College / Associate Degree | 148 (57.8%) | 0 (0.0%) |
| Bachelor's Degree or higher | 174 (100.0%) | 0 (0.0%) |
| Total | 416 (79.4%) | 0 (0.0%) |
Employment Occupations by Sex in Efland
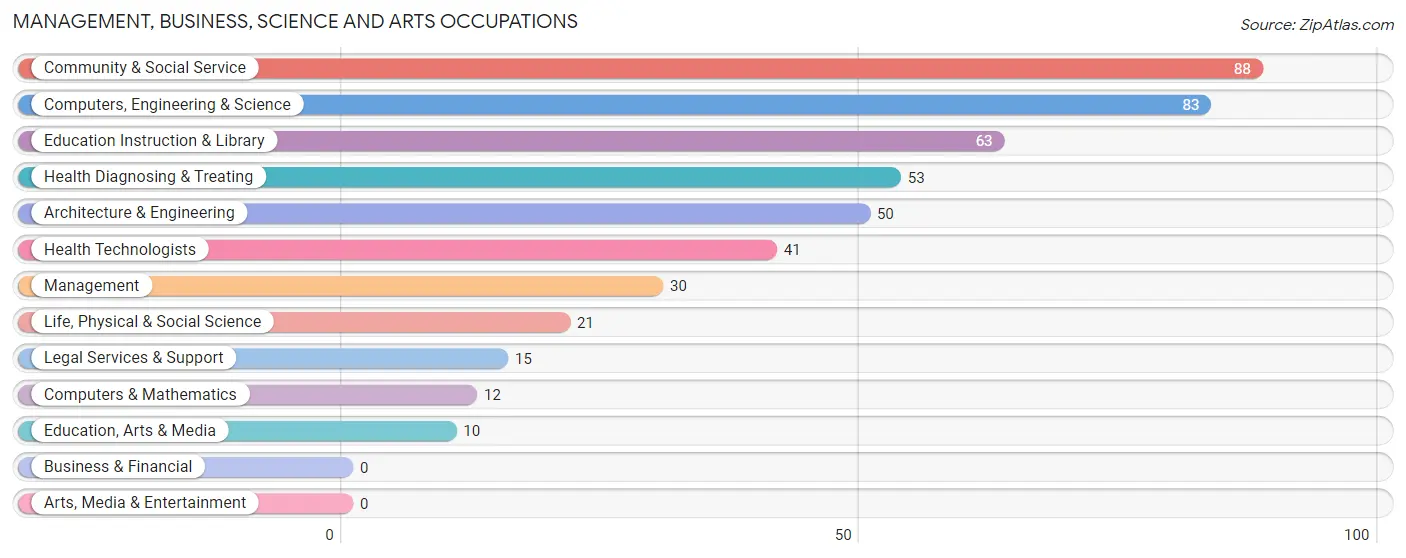
Management, Business, Science and Arts Occupations
The most common Management, Business, Science and Arts occupations in Efland are Community & Social Service (88 | 20.6%), Computers, Engineering & Science (83 | 19.4%), Education Instruction & Library (63 | 14.7%), Health Diagnosing & Treating (53 | 12.4%), and Architecture & Engineering (50 | 11.7%).
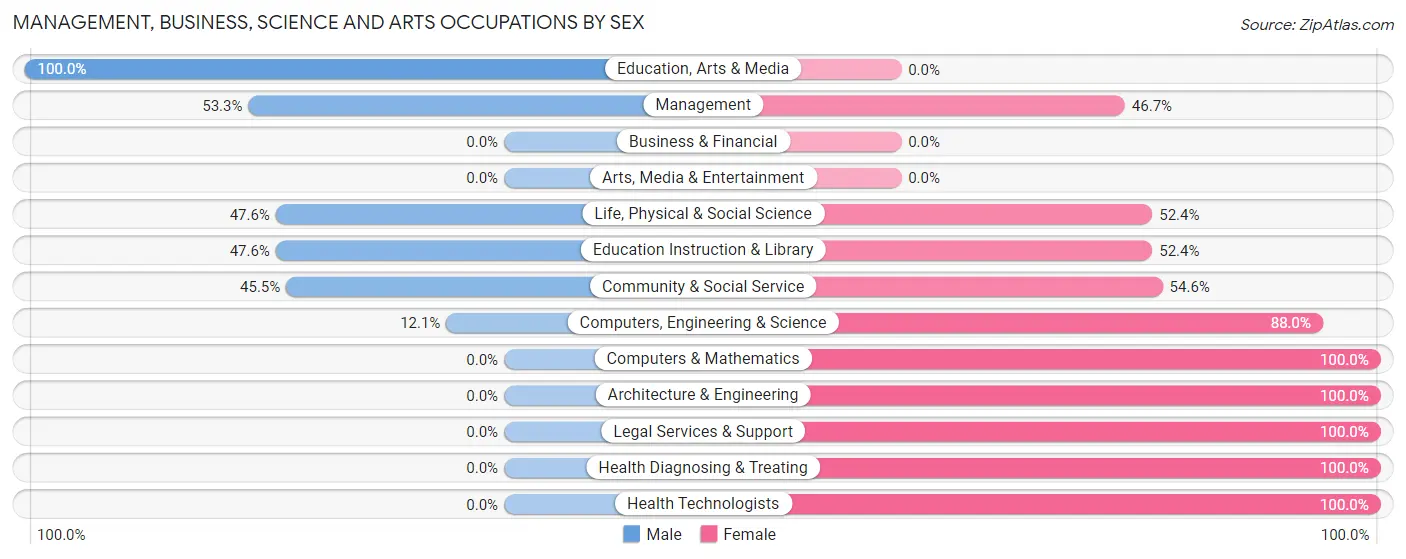
Management, Business, Science and Arts Occupations by Sex
Within the Management, Business, Science and Arts occupations in Efland, the most male-oriented occupations are Education, Arts & Media (100.0%), Management (53.3%), and Life, Physical & Social Science (47.6%), while the most female-oriented occupations are Computers & Mathematics (100.0%), Architecture & Engineering (100.0%), and Legal Services & Support (100.0%).
| Occupation | Male | Female |
| Management | 16 (53.3%) | 14 (46.7%) |
| Business & Financial | 0 (0.0%) | 0 (0.0%) |
| Computers, Engineering & Science | 10 (12.0%) | 73 (87.9%) |
| Computers & Mathematics | 0 (0.0%) | 12 (100.0%) |
| Architecture & Engineering | 0 (0.0%) | 50 (100.0%) |
| Life, Physical & Social Science | 10 (47.6%) | 11 (52.4%) |
| Community & Social Service | 40 (45.5%) | 48 (54.5%) |
| Education, Arts & Media | 10 (100.0%) | 0 (0.0%) |
| Legal Services & Support | 0 (0.0%) | 15 (100.0%) |
| Education Instruction & Library | 30 (47.6%) | 33 (52.4%) |
| Arts, Media & Entertainment | 0 (0.0%) | 0 (0.0%) |
| Health Diagnosing & Treating | 0 (0.0%) | 53 (100.0%) |
| Health Technologists | 0 (0.0%) | 41 (100.0%) |
| Total (Category) | 66 (26.0%) | 188 (74.0%) |
| Total (Overall) | 204 (47.7%) | 224 (52.3%) |
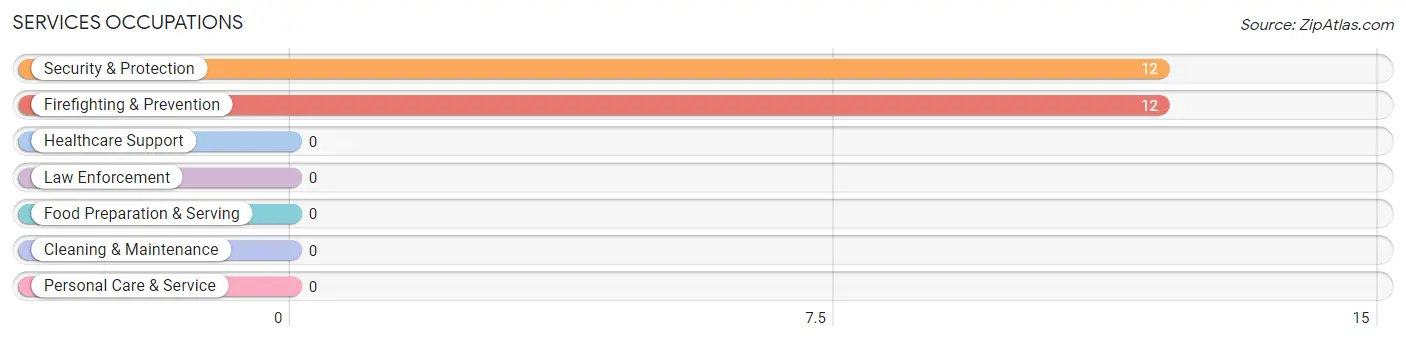
Services Occupations
The most common Services occupations in Efland are Security & Protection (12 | 2.8%), and Firefighting & Prevention (12 | 2.8%).
Services Occupations by Sex
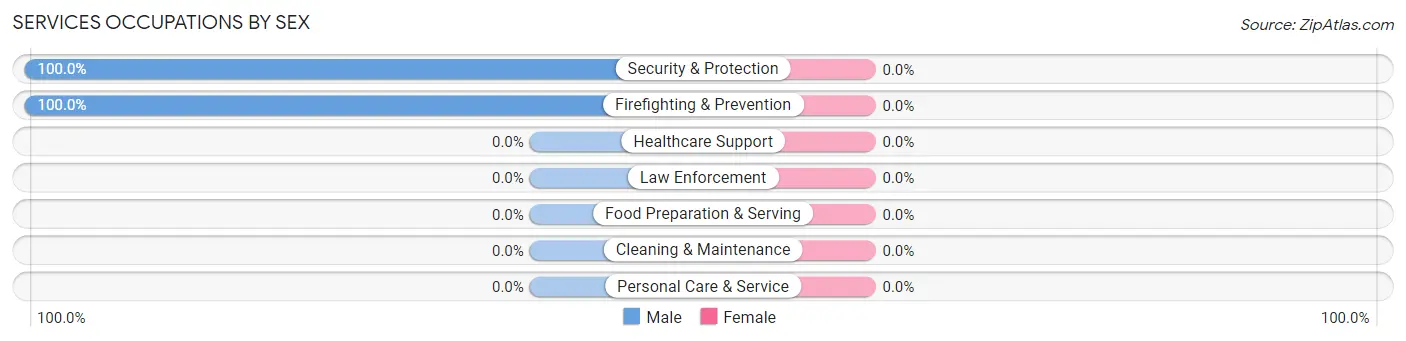
| Occupation | Male | Female |
| Healthcare Support | 0 (0.0%) | 0 (0.0%) |
| Security & Protection | 12 (100.0%) | 0 (0.0%) |
| Firefighting & Prevention | 12 (100.0%) | 0 (0.0%) |
| Law Enforcement | 0 (0.0%) | 0 (0.0%) |
| Food Preparation & Serving | 0 (0.0%) | 0 (0.0%) |
| Cleaning & Maintenance | 0 (0.0%) | 0 (0.0%) |
| Personal Care & Service | 0 (0.0%) | 0 (0.0%) |
| Total (Category) | 12 (100.0%) | 0 (0.0%) |
| Total (Overall) | 204 (47.7%) | 224 (52.3%) |
Sales and Office Occupations
The most common Sales and Office occupations in Efland are Office & Administration (57 | 13.3%), and Sales & Related (12 | 2.8%).
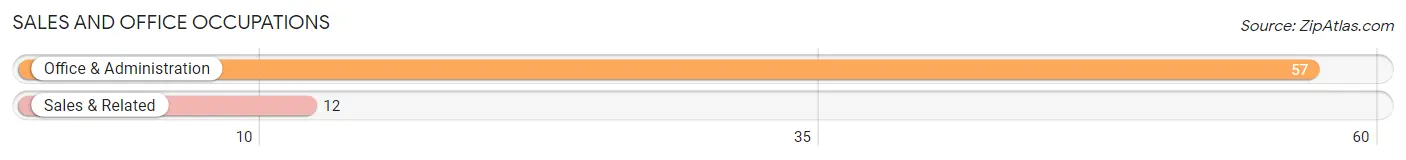
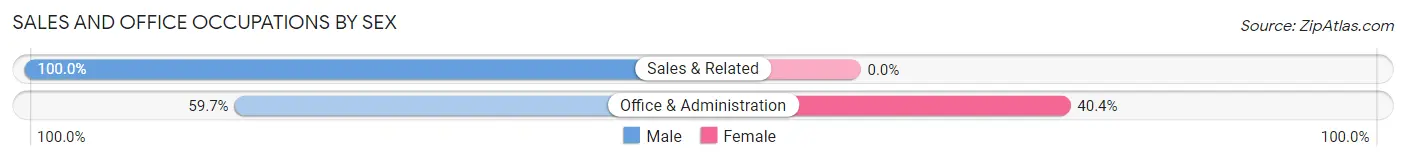
Sales and Office Occupations by Sex
| Occupation | Male | Female |
| Sales & Related | 12 (100.0%) | 0 (0.0%) |
| Office & Administration | 34 (59.7%) | 23 (40.4%) |
| Total (Category) | 46 (66.7%) | 23 (33.3%) |
| Total (Overall) | 204 (47.7%) | 224 (52.3%) |
Natural Resources, Construction and Maintenance Occupations
The most common Natural Resources, Construction and Maintenance occupations in Efland are , and Construction & Extraction (13 | 3.0%).
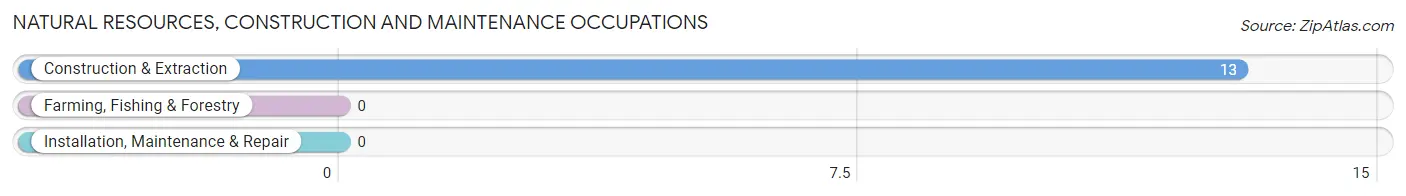
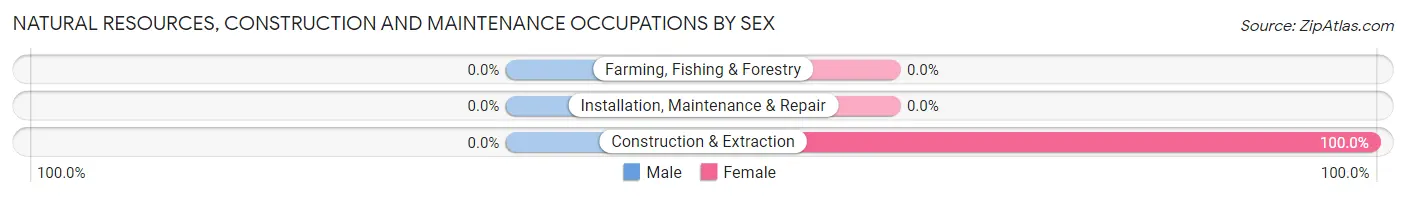
Natural Resources, Construction and Maintenance Occupations by Sex
| Occupation | Male | Female |
| Farming, Fishing & Forestry | 0 (0.0%) | 0 (0.0%) |
| Construction & Extraction | 0 (0.0%) | 13 (100.0%) |
| Installation, Maintenance & Repair | 0 (0.0%) | 0 (0.0%) |
| Total (Category) | 0 (0.0%) | 13 (100.0%) |
| Total (Overall) | 204 (47.7%) | 224 (52.3%) |
Production, Transportation and Moving Occupations
The most common Production, Transportation and Moving occupations in Efland are , and Material Moving (80 | 18.7%).
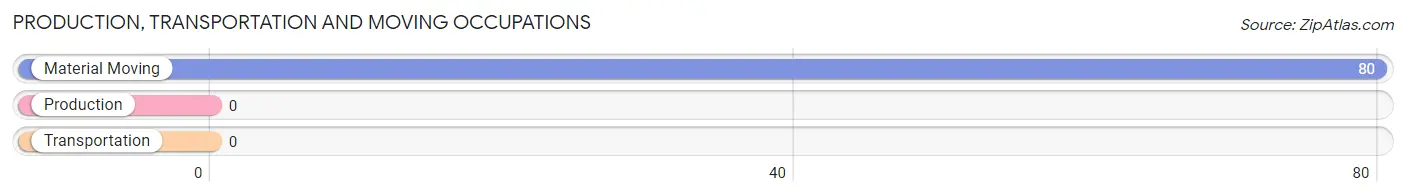
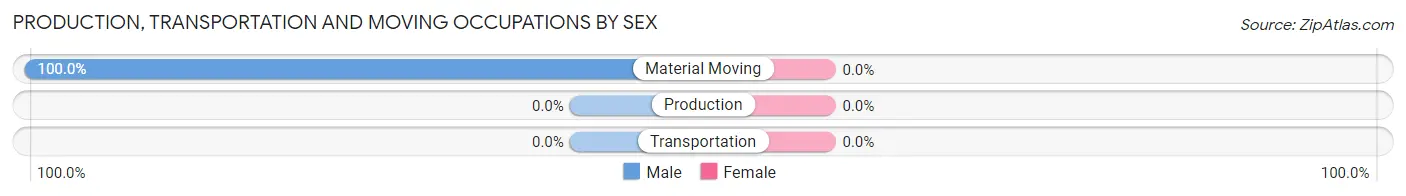
Production, Transportation and Moving Occupations by Sex
| Occupation | Male | Female |
| Production | 0 (0.0%) | 0 (0.0%) |
| Transportation | 0 (0.0%) | 0 (0.0%) |
| Material Moving | 80 (100.0%) | 0 (0.0%) |
| Total (Category) | 80 (100.0%) | 0 (0.0%) |
| Total (Overall) | 204 (47.7%) | 224 (52.3%) |
Employment Industries by Sex in Efland
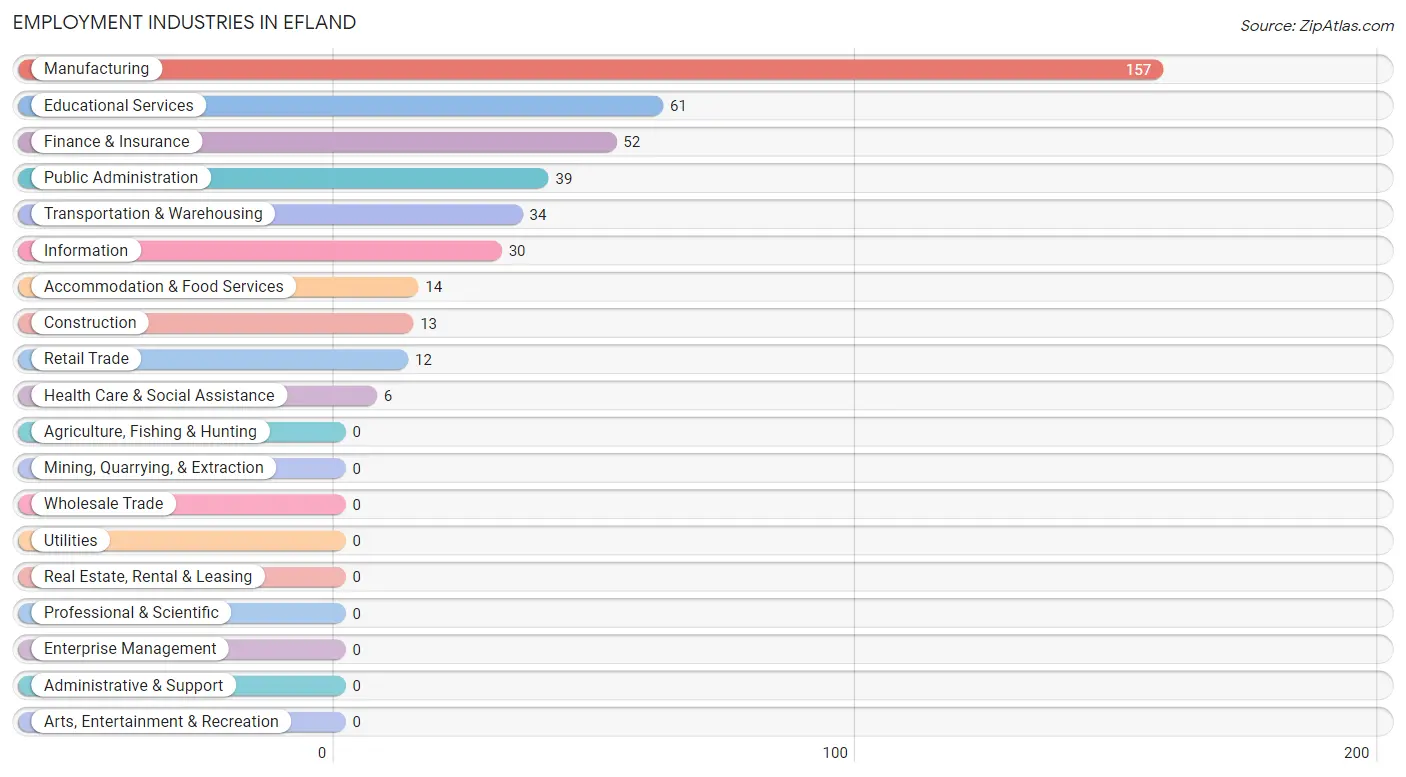
Employment Industries in Efland
The major employment industries in Efland include Manufacturing (157 | 36.7%), Educational Services (61 | 14.2%), Finance & Insurance (52 | 12.1%), Public Administration (39 | 9.1%), and Transportation & Warehousing (34 | 7.9%).
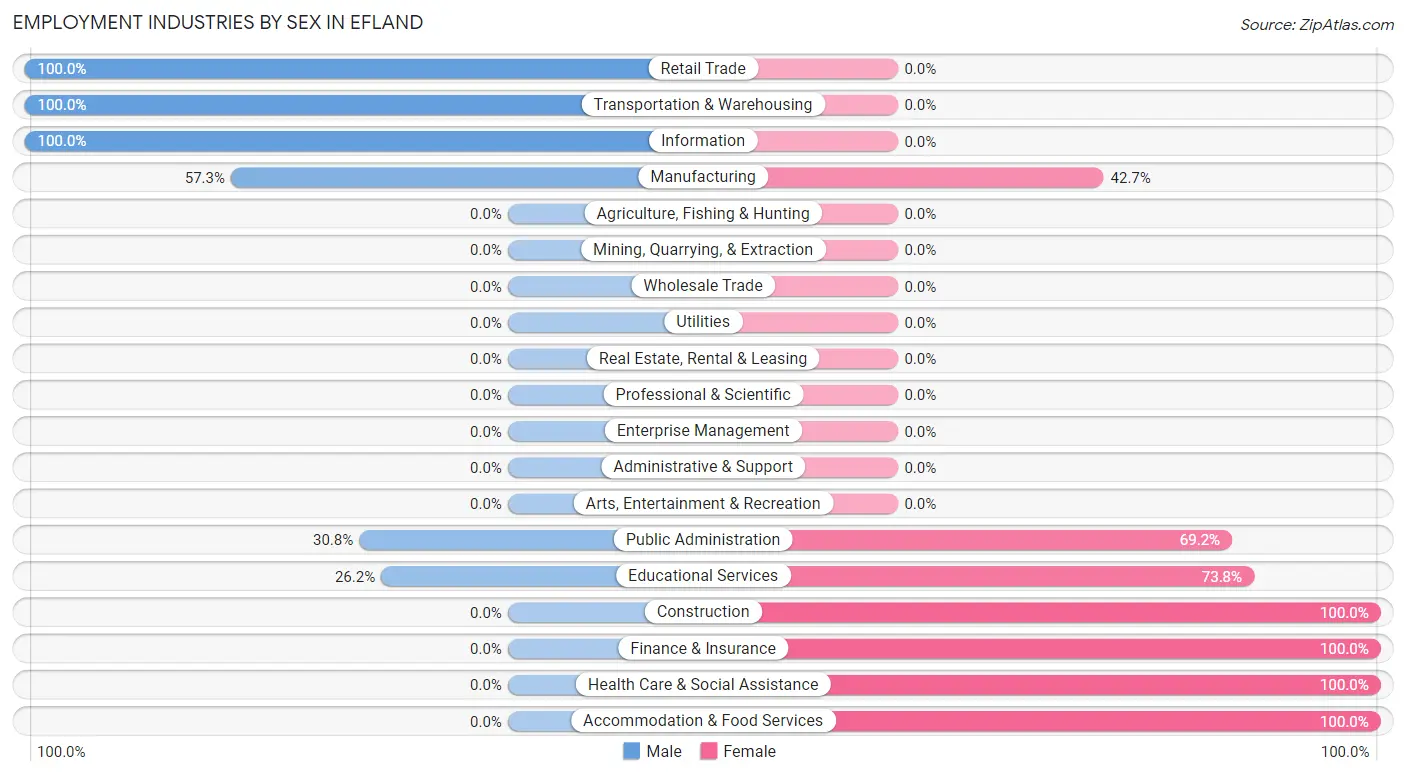
Employment Industries by Sex in Efland
The Efland industries that see more men than women are Retail Trade (100.0%), Transportation & Warehousing (100.0%), and Information (100.0%), whereas the industries that tend to have a higher number of women are Construction (100.0%), Finance & Insurance (100.0%), and Health Care & Social Assistance (100.0%).
| Industry | Male | Female |
| Agriculture, Fishing & Hunting | 0 (0.0%) | 0 (0.0%) |
| Mining, Quarrying, & Extraction | 0 (0.0%) | 0 (0.0%) |
| Construction | 0 (0.0%) | 13 (100.0%) |
| Manufacturing | 90 (57.3%) | 67 (42.7%) |
| Wholesale Trade | 0 (0.0%) | 0 (0.0%) |
| Retail Trade | 12 (100.0%) | 0 (0.0%) |
| Transportation & Warehousing | 34 (100.0%) | 0 (0.0%) |
| Utilities | 0 (0.0%) | 0 (0.0%) |
| Information | 30 (100.0%) | 0 (0.0%) |
| Finance & Insurance | 0 (0.0%) | 52 (100.0%) |
| Real Estate, Rental & Leasing | 0 (0.0%) | 0 (0.0%) |
| Professional & Scientific | 0 (0.0%) | 0 (0.0%) |
| Enterprise Management | 0 (0.0%) | 0 (0.0%) |
| Administrative & Support | 0 (0.0%) | 0 (0.0%) |
| Educational Services | 16 (26.2%) | 45 (73.8%) |
| Health Care & Social Assistance | 0 (0.0%) | 6 (100.0%) |
| Arts, Entertainment & Recreation | 0 (0.0%) | 0 (0.0%) |
| Accommodation & Food Services | 0 (0.0%) | 14 (100.0%) |
| Public Administration | 12 (30.8%) | 27 (69.2%) |
| Total | 204 (47.7%) | 224 (52.3%) |
Education in Efland
School Enrollment in Efland
The most common levels of schooling among the 277 students in Efland are high school (82 | 29.6%), elementary school (74 | 26.7%), and nursery / preschool (39 | 14.1%).
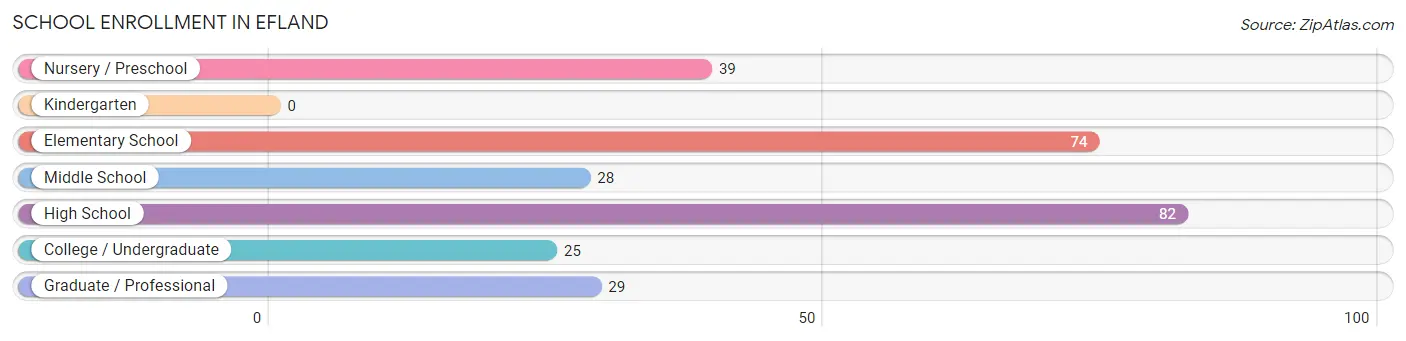
| School Level | # Students | % Students |
| Nursery / Preschool | 39 | 14.1% |
| Kindergarten | 0 | 0.0% |
| Elementary School | 74 | 26.7% |
| Middle School | 28 | 10.1% |
| High School | 82 | 29.6% |
| College / Undergraduate | 25 | 9.0% |
| Graduate / Professional | 29 | 10.5% |
| Total | 277 | 100.0% |
School Enrollment by Age by Funding Source in Efland
Out of a total of 277 students who are enrolled in schools in Efland, 39 (14.1%) attend a private institution, while the remaining 238 (85.9%) are enrolled in public schools. The age group of 5 to 9 year old has the highest likelihood of being enrolled in private schools, with 39 (34.5% in the age bracket) enrolled. Conversely, the age group of 10 to 14 year olds has the lowest likelihood of being enrolled in a private school, with 69 (100.0% in the age bracket) attending a public institution.
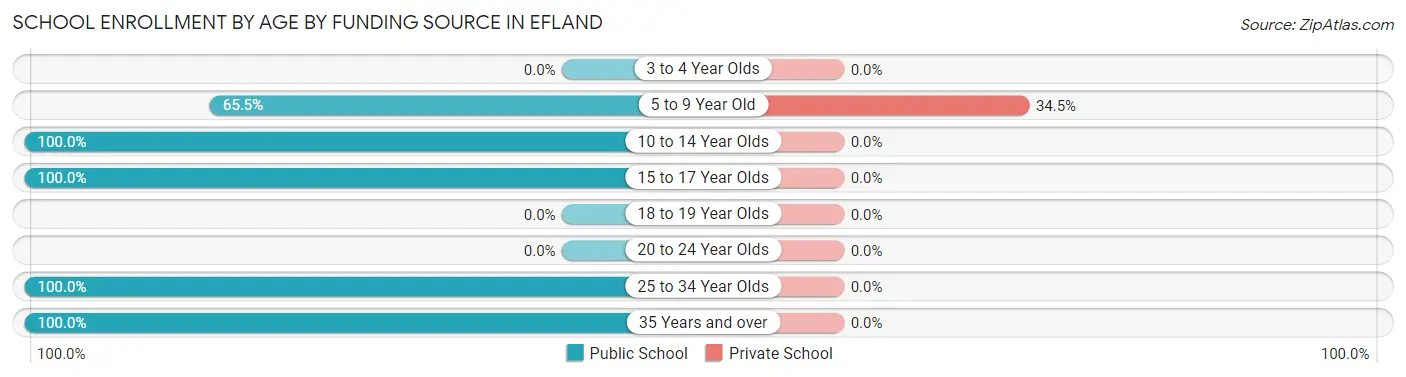
| Age Bracket | Public School | Private School |
| 3 to 4 Year Olds | 0 (0.0%) | 0 (0.0%) |
| 5 to 9 Year Old | 74 (65.5%) | 39 (34.5%) |
| 10 to 14 Year Olds | 69 (100.0%) | 0 (0.0%) |
| 15 to 17 Year Olds | 41 (100.0%) | 0 (0.0%) |
| 18 to 19 Year Olds | 0 (0.0%) | 0 (0.0%) |
| 20 to 24 Year Olds | 0 (0.0%) | 0 (0.0%) |
| 25 to 34 Year Olds | 25 (100.0%) | 0 (0.0%) |
| 35 Years and over | 29 (100.0%) | 0 (0.0%) |
| Total | 238 (85.9%) | 39 (14.1%) |
Educational Attainment by Field of Study in Efland
Bio, nature & agricultural (40 | 21.5%), visual & performing arts (33 | 17.7%), arts & humanities (30 | 16.1%), social sciences (27 | 14.5%), and psychology (16 | 8.6%) are the most common fields of study among 186 individuals in Efland who have obtained a bachelor's degree or higher.
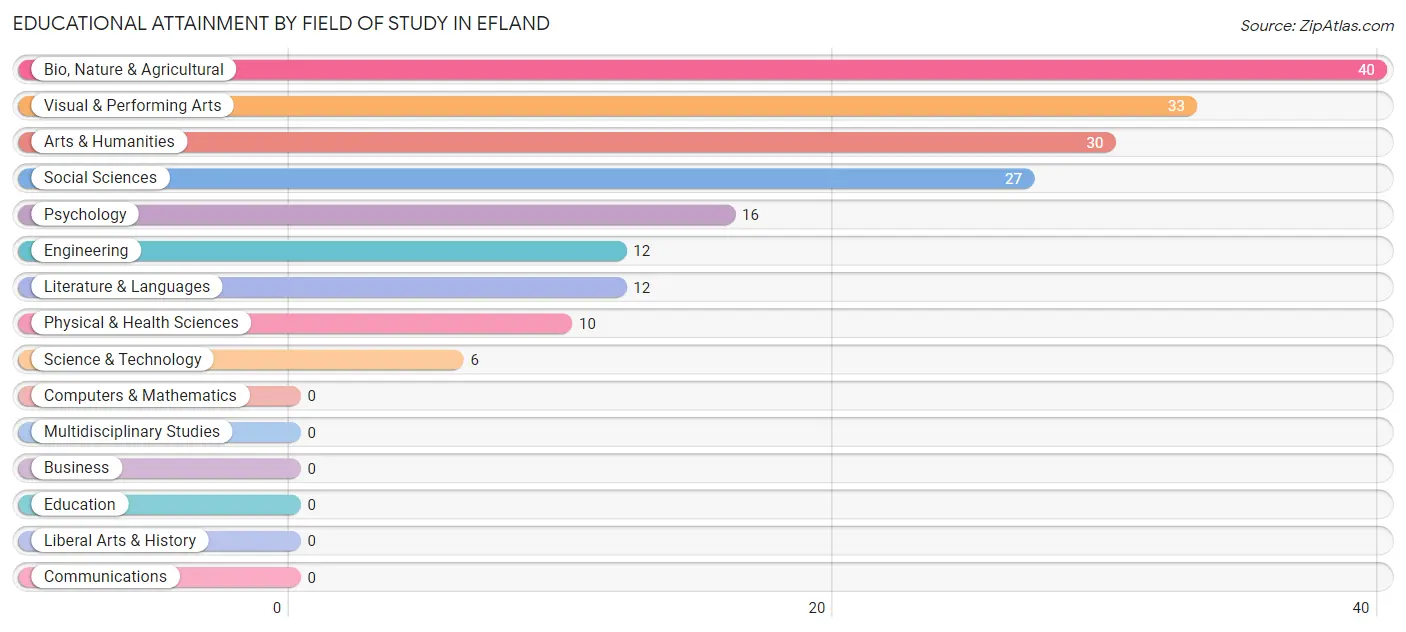
| Field of Study | # Graduates | % Graduates |
| Computers & Mathematics | 0 | 0.0% |
| Bio, Nature & Agricultural | 40 | 21.5% |
| Physical & Health Sciences | 10 | 5.4% |
| Psychology | 16 | 8.6% |
| Social Sciences | 27 | 14.5% |
| Engineering | 12 | 6.5% |
| Multidisciplinary Studies | 0 | 0.0% |
| Science & Technology | 6 | 3.2% |
| Business | 0 | 0.0% |
| Education | 0 | 0.0% |
| Literature & Languages | 12 | 6.5% |
| Liberal Arts & History | 0 | 0.0% |
| Visual & Performing Arts | 33 | 17.7% |
| Communications | 0 | 0.0% |
| Arts & Humanities | 30 | 16.1% |
| Total | 186 | 100.0% |
Transportation & Commute in Efland
Vehicle Availability by Sex in Efland
The most prevalent vehicle ownership categories in Efland are males with 4 vehicles (110, accounting for 53.9%) and females with 4 vehicles (68, making up 57.6%).
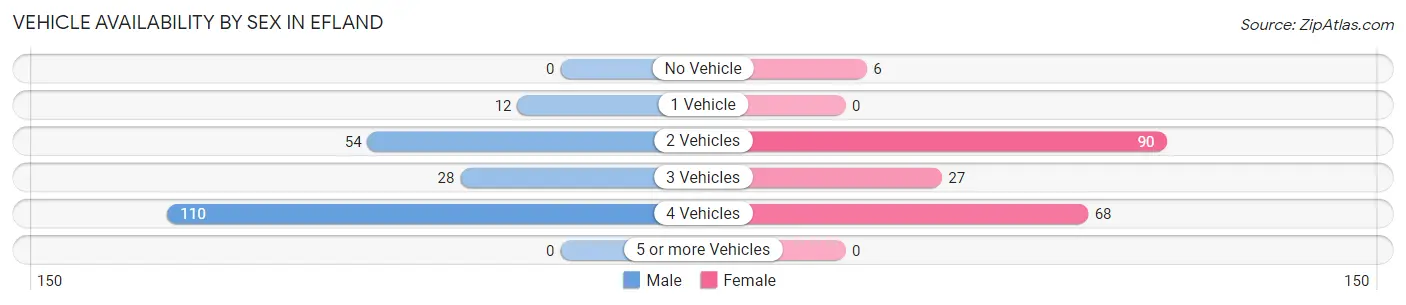
| Vehicles Available | Male | Female |
| No Vehicle | 0 (0.0%) | 6 (3.1%) |
| 1 Vehicle | 12 (5.9%) | 0 (0.0%) |
| 2 Vehicles | 54 (26.5%) | 90 (47.1%) |
| 3 Vehicles | 28 (13.7%) | 27 (14.1%) |
| 4 Vehicles | 110 (53.9%) | 68 (35.6%) |
| 5 or more Vehicles | 0 (0.0%) | 0 (0.0%) |
| Total | 204 (100.0%) | 191 (100.0%) |
Commute Time in Efland
The most frequently occuring commute durations in Efland are 15 to 19 minutes (135 commuters, 45.0%), 60 to 89 minutes (80 commuters, 26.7%), and 30 to 34 minutes (34 commuters, 11.3%).
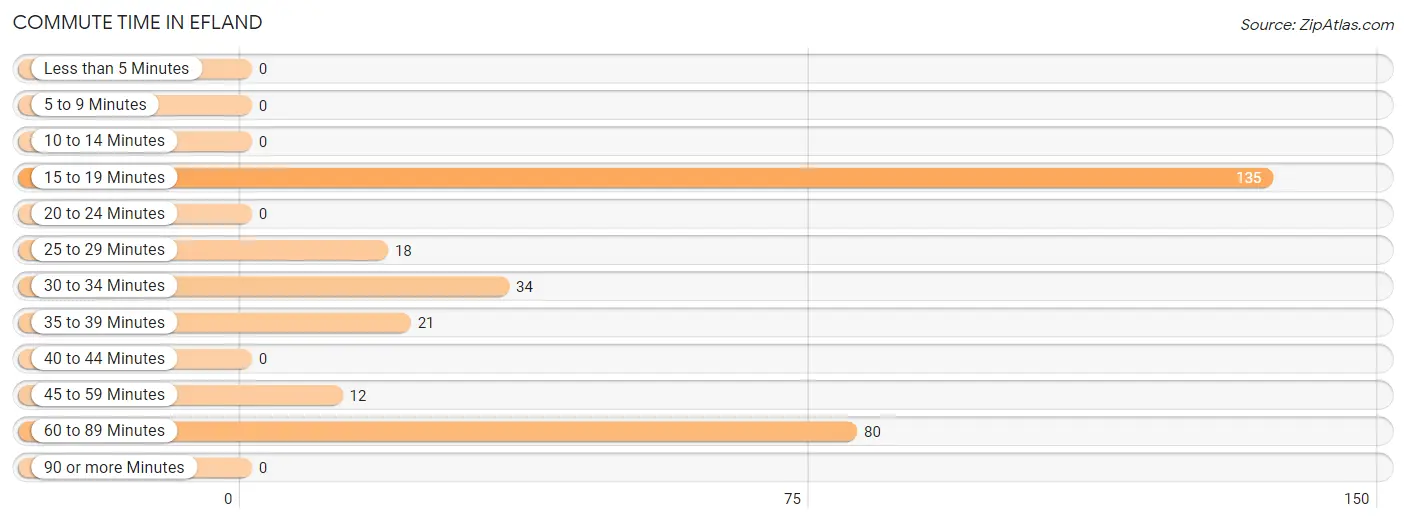
| Commute Time | # Commuters | % Commuters |
| Less than 5 Minutes | 0 | 0.0% |
| 5 to 9 Minutes | 0 | 0.0% |
| 10 to 14 Minutes | 0 | 0.0% |
| 15 to 19 Minutes | 135 | 45.0% |
| 20 to 24 Minutes | 0 | 0.0% |
| 25 to 29 Minutes | 18 | 6.0% |
| 30 to 34 Minutes | 34 | 11.3% |
| 35 to 39 Minutes | 21 | 7.0% |
| 40 to 44 Minutes | 0 | 0.0% |
| 45 to 59 Minutes | 12 | 4.0% |
| 60 to 89 Minutes | 80 | 26.7% |
| 90 or more Minutes | 0 | 0.0% |
Commute Time by Sex in Efland
The most common commute times in Efland are 15 to 19 minutes (106 commuters, 55.2%) for males and 60 to 89 minutes (50 commuters, 46.3%) for females.
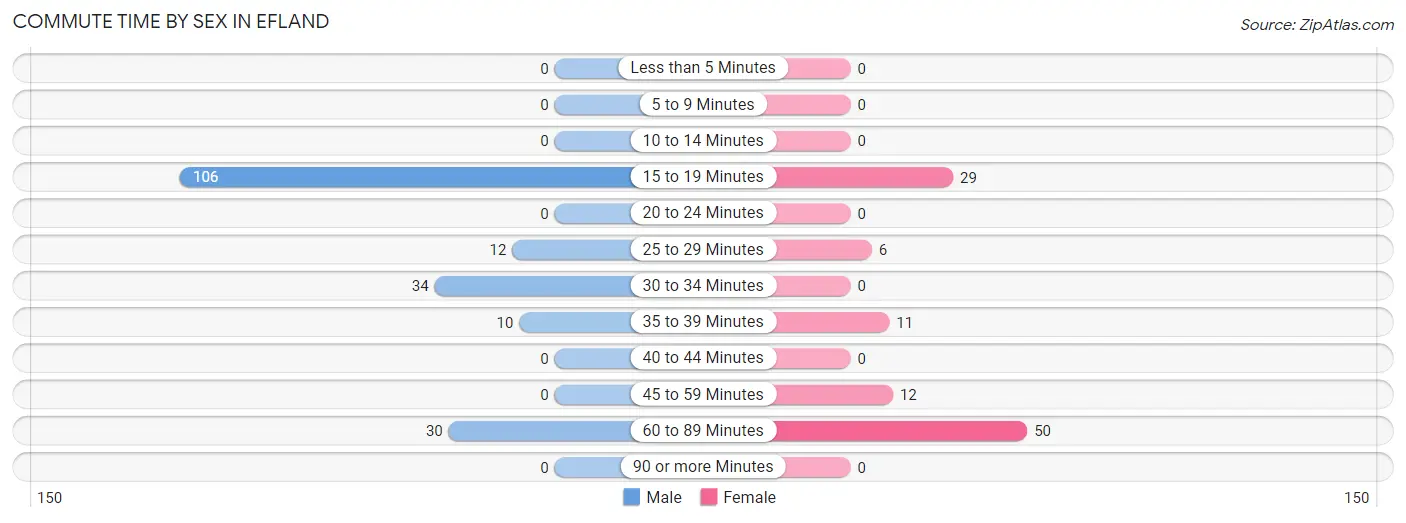
| Commute Time | Male | Female |
| Less than 5 Minutes | 0 (0.0%) | 0 (0.0%) |
| 5 to 9 Minutes | 0 (0.0%) | 0 (0.0%) |
| 10 to 14 Minutes | 0 (0.0%) | 0 (0.0%) |
| 15 to 19 Minutes | 106 (55.2%) | 29 (26.9%) |
| 20 to 24 Minutes | 0 (0.0%) | 0 (0.0%) |
| 25 to 29 Minutes | 12 (6.2%) | 6 (5.6%) |
| 30 to 34 Minutes | 34 (17.7%) | 0 (0.0%) |
| 35 to 39 Minutes | 10 (5.2%) | 11 (10.2%) |
| 40 to 44 Minutes | 0 (0.0%) | 0 (0.0%) |
| 45 to 59 Minutes | 0 (0.0%) | 12 (11.1%) |
| 60 to 89 Minutes | 30 (15.6%) | 50 (46.3%) |
| 90 or more Minutes | 0 (0.0%) | 0 (0.0%) |
Time of Departure to Work by Sex in Efland
The most frequent times of departure to work in Efland are 5:30 AM to 5:59 AM (80, 41.7%) for males and 8:00 AM to 8:29 AM (61, 56.5%) for females.
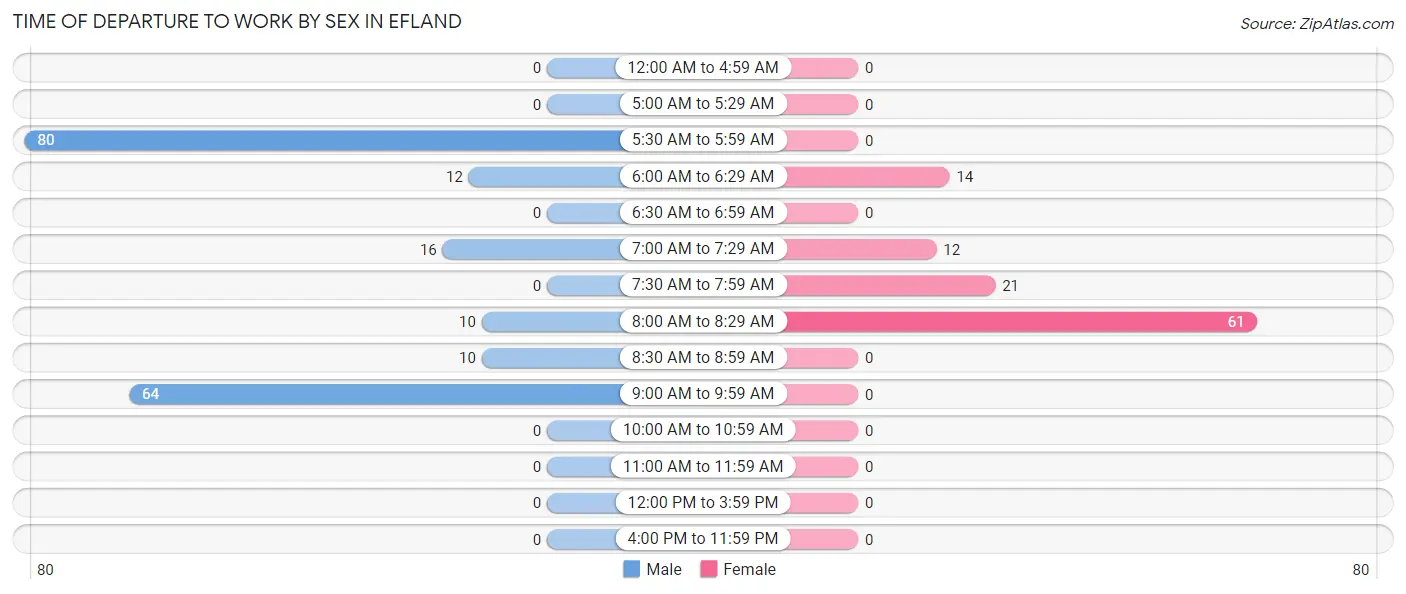
| Time of Departure | Male | Female |
| 12:00 AM to 4:59 AM | 0 (0.0%) | 0 (0.0%) |
| 5:00 AM to 5:29 AM | 0 (0.0%) | 0 (0.0%) |
| 5:30 AM to 5:59 AM | 80 (41.7%) | 0 (0.0%) |
| 6:00 AM to 6:29 AM | 12 (6.2%) | 14 (13.0%) |
| 6:30 AM to 6:59 AM | 0 (0.0%) | 0 (0.0%) |
| 7:00 AM to 7:29 AM | 16 (8.3%) | 12 (11.1%) |
| 7:30 AM to 7:59 AM | 0 (0.0%) | 21 (19.4%) |
| 8:00 AM to 8:29 AM | 10 (5.2%) | 61 (56.5%) |
| 8:30 AM to 8:59 AM | 10 (5.2%) | 0 (0.0%) |
| 9:00 AM to 9:59 AM | 64 (33.3%) | 0 (0.0%) |
| 10:00 AM to 10:59 AM | 0 (0.0%) | 0 (0.0%) |
| 11:00 AM to 11:59 AM | 0 (0.0%) | 0 (0.0%) |
| 12:00 PM to 3:59 PM | 0 (0.0%) | 0 (0.0%) |
| 4:00 PM to 11:59 PM | 0 (0.0%) | 0 (0.0%) |
| Total | 192 (100.0%) | 108 (100.0%) |
Housing Occupancy in Efland
Occupancy by Ownership in Efland
Of the total 366 dwellings in Efland, owner-occupied units account for 321 (87.7%), while renter-occupied units make up 45 (12.3%).
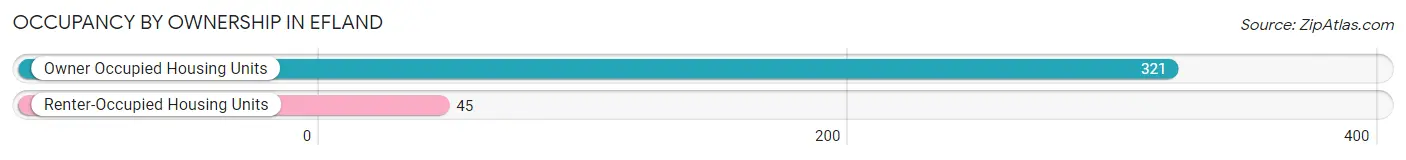
| Occupancy | # Housing Units | % Housing Units |
| Owner Occupied Housing Units | 321 | 87.7% |
| Renter-Occupied Housing Units | 45 | 12.3% |
| Total Occupied Housing Units | 366 | 100.0% |
Occupancy by Household Size in Efland
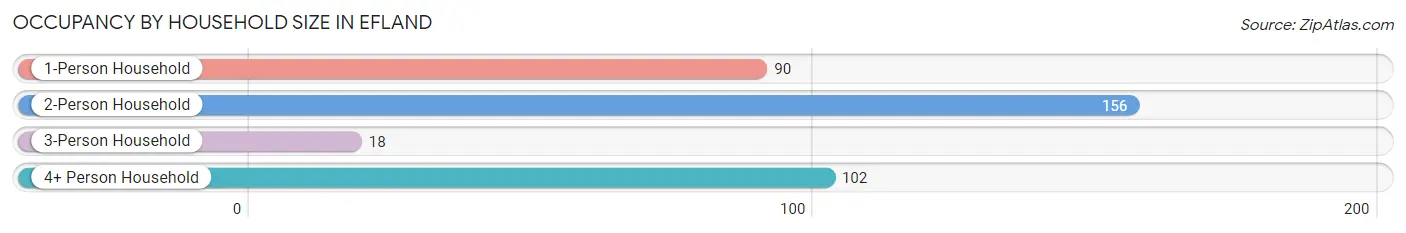
| Household Size | # Housing Units | % Housing Units |
| 1-Person Household | 90 | 24.6% |
| 2-Person Household | 156 | 42.6% |
| 3-Person Household | 18 | 4.9% |
| 4+ Person Household | 102 | 27.9% |
| Total Housing Units | 366 | 100.0% |
Occupancy by Ownership by Household Size in Efland
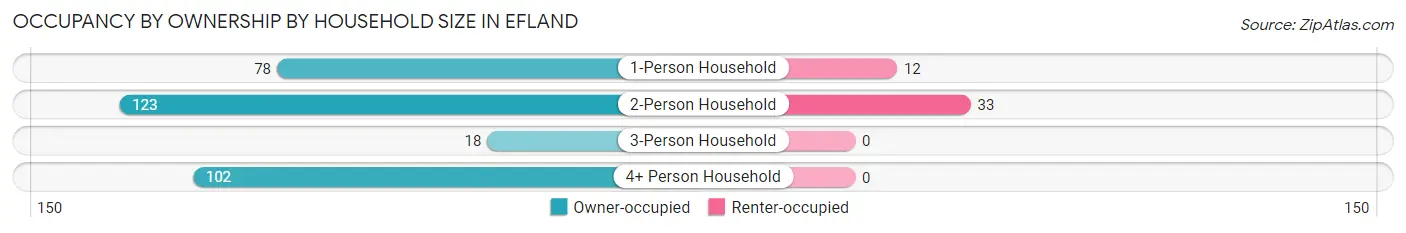
| Household Size | Owner-occupied | Renter-occupied |
| 1-Person Household | 78 (86.7%) | 12 (13.3%) |
| 2-Person Household | 123 (78.8%) | 33 (21.1%) |
| 3-Person Household | 18 (100.0%) | 0 (0.0%) |
| 4+ Person Household | 102 (100.0%) | 0 (0.0%) |
| Total Housing Units | 321 (87.7%) | 45 (12.3%) |
Occupancy by Educational Attainment in Efland
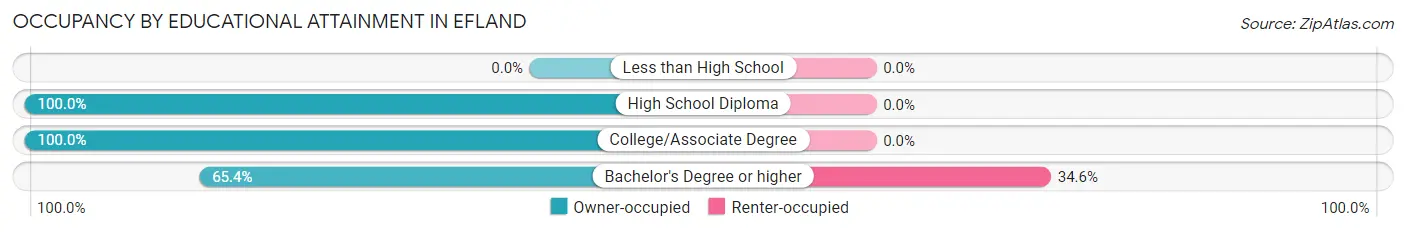
| Household Size | Owner-occupied | Renter-occupied |
| Less than High School | 0 (0.0%) | 0 (0.0%) |
| High School Diploma | 40 (100.0%) | 0 (0.0%) |
| College/Associate Degree | 196 (100.0%) | 0 (0.0%) |
| Bachelor's Degree or higher | 85 (65.4%) | 45 (34.6%) |
Occupancy by Age of Householder in Efland
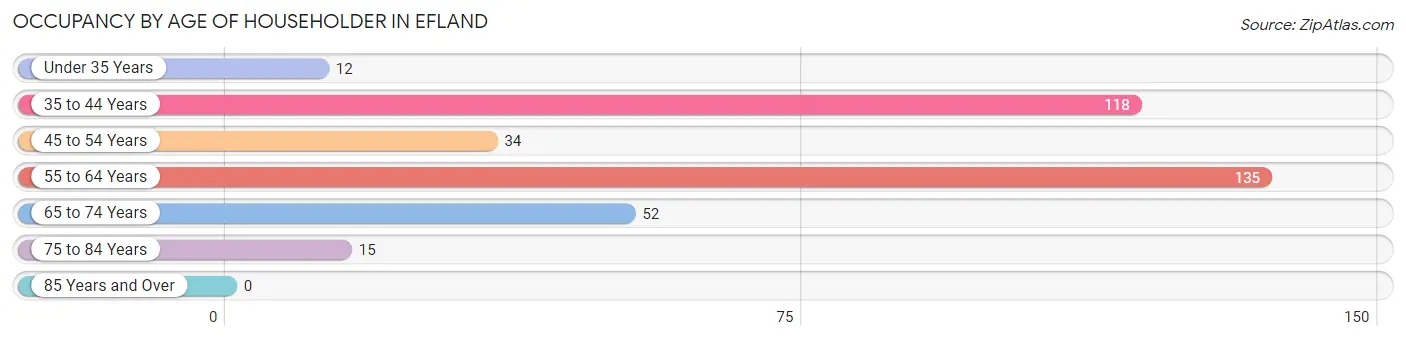
| Age Bracket | # Households | % Households |
| Under 35 Years | 12 | 3.3% |
| 35 to 44 Years | 118 | 32.2% |
| 45 to 54 Years | 34 | 9.3% |
| 55 to 64 Years | 135 | 36.9% |
| 65 to 74 Years | 52 | 14.2% |
| 75 to 84 Years | 15 | 4.1% |
| 85 Years and Over | 0 | 0.0% |
| Total | 366 | 100.0% |
Housing Finances in Efland
Median Income by Occupancy in Efland
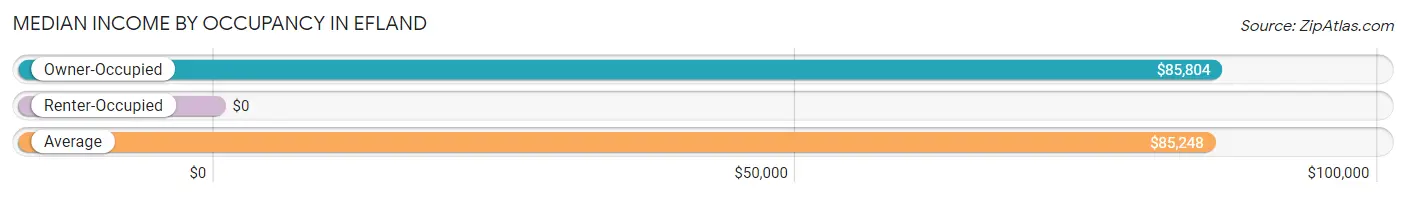
| Occupancy Type | # Households | Median Income |
| Owner-Occupied | 321 (87.7%) | $85,804 |
| Renter-Occupied | 45 (12.3%) | $0 |
| Average | 366 (100.0%) | $85,248 |
Occupancy by Householder Income Bracket in Efland
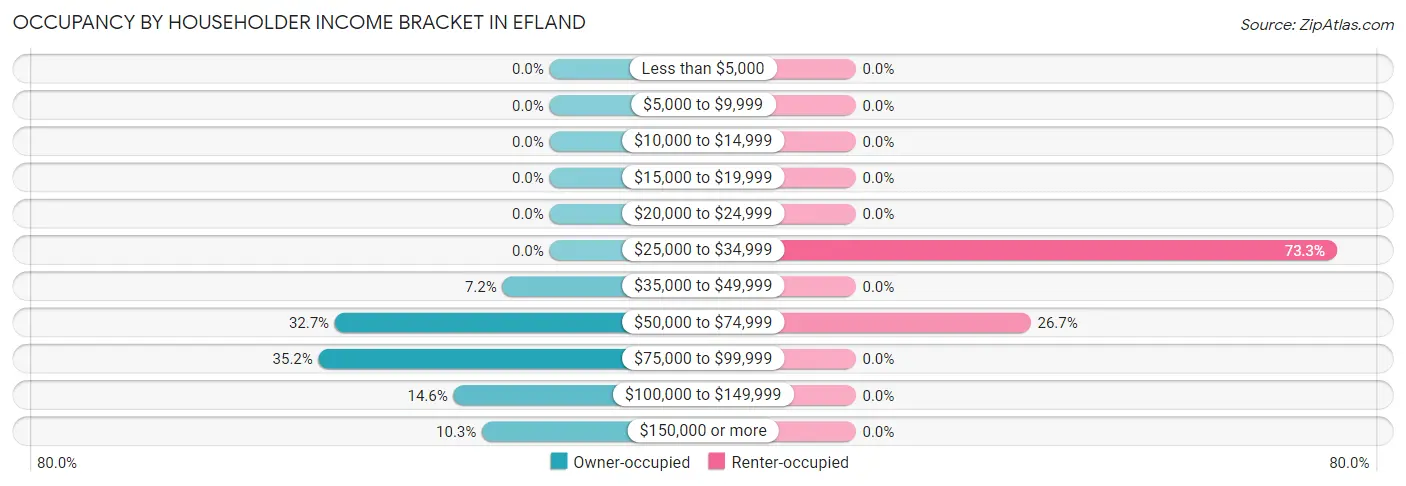
| Income Bracket | Owner-occupied | Renter-occupied |
| Less than $5,000 | 0 (0.0%) | 0 (0.0%) |
| $5,000 to $9,999 | 0 (0.0%) | 0 (0.0%) |
| $10,000 to $14,999 | 0 (0.0%) | 0 (0.0%) |
| $15,000 to $19,999 | 0 (0.0%) | 0 (0.0%) |
| $20,000 to $24,999 | 0 (0.0%) | 0 (0.0%) |
| $25,000 to $34,999 | 0 (0.0%) | 33 (73.3%) |
| $35,000 to $49,999 | 23 (7.2%) | 0 (0.0%) |
| $50,000 to $74,999 | 105 (32.7%) | 12 (26.7%) |
| $75,000 to $99,999 | 113 (35.2%) | 0 (0.0%) |
| $100,000 to $149,999 | 47 (14.6%) | 0 (0.0%) |
| $150,000 or more | 33 (10.3%) | 0 (0.0%) |
| Total | 321 (100.0%) | 45 (100.0%) |
Monthly Housing Cost Tiers in Efland
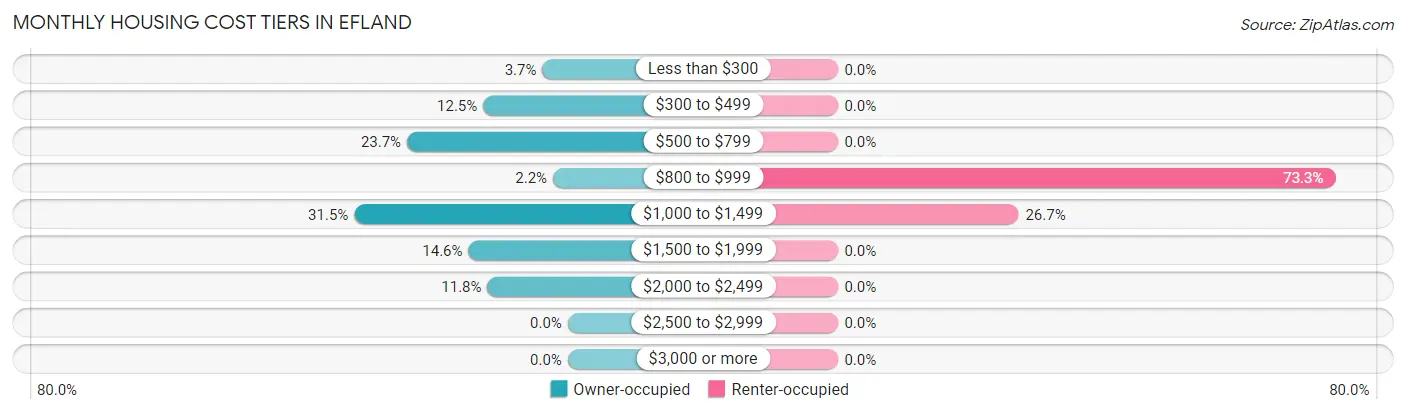
| Monthly Cost | Owner-occupied | Renter-occupied |
| Less than $300 | 12 (3.7%) | 0 (0.0%) |
| $300 to $499 | 40 (12.5%) | 0 (0.0%) |
| $500 to $799 | 76 (23.7%) | 0 (0.0%) |
| $800 to $999 | 7 (2.2%) | 33 (73.3%) |
| $1,000 to $1,499 | 101 (31.5%) | 12 (26.7%) |
| $1,500 to $1,999 | 47 (14.6%) | 0 (0.0%) |
| $2,000 to $2,499 | 38 (11.8%) | 0 (0.0%) |
| $2,500 to $2,999 | 0 (0.0%) | 0 (0.0%) |
| $3,000 or more | 0 (0.0%) | 0 (0.0%) |
| Total | 321 (100.0%) | 45 (100.0%) |
Physical Housing Characteristics in Efland
Housing Structures in Efland
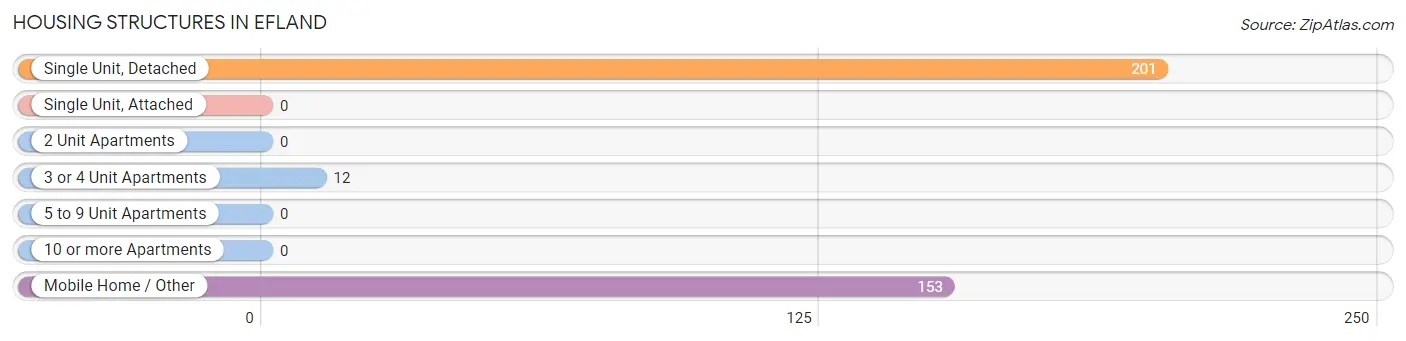
| Structure Type | # Housing Units | % Housing Units |
| Single Unit, Detached | 201 | 54.9% |
| Single Unit, Attached | 0 | 0.0% |
| 2 Unit Apartments | 0 | 0.0% |
| 3 or 4 Unit Apartments | 12 | 3.3% |
| 5 to 9 Unit Apartments | 0 | 0.0% |
| 10 or more Apartments | 0 | 0.0% |
| Mobile Home / Other | 153 | 41.8% |
| Total | 366 | 100.0% |
Housing Structures by Occupancy in Efland
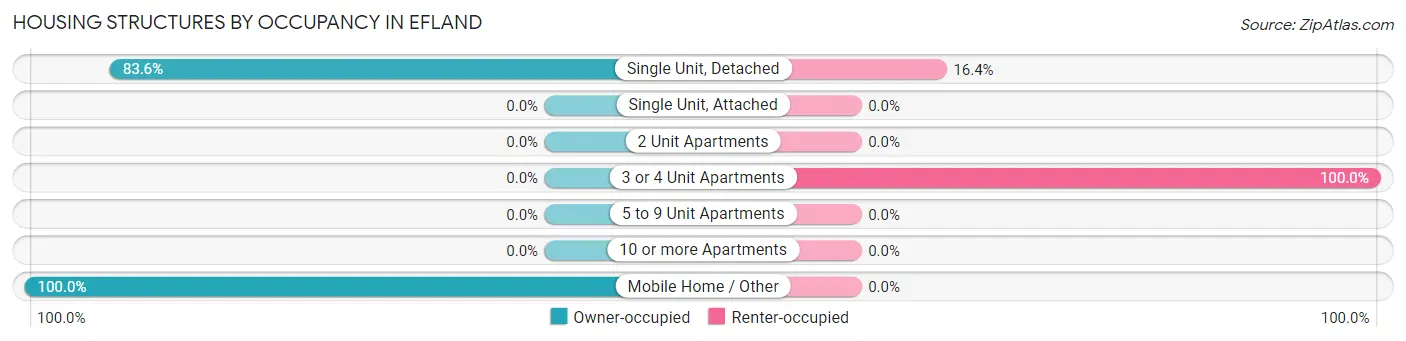
| Structure Type | Owner-occupied | Renter-occupied |
| Single Unit, Detached | 168 (83.6%) | 33 (16.4%) |
| Single Unit, Attached | 0 (0.0%) | 0 (0.0%) |
| 2 Unit Apartments | 0 (0.0%) | 0 (0.0%) |
| 3 or 4 Unit Apartments | 0 (0.0%) | 12 (100.0%) |
| 5 to 9 Unit Apartments | 0 (0.0%) | 0 (0.0%) |
| 10 or more Apartments | 0 (0.0%) | 0 (0.0%) |
| Mobile Home / Other | 153 (100.0%) | 0 (0.0%) |
| Total | 321 (87.7%) | 45 (12.3%) |
Housing Structures by Number of Rooms in Efland
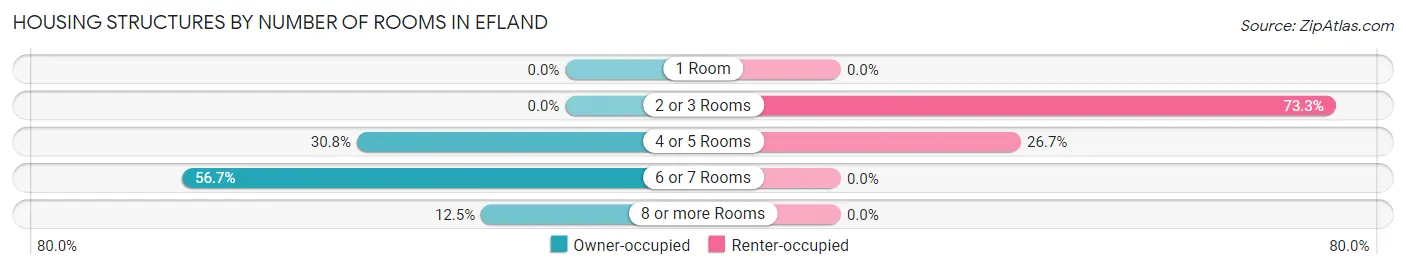
| Number of Rooms | Owner-occupied | Renter-occupied |
| 1 Room | 0 (0.0%) | 0 (0.0%) |
| 2 or 3 Rooms | 0 (0.0%) | 33 (73.3%) |
| 4 or 5 Rooms | 99 (30.8%) | 12 (26.7%) |
| 6 or 7 Rooms | 182 (56.7%) | 0 (0.0%) |
| 8 or more Rooms | 40 (12.5%) | 0 (0.0%) |
| Total | 321 (100.0%) | 45 (100.0%) |
Housing Structure by Heating Type in Efland
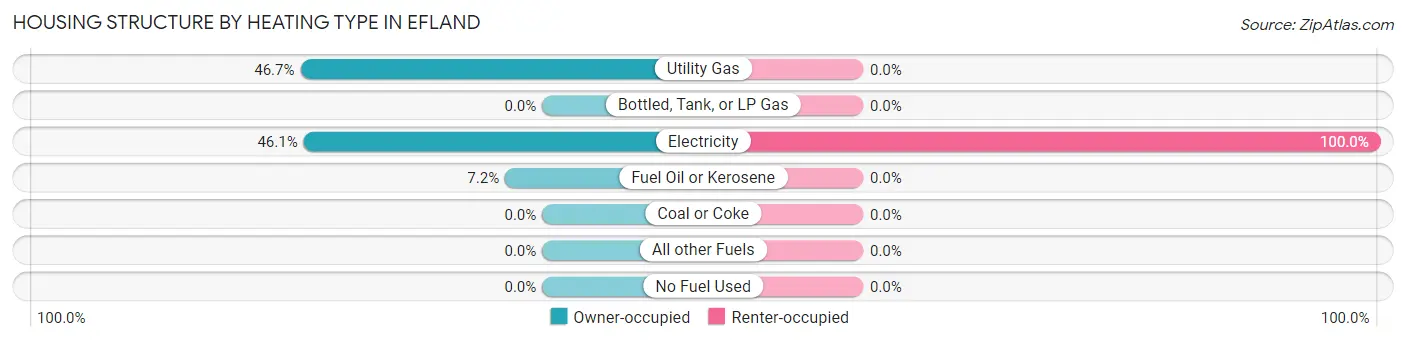
| Heating Type | Owner-occupied | Renter-occupied |
| Utility Gas | 150 (46.7%) | 0 (0.0%) |
| Bottled, Tank, or LP Gas | 0 (0.0%) | 0 (0.0%) |
| Electricity | 148 (46.1%) | 45 (100.0%) |
| Fuel Oil or Kerosene | 23 (7.2%) | 0 (0.0%) |
| Coal or Coke | 0 (0.0%) | 0 (0.0%) |
| All other Fuels | 0 (0.0%) | 0 (0.0%) |
| No Fuel Used | 0 (0.0%) | 0 (0.0%) |
| Total | 321 (100.0%) | 45 (100.0%) |
Household Vehicle Usage in Efland
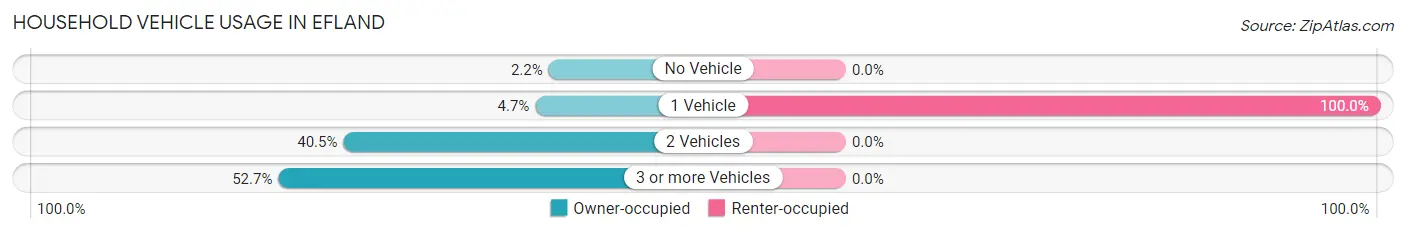
| Vehicles per Household | Owner-occupied | Renter-occupied |
| No Vehicle | 7 (2.2%) | 0 (0.0%) |
| 1 Vehicle | 15 (4.7%) | 45 (100.0%) |
| 2 Vehicles | 130 (40.5%) | 0 (0.0%) |
| 3 or more Vehicles | 169 (52.6%) | 0 (0.0%) |
| Total | 321 (100.0%) | 45 (100.0%) |
Real Estate & Mortgages in Efland
Real Estate and Mortgage Overview in Efland
| Characteristic | Without Mortgage | With Mortgage |
| Housing Units | 52 | 269 |
| Median Property Value | - | - |
| Median Household Income | - | - |
| Monthly Housing Costs | - | - |
| Real Estate Taxes | - | - |
Property Value by Mortgage Status in Efland
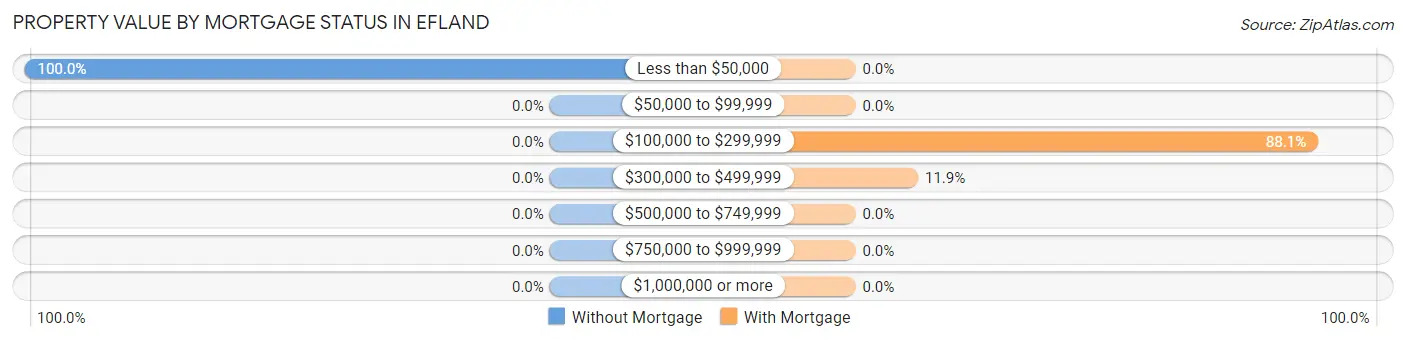
| Property Value | Without Mortgage | With Mortgage |
| Less than $50,000 | 52 (100.0%) | 0 (0.0%) |
| $50,000 to $99,999 | 0 (0.0%) | 0 (0.0%) |
| $100,000 to $299,999 | 0 (0.0%) | 237 (88.1%) |
| $300,000 to $499,999 | 0 (0.0%) | 32 (11.9%) |
| $500,000 to $749,999 | 0 (0.0%) | 0 (0.0%) |
| $750,000 to $999,999 | 0 (0.0%) | 0 (0.0%) |
| $1,000,000 or more | 0 (0.0%) | 0 (0.0%) |
| Total | 52 (100.0%) | 269 (100.0%) |
Household Income by Mortgage Status in Efland
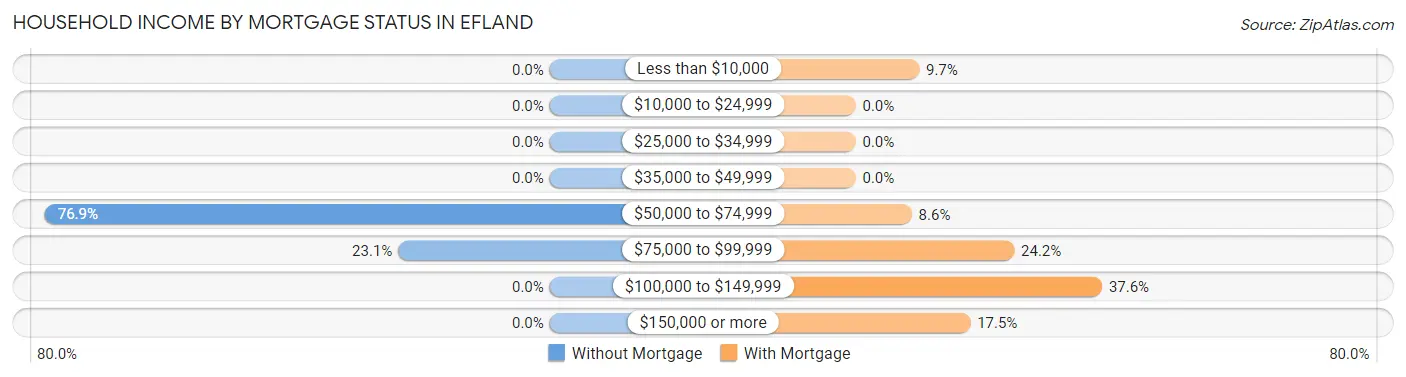
| Household Income | Without Mortgage | With Mortgage |
| Less than $10,000 | 0 (0.0%) | 26 (9.7%) |
| $10,000 to $24,999 | 0 (0.0%) | 0 (0.0%) |
| $25,000 to $34,999 | 0 (0.0%) | 0 (0.0%) |
| $35,000 to $49,999 | 0 (0.0%) | 0 (0.0%) |
| $50,000 to $74,999 | 40 (76.9%) | 23 (8.6%) |
| $75,000 to $99,999 | 12 (23.1%) | 65 (24.2%) |
| $100,000 to $149,999 | 0 (0.0%) | 101 (37.6%) |
| $150,000 or more | 0 (0.0%) | 47 (17.5%) |
| Total | 52 (100.0%) | 269 (100.0%) |
Property Value to Household Income Ratio in Efland
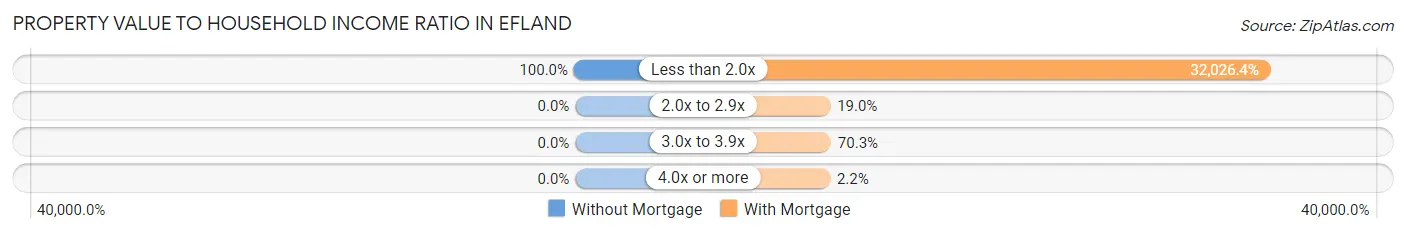
| Value-to-Income Ratio | Without Mortgage | With Mortgage |
| Less than 2.0x | 52 (100.0%) | 86,151 (32,026.4%) |
| 2.0x to 2.9x | 0 (0.0%) | 51 (19.0%) |
| 3.0x to 3.9x | 0 (0.0%) | 189 (70.3%) |
| 4.0x or more | 0 (0.0%) | 6 (2.2%) |
| Total | 52 (100.0%) | 269 (100.0%) |
Real Estate Taxes by Mortgage Status in Efland
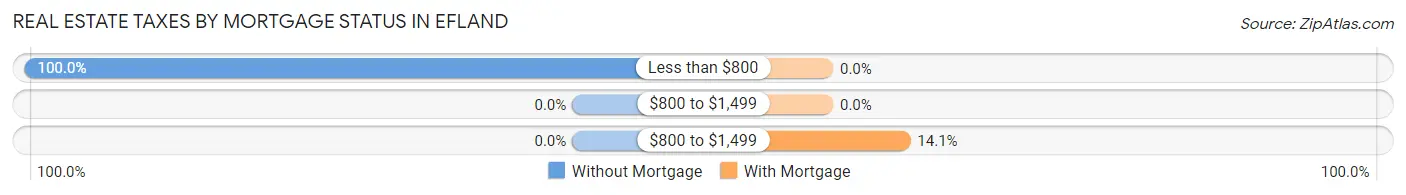
| Property Taxes | Without Mortgage | With Mortgage |
| Less than $800 | 52 (100.0%) | 0 (0.0%) |
| $800 to $1,499 | 0 (0.0%) | 0 (0.0%) |
| $800 to $1,499 | 0 (0.0%) | 38 (14.1%) |
| Total | 52 (100.0%) | 269 (100.0%) |
Health & Disability in Efland
Health Insurance Coverage by Age in Efland
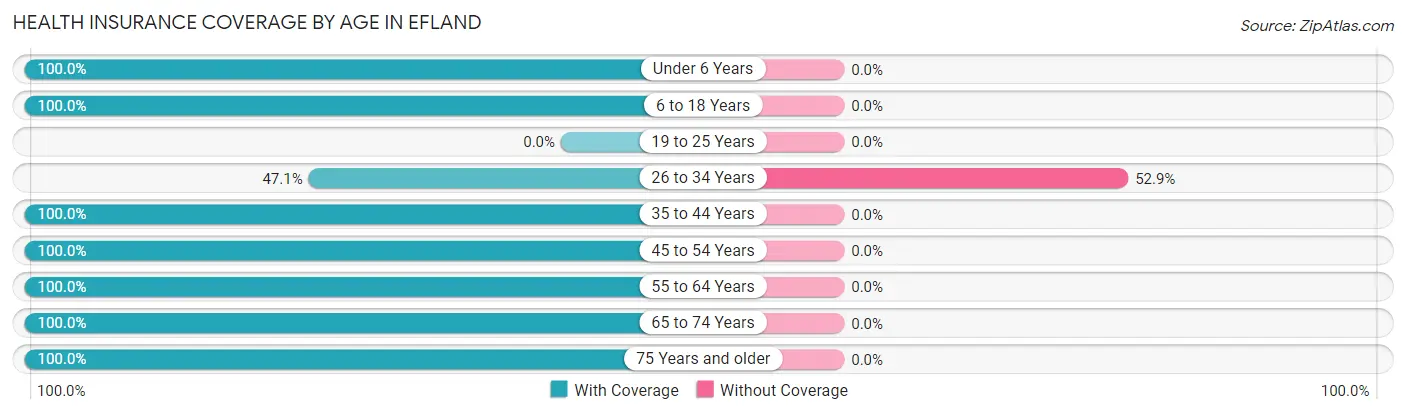
| Age Bracket | With Coverage | Without Coverage |
| Under 6 Years | 50 (100.0%) | 0 (0.0%) |
| 6 to 18 Years | 184 (100.0%) | 0 (0.0%) |
| 19 to 25 Years | 0 (0.0%) | 0 (0.0%) |
| 26 to 34 Years | 24 (47.1%) | 27 (52.9%) |
| 35 to 44 Years | 148 (100.0%) | 0 (0.0%) |
| 45 to 54 Years | 88 (100.0%) | 0 (0.0%) |
| 55 to 64 Years | 237 (100.0%) | 0 (0.0%) |
| 65 to 74 Years | 52 (100.0%) | 0 (0.0%) |
| 75 Years and older | 15 (100.0%) | 0 (0.0%) |
| Total | 798 (96.7%) | 27 (3.3%) |
Health Insurance Coverage by Citizenship Status in Efland
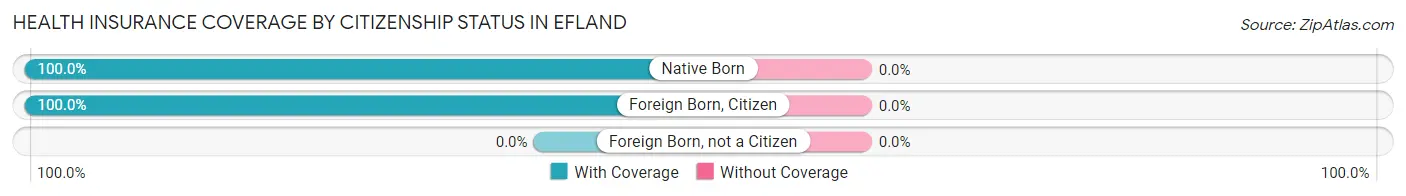
| Citizenship Status | With Coverage | Without Coverage |
| Native Born | 50 (100.0%) | 0 (0.0%) |
| Foreign Born, Citizen | 184 (100.0%) | 0 (0.0%) |
| Foreign Born, not a Citizen | 0 (0.0%) | 0 (0.0%) |
Health Insurance Coverage by Household Income in Efland
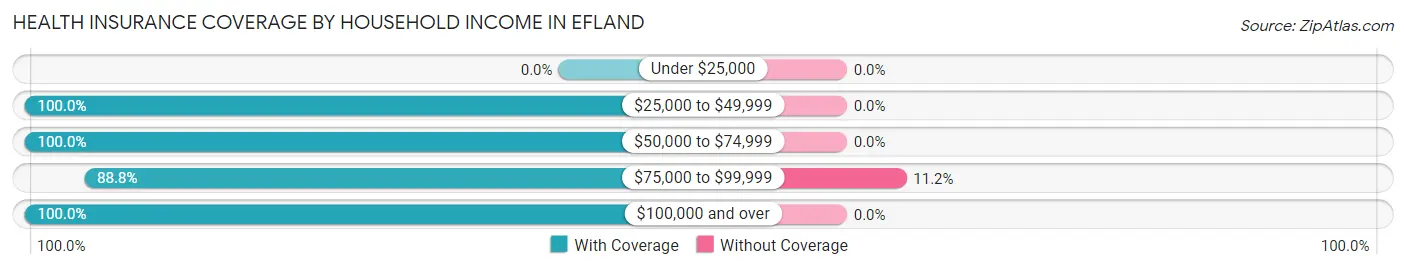
| Household Income | With Coverage | Without Coverage |
| Under $25,000 | 0 (0.0%) | 0 (0.0%) |
| $25,000 to $49,999 | 89 (100.0%) | 0 (0.0%) |
| $50,000 to $74,999 | 233 (100.0%) | 0 (0.0%) |
| $75,000 to $99,999 | 215 (88.8%) | 27 (11.2%) |
| $100,000 and over | 261 (100.0%) | 0 (0.0%) |
Public vs Private Health Insurance Coverage by Age in Efland
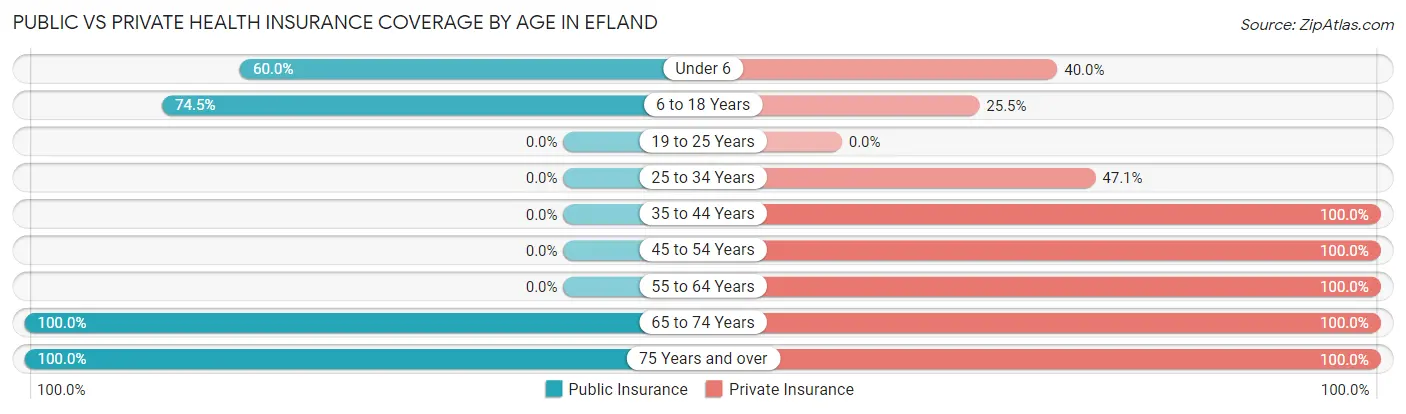
| Age Bracket | Public Insurance | Private Insurance |
| Under 6 | 30 (60.0%) | 20 (40.0%) |
| 6 to 18 Years | 137 (74.5%) | 47 (25.5%) |
| 19 to 25 Years | 0 (0.0%) | 0 (0.0%) |
| 25 to 34 Years | 0 (0.0%) | 24 (47.1%) |
| 35 to 44 Years | 0 (0.0%) | 148 (100.0%) |
| 45 to 54 Years | 0 (0.0%) | 88 (100.0%) |
| 55 to 64 Years | 0 (0.0%) | 237 (100.0%) |
| 65 to 74 Years | 52 (100.0%) | 52 (100.0%) |
| 75 Years and over | 15 (100.0%) | 15 (100.0%) |
| Total | 234 (28.4%) | 631 (76.5%) |
Disability Status by Sex by Age in Efland
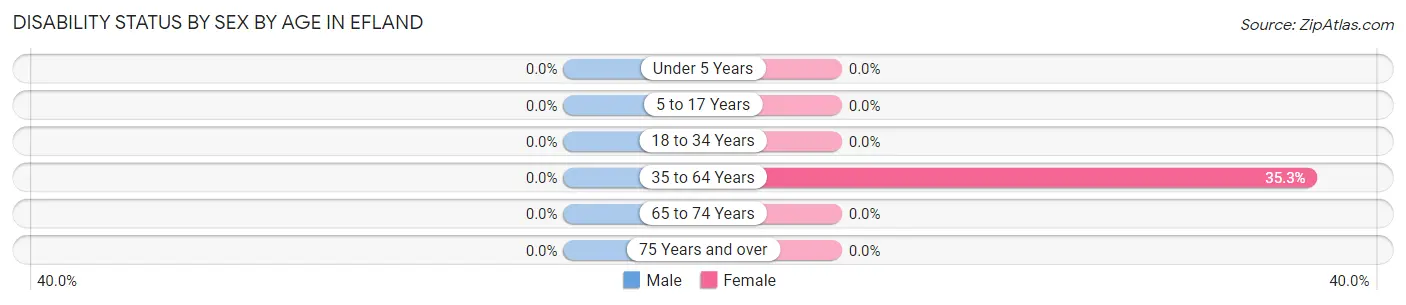
| Age Bracket | Male | Female |
| Under 5 Years | 0 (0.0%) | 0 (0.0%) |
| 5 to 17 Years | 0 (0.0%) | 0 (0.0%) |
| 18 to 34 Years | 0 (0.0%) | 0 (0.0%) |
| 35 to 64 Years | 0 (0.0%) | 101 (35.3%) |
| 65 to 74 Years | 0 (0.0%) | 0 (0.0%) |
| 75 Years and over | 0 (0.0%) | 0 (0.0%) |
Disability Class by Sex by Age in Efland
Disability Class: Hearing Difficulty
| Age Bracket | Male | Female |
| Under 5 Years | 0 (0.0%) | 0 (0.0%) |
| 5 to 17 Years | 0 (0.0%) | 0 (0.0%) |
| 18 to 34 Years | 0 (0.0%) | 0 (0.0%) |
| 35 to 64 Years | 0 (0.0%) | 0 (0.0%) |
| 65 to 74 Years | 0 (0.0%) | 0 (0.0%) |
| 75 Years and over | 0 (0.0%) | 0 (0.0%) |
Disability Class: Vision Difficulty
| Age Bracket | Male | Female |
| Under 5 Years | 0 (0.0%) | 0 (0.0%) |
| 5 to 17 Years | 0 (0.0%) | 0 (0.0%) |
| 18 to 34 Years | 0 (0.0%) | 0 (0.0%) |
| 35 to 64 Years | 0 (0.0%) | 0 (0.0%) |
| 65 to 74 Years | 0 (0.0%) | 0 (0.0%) |
| 75 Years and over | 0 (0.0%) | 0 (0.0%) |
Disability Class: Cognitive Difficulty
| Age Bracket | Male | Female |
| 5 to 17 Years | 0 (0.0%) | 0 (0.0%) |
| 18 to 34 Years | 0 (0.0%) | 0 (0.0%) |
| 35 to 64 Years | 0 (0.0%) | 0 (0.0%) |
| 65 to 74 Years | 0 (0.0%) | 0 (0.0%) |
| 75 Years and over | 0 (0.0%) | 0 (0.0%) |
Disability Class: Ambulatory Difficulty
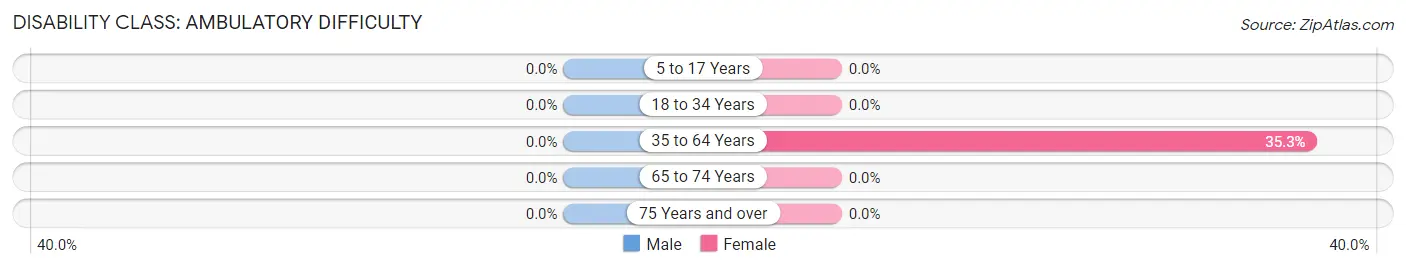
| Age Bracket | Male | Female |
| 5 to 17 Years | 0 (0.0%) | 0 (0.0%) |
| 18 to 34 Years | 0 (0.0%) | 0 (0.0%) |
| 35 to 64 Years | 0 (0.0%) | 101 (35.3%) |
| 65 to 74 Years | 0 (0.0%) | 0 (0.0%) |
| 75 Years and over | 0 (0.0%) | 0 (0.0%) |
Disability Class: Self-Care Difficulty
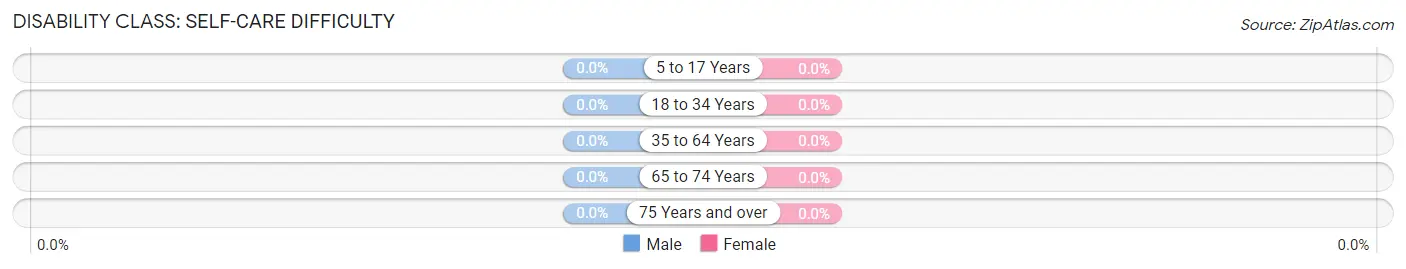
| Age Bracket | Male | Female |
| 5 to 17 Years | 0 (0.0%) | 0 (0.0%) |
| 18 to 34 Years | 0 (0.0%) | 0 (0.0%) |
| 35 to 64 Years | 0 (0.0%) | 0 (0.0%) |
| 65 to 74 Years | 0 (0.0%) | 0 (0.0%) |
| 75 Years and over | 0 (0.0%) | 0 (0.0%) |
Technology Access in Efland
Computing Device Access in Efland
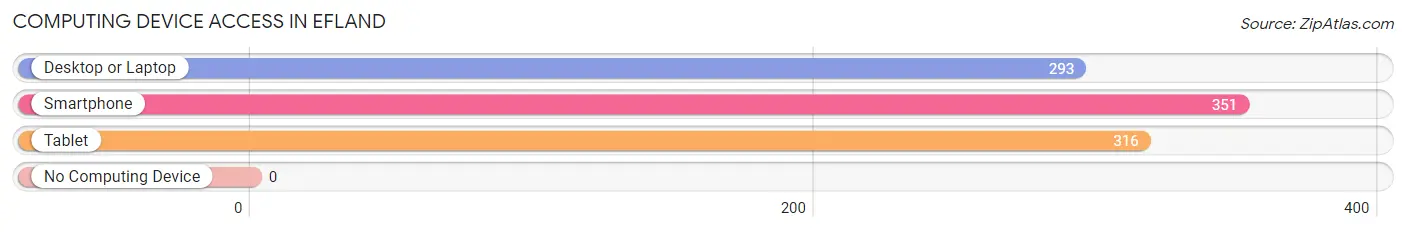
| Device Type | # Households | % Households |
| Desktop or Laptop | 293 | 80.0% |
| Smartphone | 351 | 95.9% |
| Tablet | 316 | 86.3% |
| No Computing Device | 0 | 0.0% |
| Total | 366 | 100.0% |
Internet Access in Efland
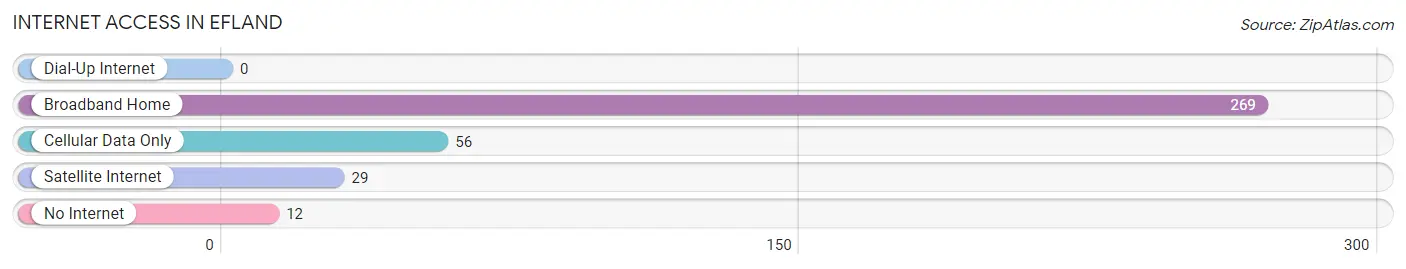
| Internet Type | # Households | % Households |
| Dial-Up Internet | 0 | 0.0% |
| Broadband Home | 269 | 73.5% |
| Cellular Data Only | 56 | 15.3% |
| Satellite Internet | 29 | 7.9% |
| No Internet | 12 | 3.3% |
| Total | 366 | 100.0% |
Efland Summary
Efland is a small unincorporated community located in Orange County, North Carolina. It is situated in the northern part of the county, approximately 15 miles northwest of Chapel Hill and 25 miles southwest of Durham. The population of Efland was estimated to be 1,845 in 2019.
History
Efland was first settled in the early 1800s by a group of German immigrants. The town was named after the Efland family, who were among the first settlers. The town was officially incorporated in 1887.
In the early 1900s, Efland was a thriving agricultural community. The town was home to several cotton mills, a sawmill, and a gristmill. The town also had a post office, a general store, and a school.
In the mid-1900s, Efland began to decline as the cotton mills closed and the population began to move away. The town was eventually unincorporated in the 1970s.
Geography
Efland is located in the northern part of Orange County, North Carolina. It is situated in the Piedmont region of the state, approximately 15 miles northwest of Chapel Hill and 25 miles southwest of Durham.
The town is situated on the banks of the Eno River, which flows through the town. The town is surrounded by rolling hills and forests.
Economy
Efland is a small, rural community with a limited economy. The town is home to several small businesses, including a general store, a gas station, and a few restaurants.
The town is also home to several farms, which produce a variety of crops, including corn, soybeans, and tobacco.
Demographics
As of 2019, the population of Efland was estimated to be 1,845. The town is predominantly white, with a small African American population. The median household income is $45,000, and the median home value is $150,000.
The town is served by the Orange County Public Schools system. The town is also home to several churches, including the Efland United Methodist Church and the Efland Baptist Church.
Conclusion
Efland is a small, rural community located in Orange County, North Carolina. The town was first settled in the early 1800s by a group of German immigrants and was officially incorporated in 1887. In the mid-1900s, the town began to decline as the cotton mills closed and the population began to move away. Today, the town is home to several small businesses, farms, and churches. The population of Efland was estimated to be 1,845 in 2019.
Common Questions
What is Per Capita Income in Efland?
Per Capita income in Efland is $37,934.
What is the Median Family Income in Efland?
Median Family Income in Efland is $86,361.
What is the Median Household income in Efland?
Median Household Income in Efland is $85,248.
What is Income or Wage Gap in Efland?
Income or Wage Gap in Efland is 26.8%.
Women in Efland earn 73.2 cents for every dollar earned by a man.
What is Inequality or Gini Index in Efland?
Inequality or Gini Index in Efland is 0.28.
What is the Total Population of Efland?
Total Population of Efland is 825.
What is the Total Male Population of Efland?
Total Male Population of Efland is 389.
What is the Total Female Population of Efland?
Total Female Population of Efland is 436.
What is the Ratio of Males per 100 Females in Efland?
There are 89.22 Males per 100 Females in Efland.
What is the Ratio of Females per 100 Males in Efland?
There are 112.08 Females per 100 Males in Efland.
What is the Median Population Age in Efland?
Median Population Age in Efland is 44.7 Years.
What is the Average Family Size in Efland
Average Family Size in Efland is 2.7 People.
What is the Average Household Size in Efland
Average Household Size in Efland is 2.2 People.
How Large is the Labor Force in Efland?
There are 428 People in the Labor Forcein in Efland.
What is the Percentage of People in the Labor Force in Efland?
67.7% of People are in the Labor Force in Efland.