Cities with the Highest Percentage of Immigrants from Africa in Oregon
RELATED REPORTS & OPTIONS
Africa
Oregon
Compare Cities
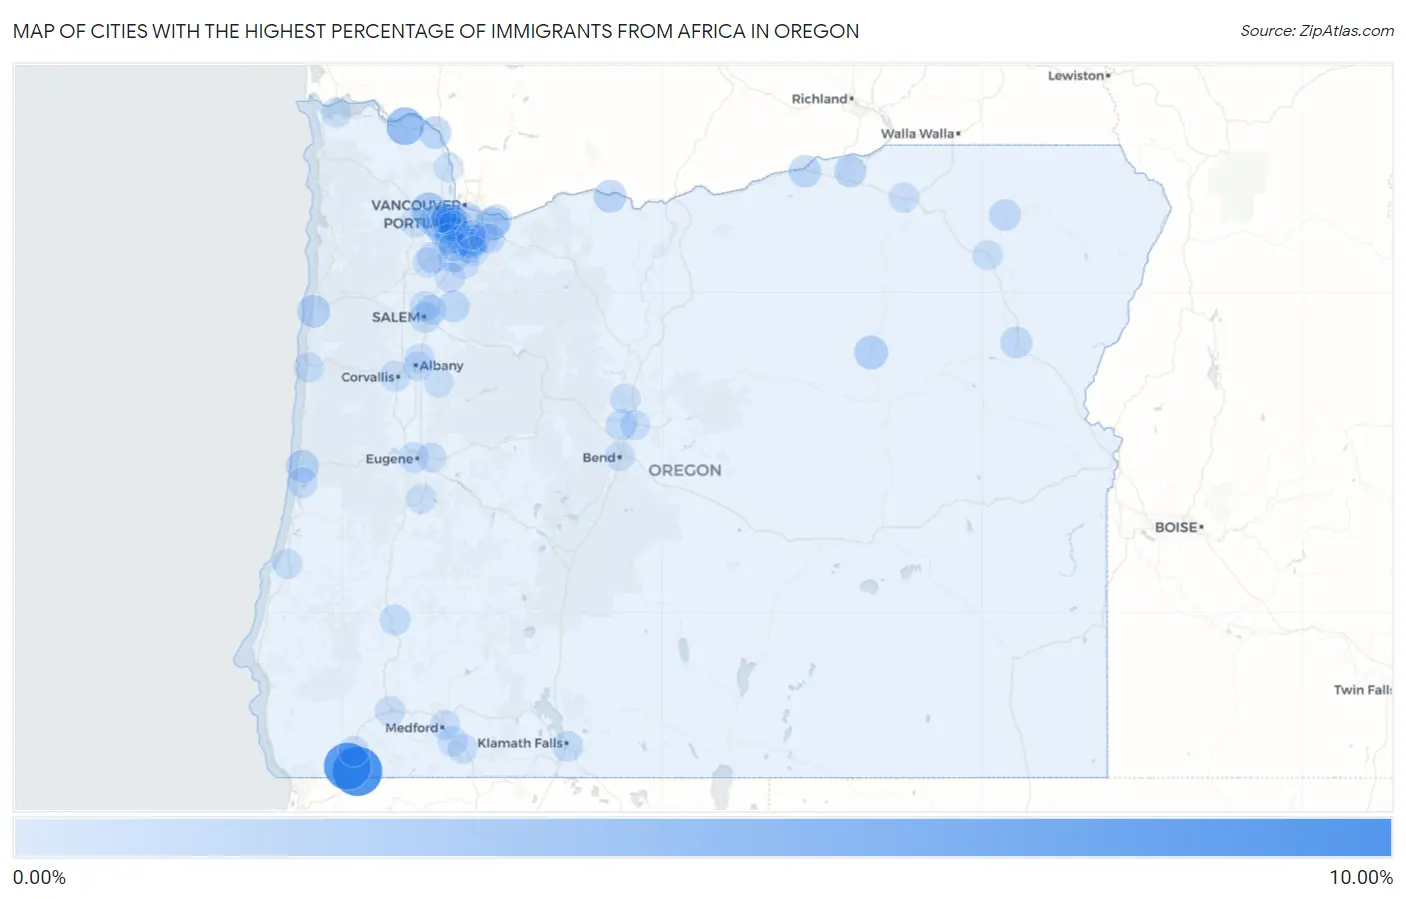
Map of Cities with the Highest Percentage of Immigrants from Africa in Oregon
0.00%
10.00%
Cities with the Highest Percentage of Immigrants from Africa in Oregon
| City | Africa | vs State | vs National | |
| 1. | Takilma | 8.85% | 0.40%(+8.45)#-1 | 0.78%(+8.07)#0 |
| 2. | O Brien | 7.75% | 0.40%(+7.36)#0 | 0.78%(+6.98)#1 |
| 3. | Clatskanie | 3.34% | 0.40%(+2.95)#1 | 0.78%(+2.56)#2 |
| 4. | North Plains | 2.17% | 0.40%(+1.77)#2 | 0.78%(+1.39)#3 |
| 5. | Aloha | 1.65% | 0.40%(+1.25)#3 | 0.78%(+0.868)#4 |
| 6. | Long Creek | 1.58% | 0.40%(+1.18)#4 | 0.78%(+0.800)#5 |
| 7. | Cedar Hills | 1.56% | 0.40%(+1.17)#5 | 0.78%(+0.785)#6 |
| 8. | Gresham | 1.36% | 0.40%(+0.962)#6 | 0.78%(+0.578)#313 |
| 9. | Oak Grove | 1.26% | 0.40%(+0.865)#7 | 0.78%(+0.481)#314 |
| 10. | Florence | 1.23% | 0.40%(+0.830)#8 | 0.78%(+0.446)#315 |
| 11. | Lincoln City | 1.18% | 0.40%(+0.789)#9 | 0.78%(+0.406)#316 |
| 12. | Mosier | 1.11% | 0.40%(+0.716)#10 | 0.78%(+0.332)#317 |
| 13. | Hillsboro | 1.09% | 0.40%(+0.693)#11 | 0.78%(+0.309)#542 |
| 14. | Rainier | 1.04% | 0.40%(+0.649)#12 | 0.78%(+0.265)#543 |
| 15. | Boardman | 0.99% | 0.40%(+0.597)#13 | 0.78%(+0.213)#544 |
| 16. | West Haven Sylvan | 0.96% | 0.40%(+0.560)#14 | 0.78%(+0.176)#545 |
| 17. | Bethany | 0.90% | 0.40%(+0.505)#15 | 0.78%(+0.121)#546 |
| 18. | Portland | 0.88% | 0.40%(+0.486)#16 | 0.78%(+0.102)#547 |
| 19. | Beaverton | 0.86% | 0.40%(+0.463)#17 | 0.78%(+0.080)#548 |
| 20. | Hermiston | 0.82% | 0.40%(+0.425)#18 | 0.78%(+0.041)#549 |
| 21. | Wilsonville | 0.80% | 0.40%(+0.409)#19 | 0.78%(+0.025)#550 |
| 22. | Baker City | 0.77% | 0.40%(+0.376)#20 | 0.78%(-0.008)#551 |
| 23. | Silverton | 0.74% | 0.40%(+0.342)#21 | 0.78%(-0.042)#552 |
| 24. | Cedar Mill | 0.74% | 0.40%(+0.341)#22 | 0.78%(-0.043)#553 |
| 25. | Elgin | 0.69% | 0.40%(+0.291)#23 | 0.78%(-0.093)#554 |
| 26. | Dunthorpe | 0.62% | 0.40%(+0.227)#24 | 0.78%(-0.157)#555 |
| 27. | Lake Oswego | 0.57% | 0.40%(+0.178)#25 | 0.78%(-0.206)#556 |
| 28. | Oatfield | 0.54% | 0.40%(+0.148)#26 | 0.78%(-0.236)#557 |
| 29. | West Linn | 0.50% | 0.40%(+0.101)#27 | 0.78%(-0.282)#558 |
| 30. | Eagle Crest | 0.49% | 0.40%(+0.092)#28 | 0.78%(-0.291)#559 |
| 31. | Troutdale | 0.46% | 0.40%(+0.069)#29 | 0.78%(-0.315)#560 |
| 32. | Bull Mountain | 0.45% | 0.40%(+0.055)#30 | 0.78%(-0.329)#561 |
| 33. | Klamath Falls | 0.41% | 0.40%(+0.017)#31 | 0.78%(-0.367)#562 |
| 34. | Myrtle Creek | 0.40% | 0.40%(+0.006)#32 | 0.78%(-0.378)#563 |
| 35. | West Slope | 0.38% | 0.40%(-0.020)#33 | 0.78%(-0.404)#564 |
| 36. | Salem | 0.37% | 0.40%(-0.027)#34 | 0.78%(-0.411)#565 |
| 37. | Corvallis | 0.37% | 0.40%(-0.029)#35 | 0.78%(-0.413)#566 |
| 38. | Eugene | 0.33% | 0.40%(-0.063)#36 | 0.78%(-0.447)#567 |
| 39. | Newberg | 0.33% | 0.40%(-0.068)#37 | 0.78%(-0.452)#568 |
| 40. | Cave Junction | 0.26% | 0.40%(-0.134)#38 | 0.78%(-0.517)#569 |
| 41. | Tigard | 0.26% | 0.40%(-0.138)#39 | 0.78%(-0.522)#570 |
| 42. | Keizer | 0.25% | 0.40%(-0.145)#40 | 0.78%(-0.529)#571 |
| 43. | Dunes City | 0.25% | 0.40%(-0.150)#41 | 0.78%(-0.534)#572 |
| 44. | Canby | 0.20% | 0.40%(-0.191)#42 | 0.78%(-0.575)#573 |
| 45. | Crooked River Ranch | 0.20% | 0.40%(-0.194)#43 | 0.78%(-0.578)#574 |
| 46. | Jennings Lodge | 0.20% | 0.40%(-0.200)#44 | 0.78%(-0.584)#575 |
| 47. | Rockcreek | 0.19% | 0.40%(-0.204)#45 | 0.78%(-0.588)#576 |
| 48. | Hubbard | 0.18% | 0.40%(-0.220)#46 | 0.78%(-0.604)#577 |
| 49. | Astoria | 0.17% | 0.40%(-0.229)#47 | 0.78%(-0.612)#578 |
| 50. | Talent | 0.16% | 0.40%(-0.236)#48 | 0.78%(-0.619)#579 |
| 51. | Hayesville | 0.16% | 0.40%(-0.240)#49 | 0.78%(-0.623)#580 |
| 52. | Tualatin | 0.15% | 0.40%(-0.244)#50 | 0.78%(-0.628)#581 |
| 53. | Medford | 0.15% | 0.40%(-0.245)#51 | 0.78%(-0.628)#582 |
| 54. | Oak Hills | 0.14% | 0.40%(-0.260)#52 | 0.78%(-0.643)#583 |
| 55. | Millersburg | 0.13% | 0.40%(-0.261)#53 | 0.78%(-0.644)#584 |
| 56. | Dundee | 0.12% | 0.40%(-0.271)#54 | 0.78%(-0.655)#585 |
| 57. | Happy Valley | 0.12% | 0.40%(-0.277)#55 | 0.78%(-0.660)#586 |
| 58. | Grants Pass | 0.11% | 0.40%(-0.281)#56 | 0.78%(-0.664)#587 |
| 59. | Coos Bay | 0.11% | 0.40%(-0.283)#57 | 0.78%(-0.666)#588 |
| 60. | La Grande | 0.11% | 0.40%(-0.289)#58 | 0.78%(-0.672)#589 |
| 61. | Redmond | 0.094% | 0.40%(-0.302)#59 | 0.78%(-0.686)#590 |
| 62. | Newport | 0.087% | 0.40%(-0.308)#60 | 0.78%(-0.692)#591 |
| 63. | Damascus | 0.085% | 0.40%(-0.310)#61 | 0.78%(-0.694)#592 |
| 64. | Pendleton | 0.082% | 0.40%(-0.313)#62 | 0.78%(-0.697)#593 |
| 65. | Lebanon | 0.070% | 0.40%(-0.326)#63 | 0.78%(-0.709)#594 |
| 66. | Forest Grove | 0.069% | 0.40%(-0.327)#64 | 0.78%(-0.710)#595 |
| 67. | Springfield | 0.062% | 0.40%(-0.334)#65 | 0.78%(-0.718)#596 |
| 68. | Santa Clara | 0.062% | 0.40%(-0.334)#66 | 0.78%(-0.718)#597 |
| 69. | Oregon City | 0.059% | 0.40%(-0.337)#67 | 0.78%(-0.720)#598 |
| 70. | Cottage Grove | 0.047% | 0.40%(-0.348)#68 | 0.78%(-0.732)#599 |
| 71. | Albany | 0.044% | 0.40%(-0.351)#69 | 0.78%(-0.735)#600 |
| 72. | Milwaukie | 0.042% | 0.40%(-0.353)#70 | 0.78%(-0.737)#601 |
| 73. | St Helens | 0.029% | 0.40%(-0.367)#71 | 0.78%(-0.751)#602 |
| 74. | Bend | 0.025% | 0.40%(-0.370)#72 | 0.78%(-0.754)#603 |
| 75. | Ashland | 0.019% | 0.40%(-0.377)#73 | 0.78%(-0.761)#604 |
Common Questions
What are the Top 10 Cities with the Highest Percentage of Immigrants from Africa in Oregon?
Top 10 Cities with the Highest Percentage of Immigrants from Africa in Oregon are:
#1
8.85%
#2
7.75%
#3
3.34%
#4
2.17%
#5
1.65%
#6
1.58%
#7
1.56%
#8
1.36%
#9
1.26%
#10
1.23%
What city has the Highest Percentage of Immigrants from Africa in Oregon?
Takilma has the Highest Percentage of Immigrants from Africa in Oregon with 8.85%.
What is the Percentage of Immigrants from Africa in the State of Oregon?
Percentage of Immigrants from Africa in Oregon is 0.40%.
What is the Percentage of Immigrants from Africa in the United States?
Percentage of Immigrants from Africa in the United States is 0.78%.