Cities with the Highest Percentage of Immigrants from Africa in Georgia
RELATED REPORTS & OPTIONS
Africa
Georgia
Compare Cities
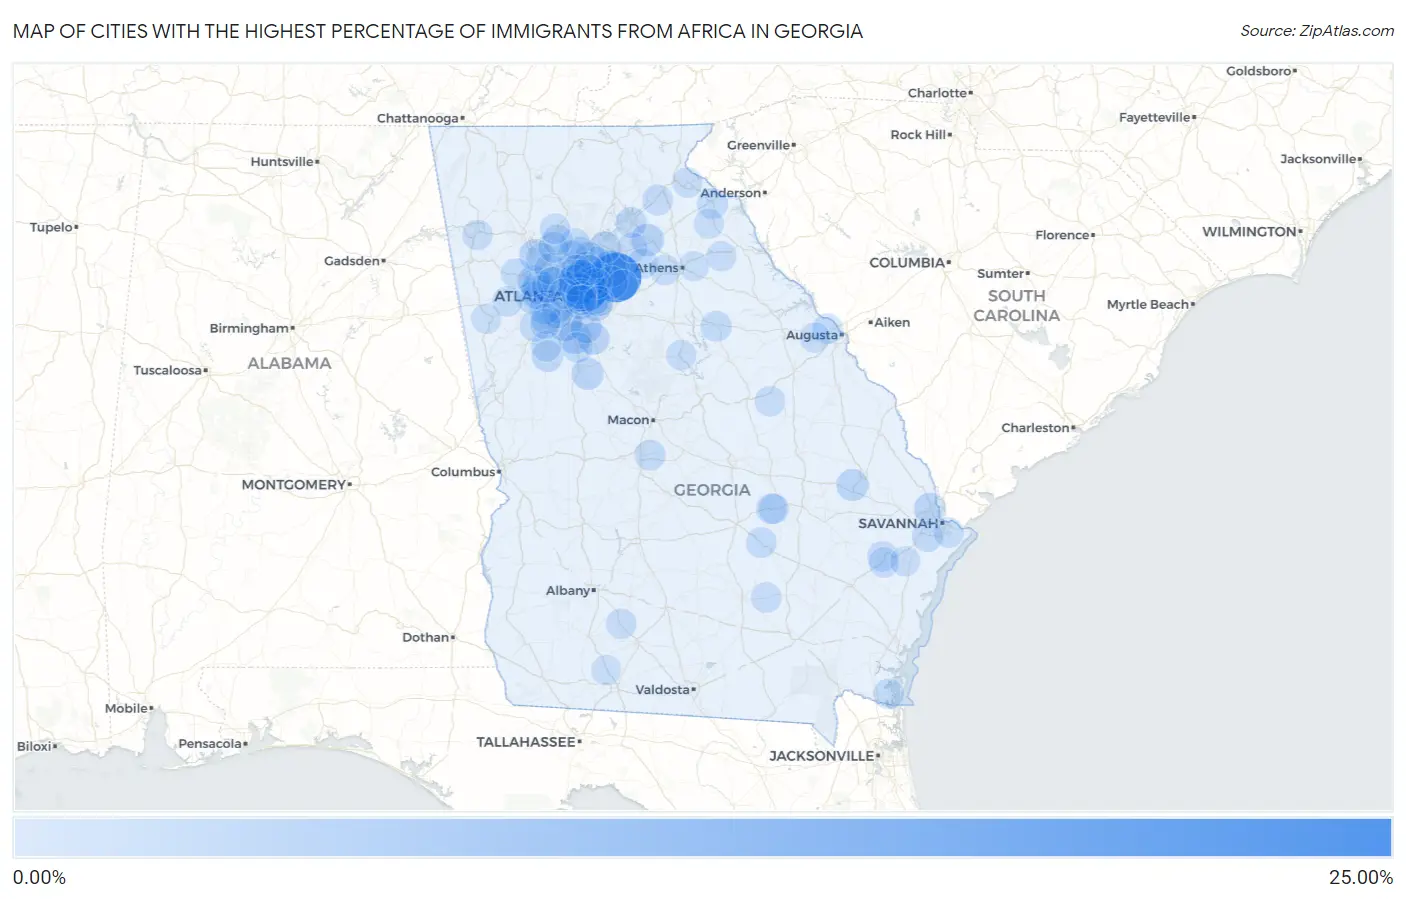
Map of Cities with the Highest Percentage of Immigrants from Africa in Georgia
0.00%
25.00%
Cities with the Highest Percentage of Immigrants from Africa in Georgia
| City | Africa | vs State | vs National | |
| 1. | Grayson | 24.52% | 1.10%(+23.4)#-1 | 0.78%(+23.7)#0 |
| 2. | Clarkston | 23.82% | 1.10%(+22.7)#0 | 0.78%(+23.0)#1 |
| 3. | Lawrenceville | 7.83% | 1.10%(+6.73)#1 | 0.78%(+7.05)#2 |
| 4. | Stone Mountain | 7.67% | 1.10%(+6.57)#2 | 0.78%(+6.89)#3 |
| 5. | Redan | 6.28% | 1.10%(+5.18)#3 | 0.78%(+5.50)#4 |
| 6. | Riverdale | 5.63% | 1.10%(+4.53)#4 | 0.78%(+4.85)#5 |
| 7. | Chamblee | 4.90% | 1.10%(+3.80)#5 | 0.78%(+4.12)#6 |
| 8. | Lilburn | 4.52% | 1.10%(+3.42)#6 | 0.78%(+3.74)#7 |
| 9. | Snellville | 4.04% | 1.10%(+2.94)#7 | 0.78%(+3.26)#8 |
| 10. | Panthersville | 4.00% | 1.10%(+2.90)#8 | 0.78%(+3.22)#9 |
| 11. | Austell | 3.86% | 1.10%(+2.76)#9 | 0.78%(+3.08)#10 |
| 12. | Lithia Springs | 3.81% | 1.10%(+2.71)#10 | 0.78%(+3.03)#11 |
| 13. | Lovejoy | 3.69% | 1.10%(+2.59)#11 | 0.78%(+2.91)#12 |
| 14. | Pendergrass | 3.58% | 1.10%(+2.48)#12 | 0.78%(+2.80)#13 |
| 15. | Tucker | 3.25% | 1.10%(+2.16)#13 | 0.78%(+2.48)#14 |
| 16. | Register | 2.87% | 1.10%(+1.77)#14 | 0.78%(+2.09)#15 |
| 17. | Douglasville | 2.83% | 1.10%(+1.73)#15 | 0.78%(+2.05)#16 |
| 18. | Stonecrest | 2.77% | 1.10%(+1.67)#16 | 0.78%(+1.99)#17 |
| 19. | Sugar Hill | 2.66% | 1.10%(+1.56)#17 | 0.78%(+1.88)#18 |
| 20. | Orchard Hill | 2.60% | 1.10%(+1.51)#18 | 0.78%(+1.82)#19 |
| 21. | Sandy Springs | 2.60% | 1.10%(+1.50)#19 | 0.78%(+1.82)#20 |
| 22. | Port Wentworth | 2.58% | 1.10%(+1.49)#20 | 0.78%(+1.81)#21 |
| 23. | Scottdale | 2.57% | 1.10%(+1.48)#21 | 0.78%(+1.80)#22 |
| 24. | Cataula | 2.57% | 1.10%(+1.47)#22 | 0.78%(+1.79)#23 |
| 25. | Powder Springs | 2.44% | 1.10%(+1.34)#23 | 0.78%(+1.66)#24 |
| 26. | Acworth | 2.43% | 1.10%(+1.33)#24 | 0.78%(+1.65)#25 |
| 27. | Duluth | 2.37% | 1.10%(+1.27)#25 | 0.78%(+1.59)#85 |
| 28. | North Druid Hills | 2.29% | 1.10%(+1.19)#26 | 0.78%(+1.51)#86 |
| 29. | Mcdonough | 2.25% | 1.10%(+1.15)#27 | 0.78%(+1.47)#87 |
| 30. | Mableton | 2.24% | 1.10%(+1.14)#28 | 0.78%(+1.46)#88 |
| 31. | College Park | 2.04% | 1.10%(+0.942)#29 | 0.78%(+1.26)#89 |
| 32. | Stockbridge | 1.95% | 1.10%(+0.852)#30 | 0.78%(+1.17)#90 |
| 33. | South Fulton | 1.92% | 1.10%(+0.821)#31 | 0.78%(+1.14)#91 |
| 34. | Senoia | 1.88% | 1.10%(+0.778)#32 | 0.78%(+1.10)#92 |
| 35. | Johns Creek | 1.86% | 1.10%(+0.760)#33 | 0.78%(+1.08)#93 |
| 36. | Alpharetta | 1.82% | 1.10%(+0.725)#34 | 0.78%(+1.05)#113 |
| 37. | Kennesaw | 1.78% | 1.10%(+0.681)#35 | 0.78%(+1.00)#114 |
| 38. | Vinings | 1.76% | 1.10%(+0.662)#36 | 0.78%(+0.982)#115 |
| 39. | Marietta | 1.76% | 1.10%(+0.657)#37 | 0.78%(+0.977)#116 |
| 40. | Peachtree Corners | 1.73% | 1.10%(+0.633)#38 | 0.78%(+0.953)#332 |
| 41. | North Decatur | 1.71% | 1.10%(+0.612)#39 | 0.78%(+0.932)#333 |
| 42. | East Point | 1.71% | 1.10%(+0.612)#40 | 0.78%(+0.931)#334 |
| 43. | Smyrna | 1.69% | 1.10%(+0.587)#41 | 0.78%(+0.907)#335 |
| 44. | Gainesville | 1.64% | 1.10%(+0.544)#42 | 0.78%(+0.864)#336 |
| 45. | Georgetown | 1.61% | 1.10%(+0.510)#43 | 0.78%(+0.830)#337 |
| 46. | Roswell | 1.55% | 1.10%(+0.450)#44 | 0.78%(+0.770)#338 |
| 47. | Lavonia | 1.41% | 1.10%(+0.315)#45 | 0.78%(+0.635)#339 |
| 48. | Decatur | 1.39% | 1.10%(+0.289)#46 | 0.78%(+0.609)#340 |
| 49. | Palmetto | 1.35% | 1.10%(+0.256)#47 | 0.78%(+0.576)#341 |
| 50. | Dallas | 1.27% | 1.10%(+0.175)#48 | 0.78%(+0.495)#342 |
| 51. | Hampton | 1.27% | 1.10%(+0.175)#49 | 0.78%(+0.494)#343 |
| 52. | Peachtree City | 1.27% | 1.10%(+0.174)#50 | 0.78%(+0.494)#344 |
| 53. | Siloam | 1.26% | 1.10%(+0.164)#51 | 0.78%(+0.483)#345 |
| 54. | Warner Robins | 1.25% | 1.10%(+0.148)#52 | 0.78%(+0.467)#346 |
| 55. | Brookhaven | 1.23% | 1.10%(+0.134)#53 | 0.78%(+0.454)#347 |
| 56. | Union City | 1.23% | 1.10%(+0.129)#54 | 0.78%(+0.449)#348 |
| 57. | Doraville | 1.16% | 1.10%(+0.061)#55 | 0.78%(+0.381)#349 |
| 58. | Mountain Park | 1.13% | 1.10%(+0.033)#56 | 0.78%(+0.353)#350 |
| 59. | Avondale Estates | 1.11% | 1.10%(+0.013)#57 | 0.78%(+0.333)#351 |
| 60. | Raoul | 1.11% | 1.10%(+0.008)#58 | 0.78%(+0.328)#352 |
| 61. | Milton | 1.07% | 1.10%(-0.027)#59 | 0.78%(+0.293)#353 |
| 62. | Lumber City | 1.06% | 1.10%(-0.034)#60 | 0.78%(+0.285)#354 |
| 63. | Kings Bay Base | 1.06% | 1.10%(-0.037)#61 | 0.78%(+0.282)#355 |
| 64. | Winder | 1.04% | 1.10%(-0.056)#62 | 0.78%(+0.263)#356 |
| 65. | Woodstock | 1.04% | 1.10%(-0.061)#63 | 0.78%(+0.259)#357 |
| 66. | Holly Springs | 1.04% | 1.10%(-0.062)#64 | 0.78%(+0.258)#358 |
| 67. | Martinez | 1.02% | 1.10%(-0.075)#65 | 0.78%(+0.245)#359 |
| 68. | Mount Vernon | 1.02% | 1.10%(-0.077)#66 | 0.78%(+0.242)#360 |
| 69. | Bogart | 1.02% | 1.10%(-0.080)#67 | 0.78%(+0.240)#361 |
| 70. | Davisboro | 1.00% | 1.10%(-0.097)#68 | 0.78%(+0.223)#362 |
| 71. | Kennesaw State University | 0.98% | 1.10%(-0.115)#69 | 0.78%(+0.205)#363 |
| 72. | Hinesville | 0.97% | 1.10%(-0.132)#70 | 0.78%(+0.188)#364 |
| 73. | Loganville | 0.95% | 1.10%(-0.147)#71 | 0.78%(+0.173)#365 |
| 74. | Belvedere Park | 0.94% | 1.10%(-0.158)#72 | 0.78%(+0.162)#366 |
| 75. | Canton | 0.92% | 1.10%(-0.183)#73 | 0.78%(+0.137)#367 |
| 76. | Atlanta | 0.90% | 1.10%(-0.204)#74 | 0.78%(+0.116)#548 |
| 77. | Candler Mcafee | 0.89% | 1.10%(-0.205)#75 | 0.78%(+0.115)#549 |
| 78. | Dunwoody | 0.89% | 1.10%(-0.207)#76 | 0.78%(+0.113)#550 |
| 79. | Norcross | 0.89% | 1.10%(-0.209)#77 | 0.78%(+0.111)#551 |
| 80. | Athens-Clarke County Unified Government (Balance) | 0.87% | 1.10%(-0.230)#78 | 0.78%(+0.090)#552 |
| 81. | Lindale | 0.85% | 1.10%(-0.245)#79 | 0.78%(+0.074)#553 |
| 82. | Nicholls | 0.85% | 1.10%(-0.250)#80 | 0.78%(+0.070)#554 |
| 83. | Allenhurst | 0.78% | 1.10%(-0.322)#81 | 0.78%(-0.003)#555 |
| 84. | Fairburn | 0.77% | 1.10%(-0.328)#82 | 0.78%(-0.008)#556 |
| 85. | Cusseta Chattahoochee County Unified Government | 0.77% | 1.10%(-0.333)#83 | 0.78%(-0.013)#557 |
| 86. | Toccoa | 0.76% | 1.10%(-0.337)#84 | 0.78%(-0.017)#558 |
| 87. | Grovetown | 0.76% | 1.10%(-0.339)#85 | 0.78%(-0.019)#559 |
| 88. | Carlton | 0.74% | 1.10%(-0.355)#86 | 0.78%(-0.035)#560 |
| 89. | Villa Rica | 0.72% | 1.10%(-0.379)#87 | 0.78%(-0.059)#561 |
| 90. | Dutch Island | 0.71% | 1.10%(-0.389)#88 | 0.78%(-0.069)#562 |
| 91. | Lithonia | 0.69% | 1.10%(-0.411)#89 | 0.78%(-0.091)#563 |
| 92. | Ailey | 0.69% | 1.10%(-0.413)#90 | 0.78%(-0.093)#564 |
| 93. | Doerun | 0.67% | 1.10%(-0.430)#91 | 0.78%(-0.110)#565 |
| 94. | Eatonton | 0.61% | 1.10%(-0.487)#92 | 0.78%(-0.167)#566 |
| 95. | Braselton | 0.61% | 1.10%(-0.491)#93 | 0.78%(-0.171)#567 |
| 96. | Carrollton | 0.60% | 1.10%(-0.494)#94 | 0.78%(-0.175)#568 |
| 97. | Winterville | 0.60% | 1.10%(-0.499)#95 | 0.78%(-0.179)#569 |
| 98. | Ochlocknee | 0.60% | 1.10%(-0.504)#96 | 0.78%(-0.184)#570 |
| 99. | Franklin Springs | 0.58% | 1.10%(-0.522)#97 | 0.78%(-0.202)#571 |
| 100. | Midway | 0.57% | 1.10%(-0.528)#98 | 0.78%(-0.209)#572 |
Common Questions
What are the Top 10 Cities with the Highest Percentage of Immigrants from Africa in Georgia?
Top 10 Cities with the Highest Percentage of Immigrants from Africa in Georgia are:
#1
24.52%
#2
23.82%
#3
7.83%
#4
7.67%
#5
6.28%
#6
5.63%
#7
4.90%
#8
4.52%
#9
4.04%
#10
4.00%
What city has the Highest Percentage of Immigrants from Africa in Georgia?
Grayson has the Highest Percentage of Immigrants from Africa in Georgia with 24.52%.
What is the Percentage of Immigrants from Africa in the State of Georgia?
Percentage of Immigrants from Africa in Georgia is 1.10%.
What is the Percentage of Immigrants from Africa in the United States?
Percentage of Immigrants from Africa in the United States is 0.78%.