Schenectady, NY Map & Demographics
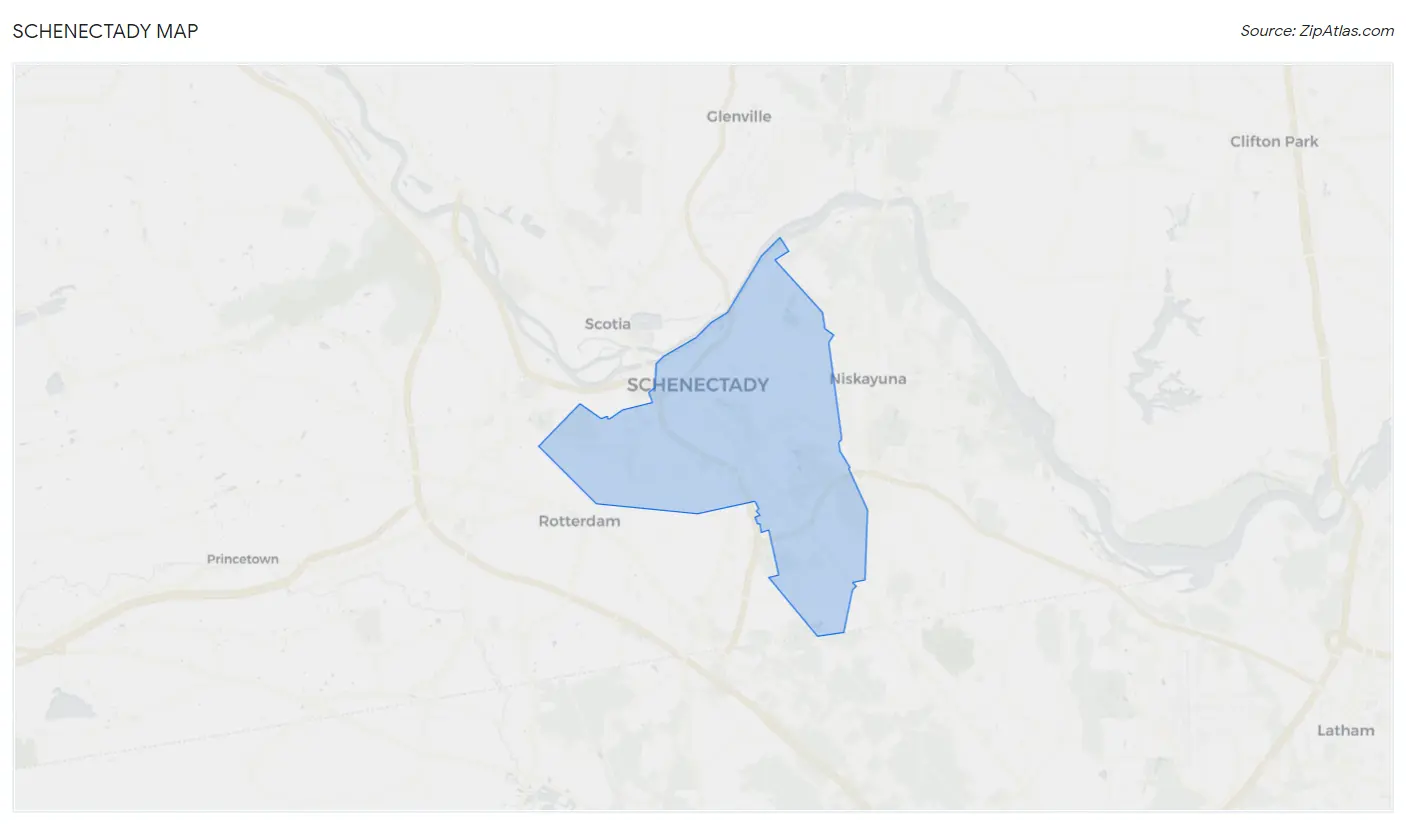
Schenectady Map
Schenectady Overview
$30,778
PER CAPITA INCOME
$65,430
AVG FAMILY INCOME
$54,650
AVG HOUSEHOLD INCOME
16.2%
WAGE / INCOME GAP [ % ]
83.8¢/ $1
WAGE / INCOME GAP [ $ ]
$10,833
FAMILY INCOME DEFICIT
0.47
INEQUALITY / GINI INDEX
68,476
TOTAL POPULATION
34,418
MALE POPULATION
34,058
FEMALE POPULATION
101.06
MALES / 100 FEMALES
98.95
FEMALES / 100 MALES
36.0
MEDIAN AGE
3.2
AVG FAMILY SIZE
2.3
AVG HOUSEHOLD SIZE
34,387
LABOR FORCE [ PEOPLE ]
61.2%
PERCENT IN LABOR FORCE
9.4%
UNEMPLOYMENT RATE
Schenectady Area Codes
Income in Schenectady
Income Overview in Schenectady
Per Capita Income in Schenectady is $30,778, while median incomes of families and households are $65,430 and $54,650 respectively.
| Characteristic | Number | Measure |
| Per Capita Income | 68,476 | $30,778 |
| Median Family Income | 14,073 | $65,430 |
| Mean Family Income | 14,073 | $84,325 |
| Median Household Income | 28,108 | $54,650 |
| Mean Household Income | 28,108 | $71,672 |
| Income Deficit | 14,073 | $10,833 |
| Wage / Income Gap (%) | 68,476 | 16.22% |
| Wage / Income Gap ($) | 68,476 | 83.78¢ per $1 |
| Gini / Inequality Index | 68,476 | 0.47 |
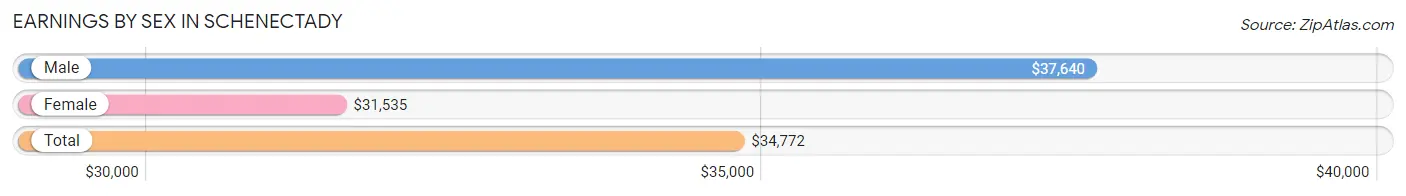
Earnings by Sex in Schenectady
Average Earnings in Schenectady are $34,772, $37,640 for men and $31,535 for women, a difference of 16.2%.
| Sex | Number | Average Earnings |
| Male | 19,088 (53.3%) | $37,640 |
| Female | 16,716 (46.7%) | $31,535 |
| Total | 35,804 (100.0%) | $34,772 |
Earnings by Sex by Income Bracket in Schenectady
The most common earnings brackets in Schenectady are $100,000+ for men (1,681 | 8.8%) and $2,500 to $4,999 for women (1,241 | 7.4%).
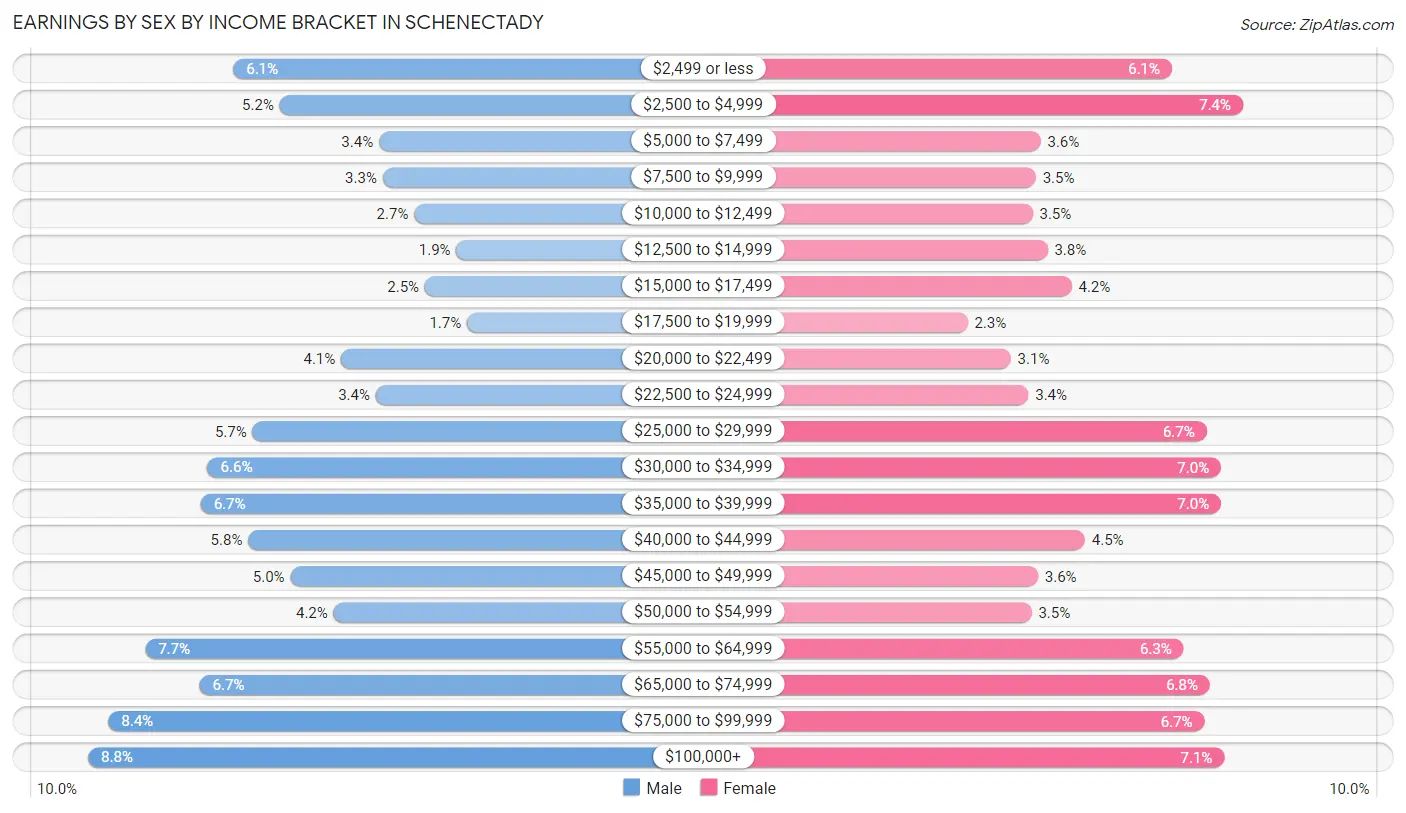
| Income | Male | Female |
| $2,499 or less | 1,162 (6.1%) | 1,018 (6.1%) |
| $2,500 to $4,999 | 996 (5.2%) | 1,241 (7.4%) |
| $5,000 to $7,499 | 642 (3.4%) | 607 (3.6%) |
| $7,500 to $9,999 | 628 (3.3%) | 591 (3.5%) |
| $10,000 to $12,499 | 516 (2.7%) | 582 (3.5%) |
| $12,500 to $14,999 | 364 (1.9%) | 629 (3.8%) |
| $15,000 to $17,499 | 478 (2.5%) | 704 (4.2%) |
| $17,500 to $19,999 | 326 (1.7%) | 378 (2.3%) |
| $20,000 to $22,499 | 776 (4.1%) | 514 (3.1%) |
| $22,500 to $24,999 | 653 (3.4%) | 569 (3.4%) |
| $25,000 to $29,999 | 1,093 (5.7%) | 1,127 (6.7%) |
| $30,000 to $34,999 | 1,254 (6.6%) | 1,172 (7.0%) |
| $35,000 to $39,999 | 1,278 (6.7%) | 1,171 (7.0%) |
| $40,000 to $44,999 | 1,109 (5.8%) | 745 (4.5%) |
| $45,000 to $49,999 | 959 (5.0%) | 598 (3.6%) |
| $50,000 to $54,999 | 804 (4.2%) | 578 (3.5%) |
| $55,000 to $64,999 | 1,477 (7.7%) | 1,054 (6.3%) |
| $65,000 to $74,999 | 1,283 (6.7%) | 1,137 (6.8%) |
| $75,000 to $99,999 | 1,609 (8.4%) | 1,120 (6.7%) |
| $100,000+ | 1,681 (8.8%) | 1,181 (7.1%) |
| Total | 19,088 (100.0%) | 16,716 (100.0%) |
Earnings by Sex by Educational Attainment in Schenectady
Average earnings in Schenectady are $45,590 for men and $36,017 for women, a difference of 21.0%. Men with an educational attainment of graduate degree enjoy the highest average annual earnings of $77,083, while those with less than high school education earn the least with $30,900. Women with an educational attainment of graduate degree earn the most with the average annual earnings of $66,061, while those with less than high school education have the smallest earnings of $24,552.
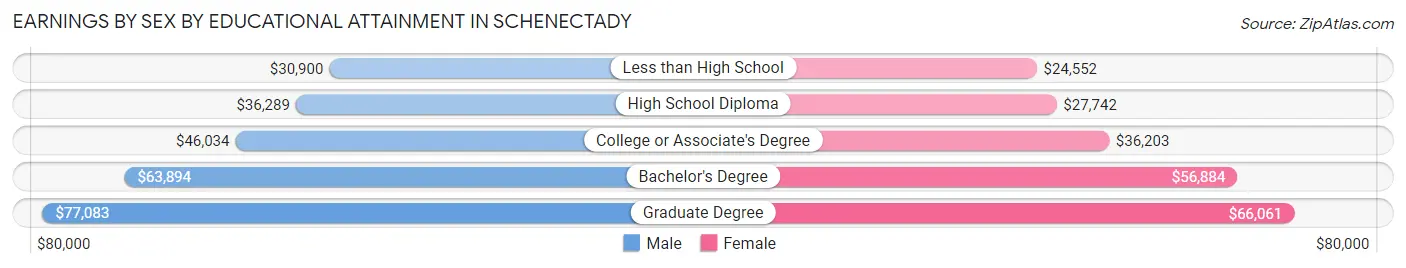
| Educational Attainment | Male Income | Female Income |
| Less than High School | $30,900 | $24,552 |
| High School Diploma | $36,289 | $27,742 |
| College or Associate's Degree | $46,034 | $36,203 |
| Bachelor's Degree | $63,894 | $56,884 |
| Graduate Degree | $77,083 | $66,061 |
| Total | $45,590 | $36,017 |
Family Income in Schenectady
Family Income Brackets in Schenectady
According to the Schenectady family income data, there are 2,533 families falling into the $100,000 to $149,999 income range, which is the most common income bracket and makes up 18.0% of all families. Conversely, the $10,000 to $14,999 income bracket is the least frequent group with only 619 families (4.4%) belonging to this category.
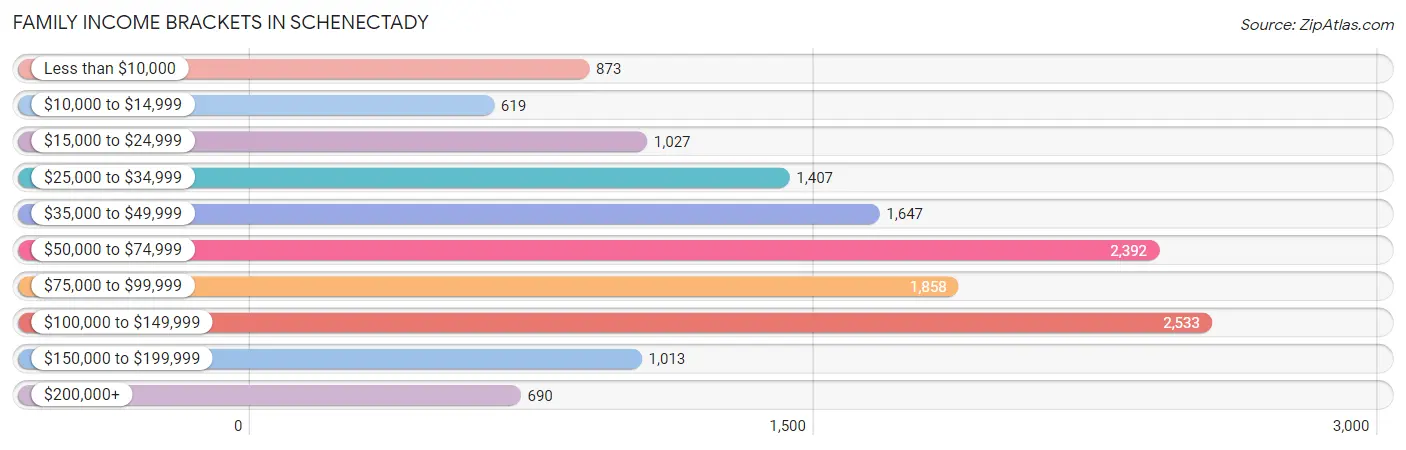
| Income Bracket | # Families | % Families |
| Less than $10,000 | 873 | 6.2% |
| $10,000 to $14,999 | 619 | 4.4% |
| $15,000 to $24,999 | 1,027 | 7.3% |
| $25,000 to $34,999 | 1,407 | 10.0% |
| $35,000 to $49,999 | 1,647 | 11.7% |
| $50,000 to $74,999 | 2,392 | 17.0% |
| $75,000 to $99,999 | 1,858 | 13.2% |
| $100,000 to $149,999 | 2,533 | 18.0% |
| $150,000 to $199,999 | 1,013 | 7.2% |
| $200,000+ | 690 | 4.9% |
Family Income by Famaliy Size in Schenectady
5-person families (922 | 6.6%) account for the highest median family income in Schenectady with $78,036 per family, while 2-person families (6,668 | 47.4%) have the highest median income of $30,365 per family member.
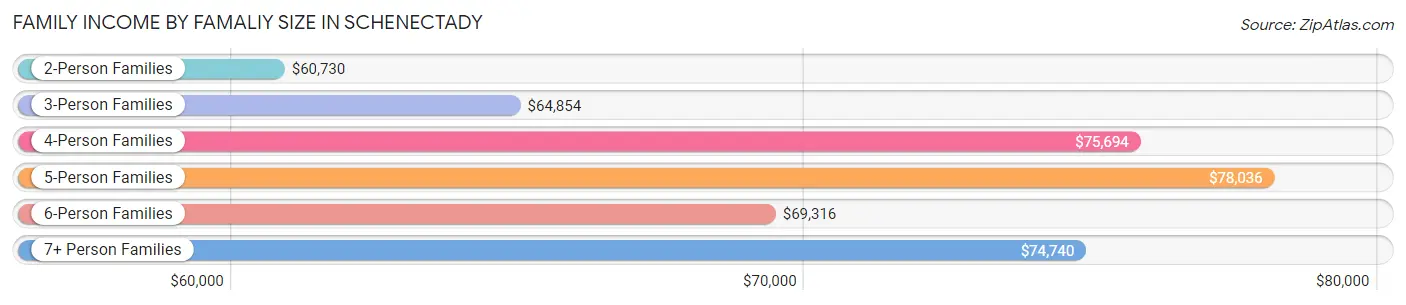
| Income Bracket | # Families | Median Income |
| 2-Person Families | 6,668 (47.4%) | $60,730 |
| 3-Person Families | 4,005 (28.5%) | $64,854 |
| 4-Person Families | 2,111 (15.0%) | $75,694 |
| 5-Person Families | 922 (6.6%) | $78,036 |
| 6-Person Families | 237 (1.7%) | $69,316 |
| 7+ Person Families | 130 (0.9%) | $74,740 |
| Total | 14,073 (100.0%) | $65,430 |
Family Income by Number of Earners in Schenectady
The median family income in Schenectady is $65,430, with families comprising 3+ earners (1,433) having the highest median family income of $109,018, while families with no earners (2,405) have the lowest median family income of $28,298, accounting for 10.2% and 17.1% of families, respectively.
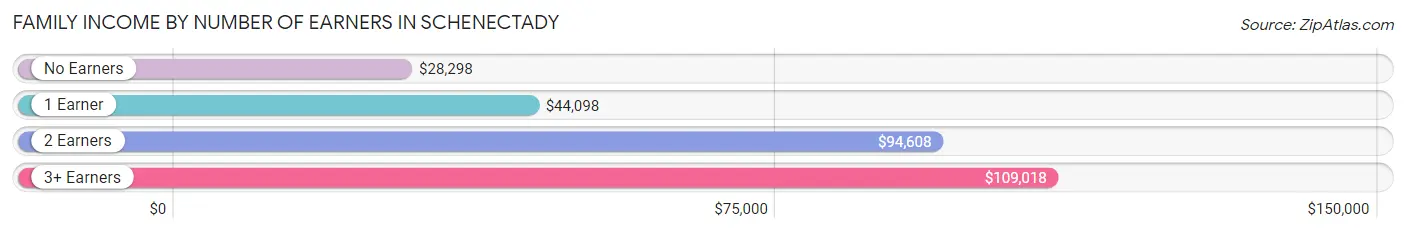
| Number of Earners | # Families | Median Income |
| No Earners | 2,405 (17.1%) | $28,298 |
| 1 Earner | 5,050 (35.9%) | $44,098 |
| 2 Earners | 5,185 (36.8%) | $94,608 |
| 3+ Earners | 1,433 (10.2%) | $109,018 |
| Total | 14,073 (100.0%) | $65,430 |
Household Income in Schenectady
Household Income Brackets in Schenectady
With 5,453 households falling in the category, the $50,000 to $74,999 income range is the most frequent in Schenectady, accounting for 19.4% of all households. In contrast, only 956 households (3.4%) fall into the $200,000+ income bracket, making it the least populous group.
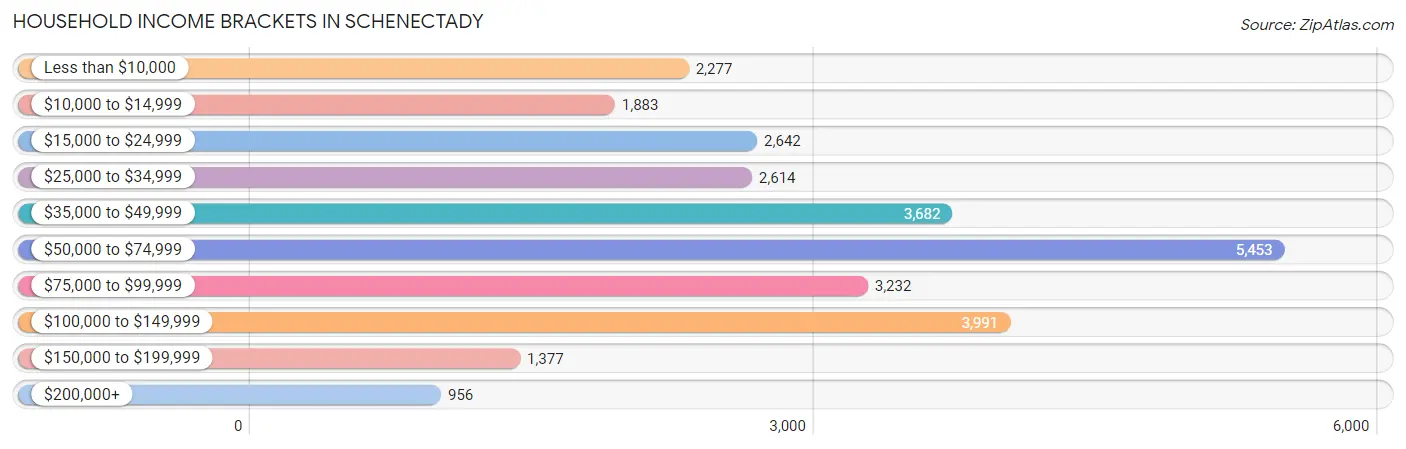
| Income Bracket | # Households | % Households |
| Less than $10,000 | 2,277 | 8.1% |
| $10,000 to $14,999 | 1,883 | 6.7% |
| $15,000 to $24,999 | 2,642 | 9.4% |
| $25,000 to $34,999 | 2,614 | 9.3% |
| $35,000 to $49,999 | 3,682 | 13.1% |
| $50,000 to $74,999 | 5,453 | 19.4% |
| $75,000 to $99,999 | 3,232 | 11.5% |
| $100,000 to $149,999 | 3,991 | 14.2% |
| $150,000 to $199,999 | 1,377 | 4.9% |
| $200,000+ | 956 | 3.4% |
Household Income by Householder Age in Schenectady
The median household income in Schenectady is $54,650, with the highest median household income of $62,872 found in the 45 to 64 years age bracket for the primary householder. A total of 10,201 households (36.3%) fall into this category. Meanwhile, the 15 to 24 years age bracket for the primary householder has the lowest median household income of $34,547, with 1,571 households (5.6%) in this group.
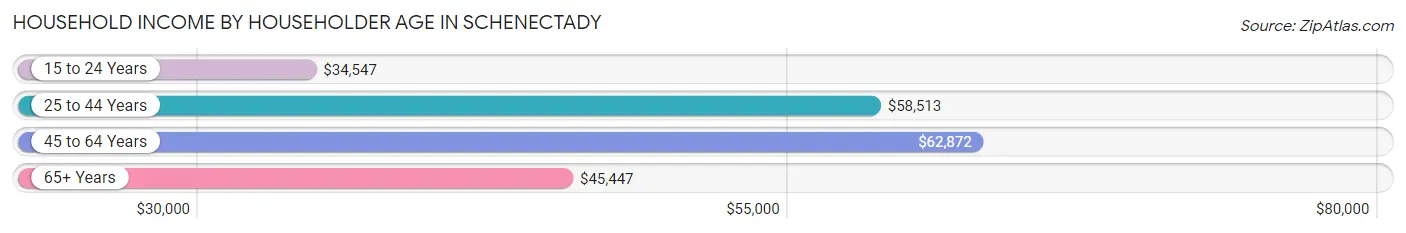
| Income Bracket | # Households | Median Income |
| 15 to 24 Years | 1,571 (5.6%) | $34,547 |
| 25 to 44 Years | 9,760 (34.7%) | $58,513 |
| 45 to 64 Years | 10,201 (36.3%) | $62,872 |
| 65+ Years | 6,576 (23.4%) | $45,447 |
| Total | 28,108 (100.0%) | $54,650 |
Poverty in Schenectady
Income Below Poverty by Sex and Age in Schenectady
With 19.3% poverty level for males and 23.1% for females among the residents of Schenectady, 12 to 14 year old males and 5 year old females are the most vulnerable to poverty, with 299 males (36.2%) and 196 females (74.5%) in their respective age groups living below the poverty level.
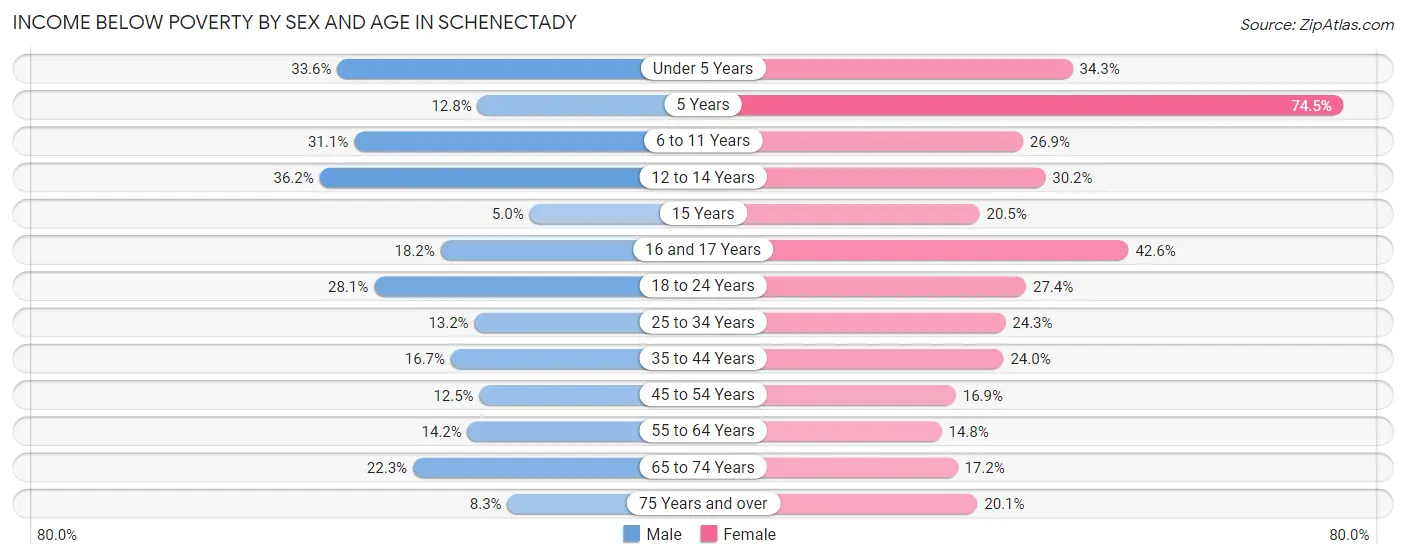
| Age Bracket | Male | Female |
| Under 5 Years | 756 (33.6%) | 715 (34.3%) |
| 5 Years | 51 (12.8%) | 196 (74.5%) |
| 6 to 11 Years | 767 (31.1%) | 575 (26.9%) |
| 12 to 14 Years | 299 (36.2%) | 331 (30.2%) |
| 15 Years | 15 (5.0%) | 54 (20.4%) |
| 16 and 17 Years | 136 (18.2%) | 258 (42.6%) |
| 18 to 24 Years | 1,066 (28.1%) | 846 (27.4%) |
| 25 to 34 Years | 670 (13.2%) | 1,308 (24.3%) |
| 35 to 44 Years | 670 (16.7%) | 969 (24.0%) |
| 45 to 54 Years | 504 (12.5%) | 668 (16.9%) |
| 55 to 64 Years | 619 (14.2%) | 679 (14.8%) |
| 65 to 74 Years | 601 (22.3%) | 510 (17.2%) |
| 75 Years and over | 132 (8.3%) | 457 (20.1%) |
| Total | 6,286 (19.3%) | 7,566 (23.1%) |
Income Above Poverty by Sex and Age in Schenectady
According to the poverty statistics in Schenectady, males aged 15 years and females aged 55 to 64 years are the age groups that are most secure financially, with 95.0% of males and 85.2% of females in these age groups living above the poverty line.
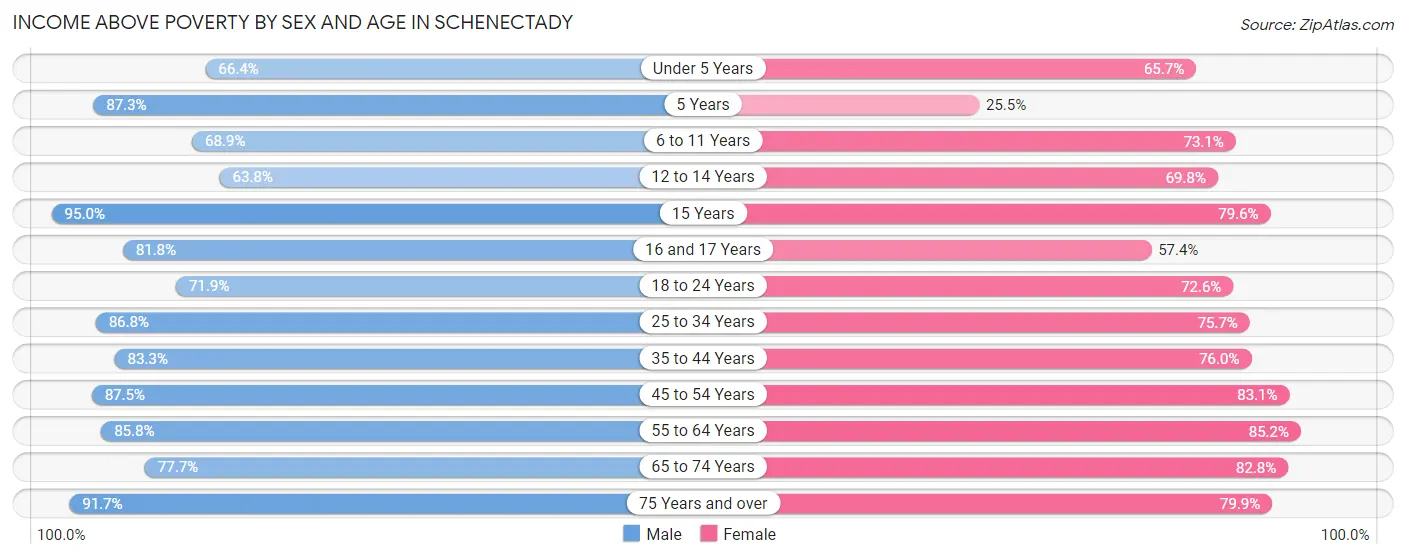
| Age Bracket | Male | Female |
| Under 5 Years | 1,496 (66.4%) | 1,372 (65.7%) |
| 5 Years | 349 (87.3%) | 67 (25.5%) |
| 6 to 11 Years | 1,700 (68.9%) | 1,563 (73.1%) |
| 12 to 14 Years | 527 (63.8%) | 764 (69.8%) |
| 15 Years | 283 (95.0%) | 210 (79.5%) |
| 16 and 17 Years | 610 (81.8%) | 348 (57.4%) |
| 18 to 24 Years | 2,726 (71.9%) | 2,246 (72.6%) |
| 25 to 34 Years | 4,405 (86.8%) | 4,078 (75.7%) |
| 35 to 44 Years | 3,342 (83.3%) | 3,067 (76.0%) |
| 45 to 54 Years | 3,542 (87.5%) | 3,278 (83.1%) |
| 55 to 64 Years | 3,731 (85.8%) | 3,906 (85.2%) |
| 65 to 74 Years | 2,089 (77.7%) | 2,459 (82.8%) |
| 75 Years and over | 1,458 (91.7%) | 1,813 (79.9%) |
| Total | 26,258 (80.7%) | 25,171 (76.9%) |
Income Below Poverty Among Married-Couple Families in Schenectady
The poverty statistics for married-couple families in Schenectady show that 8.3% or 699 of the total 8,459 families live below the poverty line. Families with 1 or 2 children have the highest poverty rate of 13.7%, comprising of 368 families. On the other hand, families with no children have the lowest poverty rate of 5.5%, which includes 291 families.
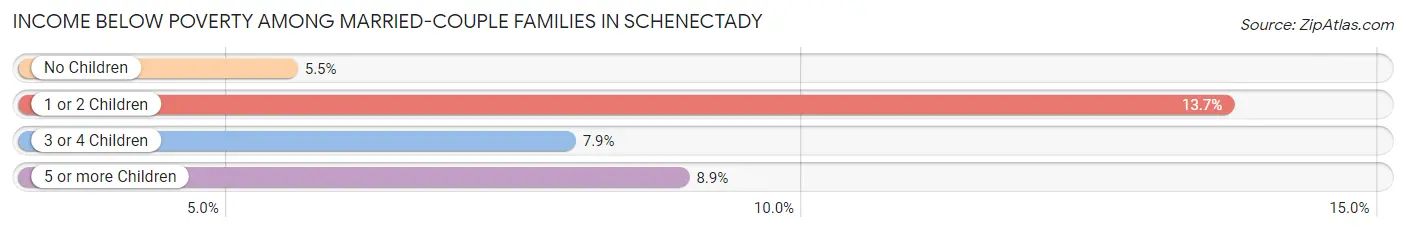
| Children | Above Poverty | Below Poverty |
| No Children | 4,978 (94.5%) | 291 (5.5%) |
| 1 or 2 Children | 2,325 (86.3%) | 368 (13.7%) |
| 3 or 4 Children | 406 (92.1%) | 35 (7.9%) |
| 5 or more Children | 51 (91.1%) | 5 (8.9%) |
| Total | 7,760 (91.7%) | 699 (8.3%) |
Income Below Poverty Among Single-Parent Households in Schenectady
According to the poverty data in Schenectady, 24.9% or 354 single-father households and 31.2% or 1,307 single-mother households are living below the poverty line. Among single-father households, those with 3 or 4 children have the highest poverty rate, with 69 households (54.8%) experiencing poverty. Likewise, among single-mother households, those with 3 or 4 children have the highest poverty rate, with 254 households (61.8%) falling below the poverty line.
| Children | Single Father | Single Mother |
| No Children | 113 (14.7%) | 255 (14.9%) |
| 1 or 2 Children | 172 (32.7%) | 798 (38.5%) |
| 3 or 4 Children | 69 (54.8%) | 254 (61.8%) |
| 5 or more Children | 0 (0.0%) | 0 (0.0%) |
| Total | 354 (24.9%) | 1,307 (31.2%) |
Income Below Poverty Among Married-Couple vs Single-Parent Households in Schenectady
The poverty data for Schenectady shows that 699 of the married-couple family households (8.3%) and 1,661 of the single-parent households (29.6%) are living below the poverty level. Within the married-couple family households, those with 1 or 2 children have the highest poverty rate, with 368 households (13.7%) falling below the poverty line. Among the single-parent households, those with 3 or 4 children have the highest poverty rate, with 323 household (60.2%) living below poverty.
| Children | Married-Couple Families | Single-Parent Households |
| No Children | 291 (5.5%) | 368 (14.8%) |
| 1 or 2 Children | 368 (13.7%) | 970 (37.3%) |
| 3 or 4 Children | 35 (7.9%) | 323 (60.2%) |
| 5 or more Children | 5 (8.9%) | 0 (0.0%) |
| Total | 699 (8.3%) | 1,661 (29.6%) |
Race in Schenectady
The most populous races in Schenectady are White / Caucasian (35,592 | 52.0%), Black / African American (13,821 | 20.2%), and Two or more Races (8,662 | 12.7%).
| Race | # Population | % Population |
| Asian | 4,549 | 6.6% |
| Black / African American | 13,821 | 20.2% |
| Hawaiian / Pacific | 85 | 0.1% |
| Hispanic or Latino | 8,598 | 12.6% |
| Native / Alaskan | 401 | 0.6% |
| White / Caucasian | 35,592 | 52.0% |
| Two or more Races | 8,662 | 12.7% |
| Some other Race | 5,366 | 7.8% |
| Total | 68,476 | 100.0% |
Ancestry in Schenectady
The most populous ancestries reported in Schenectady are Italian (7,634 | 11.2%), Irish (7,631 | 11.1%), German (5,364 | 7.8%), Puerto Rican (4,597 | 6.7%), and Guyanese (4,481 | 6.5%), together accounting for 43.4% of all Schenectady residents.
| Ancestry | # Population | % Population |
| Afghan | 270 | 0.4% |
| African | 503 | 0.7% |
| American | 3,743 | 5.5% |
| Apache | 59 | 0.1% |
| Arab | 315 | 0.5% |
| Armenian | 47 | 0.1% |
| Australian | 18 | 0.0% |
| Austrian | 71 | 0.1% |
| Barbadian | 51 | 0.1% |
| Belgian | 11 | 0.0% |
| Bhutanese | 160 | 0.2% |
| Blackfeet | 94 | 0.1% |
| British | 178 | 0.3% |
| British West Indian | 84 | 0.1% |
| Bulgarian | 11 | 0.0% |
| Burmese | 160 | 0.2% |
| Cambodian | 19 | 0.0% |
| Canadian | 74 | 0.1% |
| Central American | 987 | 1.4% |
| Central American Indian | 95 | 0.1% |
| Cherokee | 261 | 0.4% |
| Colombian | 71 | 0.1% |
| Costa Rican | 57 | 0.1% |
| Croatian | 10 | 0.0% |
| Cuban | 228 | 0.3% |
| Czech | 119 | 0.2% |
| Czechoslovakian | 26 | 0.0% |
| Danish | 171 | 0.3% |
| Delaware | 21 | 0.0% |
| Dominican | 981 | 1.4% |
| Dutch | 1,060 | 1.5% |
| Eastern European | 192 | 0.3% |
| Ecuadorian | 103 | 0.2% |
| Egyptian | 78 | 0.1% |
| English | 3,952 | 5.8% |
| European | 902 | 1.3% |
| Finnish | 74 | 0.1% |
| French | 3,623 | 5.3% |
| French American Indian | 93 | 0.1% |
| French Canadian | 802 | 1.2% |
| German | 5,364 | 7.8% |
| Ghanaian | 5 | 0.0% |
| Greek | 179 | 0.3% |
| Guatemalan | 101 | 0.2% |
| Guyanese | 4,481 | 6.5% |
| Haitian | 126 | 0.2% |
| Honduran | 502 | 0.7% |
| Hungarian | 339 | 0.5% |
| Indian (Asian) | 454 | 0.7% |
| Iranian | 39 | 0.1% |
| Irish | 7,631 | 11.1% |
| Iroquois | 238 | 0.4% |
| Israeli | 2 | 0.0% |
| Italian | 7,634 | 11.2% |
| Jamaican | 254 | 0.4% |
| Japanese | 8 | 0.0% |
| Korean | 214 | 0.3% |
| Latvian | 137 | 0.2% |
| Lebanese | 52 | 0.1% |
| Lithuanian | 109 | 0.2% |
| Malaysian | 17 | 0.0% |
| Mexican | 730 | 1.1% |
| Mexican American Indian | 111 | 0.2% |
| Moroccan | 11 | 0.0% |
| Native Hawaiian | 120 | 0.2% |
| Navajo | 17 | 0.0% |
| Nicaraguan | 7 | 0.0% |
| Nigerian | 50 | 0.1% |
| Northern European | 39 | 0.1% |
| Norwegian | 138 | 0.2% |
| Panamanian | 72 | 0.1% |
| Pennsylvania German | 9 | 0.0% |
| Peruvian | 173 | 0.3% |
| Polish | 2,628 | 3.8% |
| Portuguese | 82 | 0.1% |
| Puerto Rican | 4,597 | 6.7% |
| Romanian | 49 | 0.1% |
| Russian | 638 | 0.9% |
| Salvadoran | 42 | 0.1% |
| Samoan | 33 | 0.1% |
| Scandinavian | 152 | 0.2% |
| Scotch-Irish | 389 | 0.6% |
| Scottish | 950 | 1.4% |
| Slavic | 26 | 0.0% |
| Slovak | 188 | 0.3% |
| South American | 424 | 0.6% |
| South American Indian | 37 | 0.1% |
| Spaniard | 135 | 0.2% |
| Spanish | 160 | 0.2% |
| Sri Lankan | 122 | 0.2% |
| Subsaharan African | 870 | 1.3% |
| Sudanese | 215 | 0.3% |
| Swedish | 133 | 0.2% |
| Swiss | 75 | 0.1% |
| Syrian | 14 | 0.0% |
| Thai | 3,174 | 4.6% |
| Trinidadian and Tobagonian | 154 | 0.2% |
| Turkish | 13 | 0.0% |
| U.S. Virgin Islander | 34 | 0.1% |
| Ukrainian | 249 | 0.4% |
| Venezuelan | 15 | 0.0% |
| Vietnamese | 91 | 0.1% |
| Welsh | 270 | 0.4% |
| West Indian | 680 | 1.0% | View All 104 Rows |
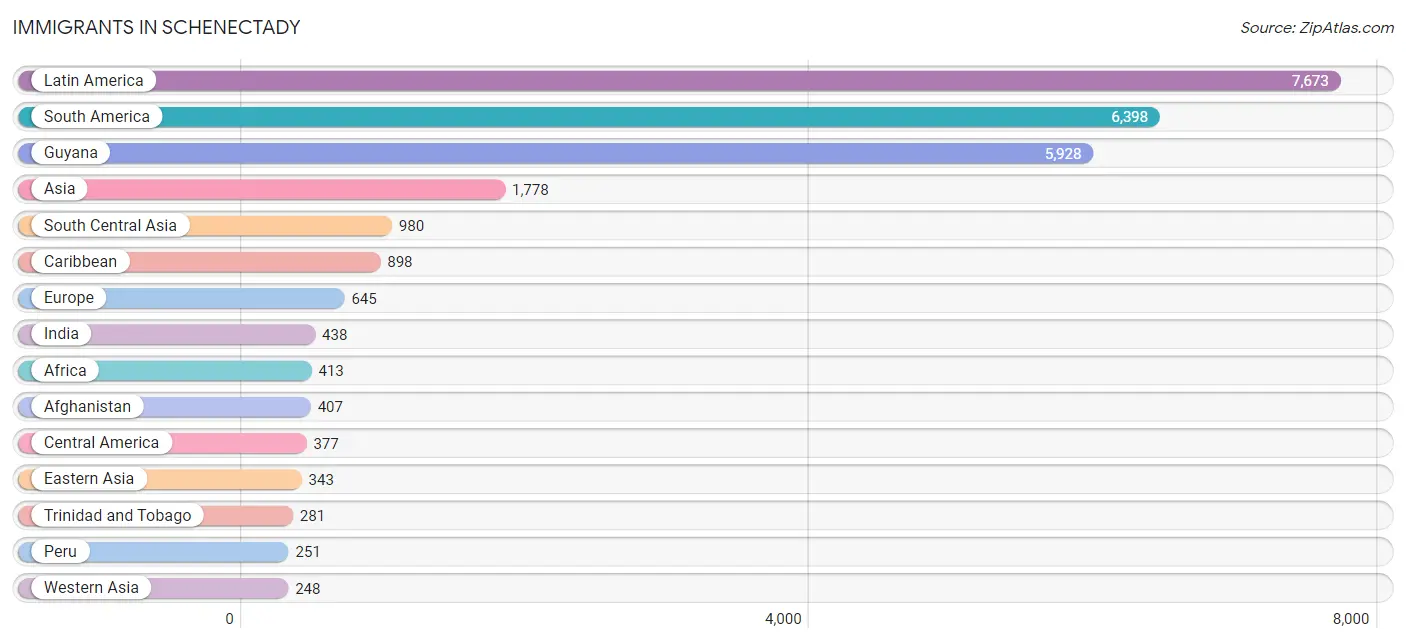
Immigrants in Schenectady
The most numerous immigrant groups reported in Schenectady came from Latin America (7,673 | 11.2%), South America (6,398 | 9.3%), Guyana (5,928 | 8.7%), Asia (1,778 | 2.6%), and South Central Asia (980 | 1.4%), together accounting for 33.2% of all Schenectady residents.
| Immigration Origin | # Population | % Population |
| Afghanistan | 407 | 0.6% |
| Africa | 413 | 0.6% |
| Asia | 1,778 | 2.6% |
| Austria | 5 | 0.0% |
| Bangladesh | 79 | 0.1% |
| Barbados | 12 | 0.0% |
| Cameroon | 10 | 0.0% |
| Canada | 160 | 0.2% |
| Caribbean | 898 | 1.3% |
| Central America | 377 | 0.5% |
| China | 209 | 0.3% |
| Colombia | 29 | 0.0% |
| Costa Rica | 12 | 0.0% |
| Cuba | 3 | 0.0% |
| Dominica | 43 | 0.1% |
| Dominican Republic | 245 | 0.4% |
| Eastern Africa | 51 | 0.1% |
| Eastern Asia | 343 | 0.5% |
| Eastern Europe | 245 | 0.4% |
| Ecuador | 81 | 0.1% |
| Egypt | 26 | 0.0% |
| El Salvador | 18 | 0.0% |
| England | 101 | 0.2% |
| Europe | 645 | 0.9% |
| France | 13 | 0.0% |
| Germany | 83 | 0.1% |
| Ghana | 8 | 0.0% |
| Greece | 28 | 0.0% |
| Guatemala | 99 | 0.1% |
| Guyana | 5,928 | 8.7% |
| Haiti | 54 | 0.1% |
| Honduras | 42 | 0.1% |
| Hong Kong | 24 | 0.0% |
| Hungary | 40 | 0.1% |
| India | 438 | 0.6% |
| Indonesia | 8 | 0.0% |
| Israel | 1 | 0.0% |
| Italy | 89 | 0.1% |
| Jamaica | 215 | 0.3% |
| Japan | 26 | 0.0% |
| Jordan | 16 | 0.0% |
| Korea | 108 | 0.2% |
| Kuwait | 79 | 0.1% |
| Laos | 7 | 0.0% |
| Latin America | 7,673 | 11.2% |
| Latvia | 36 | 0.1% |
| Liberia | 10 | 0.0% |
| Mexico | 138 | 0.2% |
| Middle Africa | 10 | 0.0% |
| Moldova | 26 | 0.0% |
| Morocco | 42 | 0.1% |
| Nepal | 4 | 0.0% |
| Nicaragua | 47 | 0.1% |
| Northern Africa | 122 | 0.2% |
| Northern Europe | 168 | 0.3% |
| Pakistan | 24 | 0.0% |
| Panama | 21 | 0.0% |
| Peru | 251 | 0.4% |
| Philippines | 113 | 0.2% |
| Poland | 19 | 0.0% |
| Russia | 73 | 0.1% |
| Saudi Arabia | 66 | 0.1% |
| Scotland | 7 | 0.0% |
| South Africa | 27 | 0.0% |
| South America | 6,398 | 9.3% |
| South Central Asia | 980 | 1.4% |
| South Eastern Asia | 207 | 0.3% |
| Southern Europe | 131 | 0.2% |
| Spain | 14 | 0.0% |
| Sri Lanka | 28 | 0.0% |
| Sudan | 54 | 0.1% |
| Trinidad and Tobago | 281 | 0.4% |
| Ukraine | 51 | 0.1% |
| Venezuela | 15 | 0.0% |
| Vietnam | 79 | 0.1% |
| Western Africa | 202 | 0.3% |
| Western Asia | 248 | 0.4% |
| Western Europe | 101 | 0.2% |
| Yemen | 26 | 0.0% | View All 79 Rows |
Sex and Age in Schenectady
Sex and Age in Schenectady
The most populous age groups in Schenectady are 20 to 24 Years (3,633 | 10.6%) for men and 20 to 24 Years (2,807 | 8.2%) for women.
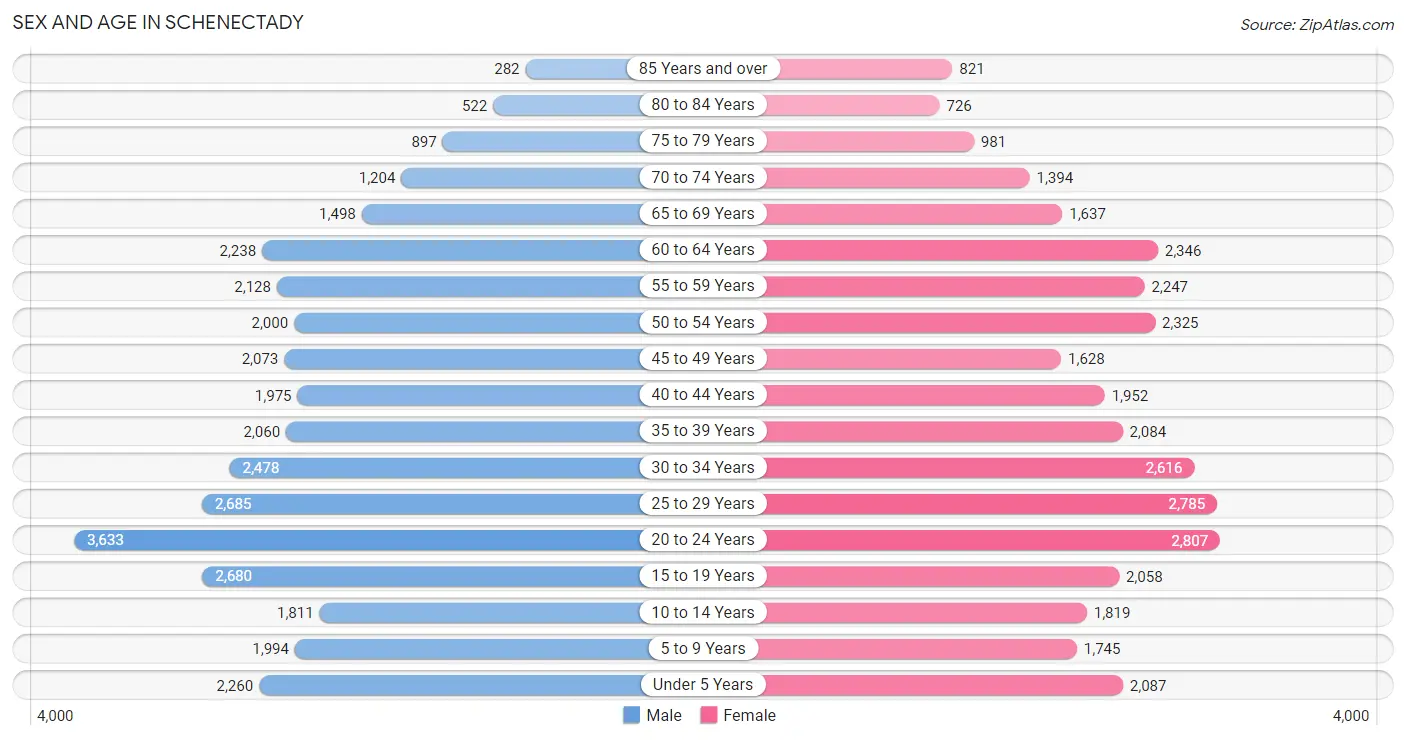
| Age Bracket | Male | Female |
| Under 5 Years | 2,260 (6.6%) | 2,087 (6.1%) |
| 5 to 9 Years | 1,994 (5.8%) | 1,745 (5.1%) |
| 10 to 14 Years | 1,811 (5.3%) | 1,819 (5.3%) |
| 15 to 19 Years | 2,680 (7.8%) | 2,058 (6.0%) |
| 20 to 24 Years | 3,633 (10.6%) | 2,807 (8.2%) |
| 25 to 29 Years | 2,685 (7.8%) | 2,785 (8.2%) |
| 30 to 34 Years | 2,478 (7.2%) | 2,616 (7.7%) |
| 35 to 39 Years | 2,060 (6.0%) | 2,084 (6.1%) |
| 40 to 44 Years | 1,975 (5.7%) | 1,952 (5.7%) |
| 45 to 49 Years | 2,073 (6.0%) | 1,628 (4.8%) |
| 50 to 54 Years | 2,000 (5.8%) | 2,325 (6.8%) |
| 55 to 59 Years | 2,128 (6.2%) | 2,247 (6.6%) |
| 60 to 64 Years | 2,238 (6.5%) | 2,346 (6.9%) |
| 65 to 69 Years | 1,498 (4.3%) | 1,637 (4.8%) |
| 70 to 74 Years | 1,204 (3.5%) | 1,394 (4.1%) |
| 75 to 79 Years | 897 (2.6%) | 981 (2.9%) |
| 80 to 84 Years | 522 (1.5%) | 726 (2.1%) |
| 85 Years and over | 282 (0.8%) | 821 (2.4%) |
| Total | 34,418 (100.0%) | 34,058 (100.0%) |
Families and Households in Schenectady
Median Family Size in Schenectady
The median family size in Schenectady is 3.20 persons per family, with single female/mother families (4,195 | 29.8%) accounting for the largest median family size of 3.27 persons per family. On the other hand, single male/father families (1,419 | 10.1%) represent the smallest median family size with 3.13 persons per family.
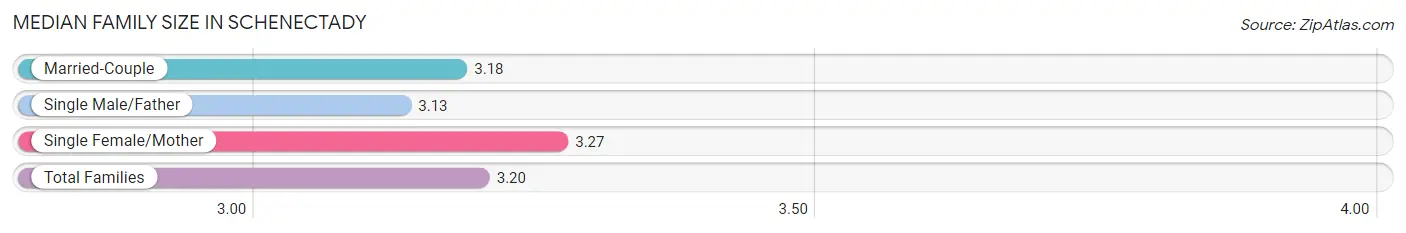
| Family Type | # Families | Family Size |
| Married-Couple | 8,459 (60.1%) | 3.18 |
| Single Male/Father | 1,419 (10.1%) | 3.13 |
| Single Female/Mother | 4,195 (29.8%) | 3.27 |
| Total Families | 14,073 (100.0%) | 3.20 |
Median Household Size in Schenectady
The median household size in Schenectady is 2.30 persons per household, with single male/father households (1,419 | 5.1%) accounting for the largest median household size of 3.65 persons per household. non-family households (14,035 | 49.9%) represent the smallest median household size with 1.23 persons per household.
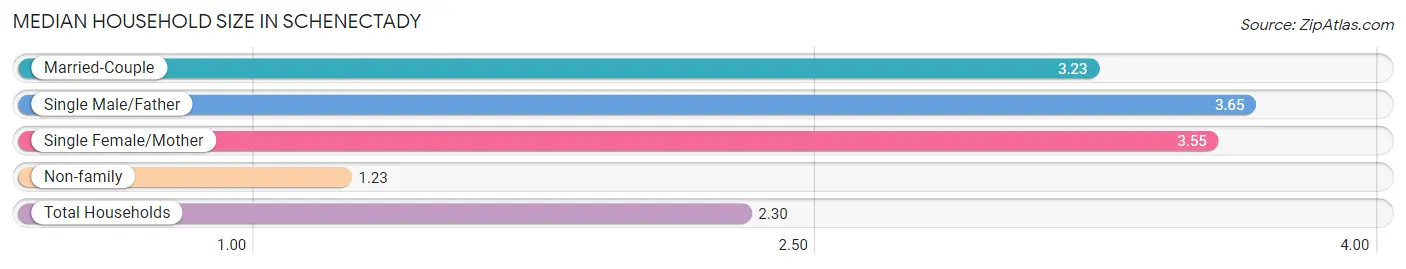
| Household Type | # Households | Household Size |
| Married-Couple | 8,459 (30.1%) | 3.23 |
| Single Male/Father | 1,419 (5.1%) | 3.65 |
| Single Female/Mother | 4,195 (14.9%) | 3.55 |
| Non-family | 14,035 (49.9%) | 1.23 |
| Total Households | 28,108 (100.0%) | 2.30 |
Household Size by Marriage Status in Schenectady
Out of a total of 28,108 households in Schenectady, 14,073 (50.1%) are family households, while 14,035 (49.9%) are nonfamily households. The most numerous type of family households are 2-person households, comprising 5,660, and the most common type of nonfamily households are 1-person households, comprising 11,298.
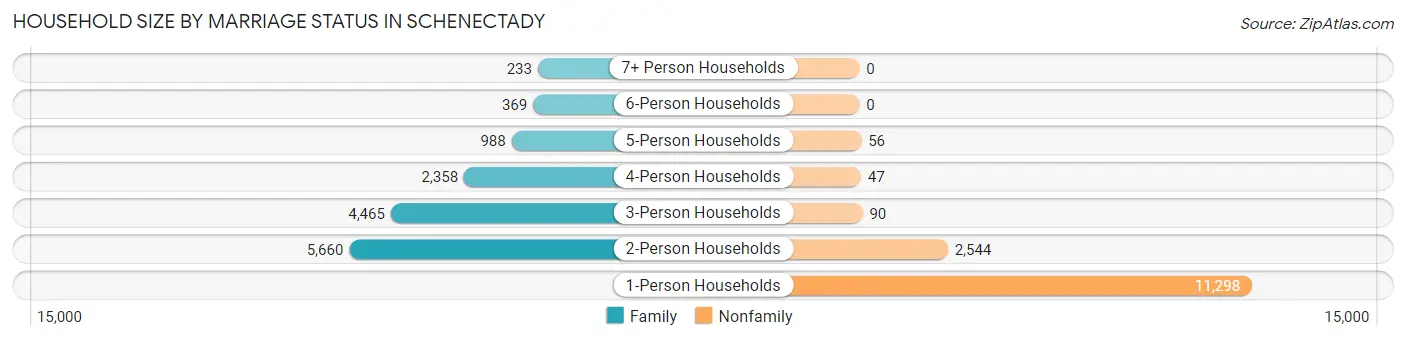
| Household Size | Family Households | Nonfamily Households |
| 1-Person Households | - | 11,298 (40.2%) |
| 2-Person Households | 5,660 (20.1%) | 2,544 (9.0%) |
| 3-Person Households | 4,465 (15.9%) | 90 (0.3%) |
| 4-Person Households | 2,358 (8.4%) | 47 (0.2%) |
| 5-Person Households | 988 (3.5%) | 56 (0.2%) |
| 6-Person Households | 369 (1.3%) | 0 (0.0%) |
| 7+ Person Households | 233 (0.8%) | 0 (0.0%) |
| Total | 14,073 (50.1%) | 14,035 (49.9%) |
Female Fertility in Schenectady
Fertility by Age in Schenectady
Average fertility rate in Schenectady is 65.0 births per 1,000 women. Women in the age bracket of 35 to 50 years have the highest fertility rate with 81.0 births per 1,000 women. Women in the age bracket of 20 to 34 years acount for 52.5% of all women with births.
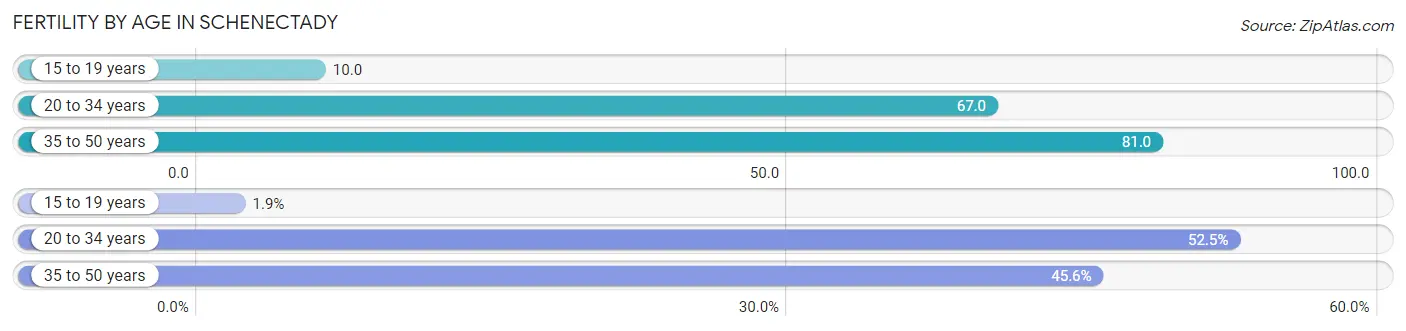
| Age Bracket | Women with Births | Births / 1,000 Women |
| 15 to 19 years | 20 (1.9%) | 10.0 |
| 20 to 34 years | 551 (52.5%) | 67.0 |
| 35 to 50 years | 478 (45.6%) | 81.0 |
| Total | 1,049 (100.0%) | 65.0 |
Fertility by Age by Marriage Status in Schenectady
74.8% of women with births (1,049) in Schenectady are married. The highest percentage of unmarried women with births falls into 15 to 19 years age bracket with 100.0% of them unmarried at the time of birth, while the lowest percentage of unmarried women with births belong to 35 to 50 years age bracket with 12.8% of them unmarried.
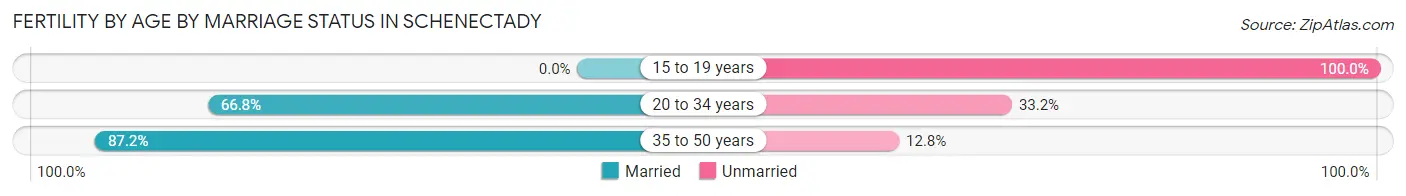
| Age Bracket | Married | Unmarried |
| 15 to 19 years | 0 (0.0%) | 20 (100.0%) |
| 20 to 34 years | 368 (66.8%) | 183 (33.2%) |
| 35 to 50 years | 417 (87.2%) | 61 (12.8%) |
| Total | 785 (74.8%) | 264 (25.2%) |
Fertility by Education in Schenectady
Average fertility rate in Schenectady is 65.0 births per 1,000 women. Women with the education attainment of less than high school have the highest fertility rate of 140.0 births per 1,000 women, while women with the education attainment of high school diploma have the lowest fertility at 36.0 births per 1,000 women. Women with the education attainment of less than high school represent 36.2% of all women with births.
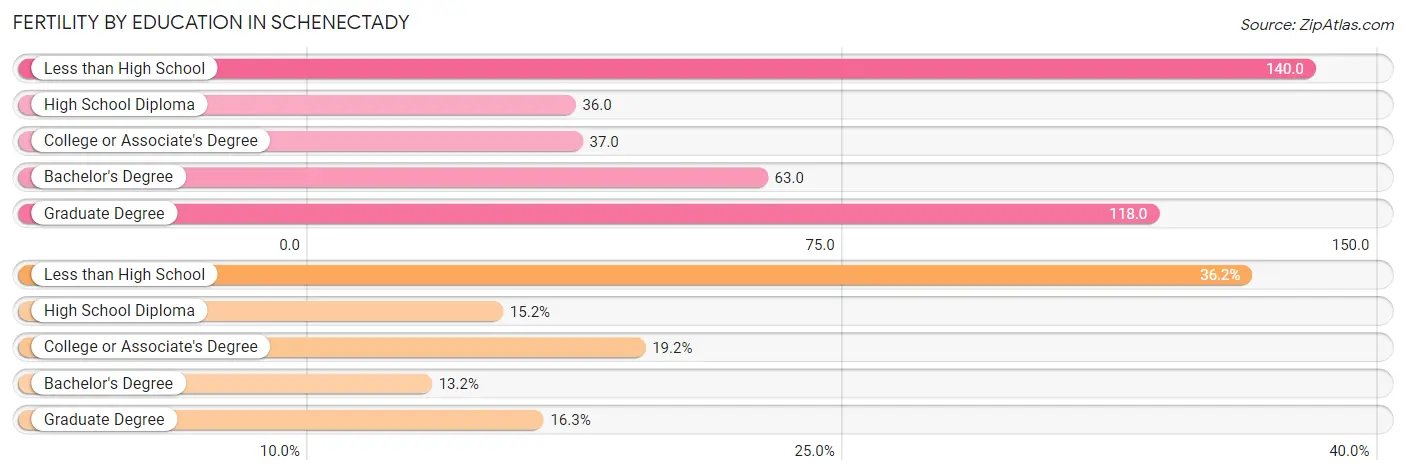
| Educational Attainment | Women with Births | Births / 1,000 Women |
| Less than High School | 380 (36.2%) | 140.0 |
| High School Diploma | 159 (15.2%) | 36.0 |
| College or Associate's Degree | 201 (19.2%) | 37.0 |
| Bachelor's Degree | 138 (13.2%) | 63.0 |
| Graduate Degree | 171 (16.3%) | 118.0 |
| Total | 1,049 (100.0%) | 65.0 |
Fertility by Education by Marriage Status in Schenectady
25.2% of women with births in Schenectady are unmarried. Women with the educational attainment of graduate degree are most likely to be married with 100.0% of them married at childbirth, while women with the educational attainment of bachelor's degree are least likely to be married with 47.8% of them unmarried at childbirth.
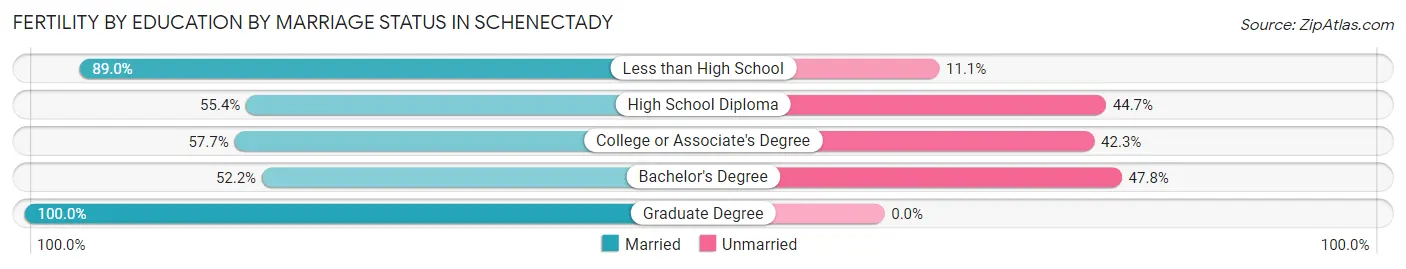
| Educational Attainment | Married | Unmarried |
| Less than High School | 338 (88.9%) | 42 (11.1%) |
| High School Diploma | 88 (55.3%) | 71 (44.7%) |
| College or Associate's Degree | 116 (57.7%) | 85 (42.3%) |
| Bachelor's Degree | 72 (52.2%) | 66 (47.8%) |
| Graduate Degree | 171 (100.0%) | 0 (0.0%) |
| Total | 785 (74.8%) | 264 (25.2%) |
Employment Characteristics in Schenectady
Employment by Class of Employer in Schenectady
Among the 30,465 employed individuals in Schenectady, private company employees (20,146 | 66.1%), not-for-profit organizations (4,641 | 15.2%), and state government employees (1,908 | 6.3%) make up the most common classes of employment.
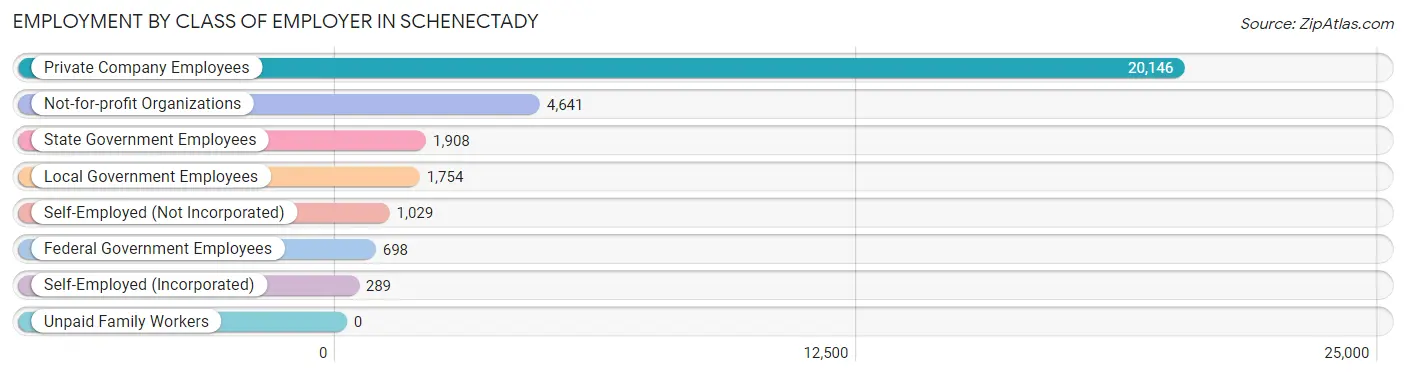
| Employer Class | # Employees | % Employees |
| Private Company Employees | 20,146 | 66.1% |
| Self-Employed (Incorporated) | 289 | 0.9% |
| Self-Employed (Not Incorporated) | 1,029 | 3.4% |
| Not-for-profit Organizations | 4,641 | 15.2% |
| Local Government Employees | 1,754 | 5.8% |
| State Government Employees | 1,908 | 6.3% |
| Federal Government Employees | 698 | 2.3% |
| Unpaid Family Workers | 0 | 0.0% |
| Total | 30,465 | 100.0% |
Employment Status by Age in Schenectady
According to the labor force statistics for Schenectady, out of the total population over 16 years of age (56,188), 61.2% or 34,387 individuals are in the labor force, with 9.4% or 3,232 of them unemployed. The age group with the highest labor force participation rate is 25 to 29 years, with 84.7% or 4,633 individuals in the labor force. Within the labor force, the 16 to 19 years age range has the highest percentage of unemployed individuals, with 23.6% or 429 of them being unemployed.
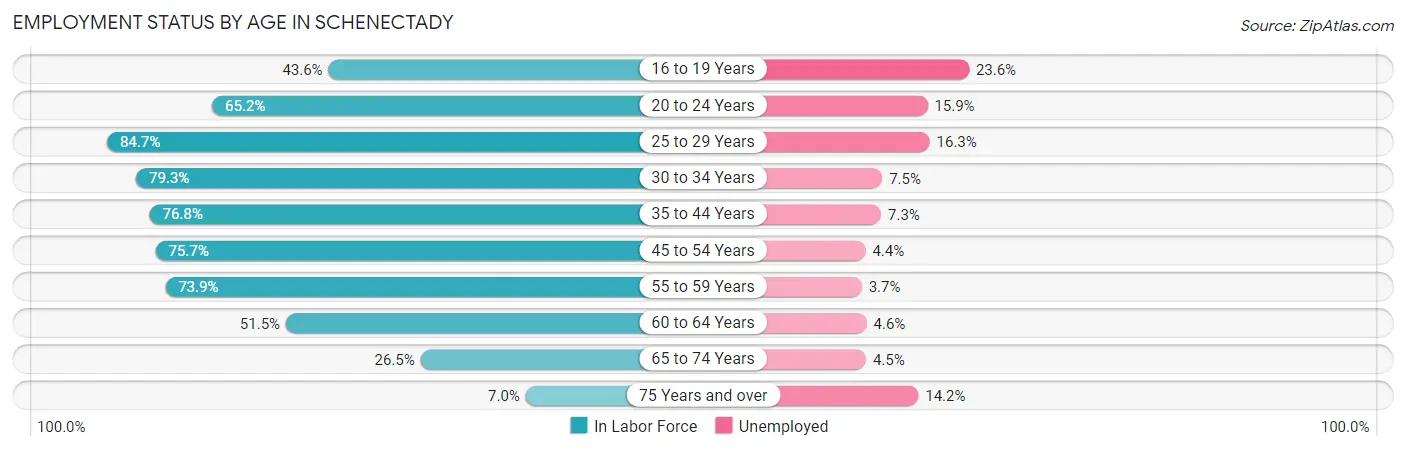
| Age Bracket | In Labor Force | Unemployed |
| 16 to 19 Years | 1,816 (43.6%) | 429 (23.6%) |
| 20 to 24 Years | 4,199 (65.2%) | 668 (15.9%) |
| 25 to 29 Years | 4,633 (84.7%) | 755 (16.3%) |
| 30 to 34 Years | 4,040 (79.3%) | 303 (7.5%) |
| 35 to 44 Years | 6,199 (76.8%) | 453 (7.3%) |
| 45 to 54 Years | 6,076 (75.7%) | 267 (4.4%) |
| 55 to 59 Years | 3,233 (73.9%) | 120 (3.7%) |
| 60 to 64 Years | 2,361 (51.5%) | 109 (4.6%) |
| 65 to 74 Years | 1,519 (26.5%) | 68 (4.5%) |
| 75 Years and over | 296 (7.0%) | 42 (14.2%) |
| Total | 34,387 (61.2%) | 3,232 (9.4%) |
Employment Status by Educational Attainment in Schenectady
According to labor force statistics for Schenectady, 74.5% of individuals (26,537) out of the total population between 25 and 64 years of age (35,620) are in the labor force, with 7.6% or 2,017 of them being unemployed. The group with the highest labor force participation rate are those with the educational attainment of bachelor's degree or higher, with 87.8% or 7,085 individuals in the labor force. Within the labor force, individuals with less than high school education have the highest percentage of unemployment, with 16.7% or 428 of them being unemployed.
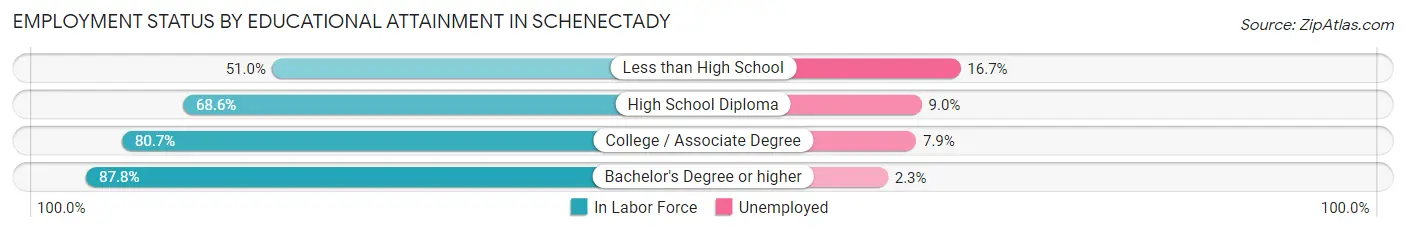
| Educational Attainment | In Labor Force | Unemployed |
| Less than High School | 2,560 (51.0%) | 838 (16.7%) |
| High School Diploma | 7,305 (68.6%) | 958 (9.0%) |
| College / Associate Degree | 9,588 (80.7%) | 939 (7.9%) |
| Bachelor's Degree or higher | 7,085 (87.8%) | 186 (2.3%) |
| Total | 26,537 (74.5%) | 2,707 (7.6%) |
Employment Occupations by Sex in Schenectady
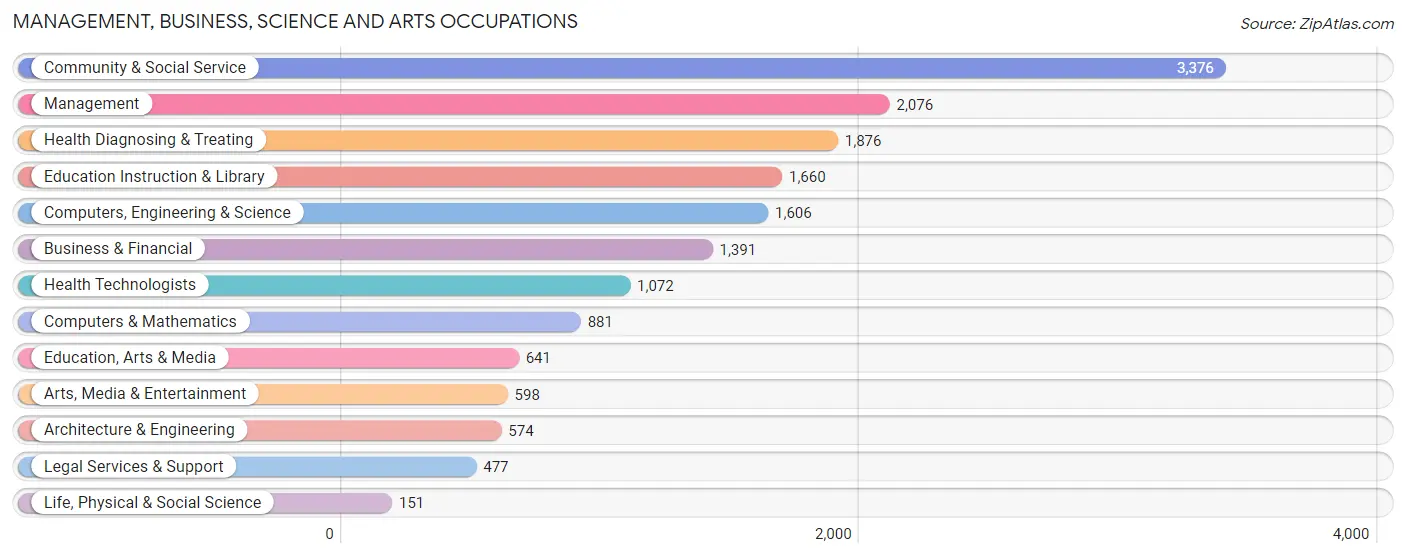
Management, Business, Science and Arts Occupations
The most common Management, Business, Science and Arts occupations in Schenectady are Community & Social Service (3,376 | 10.8%), Management (2,076 | 6.7%), Health Diagnosing & Treating (1,876 | 6.0%), Education Instruction & Library (1,660 | 5.3%), and Computers, Engineering & Science (1,606 | 5.2%).
Management, Business, Science and Arts Occupations by Sex
Within the Management, Business, Science and Arts occupations in Schenectady, the most male-oriented occupations are Architecture & Engineering (77.9%), Computers & Mathematics (74.2%), and Computers, Engineering & Science (73.7%), while the most female-oriented occupations are Health Technologists (83.0%), Health Diagnosing & Treating (80.6%), and Education, Arts & Media (72.7%).
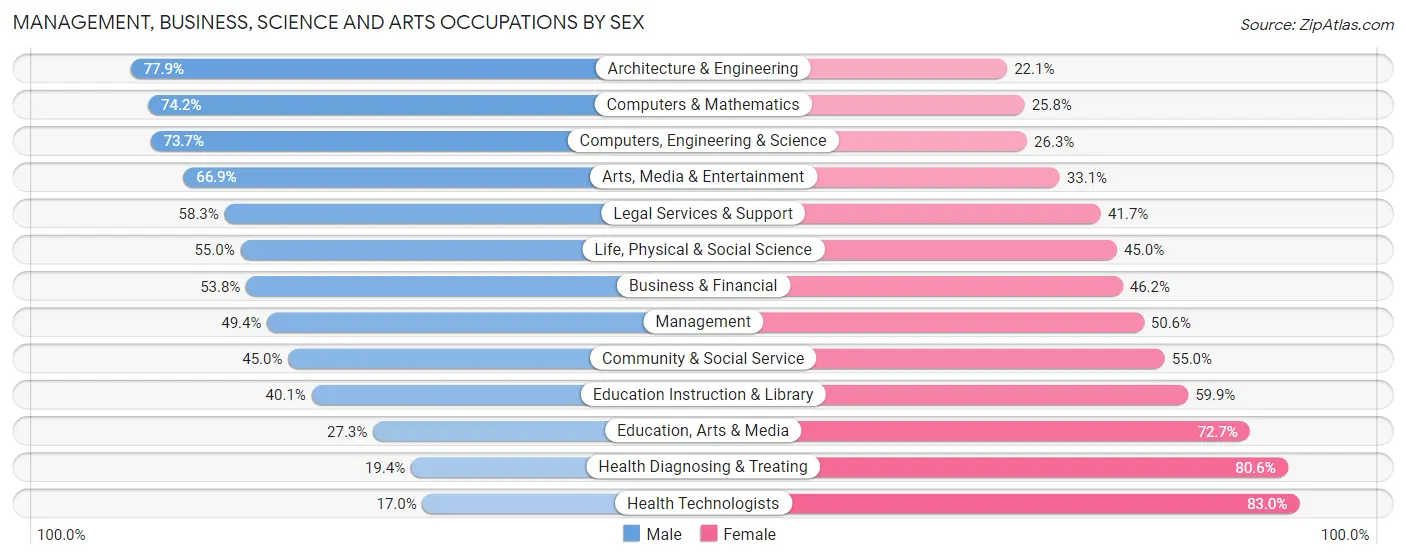
| Occupation | Male | Female |
| Management | 1,025 (49.4%) | 1,051 (50.6%) |
| Business & Financial | 748 (53.8%) | 643 (46.2%) |
| Computers, Engineering & Science | 1,184 (73.7%) | 422 (26.3%) |
| Computers & Mathematics | 654 (74.2%) | 227 (25.8%) |
| Architecture & Engineering | 447 (77.9%) | 127 (22.1%) |
| Life, Physical & Social Science | 83 (55.0%) | 68 (45.0%) |
| Community & Social Service | 1,519 (45.0%) | 1,857 (55.0%) |
| Education, Arts & Media | 175 (27.3%) | 466 (72.7%) |
| Legal Services & Support | 278 (58.3%) | 199 (41.7%) |
| Education Instruction & Library | 666 (40.1%) | 994 (59.9%) |
| Arts, Media & Entertainment | 400 (66.9%) | 198 (33.1%) |
| Health Diagnosing & Treating | 364 (19.4%) | 1,512 (80.6%) |
| Health Technologists | 182 (17.0%) | 890 (83.0%) |
| Total (Category) | 4,840 (46.9%) | 5,485 (53.1%) |
| Total (Overall) | 16,423 (52.8%) | 14,692 (47.2%) |
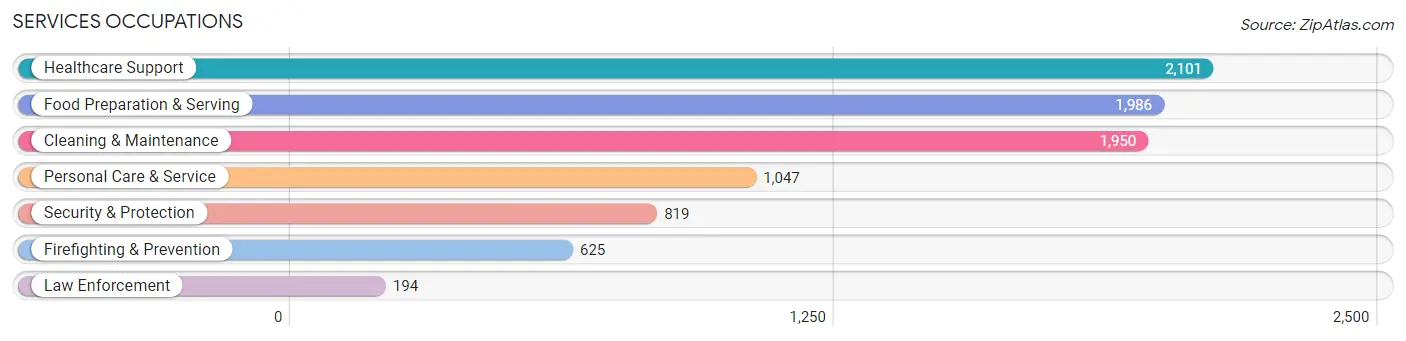
Services Occupations
The most common Services occupations in Schenectady are Healthcare Support (2,101 | 6.8%), Food Preparation & Serving (1,986 | 6.4%), Cleaning & Maintenance (1,950 | 6.3%), Personal Care & Service (1,047 | 3.4%), and Security & Protection (819 | 2.6%).
Services Occupations by Sex
Within the Services occupations in Schenectady, the most male-oriented occupations are Law Enforcement (88.1%), Security & Protection (74.0%), and Firefighting & Prevention (69.6%), while the most female-oriented occupations are Healthcare Support (86.5%), Personal Care & Service (63.3%), and Cleaning & Maintenance (55.4%).
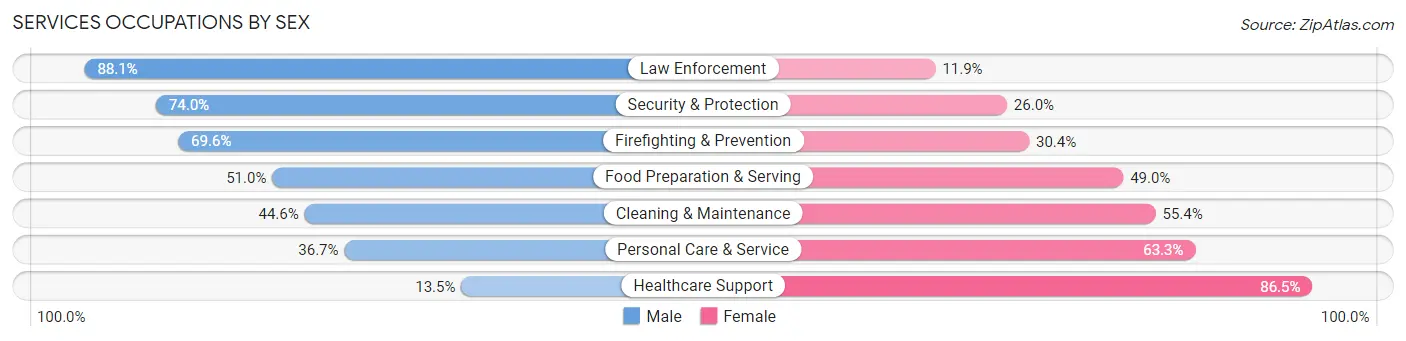
| Occupation | Male | Female |
| Healthcare Support | 284 (13.5%) | 1,817 (86.5%) |
| Security & Protection | 606 (74.0%) | 213 (26.0%) |
| Firefighting & Prevention | 435 (69.6%) | 190 (30.4%) |
| Law Enforcement | 171 (88.1%) | 23 (11.9%) |
| Food Preparation & Serving | 1,012 (51.0%) | 974 (49.0%) |
| Cleaning & Maintenance | 869 (44.6%) | 1,081 (55.4%) |
| Personal Care & Service | 384 (36.7%) | 663 (63.3%) |
| Total (Category) | 3,155 (39.9%) | 4,748 (60.1%) |
| Total (Overall) | 16,423 (52.8%) | 14,692 (47.2%) |
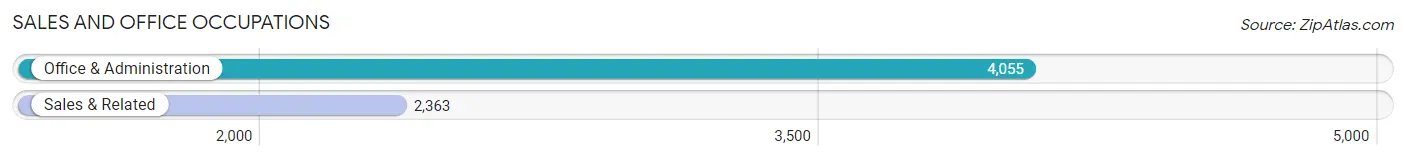
Sales and Office Occupations
The most common Sales and Office occupations in Schenectady are Office & Administration (4,055 | 13.0%), and Sales & Related (2,363 | 7.6%).
Sales and Office Occupations by Sex
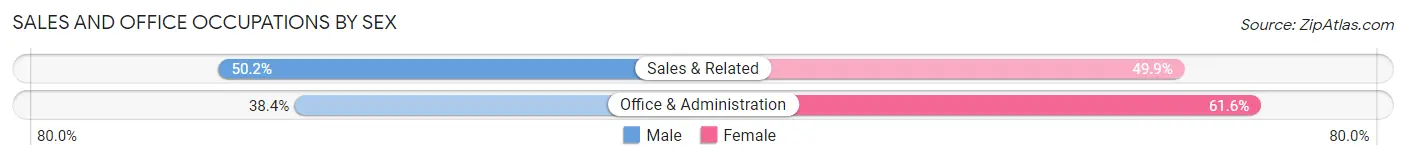
| Occupation | Male | Female |
| Sales & Related | 1,185 (50.1%) | 1,178 (49.8%) |
| Office & Administration | 1,557 (38.4%) | 2,498 (61.6%) |
| Total (Category) | 2,742 (42.7%) | 3,676 (57.3%) |
| Total (Overall) | 16,423 (52.8%) | 14,692 (47.2%) |
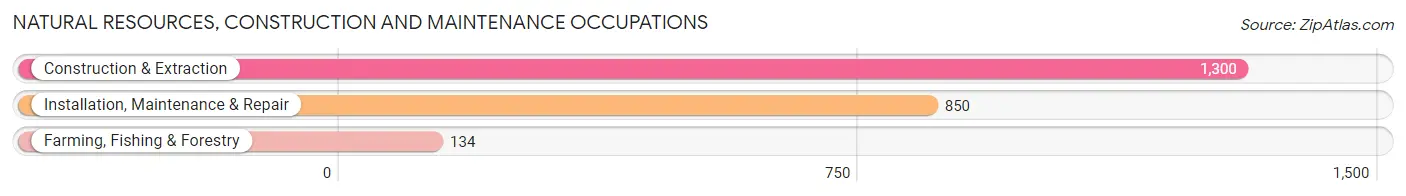
Natural Resources, Construction and Maintenance Occupations
The most common Natural Resources, Construction and Maintenance occupations in Schenectady are Construction & Extraction (1,300 | 4.2%), Installation, Maintenance & Repair (850 | 2.7%), and Farming, Fishing & Forestry (134 | 0.4%).
Natural Resources, Construction and Maintenance Occupations by Sex
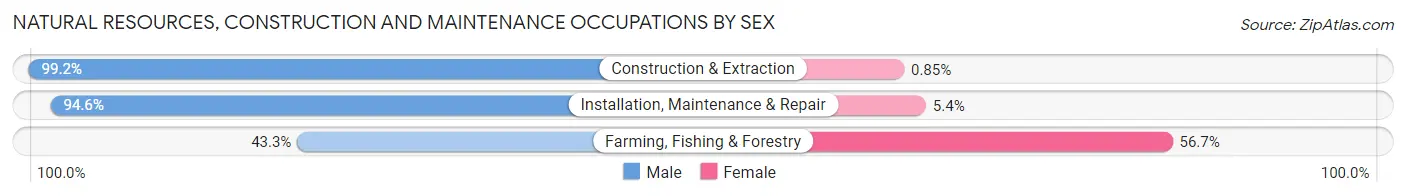
| Occupation | Male | Female |
| Farming, Fishing & Forestry | 58 (43.3%) | 76 (56.7%) |
| Construction & Extraction | 1,289 (99.2%) | 11 (0.9%) |
| Installation, Maintenance & Repair | 804 (94.6%) | 46 (5.4%) |
| Total (Category) | 2,151 (94.2%) | 133 (5.8%) |
| Total (Overall) | 16,423 (52.8%) | 14,692 (47.2%) |
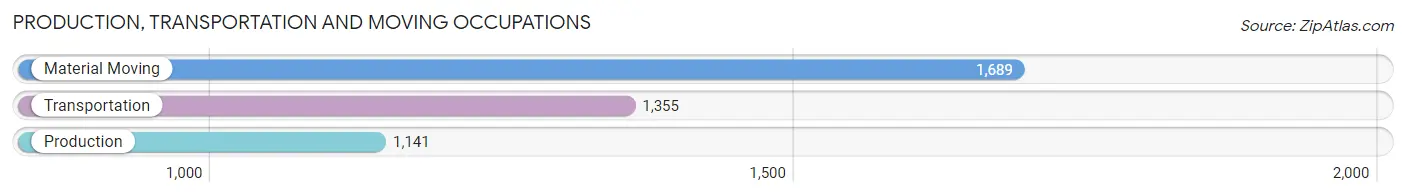
Production, Transportation and Moving Occupations
The most common Production, Transportation and Moving occupations in Schenectady are Material Moving (1,689 | 5.4%), Transportation (1,355 | 4.3%), and Production (1,141 | 3.7%).
Production, Transportation and Moving Occupations by Sex
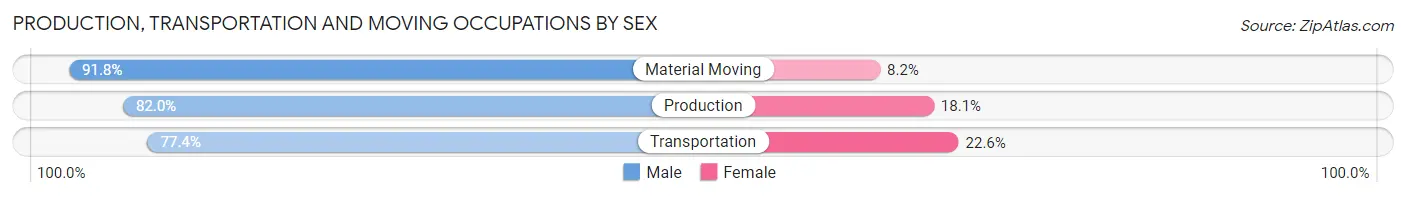
| Occupation | Male | Female |
| Production | 935 (82.0%) | 206 (18.0%) |
| Transportation | 1,049 (77.4%) | 306 (22.6%) |
| Material Moving | 1,551 (91.8%) | 138 (8.2%) |
| Total (Category) | 3,535 (84.5%) | 650 (15.5%) |
| Total (Overall) | 16,423 (52.8%) | 14,692 (47.2%) |
Employment Industries by Sex in Schenectady
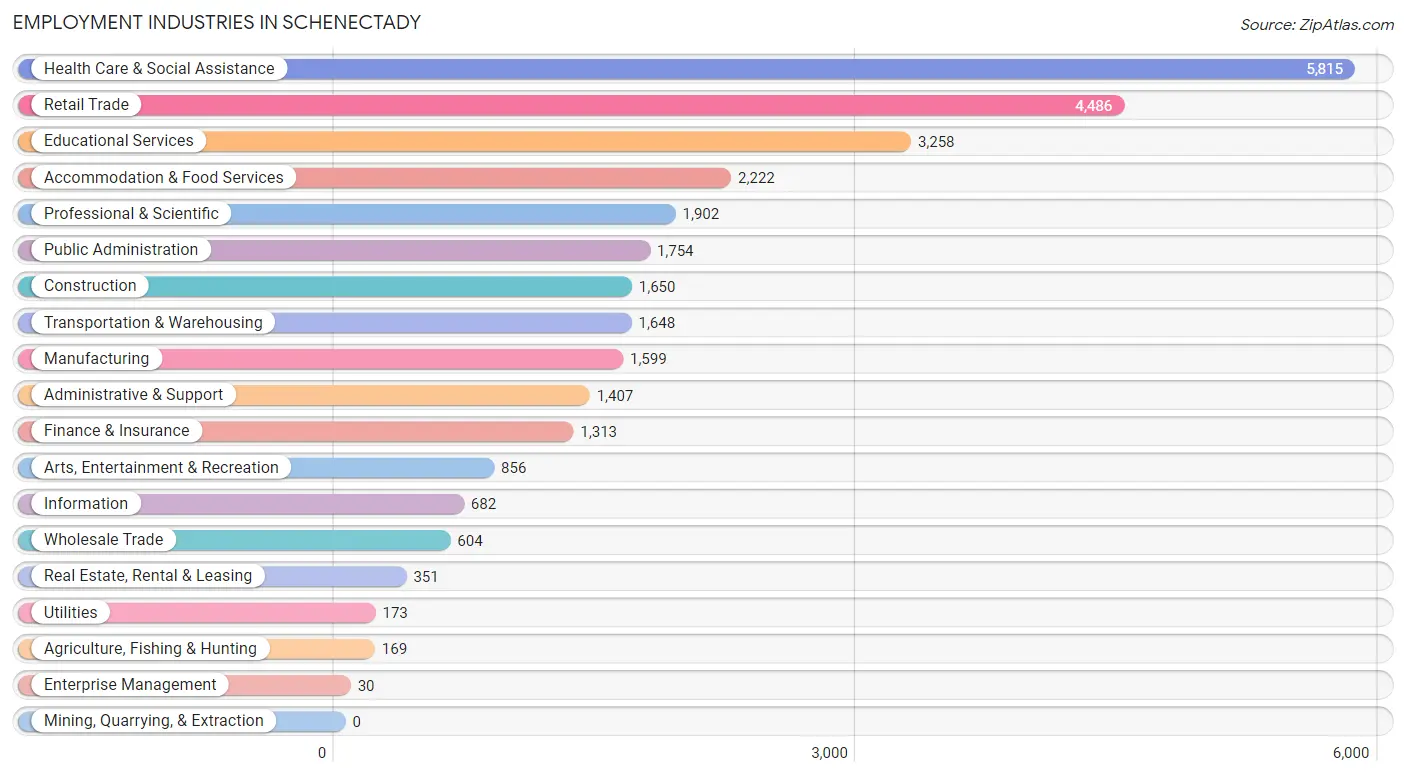
Employment Industries in Schenectady
The major employment industries in Schenectady include Health Care & Social Assistance (5,815 | 18.7%), Retail Trade (4,486 | 14.4%), Educational Services (3,258 | 10.5%), Accommodation & Food Services (2,222 | 7.1%), and Professional & Scientific (1,902 | 6.1%).
Employment Industries by Sex in Schenectady
The Schenectady industries that see more men than women are Construction (95.2%), Manufacturing (80.7%), and Wholesale Trade (79.5%), whereas the industries that tend to have a higher number of women are Health Care & Social Assistance (78.9%), Educational Services (62.9%), and Finance & Insurance (53.9%).
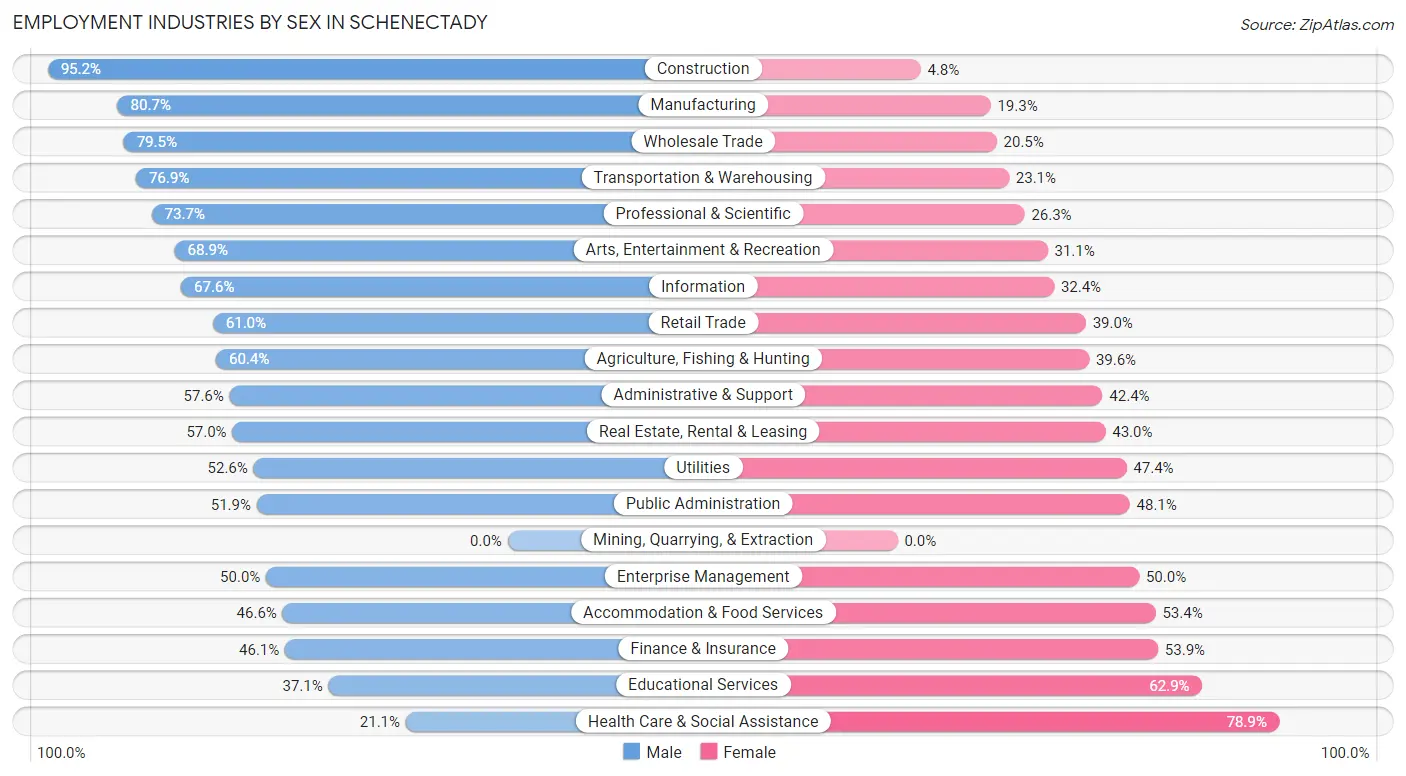
| Industry | Male | Female |
| Agriculture, Fishing & Hunting | 102 (60.4%) | 67 (39.6%) |
| Mining, Quarrying, & Extraction | 0 (0.0%) | 0 (0.0%) |
| Construction | 1,571 (95.2%) | 79 (4.8%) |
| Manufacturing | 1,291 (80.7%) | 308 (19.3%) |
| Wholesale Trade | 480 (79.5%) | 124 (20.5%) |
| Retail Trade | 2,738 (61.0%) | 1,748 (39.0%) |
| Transportation & Warehousing | 1,268 (76.9%) | 380 (23.1%) |
| Utilities | 91 (52.6%) | 82 (47.4%) |
| Information | 461 (67.6%) | 221 (32.4%) |
| Finance & Insurance | 605 (46.1%) | 708 (53.9%) |
| Real Estate, Rental & Leasing | 200 (57.0%) | 151 (43.0%) |
| Professional & Scientific | 1,402 (73.7%) | 500 (26.3%) |
| Enterprise Management | 15 (50.0%) | 15 (50.0%) |
| Administrative & Support | 810 (57.6%) | 597 (42.4%) |
| Educational Services | 1,208 (37.1%) | 2,050 (62.9%) |
| Health Care & Social Assistance | 1,226 (21.1%) | 4,589 (78.9%) |
| Arts, Entertainment & Recreation | 590 (68.9%) | 266 (31.1%) |
| Accommodation & Food Services | 1,035 (46.6%) | 1,187 (53.4%) |
| Public Administration | 911 (51.9%) | 843 (48.1%) |
| Total | 16,423 (52.8%) | 14,692 (47.2%) |
Education in Schenectady
School Enrollment in Schenectady
The most common levels of schooling among the 16,103 students in Schenectady are college / undergraduate (5,353 | 33.2%), elementary school (3,007 | 18.7%), and high school (2,991 | 18.6%).
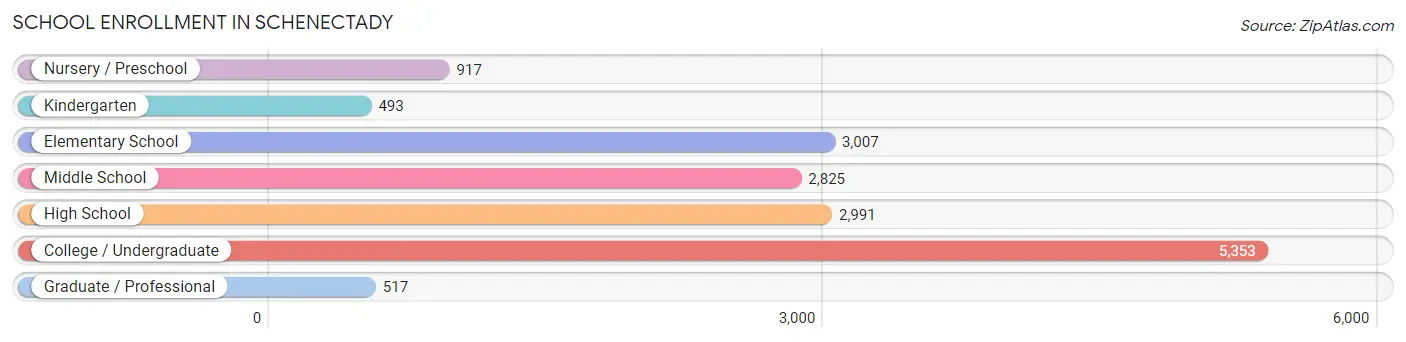
| School Level | # Students | % Students |
| Nursery / Preschool | 917 | 5.7% |
| Kindergarten | 493 | 3.1% |
| Elementary School | 3,007 | 18.7% |
| Middle School | 2,825 | 17.5% |
| High School | 2,991 | 18.6% |
| College / Undergraduate | 5,353 | 33.2% |
| Graduate / Professional | 517 | 3.2% |
| Total | 16,103 | 100.0% |
School Enrollment by Age by Funding Source in Schenectady
Out of a total of 16,103 students who are enrolled in schools in Schenectady, 4,316 (26.8%) attend a private institution, while the remaining 11,787 (73.2%) are enrolled in public schools. The age group of 20 to 24 year olds has the highest likelihood of being enrolled in private schools, with 1,594 (63.4% in the age bracket) enrolled. Conversely, the age group of 5 to 9 year old has the lowest likelihood of being enrolled in a private school, with 3,148 (93.4% in the age bracket) attending a public institution.
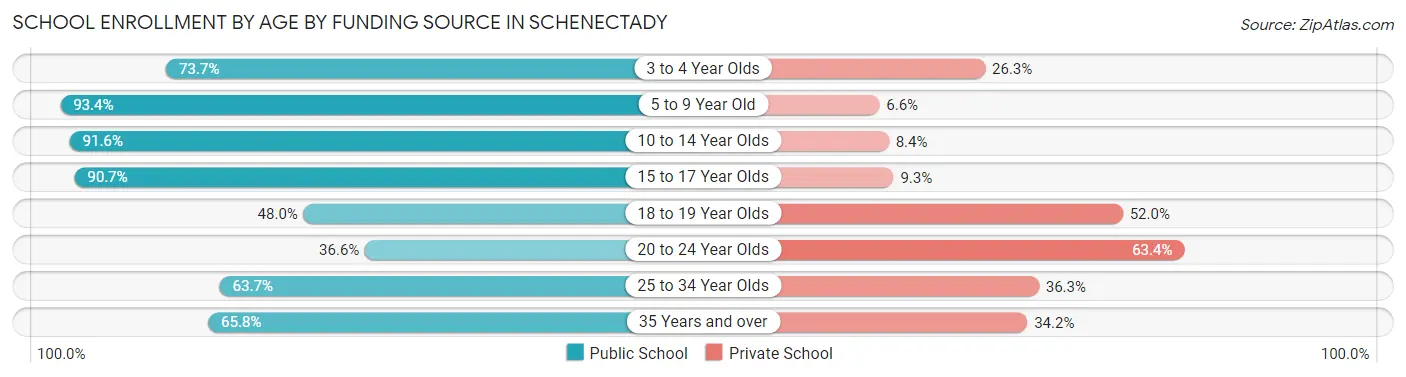
| Age Bracket | Public School | Private School |
| 3 to 4 Year Olds | 593 (73.7%) | 212 (26.3%) |
| 5 to 9 Year Old | 3,148 (93.4%) | 224 (6.6%) |
| 10 to 14 Year Olds | 3,243 (91.6%) | 297 (8.4%) |
| 15 to 17 Year Olds | 1,642 (90.7%) | 168 (9.3%) |
| 18 to 19 Year Olds | 1,089 (48.0%) | 1,179 (52.0%) |
| 20 to 24 Year Olds | 919 (36.6%) | 1,594 (63.4%) |
| 25 to 34 Year Olds | 599 (63.7%) | 342 (36.3%) |
| 35 Years and over | 562 (65.8%) | 292 (34.2%) |
| Total | 11,787 (73.2%) | 4,316 (26.8%) |
Educational Attainment by Field of Study in Schenectady
Business (1,720 | 15.6%), social sciences (1,169 | 10.6%), psychology (1,002 | 9.1%), liberal arts & history (965 | 8.7%), and science & technology (941 | 8.5%) are the most common fields of study among 11,047 individuals in Schenectady who have obtained a bachelor's degree or higher.
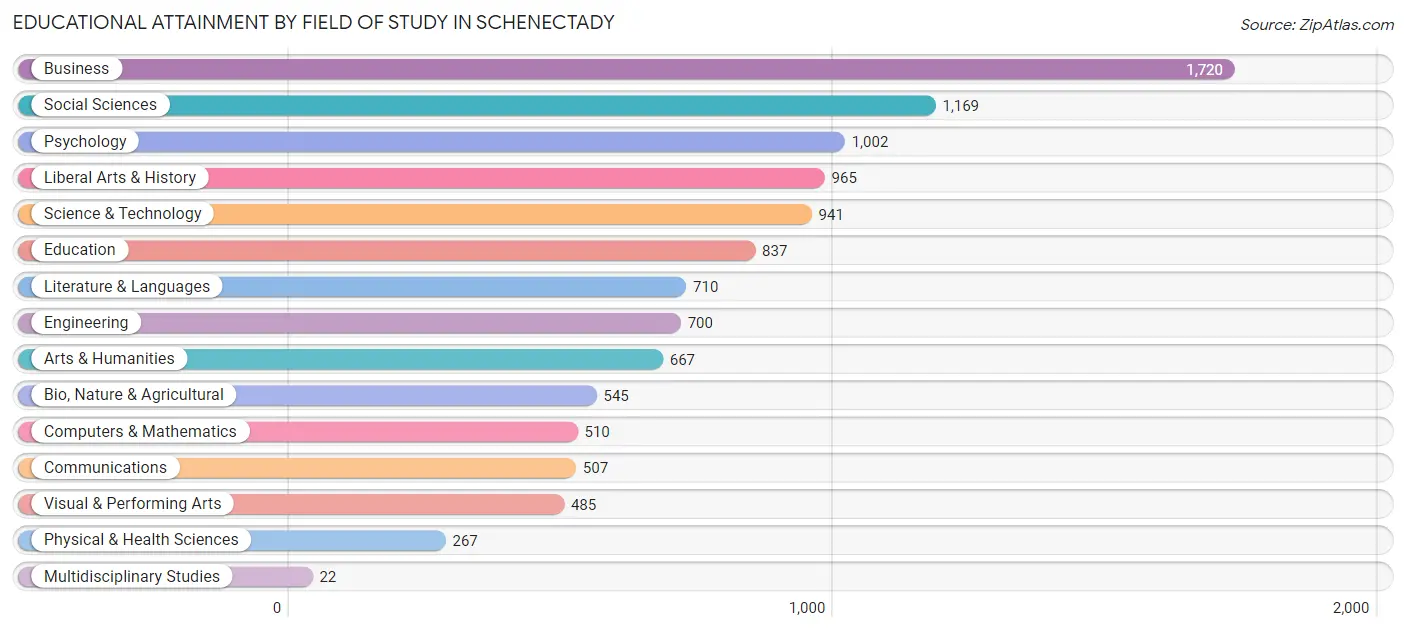
| Field of Study | # Graduates | % Graduates |
| Computers & Mathematics | 510 | 4.6% |
| Bio, Nature & Agricultural | 545 | 4.9% |
| Physical & Health Sciences | 267 | 2.4% |
| Psychology | 1,002 | 9.1% |
| Social Sciences | 1,169 | 10.6% |
| Engineering | 700 | 6.3% |
| Multidisciplinary Studies | 22 | 0.2% |
| Science & Technology | 941 | 8.5% |
| Business | 1,720 | 15.6% |
| Education | 837 | 7.6% |
| Literature & Languages | 710 | 6.4% |
| Liberal Arts & History | 965 | 8.7% |
| Visual & Performing Arts | 485 | 4.4% |
| Communications | 507 | 4.6% |
| Arts & Humanities | 667 | 6.0% |
| Total | 11,047 | 100.0% |
Transportation & Commute in Schenectady
Vehicle Availability by Sex in Schenectady
The most prevalent vehicle ownership categories in Schenectady are males with 1 vehicle (5,772, accounting for 36.5%) and females with 1 vehicle (5,118, making up 41.4%).
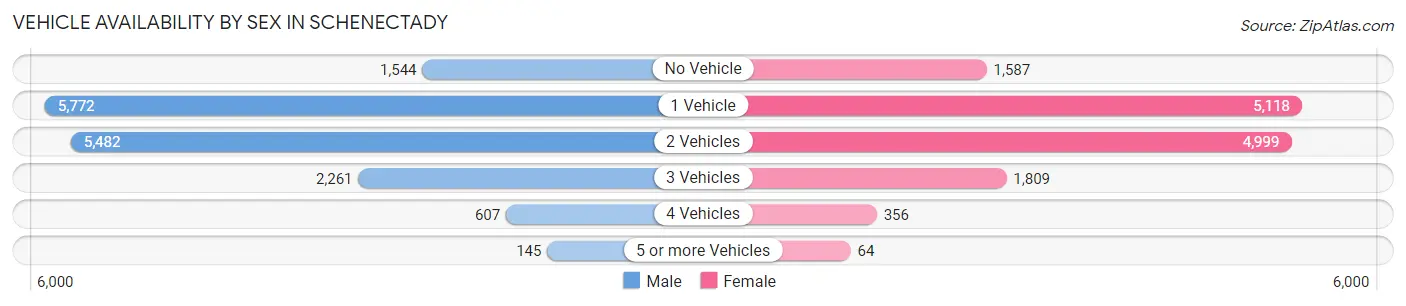
| Vehicles Available | Male | Female |
| No Vehicle | 1,544 (9.8%) | 1,587 (11.4%) |
| 1 Vehicle | 5,772 (36.5%) | 5,118 (36.7%) |
| 2 Vehicles | 5,482 (34.7%) | 4,999 (35.9%) |
| 3 Vehicles | 2,261 (14.3%) | 1,809 (13.0%) |
| 4 Vehicles | 607 (3.8%) | 356 (2.6%) |
| 5 or more Vehicles | 145 (0.9%) | 64 (0.5%) |
| Total | 15,811 (100.0%) | 13,933 (100.0%) |
Commute Time in Schenectady
The most frequently occuring commute durations in Schenectady are 10 to 14 minutes (5,887 commuters, 20.8%), 30 to 34 minutes (4,506 commuters, 16.0%), and 15 to 19 minutes (4,123 commuters, 14.6%).
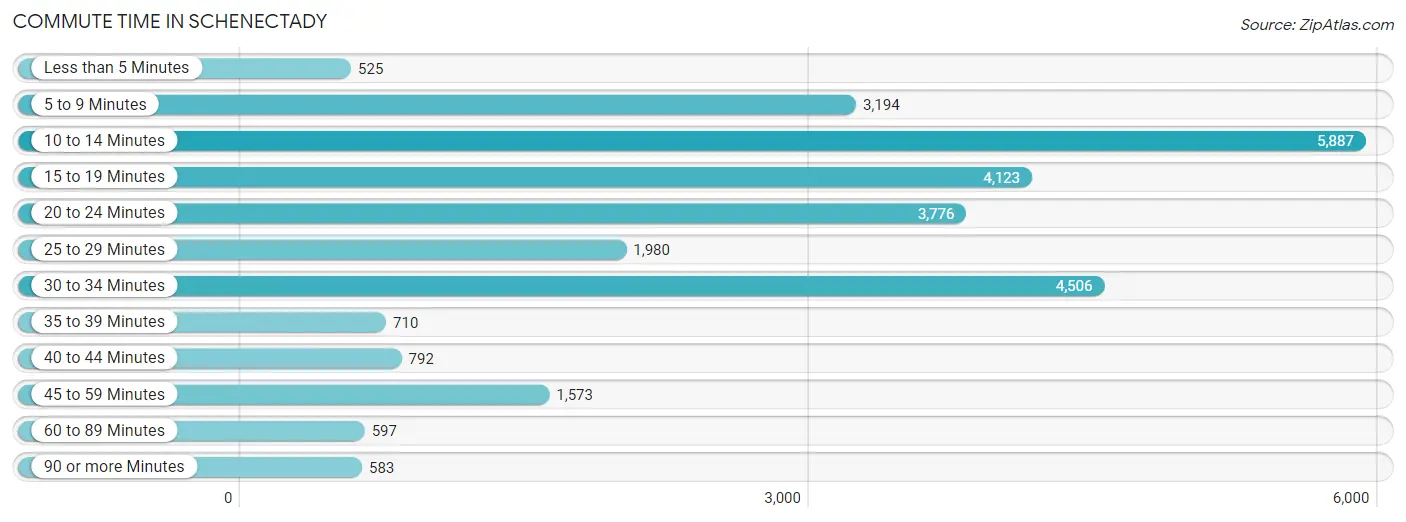
| Commute Time | # Commuters | % Commuters |
| Less than 5 Minutes | 525 | 1.9% |
| 5 to 9 Minutes | 3,194 | 11.3% |
| 10 to 14 Minutes | 5,887 | 20.8% |
| 15 to 19 Minutes | 4,123 | 14.6% |
| 20 to 24 Minutes | 3,776 | 13.4% |
| 25 to 29 Minutes | 1,980 | 7.0% |
| 30 to 34 Minutes | 4,506 | 16.0% |
| 35 to 39 Minutes | 710 | 2.5% |
| 40 to 44 Minutes | 792 | 2.8% |
| 45 to 59 Minutes | 1,573 | 5.6% |
| 60 to 89 Minutes | 597 | 2.1% |
| 90 or more Minutes | 583 | 2.1% |
Commute Time by Sex in Schenectady
The most common commute times in Schenectady are 10 to 14 minutes (2,959 commuters, 19.8%) for males and 10 to 14 minutes (2,928 commuters, 22.1%) for females.
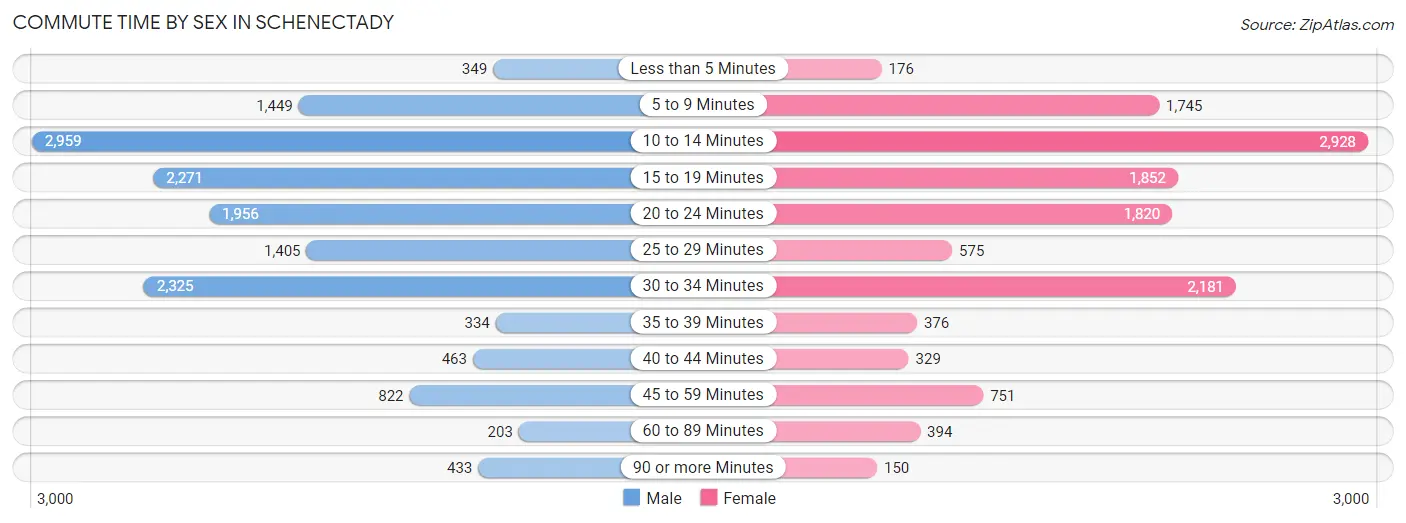
| Commute Time | Male | Female |
| Less than 5 Minutes | 349 (2.3%) | 176 (1.3%) |
| 5 to 9 Minutes | 1,449 (9.7%) | 1,745 (13.1%) |
| 10 to 14 Minutes | 2,959 (19.8%) | 2,928 (22.1%) |
| 15 to 19 Minutes | 2,271 (15.2%) | 1,852 (14.0%) |
| 20 to 24 Minutes | 1,956 (13.1%) | 1,820 (13.7%) |
| 25 to 29 Minutes | 1,405 (9.4%) | 575 (4.3%) |
| 30 to 34 Minutes | 2,325 (15.5%) | 2,181 (16.4%) |
| 35 to 39 Minutes | 334 (2.2%) | 376 (2.8%) |
| 40 to 44 Minutes | 463 (3.1%) | 329 (2.5%) |
| 45 to 59 Minutes | 822 (5.5%) | 751 (5.7%) |
| 60 to 89 Minutes | 203 (1.4%) | 394 (3.0%) |
| 90 or more Minutes | 433 (2.9%) | 150 (1.1%) |
Time of Departure to Work by Sex in Schenectady
The most frequent times of departure to work in Schenectady are 6:00 AM to 6:29 AM (1,788, 11.9%) for males and 12:00 PM to 3:59 PM (2,329, 17.5%) for females.
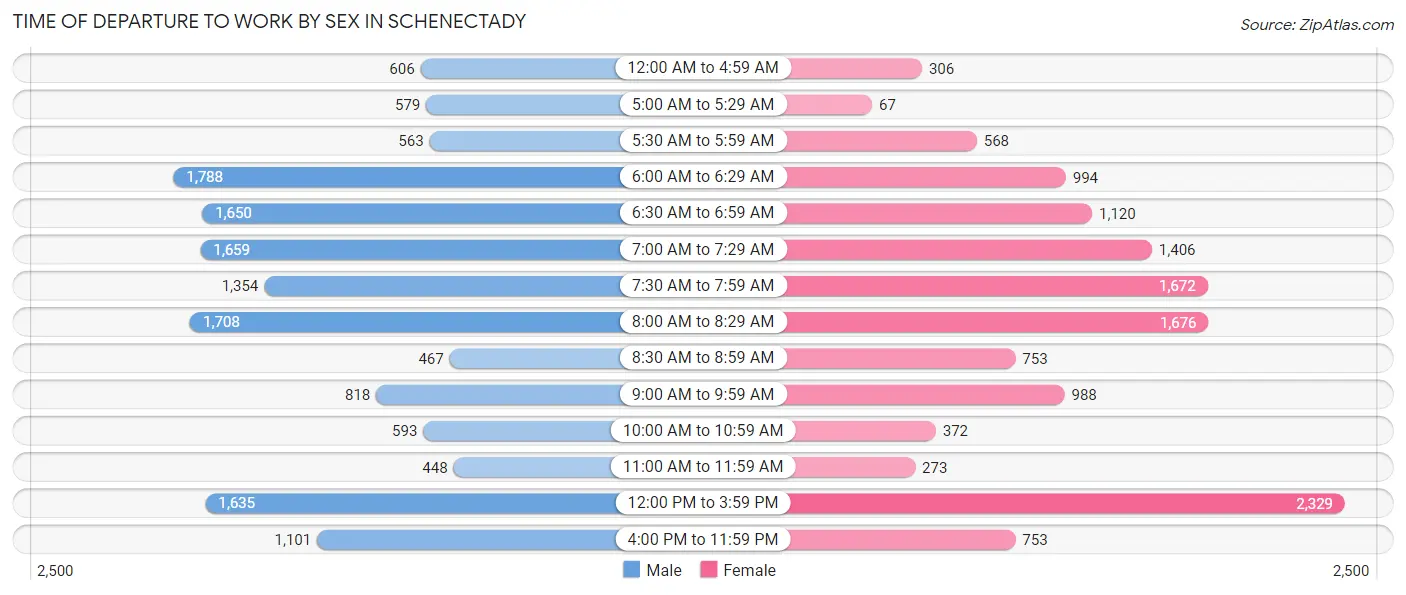
| Time of Departure | Male | Female |
| 12:00 AM to 4:59 AM | 606 (4.1%) | 306 (2.3%) |
| 5:00 AM to 5:29 AM | 579 (3.9%) | 67 (0.5%) |
| 5:30 AM to 5:59 AM | 563 (3.8%) | 568 (4.3%) |
| 6:00 AM to 6:29 AM | 1,788 (11.9%) | 994 (7.5%) |
| 6:30 AM to 6:59 AM | 1,650 (11.0%) | 1,120 (8.4%) |
| 7:00 AM to 7:29 AM | 1,659 (11.1%) | 1,406 (10.6%) |
| 7:30 AM to 7:59 AM | 1,354 (9.0%) | 1,672 (12.6%) |
| 8:00 AM to 8:29 AM | 1,708 (11.4%) | 1,676 (12.6%) |
| 8:30 AM to 8:59 AM | 467 (3.1%) | 753 (5.7%) |
| 9:00 AM to 9:59 AM | 818 (5.5%) | 988 (7.4%) |
| 10:00 AM to 10:59 AM | 593 (4.0%) | 372 (2.8%) |
| 11:00 AM to 11:59 AM | 448 (3.0%) | 273 (2.1%) |
| 12:00 PM to 3:59 PM | 1,635 (10.9%) | 2,329 (17.5%) |
| 4:00 PM to 11:59 PM | 1,101 (7.4%) | 753 (5.7%) |
| Total | 14,969 (100.0%) | 13,277 (100.0%) |
Housing Occupancy in Schenectady
Occupancy by Ownership in Schenectady
Of the total 28,108 dwellings in Schenectady, owner-occupied units account for 12,729 (45.3%), while renter-occupied units make up 15,379 (54.7%).
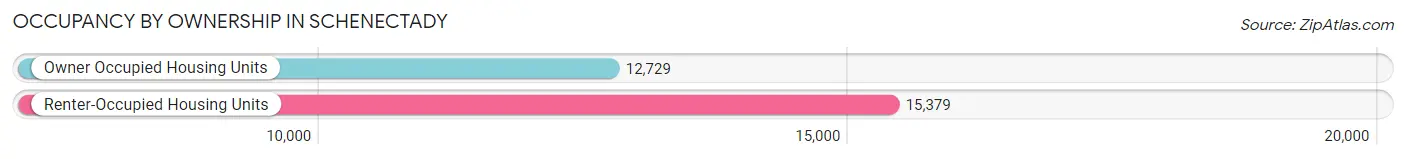
| Occupancy | # Housing Units | % Housing Units |
| Owner Occupied Housing Units | 12,729 | 45.3% |
| Renter-Occupied Housing Units | 15,379 | 54.7% |
| Total Occupied Housing Units | 28,108 | 100.0% |
Occupancy by Household Size in Schenectady
| Household Size | # Housing Units | % Housing Units |
| 1-Person Household | 11,298 | 40.2% |
| 2-Person Household | 8,204 | 29.2% |
| 3-Person Household | 4,555 | 16.2% |
| 4+ Person Household | 4,051 | 14.4% |
| Total Housing Units | 28,108 | 100.0% |
Occupancy by Ownership by Household Size in Schenectady
| Household Size | Owner-occupied | Renter-occupied |
| 1-Person Household | 3,648 (32.3%) | 7,650 (67.7%) |
| 2-Person Household | 4,573 (55.7%) | 3,631 (44.3%) |
| 3-Person Household | 2,347 (51.5%) | 2,208 (48.5%) |
| 4+ Person Household | 2,161 (53.3%) | 1,890 (46.7%) |
| Total Housing Units | 12,729 (45.3%) | 15,379 (54.7%) |
Occupancy by Educational Attainment in Schenectady
| Household Size | Owner-occupied | Renter-occupied |
| Less than High School | 1,229 (32.5%) | 2,552 (67.5%) |
| High School Diploma | 3,442 (43.7%) | 4,439 (56.3%) |
| College/Associate Degree | 4,208 (44.7%) | 5,214 (55.3%) |
| Bachelor's Degree or higher | 3,850 (54.8%) | 3,174 (45.2%) |
Occupancy by Age of Householder in Schenectady
| Age Bracket | # Households | % Households |
| Under 35 Years | 6,667 | 23.7% |
| 35 to 44 Years | 4,664 | 16.6% |
| 45 to 54 Years | 4,631 | 16.5% |
| 55 to 64 Years | 5,570 | 19.8% |
| 65 to 74 Years | 3,801 | 13.5% |
| 75 to 84 Years | 2,116 | 7.5% |
| 85 Years and Over | 659 | 2.3% |
| Total | 28,108 | 100.0% |
Housing Finances in Schenectady
Median Income by Occupancy in Schenectady
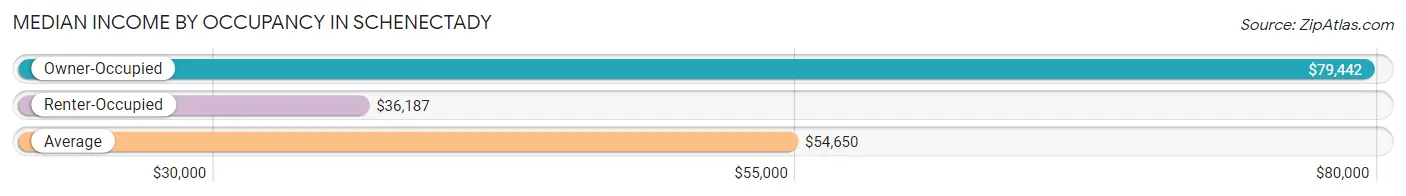
| Occupancy Type | # Households | Median Income |
| Owner-Occupied | 12,729 (45.3%) | $79,442 |
| Renter-Occupied | 15,379 (54.7%) | $36,187 |
| Average | 28,108 (100.0%) | $54,650 |
Occupancy by Householder Income Bracket in Schenectady
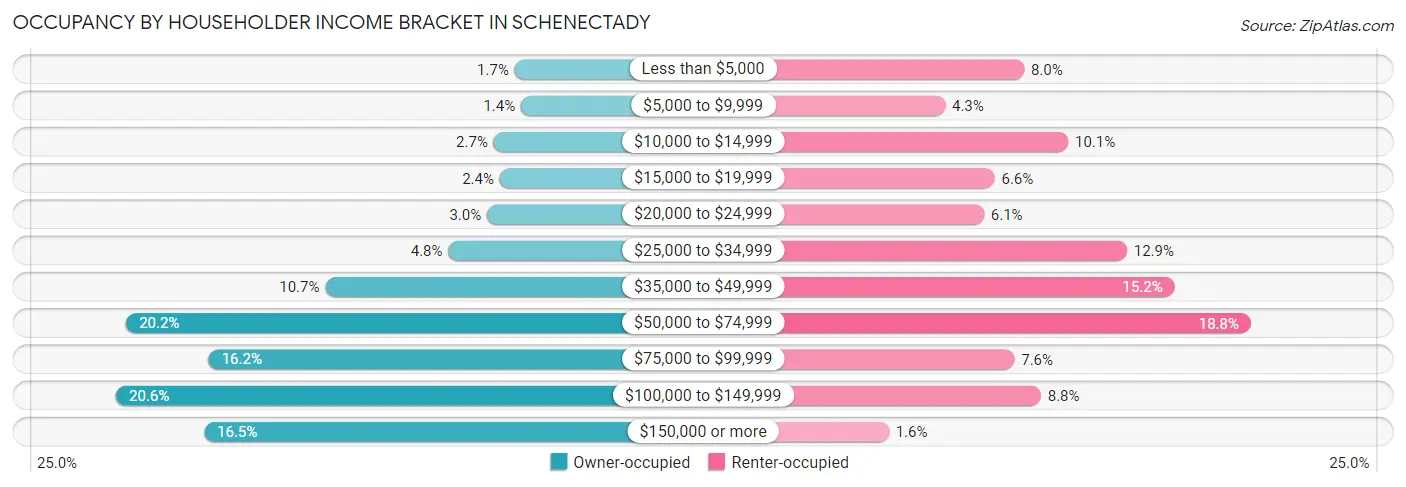
| Income Bracket | Owner-occupied | Renter-occupied |
| Less than $5,000 | 211 (1.7%) | 1,233 (8.0%) |
| $5,000 to $9,999 | 173 (1.4%) | 655 (4.3%) |
| $10,000 to $14,999 | 338 (2.7%) | 1,556 (10.1%) |
| $15,000 to $19,999 | 302 (2.4%) | 1,018 (6.6%) |
| $20,000 to $24,999 | 379 (3.0%) | 939 (6.1%) |
| $25,000 to $34,999 | 614 (4.8%) | 1,987 (12.9%) |
| $35,000 to $49,999 | 1,359 (10.7%) | 2,336 (15.2%) |
| $50,000 to $74,999 | 2,566 (20.2%) | 2,894 (18.8%) |
| $75,000 to $99,999 | 2,066 (16.2%) | 1,162 (7.6%) |
| $100,000 to $149,999 | 2,627 (20.6%) | 1,356 (8.8%) |
| $150,000 or more | 2,094 (16.5%) | 243 (1.6%) |
| Total | 12,729 (100.0%) | 15,379 (100.0%) |
Monthly Housing Cost Tiers in Schenectady
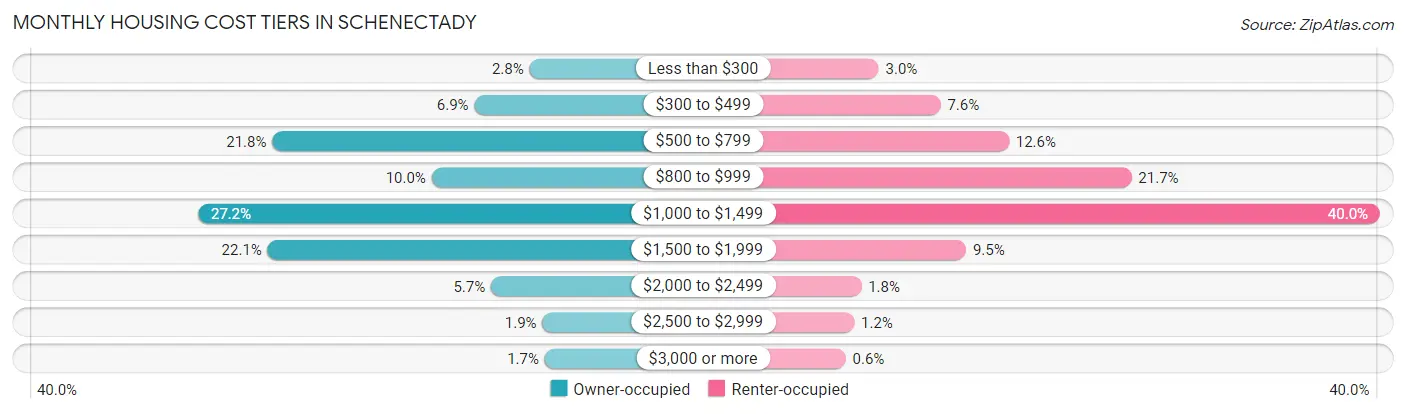
| Monthly Cost | Owner-occupied | Renter-occupied |
| Less than $300 | 358 (2.8%) | 466 (3.0%) |
| $300 to $499 | 874 (6.9%) | 1,167 (7.6%) |
| $500 to $799 | 2,770 (21.8%) | 1,941 (12.6%) |
| $800 to $999 | 1,276 (10.0%) | 3,329 (21.6%) |
| $1,000 to $1,499 | 3,467 (27.2%) | 6,144 (40.0%) |
| $1,500 to $1,999 | 2,813 (22.1%) | 1,457 (9.5%) |
| $2,000 to $2,499 | 719 (5.7%) | 269 (1.8%) |
| $2,500 to $2,999 | 237 (1.9%) | 189 (1.2%) |
| $3,000 or more | 215 (1.7%) | 92 (0.6%) |
| Total | 12,729 (100.0%) | 15,379 (100.0%) |
Physical Housing Characteristics in Schenectady
Housing Structures in Schenectady
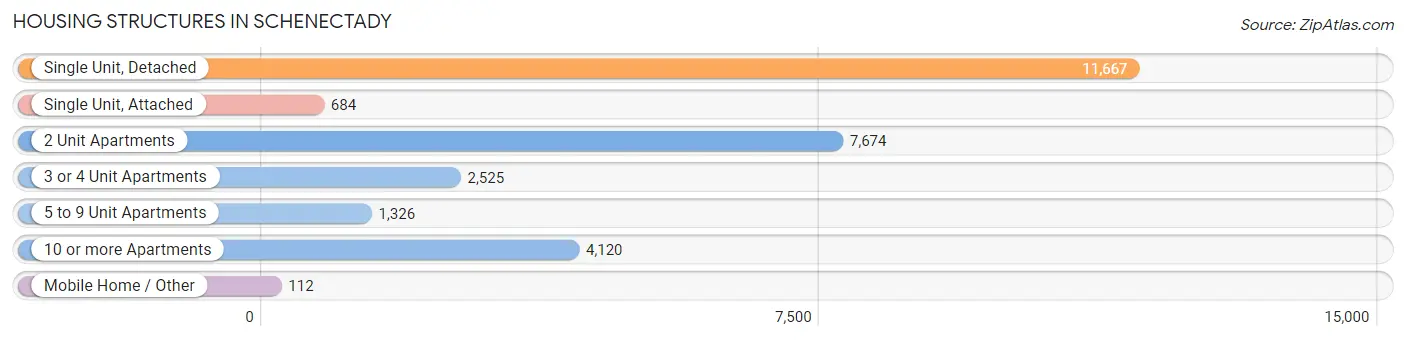
| Structure Type | # Housing Units | % Housing Units |
| Single Unit, Detached | 11,667 | 41.5% |
| Single Unit, Attached | 684 | 2.4% |
| 2 Unit Apartments | 7,674 | 27.3% |
| 3 or 4 Unit Apartments | 2,525 | 9.0% |
| 5 to 9 Unit Apartments | 1,326 | 4.7% |
| 10 or more Apartments | 4,120 | 14.7% |
| Mobile Home / Other | 112 | 0.4% |
| Total | 28,108 | 100.0% |
Housing Structures by Occupancy in Schenectady
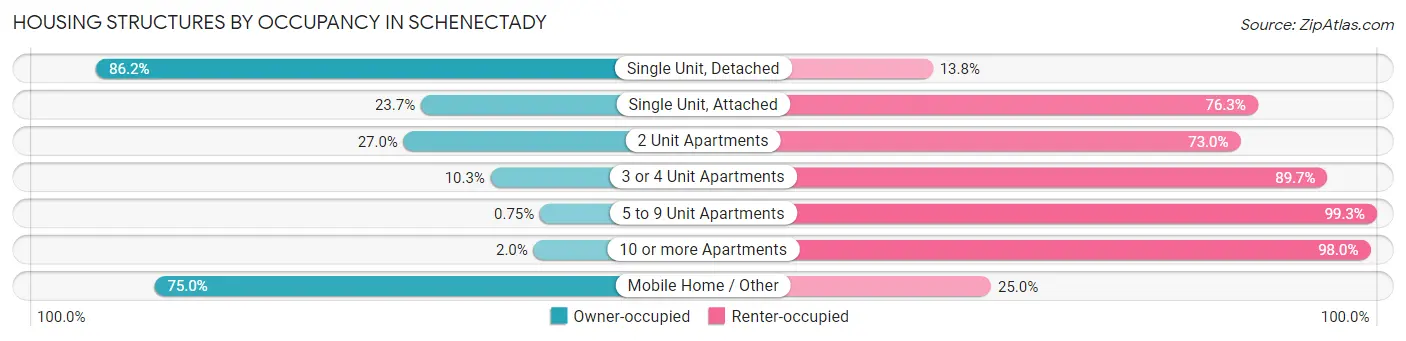
| Structure Type | Owner-occupied | Renter-occupied |
| Single Unit, Detached | 10,059 (86.2%) | 1,608 (13.8%) |
| Single Unit, Attached | 162 (23.7%) | 522 (76.3%) |
| 2 Unit Apartments | 2,073 (27.0%) | 5,601 (73.0%) |
| 3 or 4 Unit Apartments | 259 (10.3%) | 2,266 (89.7%) |
| 5 to 9 Unit Apartments | 10 (0.7%) | 1,316 (99.3%) |
| 10 or more Apartments | 82 (2.0%) | 4,038 (98.0%) |
| Mobile Home / Other | 84 (75.0%) | 28 (25.0%) |
| Total | 12,729 (45.3%) | 15,379 (54.7%) |
Housing Structures by Number of Rooms in Schenectady
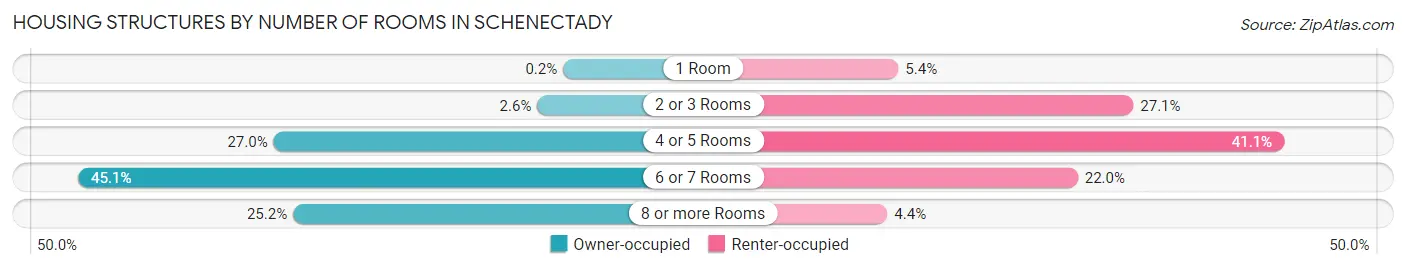
| Number of Rooms | Owner-occupied | Renter-occupied |
| 1 Room | 26 (0.2%) | 832 (5.4%) |
| 2 or 3 Rooms | 330 (2.6%) | 4,174 (27.1%) |
| 4 or 5 Rooms | 3,434 (27.0%) | 6,314 (41.1%) |
| 6 or 7 Rooms | 5,734 (45.1%) | 3,384 (22.0%) |
| 8 or more Rooms | 3,205 (25.2%) | 675 (4.4%) |
| Total | 12,729 (100.0%) | 15,379 (100.0%) |
Housing Structure by Heating Type in Schenectady
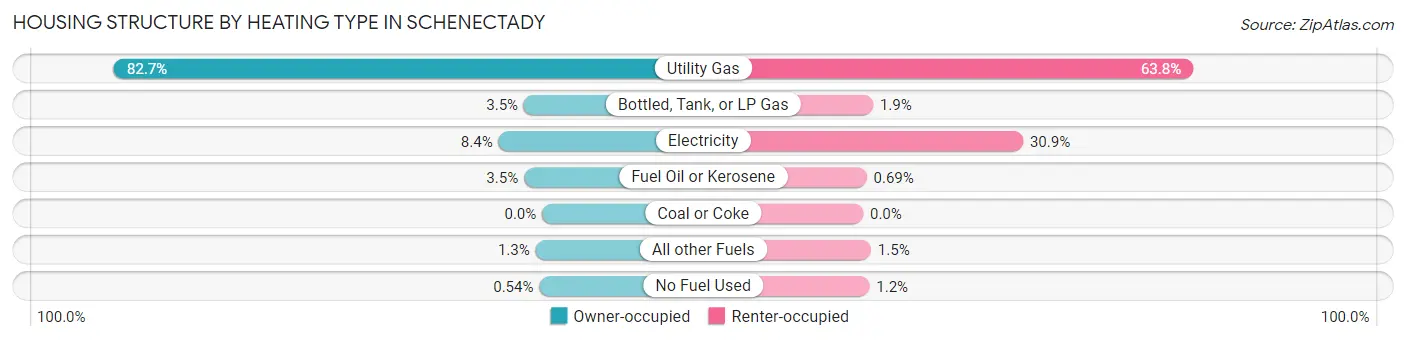
| Heating Type | Owner-occupied | Renter-occupied |
| Utility Gas | 10,532 (82.7%) | 9,804 (63.7%) |
| Bottled, Tank, or LP Gas | 447 (3.5%) | 295 (1.9%) |
| Electricity | 1,073 (8.4%) | 4,753 (30.9%) |
| Fuel Oil or Kerosene | 446 (3.5%) | 106 (0.7%) |
| Coal or Coke | 0 (0.0%) | 0 (0.0%) |
| All other Fuels | 162 (1.3%) | 233 (1.5%) |
| No Fuel Used | 69 (0.5%) | 188 (1.2%) |
| Total | 12,729 (100.0%) | 15,379 (100.0%) |
Household Vehicle Usage in Schenectady
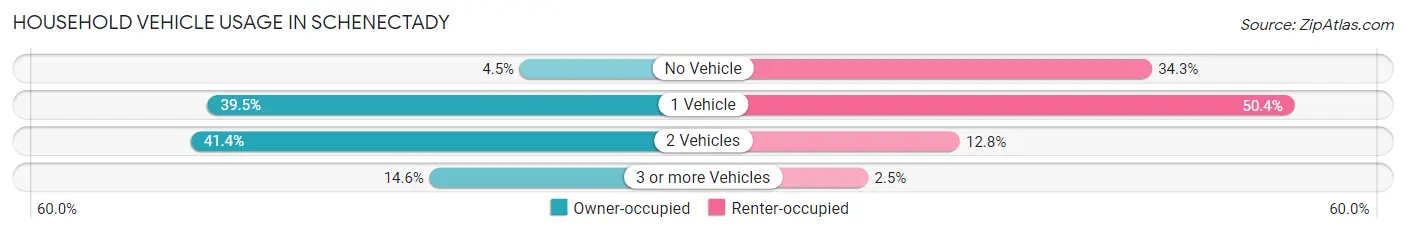
| Vehicles per Household | Owner-occupied | Renter-occupied |
| No Vehicle | 574 (4.5%) | 5,277 (34.3%) |
| 1 Vehicle | 5,027 (39.5%) | 7,745 (50.4%) |
| 2 Vehicles | 5,267 (41.4%) | 1,966 (12.8%) |
| 3 or more Vehicles | 1,861 (14.6%) | 391 (2.5%) |
| Total | 12,729 (100.0%) | 15,379 (100.0%) |
Real Estate & Mortgages in Schenectady
Real Estate and Mortgage Overview in Schenectady
| Characteristic | Without Mortgage | With Mortgage |
| Housing Units | 4,775 | 7,954 |
| Median Property Value | $132,100 | $147,500 |
| Median Household Income | $63,860 | $1,444 |
| Monthly Housing Costs | $625 | $215 |
| Real Estate Taxes | $3,898 | $317 |
Property Value by Mortgage Status in Schenectady
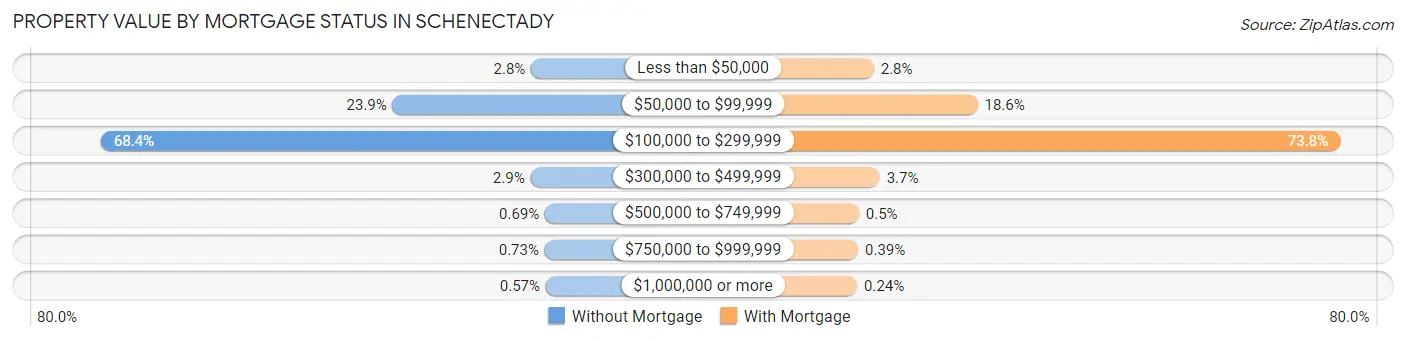
| Property Value | Without Mortgage | With Mortgage |
| Less than $50,000 | 134 (2.8%) | 221 (2.8%) |
| $50,000 to $99,999 | 1,142 (23.9%) | 1,479 (18.6%) |
| $100,000 to $299,999 | 3,265 (68.4%) | 5,871 (73.8%) |
| $300,000 to $499,999 | 139 (2.9%) | 293 (3.7%) |
| $500,000 to $749,999 | 33 (0.7%) | 40 (0.5%) |
| $750,000 to $999,999 | 35 (0.7%) | 31 (0.4%) |
| $1,000,000 or more | 27 (0.6%) | 19 (0.2%) |
| Total | 4,775 (100.0%) | 7,954 (100.0%) |
Household Income by Mortgage Status in Schenectady
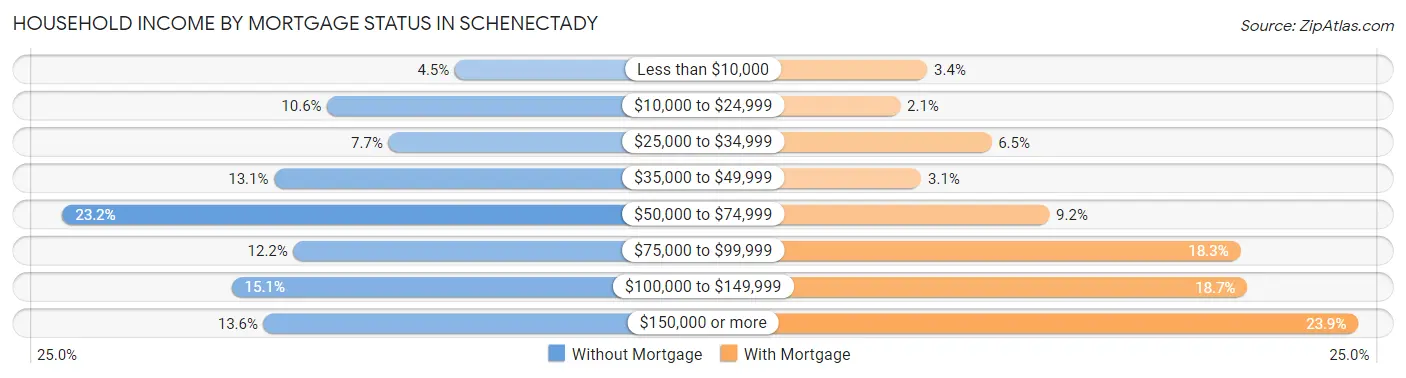
| Household Income | Without Mortgage | With Mortgage |
| Less than $10,000 | 215 (4.5%) | 271 (3.4%) |
| $10,000 to $24,999 | 505 (10.6%) | 169 (2.1%) |
| $25,000 to $34,999 | 366 (7.7%) | 514 (6.5%) |
| $35,000 to $49,999 | 626 (13.1%) | 248 (3.1%) |
| $50,000 to $74,999 | 1,108 (23.2%) | 733 (9.2%) |
| $75,000 to $99,999 | 582 (12.2%) | 1,458 (18.3%) |
| $100,000 to $149,999 | 723 (15.1%) | 1,484 (18.7%) |
| $150,000 or more | 650 (13.6%) | 1,904 (23.9%) |
| Total | 4,775 (100.0%) | 7,954 (100.0%) |
Property Value to Household Income Ratio in Schenectady
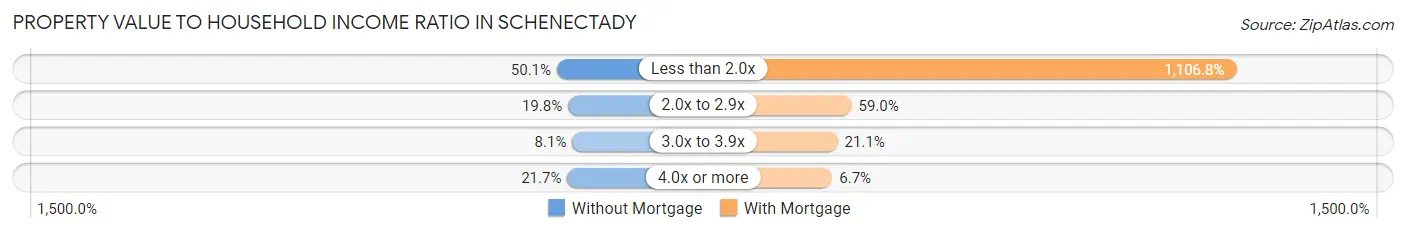
| Value-to-Income Ratio | Without Mortgage | With Mortgage |
| Less than 2.0x | 2,392 (50.1%) | 88,031 (1,106.8%) |
| 2.0x to 2.9x | 945 (19.8%) | 4,690 (59.0%) |
| 3.0x to 3.9x | 387 (8.1%) | 1,677 (21.1%) |
| 4.0x or more | 1,037 (21.7%) | 530 (6.7%) |
| Total | 4,775 (100.0%) | 7,954 (100.0%) |
Real Estate Taxes by Mortgage Status in Schenectady
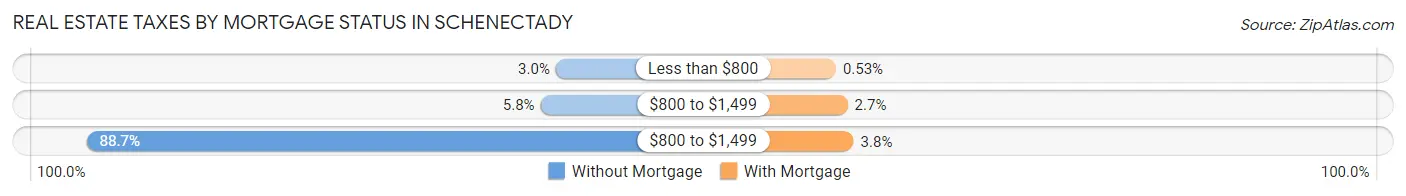
| Property Taxes | Without Mortgage | With Mortgage |
| Less than $800 | 143 (3.0%) | 42 (0.5%) |
| $800 to $1,499 | 276 (5.8%) | 212 (2.7%) |
| $800 to $1,499 | 4,234 (88.7%) | 299 (3.8%) |
| Total | 4,775 (100.0%) | 7,954 (100.0%) |
Health & Disability in Schenectady
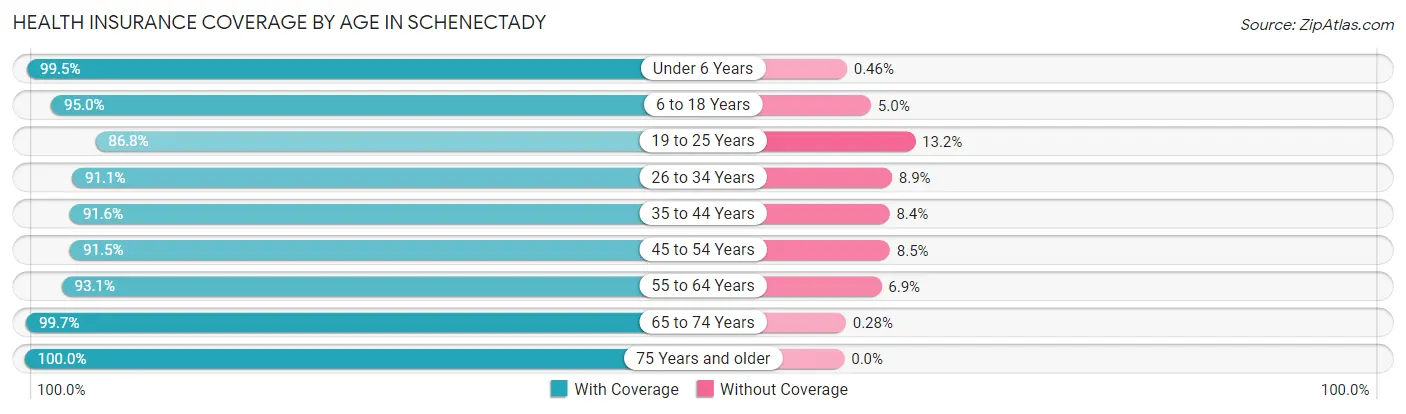
Health Insurance Coverage by Age in Schenectady
| Age Bracket | With Coverage | Without Coverage |
| Under 6 Years | 4,987 (99.5%) | 23 (0.5%) |
| 6 to 18 Years | 9,881 (95.0%) | 516 (5.0%) |
| 19 to 25 Years | 7,431 (86.8%) | 1,130 (13.2%) |
| 26 to 34 Years | 8,464 (91.1%) | 824 (8.9%) |
| 35 to 44 Years | 7,345 (91.6%) | 676 (8.4%) |
| 45 to 54 Years | 7,313 (91.5%) | 679 (8.5%) |
| 55 to 64 Years | 8,318 (93.1%) | 617 (6.9%) |
| 65 to 74 Years | 5,643 (99.7%) | 16 (0.3%) |
| 75 Years and older | 3,860 (100.0%) | 0 (0.0%) |
| Total | 63,242 (93.4%) | 4,481 (6.6%) |
Health Insurance Coverage by Citizenship Status in Schenectady
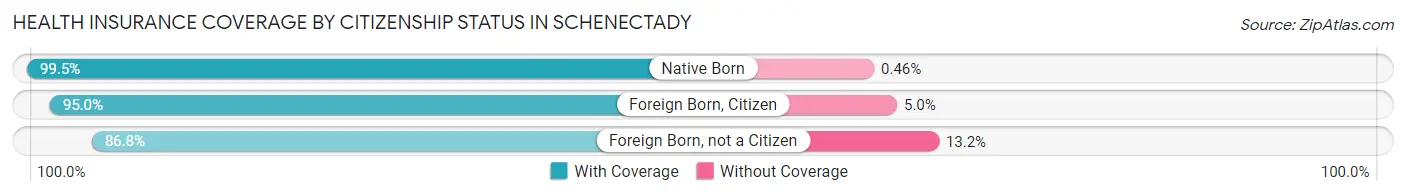
| Citizenship Status | With Coverage | Without Coverage |
| Native Born | 4,987 (99.5%) | 23 (0.5%) |
| Foreign Born, Citizen | 9,881 (95.0%) | 516 (5.0%) |
| Foreign Born, not a Citizen | 7,431 (86.8%) | 1,130 (13.2%) |
Health Insurance Coverage by Household Income in Schenectady
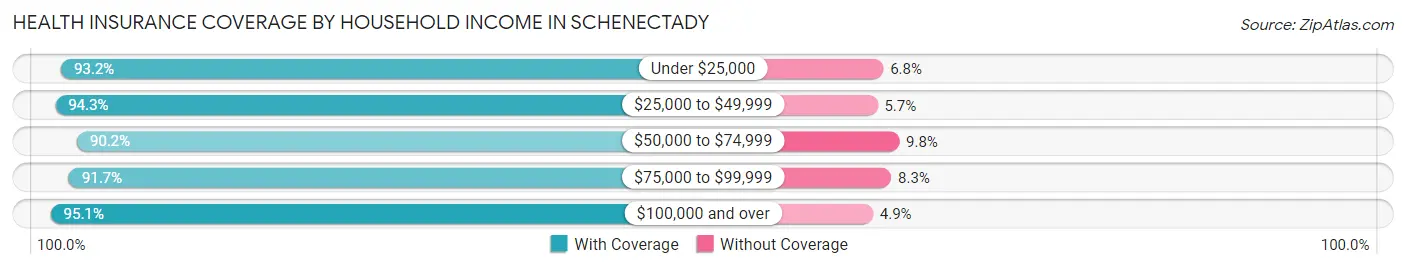
| Household Income | With Coverage | Without Coverage |
| Under $25,000 | 11,623 (93.2%) | 851 (6.8%) |
| $25,000 to $49,999 | 11,990 (94.3%) | 730 (5.7%) |
| $50,000 to $74,999 | 11,002 (90.2%) | 1,195 (9.8%) |
| $75,000 to $99,999 | 8,027 (91.7%) | 727 (8.3%) |
| $100,000 and over | 17,633 (95.1%) | 904 (4.9%) |
Public vs Private Health Insurance Coverage by Age in Schenectady
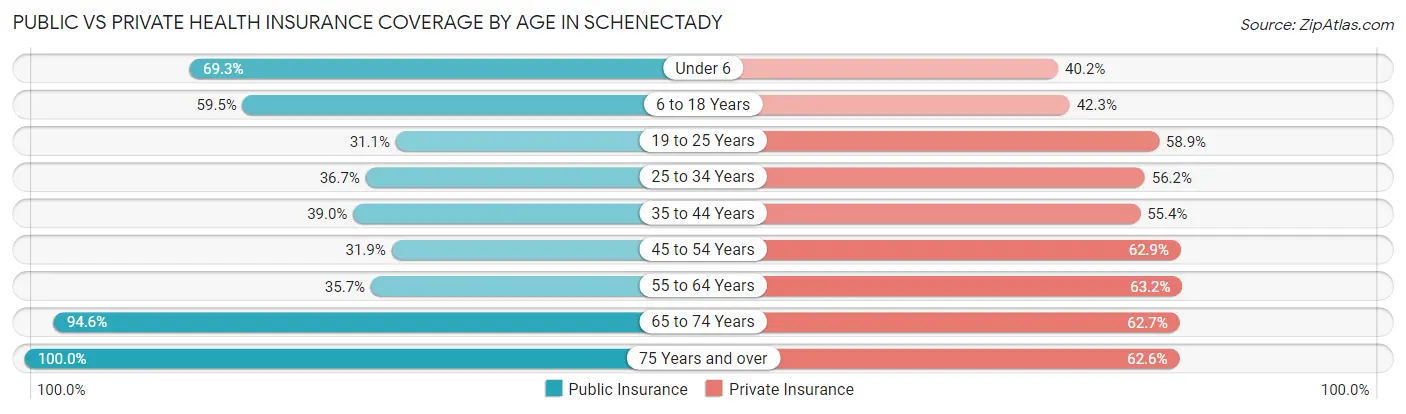
| Age Bracket | Public Insurance | Private Insurance |
| Under 6 | 3,471 (69.3%) | 2,012 (40.2%) |
| 6 to 18 Years | 6,189 (59.5%) | 4,399 (42.3%) |
| 19 to 25 Years | 2,663 (31.1%) | 5,039 (58.9%) |
| 25 to 34 Years | 3,408 (36.7%) | 5,224 (56.2%) |
| 35 to 44 Years | 3,129 (39.0%) | 4,443 (55.4%) |
| 45 to 54 Years | 2,549 (31.9%) | 5,028 (62.9%) |
| 55 to 64 Years | 3,192 (35.7%) | 5,646 (63.2%) |
| 65 to 74 Years | 5,351 (94.6%) | 3,548 (62.7%) |
| 75 Years and over | 3,859 (100.0%) | 2,418 (62.6%) |
| Total | 33,811 (49.9%) | 37,757 (55.7%) |
Disability Status by Sex by Age in Schenectady
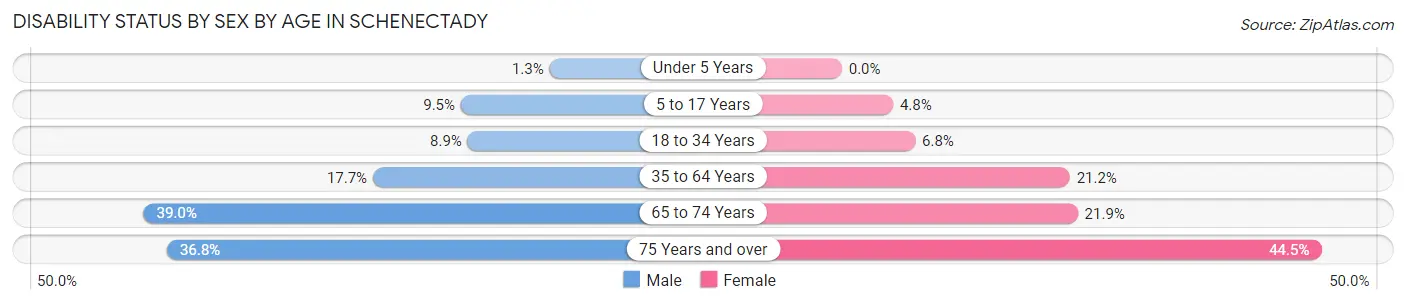
| Age Bracket | Male | Female |
| Under 5 Years | 29 (1.3%) | 0 (0.0%) |
| 5 to 17 Years | 461 (9.5%) | 211 (4.8%) |
| 18 to 34 Years | 912 (8.9%) | 636 (6.8%) |
| 35 to 64 Years | 2,188 (17.7%) | 2,658 (21.1%) |
| 65 to 74 Years | 1,048 (39.0%) | 650 (21.9%) |
| 75 Years and over | 585 (36.8%) | 1,010 (44.5%) |
Disability Class by Sex by Age in Schenectady
Disability Class: Hearing Difficulty
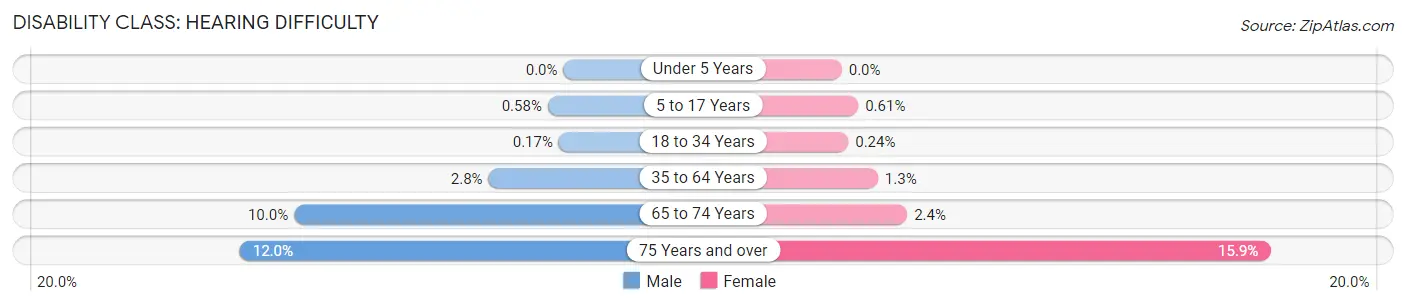
| Age Bracket | Male | Female |
| Under 5 Years | 0 (0.0%) | 0 (0.0%) |
| 5 to 17 Years | 28 (0.6%) | 27 (0.6%) |
| 18 to 34 Years | 17 (0.2%) | 22 (0.2%) |
| 35 to 64 Years | 344 (2.8%) | 168 (1.3%) |
| 65 to 74 Years | 269 (10.0%) | 72 (2.4%) |
| 75 Years and over | 191 (12.0%) | 361 (15.9%) |
Disability Class: Vision Difficulty
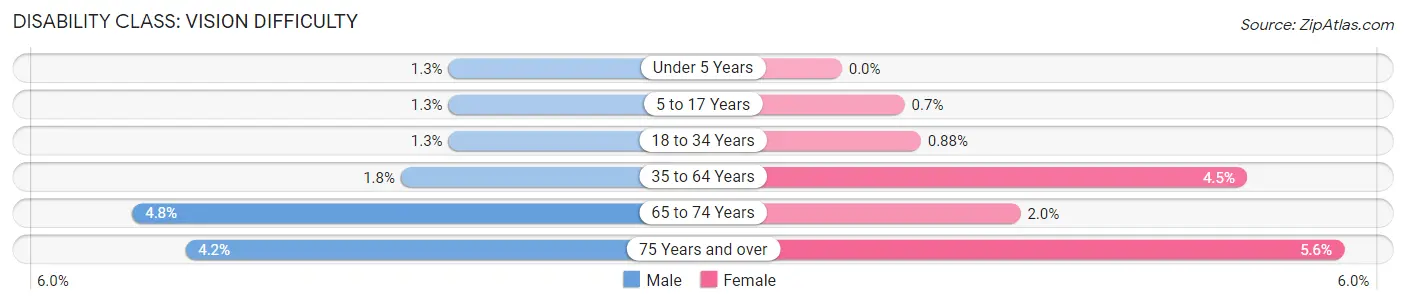
| Age Bracket | Male | Female |
| Under 5 Years | 29 (1.3%) | 0 (0.0%) |
| 5 to 17 Years | 62 (1.3%) | 31 (0.7%) |
| 18 to 34 Years | 131 (1.3%) | 82 (0.9%) |
| 35 to 64 Years | 224 (1.8%) | 567 (4.5%) |
| 65 to 74 Years | 129 (4.8%) | 59 (2.0%) |
| 75 Years and over | 67 (4.2%) | 127 (5.6%) |
Disability Class: Cognitive Difficulty
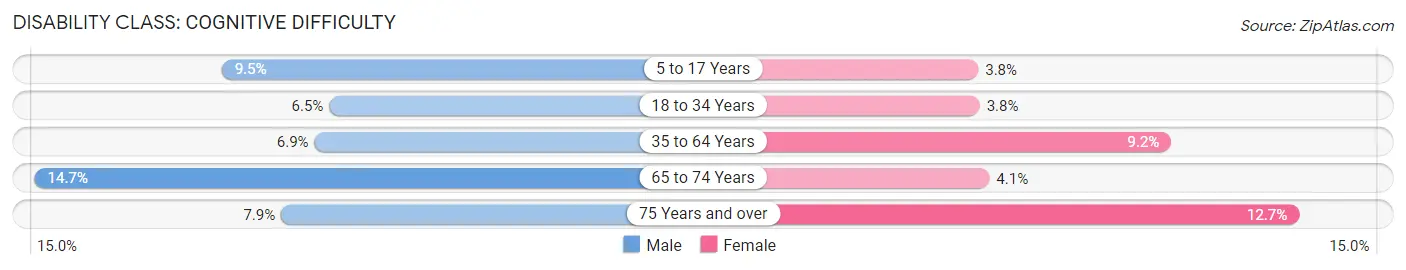
| Age Bracket | Male | Female |
| 5 to 17 Years | 461 (9.5%) | 169 (3.8%) |
| 18 to 34 Years | 670 (6.5%) | 359 (3.8%) |
| 35 to 64 Years | 858 (6.9%) | 1,153 (9.2%) |
| 65 to 74 Years | 396 (14.7%) | 122 (4.1%) |
| 75 Years and over | 125 (7.9%) | 289 (12.7%) |
Disability Class: Ambulatory Difficulty
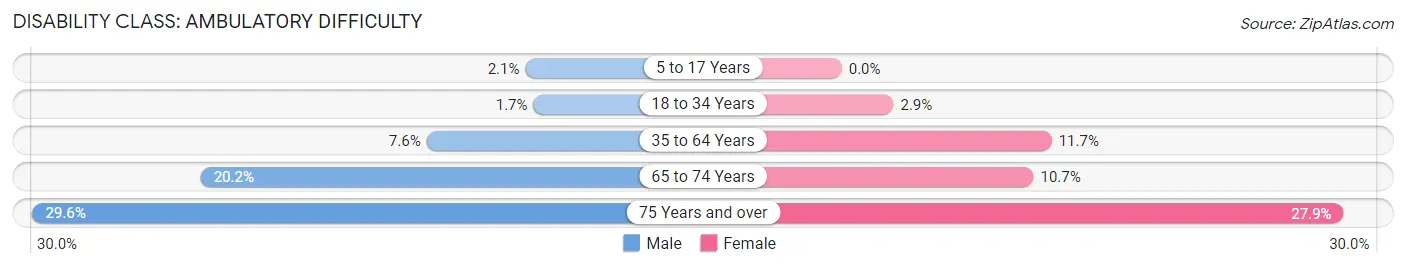
| Age Bracket | Male | Female |
| 5 to 17 Years | 103 (2.1%) | 0 (0.0%) |
| 18 to 34 Years | 171 (1.7%) | 269 (2.9%) |
| 35 to 64 Years | 943 (7.6%) | 1,469 (11.7%) |
| 65 to 74 Years | 543 (20.2%) | 317 (10.7%) |
| 75 Years and over | 470 (29.6%) | 634 (27.9%) |
Disability Class: Self-Care Difficulty
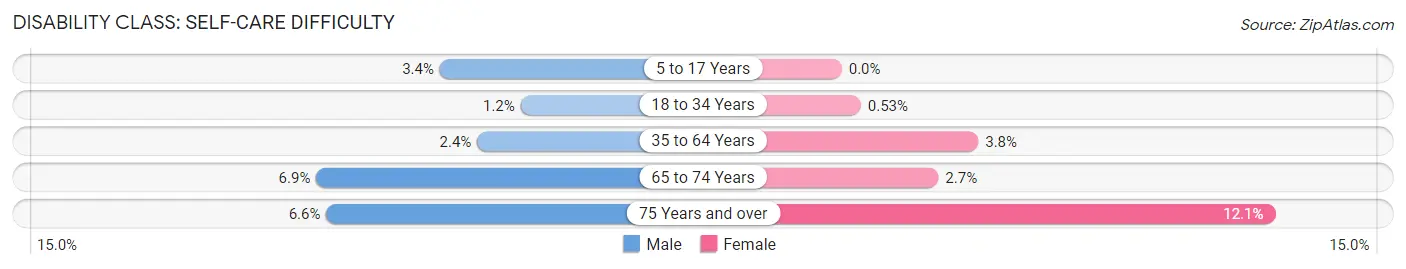
| Age Bracket | Male | Female |
| 5 to 17 Years | 167 (3.4%) | 0 (0.0%) |
| 18 to 34 Years | 122 (1.2%) | 50 (0.5%) |
| 35 to 64 Years | 297 (2.4%) | 478 (3.8%) |
| 65 to 74 Years | 185 (6.9%) | 80 (2.7%) |
| 75 Years and over | 105 (6.6%) | 274 (12.1%) |
Technology Access in Schenectady
Computing Device Access in Schenectady
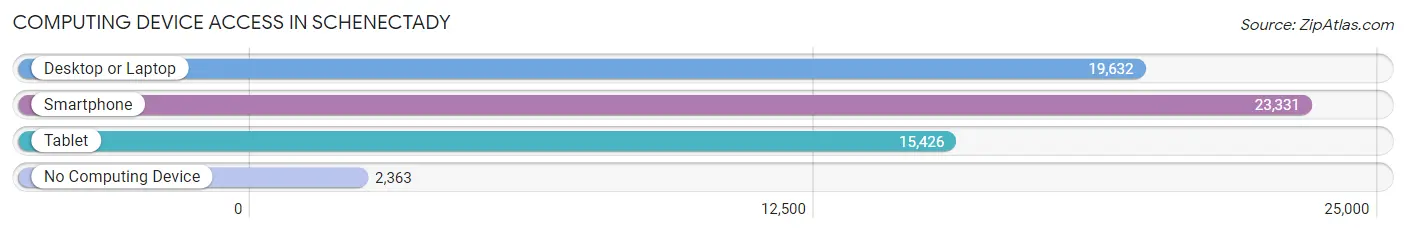
| Device Type | # Households | % Households |
| Desktop or Laptop | 19,632 | 69.8% |
| Smartphone | 23,331 | 83.0% |
| Tablet | 15,426 | 54.9% |
| No Computing Device | 2,363 | 8.4% |
| Total | 28,108 | 100.0% |
Internet Access in Schenectady
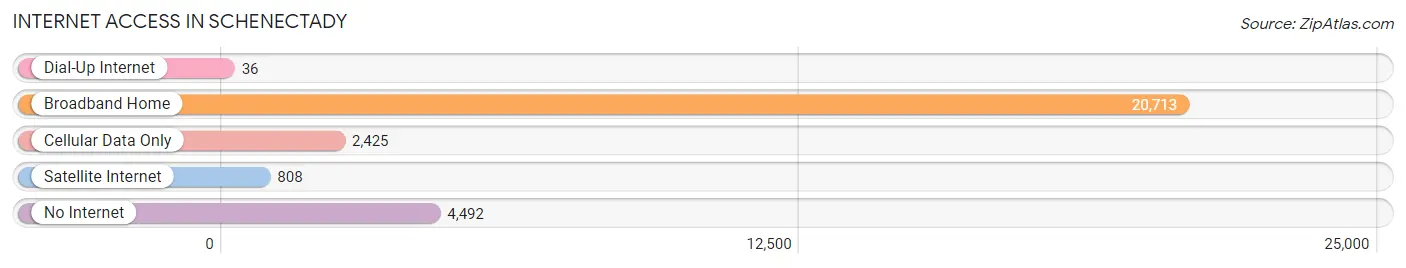
| Internet Type | # Households | % Households |
| Dial-Up Internet | 36 | 0.1% |
| Broadband Home | 20,713 | 73.7% |
| Cellular Data Only | 2,425 | 8.6% |
| Satellite Internet | 808 | 2.9% |
| No Internet | 4,492 | 16.0% |
| Total | 28,108 | 100.0% |
Schenectady Summary
Schenectady, New York is a city located in the eastern part of the state, in Schenectady County. It is the county seat and the largest city in the county. The city is situated on the Mohawk River, about 10 miles northwest of Albany, the state capital. As of the 2010 census, the city had a population of 66,135, making it the ninth-largest city in New York.
History
The area that is now Schenectady was originally inhabited by the Mohawk people, who were part of the Iroquois Confederacy. The first European settlers arrived in the area in the 1660s, and the city was officially founded in 1661 by Dutch settlers. The city was named after a Mohawk word meaning “beyond the pines.”
In the late 1700s, the city became an important industrial center, with the opening of the first steam-powered sawmill in the United States. The city was also home to the first commercial railroad in the country, the Mohawk and Hudson Railroad, which opened in 1831.
In the late 1800s, the city experienced a period of rapid growth, with the opening of several factories and the construction of the Erie Canal. The city was also home to the first electric trolley system in the United States.
Geography
Schenectady is located in the eastern part of New York State, in Schenectady County. It is situated on the Mohawk River, about 10 miles northwest of Albany, the state capital. The city covers an area of 16.3 square miles, with a population density of 4,039 people per square mile.
The city is located in a humid continental climate zone, with cold winters and hot, humid summers. The average annual temperature is 46.2°F, with an average high of 61.2°F in July and an average low of 31.2°F in January. The average annual precipitation is 43.2 inches.
Economy
Schenectady’s economy is largely based on manufacturing and technology. The city is home to several large companies, including General Electric, which has a large presence in the city. Other major employers include Proctor & Gamble, Price Chopper, and the State University of New York at Schenectady.
The city also has a thriving tourism industry, with several attractions, including the Schenectady County Historical Society, the Schenectady Museum, and the Proctors Theater.
Demographics
As of the 2010 census, the city had a population of 66,135, with a population density of 4,039 people per square mile. The racial makeup of the city was 73.2% White, 15.3% African American, 0.4% Native American, 4.2% Asian, 0.1% Pacific Islander, 4.2% from other races, and 2.6% from two or more races. Hispanic or Latino of any race were 10.2% of the population.
The median household income in the city was $41,945, and the median family income was $50,945. The per capita income was $22,845. About 17.2% of the population was below the poverty line.
Common Questions
What is Per Capita Income in Schenectady?
Per Capita income in Schenectady is $30,778.
What is the Median Family Income in Schenectady?
Median Family Income in Schenectady is $65,430.
What is the Median Household income in Schenectady?
Median Household Income in Schenectady is $54,650.
What is Income or Wage Gap in Schenectady?
Income or Wage Gap in Schenectady is 16.2%.
Women in Schenectady earn 83.8 cents for every dollar earned by a man.
What is Family Income Deficit in Schenectady?
Family Income Deficit in Schenectady is $10,833.
Families that are below poverty line in Schenectady earn $10,833 less on average than the poverty threshold level.
What is Inequality or Gini Index in Schenectady?
Inequality or Gini Index in Schenectady is 0.47.
What is the Total Population of Schenectady?
Total Population of Schenectady is 68,476.
What is the Total Male Population of Schenectady?
Total Male Population of Schenectady is 34,418.
What is the Total Female Population of Schenectady?
Total Female Population of Schenectady is 34,058.
What is the Ratio of Males per 100 Females in Schenectady?
There are 101.06 Males per 100 Females in Schenectady.
What is the Ratio of Females per 100 Males in Schenectady?
There are 98.95 Females per 100 Males in Schenectady.
What is the Median Population Age in Schenectady?
Median Population Age in Schenectady is 36.0 Years.
What is the Average Family Size in Schenectady
Average Family Size in Schenectady is 3.2 People.
What is the Average Household Size in Schenectady
Average Household Size in Schenectady is 2.3 People.
How Large is the Labor Force in Schenectady?
There are 34,387 People in the Labor Forcein in Schenectady.
What is the Percentage of People in the Labor Force in Schenectady?
61.2% of People are in the Labor Force in Schenectady.
What is the Unemployment Rate in Schenectady?
Unemployment Rate in Schenectady is 9.4%.