Buford, GA Map & Demographics
Buford Map
Buford Overview
$28,751
PER CAPITA INCOME
$75,917
AVG FAMILY INCOME
$68,165
AVG HOUSEHOLD INCOME
35.6%
WAGE / INCOME GAP [ % ]
64.4¢/ $1
WAGE / INCOME GAP [ $ ]
0.43
INEQUALITY / GINI INDEX
17,222
TOTAL POPULATION
8,322
MALE POPULATION
8,900
FEMALE POPULATION
93.51
MALES / 100 FEMALES
106.95
FEMALES / 100 MALES
35.6
MEDIAN AGE
3.9
AVG FAMILY SIZE
3.4
AVG HOUSEHOLD SIZE
7,391
LABOR FORCE [ PEOPLE ]
60.2%
PERCENT IN LABOR FORCE
3.0%
UNEMPLOYMENT RATE
Income in Buford
Income Overview in Buford
Per Capita Income in Buford is $28,751, while median incomes of families and households are $75,917 and $68,165 respectively.
| Characteristic | Number | Measure |
| Per Capita Income | 17,222 | $28,751 |
| Median Family Income | 3,779 | $75,917 |
| Mean Family Income | 3,779 | $105,604 |
| Median Household Income | 5,019 | $68,165 |
| Mean Household Income | 5,019 | $94,305 |
| Income Deficit | 3,779 | $0 |
| Wage / Income Gap (%) | 17,222 | 35.56% |
| Wage / Income Gap ($) | 17,222 | 64.44¢ per $1 |
| Gini / Inequality Index | 17,222 | 0.43 |
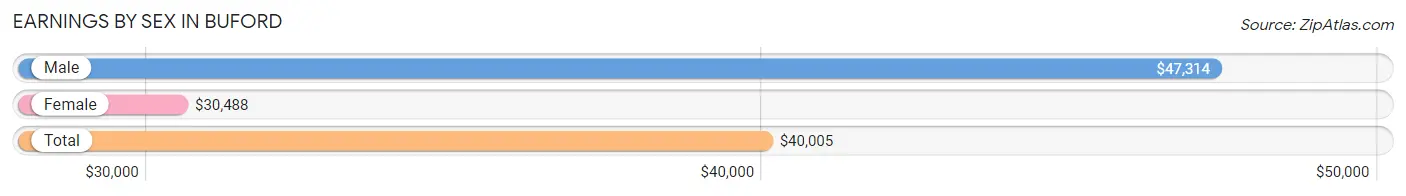
Earnings by Sex in Buford
Average Earnings in Buford are $40,005, $47,314 for men and $30,488 for women, a difference of 35.6%.
| Sex | Number | Average Earnings |
| Male | 4,211 (53.9%) | $47,314 |
| Female | 3,596 (46.1%) | $30,488 |
| Total | 7,807 (100.0%) | $40,005 |
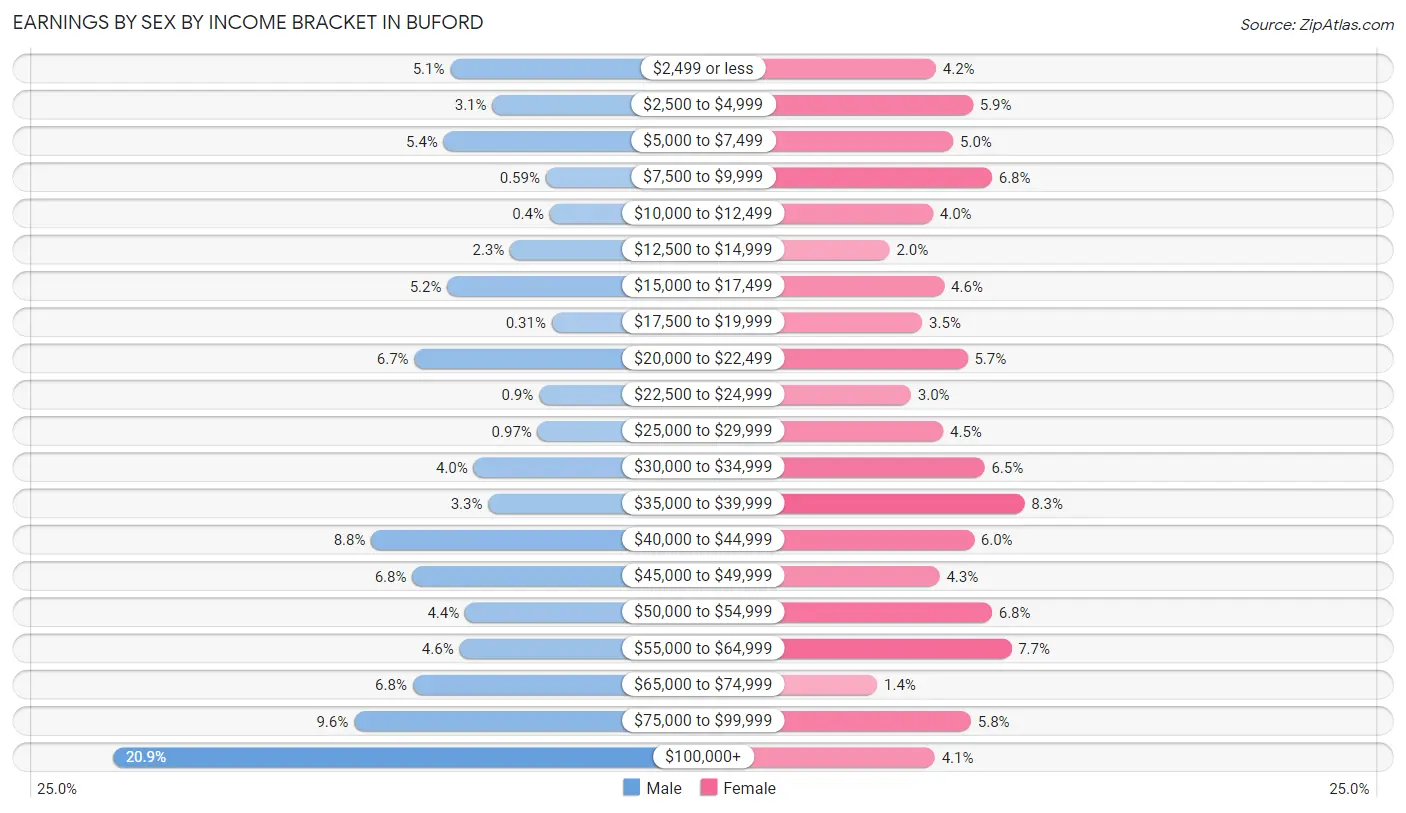
Earnings by Sex by Income Bracket in Buford
The most common earnings brackets in Buford are $100,000+ for men (879 | 20.9%) and $35,000 to $39,999 for women (299 | 8.3%).
| Income | Male | Female |
| $2,499 or less | 213 (5.1%) | 150 (4.2%) |
| $2,500 to $4,999 | 130 (3.1%) | 212 (5.9%) |
| $5,000 to $7,499 | 226 (5.4%) | 179 (5.0%) |
| $7,500 to $9,999 | 25 (0.6%) | 244 (6.8%) |
| $10,000 to $12,499 | 17 (0.4%) | 145 (4.0%) |
| $12,500 to $14,999 | 95 (2.3%) | 72 (2.0%) |
| $15,000 to $17,499 | 219 (5.2%) | 164 (4.6%) |
| $17,500 to $19,999 | 13 (0.3%) | 127 (3.5%) |
| $20,000 to $22,499 | 284 (6.7%) | 203 (5.7%) |
| $22,500 to $24,999 | 38 (0.9%) | 108 (3.0%) |
| $25,000 to $29,999 | 41 (1.0%) | 162 (4.5%) |
| $30,000 to $34,999 | 167 (4.0%) | 232 (6.5%) |
| $35,000 to $39,999 | 138 (3.3%) | 299 (8.3%) |
| $40,000 to $44,999 | 369 (8.8%) | 214 (5.9%) |
| $45,000 to $49,999 | 288 (6.8%) | 156 (4.3%) |
| $50,000 to $54,999 | 184 (4.4%) | 244 (6.8%) |
| $55,000 to $64,999 | 195 (4.6%) | 277 (7.7%) |
| $65,000 to $74,999 | 287 (6.8%) | 51 (1.4%) |
| $75,000 to $99,999 | 403 (9.6%) | 209 (5.8%) |
| $100,000+ | 879 (20.9%) | 148 (4.1%) |
| Total | 4,211 (100.0%) | 3,596 (100.0%) |
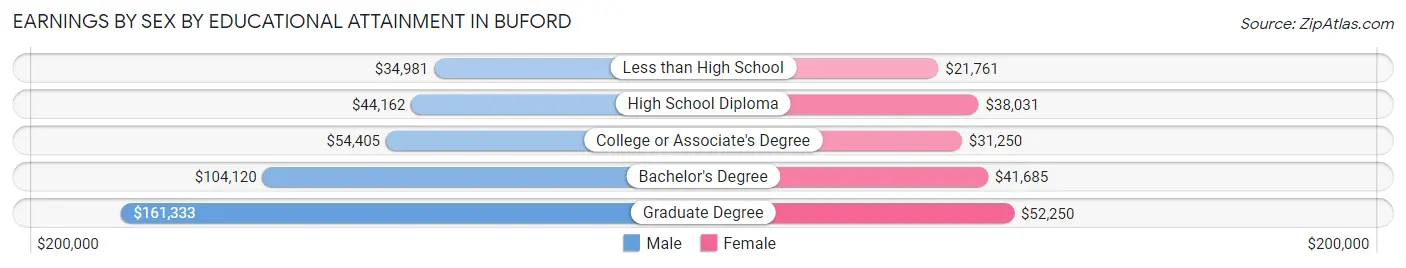
Earnings by Sex by Educational Attainment in Buford
Average earnings in Buford are $54,577 for men and $34,651 for women, a difference of 36.5%. Men with an educational attainment of graduate degree enjoy the highest average annual earnings of $161,333, while those with less than high school education earn the least with $34,981. Women with an educational attainment of graduate degree earn the most with the average annual earnings of $52,250, while those with less than high school education have the smallest earnings of $21,761.
| Educational Attainment | Male Income | Female Income |
| Less than High School | $34,981 | $21,761 |
| High School Diploma | $44,162 | $38,031 |
| College or Associate's Degree | $54,405 | $31,250 |
| Bachelor's Degree | $104,120 | $41,685 |
| Graduate Degree | $161,333 | $52,250 |
| Total | $54,577 | $34,651 |
Family Income in Buford
Family Income Brackets in Buford
According to the Buford family income data, there are 862 families falling into the $50,000 to $74,999 income range, which is the most common income bracket and makes up 22.8% of all families. Conversely, the $25,000 to $34,999 income bracket is the least frequent group with only 15 families (0.4%) belonging to this category.
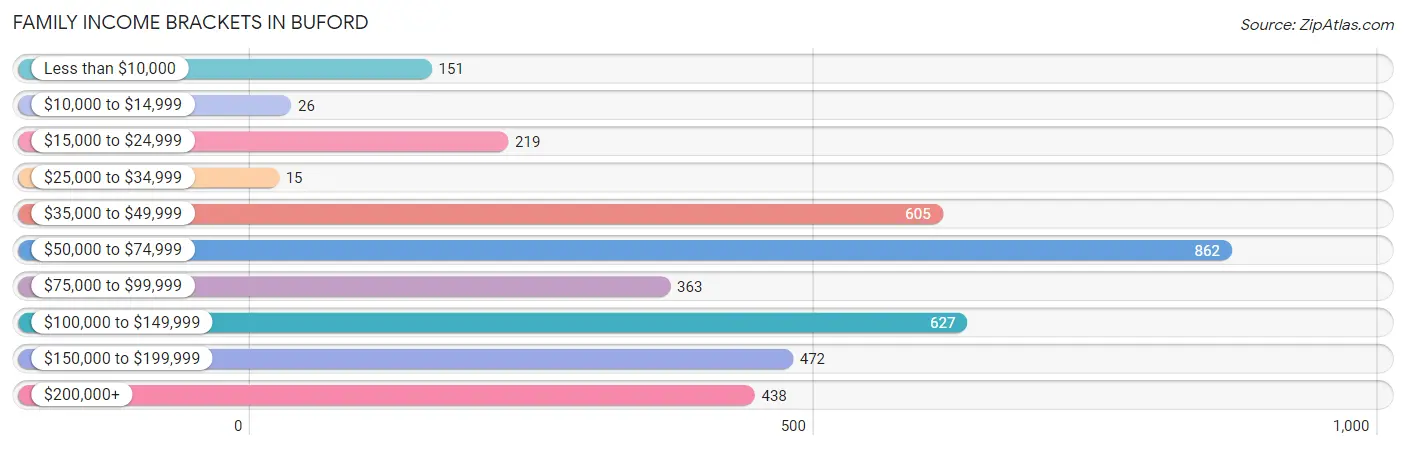
| Income Bracket | # Families | % Families |
| Less than $10,000 | 151 | 4.0% |
| $10,000 to $14,999 | 26 | 0.7% |
| $15,000 to $24,999 | 219 | 5.8% |
| $25,000 to $34,999 | 15 | 0.4% |
| $35,000 to $49,999 | 605 | 16.0% |
| $50,000 to $74,999 | 862 | 22.8% |
| $75,000 to $99,999 | 363 | 9.6% |
| $100,000 to $149,999 | 627 | 16.6% |
| $150,000 to $199,999 | 472 | 12.5% |
| $200,000+ | 438 | 11.6% |
Family Income by Famaliy Size in Buford
5-person families (616 | 16.3%) account for the highest median family income in Buford with $117,571 per family, while 3-person families (595 | 15.7%) have the highest median income of $32,670 per family member.
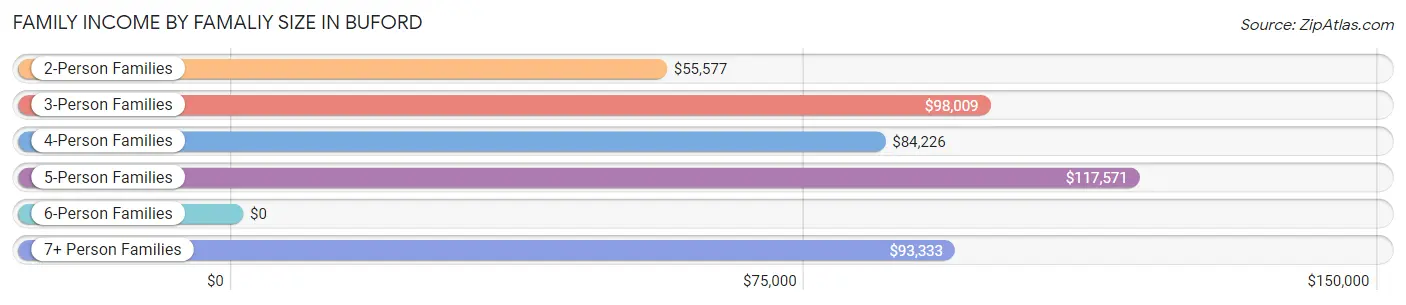
| Income Bracket | # Families | Median Income |
| 2-Person Families | 1,328 (35.1%) | $55,577 |
| 3-Person Families | 595 (15.7%) | $98,009 |
| 4-Person Families | 891 (23.6%) | $84,226 |
| 5-Person Families | 616 (16.3%) | $117,571 |
| 6-Person Families | 279 (7.4%) | $0 |
| 7+ Person Families | 70 (1.8%) | $93,333 |
| Total | 3,779 (100.0%) | $75,917 |
Family Income by Number of Earners in Buford
The median family income in Buford is $75,917, with families comprising 3+ earners (510) having the highest median family income of $141,613, while families with no earners (442) have the lowest median family income of $46,029, accounting for 13.5% and 11.7% of families, respectively.
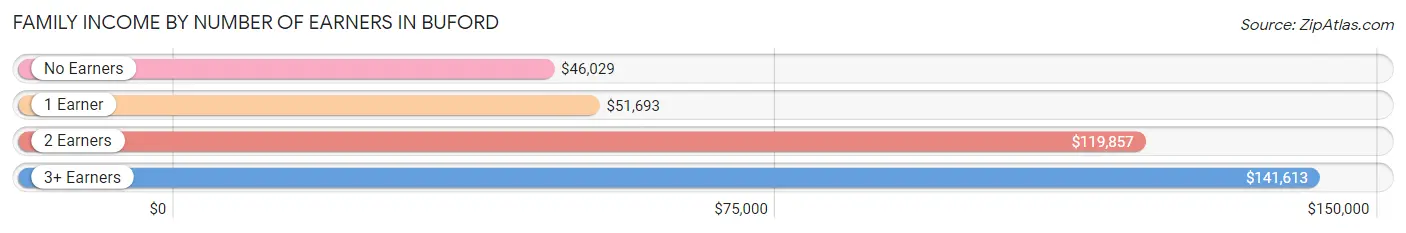
| Number of Earners | # Families | Median Income |
| No Earners | 442 (11.7%) | $46,029 |
| 1 Earner | 1,207 (31.9%) | $51,693 |
| 2 Earners | 1,620 (42.9%) | $119,857 |
| 3+ Earners | 510 (13.5%) | $141,613 |
| Total | 3,779 (100.0%) | $75,917 |
Household Income in Buford
Household Income Brackets in Buford
With 1,029 households falling in the category, the $50,000 to $74,999 income range is the most frequent in Buford, accounting for 20.5% of all households. In contrast, only 100 households (2.0%) fall into the $10,000 to $14,999 income bracket, making it the least populous group.
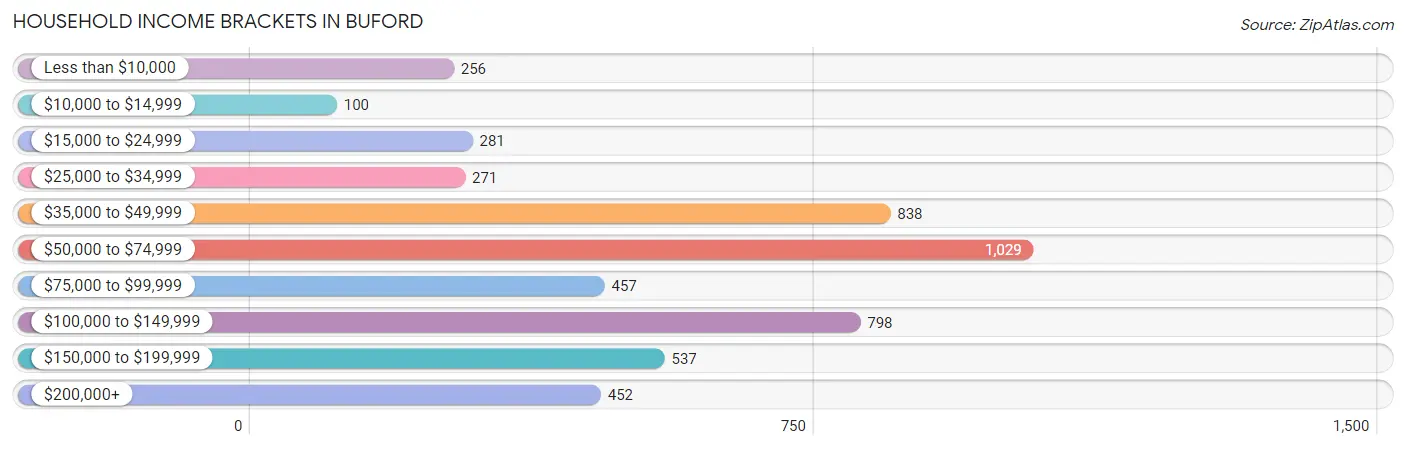
| Income Bracket | # Households | % Households |
| Less than $10,000 | 256 | 5.1% |
| $10,000 to $14,999 | 100 | 2.0% |
| $15,000 to $24,999 | 281 | 5.6% |
| $25,000 to $34,999 | 271 | 5.4% |
| $35,000 to $49,999 | 838 | 16.7% |
| $50,000 to $74,999 | 1,029 | 20.5% |
| $75,000 to $99,999 | 457 | 9.1% |
| $100,000 to $149,999 | 798 | 15.9% |
| $150,000 to $199,999 | 537 | 10.7% |
| $200,000+ | 452 | 9.0% |
Household Income by Householder Age in Buford
The median household income in Buford is $68,165, with the highest median household income of $106,389 found in the 45 to 64 years age bracket for the primary householder. A total of 1,864 households (37.1%) fall into this category. Meanwhile, the 65+ years age bracket for the primary householder has the lowest median household income of $48,068, with 1,307 households (26.0%) in this group.
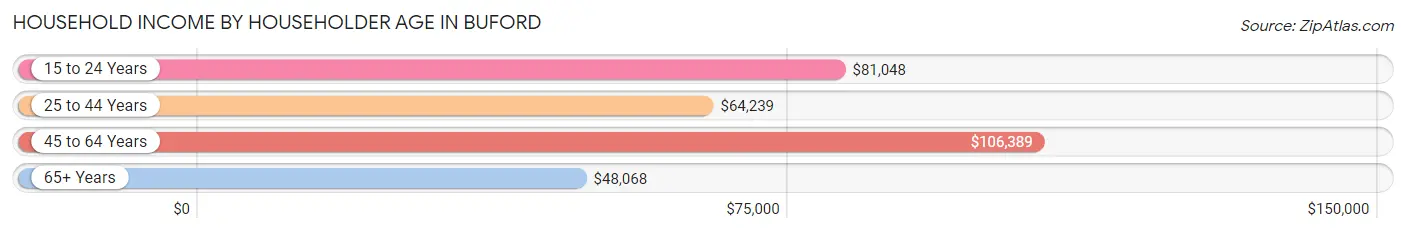
| Income Bracket | # Households | Median Income |
| 15 to 24 Years | 108 (2.1%) | $81,048 |
| 25 to 44 Years | 1,740 (34.7%) | $64,239 |
| 45 to 64 Years | 1,864 (37.1%) | $106,389 |
| 65+ Years | 1,307 (26.0%) | $48,068 |
| Total | 5,019 (100.0%) | $68,165 |
Poverty in Buford
Income Below Poverty by Sex and Age in Buford
With 10.5% poverty level for males and 8.1% for females among the residents of Buford, 15 year old males and 75 year old and over females are the most vulnerable to poverty, with 181 males (63.1%) and 131 females (18.4%) in their respective age groups living below the poverty level.
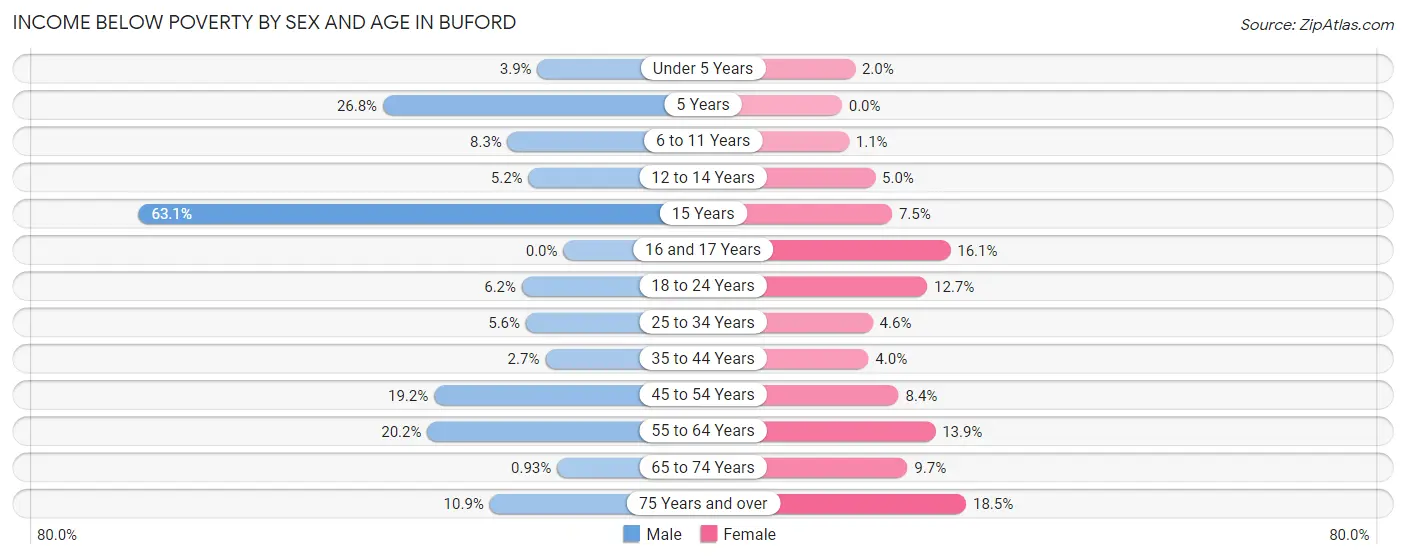
| Age Bracket | Male | Female |
| Under 5 Years | 26 (3.8%) | 10 (1.9%) |
| 5 Years | 30 (26.8%) | 0 (0.0%) |
| 6 to 11 Years | 109 (8.3%) | 10 (1.1%) |
| 12 to 14 Years | 23 (5.2%) | 16 (5.0%) |
| 15 Years | 181 (63.1%) | 19 (7.4%) |
| 16 and 17 Years | 0 (0.0%) | 34 (16.1%) |
| 18 to 24 Years | 36 (6.2%) | 119 (12.7%) |
| 25 to 34 Years | 24 (5.6%) | 38 (4.6%) |
| 35 to 44 Years | 38 (2.7%) | 58 (4.0%) |
| 45 to 54 Years | 269 (19.2%) | 80 (8.4%) |
| 55 to 64 Years | 99 (20.2%) | 133 (13.9%) |
| 65 to 74 Years | 4 (0.9%) | 63 (9.7%) |
| 75 Years and over | 36 (10.9%) | 131 (18.4%) |
| Total | 875 (10.5%) | 711 (8.1%) |
Income Above Poverty by Sex and Age in Buford
According to the poverty statistics in Buford, males aged 16 and 17 years and females aged 5 years are the age groups that are most secure financially, with 100.0% of males and 100.0% of females in these age groups living above the poverty line.
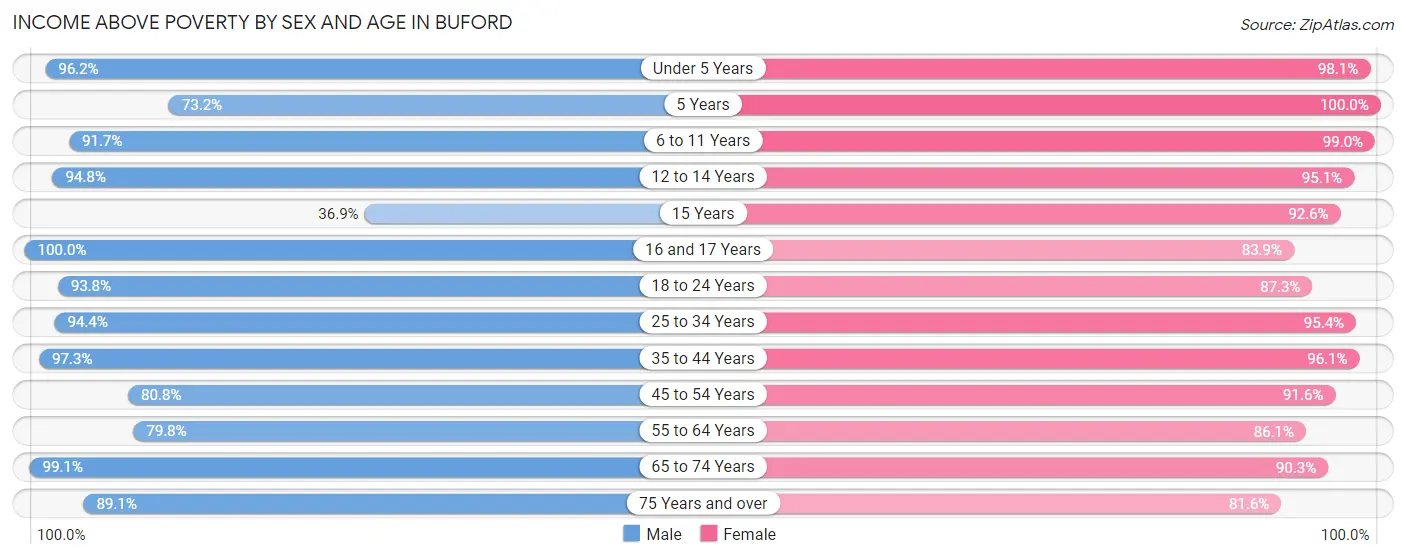
| Age Bracket | Male | Female |
| Under 5 Years | 650 (96.2%) | 503 (98.1%) |
| 5 Years | 82 (73.2%) | 54 (100.0%) |
| 6 to 11 Years | 1,209 (91.7%) | 945 (99.0%) |
| 12 to 14 Years | 420 (94.8%) | 307 (95.1%) |
| 15 Years | 106 (36.9%) | 236 (92.5%) |
| 16 and 17 Years | 380 (100.0%) | 177 (83.9%) |
| 18 to 24 Years | 548 (93.8%) | 820 (87.3%) |
| 25 to 34 Years | 407 (94.4%) | 791 (95.4%) |
| 35 to 44 Years | 1,375 (97.3%) | 1,410 (96.1%) |
| 45 to 54 Years | 1,132 (80.8%) | 869 (91.6%) |
| 55 to 64 Years | 391 (79.8%) | 826 (86.1%) |
| 65 to 74 Years | 426 (99.1%) | 584 (90.3%) |
| 75 Years and over | 293 (89.1%) | 579 (81.6%) |
| Total | 7,419 (89.4%) | 8,101 (91.9%) |
Income Below Poverty Among Married-Couple Families in Buford
The poverty statistics for married-couple families in Buford show that 4.5% or 126 of the total 2,815 families live below the poverty line. Families with no children have the highest poverty rate of 7.1%, comprising of 81 families. On the other hand, families with 5 or more children have the lowest poverty rate of 0.0%, which includes 0 families.
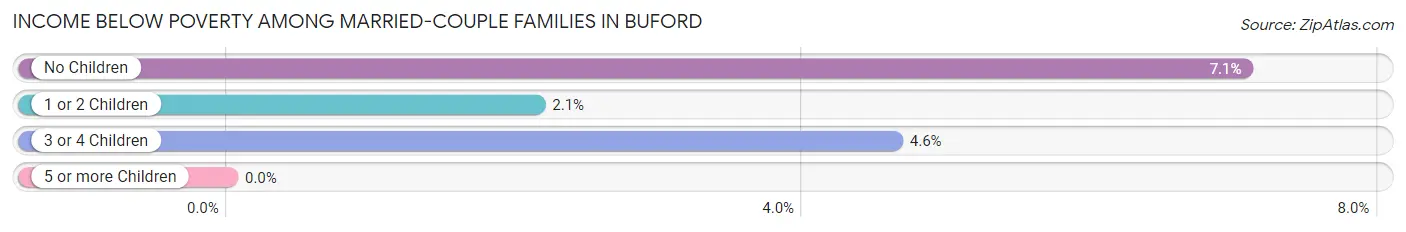
| Children | Above Poverty | Below Poverty |
| No Children | 1,064 (92.9%) | 81 (7.1%) |
| 1 or 2 Children | 1,189 (97.9%) | 26 (2.1%) |
| 3 or 4 Children | 391 (95.4%) | 19 (4.6%) |
| 5 or more Children | 45 (100.0%) | 0 (0.0%) |
| Total | 2,689 (95.5%) | 126 (4.5%) |
Income Below Poverty Among Single-Parent Households in Buford
According to the poverty data in Buford, 26.8% or 116 single-father households and 18.6% or 99 single-mother households are living below the poverty line. Among single-father households, those with 1 or 2 children have the highest poverty rate, with 95 households (33.7%) experiencing poverty. Likewise, among single-mother households, those with 3 or 4 children have the highest poverty rate, with 28 households (30.8%) falling below the poverty line.
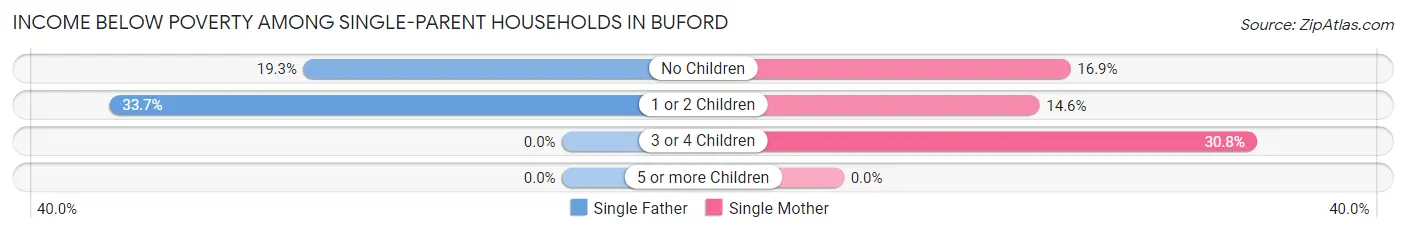
| Children | Single Father | Single Mother |
| No Children | 21 (19.3%) | 50 (16.9%) |
| 1 or 2 Children | 95 (33.7%) | 21 (14.6%) |
| 3 or 4 Children | 0 (0.0%) | 28 (30.8%) |
| 5 or more Children | 0 (0.0%) | 0 (0.0%) |
| Total | 116 (26.8%) | 99 (18.6%) |
Income Below Poverty Among Married-Couple vs Single-Parent Households in Buford
The poverty data for Buford shows that 126 of the married-couple family households (4.5%) and 215 of the single-parent households (22.3%) are living below the poverty level. Within the married-couple family households, those with no children have the highest poverty rate, with 81 households (7.1%) falling below the poverty line. Among the single-parent households, those with 1 or 2 children have the highest poverty rate, with 116 household (27.2%) living below poverty.
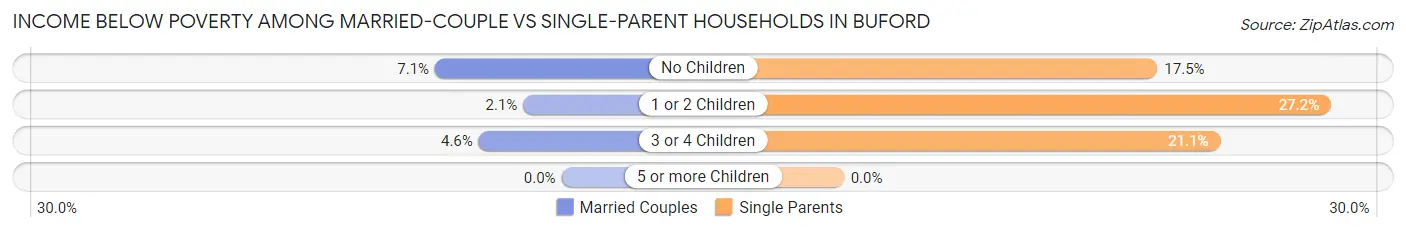
| Children | Married-Couple Families | Single-Parent Households |
| No Children | 81 (7.1%) | 71 (17.5%) |
| 1 or 2 Children | 26 (2.1%) | 116 (27.2%) |
| 3 or 4 Children | 19 (4.6%) | 28 (21.0%) |
| 5 or more Children | 0 (0.0%) | 0 (0.0%) |
| Total | 126 (4.5%) | 215 (22.3%) |
Race in Buford
The most populous races in Buford are White / Caucasian (9,946 | 57.8%), Hispanic or Latino (5,380 | 31.2%), and Two or more Races (3,038 | 17.6%).
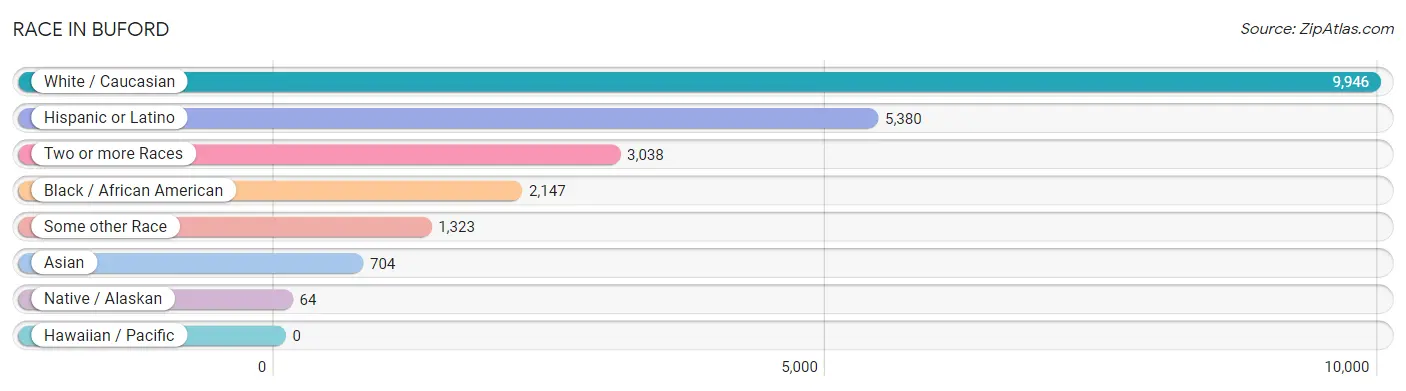
| Race | # Population | % Population |
| Asian | 704 | 4.1% |
| Black / African American | 2,147 | 12.5% |
| Hawaiian / Pacific | 0 | 0.0% |
| Hispanic or Latino | 5,380 | 31.2% |
| Native / Alaskan | 64 | 0.4% |
| White / Caucasian | 9,946 | 57.8% |
| Two or more Races | 3,038 | 17.6% |
| Some other Race | 1,323 | 7.7% |
| Total | 17,222 | 100.0% |
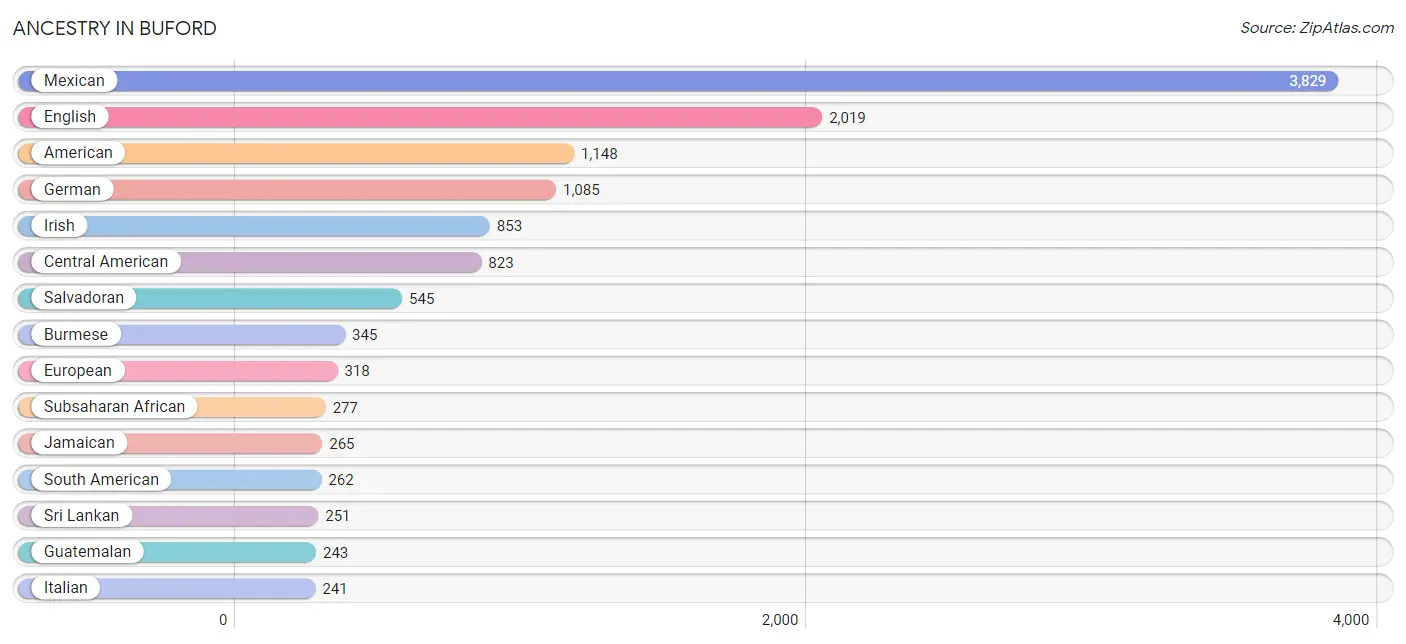
Ancestry in Buford
The most populous ancestries reported in Buford are Mexican (3,829 | 22.2%), English (2,019 | 11.7%), American (1,148 | 6.7%), German (1,085 | 6.3%), and Irish (853 | 5.0%), together accounting for 51.9% of all Buford residents.
| Ancestry | # Population | % Population |
| African | 232 | 1.3% |
| American | 1,148 | 6.7% |
| Arab | 205 | 1.2% |
| Bahamian | 35 | 0.2% |
| Bangladeshi | 17 | 0.1% |
| Basque | 48 | 0.3% |
| British | 3 | 0.0% |
| Burmese | 345 | 2.0% |
| Cape Verdean | 35 | 0.2% |
| Central American | 823 | 4.8% |
| Central American Indian | 80 | 0.5% |
| Cherokee | 28 | 0.2% |
| Chilean | 26 | 0.2% |
| Colombian | 142 | 0.8% |
| Croatian | 71 | 0.4% |
| Cuban | 10 | 0.1% |
| Dutch | 72 | 0.4% |
| Eastern European | 132 | 0.8% |
| Egyptian | 100 | 0.6% |
| English | 2,019 | 11.7% |
| European | 318 | 1.8% |
| French | 40 | 0.2% |
| French Canadian | 59 | 0.3% |
| German | 1,085 | 6.3% |
| Greek | 11 | 0.1% |
| Guatemalan | 243 | 1.4% |
| Guyanese | 226 | 1.3% |
| Haitian | 52 | 0.3% |
| Honduran | 35 | 0.2% |
| Hungarian | 21 | 0.1% |
| Indian (Asian) | 20 | 0.1% |
| Irish | 853 | 5.0% |
| Italian | 241 | 1.4% |
| Jamaican | 265 | 1.5% |
| Korean | 22 | 0.1% |
| Lebanese | 13 | 0.1% |
| Lithuanian | 16 | 0.1% |
| Mexican | 3,829 | 22.2% |
| Norwegian | 55 | 0.3% |
| Pakistani | 25 | 0.2% |
| Pennsylvania German | 14 | 0.1% |
| Peruvian | 94 | 0.5% |
| Polish | 61 | 0.4% |
| Puerto Rican | 224 | 1.3% |
| Romanian | 60 | 0.4% |
| Russian | 38 | 0.2% |
| Salvadoran | 545 | 3.2% |
| Scotch-Irish | 89 | 0.5% |
| Scottish | 133 | 0.8% |
| Slavic | 9 | 0.1% |
| Slovak | 13 | 0.1% |
| South African | 10 | 0.1% |
| South American | 262 | 1.5% |
| Sri Lankan | 251 | 1.5% |
| Subsaharan African | 277 | 1.6% |
| Swedish | 108 | 0.6% |
| Syrian | 92 | 0.5% |
| Thai | 101 | 0.6% |
| Trinidadian and Tobagonian | 8 | 0.1% |
| Ukrainian | 14 | 0.1% |
| Welsh | 53 | 0.3% | View All 61 Rows |
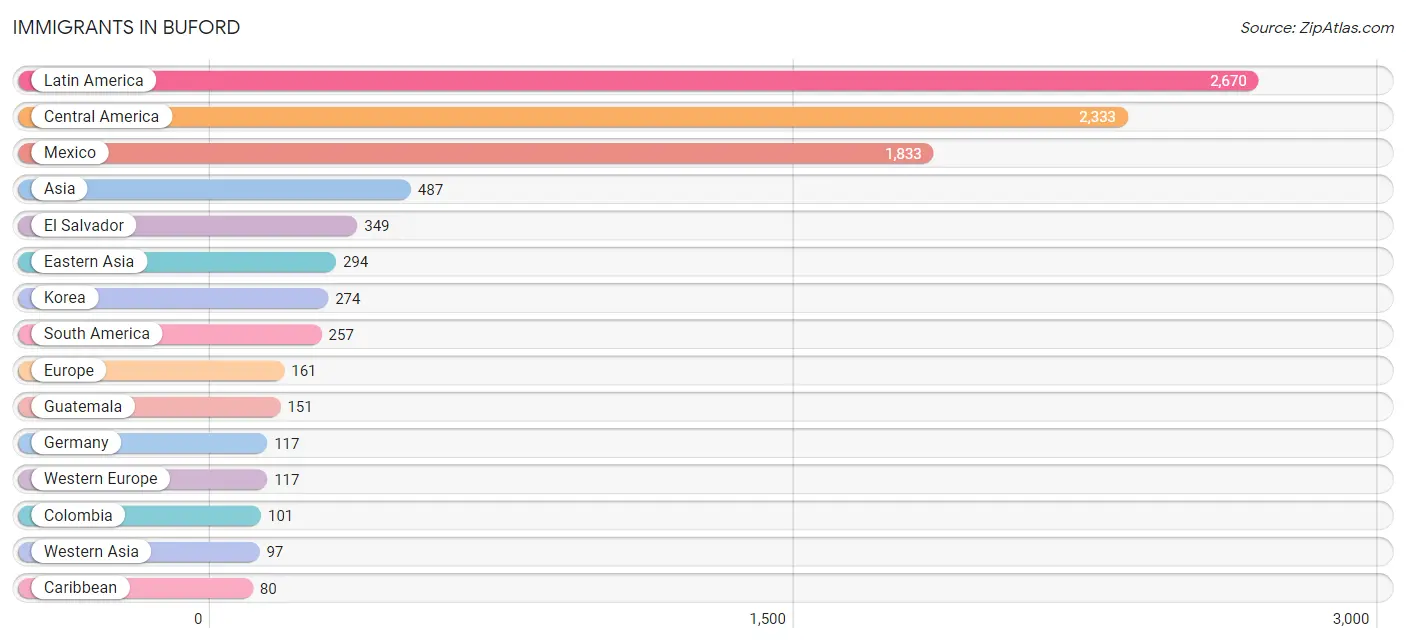
Immigrants in Buford
The most numerous immigrant groups reported in Buford came from Latin America (2,670 | 15.5%), Central America (2,333 | 13.6%), Mexico (1,833 | 10.6%), Asia (487 | 2.8%), and El Salvador (349 | 2.0%), together accounting for 44.5% of all Buford residents.
| Immigration Origin | # Population | % Population |
| Africa | 74 | 0.4% |
| Asia | 487 | 2.8% |
| Cabo Verde | 17 | 0.1% |
| Canada | 59 | 0.3% |
| Caribbean | 80 | 0.5% |
| Central America | 2,333 | 13.6% |
| Chile | 26 | 0.2% |
| China | 20 | 0.1% |
| Colombia | 101 | 0.6% |
| Cuba | 10 | 0.1% |
| Eastern Asia | 294 | 1.7% |
| Eastern Europe | 44 | 0.3% |
| Egypt | 33 | 0.2% |
| El Salvador | 349 | 2.0% |
| Europe | 161 | 0.9% |
| Germany | 117 | 0.7% |
| Guatemala | 151 | 0.9% |
| Guyana | 70 | 0.4% |
| Haiti | 18 | 0.1% |
| India | 28 | 0.2% |
| Iraq | 52 | 0.3% |
| Jamaica | 44 | 0.3% |
| Korea | 274 | 1.6% |
| Latin America | 2,670 | 15.5% |
| Mexico | 1,833 | 10.6% |
| Northern Africa | 33 | 0.2% |
| Peru | 60 | 0.4% |
| Romania | 44 | 0.3% |
| South America | 257 | 1.5% |
| South Central Asia | 28 | 0.2% |
| South Eastern Asia | 68 | 0.4% |
| Syria | 30 | 0.2% |
| Trinidad and Tobago | 8 | 0.1% |
| Vietnam | 68 | 0.4% |
| Western Africa | 17 | 0.1% |
| Western Asia | 97 | 0.6% |
| Western Europe | 117 | 0.7% | View All 37 Rows |
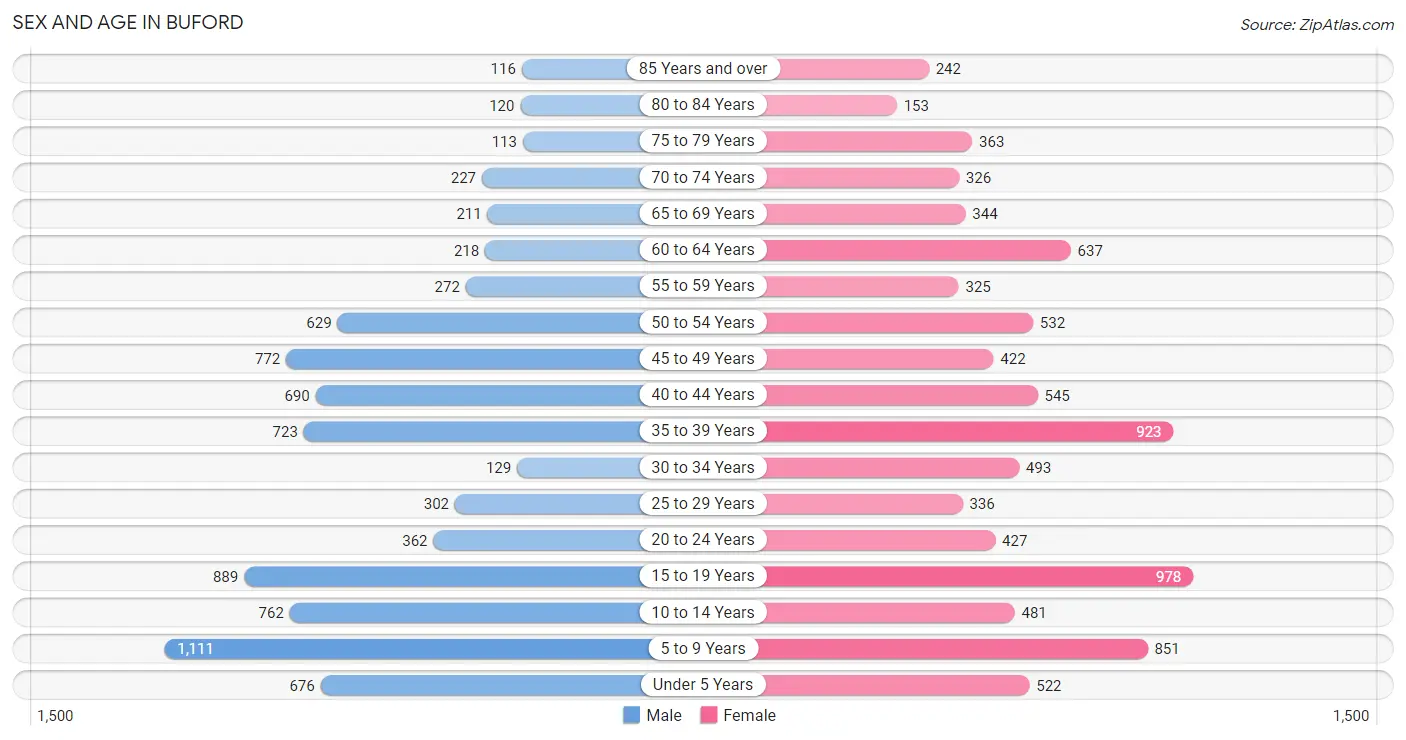
Sex and Age in Buford
Sex and Age in Buford
The most populous age groups in Buford are 5 to 9 Years (1,111 | 13.4%) for men and 15 to 19 Years (978 | 11.0%) for women.
| Age Bracket | Male | Female |
| Under 5 Years | 676 (8.1%) | 522 (5.9%) |
| 5 to 9 Years | 1,111 (13.4%) | 851 (9.6%) |
| 10 to 14 Years | 762 (9.2%) | 481 (5.4%) |
| 15 to 19 Years | 889 (10.7%) | 978 (11.0%) |
| 20 to 24 Years | 362 (4.3%) | 427 (4.8%) |
| 25 to 29 Years | 302 (3.6%) | 336 (3.8%) |
| 30 to 34 Years | 129 (1.5%) | 493 (5.5%) |
| 35 to 39 Years | 723 (8.7%) | 923 (10.4%) |
| 40 to 44 Years | 690 (8.3%) | 545 (6.1%) |
| 45 to 49 Years | 772 (9.3%) | 422 (4.7%) |
| 50 to 54 Years | 629 (7.6%) | 532 (6.0%) |
| 55 to 59 Years | 272 (3.3%) | 325 (3.6%) |
| 60 to 64 Years | 218 (2.6%) | 637 (7.2%) |
| 65 to 69 Years | 211 (2.5%) | 344 (3.9%) |
| 70 to 74 Years | 227 (2.7%) | 326 (3.7%) |
| 75 to 79 Years | 113 (1.4%) | 363 (4.1%) |
| 80 to 84 Years | 120 (1.4%) | 153 (1.7%) |
| 85 Years and over | 116 (1.4%) | 242 (2.7%) |
| Total | 8,322 (100.0%) | 8,900 (100.0%) |
Families and Households in Buford
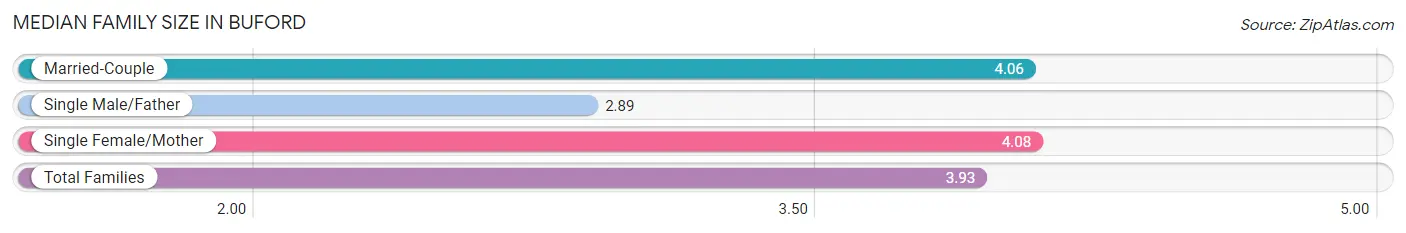
Median Family Size in Buford
The median family size in Buford is 3.93 persons per family, with single female/mother families (531 | 14.1%) accounting for the largest median family size of 4.08 persons per family. On the other hand, single male/father families (433 | 11.5%) represent the smallest median family size with 2.89 persons per family.
| Family Type | # Families | Family Size |
| Married-Couple | 2,815 (74.5%) | 4.06 |
| Single Male/Father | 433 (11.5%) | 2.89 |
| Single Female/Mother | 531 (14.1%) | 4.08 |
| Total Families | 3,779 (100.0%) | 3.93 |
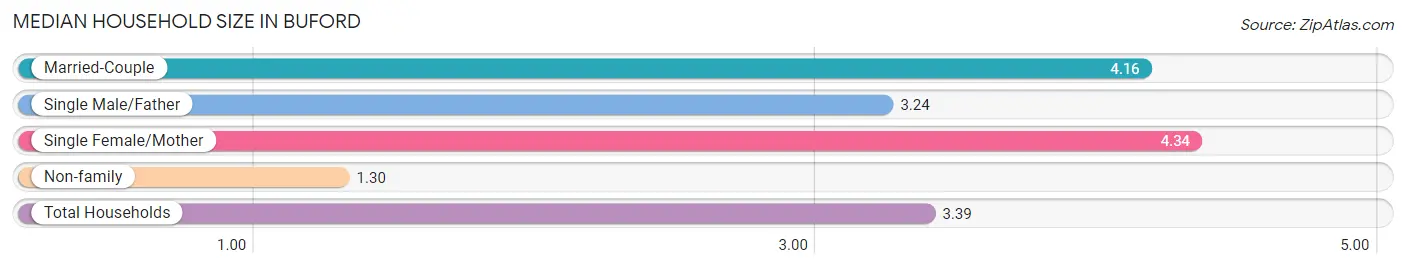
Median Household Size in Buford
The median household size in Buford is 3.39 persons per household, with single female/mother households (531 | 10.6%) accounting for the largest median household size of 4.34 persons per household. non-family households (1,240 | 24.7%) represent the smallest median household size with 1.30 persons per household.
| Household Type | # Households | Household Size |
| Married-Couple | 2,815 (56.1%) | 4.16 |
| Single Male/Father | 433 (8.6%) | 3.24 |
| Single Female/Mother | 531 (10.6%) | 4.34 |
| Non-family | 1,240 (24.7%) | 1.30 |
| Total Households | 5,019 (100.0%) | 3.39 |
Household Size by Marriage Status in Buford
Out of a total of 5,019 households in Buford, 3,779 (75.3%) are family households, while 1,240 (24.7%) are nonfamily households. The most numerous type of family households are 2-person households, comprising 1,265, and the most common type of nonfamily households are 1-person households, comprising 942.
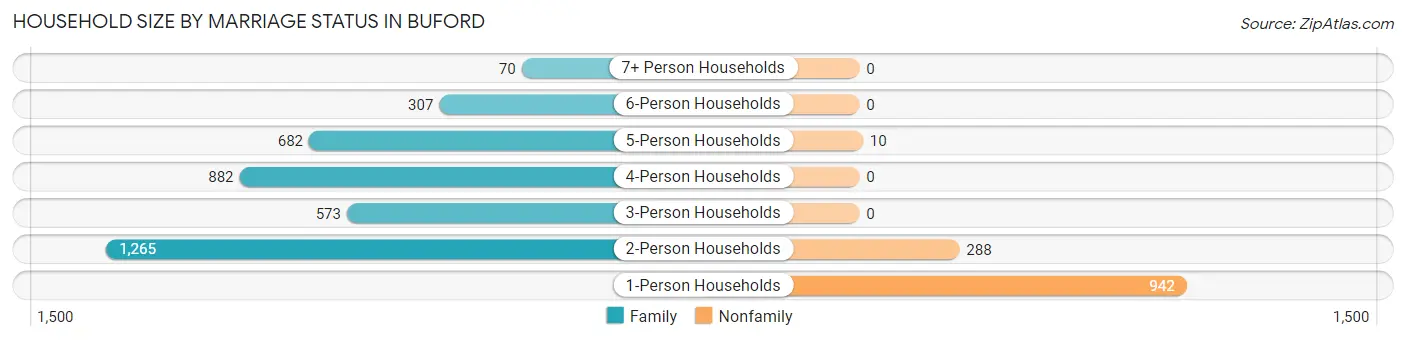
| Household Size | Family Households | Nonfamily Households |
| 1-Person Households | - | 942 (18.8%) |
| 2-Person Households | 1,265 (25.2%) | 288 (5.7%) |
| 3-Person Households | 573 (11.4%) | 0 (0.0%) |
| 4-Person Households | 882 (17.6%) | 0 (0.0%) |
| 5-Person Households | 682 (13.6%) | 10 (0.2%) |
| 6-Person Households | 307 (6.1%) | 0 (0.0%) |
| 7+ Person Households | 70 (1.4%) | 0 (0.0%) |
| Total | 3,779 (75.3%) | 1,240 (24.7%) |
Female Fertility in Buford
Fertility by Age in Buford
Average fertility rate in Buford is 73.0 births per 1,000 women. Women in the age bracket of 20 to 34 years have the highest fertility rate with 161.0 births per 1,000 women. Women in the age bracket of 20 to 34 years acount for 66.2% of all women with births.
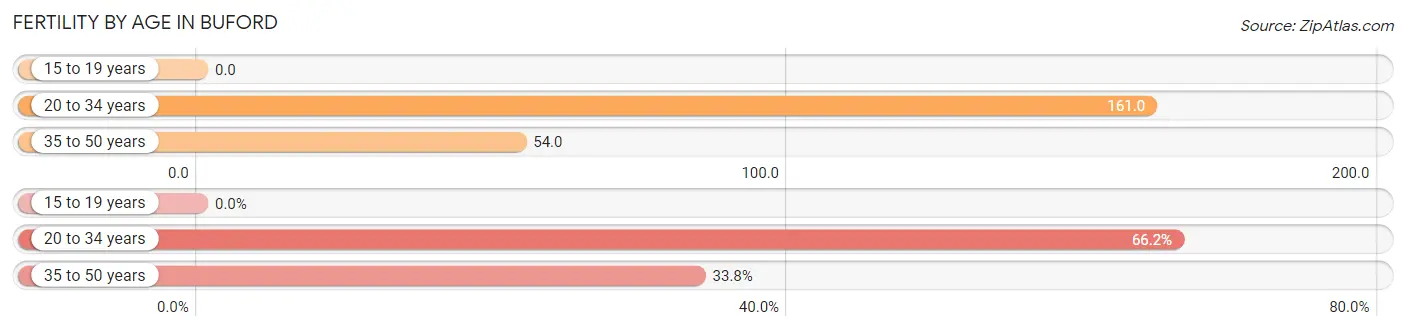
| Age Bracket | Women with Births | Births / 1,000 Women |
| 15 to 19 years | 0 (0.0%) | 0.0 |
| 20 to 34 years | 202 (66.2%) | 161.0 |
| 35 to 50 years | 103 (33.8%) | 54.0 |
| Total | 305 (100.0%) | 73.0 |
Fertility by Age by Marriage Status in Buford
49.2% of women with births (305) in Buford are married. The highest percentage of unmarried women with births falls into 20 to 34 years age bracket with 76.7% of them unmarried at the time of birth, while the lowest percentage of unmarried women with births belong to 35 to 50 years age bracket with 0.0% of them unmarried.
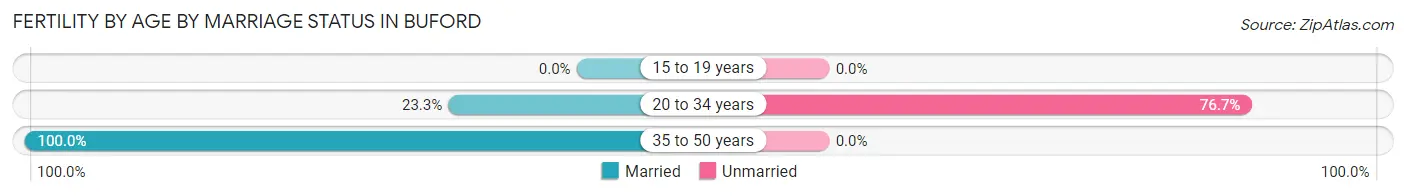
| Age Bracket | Married | Unmarried |
| 15 to 19 years | 0 (0.0%) | 0 (0.0%) |
| 20 to 34 years | 47 (23.3%) | 155 (76.7%) |
| 35 to 50 years | 103 (100.0%) | 0 (0.0%) |
| Total | 150 (49.2%) | 155 (50.8%) |
Fertility by Education in Buford
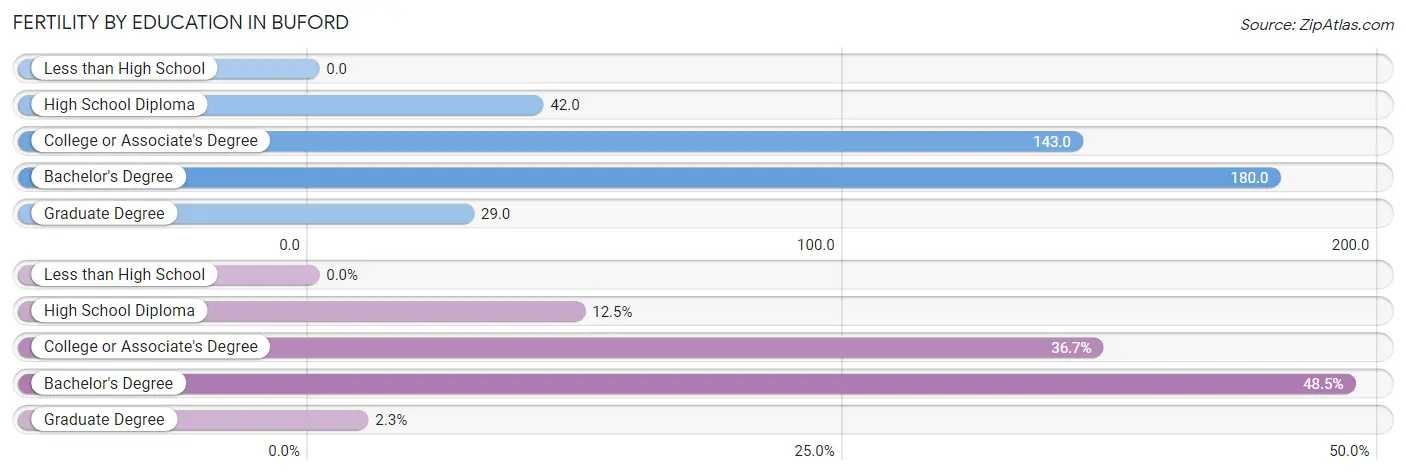
| Educational Attainment | Women with Births | Births / 1,000 Women |
| Less than High School | 0 (0.0%) | 0.0 |
| High School Diploma | 38 (12.5%) | 42.0 |
| College or Associate's Degree | 112 (36.7%) | 143.0 |
| Bachelor's Degree | 148 (48.5%) | 180.0 |
| Graduate Degree | 7 (2.3%) | 29.0 |
| Total | 305 (100.0%) | 73.0 |
Fertility by Education by Marriage Status in Buford
50.8% of women with births in Buford are unmarried. Women with the educational attainment of graduate degree are most likely to be married with 100.0% of them married at childbirth, while women with the educational attainment of college or associate's degree are least likely to be married with 72.3% of them unmarried at childbirth.
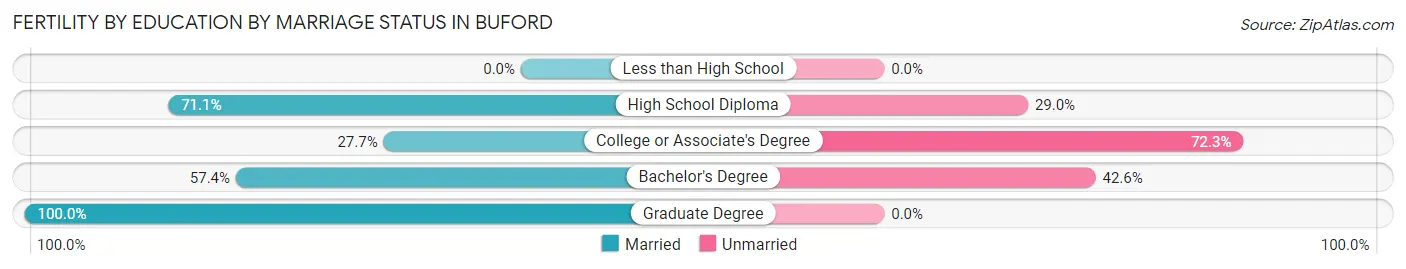
| Educational Attainment | Married | Unmarried |
| Less than High School | 0 (0.0%) | 0 (0.0%) |
| High School Diploma | 27 (71.1%) | 11 (28.9%) |
| College or Associate's Degree | 31 (27.7%) | 81 (72.3%) |
| Bachelor's Degree | 85 (57.4%) | 63 (42.6%) |
| Graduate Degree | 7 (100.0%) | 0 (0.0%) |
| Total | 150 (49.2%) | 155 (50.8%) |
Employment Characteristics in Buford
Employment by Class of Employer in Buford
Among the 7,030 employed individuals in Buford, private company employees (5,225 | 74.3%), self-employed (incorporated) (516 | 7.3%), and local government employees (435 | 6.2%) make up the most common classes of employment.
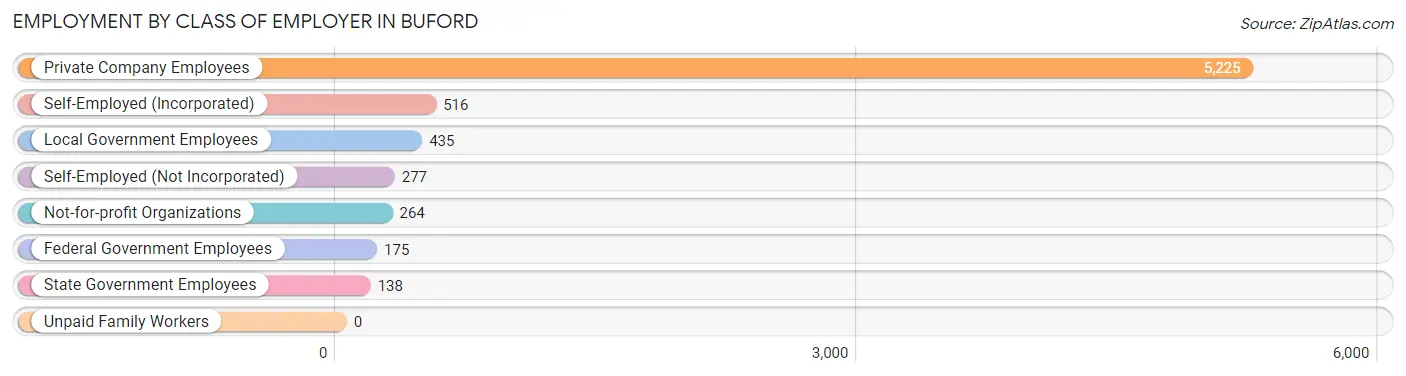
| Employer Class | # Employees | % Employees |
| Private Company Employees | 5,225 | 74.3% |
| Self-Employed (Incorporated) | 516 | 7.3% |
| Self-Employed (Not Incorporated) | 277 | 3.9% |
| Not-for-profit Organizations | 264 | 3.8% |
| Local Government Employees | 435 | 6.2% |
| State Government Employees | 138 | 2.0% |
| Federal Government Employees | 175 | 2.5% |
| Unpaid Family Workers | 0 | 0.0% |
| Total | 7,030 | 100.0% |
Employment Status by Age in Buford
According to the labor force statistics for Buford, out of the total population over 16 years of age (12,277), 60.2% or 7,391 individuals are in the labor force, with 3.0% or 222 of them unemployed. The age group with the highest labor force participation rate is 25 to 29 years, with 92.2% or 588 individuals in the labor force. Within the labor force, the 16 to 19 years age range has the highest percentage of unemployed individuals, with 7.2% or 27 of them being unemployed.
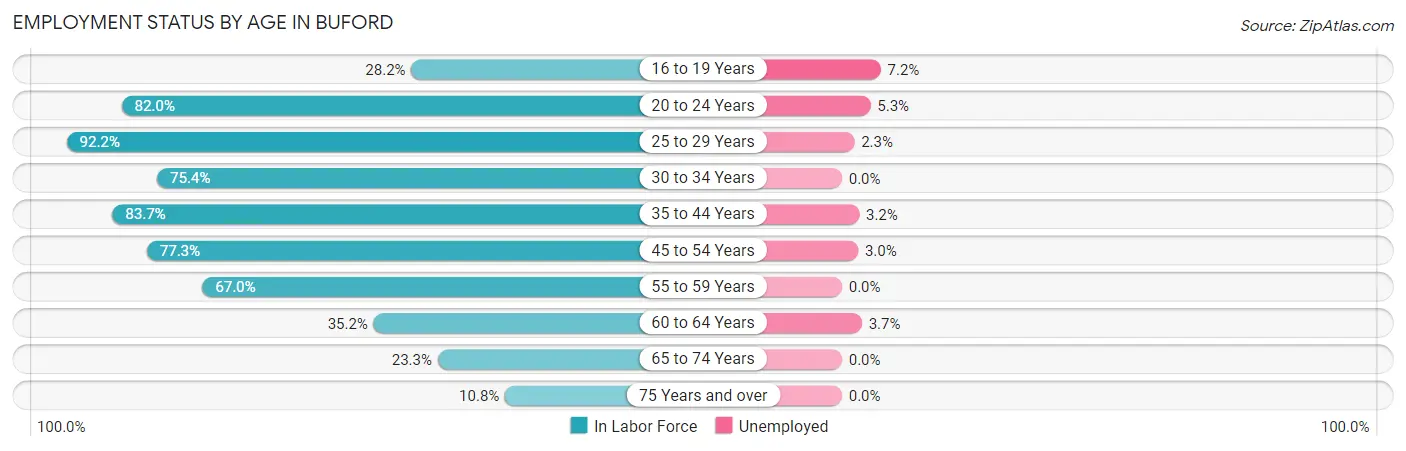
| Age Bracket | In Labor Force | Unemployed |
| 16 to 19 Years | 374 (28.2%) | 27 (7.2%) |
| 20 to 24 Years | 647 (82.0%) | 34 (5.3%) |
| 25 to 29 Years | 588 (92.2%) | 14 (2.3%) |
| 30 to 34 Years | 469 (75.4%) | 0 (0.0%) |
| 35 to 44 Years | 2,411 (83.7%) | 77 (3.2%) |
| 45 to 54 Years | 1,820 (77.3%) | 55 (3.0%) |
| 55 to 59 Years | 400 (67.0%) | 0 (0.0%) |
| 60 to 64 Years | 301 (35.2%) | 11 (3.7%) |
| 65 to 74 Years | 258 (23.3%) | 0 (0.0%) |
| 75 Years and over | 120 (10.8%) | 0 (0.0%) |
| Total | 7,391 (60.2%) | 222 (3.0%) |
Employment Status by Educational Attainment in Buford
According to labor force statistics for Buford, 75.4% of individuals (5,993) out of the total population between 25 and 64 years of age (7,948) are in the labor force, with 2.6% or 156 of them being unemployed. The group with the highest labor force participation rate are those with the educational attainment of bachelor's degree or higher, with 85.8% or 2,042 individuals in the labor force. Within the labor force, individuals with college / associate degree education have the highest percentage of unemployment, with 6.9% or 90 of them being unemployed.
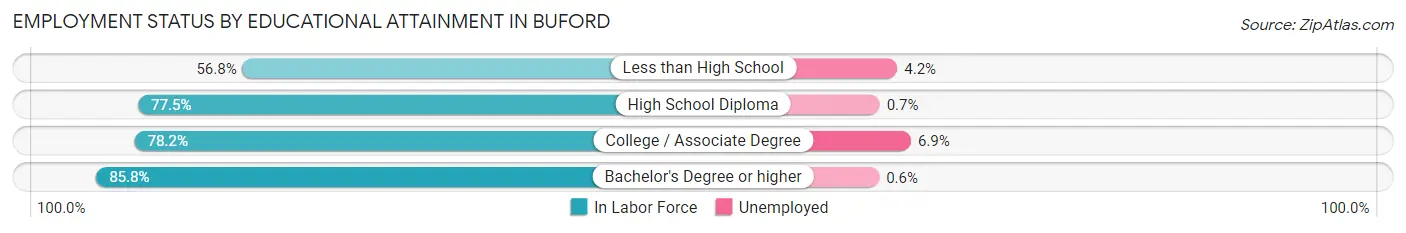
| Educational Attainment | In Labor Force | Unemployed |
| Less than High School | 1,042 (56.8%) | 77 (4.2%) |
| High School Diploma | 1,606 (77.5%) | 15 (0.7%) |
| College / Associate Degree | 1,300 (78.2%) | 115 (6.9%) |
| Bachelor's Degree or higher | 2,042 (85.8%) | 14 (0.6%) |
| Total | 5,993 (75.4%) | 207 (2.6%) |
Employment Occupations by Sex in Buford
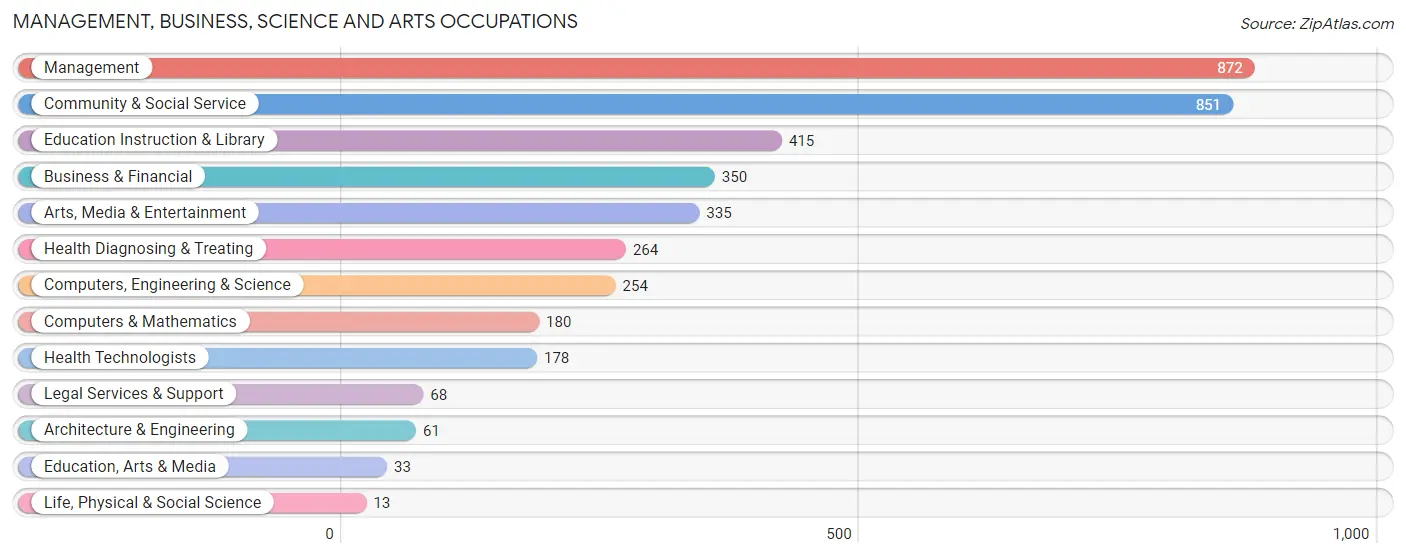
Management, Business, Science and Arts Occupations
The most common Management, Business, Science and Arts occupations in Buford are Management (872 | 12.2%), Community & Social Service (851 | 11.9%), Education Instruction & Library (415 | 5.8%), Business & Financial (350 | 4.9%), and Arts, Media & Entertainment (335 | 4.7%).
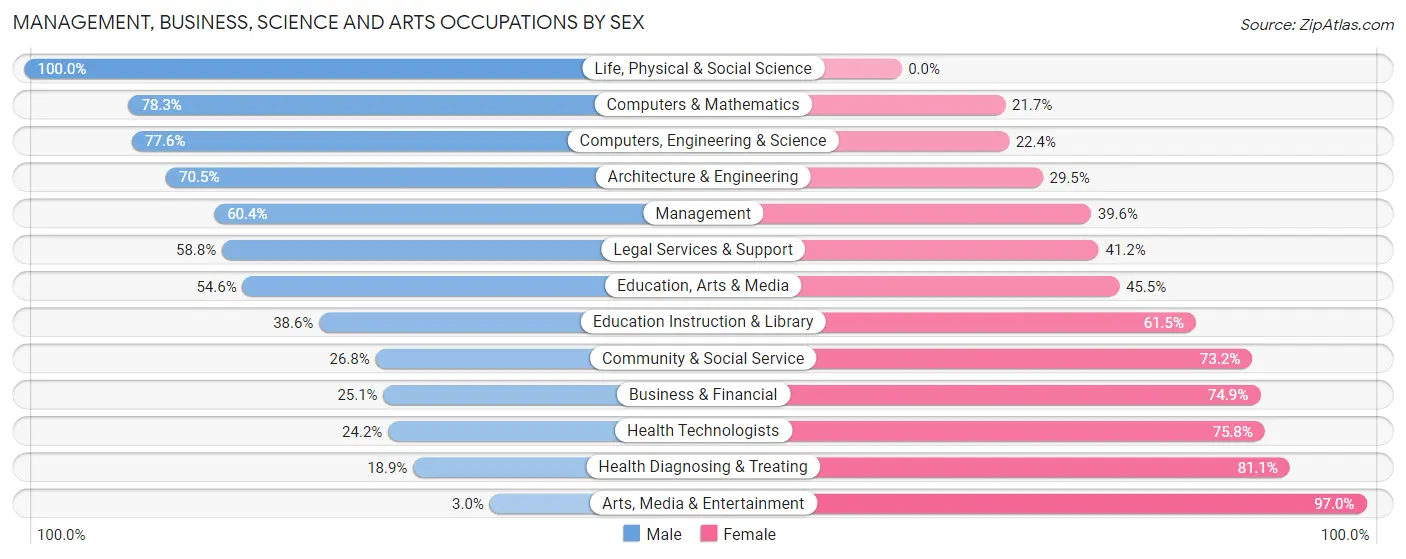
Management, Business, Science and Arts Occupations by Sex
Within the Management, Business, Science and Arts occupations in Buford, the most male-oriented occupations are Life, Physical & Social Science (100.0%), Computers & Mathematics (78.3%), and Computers, Engineering & Science (77.6%), while the most female-oriented occupations are Arts, Media & Entertainment (97.0%), Health Diagnosing & Treating (81.1%), and Health Technologists (75.8%).
| Occupation | Male | Female |
| Management | 527 (60.4%) | 345 (39.6%) |
| Business & Financial | 88 (25.1%) | 262 (74.9%) |
| Computers, Engineering & Science | 197 (77.6%) | 57 (22.4%) |
| Computers & Mathematics | 141 (78.3%) | 39 (21.7%) |
| Architecture & Engineering | 43 (70.5%) | 18 (29.5%) |
| Life, Physical & Social Science | 13 (100.0%) | 0 (0.0%) |
| Community & Social Service | 228 (26.8%) | 623 (73.2%) |
| Education, Arts & Media | 18 (54.5%) | 15 (45.5%) |
| Legal Services & Support | 40 (58.8%) | 28 (41.2%) |
| Education Instruction & Library | 160 (38.6%) | 255 (61.5%) |
| Arts, Media & Entertainment | 10 (3.0%) | 325 (97.0%) |
| Health Diagnosing & Treating | 50 (18.9%) | 214 (81.1%) |
| Health Technologists | 43 (24.2%) | 135 (75.8%) |
| Total (Category) | 1,090 (42.1%) | 1,501 (57.9%) |
| Total (Overall) | 3,827 (53.6%) | 3,310 (46.4%) |
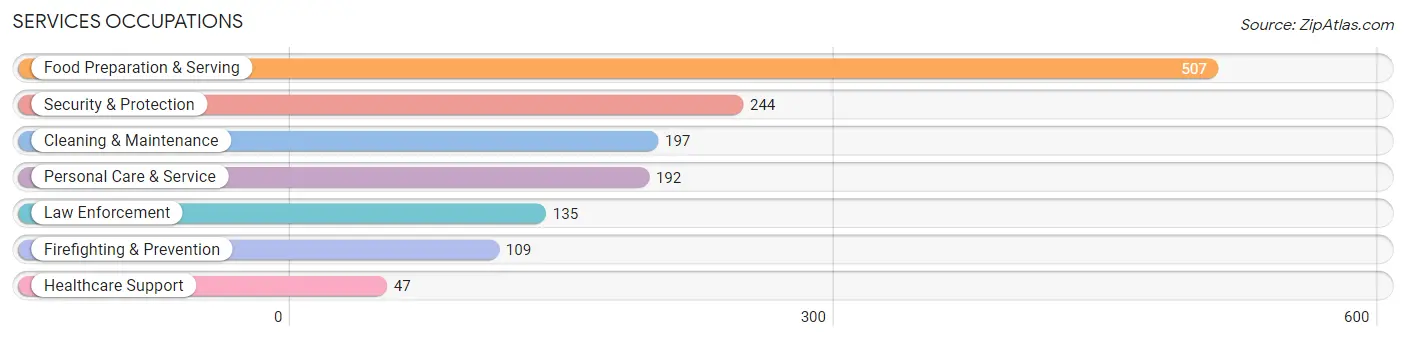
Services Occupations
The most common Services occupations in Buford are Food Preparation & Serving (507 | 7.1%), Security & Protection (244 | 3.4%), Cleaning & Maintenance (197 | 2.8%), Personal Care & Service (192 | 2.7%), and Law Enforcement (135 | 1.9%).
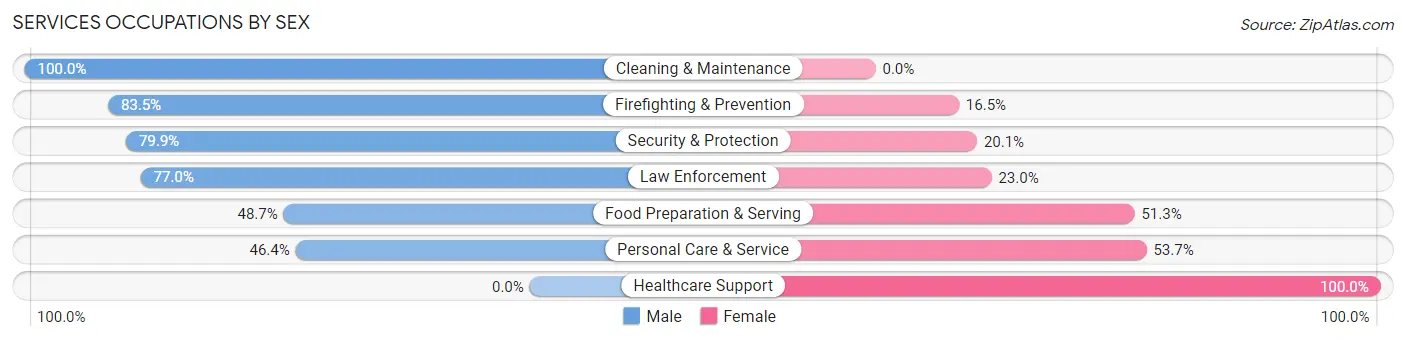
Services Occupations by Sex
Within the Services occupations in Buford, the most male-oriented occupations are Cleaning & Maintenance (100.0%), Firefighting & Prevention (83.5%), and Security & Protection (79.9%), while the most female-oriented occupations are Healthcare Support (100.0%), Personal Care & Service (53.6%), and Food Preparation & Serving (51.3%).
| Occupation | Male | Female |
| Healthcare Support | 0 (0.0%) | 47 (100.0%) |
| Security & Protection | 195 (79.9%) | 49 (20.1%) |
| Firefighting & Prevention | 91 (83.5%) | 18 (16.5%) |
| Law Enforcement | 104 (77.0%) | 31 (23.0%) |
| Food Preparation & Serving | 247 (48.7%) | 260 (51.3%) |
| Cleaning & Maintenance | 197 (100.0%) | 0 (0.0%) |
| Personal Care & Service | 89 (46.4%) | 103 (53.6%) |
| Total (Category) | 728 (61.3%) | 459 (38.7%) |
| Total (Overall) | 3,827 (53.6%) | 3,310 (46.4%) |
Sales and Office Occupations
The most common Sales and Office occupations in Buford are Sales & Related (790 | 11.1%), and Office & Administration (692 | 9.7%).
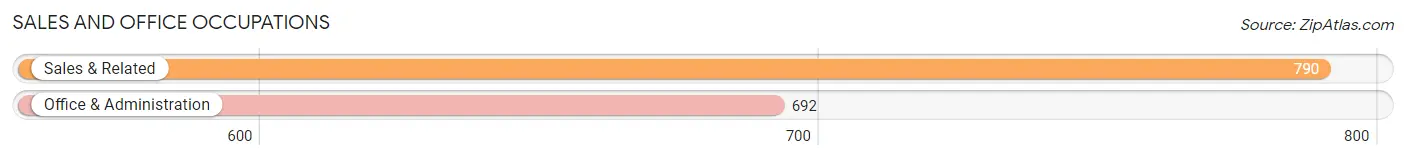
Sales and Office Occupations by Sex

| Occupation | Male | Female |
| Sales & Related | 393 (49.7%) | 397 (50.2%) |
| Office & Administration | 88 (12.7%) | 604 (87.3%) |
| Total (Category) | 481 (32.5%) | 1,001 (67.5%) |
| Total (Overall) | 3,827 (53.6%) | 3,310 (46.4%) |
Natural Resources, Construction and Maintenance Occupations
The most common Natural Resources, Construction and Maintenance occupations in Buford are Construction & Extraction (530 | 7.4%), and Installation, Maintenance & Repair (119 | 1.7%).
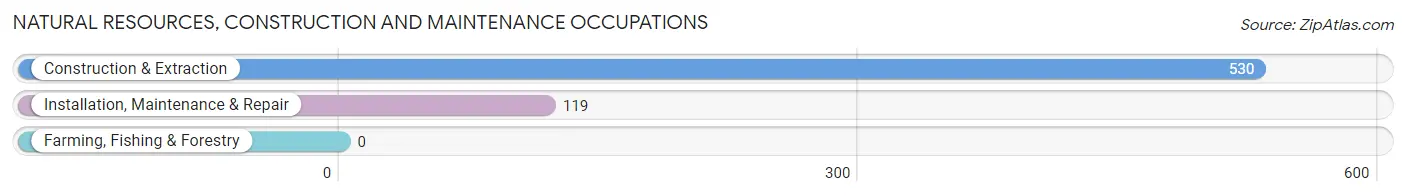
Natural Resources, Construction and Maintenance Occupations by Sex

| Occupation | Male | Female |
| Farming, Fishing & Forestry | 0 (0.0%) | 0 (0.0%) |
| Construction & Extraction | 530 (100.0%) | 0 (0.0%) |
| Installation, Maintenance & Repair | 119 (100.0%) | 0 (0.0%) |
| Total (Category) | 649 (100.0%) | 0 (0.0%) |
| Total (Overall) | 3,827 (53.6%) | 3,310 (46.4%) |
Production, Transportation and Moving Occupations
The most common Production, Transportation and Moving occupations in Buford are Material Moving (549 | 7.7%), Production (453 | 6.4%), and Transportation (226 | 3.2%).
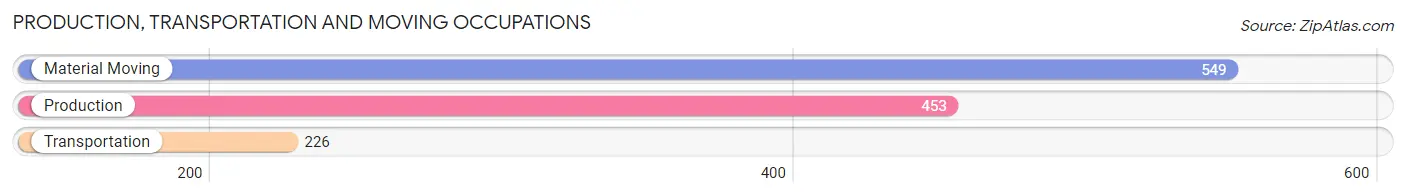
Production, Transportation and Moving Occupations by Sex
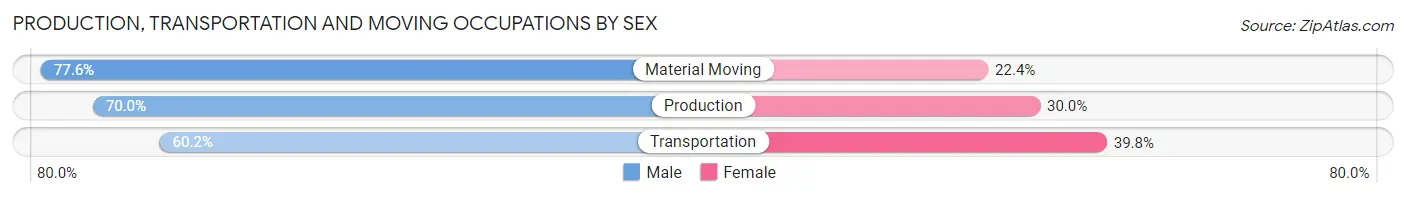
| Occupation | Male | Female |
| Production | 317 (70.0%) | 136 (30.0%) |
| Transportation | 136 (60.2%) | 90 (39.8%) |
| Material Moving | 426 (77.6%) | 123 (22.4%) |
| Total (Category) | 879 (71.6%) | 349 (28.4%) |
| Total (Overall) | 3,827 (53.6%) | 3,310 (46.4%) |
Employment Industries by Sex in Buford
Employment Industries in Buford
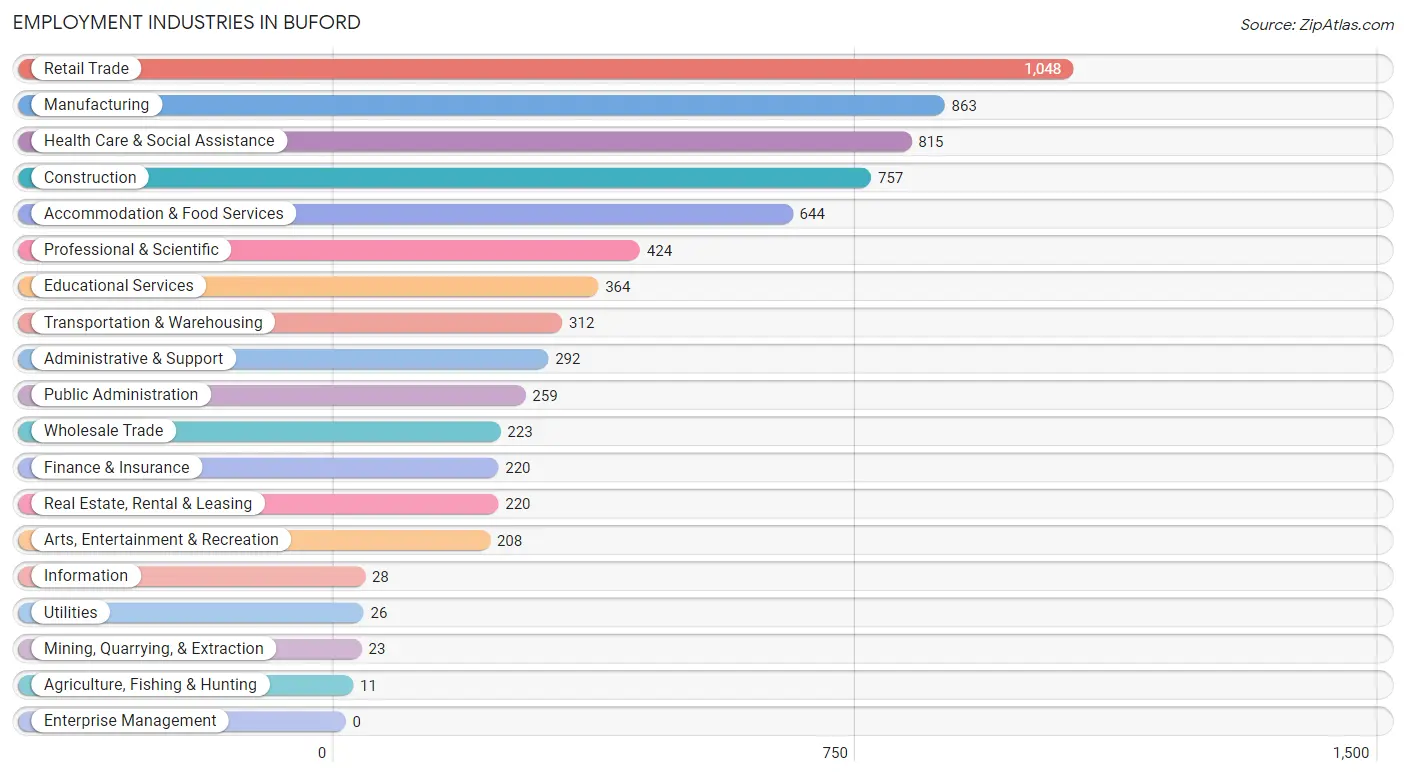
The major employment industries in Buford include Retail Trade (1,048 | 14.7%), Manufacturing (863 | 12.1%), Health Care & Social Assistance (815 | 11.4%), Construction (757 | 10.6%), and Accommodation & Food Services (644 | 9.0%).
Employment Industries by Sex in Buford
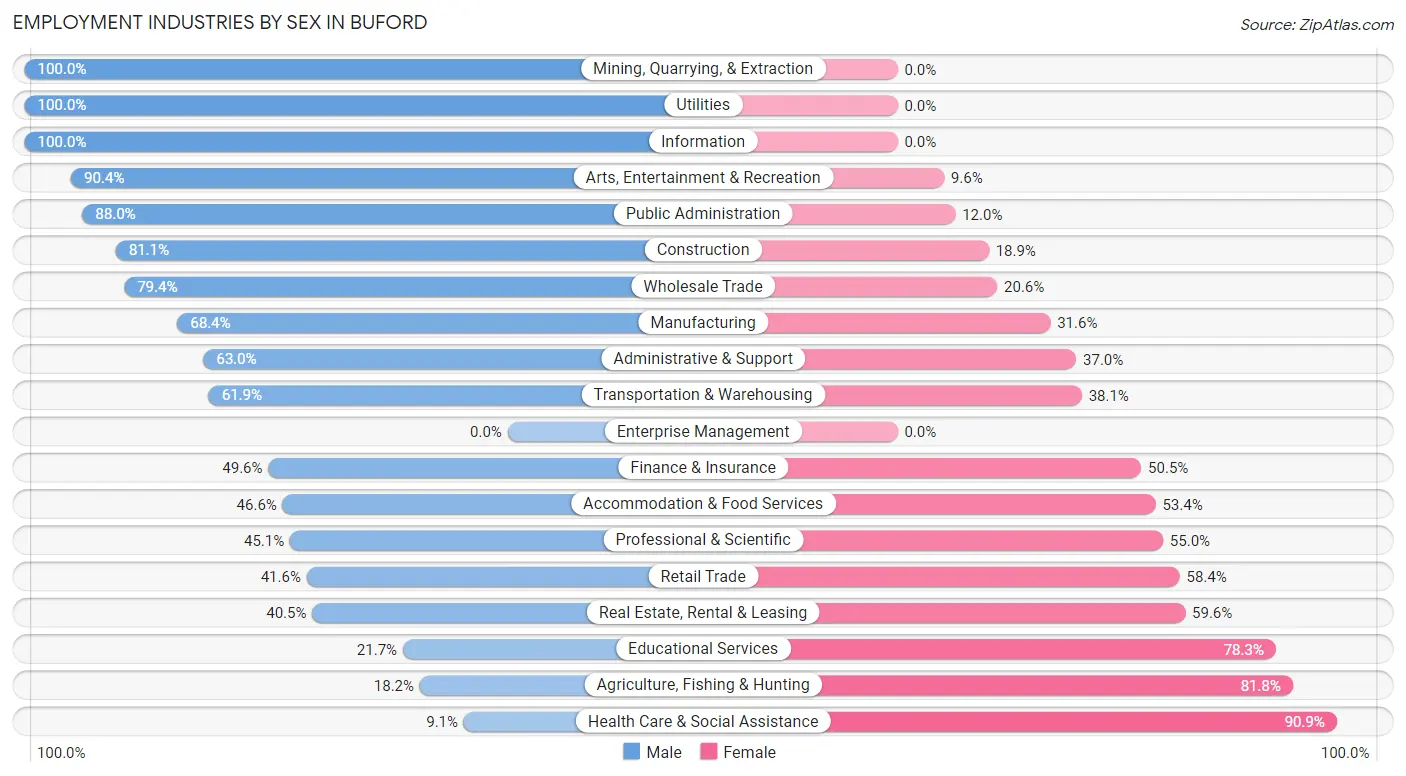
The Buford industries that see more men than women are Mining, Quarrying, & Extraction (100.0%), Utilities (100.0%), and Information (100.0%), whereas the industries that tend to have a higher number of women are Health Care & Social Assistance (90.9%), Agriculture, Fishing & Hunting (81.8%), and Educational Services (78.3%).
| Industry | Male | Female |
| Agriculture, Fishing & Hunting | 2 (18.2%) | 9 (81.8%) |
| Mining, Quarrying, & Extraction | 23 (100.0%) | 0 (0.0%) |
| Construction | 614 (81.1%) | 143 (18.9%) |
| Manufacturing | 590 (68.4%) | 273 (31.6%) |
| Wholesale Trade | 177 (79.4%) | 46 (20.6%) |
| Retail Trade | 436 (41.6%) | 612 (58.4%) |
| Transportation & Warehousing | 193 (61.9%) | 119 (38.1%) |
| Utilities | 26 (100.0%) | 0 (0.0%) |
| Information | 28 (100.0%) | 0 (0.0%) |
| Finance & Insurance | 109 (49.5%) | 111 (50.4%) |
| Real Estate, Rental & Leasing | 89 (40.5%) | 131 (59.6%) |
| Professional & Scientific | 191 (45.1%) | 233 (54.9%) |
| Enterprise Management | 0 (0.0%) | 0 (0.0%) |
| Administrative & Support | 184 (63.0%) | 108 (37.0%) |
| Educational Services | 79 (21.7%) | 285 (78.3%) |
| Health Care & Social Assistance | 74 (9.1%) | 741 (90.9%) |
| Arts, Entertainment & Recreation | 188 (90.4%) | 20 (9.6%) |
| Accommodation & Food Services | 300 (46.6%) | 344 (53.4%) |
| Public Administration | 228 (88.0%) | 31 (12.0%) |
| Total | 3,827 (53.6%) | 3,310 (46.4%) |
Education in Buford
School Enrollment in Buford
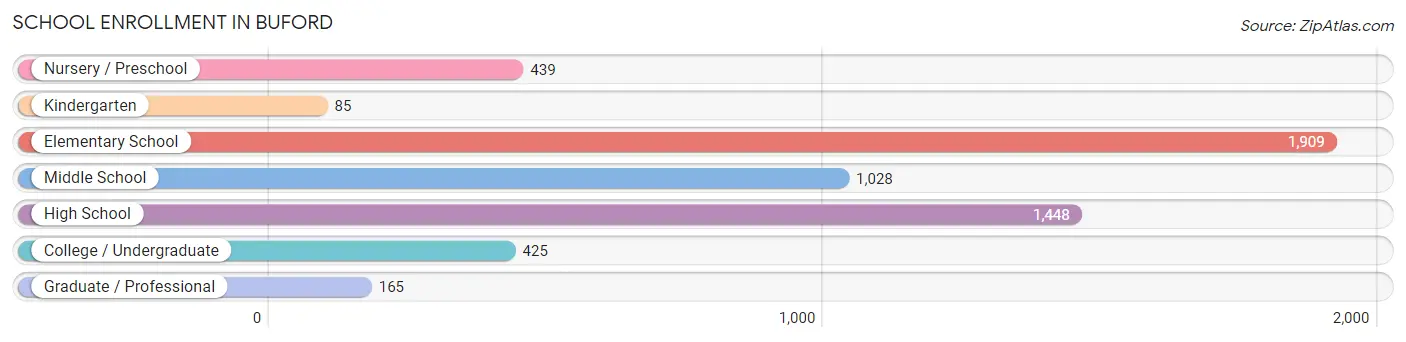
The most common levels of schooling among the 5,499 students in Buford are elementary school (1,909 | 34.7%), high school (1,448 | 26.3%), and middle school (1,028 | 18.7%).
| School Level | # Students | % Students |
| Nursery / Preschool | 439 | 8.0% |
| Kindergarten | 85 | 1.5% |
| Elementary School | 1,909 | 34.7% |
| Middle School | 1,028 | 18.7% |
| High School | 1,448 | 26.3% |
| College / Undergraduate | 425 | 7.7% |
| Graduate / Professional | 165 | 3.0% |
| Total | 5,499 | 100.0% |
School Enrollment by Age by Funding Source in Buford
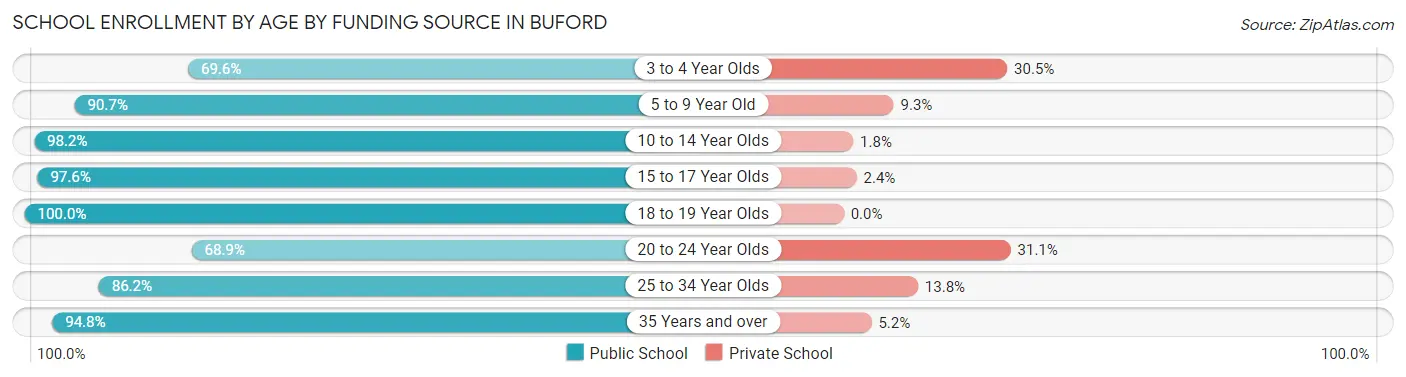
Out of a total of 5,499 students who are enrolled in schools in Buford, 445 (8.1%) attend a private institution, while the remaining 5,054 (91.9%) are enrolled in public schools. The age group of 20 to 24 year olds has the highest likelihood of being enrolled in private schools, with 88 (31.1% in the age bracket) enrolled. Conversely, the age group of 18 to 19 year olds has the lowest likelihood of being enrolled in a private school, with 196 (100.0% in the age bracket) attending a public institution.
| Age Bracket | Public School | Private School |
| 3 to 4 Year Olds | 233 (69.6%) | 102 (30.4%) |
| 5 to 9 Year Old | 1,774 (90.7%) | 182 (9.3%) |
| 10 to 14 Year Olds | 1,221 (98.2%) | 22 (1.8%) |
| 15 to 17 Year Olds | 1,094 (97.6%) | 27 (2.4%) |
| 18 to 19 Year Olds | 196 (100.0%) | 0 (0.0%) |
| 20 to 24 Year Olds | 195 (68.9%) | 88 (31.1%) |
| 25 to 34 Year Olds | 81 (86.2%) | 13 (13.8%) |
| 35 Years and over | 257 (94.8%) | 14 (5.2%) |
| Total | 5,054 (91.9%) | 445 (8.1%) |
Educational Attainment by Field of Study in Buford
Business (942 | 31.4%), education (309 | 10.3%), arts & humanities (220 | 7.3%), social sciences (197 | 6.6%), and science & technology (188 | 6.3%) are the most common fields of study among 3,002 individuals in Buford who have obtained a bachelor's degree or higher.
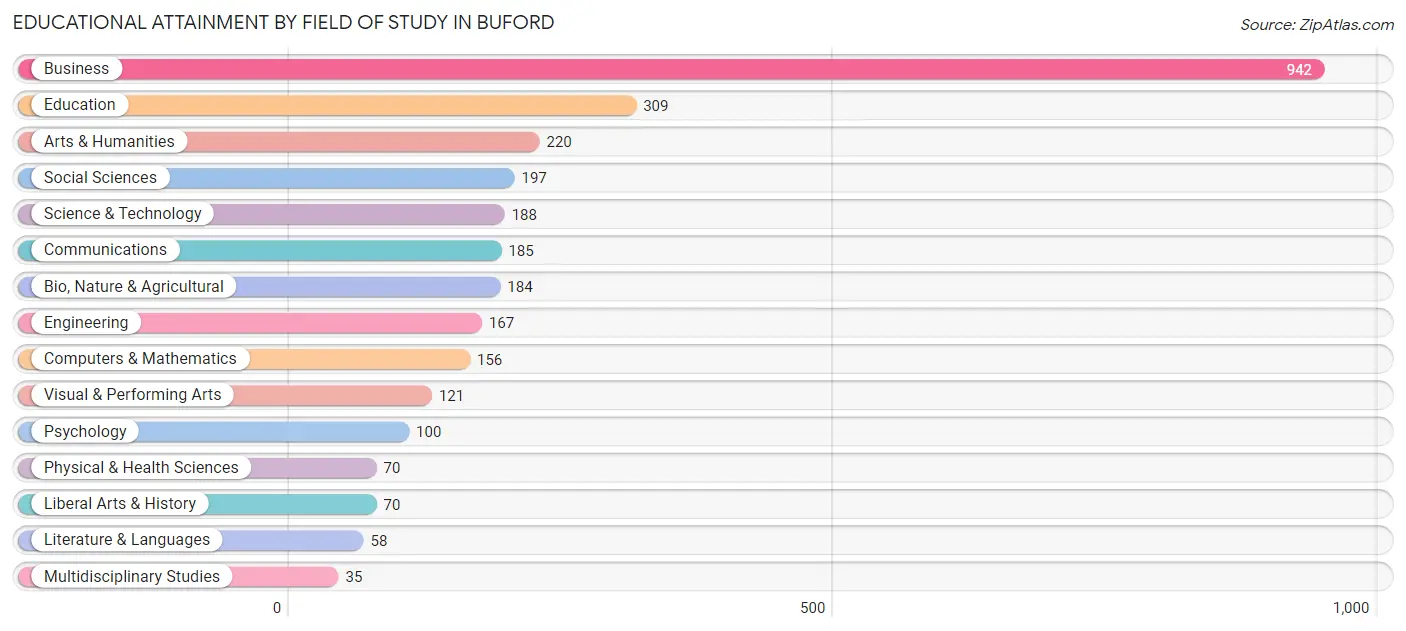
| Field of Study | # Graduates | % Graduates |
| Computers & Mathematics | 156 | 5.2% |
| Bio, Nature & Agricultural | 184 | 6.1% |
| Physical & Health Sciences | 70 | 2.3% |
| Psychology | 100 | 3.3% |
| Social Sciences | 197 | 6.6% |
| Engineering | 167 | 5.6% |
| Multidisciplinary Studies | 35 | 1.2% |
| Science & Technology | 188 | 6.3% |
| Business | 942 | 31.4% |
| Education | 309 | 10.3% |
| Literature & Languages | 58 | 1.9% |
| Liberal Arts & History | 70 | 2.3% |
| Visual & Performing Arts | 121 | 4.0% |
| Communications | 185 | 6.2% |
| Arts & Humanities | 220 | 7.3% |
| Total | 3,002 | 100.0% |
Transportation & Commute in Buford
Vehicle Availability by Sex in Buford
The most prevalent vehicle ownership categories in Buford are males with 2 vehicles (1,458, accounting for 38.7%) and females with 2 vehicles (1,144, making up 44.9%).
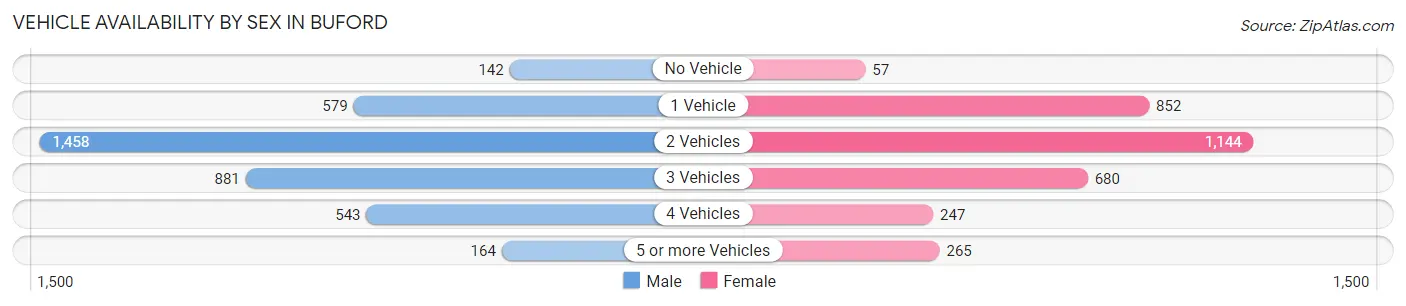
| Vehicles Available | Male | Female |
| No Vehicle | 142 (3.8%) | 57 (1.8%) |
| 1 Vehicle | 579 (15.4%) | 852 (26.3%) |
| 2 Vehicles | 1,458 (38.7%) | 1,144 (35.2%) |
| 3 Vehicles | 881 (23.4%) | 680 (21.0%) |
| 4 Vehicles | 543 (14.4%) | 247 (7.6%) |
| 5 or more Vehicles | 164 (4.3%) | 265 (8.2%) |
| Total | 3,767 (100.0%) | 3,245 (100.0%) |
Commute Time in Buford
The most frequently occuring commute durations in Buford are 5 to 9 minutes (888 commuters, 14.0%), 20 to 24 minutes (816 commuters, 12.9%), and 25 to 29 minutes (754 commuters, 11.9%).
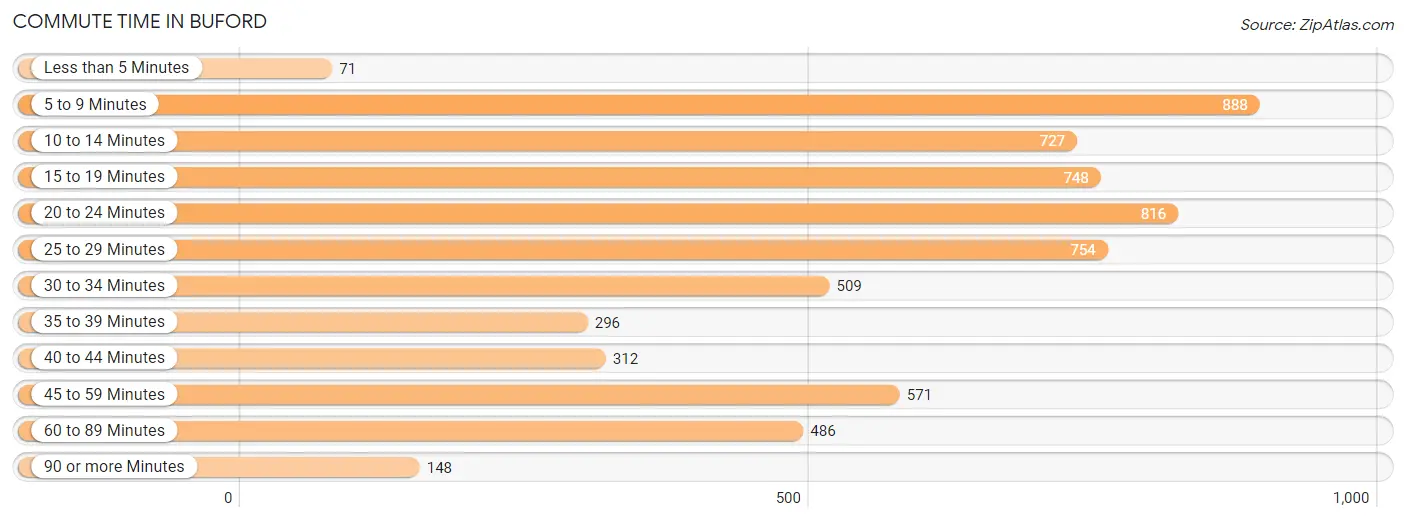
| Commute Time | # Commuters | % Commuters |
| Less than 5 Minutes | 71 | 1.1% |
| 5 to 9 Minutes | 888 | 14.0% |
| 10 to 14 Minutes | 727 | 11.5% |
| 15 to 19 Minutes | 748 | 11.8% |
| 20 to 24 Minutes | 816 | 12.9% |
| 25 to 29 Minutes | 754 | 11.9% |
| 30 to 34 Minutes | 509 | 8.1% |
| 35 to 39 Minutes | 296 | 4.7% |
| 40 to 44 Minutes | 312 | 4.9% |
| 45 to 59 Minutes | 571 | 9.0% |
| 60 to 89 Minutes | 486 | 7.7% |
| 90 or more Minutes | 148 | 2.3% |
Commute Time by Sex in Buford
The most common commute times in Buford are 25 to 29 minutes (544 commuters, 16.1%) for males and 5 to 9 minutes (531 commuters, 18.0%) for females.
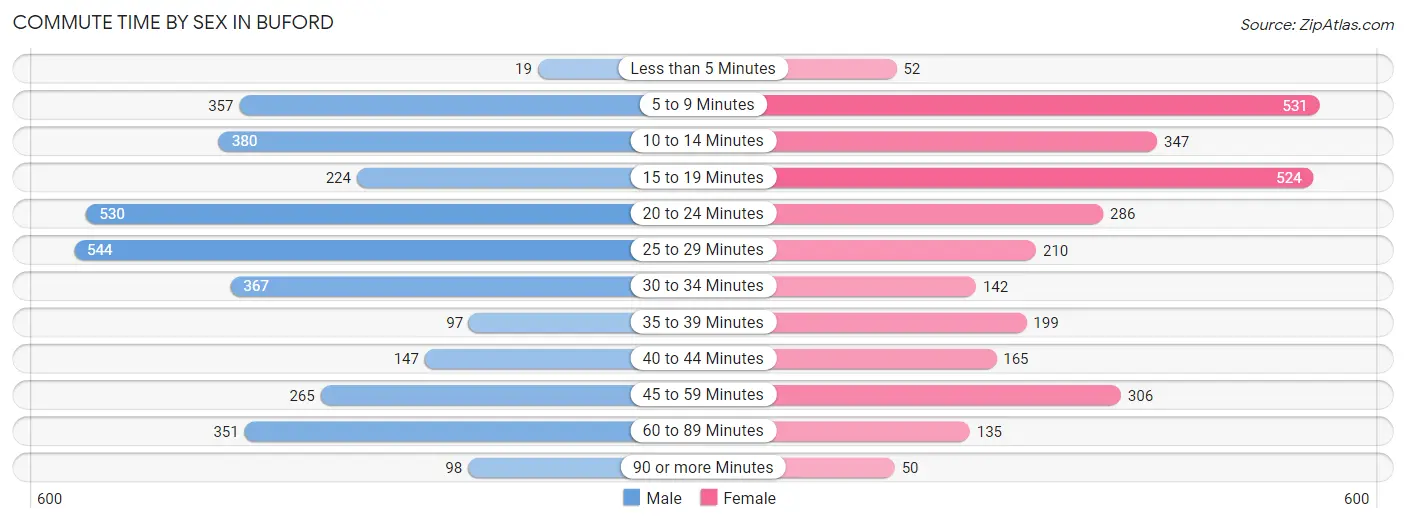
| Commute Time | Male | Female |
| Less than 5 Minutes | 19 (0.6%) | 52 (1.8%) |
| 5 to 9 Minutes | 357 (10.6%) | 531 (18.0%) |
| 10 to 14 Minutes | 380 (11.3%) | 347 (11.8%) |
| 15 to 19 Minutes | 224 (6.6%) | 524 (17.8%) |
| 20 to 24 Minutes | 530 (15.7%) | 286 (9.7%) |
| 25 to 29 Minutes | 544 (16.1%) | 210 (7.1%) |
| 30 to 34 Minutes | 367 (10.9%) | 142 (4.8%) |
| 35 to 39 Minutes | 97 (2.9%) | 199 (6.8%) |
| 40 to 44 Minutes | 147 (4.3%) | 165 (5.6%) |
| 45 to 59 Minutes | 265 (7.8%) | 306 (10.4%) |
| 60 to 89 Minutes | 351 (10.4%) | 135 (4.6%) |
| 90 or more Minutes | 98 (2.9%) | 50 (1.7%) |
Time of Departure to Work by Sex in Buford
The most frequent times of departure to work in Buford are 7:00 AM to 7:29 AM (729, 21.6%) for males and 8:00 AM to 8:29 AM (478, 16.2%) for females.
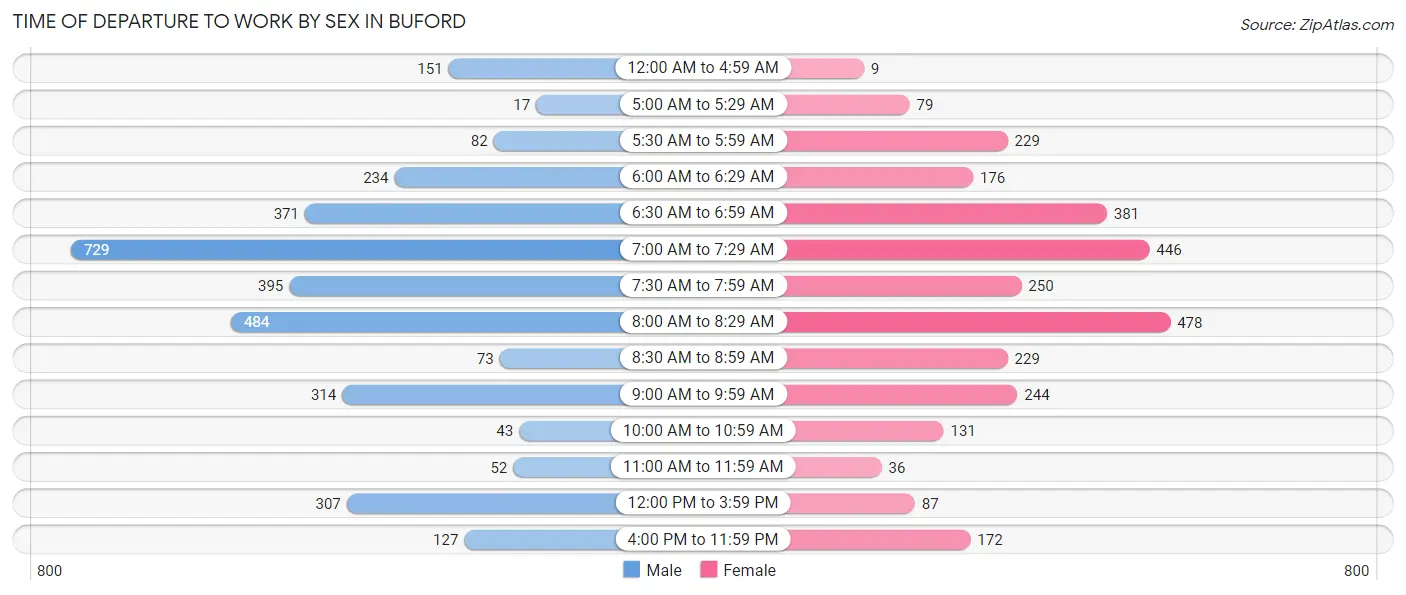
| Time of Departure | Male | Female |
| 12:00 AM to 4:59 AM | 151 (4.5%) | 9 (0.3%) |
| 5:00 AM to 5:29 AM | 17 (0.5%) | 79 (2.7%) |
| 5:30 AM to 5:59 AM | 82 (2.4%) | 229 (7.8%) |
| 6:00 AM to 6:29 AM | 234 (6.9%) | 176 (6.0%) |
| 6:30 AM to 6:59 AM | 371 (11.0%) | 381 (12.9%) |
| 7:00 AM to 7:29 AM | 729 (21.6%) | 446 (15.1%) |
| 7:30 AM to 7:59 AM | 395 (11.7%) | 250 (8.5%) |
| 8:00 AM to 8:29 AM | 484 (14.3%) | 478 (16.2%) |
| 8:30 AM to 8:59 AM | 73 (2.2%) | 229 (7.8%) |
| 9:00 AM to 9:59 AM | 314 (9.3%) | 244 (8.3%) |
| 10:00 AM to 10:59 AM | 43 (1.3%) | 131 (4.4%) |
| 11:00 AM to 11:59 AM | 52 (1.5%) | 36 (1.2%) |
| 12:00 PM to 3:59 PM | 307 (9.1%) | 87 (2.9%) |
| 4:00 PM to 11:59 PM | 127 (3.8%) | 172 (5.8%) |
| Total | 3,379 (100.0%) | 2,947 (100.0%) |
Housing Occupancy in Buford
Occupancy by Ownership in Buford
Of the total 5,019 dwellings in Buford, owner-occupied units account for 3,618 (72.1%), while renter-occupied units make up 1,401 (27.9%).
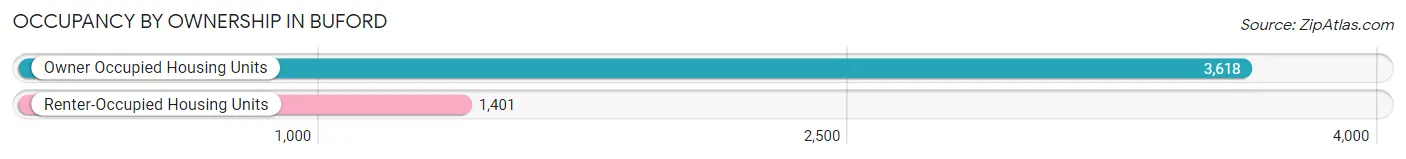
| Occupancy | # Housing Units | % Housing Units |
| Owner Occupied Housing Units | 3,618 | 72.1% |
| Renter-Occupied Housing Units | 1,401 | 27.9% |
| Total Occupied Housing Units | 5,019 | 100.0% |
Occupancy by Household Size in Buford
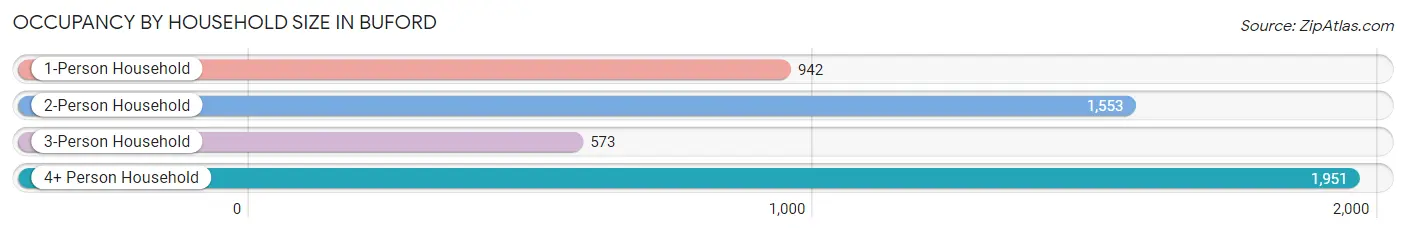
| Household Size | # Housing Units | % Housing Units |
| 1-Person Household | 942 | 18.8% |
| 2-Person Household | 1,553 | 30.9% |
| 3-Person Household | 573 | 11.4% |
| 4+ Person Household | 1,951 | 38.9% |
| Total Housing Units | 5,019 | 100.0% |
Occupancy by Ownership by Household Size in Buford
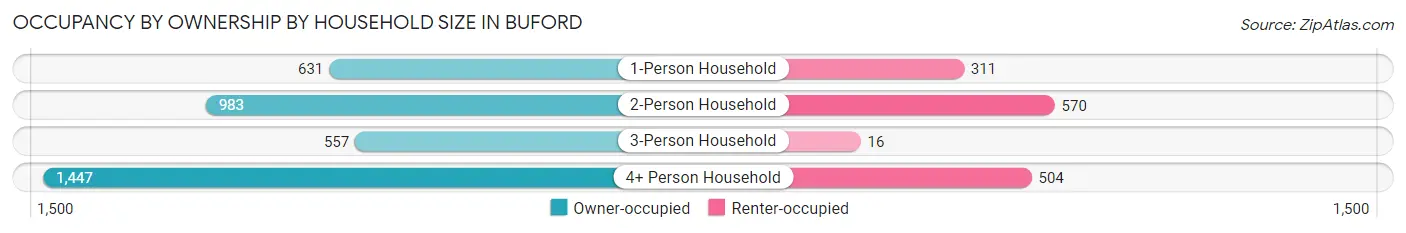
| Household Size | Owner-occupied | Renter-occupied |
| 1-Person Household | 631 (67.0%) | 311 (33.0%) |
| 2-Person Household | 983 (63.3%) | 570 (36.7%) |
| 3-Person Household | 557 (97.2%) | 16 (2.8%) |
| 4+ Person Household | 1,447 (74.2%) | 504 (25.8%) |
| Total Housing Units | 3,618 (72.1%) | 1,401 (27.9%) |
Occupancy by Educational Attainment in Buford
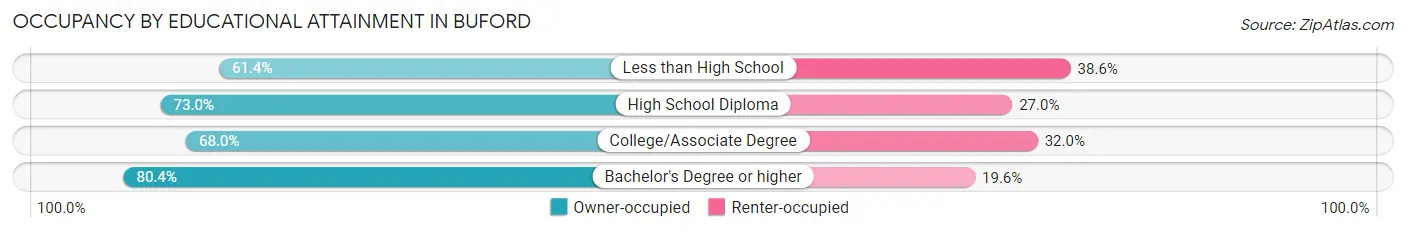
| Household Size | Owner-occupied | Renter-occupied |
| Less than High School | 505 (61.4%) | 317 (38.6%) |
| High School Diploma | 1,012 (73.0%) | 374 (27.0%) |
| College/Associate Degree | 868 (68.0%) | 409 (32.0%) |
| Bachelor's Degree or higher | 1,233 (80.4%) | 301 (19.6%) |
Occupancy by Age of Householder in Buford
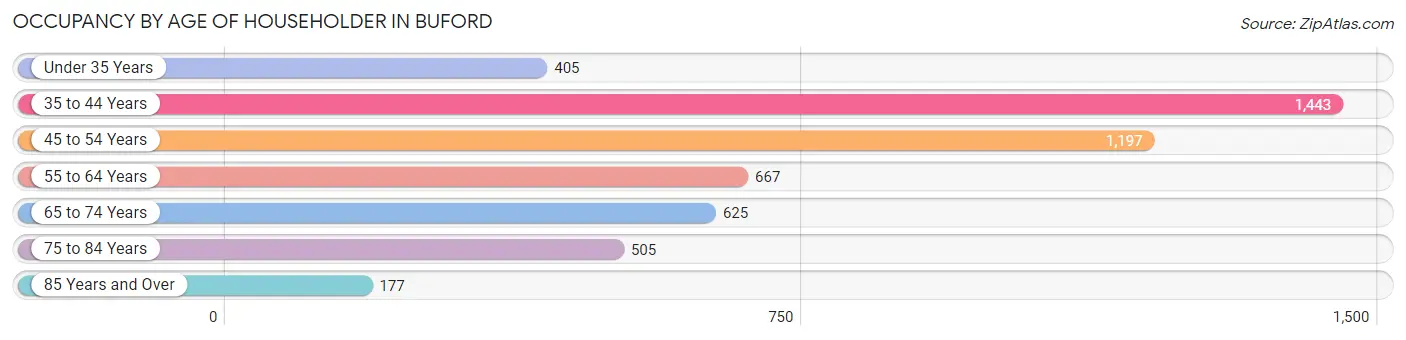
| Age Bracket | # Households | % Households |
| Under 35 Years | 405 | 8.1% |
| 35 to 44 Years | 1,443 | 28.7% |
| 45 to 54 Years | 1,197 | 23.8% |
| 55 to 64 Years | 667 | 13.3% |
| 65 to 74 Years | 625 | 12.4% |
| 75 to 84 Years | 505 | 10.1% |
| 85 Years and Over | 177 | 3.5% |
| Total | 5,019 | 100.0% |
Housing Finances in Buford
Median Income by Occupancy in Buford
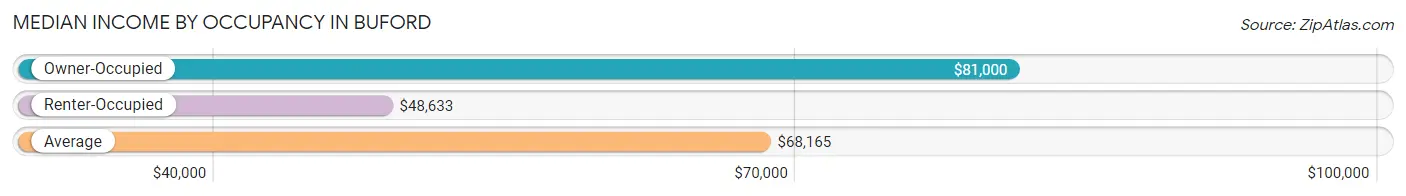
| Occupancy Type | # Households | Median Income |
| Owner-Occupied | 3,618 (72.1%) | $81,000 |
| Renter-Occupied | 1,401 (27.9%) | $48,633 |
| Average | 5,019 (100.0%) | $68,165 |
Occupancy by Householder Income Bracket in Buford
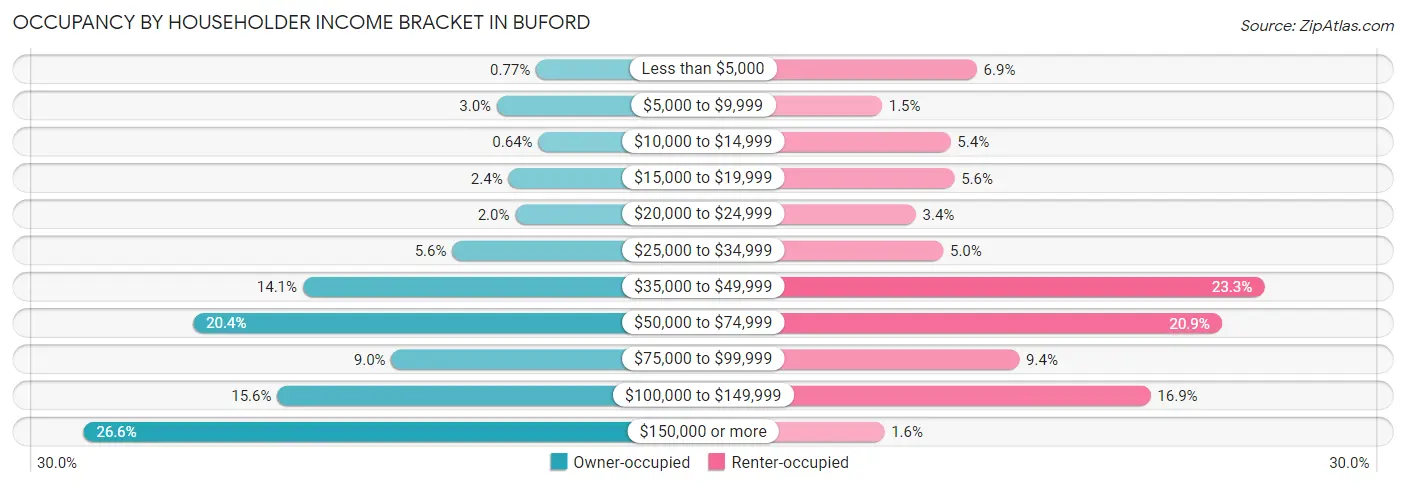
| Income Bracket | Owner-occupied | Renter-occupied |
| Less than $5,000 | 28 (0.8%) | 97 (6.9%) |
| $5,000 to $9,999 | 109 (3.0%) | 21 (1.5%) |
| $10,000 to $14,999 | 23 (0.6%) | 76 (5.4%) |
| $15,000 to $19,999 | 85 (2.4%) | 79 (5.6%) |
| $20,000 to $24,999 | 71 (2.0%) | 48 (3.4%) |
| $25,000 to $34,999 | 201 (5.6%) | 70 (5.0%) |
| $35,000 to $49,999 | 510 (14.1%) | 327 (23.3%) |
| $50,000 to $74,999 | 737 (20.4%) | 293 (20.9%) |
| $75,000 to $99,999 | 327 (9.0%) | 131 (9.3%) |
| $100,000 to $149,999 | 563 (15.6%) | 236 (16.9%) |
| $150,000 or more | 964 (26.6%) | 23 (1.6%) |
| Total | 3,618 (100.0%) | 1,401 (100.0%) |
Monthly Housing Cost Tiers in Buford
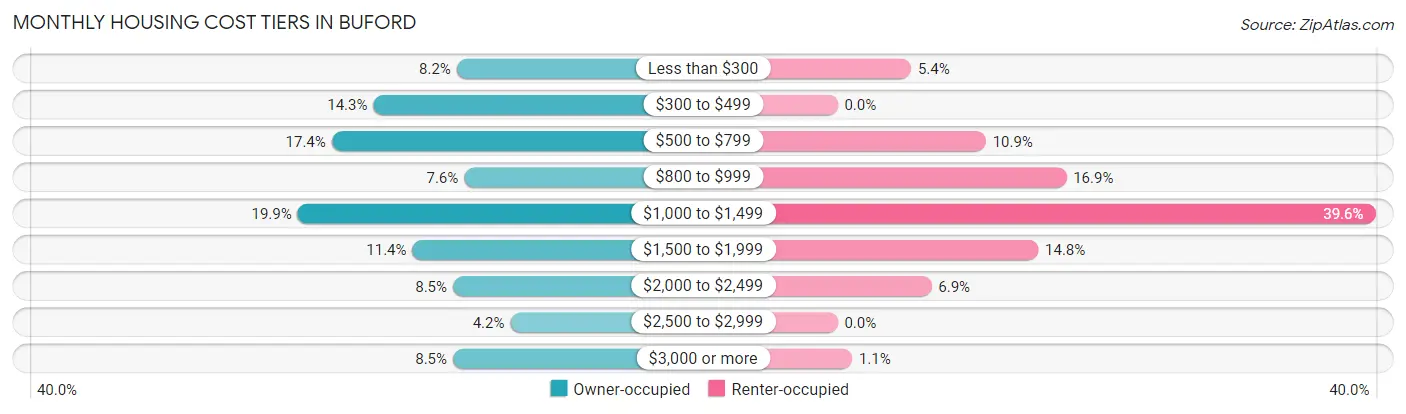
| Monthly Cost | Owner-occupied | Renter-occupied |
| Less than $300 | 296 (8.2%) | 76 (5.4%) |
| $300 to $499 | 518 (14.3%) | 0 (0.0%) |
| $500 to $799 | 629 (17.4%) | 153 (10.9%) |
| $800 to $999 | 276 (7.6%) | 236 (16.9%) |
| $1,000 to $1,499 | 720 (19.9%) | 555 (39.6%) |
| $1,500 to $1,999 | 414 (11.4%) | 207 (14.8%) |
| $2,000 to $2,499 | 306 (8.5%) | 97 (6.9%) |
| $2,500 to $2,999 | 153 (4.2%) | 0 (0.0%) |
| $3,000 or more | 306 (8.5%) | 15 (1.1%) |
| Total | 3,618 (100.0%) | 1,401 (100.0%) |
Physical Housing Characteristics in Buford
Housing Structures in Buford
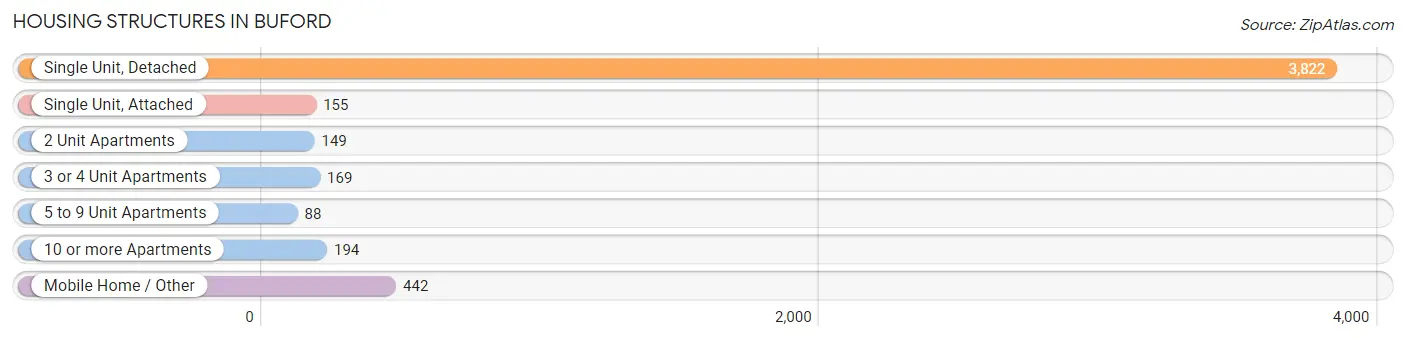
| Structure Type | # Housing Units | % Housing Units |
| Single Unit, Detached | 3,822 | 76.1% |
| Single Unit, Attached | 155 | 3.1% |
| 2 Unit Apartments | 149 | 3.0% |
| 3 or 4 Unit Apartments | 169 | 3.4% |
| 5 to 9 Unit Apartments | 88 | 1.8% |
| 10 or more Apartments | 194 | 3.9% |
| Mobile Home / Other | 442 | 8.8% |
| Total | 5,019 | 100.0% |
Housing Structures by Occupancy in Buford
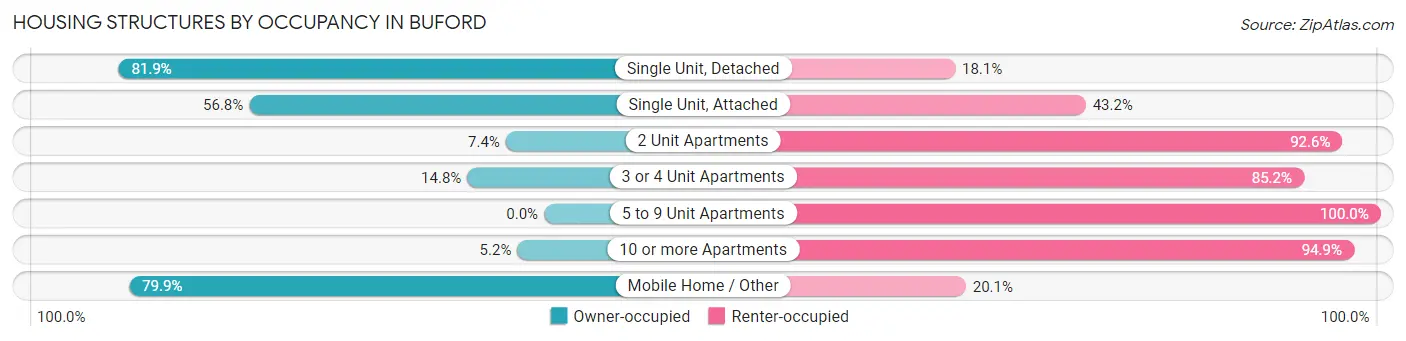
| Structure Type | Owner-occupied | Renter-occupied |
| Single Unit, Detached | 3,131 (81.9%) | 691 (18.1%) |
| Single Unit, Attached | 88 (56.8%) | 67 (43.2%) |
| 2 Unit Apartments | 11 (7.4%) | 138 (92.6%) |
| 3 or 4 Unit Apartments | 25 (14.8%) | 144 (85.2%) |
| 5 to 9 Unit Apartments | 0 (0.0%) | 88 (100.0%) |
| 10 or more Apartments | 10 (5.1%) | 184 (94.9%) |
| Mobile Home / Other | 353 (79.9%) | 89 (20.1%) |
| Total | 3,618 (72.1%) | 1,401 (27.9%) |
Housing Structures by Number of Rooms in Buford
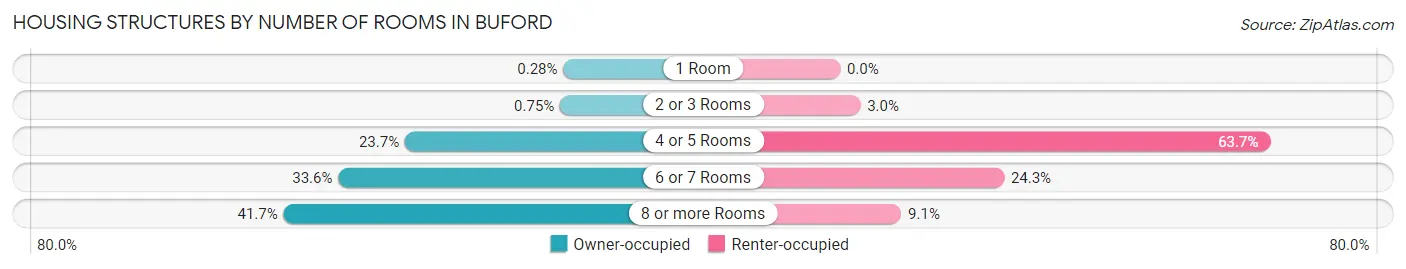
| Number of Rooms | Owner-occupied | Renter-occupied |
| 1 Room | 10 (0.3%) | 0 (0.0%) |
| 2 or 3 Rooms | 27 (0.7%) | 42 (3.0%) |
| 4 or 5 Rooms | 858 (23.7%) | 892 (63.7%) |
| 6 or 7 Rooms | 1,215 (33.6%) | 340 (24.3%) |
| 8 or more Rooms | 1,508 (41.7%) | 127 (9.1%) |
| Total | 3,618 (100.0%) | 1,401 (100.0%) |
Housing Structure by Heating Type in Buford
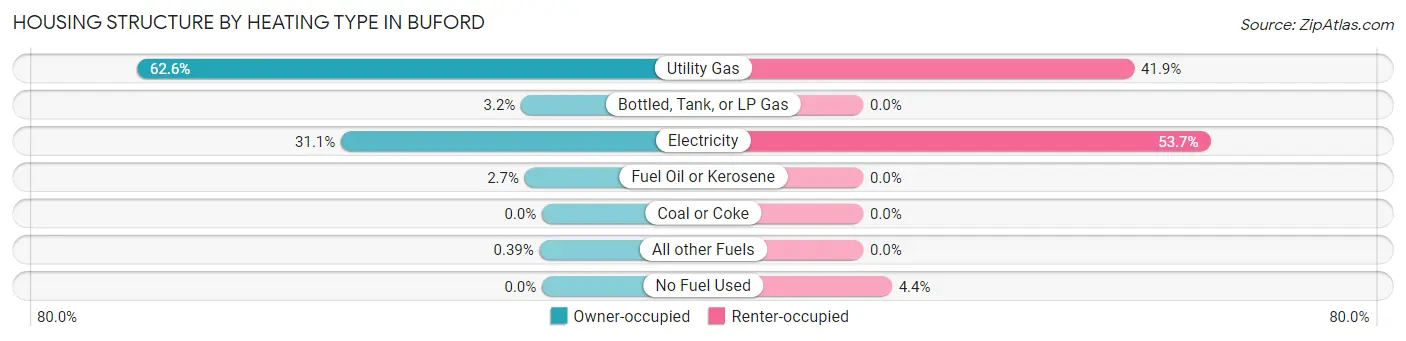
| Heating Type | Owner-occupied | Renter-occupied |
| Utility Gas | 2,266 (62.6%) | 587 (41.9%) |
| Bottled, Tank, or LP Gas | 117 (3.2%) | 0 (0.0%) |
| Electricity | 1,124 (31.1%) | 752 (53.7%) |
| Fuel Oil or Kerosene | 97 (2.7%) | 0 (0.0%) |
| Coal or Coke | 0 (0.0%) | 0 (0.0%) |
| All other Fuels | 14 (0.4%) | 0 (0.0%) |
| No Fuel Used | 0 (0.0%) | 62 (4.4%) |
| Total | 3,618 (100.0%) | 1,401 (100.0%) |
Household Vehicle Usage in Buford
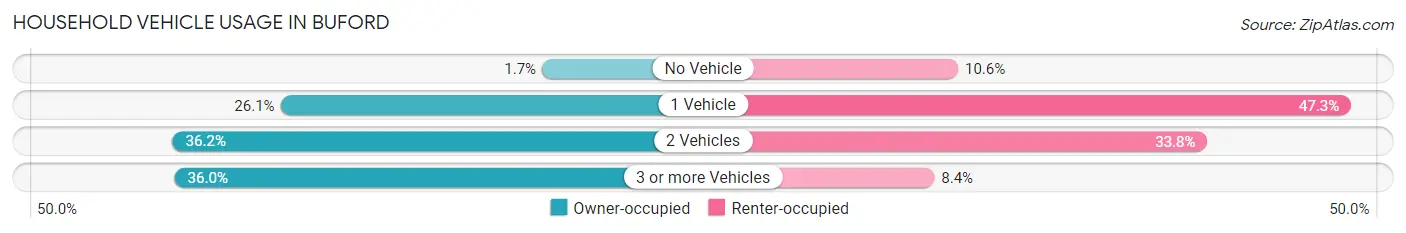
| Vehicles per Household | Owner-occupied | Renter-occupied |
| No Vehicle | 62 (1.7%) | 148 (10.6%) |
| 1 Vehicle | 945 (26.1%) | 662 (47.2%) |
| 2 Vehicles | 1,309 (36.2%) | 474 (33.8%) |
| 3 or more Vehicles | 1,302 (36.0%) | 117 (8.4%) |
| Total | 3,618 (100.0%) | 1,401 (100.0%) |
Real Estate & Mortgages in Buford
Real Estate and Mortgage Overview in Buford
| Characteristic | Without Mortgage | With Mortgage |
| Housing Units | 1,504 | 2,114 |
| Median Property Value | $243,000 | $354,200 |
| Median Household Income | $54,853 | $757 |
| Monthly Housing Costs | $491 | $306 |
| Real Estate Taxes | $979 | $26 |
Property Value by Mortgage Status in Buford
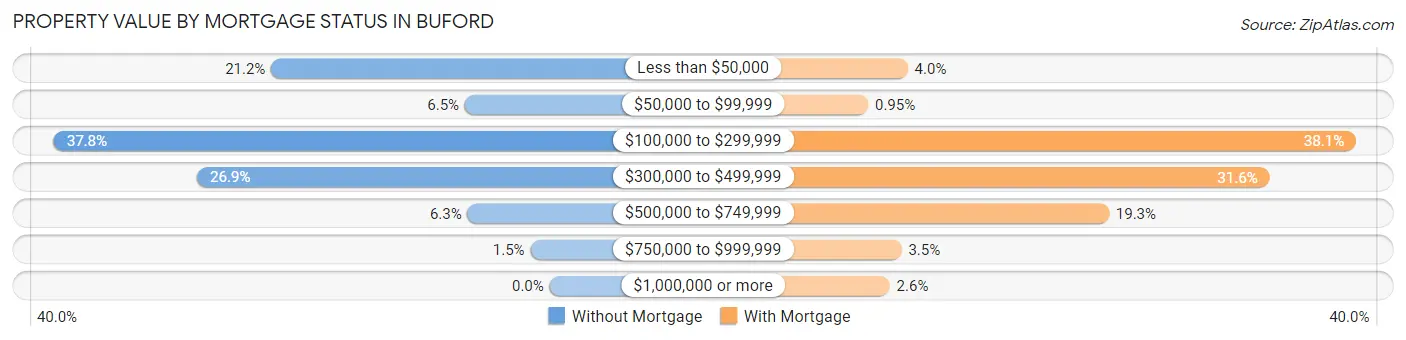
| Property Value | Without Mortgage | With Mortgage |
| Less than $50,000 | 319 (21.2%) | 84 (4.0%) |
| $50,000 to $99,999 | 97 (6.5%) | 20 (0.9%) |
| $100,000 to $299,999 | 568 (37.8%) | 806 (38.1%) |
| $300,000 to $499,999 | 404 (26.9%) | 667 (31.6%) |
| $500,000 to $749,999 | 94 (6.2%) | 408 (19.3%) |
| $750,000 to $999,999 | 22 (1.5%) | 74 (3.5%) |
| $1,000,000 or more | 0 (0.0%) | 55 (2.6%) |
| Total | 1,504 (100.0%) | 2,114 (100.0%) |
Household Income by Mortgage Status in Buford
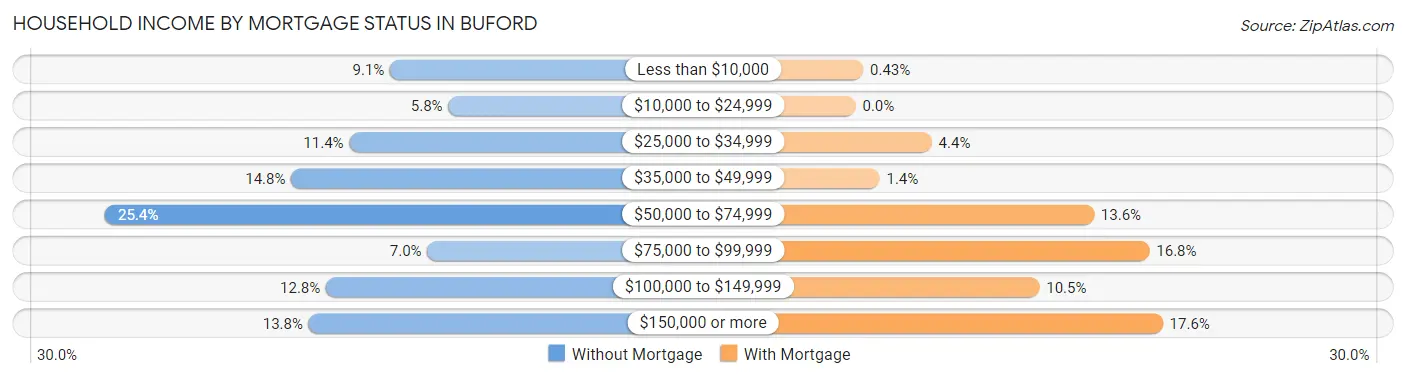
| Household Income | Without Mortgage | With Mortgage |
| Less than $10,000 | 137 (9.1%) | 9 (0.4%) |
| $10,000 to $24,999 | 87 (5.8%) | 0 (0.0%) |
| $25,000 to $34,999 | 172 (11.4%) | 92 (4.3%) |
| $35,000 to $49,999 | 222 (14.8%) | 29 (1.4%) |
| $50,000 to $74,999 | 382 (25.4%) | 288 (13.6%) |
| $75,000 to $99,999 | 105 (7.0%) | 355 (16.8%) |
| $100,000 to $149,999 | 192 (12.8%) | 222 (10.5%) |
| $150,000 or more | 207 (13.8%) | 371 (17.5%) |
| Total | 1,504 (100.0%) | 2,114 (100.0%) |
Property Value to Household Income Ratio in Buford
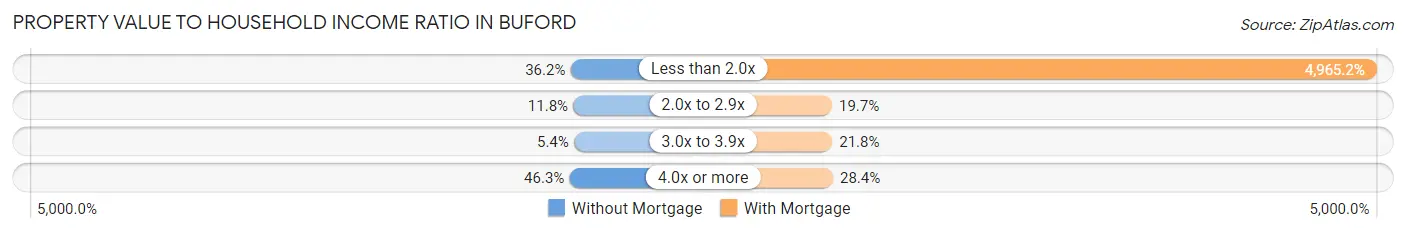
| Value-to-Income Ratio | Without Mortgage | With Mortgage |
| Less than 2.0x | 545 (36.2%) | 104,965 (4,965.2%) |
| 2.0x to 2.9x | 178 (11.8%) | 416 (19.7%) |
| 3.0x to 3.9x | 81 (5.4%) | 460 (21.8%) |
| 4.0x or more | 696 (46.3%) | 601 (28.4%) |
| Total | 1,504 (100.0%) | 2,114 (100.0%) |
Real Estate Taxes by Mortgage Status in Buford
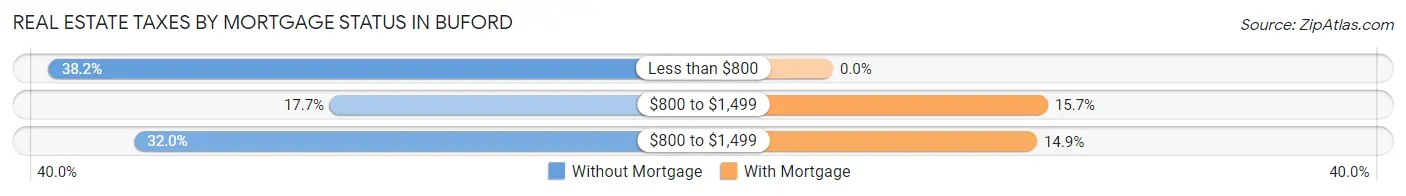
| Property Taxes | Without Mortgage | With Mortgage |
| Less than $800 | 575 (38.2%) | 0 (0.0%) |
| $800 to $1,499 | 266 (17.7%) | 332 (15.7%) |
| $800 to $1,499 | 481 (32.0%) | 315 (14.9%) |
| Total | 1,504 (100.0%) | 2,114 (100.0%) |
Health & Disability in Buford
Health Insurance Coverage by Age in Buford
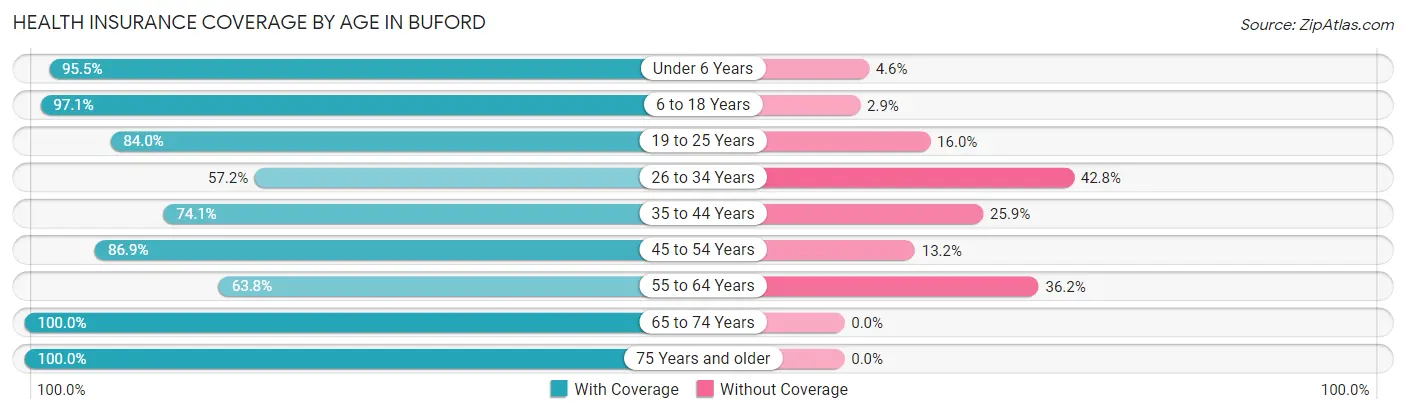
| Age Bracket | With Coverage | Without Coverage |
| Under 6 Years | 1,302 (95.5%) | 62 (4.5%) |
| 6 to 18 Years | 4,290 (97.1%) | 130 (2.9%) |
| 19 to 25 Years | 1,186 (84.0%) | 226 (16.0%) |
| 26 to 34 Years | 623 (57.2%) | 466 (42.8%) |
| 35 to 44 Years | 2,135 (74.1%) | 746 (25.9%) |
| 45 to 54 Years | 2,041 (86.9%) | 309 (13.2%) |
| 55 to 64 Years | 924 (63.8%) | 525 (36.2%) |
| 65 to 74 Years | 1,077 (100.0%) | 0 (0.0%) |
| 75 Years and older | 1,039 (100.0%) | 0 (0.0%) |
| Total | 14,617 (85.6%) | 2,464 (14.4%) |
Health Insurance Coverage by Citizenship Status in Buford

| Citizenship Status | With Coverage | Without Coverage |
| Native Born | 1,302 (95.5%) | 62 (4.5%) |
| Foreign Born, Citizen | 4,290 (97.1%) | 130 (2.9%) |
| Foreign Born, not a Citizen | 1,186 (84.0%) | 226 (16.0%) |
Health Insurance Coverage by Household Income in Buford
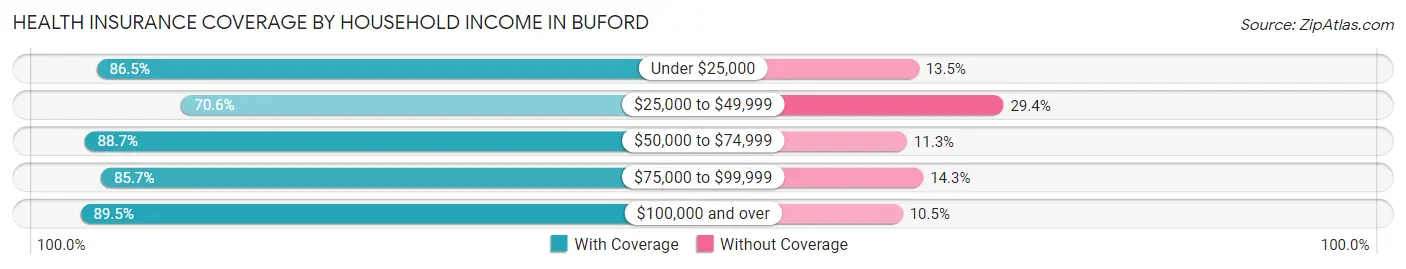
| Household Income | With Coverage | Without Coverage |
| Under $25,000 | 1,079 (86.5%) | 168 (13.5%) |
| $25,000 to $49,999 | 2,004 (70.6%) | 833 (29.4%) |
| $50,000 to $74,999 | 3,019 (88.7%) | 383 (11.3%) |
| $75,000 to $99,999 | 1,430 (85.7%) | 239 (14.3%) |
| $100,000 and over | 7,024 (89.5%) | 822 (10.5%) |
Public vs Private Health Insurance Coverage by Age in Buford
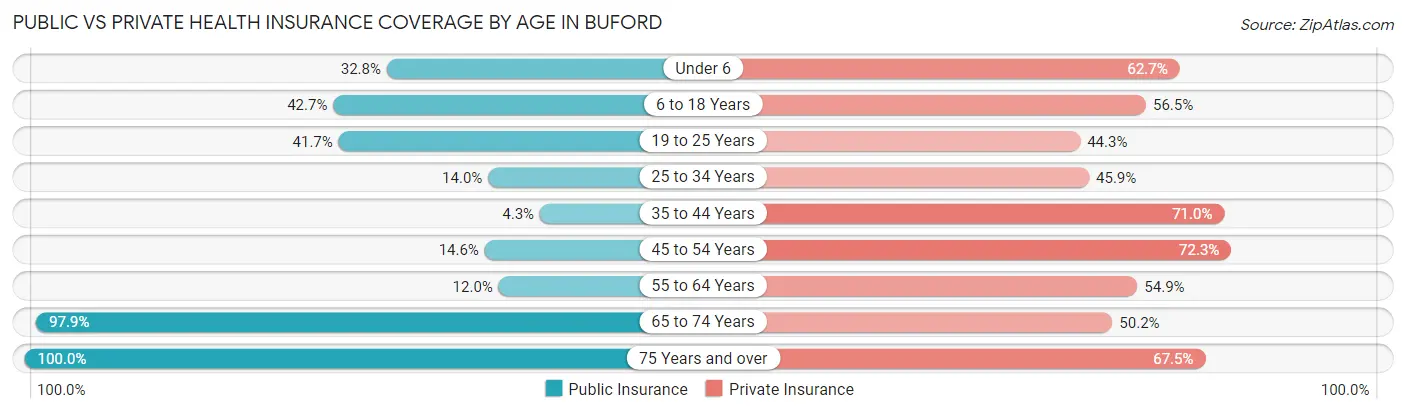
| Age Bracket | Public Insurance | Private Insurance |
| Under 6 | 447 (32.8%) | 855 (62.7%) |
| 6 to 18 Years | 1,888 (42.7%) | 2,496 (56.5%) |
| 19 to 25 Years | 589 (41.7%) | 625 (44.3%) |
| 25 to 34 Years | 152 (14.0%) | 500 (45.9%) |
| 35 to 44 Years | 125 (4.3%) | 2,045 (71.0%) |
| 45 to 54 Years | 343 (14.6%) | 1,698 (72.3%) |
| 55 to 64 Years | 174 (12.0%) | 795 (54.9%) |
| 65 to 74 Years | 1,054 (97.9%) | 541 (50.2%) |
| 75 Years and over | 1,039 (100.0%) | 701 (67.5%) |
| Total | 5,811 (34.0%) | 10,256 (60.0%) |
Disability Status by Sex by Age in Buford
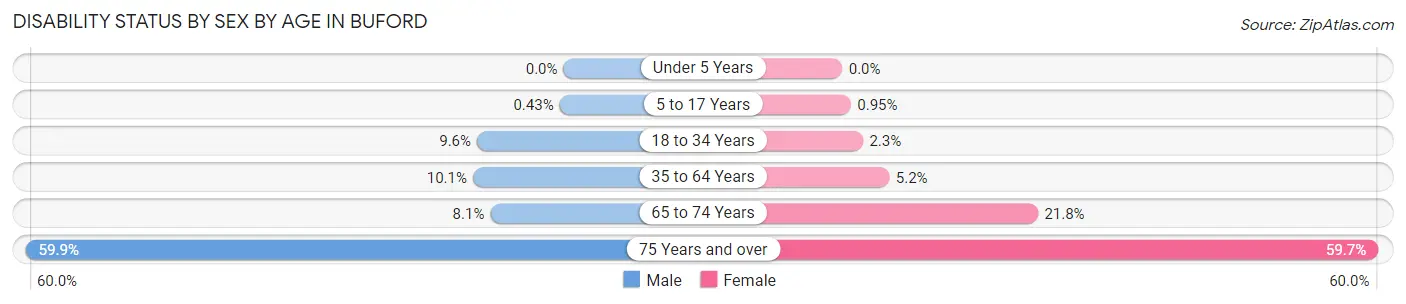
| Age Bracket | Male | Female |
| Under 5 Years | 0 (0.0%) | 0 (0.0%) |
| 5 to 17 Years | 11 (0.4%) | 17 (0.9%) |
| 18 to 34 Years | 97 (9.6%) | 40 (2.3%) |
| 35 to 64 Years | 333 (10.1%) | 177 (5.2%) |
| 65 to 74 Years | 35 (8.1%) | 141 (21.8%) |
| 75 Years and over | 197 (59.9%) | 424 (59.7%) |
Disability Class by Sex by Age in Buford
Disability Class: Hearing Difficulty
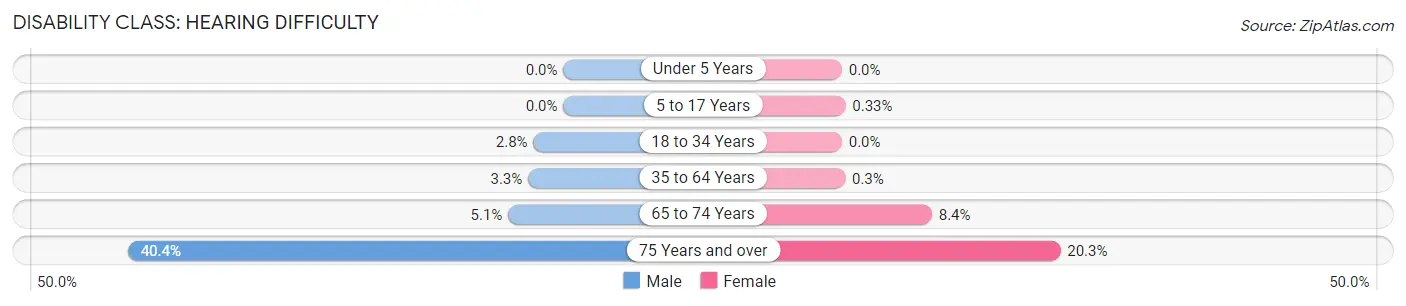
| Age Bracket | Male | Female |
| Under 5 Years | 0 (0.0%) | 0 (0.0%) |
| 5 to 17 Years | 0 (0.0%) | 6 (0.3%) |
| 18 to 34 Years | 28 (2.8%) | 0 (0.0%) |
| 35 to 64 Years | 108 (3.3%) | 10 (0.3%) |
| 65 to 74 Years | 22 (5.1%) | 54 (8.4%) |
| 75 Years and over | 133 (40.4%) | 144 (20.3%) |
Disability Class: Vision Difficulty
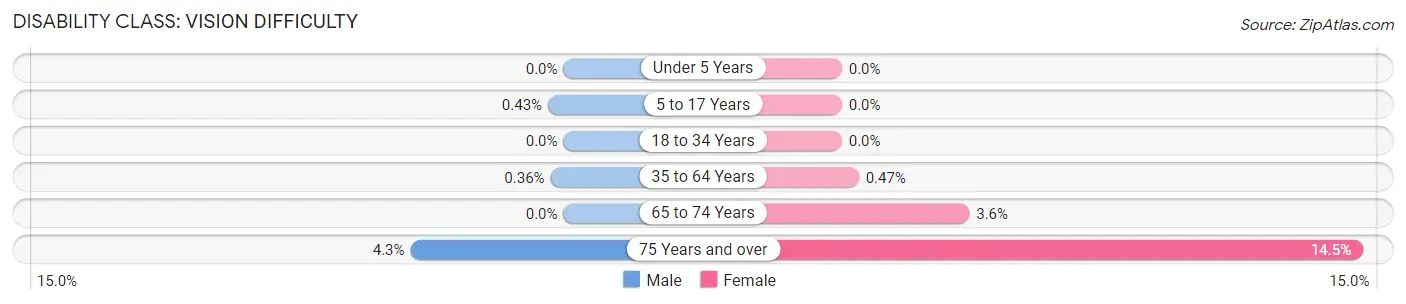
| Age Bracket | Male | Female |
| Under 5 Years | 0 (0.0%) | 0 (0.0%) |
| 5 to 17 Years | 11 (0.4%) | 0 (0.0%) |
| 18 to 34 Years | 0 (0.0%) | 0 (0.0%) |
| 35 to 64 Years | 12 (0.4%) | 16 (0.5%) |
| 65 to 74 Years | 0 (0.0%) | 23 (3.5%) |
| 75 Years and over | 14 (4.3%) | 103 (14.5%) |
Disability Class: Cognitive Difficulty
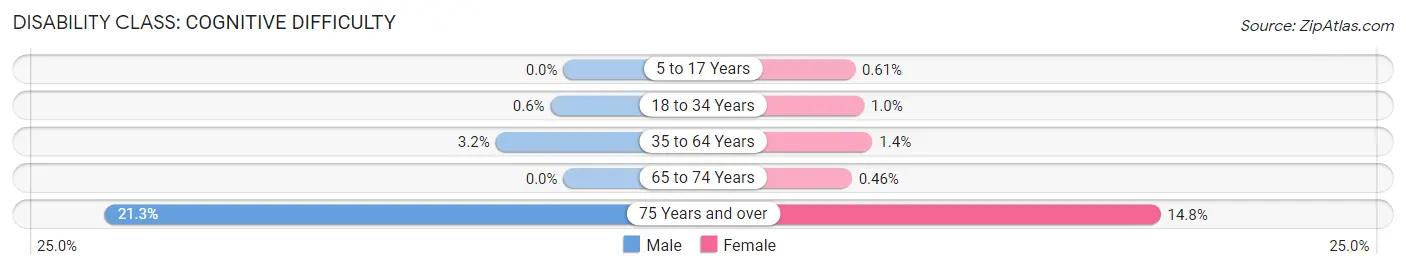
| Age Bracket | Male | Female |
| 5 to 17 Years | 0 (0.0%) | 11 (0.6%) |
| 18 to 34 Years | 6 (0.6%) | 18 (1.0%) |
| 35 to 64 Years | 104 (3.2%) | 48 (1.4%) |
| 65 to 74 Years | 0 (0.0%) | 3 (0.5%) |
| 75 Years and over | 70 (21.3%) | 105 (14.8%) |
Disability Class: Ambulatory Difficulty
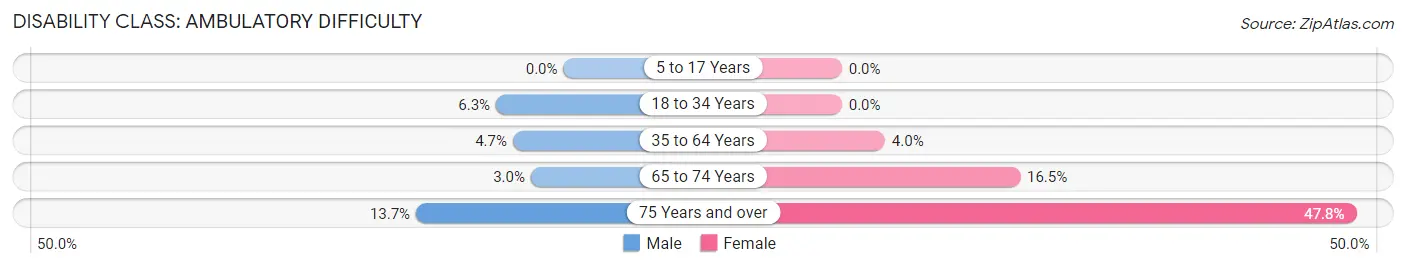
| Age Bracket | Male | Female |
| 5 to 17 Years | 0 (0.0%) | 0 (0.0%) |
| 18 to 34 Years | 63 (6.3%) | 0 (0.0%) |
| 35 to 64 Years | 155 (4.7%) | 135 (4.0%) |
| 65 to 74 Years | 13 (3.0%) | 107 (16.5%) |
| 75 Years and over | 45 (13.7%) | 339 (47.7%) |
Disability Class: Self-Care Difficulty
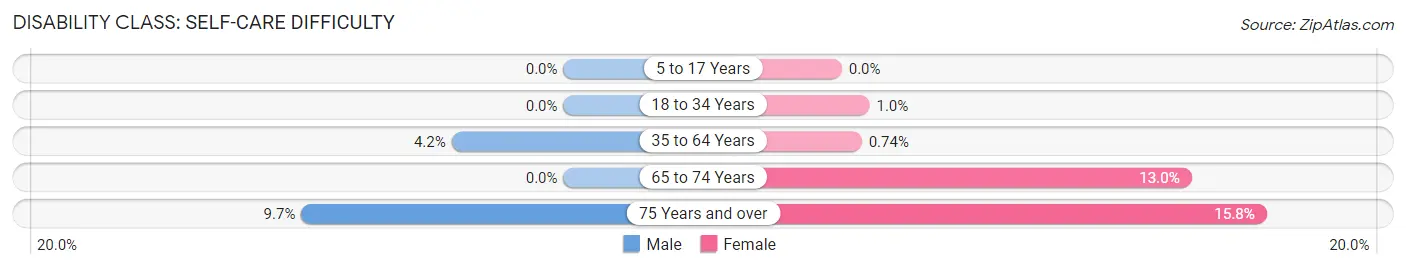
| Age Bracket | Male | Female |
| 5 to 17 Years | 0 (0.0%) | 0 (0.0%) |
| 18 to 34 Years | 0 (0.0%) | 18 (1.0%) |
| 35 to 64 Years | 137 (4.2%) | 25 (0.7%) |
| 65 to 74 Years | 0 (0.0%) | 84 (13.0%) |
| 75 Years and over | 32 (9.7%) | 112 (15.8%) |
Technology Access in Buford
Computing Device Access in Buford
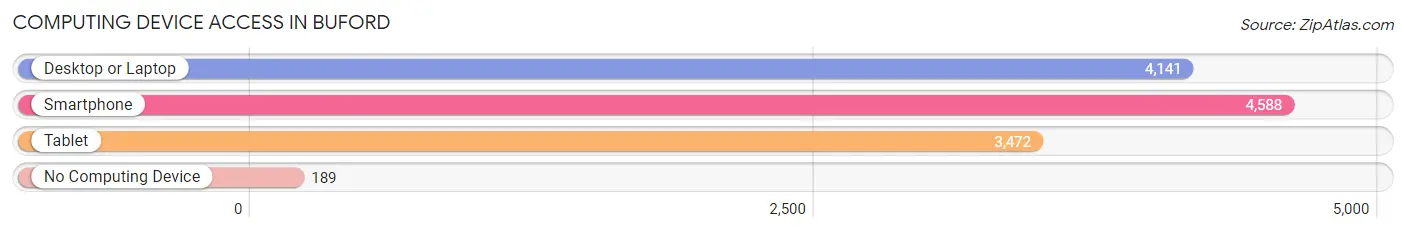
| Device Type | # Households | % Households |
| Desktop or Laptop | 4,141 | 82.5% |
| Smartphone | 4,588 | 91.4% |
| Tablet | 3,472 | 69.2% |
| No Computing Device | 189 | 3.8% |
| Total | 5,019 | 100.0% |
Internet Access in Buford
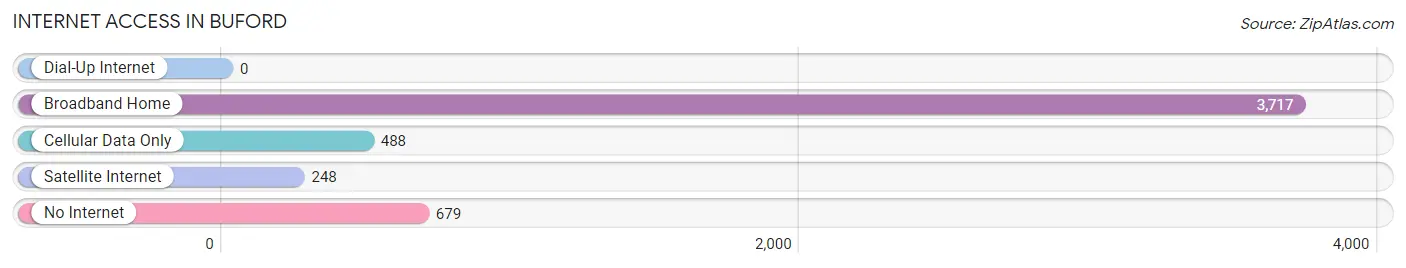
| Internet Type | # Households | % Households |
| Dial-Up Internet | 0 | 0.0% |
| Broadband Home | 3,717 | 74.1% |
| Cellular Data Only | 488 | 9.7% |
| Satellite Internet | 248 | 4.9% |
| No Internet | 679 | 13.5% |
| Total | 5,019 | 100.0% |
Buford Summary
Buford, Georgia is a city located in Gwinnett and Hall counties in the state of Georgia. It is a suburb of Atlanta and is located about 40 miles northeast of the city. The city is part of the Atlanta metropolitan area and has a population of approximately 13,000 people.
Geography
Buford is located in the foothills of the Blue Ridge Mountains and is situated along the banks of the Chattahoochee River. The city is located in the Piedmont region of Georgia and is part of the Atlanta metropolitan area. The city is located in both Gwinnett and Hall counties and is bordered by the cities of Suwanee, Sugar Hill, and Flowery Branch. The city has a total area of 8.3 square miles, of which 8.2 square miles is land and 0.1 square miles is water.
History
The area that is now Buford was first settled in the early 1800s by settlers from North Carolina. The city was named after Algernon Sidney Buford, who was a railroad executive and the president of the Atlanta and Richmond Air-Line Railway. The city was incorporated in 1872 and was originally a farming community. In the late 19th century, the city began to grow as a result of the railroad and the development of the cotton industry.
In the early 20th century, the city experienced a period of growth and development as a result of the construction of the Buford Dam. The dam was built in the 1950s and provided hydroelectric power to the area. The city also experienced a period of growth in the 1970s and 1980s as a result of the growth of the Atlanta metropolitan area.
Economy
The economy of Buford is largely based on the service industry. The city is home to several large retail stores, including Walmart, Target, and Home Depot. The city is also home to several manufacturing companies, including Buford Manufacturing, which produces automotive parts. The city is also home to several restaurants and other businesses.
Demographics
As of the 2010 census, the population of Buford was 13,225. The racial makeup of the city was 79.2% White, 11.2% African American, 0.3% Native American, 4.2% Asian, 0.1% Pacific Islander, 2.2% from other races, and 2.9% from two or more races. The median household income in Buford was $60,945 in 2019. The median age of the population was 36.7 years.
Conclusion
Buford, Georgia is a city located in Gwinnett and Hall counties in the state of Georgia. It is a suburb of Atlanta and is located about 40 miles northeast of the city. The city is part of the Atlanta metropolitan area and has a population of approximately 13,000 people. The economy of Buford is largely based on the service industry and the city is home to several large retail stores, manufacturing companies, and restaurants. The population of Buford is largely white and the median household income in 2019 was $60,945.
Common Questions
What is Per Capita Income in Buford?
Per Capita income in Buford is $28,751.
What is the Median Family Income in Buford?
Median Family Income in Buford is $75,917.
What is the Median Household income in Buford?
Median Household Income in Buford is $68,165.
What is Income or Wage Gap in Buford?
Income or Wage Gap in Buford is 35.6%.
Women in Buford earn 64.4 cents for every dollar earned by a man.
What is Inequality or Gini Index in Buford?
Inequality or Gini Index in Buford is 0.43.
What is the Total Population of Buford?
Total Population of Buford is 17,222.
What is the Total Male Population of Buford?
Total Male Population of Buford is 8,322.
What is the Total Female Population of Buford?
Total Female Population of Buford is 8,900.
What is the Ratio of Males per 100 Females in Buford?
There are 93.51 Males per 100 Females in Buford.
What is the Ratio of Females per 100 Males in Buford?
There are 106.95 Females per 100 Males in Buford.
What is the Median Population Age in Buford?
Median Population Age in Buford is 35.6 Years.
What is the Average Family Size in Buford
Average Family Size in Buford is 3.9 People.
What is the Average Household Size in Buford
Average Household Size in Buford is 3.4 People.
How Large is the Labor Force in Buford?
There are 7,391 People in the Labor Forcein in Buford.
What is the Percentage of People in the Labor Force in Buford?
60.2% of People are in the Labor Force in Buford.
What is the Unemployment Rate in Buford?
Unemployment Rate in Buford is 3.0%.