Christmas, FL Map & Demographics
Christmas Map
Christmas Overview
$39,586
PER CAPITA INCOME
$96,964
AVG FAMILY INCOME
$92,550
AVG HOUSEHOLD INCOME
7.1%
WAGE / INCOME GAP [ % ]
92.9¢/ $1
WAGE / INCOME GAP [ $ ]
0.39
INEQUALITY / GINI INDEX
1,545
TOTAL POPULATION
799
MALE POPULATION
746
FEMALE POPULATION
107.10
MALES / 100 FEMALES
93.37
FEMALES / 100 MALES
44.3
MEDIAN AGE
2.6
AVG FAMILY SIZE
2.4
AVG HOUSEHOLD SIZE
940
LABOR FORCE [ PEOPLE ]
69.6%
PERCENT IN LABOR FORCE
1.7%
UNEMPLOYMENT RATE
Christmas Zip Codes
Income in Christmas
Income Overview in Christmas
Per Capita Income in Christmas is $39,586, while median incomes of families and households are $96,964 and $92,550 respectively.
| Characteristic | Number | Measure |
| Per Capita Income | 1,545 | $39,586 |
| Median Family Income | 526 | $96,964 |
| Mean Family Income | 526 | $107,939 |
| Median Household Income | 633 | $92,550 |
| Mean Household Income | 633 | $97,663 |
| Income Deficit | 526 | $0 |
| Wage / Income Gap (%) | 1,545 | 7.12% |
| Wage / Income Gap ($) | 1,545 | 92.88¢ per $1 |
| Gini / Inequality Index | 1,545 | 0.39 |
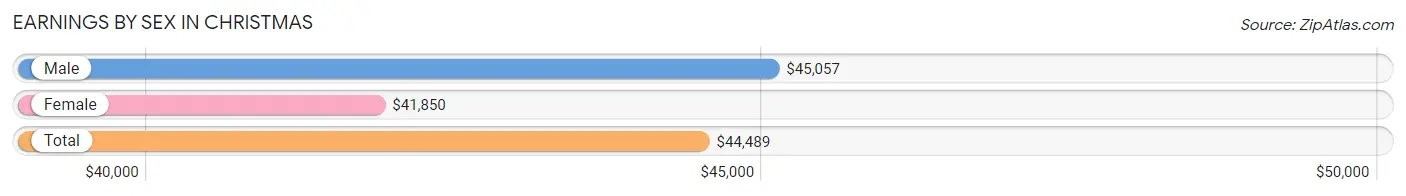
Earnings by Sex in Christmas
Average Earnings in Christmas are $44,489, $45,057 for men and $41,850 for women, a difference of 7.1%.
| Sex | Number | Average Earnings |
| Male | 462 (47.6%) | $45,057 |
| Female | 509 (52.4%) | $41,850 |
| Total | 971 (100.0%) | $44,489 |
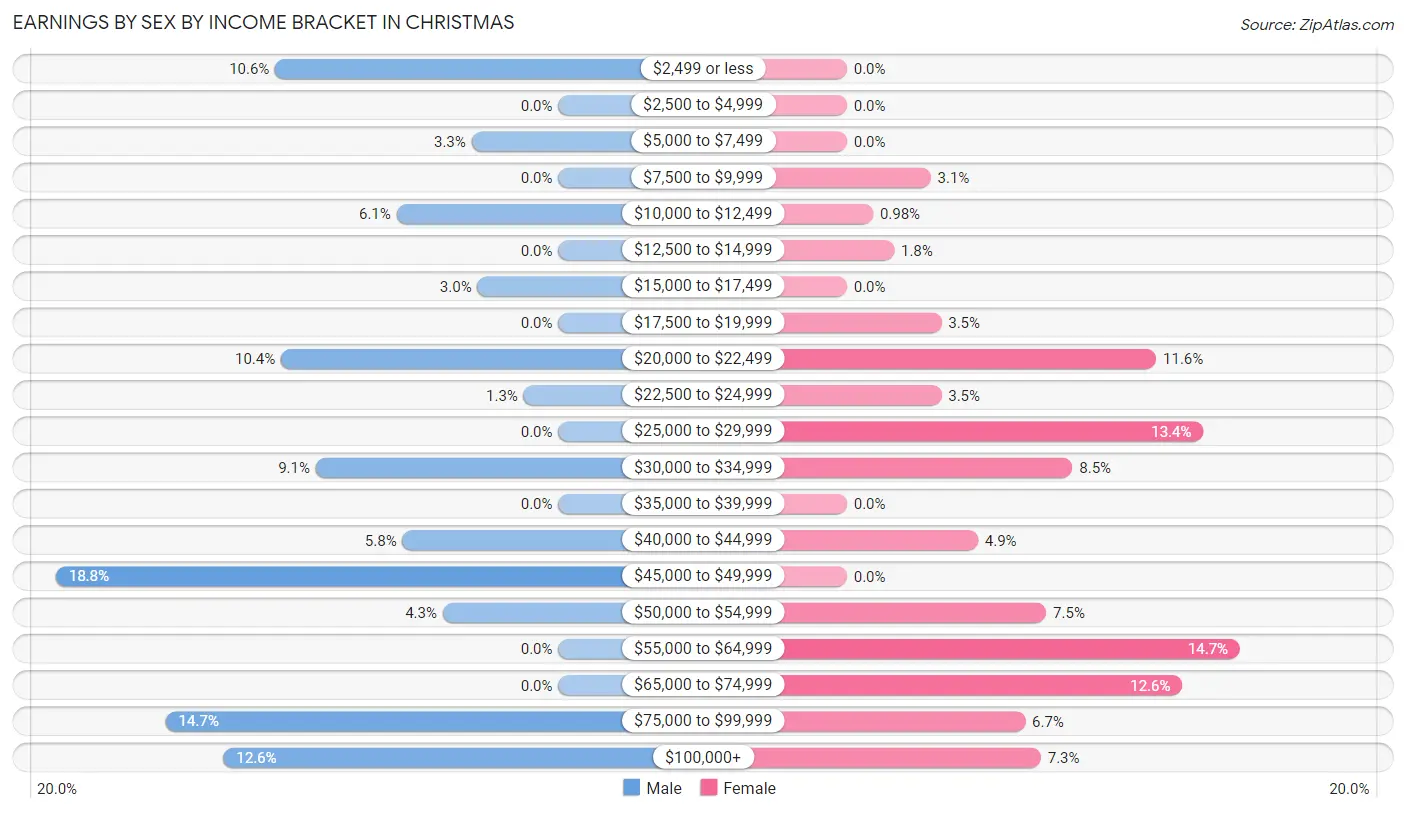
Earnings by Sex by Income Bracket in Christmas
The most common earnings brackets in Christmas are $45,000 to $49,999 for men (87 | 18.8%) and $55,000 to $64,999 for women (75 | 14.7%).
| Income | Male | Female |
| $2,499 or less | 49 (10.6%) | 0 (0.0%) |
| $2,500 to $4,999 | 0 (0.0%) | 0 (0.0%) |
| $5,000 to $7,499 | 15 (3.3%) | 0 (0.0%) |
| $7,500 to $9,999 | 0 (0.0%) | 16 (3.1%) |
| $10,000 to $12,499 | 28 (6.1%) | 5 (1.0%) |
| $12,500 to $14,999 | 0 (0.0%) | 9 (1.8%) |
| $15,000 to $17,499 | 14 (3.0%) | 0 (0.0%) |
| $17,500 to $19,999 | 0 (0.0%) | 18 (3.5%) |
| $20,000 to $22,499 | 48 (10.4%) | 59 (11.6%) |
| $22,500 to $24,999 | 6 (1.3%) | 18 (3.5%) |
| $25,000 to $29,999 | 0 (0.0%) | 68 (13.4%) |
| $30,000 to $34,999 | 42 (9.1%) | 43 (8.5%) |
| $35,000 to $39,999 | 0 (0.0%) | 0 (0.0%) |
| $40,000 to $44,999 | 27 (5.8%) | 25 (4.9%) |
| $45,000 to $49,999 | 87 (18.8%) | 0 (0.0%) |
| $50,000 to $54,999 | 20 (4.3%) | 38 (7.5%) |
| $55,000 to $64,999 | 0 (0.0%) | 75 (14.7%) |
| $65,000 to $74,999 | 0 (0.0%) | 64 (12.6%) |
| $75,000 to $99,999 | 68 (14.7%) | 34 (6.7%) |
| $100,000+ | 58 (12.6%) | 37 (7.3%) |
| Total | 462 (100.0%) | 509 (100.0%) |
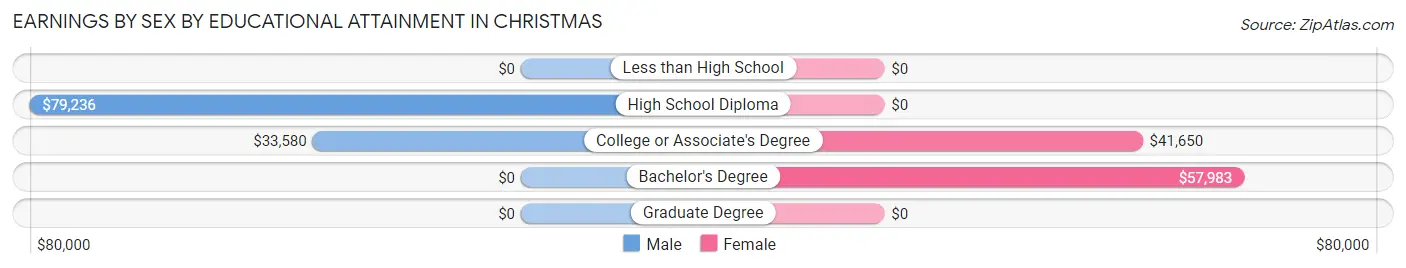
Earnings by Sex by Educational Attainment in Christmas
Average earnings in Christmas are $46,006 for men and $53,651 for women, a difference of 14.2%. Men with an educational attainment of high school diploma enjoy the highest average annual earnings of $79,236, while those with college or associate's degree education earn the least with $33,580. Women with an educational attainment of bachelor's degree earn the most with the average annual earnings of $57,983, while those with college or associate's degree education have the smallest earnings of $41,650.
| Educational Attainment | Male Income | Female Income |
| Less than High School | - | - |
| High School Diploma | $79,236 | $0 |
| College or Associate's Degree | $33,580 | $41,650 |
| Bachelor's Degree | - | - |
| Graduate Degree | - | - |
| Total | $46,006 | $53,651 |
Family Income in Christmas
Family Income Brackets in Christmas
According to the Christmas family income data, there are 147 families falling into the $100,000 to $149,999 income range, which is the most common income bracket and makes up 28.0% of all families.
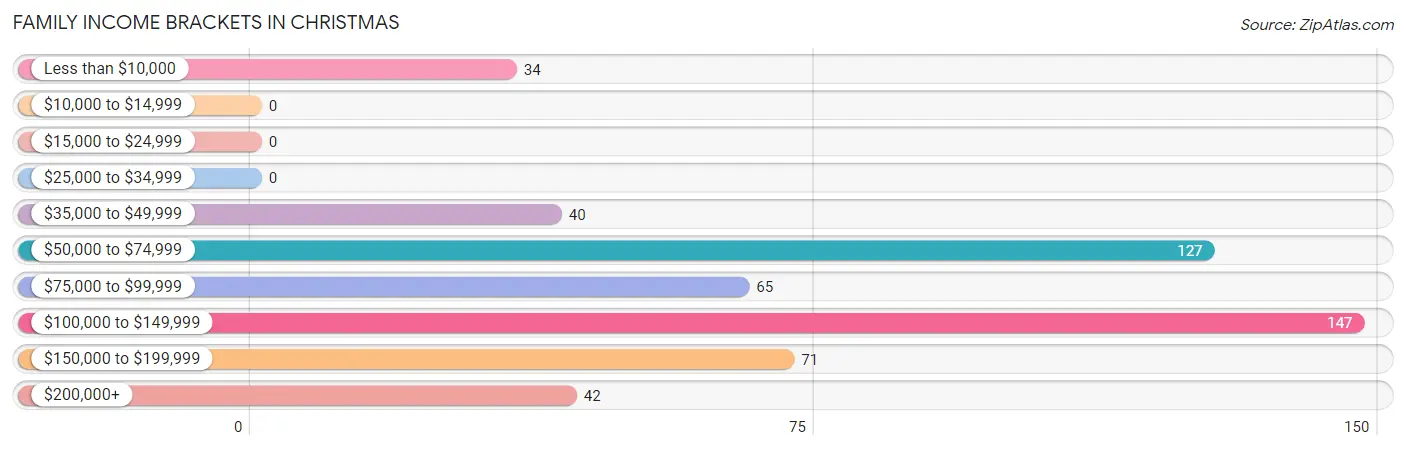
| Income Bracket | # Families | % Families |
| Less than $10,000 | 34 | 6.5% |
| $10,000 to $14,999 | 0 | 0.0% |
| $15,000 to $24,999 | 0 | 0.0% |
| $25,000 to $34,999 | 0 | 0.0% |
| $35,000 to $49,999 | 40 | 7.6% |
| $50,000 to $74,999 | 127 | 24.1% |
| $75,000 to $99,999 | 65 | 12.4% |
| $100,000 to $149,999 | 147 | 27.9% |
| $150,000 to $199,999 | 71 | 13.5% |
| $200,000+ | 42 | 8.0% |
Family Income by Famaliy Size in Christmas
3-person families (103 | 19.6%) account for the highest median family income in Christmas with $117,721 per family, while 2-person families (336 | 63.9%) have the highest median income of $46,400 per family member.
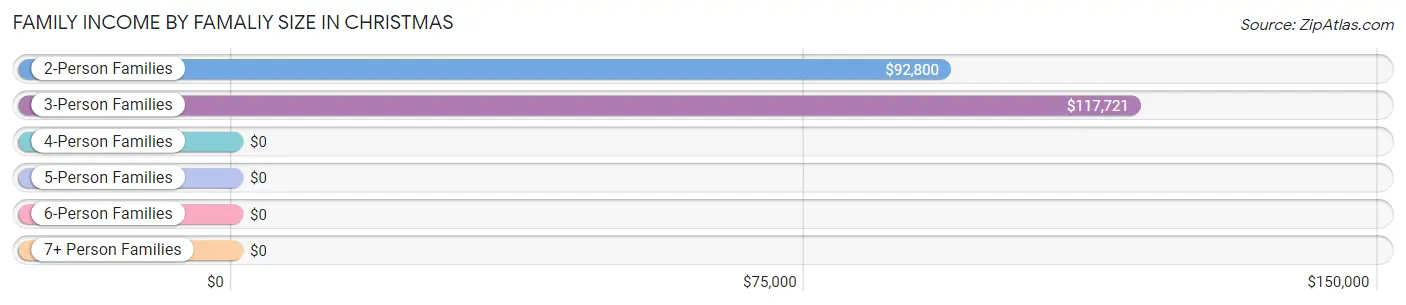
| Income Bracket | # Families | Median Income |
| 2-Person Families | 336 (63.9%) | $92,800 |
| 3-Person Families | 103 (19.6%) | $117,721 |
| 4-Person Families | 73 (13.9%) | $0 |
| 5-Person Families | 14 (2.7%) | $0 |
| 6-Person Families | 0 (0.0%) | $0 |
| 7+ Person Families | 0 (0.0%) | $0 |
| Total | 526 (100.0%) | $96,964 |
Family Income by Number of Earners in Christmas
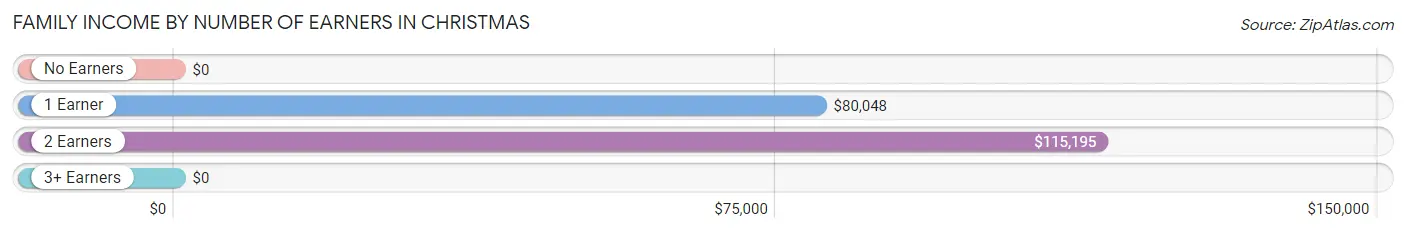
| Number of Earners | # Families | Median Income |
| No Earners | 105 (20.0%) | $0 |
| 1 Earner | 95 (18.1%) | $80,048 |
| 2 Earners | 261 (49.6%) | $115,195 |
| 3+ Earners | 65 (12.4%) | $0 |
| Total | 526 (100.0%) | $96,964 |
Household Income in Christmas
Household Income Brackets in Christmas
With 165 households falling in the category, the $100,000 to $149,999 income range is the most frequent in Christmas, accounting for 26.1% of all households.
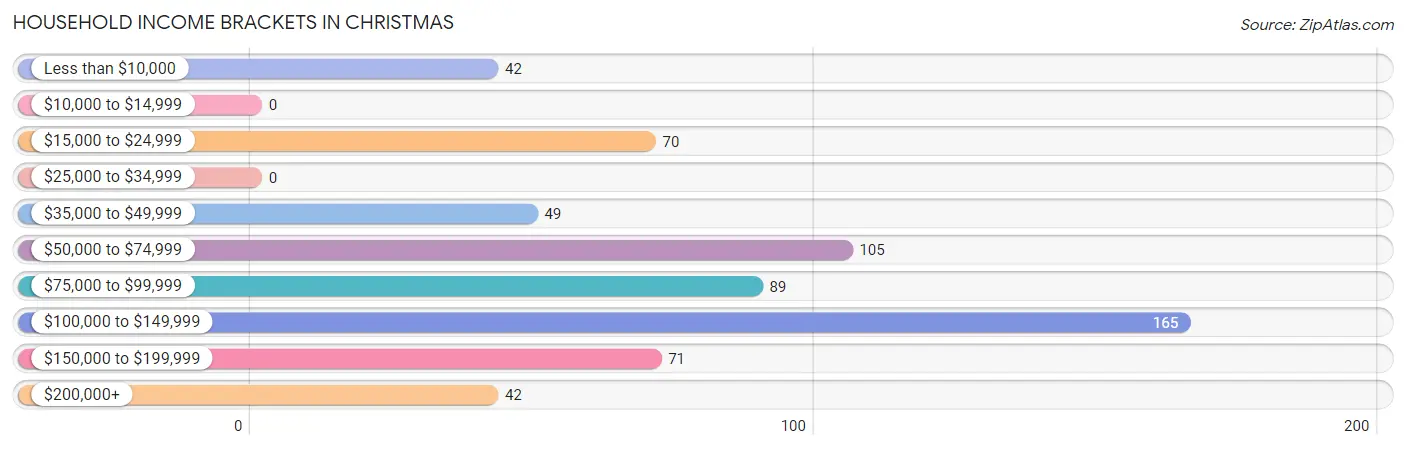
| Income Bracket | # Households | % Households |
| Less than $10,000 | 42 | 6.6% |
| $10,000 to $14,999 | 0 | 0.0% |
| $15,000 to $24,999 | 70 | 11.1% |
| $25,000 to $34,999 | 0 | 0.0% |
| $35,000 to $49,999 | 49 | 7.7% |
| $50,000 to $74,999 | 105 | 16.6% |
| $75,000 to $99,999 | 89 | 14.1% |
| $100,000 to $149,999 | 165 | 26.1% |
| $150,000 to $199,999 | 71 | 11.2% |
| $200,000+ | 42 | 6.6% |
Household Income by Householder Age in Christmas
The median household income in Christmas is $92,550, with the highest median household income of $116,758 found in the 25 to 44 years age bracket for the primary householder. A total of 245 households (38.7%) fall into this category. Meanwhile, the 15 to 24 years age bracket for the primary householder has the lowest median household income of $0, with 20 households (3.2%) in this group.
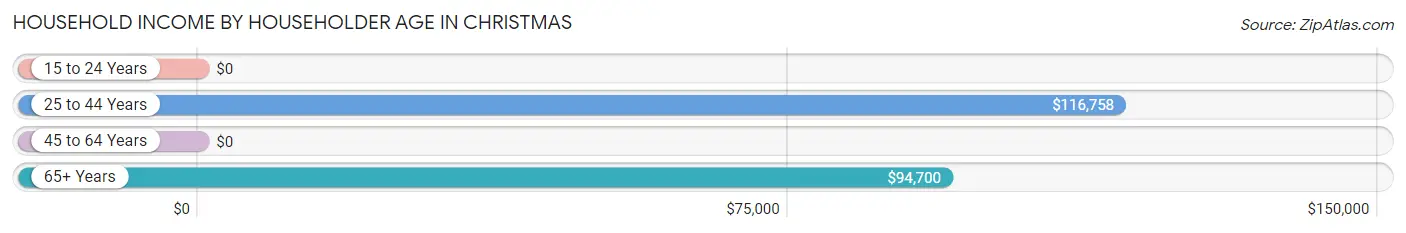
| Income Bracket | # Households | Median Income |
| 15 to 24 Years | 20 (3.2%) | $0 |
| 25 to 44 Years | 245 (38.7%) | $116,758 |
| 45 to 64 Years | 236 (37.3%) | $0 |
| 65+ Years | 132 (20.8%) | $94,700 |
| Total | 633 (100.0%) | $92,550 |
Poverty in Christmas
Income Below Poverty by Sex and Age in Christmas
With 4.9% poverty level for males and 5.6% for females among the residents of Christmas, 45 to 54 year old males and 55 to 64 year old females are the most vulnerable to poverty, with 39 males (27.9%) and 42 females (35.3%) in their respective age groups living below the poverty level.
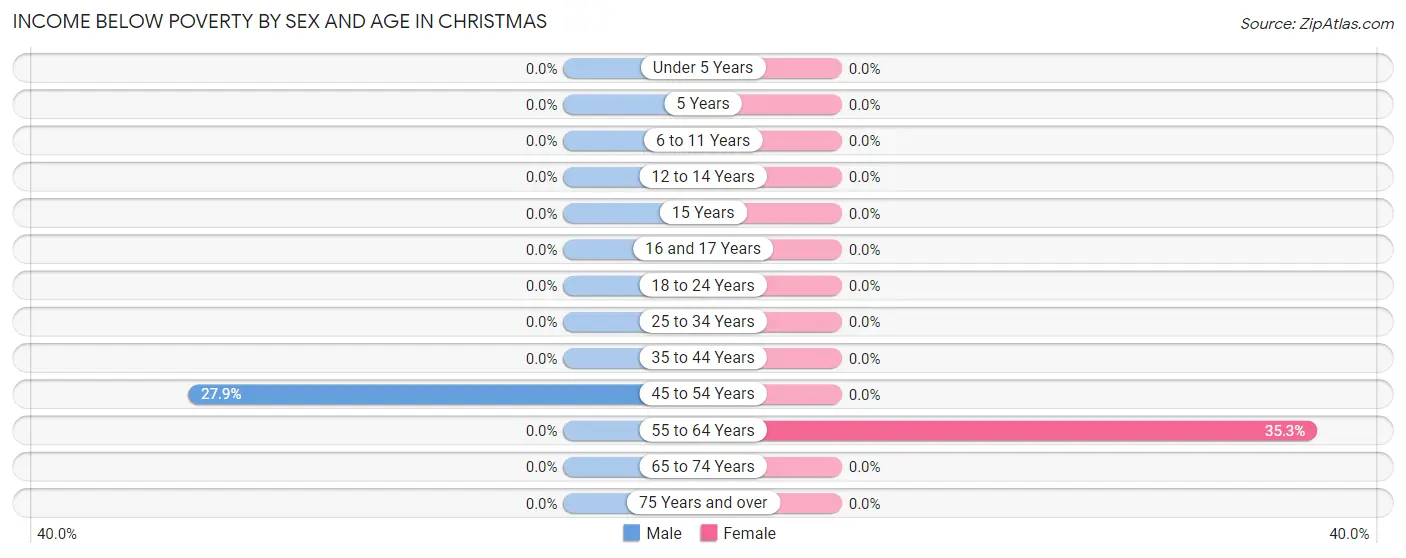
| Age Bracket | Male | Female |
| Under 5 Years | 0 (0.0%) | 0 (0.0%) |
| 5 Years | 0 (0.0%) | 0 (0.0%) |
| 6 to 11 Years | 0 (0.0%) | 0 (0.0%) |
| 12 to 14 Years | 0 (0.0%) | 0 (0.0%) |
| 15 Years | 0 (0.0%) | 0 (0.0%) |
| 16 and 17 Years | 0 (0.0%) | 0 (0.0%) |
| 18 to 24 Years | 0 (0.0%) | 0 (0.0%) |
| 25 to 34 Years | 0 (0.0%) | 0 (0.0%) |
| 35 to 44 Years | 0 (0.0%) | 0 (0.0%) |
| 45 to 54 Years | 39 (27.9%) | 0 (0.0%) |
| 55 to 64 Years | 0 (0.0%) | 42 (35.3%) |
| 65 to 74 Years | 0 (0.0%) | 0 (0.0%) |
| 75 Years and over | 0 (0.0%) | 0 (0.0%) |
| Total | 39 (4.9%) | 42 (5.6%) |
Income Above Poverty by Sex and Age in Christmas
According to the poverty statistics in Christmas, males aged under 5 years and females aged 5 years are the age groups that are most secure financially, with 100.0% of males and 100.0% of females in these age groups living above the poverty line.
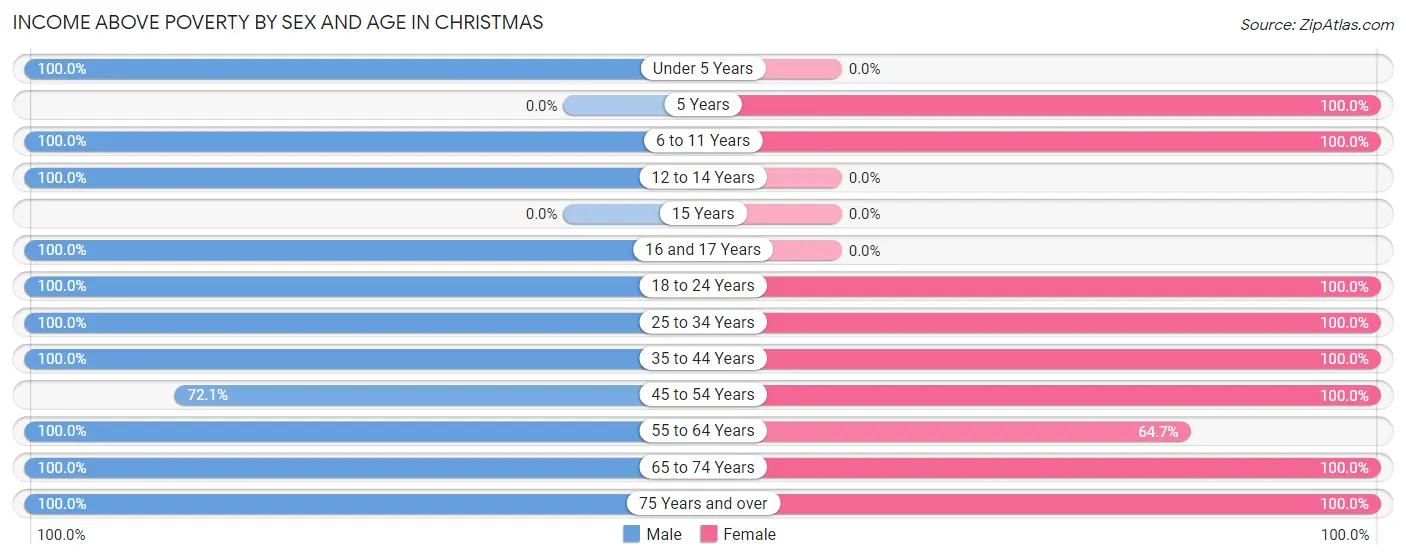
| Age Bracket | Male | Female |
| Under 5 Years | 15 (100.0%) | 0 (0.0%) |
| 5 Years | 0 (0.0%) | 44 (100.0%) |
| 6 to 11 Years | 60 (100.0%) | 30 (100.0%) |
| 12 to 14 Years | 45 (100.0%) | 0 (0.0%) |
| 15 Years | 0 (0.0%) | 0 (0.0%) |
| 16 and 17 Years | 64 (100.0%) | 0 (0.0%) |
| 18 to 24 Years | 42 (100.0%) | 48 (100.0%) |
| 25 to 34 Years | 56 (100.0%) | 120 (100.0%) |
| 35 to 44 Years | 131 (100.0%) | 150 (100.0%) |
| 45 to 54 Years | 101 (72.1%) | 140 (100.0%) |
| 55 to 64 Years | 86 (100.0%) | 77 (64.7%) |
| 65 to 74 Years | 121 (100.0%) | 64 (100.0%) |
| 75 Years and over | 39 (100.0%) | 31 (100.0%) |
| Total | 760 (95.1%) | 704 (94.4%) |
Income Below Poverty Among Married-Couple Families in Christmas
The poverty statistics for married-couple families in Christmas show that 7.7% or 34 of the total 440 families live below the poverty line. Families with no children have the highest poverty rate of 11.1%, comprising of 34 families. On the other hand, families with 1 or 2 children have the lowest poverty rate of 0.0%, which includes 0 families.
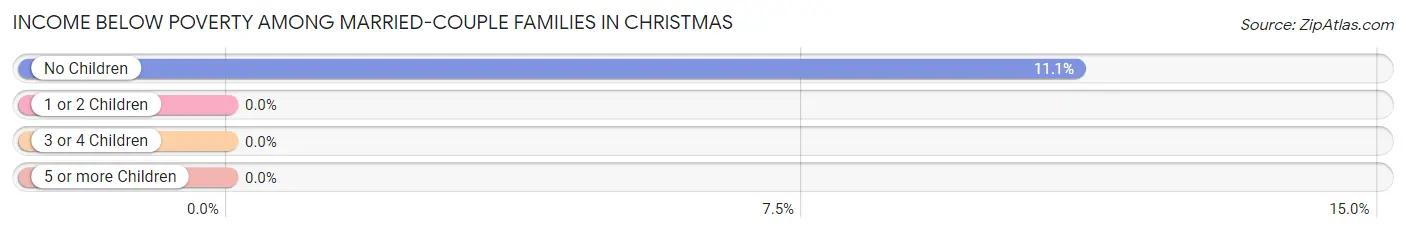
| Children | Above Poverty | Below Poverty |
| No Children | 273 (88.9%) | 34 (11.1%) |
| 1 or 2 Children | 119 (100.0%) | 0 (0.0%) |
| 3 or 4 Children | 14 (100.0%) | 0 (0.0%) |
| 5 or more Children | 0 (0.0%) | 0 (0.0%) |
| Total | 406 (92.3%) | 34 (7.7%) |
Income Below Poverty Among Single-Parent Households in Christmas
| Children | Single Father | Single Mother |
| No Children | 0 (0.0%) | 0 (0.0%) |
| 1 or 2 Children | 0 (0.0%) | 0 (0.0%) |
| 3 or 4 Children | 0 (0.0%) | 0 (0.0%) |
| 5 or more Children | 0 (0.0%) | 0 (0.0%) |
| Total | 0 (0.0%) | 0 (0.0%) |
Income Below Poverty Among Married-Couple vs Single-Parent Households in Christmas
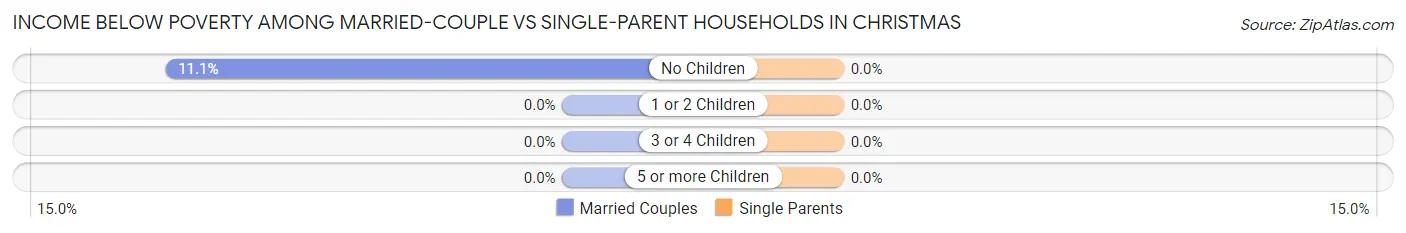
| Children | Married-Couple Families | Single-Parent Households |
| No Children | 34 (11.1%) | 0 (0.0%) |
| 1 or 2 Children | 0 (0.0%) | 0 (0.0%) |
| 3 or 4 Children | 0 (0.0%) | 0 (0.0%) |
| 5 or more Children | 0 (0.0%) | 0 (0.0%) |
| Total | 34 (7.7%) | 0 (0.0%) |
Race in Christmas
The most populous races in Christmas are White / Caucasian (1,366 | 88.4%), Two or more Races (100 | 6.5%), and Hispanic or Latino (87 | 5.6%).
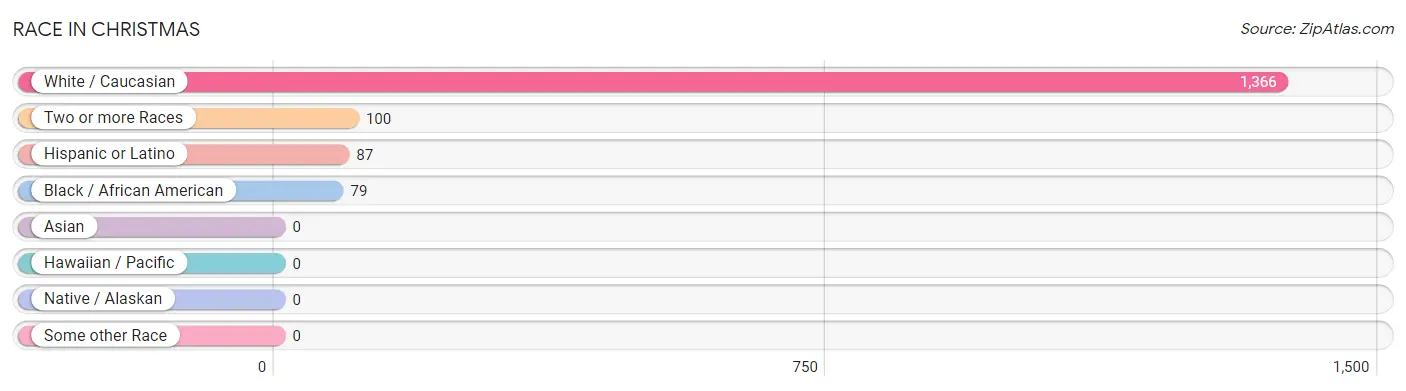
| Race | # Population | % Population |
| Asian | 0 | 0.0% |
| Black / African American | 79 | 5.1% |
| Hawaiian / Pacific | 0 | 0.0% |
| Hispanic or Latino | 87 | 5.6% |
| Native / Alaskan | 0 | 0.0% |
| White / Caucasian | 1,366 | 88.4% |
| Two or more Races | 100 | 6.5% |
| Some other Race | 0 | 0.0% |
| Total | 1,545 | 100.0% |
Ancestry in Christmas
The most populous ancestries reported in Christmas are German (327 | 21.2%), American (258 | 16.7%), English (183 | 11.8%), Irish (108 | 7.0%), and Cuban (73 | 4.7%), together accounting for 61.4% of all Christmas residents.
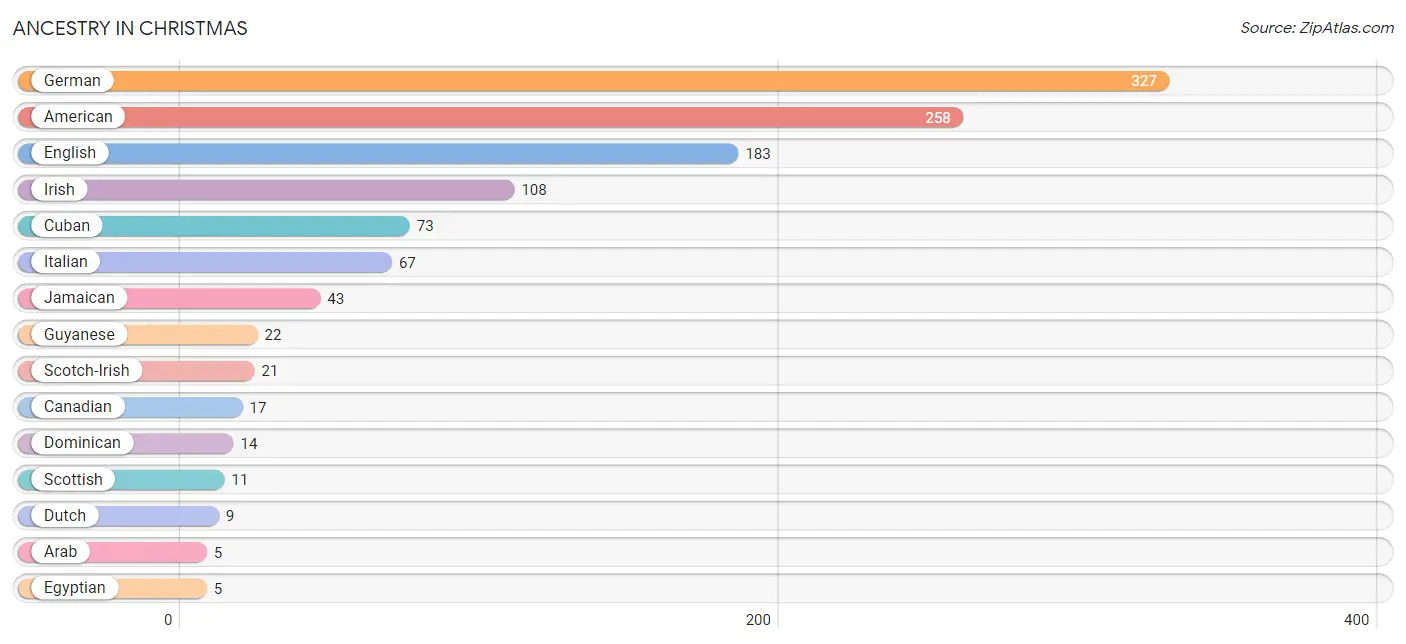
| Ancestry | # Population | % Population |
| American | 258 | 16.7% |
| Arab | 5 | 0.3% |
| Canadian | 17 | 1.1% |
| Cuban | 73 | 4.7% |
| Dominican | 14 | 0.9% |
| Dutch | 9 | 0.6% |
| Egyptian | 5 | 0.3% |
| English | 183 | 11.8% |
| German | 327 | 21.2% |
| Guyanese | 22 | 1.4% |
| Irish | 108 | 7.0% |
| Italian | 67 | 4.3% |
| Jamaican | 43 | 2.8% |
| Scotch-Irish | 21 | 1.4% |
| Scottish | 11 | 0.7% |
| Slovak | 5 | 0.3% | View All 16 Rows |
Immigrants in Christmas
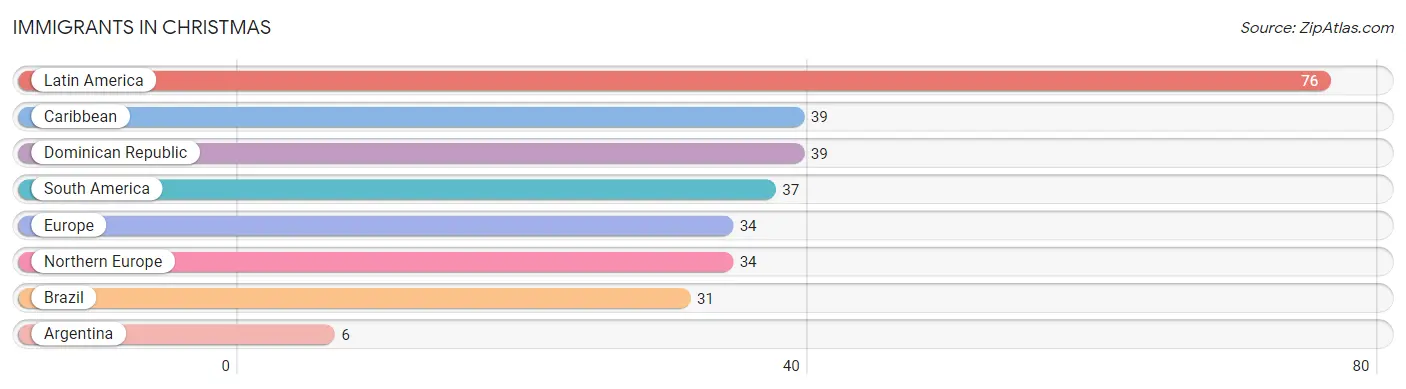
The most numerous immigrant groups reported in Christmas came from Latin America (76 | 4.9%), Caribbean (39 | 2.5%), Dominican Republic (39 | 2.5%), South America (37 | 2.4%), and Europe (34 | 2.2%), together accounting for 14.5% of all Christmas residents.
| Immigration Origin | # Population | % Population |
| Argentina | 6 | 0.4% |
| Brazil | 31 | 2.0% |
| Caribbean | 39 | 2.5% |
| Dominican Republic | 39 | 2.5% |
| Europe | 34 | 2.2% |
| Latin America | 76 | 4.9% |
| Northern Europe | 34 | 2.2% |
| South America | 37 | 2.4% | View All 8 Rows |
Sex and Age in Christmas
Sex and Age in Christmas
The most populous age groups in Christmas are 50 to 54 Years (120 | 15.0%) for men and 50 to 54 Years (109 | 14.6%) for women.

| Age Bracket | Male | Female |
| Under 5 Years | 15 (1.9%) | 0 (0.0%) |
| 5 to 9 Years | 47 (5.9%) | 74 (9.9%) |
| 10 to 14 Years | 58 (7.3%) | 0 (0.0%) |
| 15 to 19 Years | 64 (8.0%) | 0 (0.0%) |
| 20 to 24 Years | 42 (5.3%) | 48 (6.4%) |
| 25 to 29 Years | 6 (0.7%) | 57 (7.6%) |
| 30 to 34 Years | 50 (6.3%) | 63 (8.5%) |
| 35 to 39 Years | 28 (3.5%) | 72 (9.7%) |
| 40 to 44 Years | 103 (12.9%) | 78 (10.5%) |
| 45 to 49 Years | 20 (2.5%) | 31 (4.2%) |
| 50 to 54 Years | 120 (15.0%) | 109 (14.6%) |
| 55 to 59 Years | 86 (10.8%) | 84 (11.3%) |
| 60 to 64 Years | 0 (0.0%) | 35 (4.7%) |
| 65 to 69 Years | 65 (8.1%) | 29 (3.9%) |
| 70 to 74 Years | 56 (7.0%) | 35 (4.7%) |
| 75 to 79 Years | 4 (0.5%) | 0 (0.0%) |
| 80 to 84 Years | 0 (0.0%) | 23 (3.1%) |
| 85 Years and over | 35 (4.4%) | 8 (1.1%) |
| Total | 799 (100.0%) | 746 (100.0%) |
Families and Households in Christmas
Median Family Size in Christmas
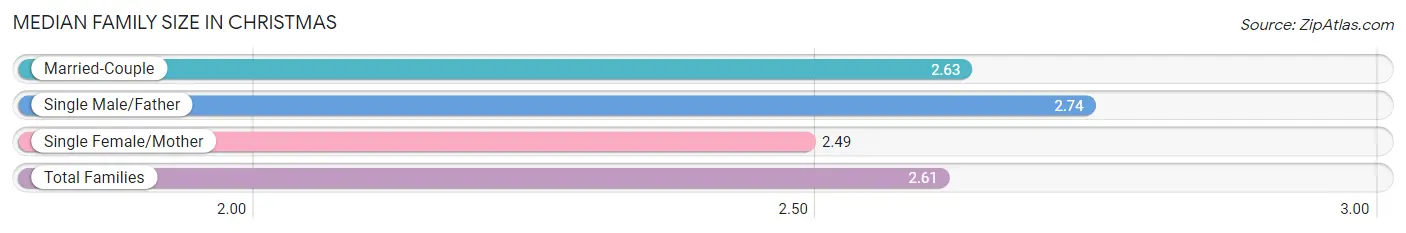
The median family size in Christmas is 2.61 persons per family, with single male/father families (19 | 3.6%) accounting for the largest median family size of 2.74 persons per family. On the other hand, single female/mother families (67 | 12.7%) represent the smallest median family size with 2.49 persons per family.
| Family Type | # Families | Family Size |
| Married-Couple | 440 (83.7%) | 2.63 |
| Single Male/Father | 19 (3.6%) | 2.74 |
| Single Female/Mother | 67 (12.7%) | 2.49 |
| Total Families | 526 (100.0%) | 2.61 |
Median Household Size in Christmas
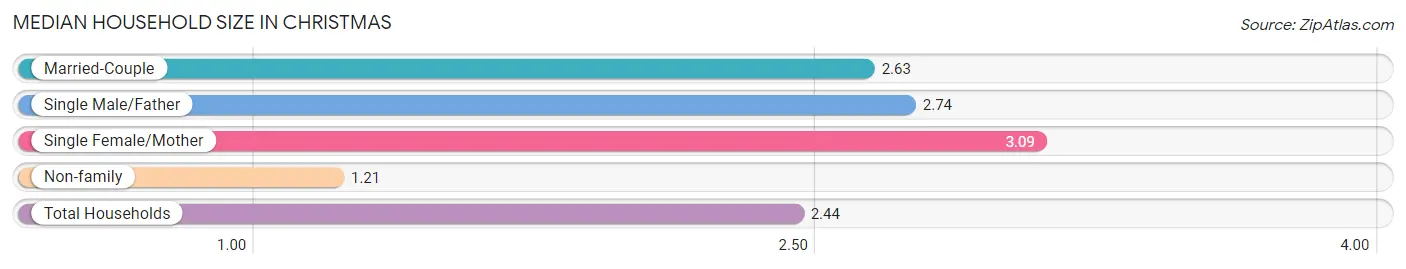
The median household size in Christmas is 2.44 persons per household, with single female/mother households (67 | 10.6%) accounting for the largest median household size of 3.09 persons per household. non-family households (107 | 16.9%) represent the smallest median household size with 1.21 persons per household.
| Household Type | # Households | Household Size |
| Married-Couple | 440 (69.5%) | 2.63 |
| Single Male/Father | 19 (3.0%) | 2.74 |
| Single Female/Mother | 67 (10.6%) | 3.09 |
| Non-family | 107 (16.9%) | 1.21 |
| Total Households | 633 (100.0%) | 2.44 |
Household Size by Marriage Status in Christmas
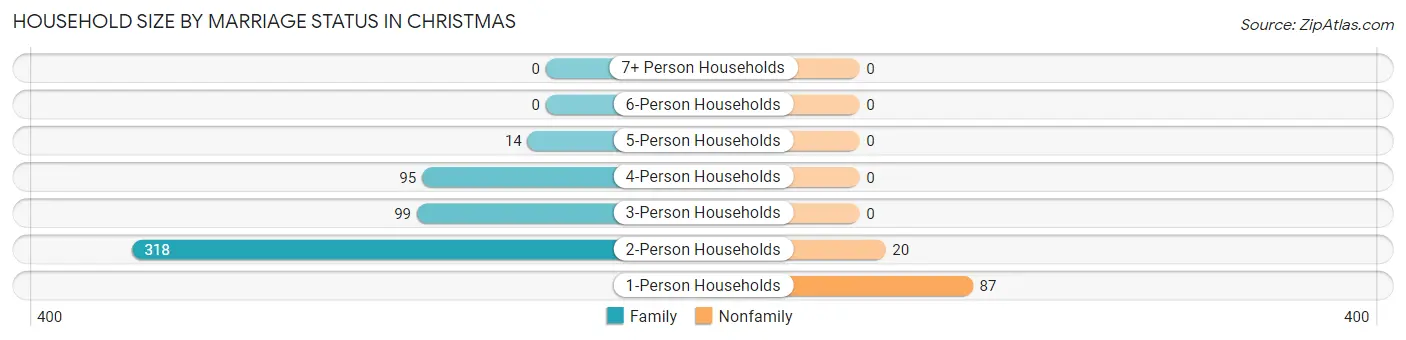
Out of a total of 633 households in Christmas, 526 (83.1%) are family households, while 107 (16.9%) are nonfamily households. The most numerous type of family households are 2-person households, comprising 318, and the most common type of nonfamily households are 1-person households, comprising 87.
| Household Size | Family Households | Nonfamily Households |
| 1-Person Households | - | 87 (13.7%) |
| 2-Person Households | 318 (50.2%) | 20 (3.2%) |
| 3-Person Households | 99 (15.6%) | 0 (0.0%) |
| 4-Person Households | 95 (15.0%) | 0 (0.0%) |
| 5-Person Households | 14 (2.2%) | 0 (0.0%) |
| 6-Person Households | 0 (0.0%) | 0 (0.0%) |
| 7+ Person Households | 0 (0.0%) | 0 (0.0%) |
| Total | 526 (83.1%) | 107 (16.9%) |
Female Fertility in Christmas
Fertility by Age in Christmas
| Age Bracket | Women with Births | Births / 1,000 Women |
| 15 to 19 years | 0 (0.0%) | 0.0 |
| 20 to 34 years | 0 (0.0%) | 0.0 |
| 35 to 50 years | 0 (0.0%) | 0.0 |
| Total | 0 (0.0%) | 0.0 |
Fertility by Age by Marriage Status in Christmas
| Age Bracket | Married | Unmarried |
| 15 to 19 years | 0 (0.0%) | 0 (0.0%) |
| 20 to 34 years | 0 (0.0%) | 0 (0.0%) |
| 35 to 50 years | 0 (0.0%) | 0 (0.0%) |
| Total | 0 (0.0%) | 0 (0.0%) |
Fertility by Education in Christmas
| Educational Attainment | Women with Births | Births / 1,000 Women |
| Less than High School | 0 (0.0%) | 0.0 |
| High School Diploma | 0 (0.0%) | 0.0 |
| College or Associate's Degree | 0 (0.0%) | 0.0 |
| Bachelor's Degree | 0 (0.0%) | 0.0 |
| Graduate Degree | 0 (0.0%) | 0.0 |
| Total | 0 (0.0%) | 0.0 |
Fertility by Education by Marriage Status in Christmas
| Educational Attainment | Married | Unmarried |
| Less than High School | 0 (0.0%) | 0 (0.0%) |
| High School Diploma | 0 (0.0%) | 0 (0.0%) |
| College or Associate's Degree | 0 (0.0%) | 0 (0.0%) |
| Bachelor's Degree | 0 (0.0%) | 0 (0.0%) |
| Graduate Degree | 0 (0.0%) | 0 (0.0%) |
| Total | 0 (0.0%) | 0 (0.0%) |
Employment Characteristics in Christmas
Employment by Class of Employer in Christmas
Among the 924 employed individuals in Christmas, private company employees (502 | 54.3%), not-for-profit organizations (156 | 16.9%), and local government employees (126 | 13.6%) make up the most common classes of employment.
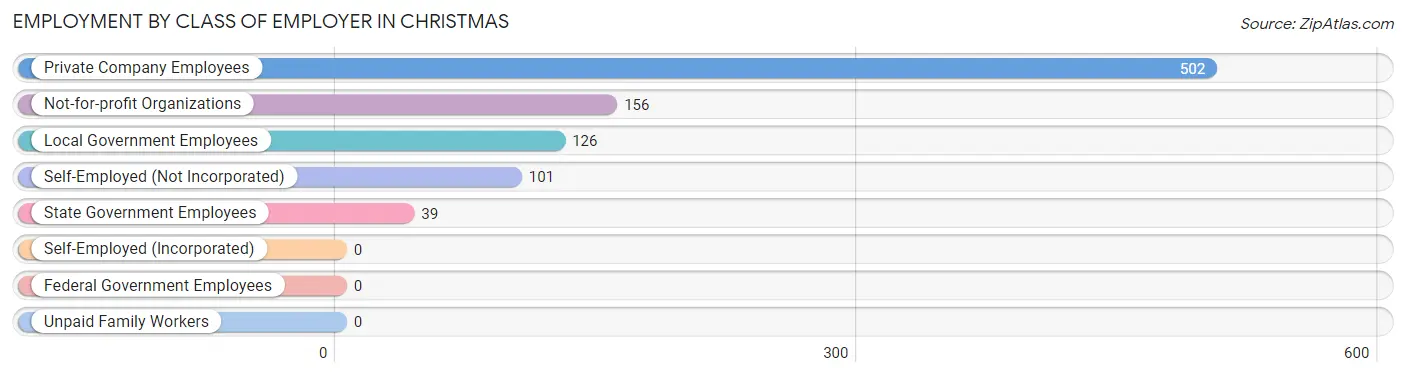
| Employer Class | # Employees | % Employees |
| Private Company Employees | 502 | 54.3% |
| Self-Employed (Incorporated) | 0 | 0.0% |
| Self-Employed (Not Incorporated) | 101 | 10.9% |
| Not-for-profit Organizations | 156 | 16.9% |
| Local Government Employees | 126 | 13.6% |
| State Government Employees | 39 | 4.2% |
| Federal Government Employees | 0 | 0.0% |
| Unpaid Family Workers | 0 | 0.0% |
| Total | 924 | 100.0% |
Employment Status by Age in Christmas
According to the labor force statistics for Christmas, out of the total population over 16 years of age (1,351), 69.6% or 940 individuals are in the labor force, with 1.7% or 16 of them unemployed. The age group with the highest labor force participation rate is 16 to 19 years, with 100.0% or 64 individuals in the labor force. Within the labor force, the 20 to 24 years age range has the highest percentage of unemployed individuals, with 17.8% or 16 of them being unemployed.
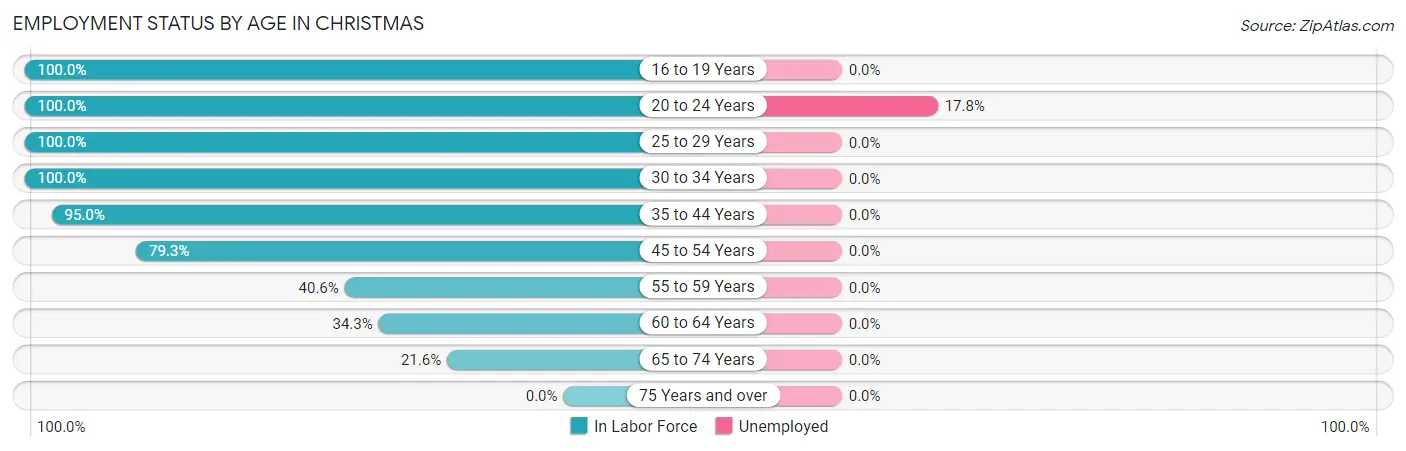
| Age Bracket | In Labor Force | Unemployed |
| 16 to 19 Years | 64 (100.0%) | 0 (0.0%) |
| 20 to 24 Years | 90 (100.0%) | 16 (17.8%) |
| 25 to 29 Years | 63 (100.0%) | 0 (0.0%) |
| 30 to 34 Years | 113 (100.0%) | 0 (0.0%) |
| 35 to 44 Years | 267 (95.0%) | 0 (0.0%) |
| 45 to 54 Years | 222 (79.3%) | 0 (0.0%) |
| 55 to 59 Years | 69 (40.6%) | 0 (0.0%) |
| 60 to 64 Years | 12 (34.3%) | 0 (0.0%) |
| 65 to 74 Years | 40 (21.6%) | 0 (0.0%) |
| 75 Years and over | 0 (0.0%) | 0 (0.0%) |
| Total | 940 (69.6%) | 16 (1.7%) |
Employment Status by Educational Attainment in Christmas
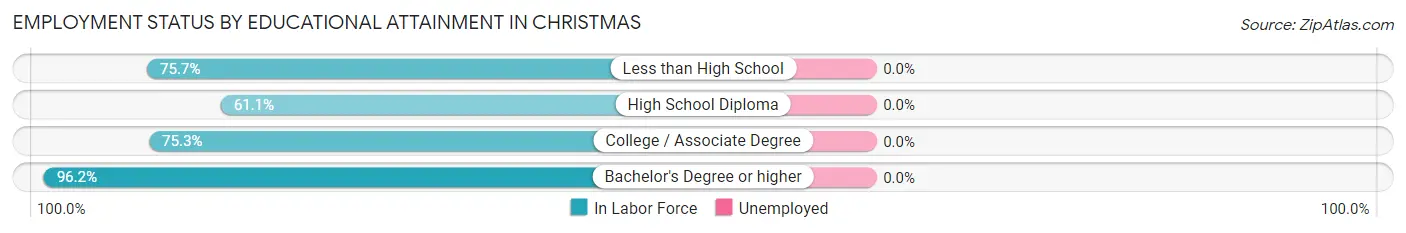
| Educational Attainment | In Labor Force | Unemployed |
| Less than High School | 103 (75.7%) | 0 (0.0%) |
| High School Diploma | 107 (61.1%) | 0 (0.0%) |
| College / Associate Degree | 256 (75.3%) | 0 (0.0%) |
| Bachelor's Degree or higher | 280 (96.2%) | 0 (0.0%) |
| Total | 746 (79.2%) | 0 (0.0%) |
Employment Occupations by Sex in Christmas
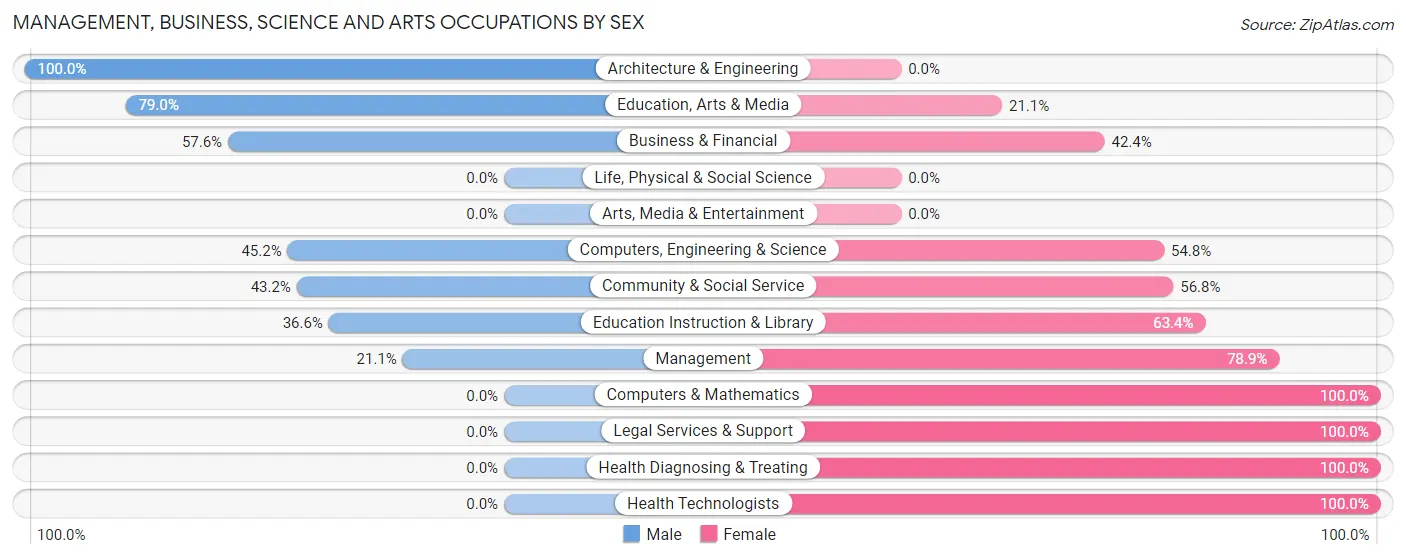
Management, Business, Science and Arts Occupations
The most common Management, Business, Science and Arts occupations in Christmas are Community & Social Service (148 | 16.0%), Management (123 | 13.3%), Education Instruction & Library (93 | 10.1%), Health Diagnosing & Treating (87 | 9.4%), and Health Technologists (46 | 5.0%).
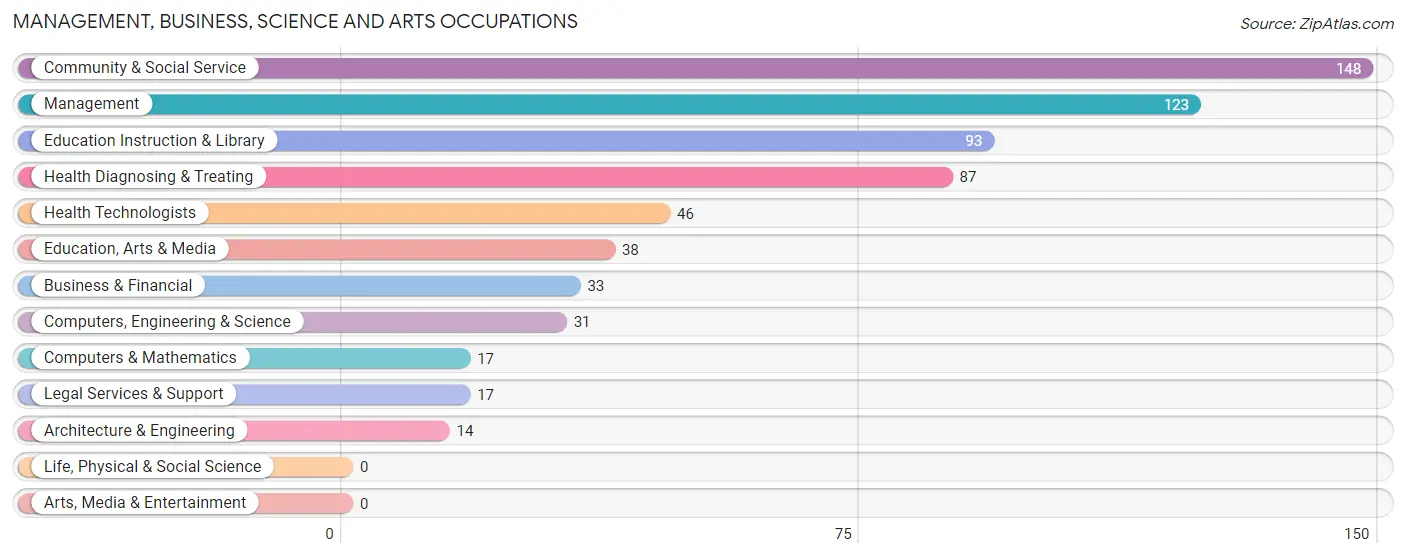
Management, Business, Science and Arts Occupations by Sex
Within the Management, Business, Science and Arts occupations in Christmas, the most male-oriented occupations are Architecture & Engineering (100.0%), Education, Arts & Media (78.9%), and Business & Financial (57.6%), while the most female-oriented occupations are Computers & Mathematics (100.0%), Legal Services & Support (100.0%), and Health Diagnosing & Treating (100.0%).
| Occupation | Male | Female |
| Management | 26 (21.1%) | 97 (78.9%) |
| Business & Financial | 19 (57.6%) | 14 (42.4%) |
| Computers, Engineering & Science | 14 (45.2%) | 17 (54.8%) |
| Computers & Mathematics | 0 (0.0%) | 17 (100.0%) |
| Architecture & Engineering | 14 (100.0%) | 0 (0.0%) |
| Life, Physical & Social Science | 0 (0.0%) | 0 (0.0%) |
| Community & Social Service | 64 (43.2%) | 84 (56.8%) |
| Education, Arts & Media | 30 (78.9%) | 8 (21.0%) |
| Legal Services & Support | 0 (0.0%) | 17 (100.0%) |
| Education Instruction & Library | 34 (36.6%) | 59 (63.4%) |
| Arts, Media & Entertainment | 0 (0.0%) | 0 (0.0%) |
| Health Diagnosing & Treating | 0 (0.0%) | 87 (100.0%) |
| Health Technologists | 0 (0.0%) | 46 (100.0%) |
| Total (Category) | 123 (29.1%) | 299 (70.9%) |
| Total (Overall) | 431 (46.7%) | 493 (53.3%) |
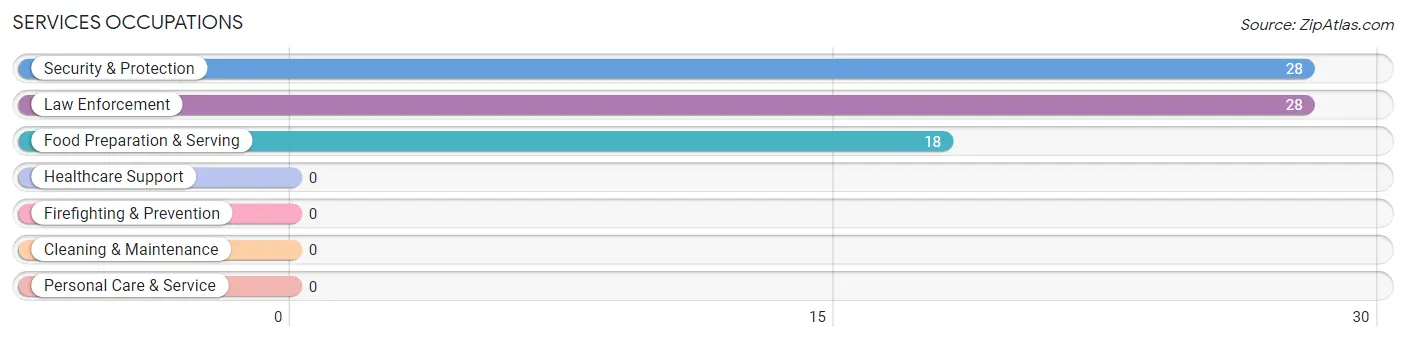
Services Occupations
The most common Services occupations in Christmas are Security & Protection (28 | 3.0%), Law Enforcement (28 | 3.0%), and Food Preparation & Serving (18 | 1.9%).
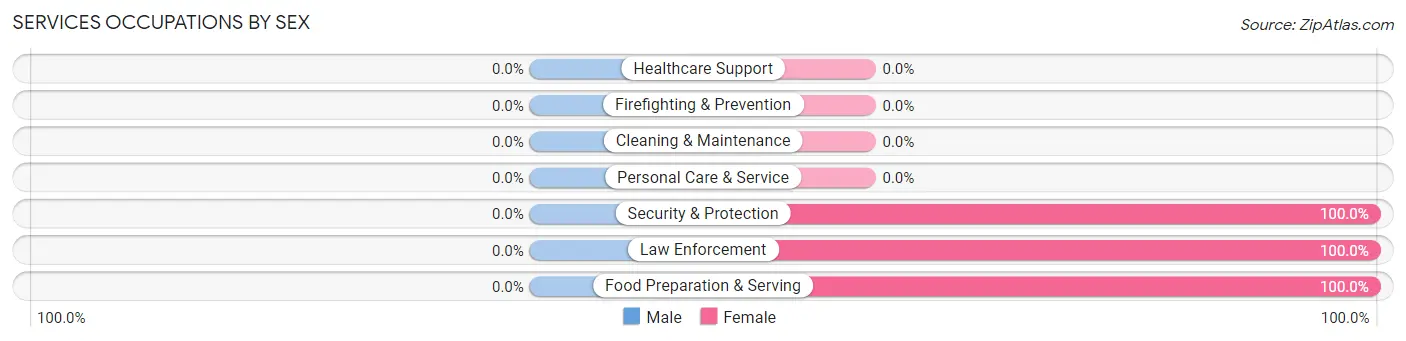
Services Occupations by Sex
| Occupation | Male | Female |
| Healthcare Support | 0 (0.0%) | 0 (0.0%) |
| Security & Protection | 0 (0.0%) | 28 (100.0%) |
| Firefighting & Prevention | 0 (0.0%) | 0 (0.0%) |
| Law Enforcement | 0 (0.0%) | 28 (100.0%) |
| Food Preparation & Serving | 0 (0.0%) | 18 (100.0%) |
| Cleaning & Maintenance | 0 (0.0%) | 0 (0.0%) |
| Personal Care & Service | 0 (0.0%) | 0 (0.0%) |
| Total (Category) | 0 (0.0%) | 46 (100.0%) |
| Total (Overall) | 431 (46.7%) | 493 (53.3%) |
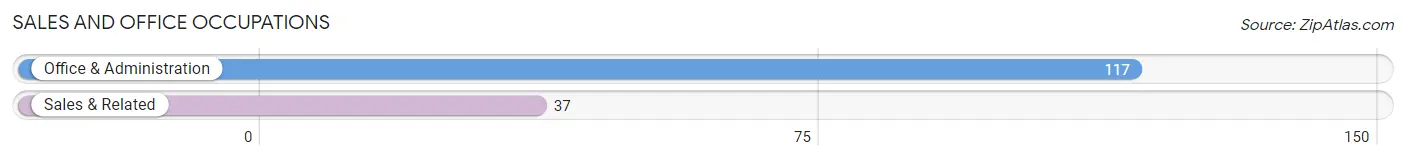
Sales and Office Occupations
The most common Sales and Office occupations in Christmas are Office & Administration (117 | 12.7%), and Sales & Related (37 | 4.0%).
Sales and Office Occupations by Sex
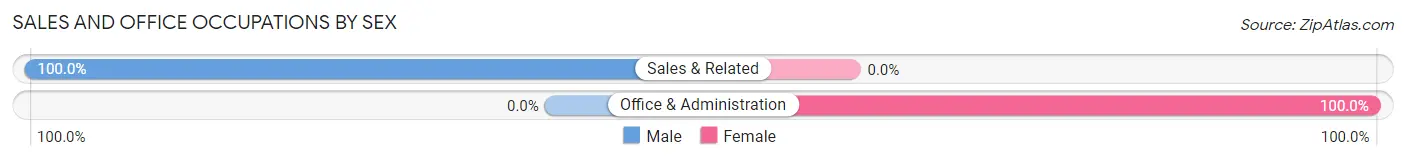
| Occupation | Male | Female |
| Sales & Related | 37 (100.0%) | 0 (0.0%) |
| Office & Administration | 0 (0.0%) | 117 (100.0%) |
| Total (Category) | 37 (24.0%) | 117 (76.0%) |
| Total (Overall) | 431 (46.7%) | 493 (53.3%) |
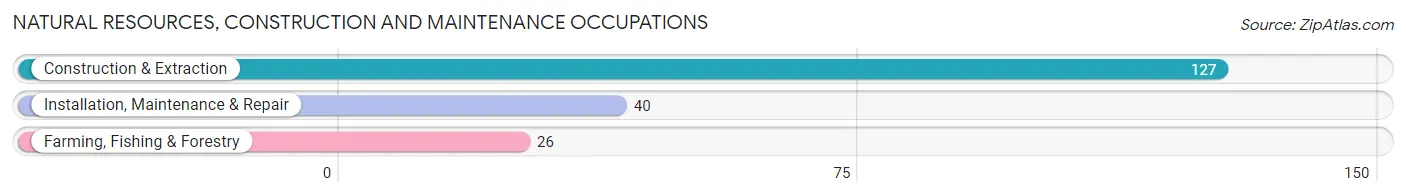
Natural Resources, Construction and Maintenance Occupations
The most common Natural Resources, Construction and Maintenance occupations in Christmas are Construction & Extraction (127 | 13.7%), Installation, Maintenance & Repair (40 | 4.3%), and Farming, Fishing & Forestry (26 | 2.8%).
Natural Resources, Construction and Maintenance Occupations by Sex
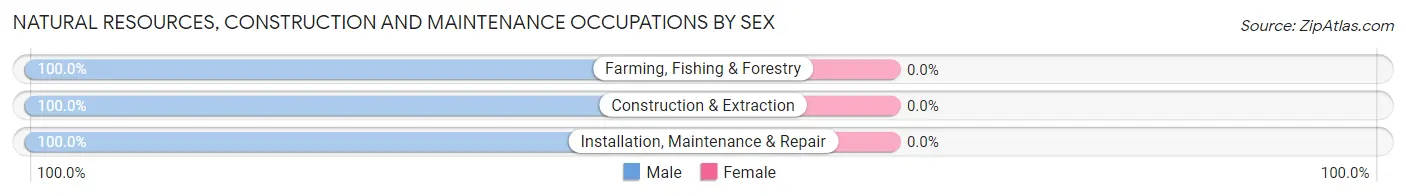
| Occupation | Male | Female |
| Farming, Fishing & Forestry | 26 (100.0%) | 0 (0.0%) |
| Construction & Extraction | 127 (100.0%) | 0 (0.0%) |
| Installation, Maintenance & Repair | 40 (100.0%) | 0 (0.0%) |
| Total (Category) | 193 (100.0%) | 0 (0.0%) |
| Total (Overall) | 431 (46.7%) | 493 (53.3%) |
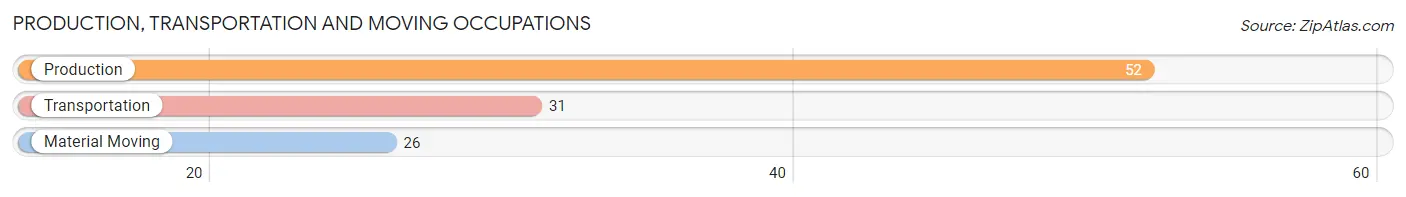
Production, Transportation and Moving Occupations
The most common Production, Transportation and Moving occupations in Christmas are Production (52 | 5.6%), Transportation (31 | 3.4%), and Material Moving (26 | 2.8%).
Production, Transportation and Moving Occupations by Sex
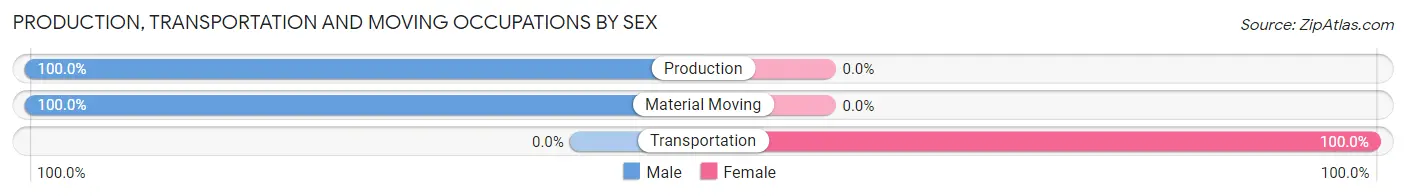
| Occupation | Male | Female |
| Production | 52 (100.0%) | 0 (0.0%) |
| Transportation | 0 (0.0%) | 31 (100.0%) |
| Material Moving | 26 (100.0%) | 0 (0.0%) |
| Total (Category) | 78 (71.6%) | 31 (28.4%) |
| Total (Overall) | 431 (46.7%) | 493 (53.3%) |
Employment Industries by Sex in Christmas
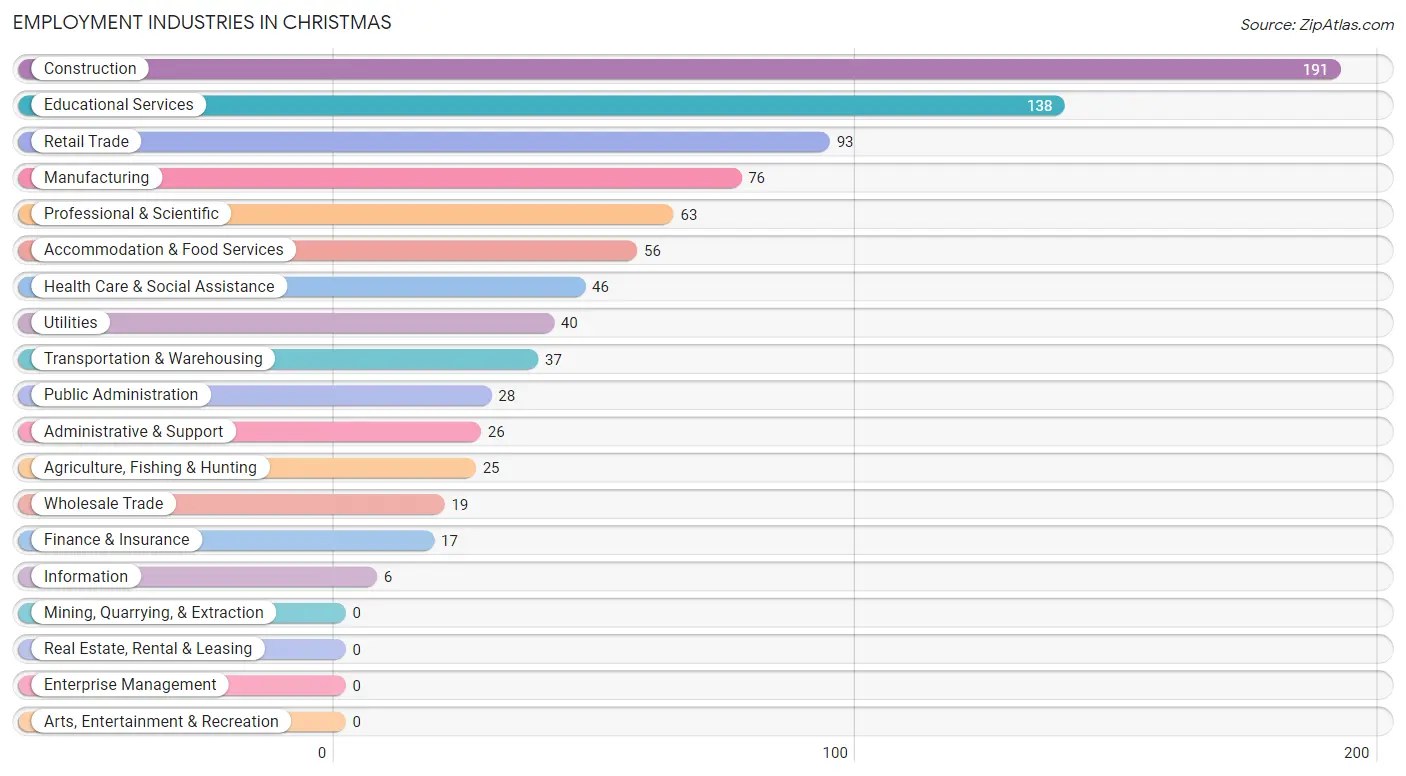
Employment Industries in Christmas
The major employment industries in Christmas include Construction (191 | 20.7%), Educational Services (138 | 14.9%), Retail Trade (93 | 10.1%), Manufacturing (76 | 8.2%), and Professional & Scientific (63 | 6.8%).
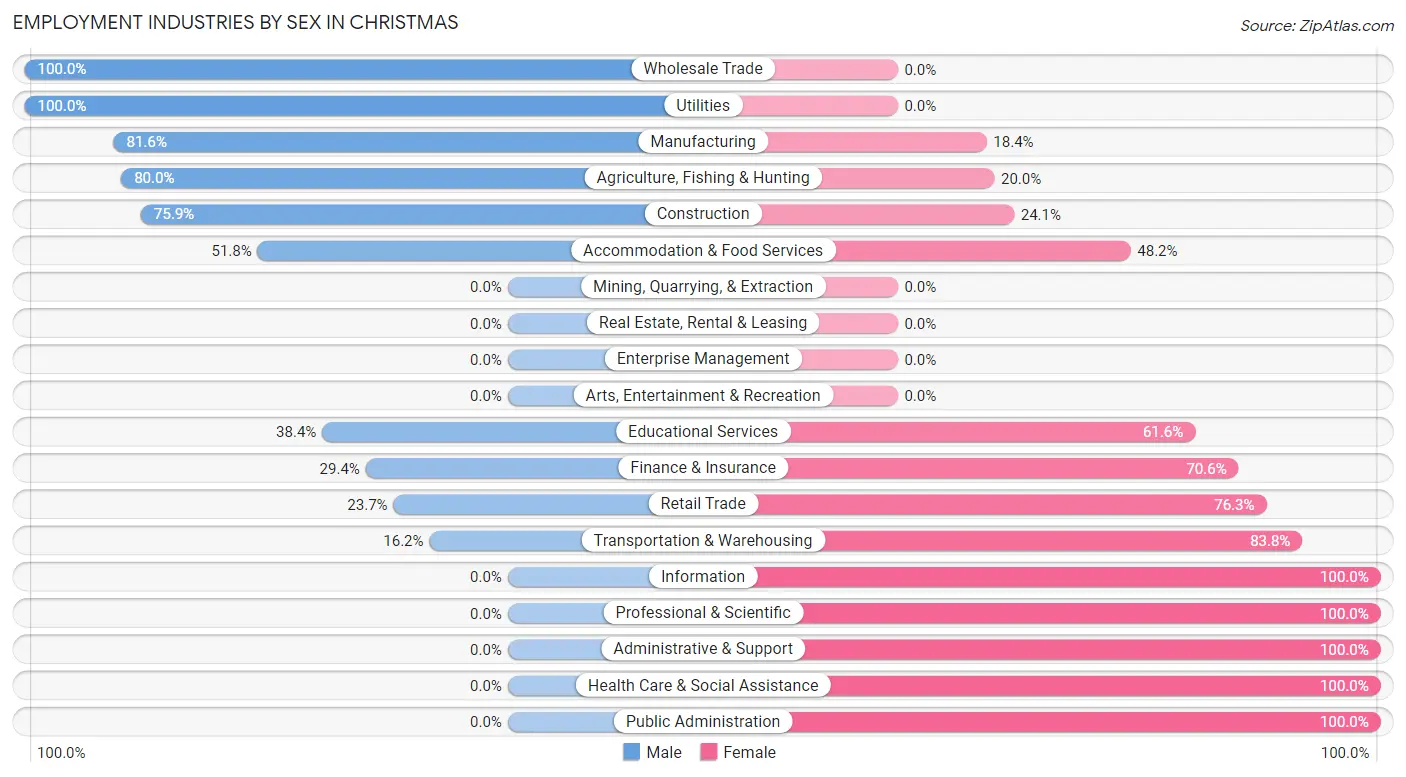
Employment Industries by Sex in Christmas
The Christmas industries that see more men than women are Wholesale Trade (100.0%), Utilities (100.0%), and Manufacturing (81.6%), whereas the industries that tend to have a higher number of women are Information (100.0%), Professional & Scientific (100.0%), and Administrative & Support (100.0%).
| Industry | Male | Female |
| Agriculture, Fishing & Hunting | 20 (80.0%) | 5 (20.0%) |
| Mining, Quarrying, & Extraction | 0 (0.0%) | 0 (0.0%) |
| Construction | 145 (75.9%) | 46 (24.1%) |
| Manufacturing | 62 (81.6%) | 14 (18.4%) |
| Wholesale Trade | 19 (100.0%) | 0 (0.0%) |
| Retail Trade | 22 (23.7%) | 71 (76.3%) |
| Transportation & Warehousing | 6 (16.2%) | 31 (83.8%) |
| Utilities | 40 (100.0%) | 0 (0.0%) |
| Information | 0 (0.0%) | 6 (100.0%) |
| Finance & Insurance | 5 (29.4%) | 12 (70.6%) |
| Real Estate, Rental & Leasing | 0 (0.0%) | 0 (0.0%) |
| Professional & Scientific | 0 (0.0%) | 63 (100.0%) |
| Enterprise Management | 0 (0.0%) | 0 (0.0%) |
| Administrative & Support | 0 (0.0%) | 26 (100.0%) |
| Educational Services | 53 (38.4%) | 85 (61.6%) |
| Health Care & Social Assistance | 0 (0.0%) | 46 (100.0%) |
| Arts, Entertainment & Recreation | 0 (0.0%) | 0 (0.0%) |
| Accommodation & Food Services | 29 (51.8%) | 27 (48.2%) |
| Public Administration | 0 (0.0%) | 28 (100.0%) |
| Total | 431 (46.7%) | 493 (53.3%) |
Education in Christmas
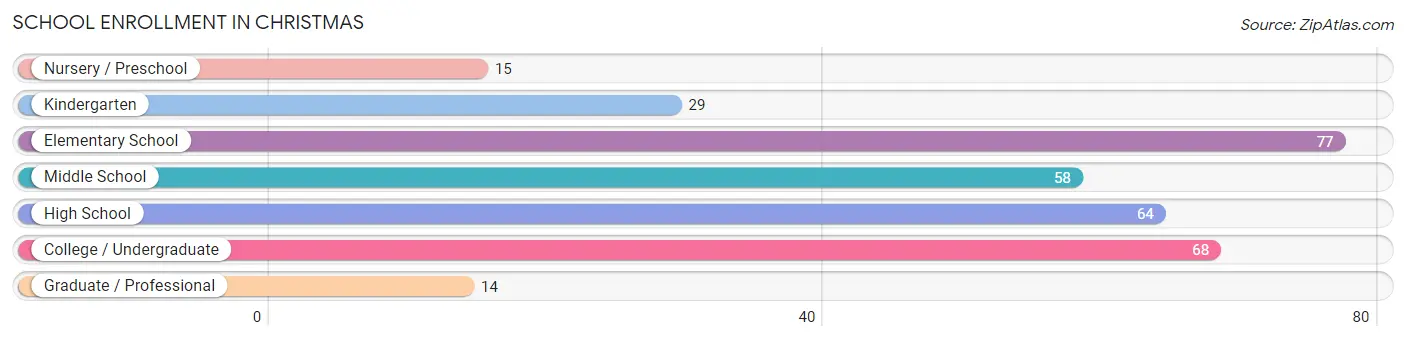
School Enrollment in Christmas
The most common levels of schooling among the 325 students in Christmas are elementary school (77 | 23.7%), college / undergraduate (68 | 20.9%), and high school (64 | 19.7%).
| School Level | # Students | % Students |
| Nursery / Preschool | 15 | 4.6% |
| Kindergarten | 29 | 8.9% |
| Elementary School | 77 | 23.7% |
| Middle School | 58 | 17.8% |
| High School | 64 | 19.7% |
| College / Undergraduate | 68 | 20.9% |
| Graduate / Professional | 14 | 4.3% |
| Total | 325 | 100.0% |
School Enrollment by Age by Funding Source in Christmas
Out of a total of 325 students who are enrolled in schools in Christmas, 14 (4.3%) attend a private institution, while the remaining 311 (95.7%) are enrolled in public schools. The age group of 25 to 34 year olds has the highest likelihood of being enrolled in private schools, with 14 (24.6% in the age bracket) enrolled. Conversely, the age group of 5 to 9 year old has the lowest likelihood of being enrolled in a private school, with 121 (100.0% in the age bracket) attending a public institution.
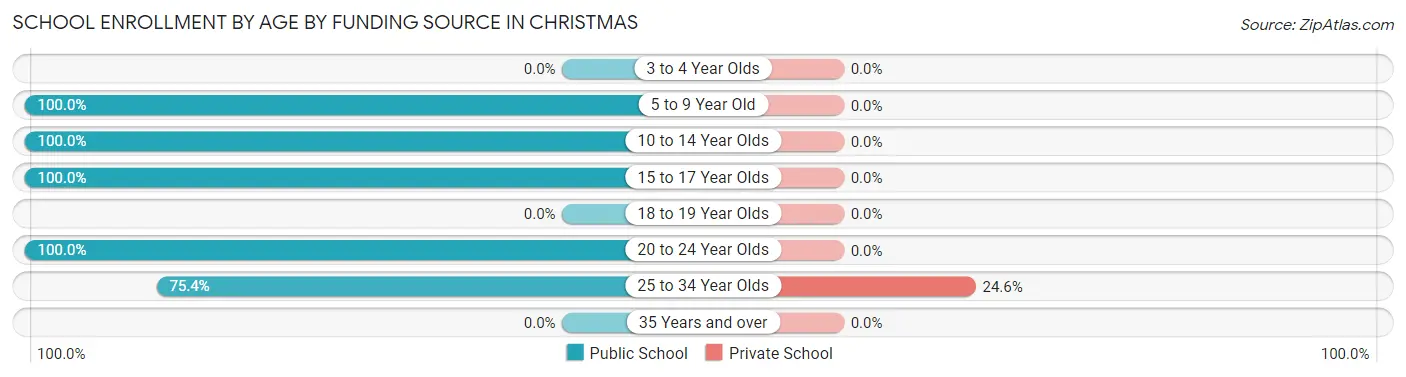
| Age Bracket | Public School | Private School |
| 3 to 4 Year Olds | 0 (0.0%) | 0 (0.0%) |
| 5 to 9 Year Old | 121 (100.0%) | 0 (0.0%) |
| 10 to 14 Year Olds | 58 (100.0%) | 0 (0.0%) |
| 15 to 17 Year Olds | 64 (100.0%) | 0 (0.0%) |
| 18 to 19 Year Olds | 0 (0.0%) | 0 (0.0%) |
| 20 to 24 Year Olds | 25 (100.0%) | 0 (0.0%) |
| 25 to 34 Year Olds | 43 (75.4%) | 14 (24.6%) |
| 35 Years and over | 0 (0.0%) | 0 (0.0%) |
| Total | 311 (95.7%) | 14 (4.3%) |
Educational Attainment by Field of Study in Christmas
Education (113 | 26.0%), business (86 | 19.8%), liberal arts & history (63 | 14.5%), science & technology (45 | 10.4%), and arts & humanities (40 | 9.2%) are the most common fields of study among 434 individuals in Christmas who have obtained a bachelor's degree or higher.
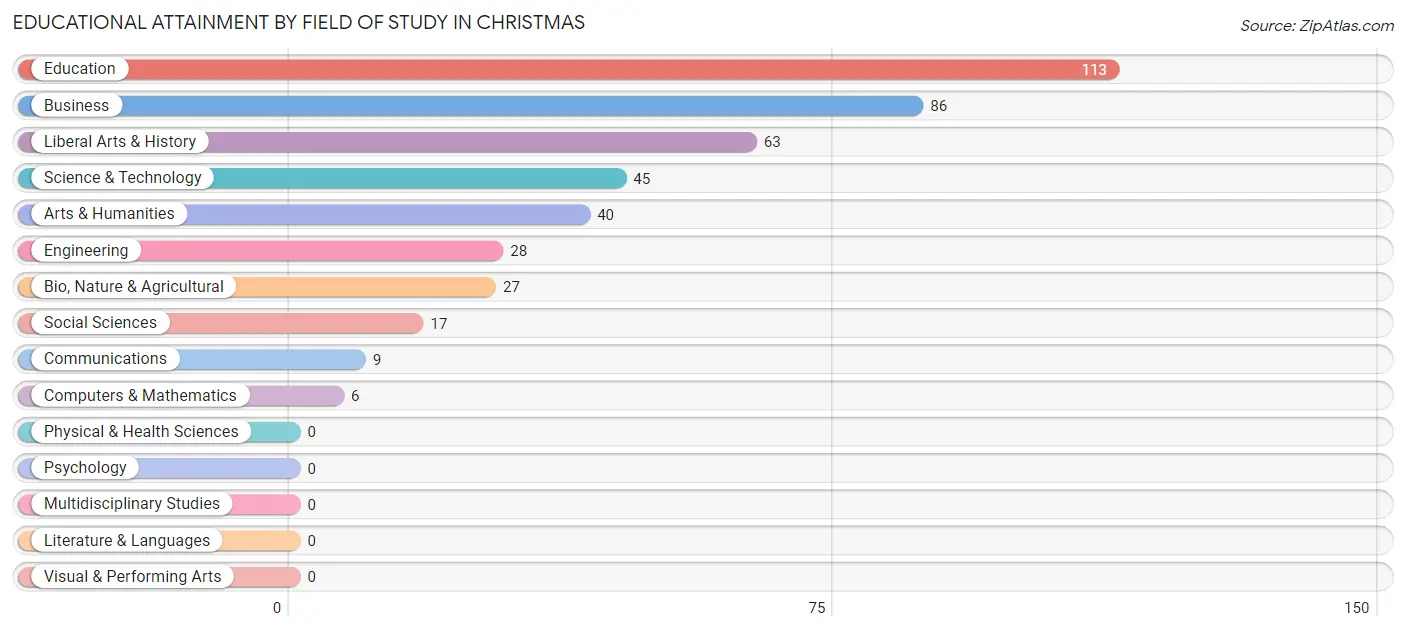
| Field of Study | # Graduates | % Graduates |
| Computers & Mathematics | 6 | 1.4% |
| Bio, Nature & Agricultural | 27 | 6.2% |
| Physical & Health Sciences | 0 | 0.0% |
| Psychology | 0 | 0.0% |
| Social Sciences | 17 | 3.9% |
| Engineering | 28 | 6.5% |
| Multidisciplinary Studies | 0 | 0.0% |
| Science & Technology | 45 | 10.4% |
| Business | 86 | 19.8% |
| Education | 113 | 26.0% |
| Literature & Languages | 0 | 0.0% |
| Liberal Arts & History | 63 | 14.5% |
| Visual & Performing Arts | 0 | 0.0% |
| Communications | 9 | 2.1% |
| Arts & Humanities | 40 | 9.2% |
| Total | 434 | 100.0% |
Transportation & Commute in Christmas
Vehicle Availability by Sex in Christmas
The most prevalent vehicle ownership categories in Christmas are males with 2 vehicles (271, accounting for 62.9%) and females with 2 vehicles (292, making up 55.0%).
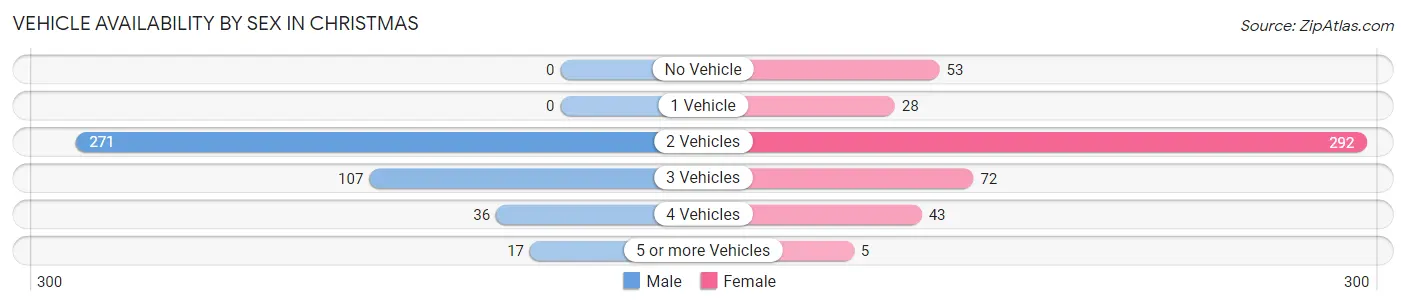
| Vehicles Available | Male | Female |
| No Vehicle | 0 (0.0%) | 53 (10.7%) |
| 1 Vehicle | 0 (0.0%) | 28 (5.7%) |
| 2 Vehicles | 271 (62.9%) | 292 (59.2%) |
| 3 Vehicles | 107 (24.8%) | 72 (14.6%) |
| 4 Vehicles | 36 (8.4%) | 43 (8.7%) |
| 5 or more Vehicles | 17 (3.9%) | 5 (1.0%) |
| Total | 431 (100.0%) | 493 (100.0%) |
Commute Time in Christmas
The most frequently occuring commute durations in Christmas are 15 to 19 minutes (241 commuters, 26.5%), 45 to 59 minutes (117 commuters, 12.9%), and 20 to 24 minutes (116 commuters, 12.8%).
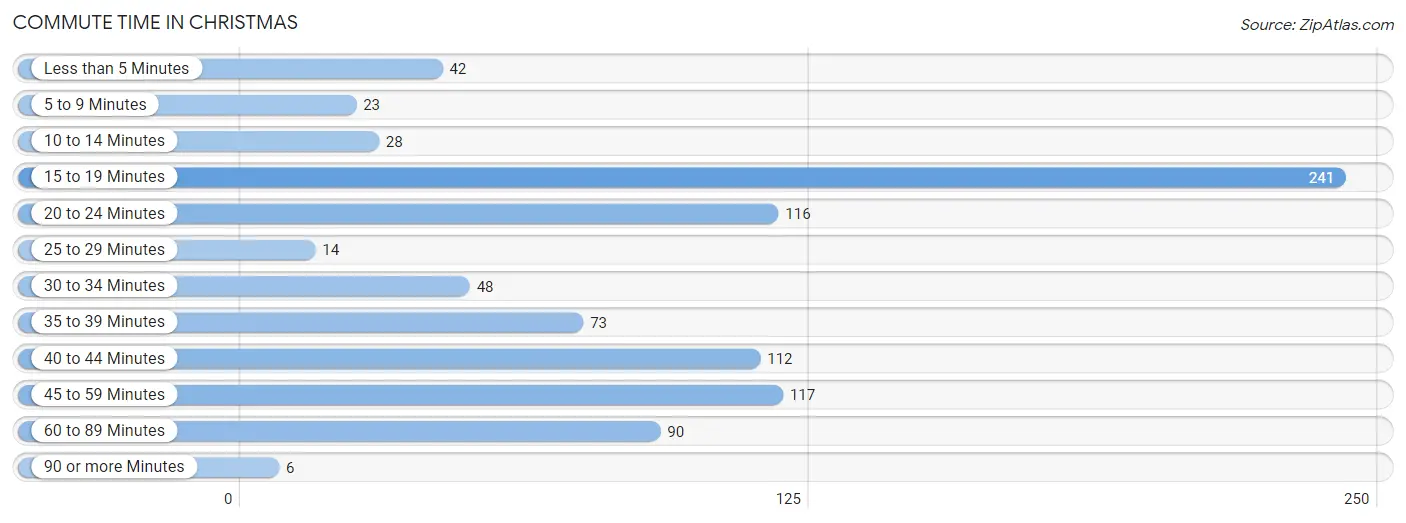
| Commute Time | # Commuters | % Commuters |
| Less than 5 Minutes | 42 | 4.6% |
| 5 to 9 Minutes | 23 | 2.5% |
| 10 to 14 Minutes | 28 | 3.1% |
| 15 to 19 Minutes | 241 | 26.5% |
| 20 to 24 Minutes | 116 | 12.8% |
| 25 to 29 Minutes | 14 | 1.5% |
| 30 to 34 Minutes | 48 | 5.3% |
| 35 to 39 Minutes | 73 | 8.0% |
| 40 to 44 Minutes | 112 | 12.3% |
| 45 to 59 Minutes | 117 | 12.9% |
| 60 to 89 Minutes | 90 | 9.9% |
| 90 or more Minutes | 6 | 0.7% |
Commute Time by Sex in Christmas
The most common commute times in Christmas are 20 to 24 minutes (92 commuters, 21.3%) for males and 15 to 19 minutes (189 commuters, 39.5%) for females.
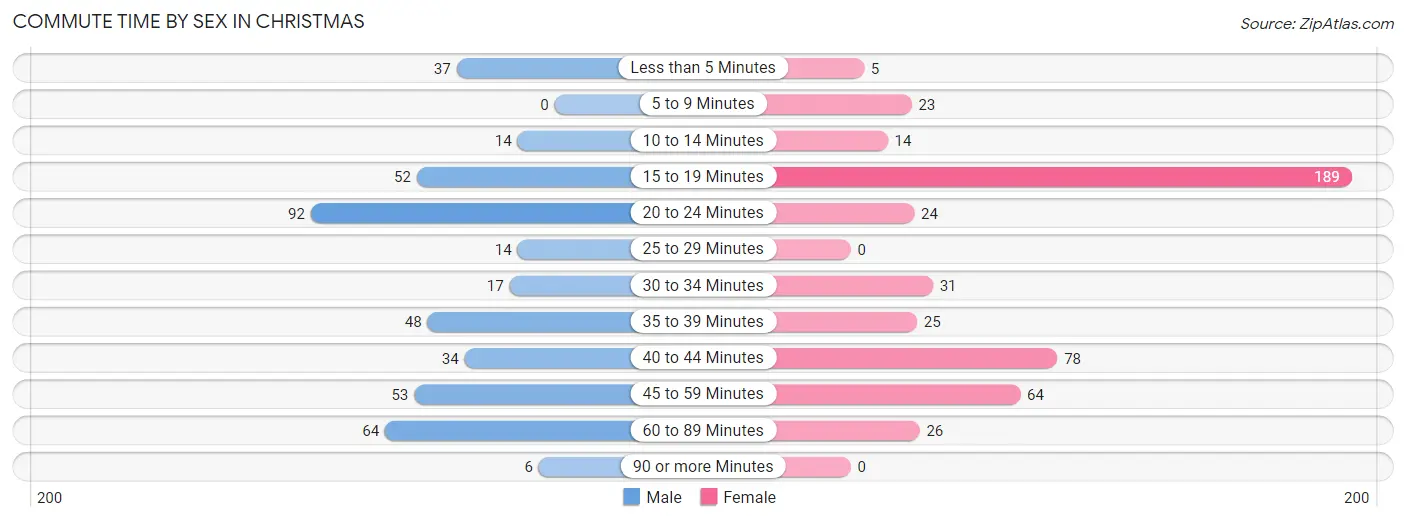
| Commute Time | Male | Female |
| Less than 5 Minutes | 37 (8.6%) | 5 (1.0%) |
| 5 to 9 Minutes | 0 (0.0%) | 23 (4.8%) |
| 10 to 14 Minutes | 14 (3.3%) | 14 (2.9%) |
| 15 to 19 Minutes | 52 (12.1%) | 189 (39.5%) |
| 20 to 24 Minutes | 92 (21.3%) | 24 (5.0%) |
| 25 to 29 Minutes | 14 (3.3%) | 0 (0.0%) |
| 30 to 34 Minutes | 17 (3.9%) | 31 (6.5%) |
| 35 to 39 Minutes | 48 (11.1%) | 25 (5.2%) |
| 40 to 44 Minutes | 34 (7.9%) | 78 (16.3%) |
| 45 to 59 Minutes | 53 (12.3%) | 64 (13.4%) |
| 60 to 89 Minutes | 64 (14.8%) | 26 (5.4%) |
| 90 or more Minutes | 6 (1.4%) | 0 (0.0%) |
Time of Departure to Work by Sex in Christmas
The most frequent times of departure to work in Christmas are 6:00 AM to 6:29 AM (137, 31.8%) for males and 12:00 AM to 4:59 AM (102, 21.3%) for females.
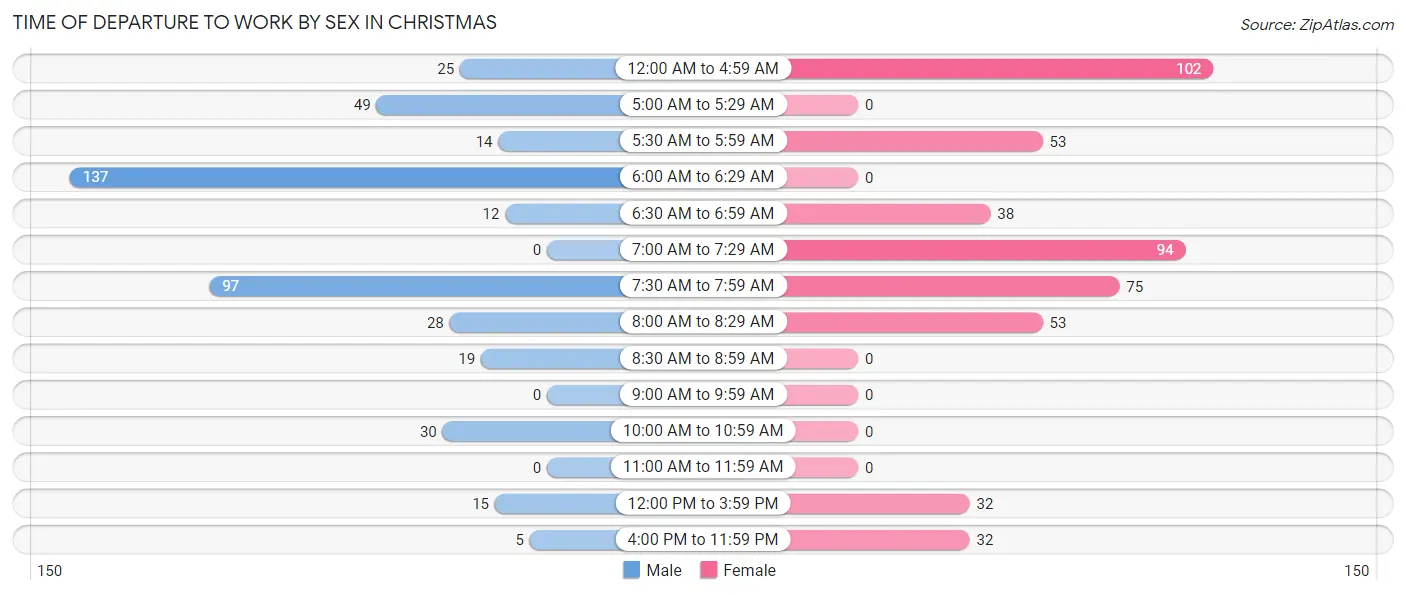
| Time of Departure | Male | Female |
| 12:00 AM to 4:59 AM | 25 (5.8%) | 102 (21.3%) |
| 5:00 AM to 5:29 AM | 49 (11.4%) | 0 (0.0%) |
| 5:30 AM to 5:59 AM | 14 (3.3%) | 53 (11.1%) |
| 6:00 AM to 6:29 AM | 137 (31.8%) | 0 (0.0%) |
| 6:30 AM to 6:59 AM | 12 (2.8%) | 38 (7.9%) |
| 7:00 AM to 7:29 AM | 0 (0.0%) | 94 (19.6%) |
| 7:30 AM to 7:59 AM | 97 (22.5%) | 75 (15.7%) |
| 8:00 AM to 8:29 AM | 28 (6.5%) | 53 (11.1%) |
| 8:30 AM to 8:59 AM | 19 (4.4%) | 0 (0.0%) |
| 9:00 AM to 9:59 AM | 0 (0.0%) | 0 (0.0%) |
| 10:00 AM to 10:59 AM | 30 (7.0%) | 0 (0.0%) |
| 11:00 AM to 11:59 AM | 0 (0.0%) | 0 (0.0%) |
| 12:00 PM to 3:59 PM | 15 (3.5%) | 32 (6.7%) |
| 4:00 PM to 11:59 PM | 5 (1.2%) | 32 (6.7%) |
| Total | 431 (100.0%) | 479 (100.0%) |
Housing Occupancy in Christmas
Occupancy by Ownership in Christmas
Of the total 633 dwellings in Christmas, owner-occupied units account for 524 (82.8%), while renter-occupied units make up 109 (17.2%).
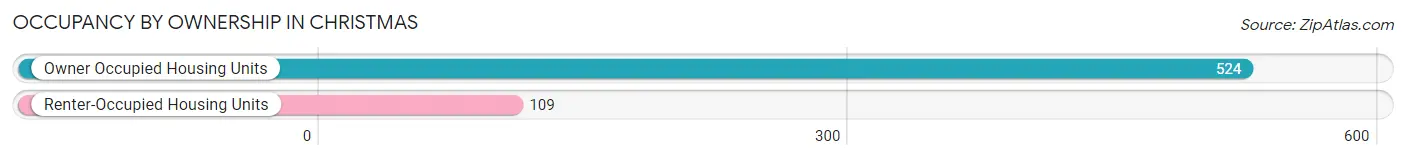
| Occupancy | # Housing Units | % Housing Units |
| Owner Occupied Housing Units | 524 | 82.8% |
| Renter-Occupied Housing Units | 109 | 17.2% |
| Total Occupied Housing Units | 633 | 100.0% |
Occupancy by Household Size in Christmas
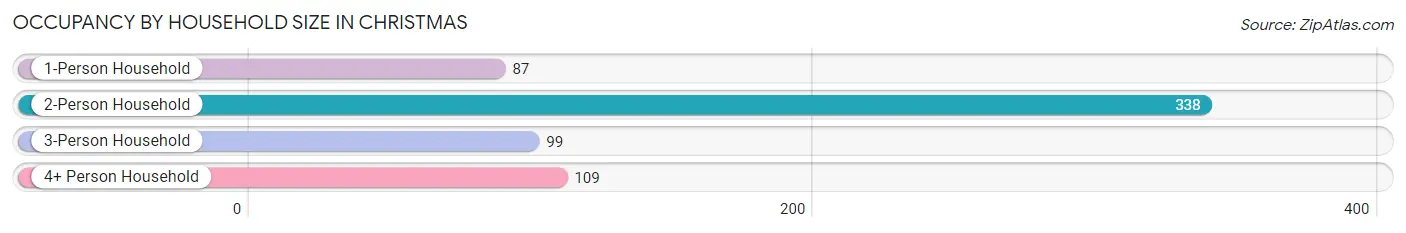
| Household Size | # Housing Units | % Housing Units |
| 1-Person Household | 87 | 13.7% |
| 2-Person Household | 338 | 53.4% |
| 3-Person Household | 99 | 15.6% |
| 4+ Person Household | 109 | 17.2% |
| Total Housing Units | 633 | 100.0% |
Occupancy by Ownership by Household Size in Christmas
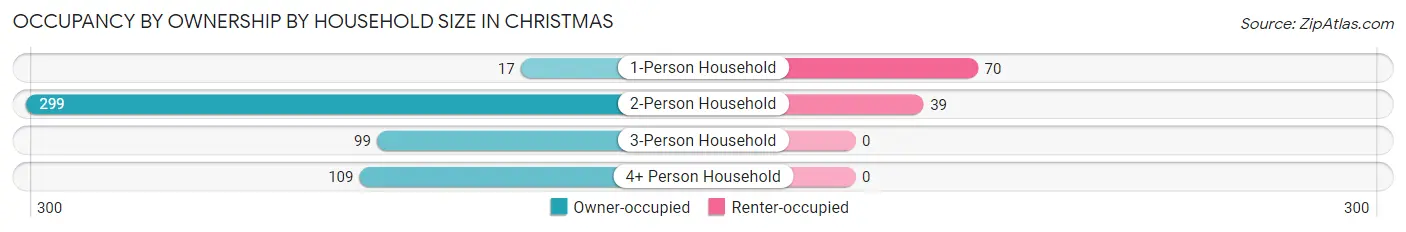
| Household Size | Owner-occupied | Renter-occupied |
| 1-Person Household | 17 (19.5%) | 70 (80.5%) |
| 2-Person Household | 299 (88.5%) | 39 (11.5%) |
| 3-Person Household | 99 (100.0%) | 0 (0.0%) |
| 4+ Person Household | 109 (100.0%) | 0 (0.0%) |
| Total Housing Units | 524 (82.8%) | 109 (17.2%) |
Occupancy by Educational Attainment in Christmas
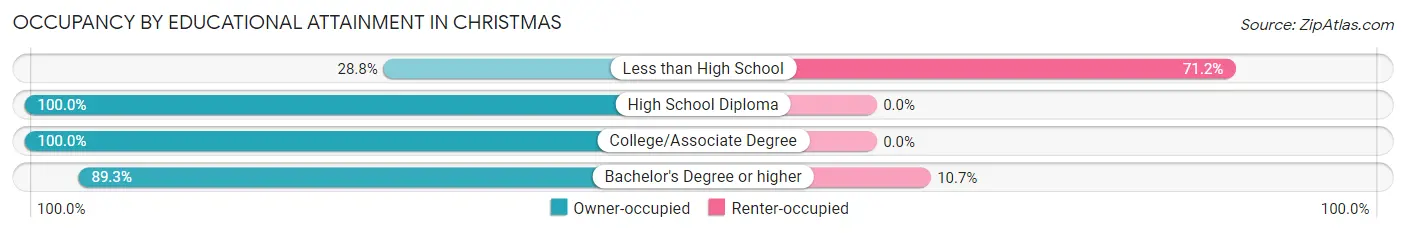
| Household Size | Owner-occupied | Renter-occupied |
| Less than High School | 32 (28.8%) | 79 (71.2%) |
| High School Diploma | 81 (100.0%) | 0 (0.0%) |
| College/Associate Degree | 161 (100.0%) | 0 (0.0%) |
| Bachelor's Degree or higher | 250 (89.3%) | 30 (10.7%) |
Occupancy by Age of Householder in Christmas
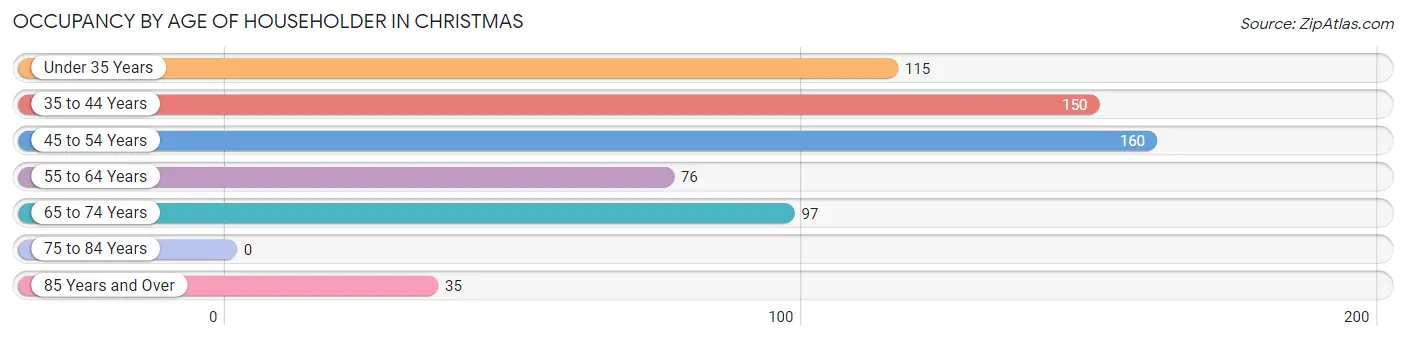
| Age Bracket | # Households | % Households |
| Under 35 Years | 115 | 18.2% |
| 35 to 44 Years | 150 | 23.7% |
| 45 to 54 Years | 160 | 25.3% |
| 55 to 64 Years | 76 | 12.0% |
| 65 to 74 Years | 97 | 15.3% |
| 75 to 84 Years | 0 | 0.0% |
| 85 Years and Over | 35 | 5.5% |
| Total | 633 | 100.0% |
Housing Finances in Christmas
Median Income by Occupancy in Christmas
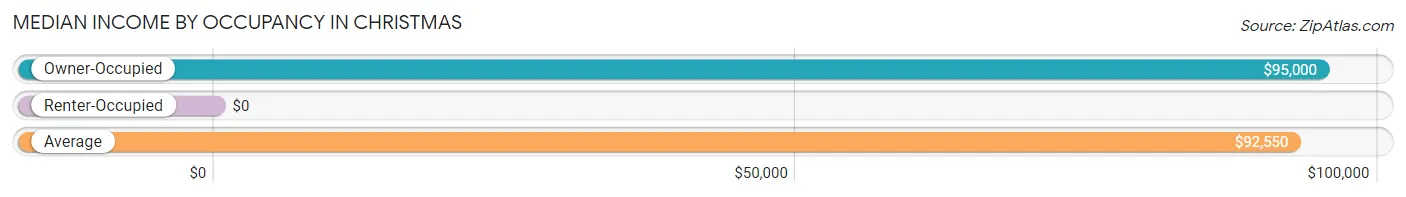
| Occupancy Type | # Households | Median Income |
| Owner-Occupied | 524 (82.8%) | $95,000 |
| Renter-Occupied | 109 (17.2%) | $0 |
| Average | 633 (100.0%) | $92,550 |
Occupancy by Householder Income Bracket in Christmas
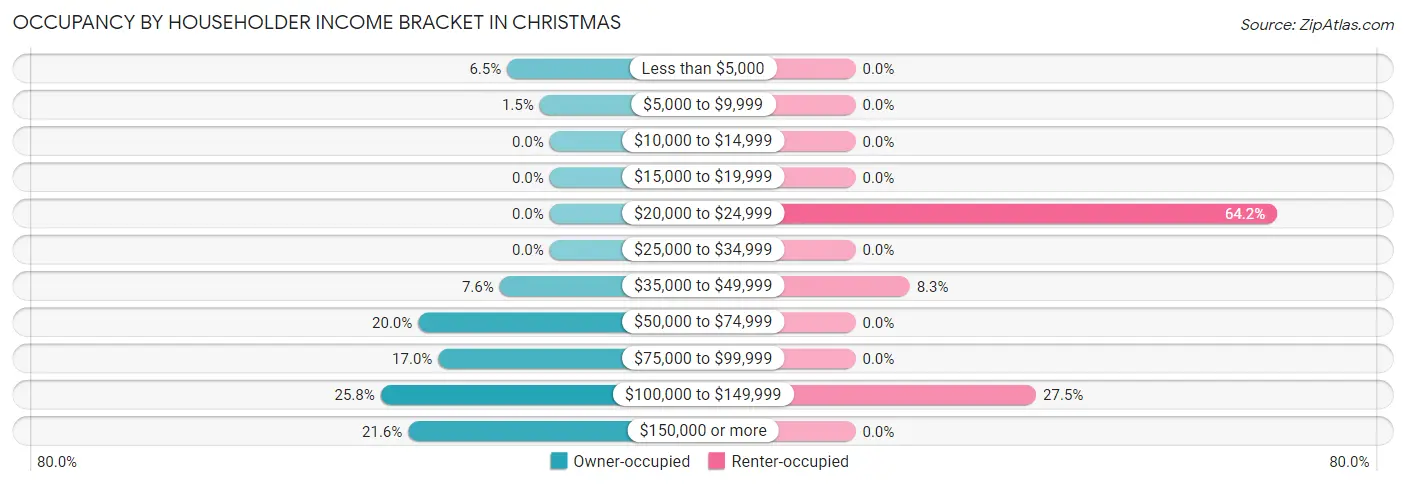
| Income Bracket | Owner-occupied | Renter-occupied |
| Less than $5,000 | 34 (6.5%) | 0 (0.0%) |
| $5,000 to $9,999 | 8 (1.5%) | 0 (0.0%) |
| $10,000 to $14,999 | 0 (0.0%) | 0 (0.0%) |
| $15,000 to $19,999 | 0 (0.0%) | 0 (0.0%) |
| $20,000 to $24,999 | 0 (0.0%) | 70 (64.2%) |
| $25,000 to $34,999 | 0 (0.0%) | 0 (0.0%) |
| $35,000 to $49,999 | 40 (7.6%) | 9 (8.3%) |
| $50,000 to $74,999 | 105 (20.0%) | 0 (0.0%) |
| $75,000 to $99,999 | 89 (17.0%) | 0 (0.0%) |
| $100,000 to $149,999 | 135 (25.8%) | 30 (27.5%) |
| $150,000 or more | 113 (21.6%) | 0 (0.0%) |
| Total | 524 (100.0%) | 109 (100.0%) |
Monthly Housing Cost Tiers in Christmas
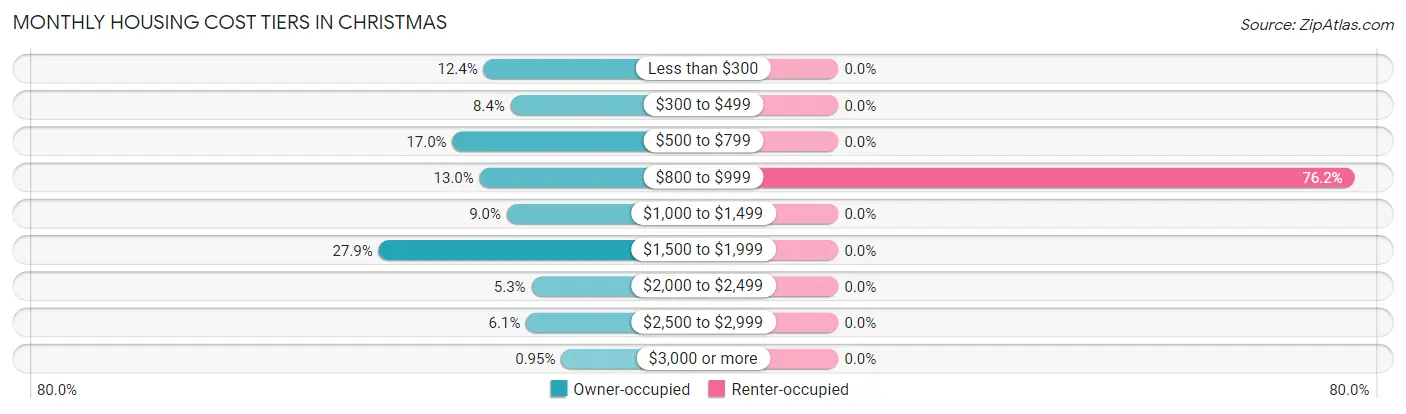
| Monthly Cost | Owner-occupied | Renter-occupied |
| Less than $300 | 65 (12.4%) | 0 (0.0%) |
| $300 to $499 | 44 (8.4%) | 0 (0.0%) |
| $500 to $799 | 89 (17.0%) | 0 (0.0%) |
| $800 to $999 | 68 (13.0%) | 83 (76.1%) |
| $1,000 to $1,499 | 47 (9.0%) | 0 (0.0%) |
| $1,500 to $1,999 | 146 (27.9%) | 0 (0.0%) |
| $2,000 to $2,499 | 28 (5.3%) | 0 (0.0%) |
| $2,500 to $2,999 | 32 (6.1%) | 0 (0.0%) |
| $3,000 or more | 5 (0.9%) | 0 (0.0%) |
| Total | 524 (100.0%) | 109 (100.0%) |
Physical Housing Characteristics in Christmas
Housing Structures in Christmas
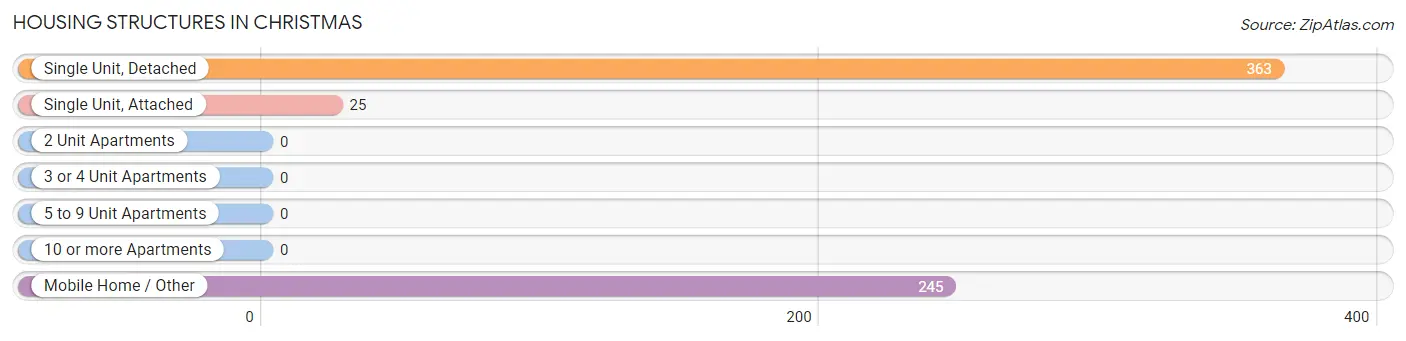
| Structure Type | # Housing Units | % Housing Units |
| Single Unit, Detached | 363 | 57.4% |
| Single Unit, Attached | 25 | 4.0% |
| 2 Unit Apartments | 0 | 0.0% |
| 3 or 4 Unit Apartments | 0 | 0.0% |
| 5 to 9 Unit Apartments | 0 | 0.0% |
| 10 or more Apartments | 0 | 0.0% |
| Mobile Home / Other | 245 | 38.7% |
| Total | 633 | 100.0% |
Housing Structures by Occupancy in Christmas
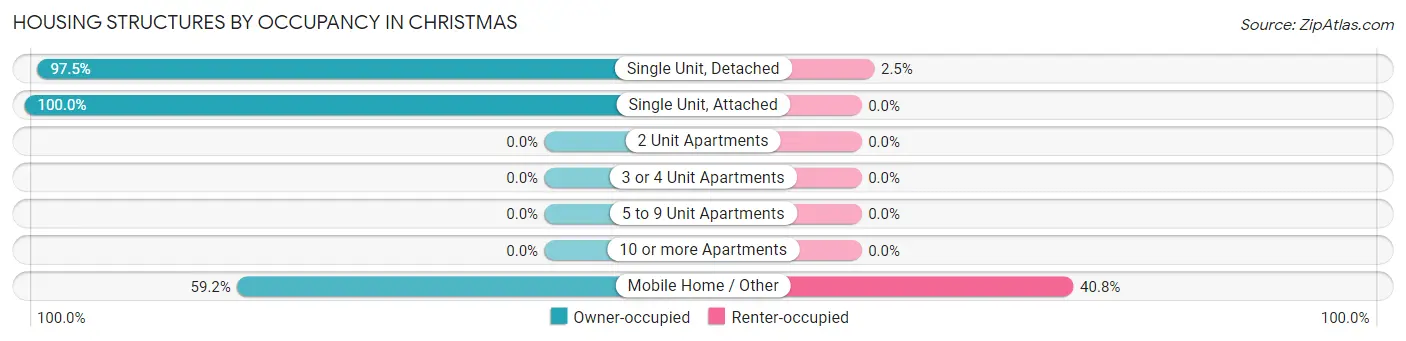
| Structure Type | Owner-occupied | Renter-occupied |
| Single Unit, Detached | 354 (97.5%) | 9 (2.5%) |
| Single Unit, Attached | 25 (100.0%) | 0 (0.0%) |
| 2 Unit Apartments | 0 (0.0%) | 0 (0.0%) |
| 3 or 4 Unit Apartments | 0 (0.0%) | 0 (0.0%) |
| 5 to 9 Unit Apartments | 0 (0.0%) | 0 (0.0%) |
| 10 or more Apartments | 0 (0.0%) | 0 (0.0%) |
| Mobile Home / Other | 145 (59.2%) | 100 (40.8%) |
| Total | 524 (82.8%) | 109 (17.2%) |
Housing Structures by Number of Rooms in Christmas
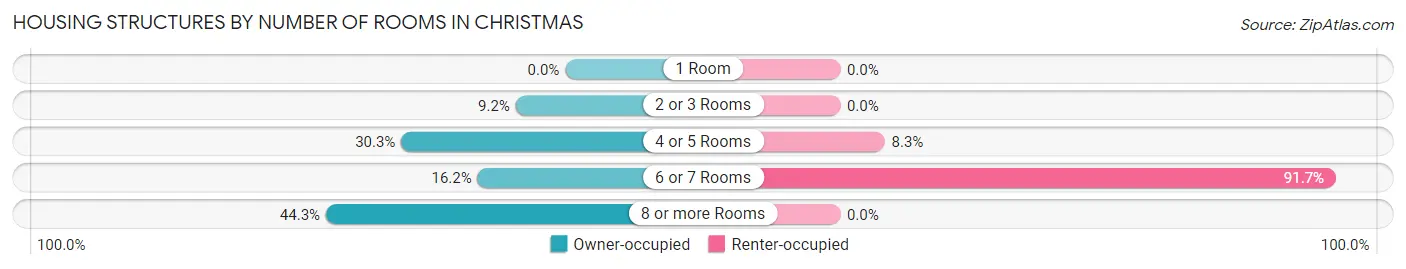
| Number of Rooms | Owner-occupied | Renter-occupied |
| 1 Room | 0 (0.0%) | 0 (0.0%) |
| 2 or 3 Rooms | 48 (9.2%) | 0 (0.0%) |
| 4 or 5 Rooms | 159 (30.3%) | 9 (8.3%) |
| 6 or 7 Rooms | 85 (16.2%) | 100 (91.7%) |
| 8 or more Rooms | 232 (44.3%) | 0 (0.0%) |
| Total | 524 (100.0%) | 109 (100.0%) |
Housing Structure by Heating Type in Christmas
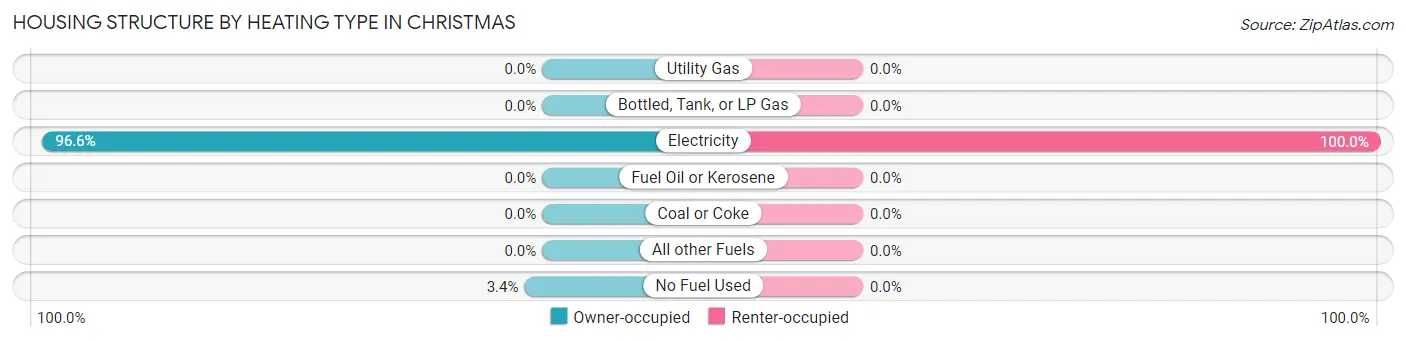
| Heating Type | Owner-occupied | Renter-occupied |
| Utility Gas | 0 (0.0%) | 0 (0.0%) |
| Bottled, Tank, or LP Gas | 0 (0.0%) | 0 (0.0%) |
| Electricity | 506 (96.6%) | 109 (100.0%) |
| Fuel Oil or Kerosene | 0 (0.0%) | 0 (0.0%) |
| Coal or Coke | 0 (0.0%) | 0 (0.0%) |
| All other Fuels | 0 (0.0%) | 0 (0.0%) |
| No Fuel Used | 18 (3.4%) | 0 (0.0%) |
| Total | 524 (100.0%) | 109 (100.0%) |
Household Vehicle Usage in Christmas
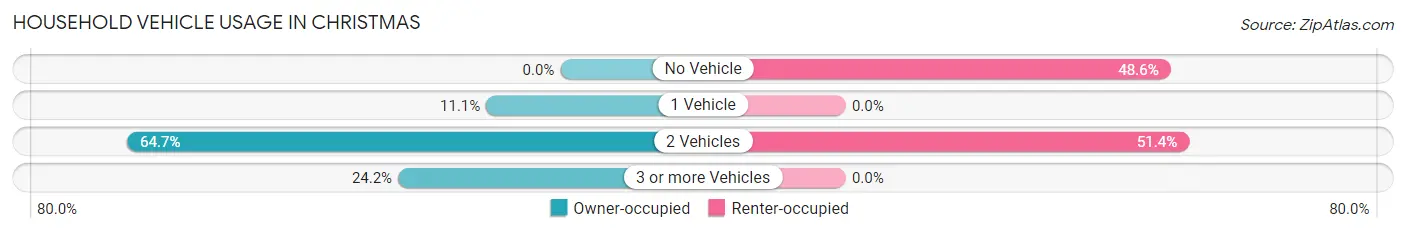
| Vehicles per Household | Owner-occupied | Renter-occupied |
| No Vehicle | 0 (0.0%) | 53 (48.6%) |
| 1 Vehicle | 58 (11.1%) | 0 (0.0%) |
| 2 Vehicles | 339 (64.7%) | 56 (51.4%) |
| 3 or more Vehicles | 127 (24.2%) | 0 (0.0%) |
| Total | 524 (100.0%) | 109 (100.0%) |
Real Estate & Mortgages in Christmas
Real Estate and Mortgage Overview in Christmas
| Characteristic | Without Mortgage | With Mortgage |
| Housing Units | 190 | 334 |
| Median Property Value | $464,700 | $276,300 |
| Median Household Income | $81,635 | $101 |
| Monthly Housing Costs | $467 | $5 |
| Real Estate Taxes | $1,290 | $0 |
Property Value by Mortgage Status in Christmas
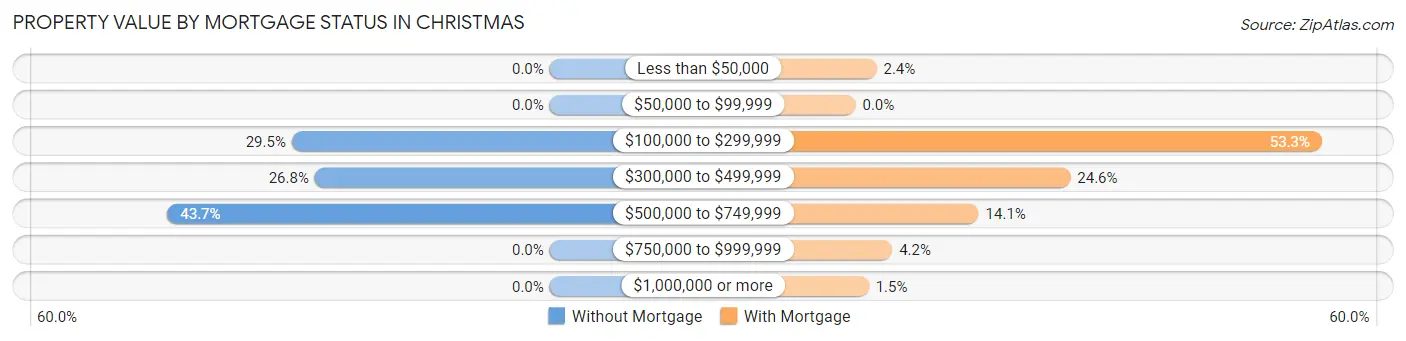
| Property Value | Without Mortgage | With Mortgage |
| Less than $50,000 | 0 (0.0%) | 8 (2.4%) |
| $50,000 to $99,999 | 0 (0.0%) | 0 (0.0%) |
| $100,000 to $299,999 | 56 (29.5%) | 178 (53.3%) |
| $300,000 to $499,999 | 51 (26.8%) | 82 (24.5%) |
| $500,000 to $749,999 | 83 (43.7%) | 47 (14.1%) |
| $750,000 to $999,999 | 0 (0.0%) | 14 (4.2%) |
| $1,000,000 or more | 0 (0.0%) | 5 (1.5%) |
| Total | 190 (100.0%) | 334 (100.0%) |
Household Income by Mortgage Status in Christmas
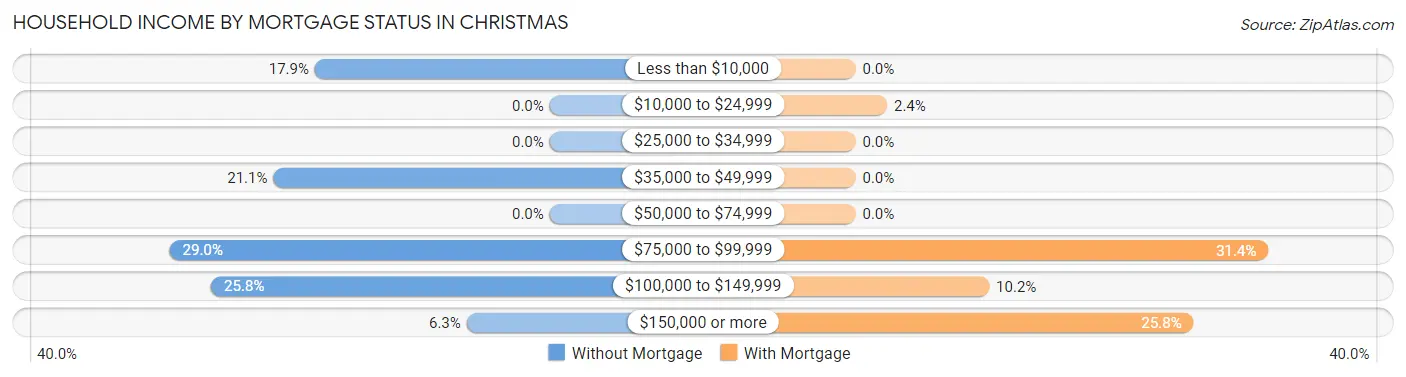
| Household Income | Without Mortgage | With Mortgage |
| Less than $10,000 | 34 (17.9%) | 0 (0.0%) |
| $10,000 to $24,999 | 0 (0.0%) | 8 (2.4%) |
| $25,000 to $34,999 | 0 (0.0%) | 0 (0.0%) |
| $35,000 to $49,999 | 40 (21.0%) | 0 (0.0%) |
| $50,000 to $74,999 | 0 (0.0%) | 0 (0.0%) |
| $75,000 to $99,999 | 55 (28.9%) | 105 (31.4%) |
| $100,000 to $149,999 | 49 (25.8%) | 34 (10.2%) |
| $150,000 or more | 12 (6.3%) | 86 (25.8%) |
| Total | 190 (100.0%) | 334 (100.0%) |
Property Value to Household Income Ratio in Christmas
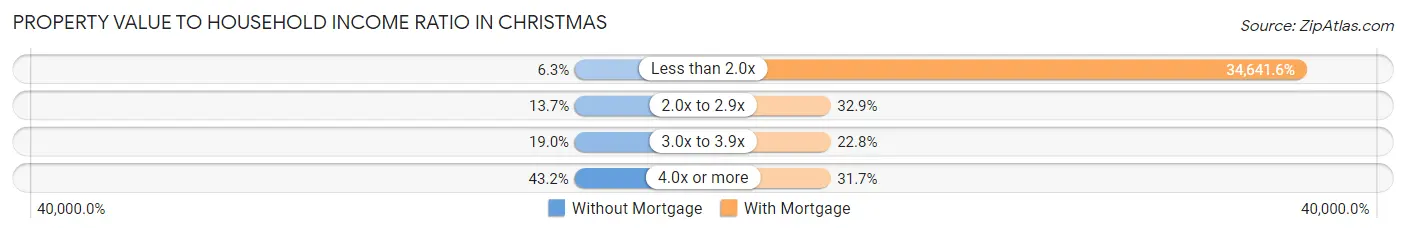
| Value-to-Income Ratio | Without Mortgage | With Mortgage |
| Less than 2.0x | 12 (6.3%) | 115,703 (34,641.6%) |
| 2.0x to 2.9x | 26 (13.7%) | 110 (32.9%) |
| 3.0x to 3.9x | 36 (19.0%) | 76 (22.8%) |
| 4.0x or more | 82 (43.2%) | 106 (31.7%) |
| Total | 190 (100.0%) | 334 (100.0%) |
Real Estate Taxes by Mortgage Status in Christmas
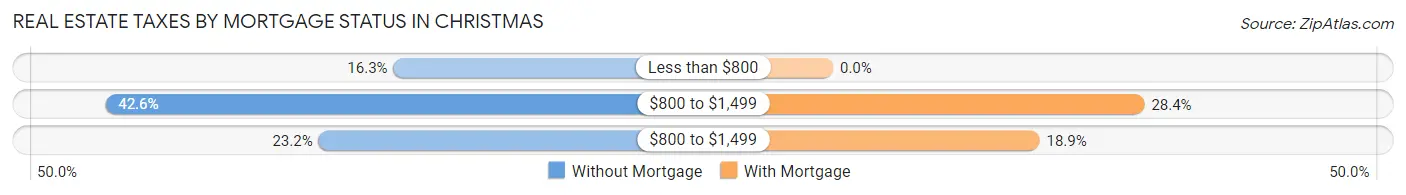
| Property Taxes | Without Mortgage | With Mortgage |
| Less than $800 | 31 (16.3%) | 0 (0.0%) |
| $800 to $1,499 | 81 (42.6%) | 95 (28.4%) |
| $800 to $1,499 | 44 (23.2%) | 63 (18.9%) |
| Total | 190 (100.0%) | 334 (100.0%) |
Health & Disability in Christmas
Health Insurance Coverage by Age in Christmas
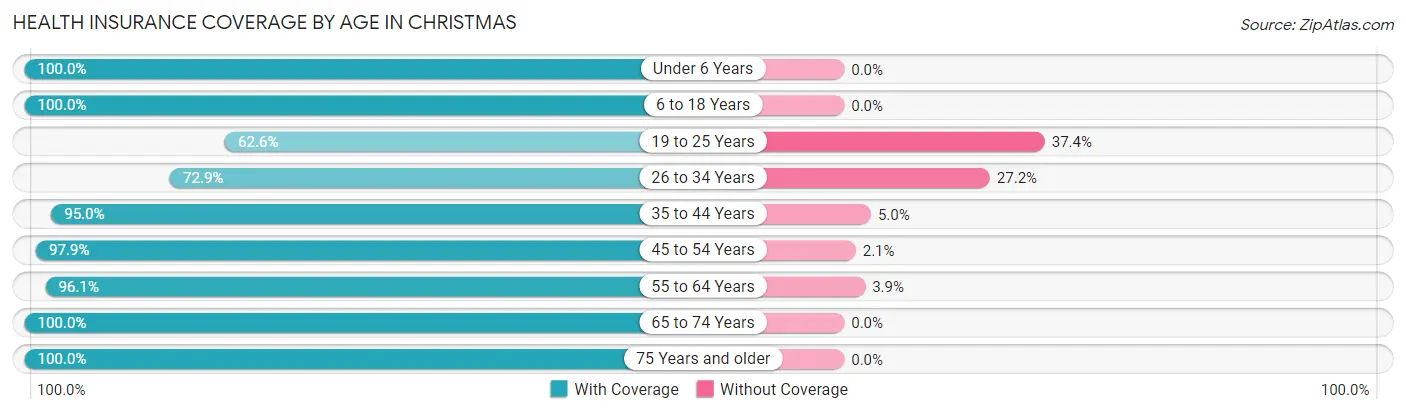
| Age Bracket | With Coverage | Without Coverage |
| Under 6 Years | 59 (100.0%) | 0 (0.0%) |
| 6 to 18 Years | 199 (100.0%) | 0 (0.0%) |
| 19 to 25 Years | 72 (62.6%) | 43 (37.4%) |
| 26 to 34 Years | 110 (72.9%) | 41 (27.2%) |
| 35 to 44 Years | 267 (95.0%) | 14 (5.0%) |
| 45 to 54 Years | 274 (97.9%) | 6 (2.1%) |
| 55 to 64 Years | 197 (96.1%) | 8 (3.9%) |
| 65 to 74 Years | 185 (100.0%) | 0 (0.0%) |
| 75 Years and older | 70 (100.0%) | 0 (0.0%) |
| Total | 1,433 (92.7%) | 112 (7.2%) |
Health Insurance Coverage by Citizenship Status in Christmas
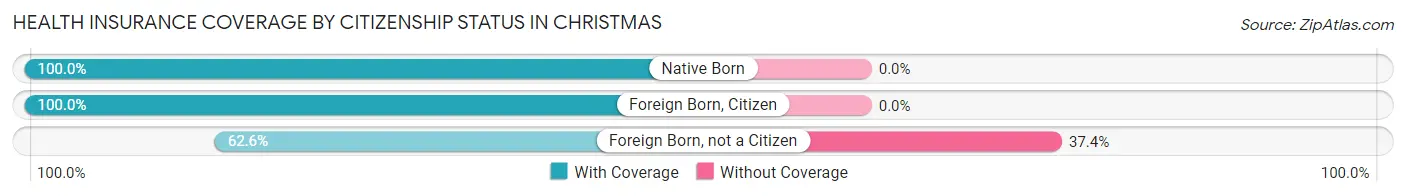
| Citizenship Status | With Coverage | Without Coverage |
| Native Born | 59 (100.0%) | 0 (0.0%) |
| Foreign Born, Citizen | 199 (100.0%) | 0 (0.0%) |
| Foreign Born, not a Citizen | 72 (62.6%) | 43 (37.4%) |
Health Insurance Coverage by Household Income in Christmas
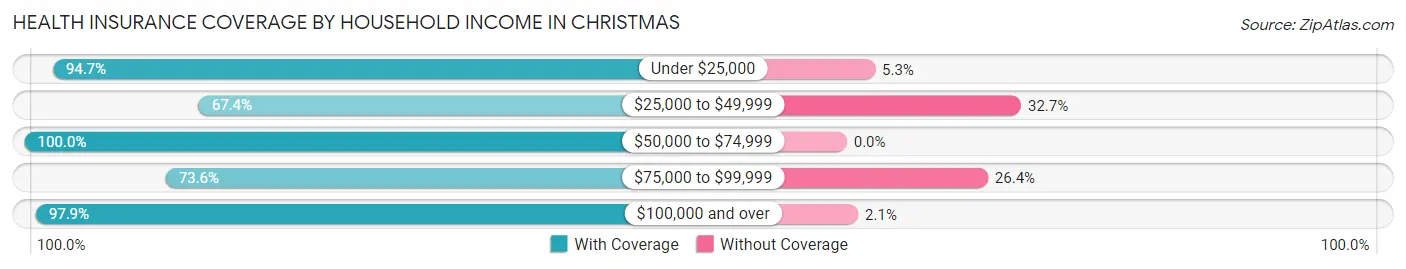
| Household Income | With Coverage | Without Coverage |
| Under $25,000 | 143 (94.7%) | 8 (5.3%) |
| $25,000 to $49,999 | 66 (67.3%) | 32 (32.7%) |
| $50,000 to $74,999 | 288 (100.0%) | 0 (0.0%) |
| $75,000 to $99,999 | 153 (73.6%) | 55 (26.4%) |
| $100,000 and over | 783 (97.9%) | 17 (2.1%) |
Public vs Private Health Insurance Coverage by Age in Christmas
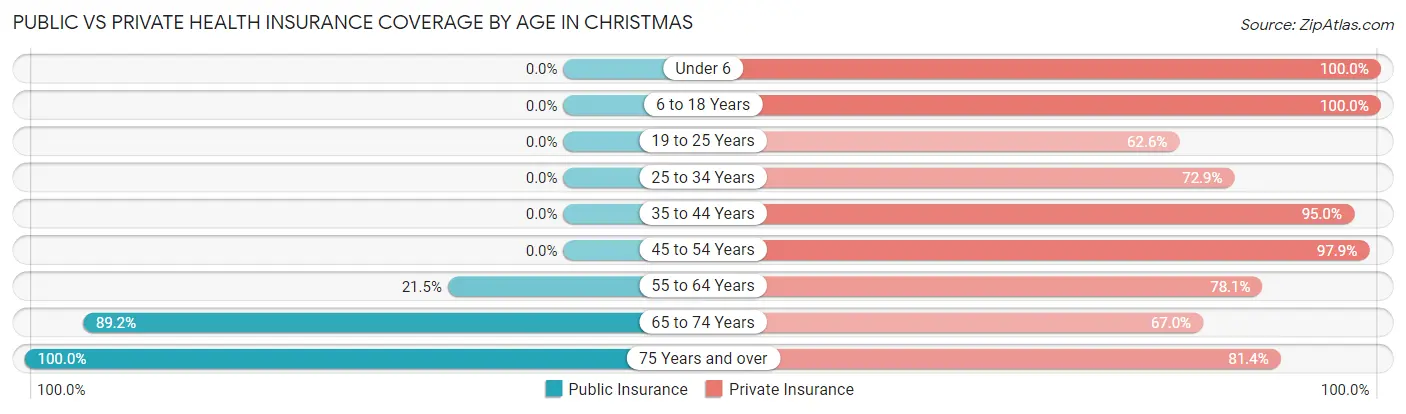
| Age Bracket | Public Insurance | Private Insurance |
| Under 6 | 0 (0.0%) | 59 (100.0%) |
| 6 to 18 Years | 0 (0.0%) | 199 (100.0%) |
| 19 to 25 Years | 0 (0.0%) | 72 (62.6%) |
| 25 to 34 Years | 0 (0.0%) | 110 (72.9%) |
| 35 to 44 Years | 0 (0.0%) | 267 (95.0%) |
| 45 to 54 Years | 0 (0.0%) | 274 (97.9%) |
| 55 to 64 Years | 44 (21.5%) | 160 (78.0%) |
| 65 to 74 Years | 165 (89.2%) | 124 (67.0%) |
| 75 Years and over | 70 (100.0%) | 57 (81.4%) |
| Total | 279 (18.1%) | 1,322 (85.6%) |
Disability Status by Sex by Age in Christmas
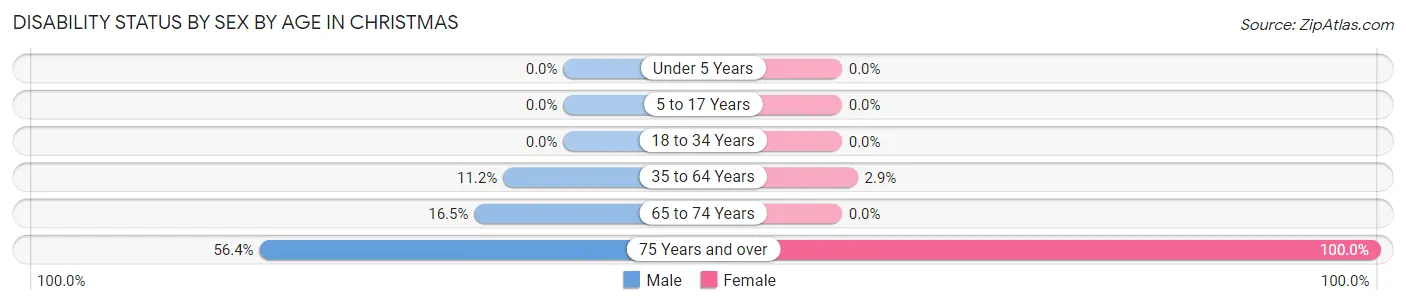
| Age Bracket | Male | Female |
| Under 5 Years | 0 (0.0%) | 0 (0.0%) |
| 5 to 17 Years | 0 (0.0%) | 0 (0.0%) |
| 18 to 34 Years | 0 (0.0%) | 0 (0.0%) |
| 35 to 64 Years | 40 (11.2%) | 12 (2.9%) |
| 65 to 74 Years | 20 (16.5%) | 0 (0.0%) |
| 75 Years and over | 22 (56.4%) | 31 (100.0%) |
Disability Class by Sex by Age in Christmas
Disability Class: Hearing Difficulty
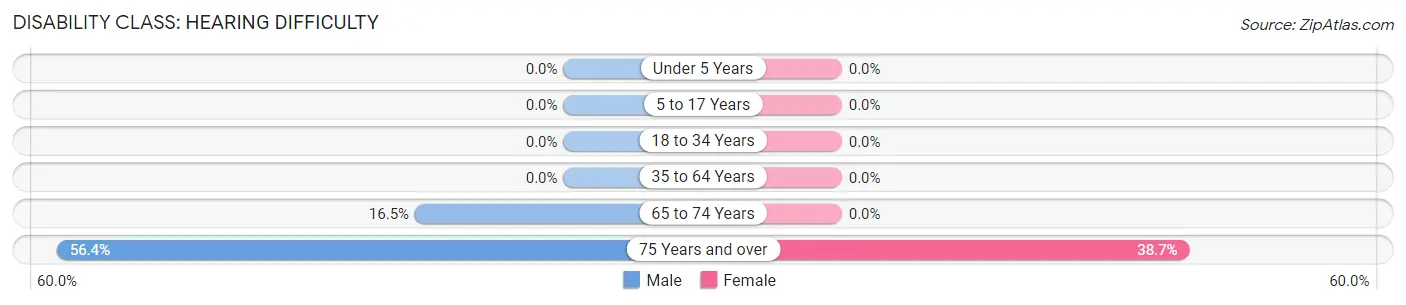
| Age Bracket | Male | Female |
| Under 5 Years | 0 (0.0%) | 0 (0.0%) |
| 5 to 17 Years | 0 (0.0%) | 0 (0.0%) |
| 18 to 34 Years | 0 (0.0%) | 0 (0.0%) |
| 35 to 64 Years | 0 (0.0%) | 0 (0.0%) |
| 65 to 74 Years | 20 (16.5%) | 0 (0.0%) |
| 75 Years and over | 22 (56.4%) | 12 (38.7%) |
Disability Class: Vision Difficulty
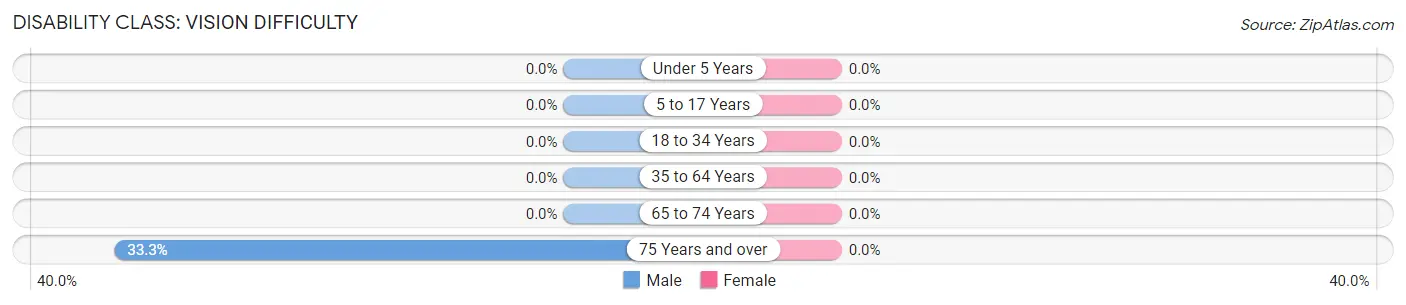
| Age Bracket | Male | Female |
| Under 5 Years | 0 (0.0%) | 0 (0.0%) |
| 5 to 17 Years | 0 (0.0%) | 0 (0.0%) |
| 18 to 34 Years | 0 (0.0%) | 0 (0.0%) |
| 35 to 64 Years | 0 (0.0%) | 0 (0.0%) |
| 65 to 74 Years | 0 (0.0%) | 0 (0.0%) |
| 75 Years and over | 13 (33.3%) | 0 (0.0%) |
Disability Class: Cognitive Difficulty
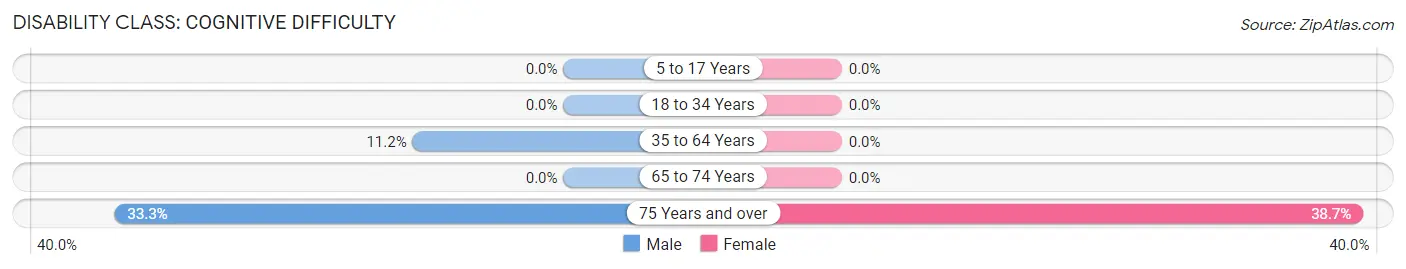
| Age Bracket | Male | Female |
| 5 to 17 Years | 0 (0.0%) | 0 (0.0%) |
| 18 to 34 Years | 0 (0.0%) | 0 (0.0%) |
| 35 to 64 Years | 40 (11.2%) | 0 (0.0%) |
| 65 to 74 Years | 0 (0.0%) | 0 (0.0%) |
| 75 Years and over | 13 (33.3%) | 12 (38.7%) |
Disability Class: Ambulatory Difficulty
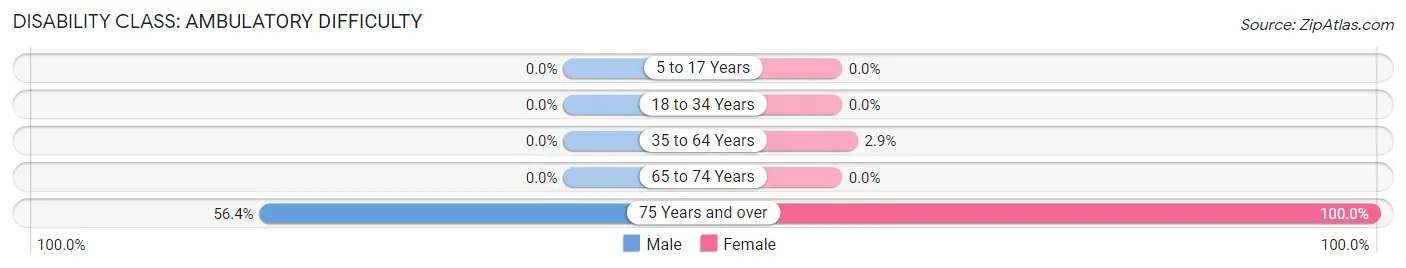
| Age Bracket | Male | Female |
| 5 to 17 Years | 0 (0.0%) | 0 (0.0%) |
| 18 to 34 Years | 0 (0.0%) | 0 (0.0%) |
| 35 to 64 Years | 0 (0.0%) | 12 (2.9%) |
| 65 to 74 Years | 0 (0.0%) | 0 (0.0%) |
| 75 Years and over | 22 (56.4%) | 31 (100.0%) |
Disability Class: Self-Care Difficulty
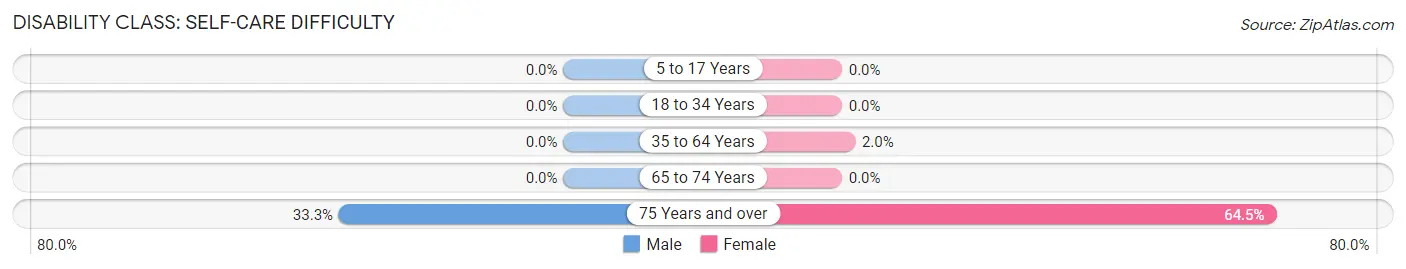
| Age Bracket | Male | Female |
| 5 to 17 Years | 0 (0.0%) | 0 (0.0%) |
| 18 to 34 Years | 0 (0.0%) | 0 (0.0%) |
| 35 to 64 Years | 0 (0.0%) | 8 (2.0%) |
| 65 to 74 Years | 0 (0.0%) | 0 (0.0%) |
| 75 Years and over | 13 (33.3%) | 20 (64.5%) |
Technology Access in Christmas
Computing Device Access in Christmas
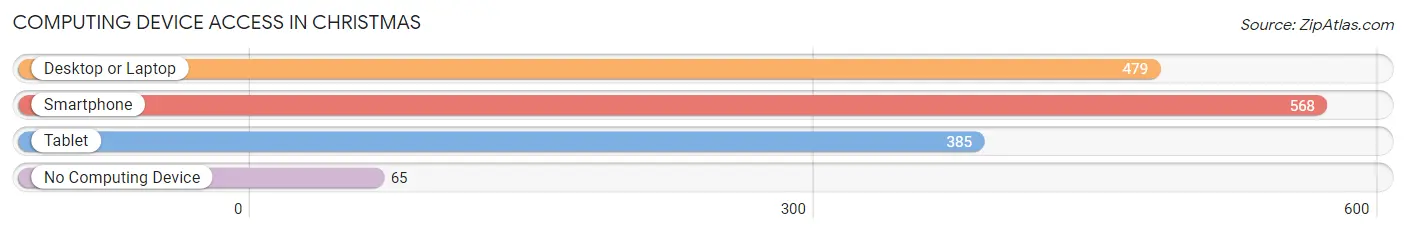
| Device Type | # Households | % Households |
| Desktop or Laptop | 479 | 75.7% |
| Smartphone | 568 | 89.7% |
| Tablet | 385 | 60.8% |
| No Computing Device | 65 | 10.3% |
| Total | 633 | 100.0% |
Internet Access in Christmas
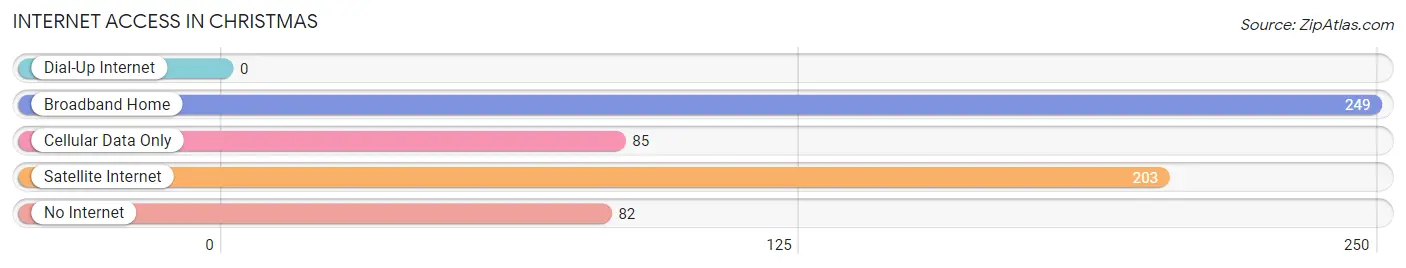
| Internet Type | # Households | % Households |
| Dial-Up Internet | 0 | 0.0% |
| Broadband Home | 249 | 39.3% |
| Cellular Data Only | 85 | 13.4% |
| Satellite Internet | 203 | 32.1% |
| No Internet | 82 | 13.0% |
| Total | 633 | 100.0% |
Christmas Summary
Christmas, Florida is a small unincorporated community located in Orange County, Florida. It is situated approximately 20 miles east of Orlando and is part of the Orlando-Kissimmee-Sanford Metropolitan Statistical Area. The population of Christmas was estimated to be 1,717 in 2019.
History
Christmas, Florida was founded in 1837 by a group of settlers from Georgia. The town was named after the nearby Christmas Creek, which was named by the settlers for the Christmas holiday. The town was originally a farming community, but it eventually grew to include a post office, a general store, and a school.
In the early 1900s, the town began to experience a population boom due to the arrival of the railroad. This allowed for the transportation of goods and people to and from the town. The railroad also allowed for the development of the citrus industry in the area, which further increased the population.
In the 1950s, the town began to experience a decline in population due to the development of nearby Orlando. This caused many of the residents to move away from the town in search of better job opportunities.
Geography
Christmas is located in Orange County, Florida. It is situated approximately 20 miles east of Orlando and is part of the Orlando-Kissimmee-Sanford Metropolitan Statistical Area. The town is located on the northern shore of Lake Christmas, which is a natural freshwater lake. The lake is fed by several small creeks and is surrounded by wetlands and pine forests.
The town is located in a humid subtropical climate zone, which is characterized by hot, humid summers and mild winters. The average temperature in the summer is around 90 degrees Fahrenheit, while the average temperature in the winter is around 60 degrees Fahrenheit.
Economy
Christmas, Florida is primarily a residential community, but it does have some small businesses. The town is home to several small retail stores, restaurants, and other businesses. The town is also home to a few small manufacturing companies.
The town is also home to a few tourist attractions, such as the Christmas Historical Museum and the Christmas Wildlife Refuge. These attractions draw in visitors from all over the world.
Demographics
The population of Christmas was estimated to be 1,717 in 2019. The town is predominantly white, with the majority of the population being of European descent. The town also has a small Hispanic population, as well as a small African American population.
The median household income in Christmas is $45,000, which is slightly lower than the national average. The town has a poverty rate of 11.3%, which is slightly higher than the national average.
Conclusion
Christmas, Florida is a small unincorporated community located in Orange County, Florida. It is situated approximately 20 miles east of Orlando and is part of the Orlando-Kissimmee-Sanford Metropolitan Statistical Area. The population of Christmas was estimated to be 1,717 in 2019. The town is predominantly white, with the majority of the population being of European descent. The town is primarily a residential community, but it does have some small businesses. The town is also home to a few tourist attractions, such as the Christmas Historical Museum and the Christmas Wildlife Refuge. The median household income in Christmas is $45,000, which is slightly lower than the national average.
Common Questions
What is Per Capita Income in Christmas?
Per Capita income in Christmas is $39,586.
What is the Median Family Income in Christmas?
Median Family Income in Christmas is $96,964.
What is the Median Household income in Christmas?
Median Household Income in Christmas is $92,550.
What is Income or Wage Gap in Christmas?
Income or Wage Gap in Christmas is 7.1%.
Women in Christmas earn 92.9 cents for every dollar earned by a man.
What is Inequality or Gini Index in Christmas?
Inequality or Gini Index in Christmas is 0.39.
What is the Total Population of Christmas?
Total Population of Christmas is 1,545.
What is the Total Male Population of Christmas?
Total Male Population of Christmas is 799.
What is the Total Female Population of Christmas?
Total Female Population of Christmas is 746.
What is the Ratio of Males per 100 Females in Christmas?
There are 107.10 Males per 100 Females in Christmas.
What is the Ratio of Females per 100 Males in Christmas?
There are 93.37 Females per 100 Males in Christmas.
What is the Median Population Age in Christmas?
Median Population Age in Christmas is 44.3 Years.
What is the Average Family Size in Christmas
Average Family Size in Christmas is 2.6 People.
What is the Average Household Size in Christmas
Average Household Size in Christmas is 2.4 People.
How Large is the Labor Force in Christmas?
There are 940 People in the Labor Forcein in Christmas.
What is the Percentage of People in the Labor Force in Christmas?
69.6% of People are in the Labor Force in Christmas.
What is the Unemployment Rate in Christmas?
Unemployment Rate in Christmas is 1.7%.