Gaylord, MN Map & Demographics
Gaylord Map
Gaylord Overview
$37,133
PER CAPITA INCOME
$88,064
AVG FAMILY INCOME
$62,083
AVG HOUSEHOLD INCOME
18.0%
WAGE / INCOME GAP [ % ]
82.0¢/ $1
WAGE / INCOME GAP [ $ ]
0.45
INEQUALITY / GINI INDEX
2,082
TOTAL POPULATION
1,015
MALE POPULATION
1,067
FEMALE POPULATION
95.13
MALES / 100 FEMALES
105.12
FEMALES / 100 MALES
44.9
MEDIAN AGE
3.0
AVG FAMILY SIZE
2.2
AVG HOUSEHOLD SIZE
1,122
LABOR FORCE [ PEOPLE ]
62.5%
PERCENT IN LABOR FORCE
3.6%
UNEMPLOYMENT RATE
Gaylord Zip Codes
Gaylord Area Codes
Income in Gaylord
Income Overview in Gaylord
Per Capita Income in Gaylord is $37,133, while median incomes of families and households are $88,064 and $62,083 respectively.
| Characteristic | Number | Measure |
| Per Capita Income | 2,082 | $37,133 |
| Median Family Income | 521 | $88,064 |
| Mean Family Income | 521 | $93,474 |
| Median Household Income | 903 | $62,083 |
| Mean Household Income | 903 | $84,518 |
| Income Deficit | 521 | $0 |
| Wage / Income Gap (%) | 2,082 | 17.96% |
| Wage / Income Gap ($) | 2,082 | 82.04¢ per $1 |
| Gini / Inequality Index | 2,082 | 0.45 |
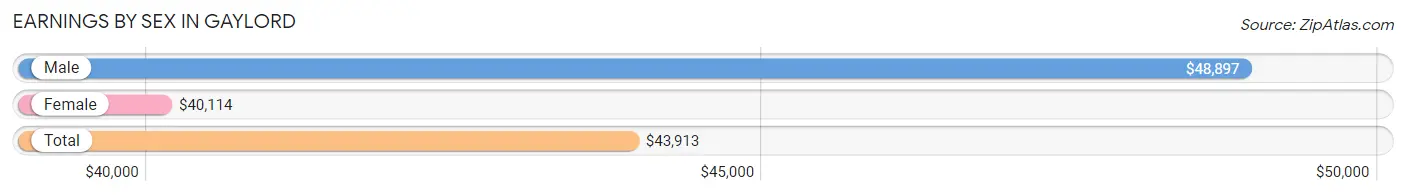
Earnings by Sex in Gaylord
Average Earnings in Gaylord are $43,913, $48,897 for men and $40,114 for women, a difference of 18.0%.
| Sex | Number | Average Earnings |
| Male | 619 (53.7%) | $48,897 |
| Female | 533 (46.3%) | $40,114 |
| Total | 1,152 (100.0%) | $43,913 |
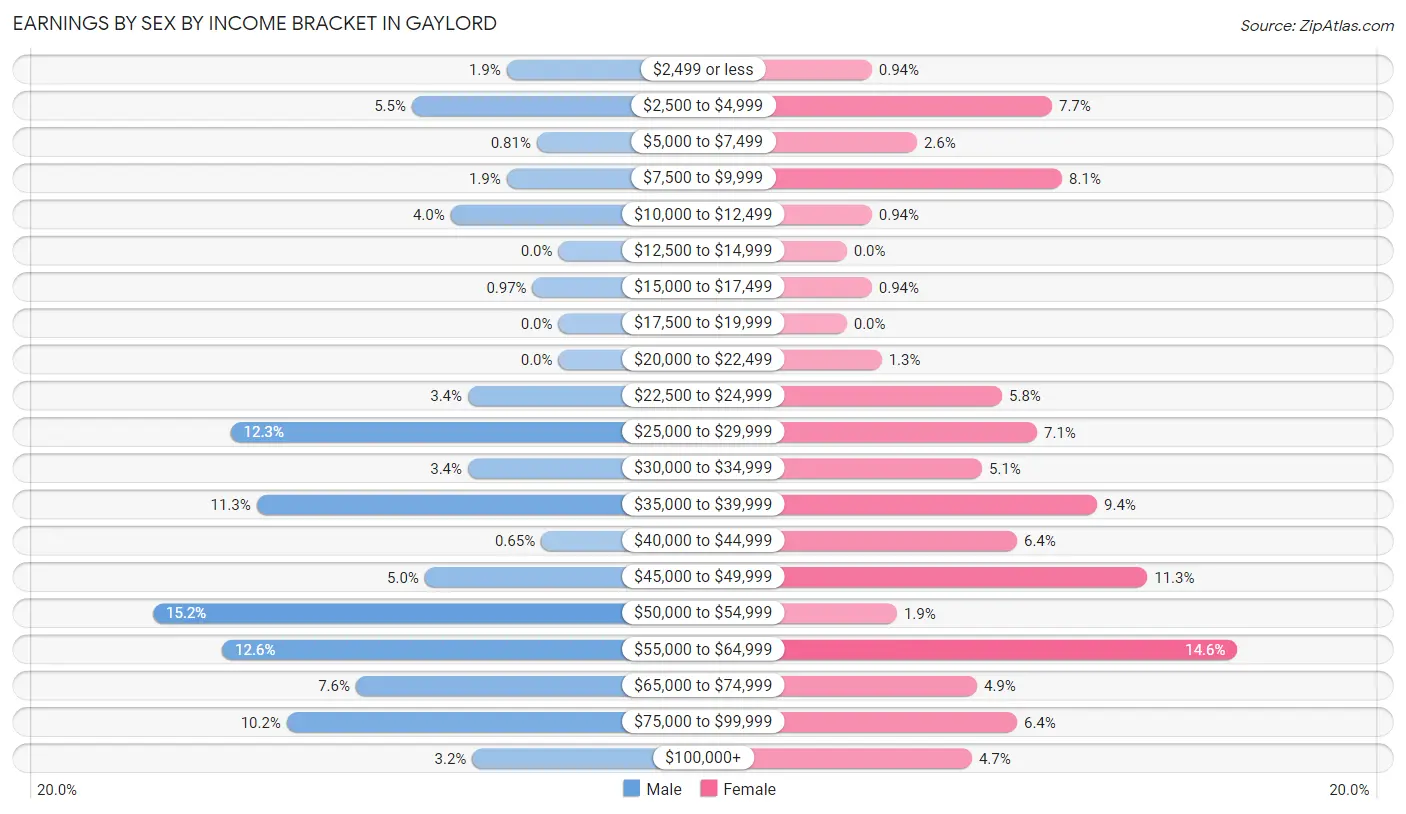
Earnings by Sex by Income Bracket in Gaylord
The most common earnings brackets in Gaylord are $50,000 to $54,999 for men (94 | 15.2%) and $55,000 to $64,999 for women (78 | 14.6%).
| Income | Male | Female |
| $2,499 or less | 12 (1.9%) | 5 (0.9%) |
| $2,500 to $4,999 | 34 (5.5%) | 41 (7.7%) |
| $5,000 to $7,499 | 5 (0.8%) | 14 (2.6%) |
| $7,500 to $9,999 | 12 (1.9%) | 43 (8.1%) |
| $10,000 to $12,499 | 25 (4.0%) | 5 (0.9%) |
| $12,500 to $14,999 | 0 (0.0%) | 0 (0.0%) |
| $15,000 to $17,499 | 6 (1.0%) | 5 (0.9%) |
| $17,500 to $19,999 | 0 (0.0%) | 0 (0.0%) |
| $20,000 to $22,499 | 0 (0.0%) | 7 (1.3%) |
| $22,500 to $24,999 | 21 (3.4%) | 31 (5.8%) |
| $25,000 to $29,999 | 76 (12.3%) | 38 (7.1%) |
| $30,000 to $34,999 | 21 (3.4%) | 27 (5.1%) |
| $35,000 to $39,999 | 70 (11.3%) | 50 (9.4%) |
| $40,000 to $44,999 | 4 (0.6%) | 34 (6.4%) |
| $45,000 to $49,999 | 31 (5.0%) | 60 (11.3%) |
| $50,000 to $54,999 | 94 (15.2%) | 10 (1.9%) |
| $55,000 to $64,999 | 78 (12.6%) | 78 (14.6%) |
| $65,000 to $74,999 | 47 (7.6%) | 26 (4.9%) |
| $75,000 to $99,999 | 63 (10.2%) | 34 (6.4%) |
| $100,000+ | 20 (3.2%) | 25 (4.7%) |
| Total | 619 (100.0%) | 533 (100.0%) |
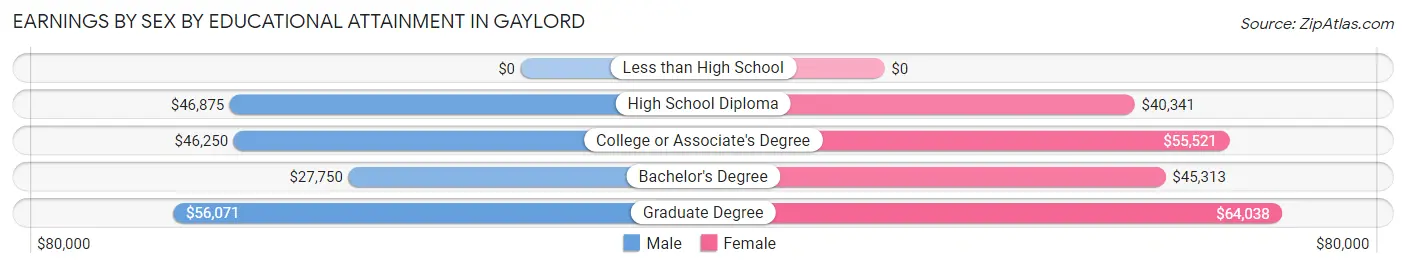
Earnings by Sex by Educational Attainment in Gaylord
Average earnings in Gaylord are $50,169 for men and $45,293 for women, a difference of 9.7%. Men with an educational attainment of graduate degree enjoy the highest average annual earnings of $56,071, while those with bachelor's degree education earn the least with $27,750. Women with an educational attainment of graduate degree earn the most with the average annual earnings of $64,038, while those with high school diploma education have the smallest earnings of $40,341.
| Educational Attainment | Male Income | Female Income |
| Less than High School | - | - |
| High School Diploma | $46,875 | $40,341 |
| College or Associate's Degree | $46,250 | $55,521 |
| Bachelor's Degree | $27,750 | $45,313 |
| Graduate Degree | $56,071 | $64,038 |
| Total | $50,169 | $45,293 |
Family Income in Gaylord
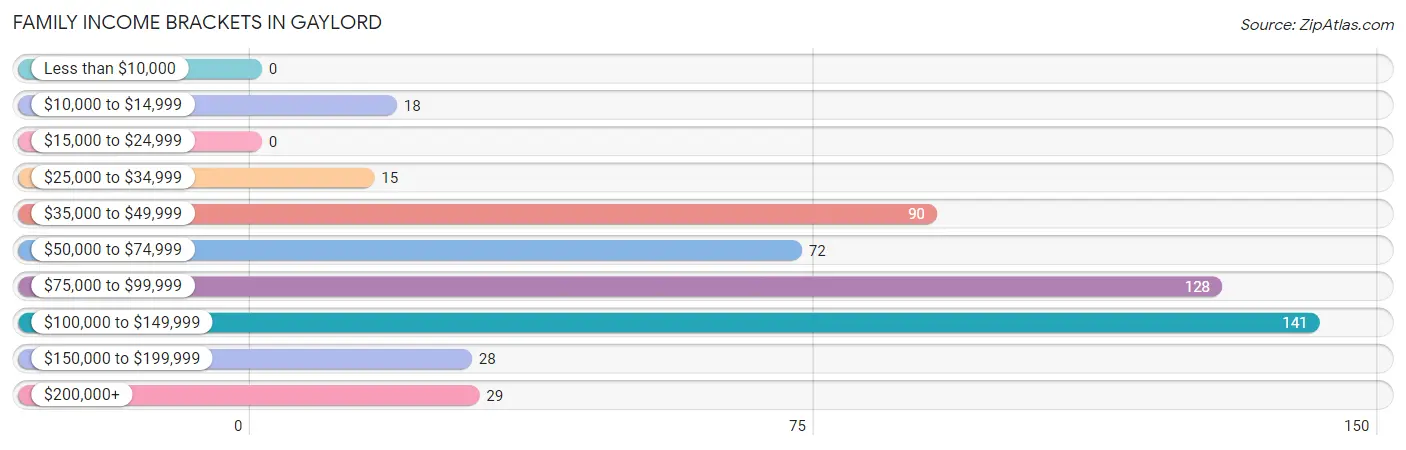
Family Income Brackets in Gaylord
According to the Gaylord family income data, there are 141 families falling into the $100,000 to $149,999 income range, which is the most common income bracket and makes up 27.1% of all families.
| Income Bracket | # Families | % Families |
| Less than $10,000 | 0 | 0.0% |
| $10,000 to $14,999 | 18 | 3.5% |
| $15,000 to $24,999 | 0 | 0.0% |
| $25,000 to $34,999 | 15 | 2.9% |
| $35,000 to $49,999 | 90 | 17.3% |
| $50,000 to $74,999 | 72 | 13.8% |
| $75,000 to $99,999 | 128 | 24.6% |
| $100,000 to $149,999 | 141 | 27.1% |
| $150,000 to $199,999 | 28 | 5.4% |
| $200,000+ | 29 | 5.6% |
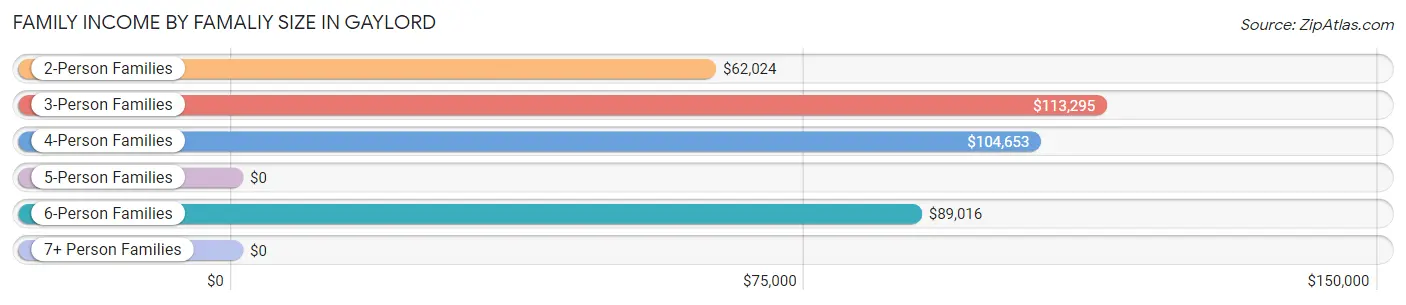
Family Income by Famaliy Size in Gaylord
3-person families (71 | 13.6%) account for the highest median family income in Gaylord with $113,295 per family, while 3-person families (71 | 13.6%) have the highest median income of $37,765 per family member.
| Income Bracket | # Families | Median Income |
| 2-Person Families | 304 (58.4%) | $62,024 |
| 3-Person Families | 71 (13.6%) | $113,295 |
| 4-Person Families | 83 (15.9%) | $104,653 |
| 5-Person Families | 6 (1.1%) | $0 |
| 6-Person Families | 57 (10.9%) | $89,016 |
| 7+ Person Families | 0 (0.0%) | $0 |
| Total | 521 (100.0%) | $88,064 |
Family Income by Number of Earners in Gaylord
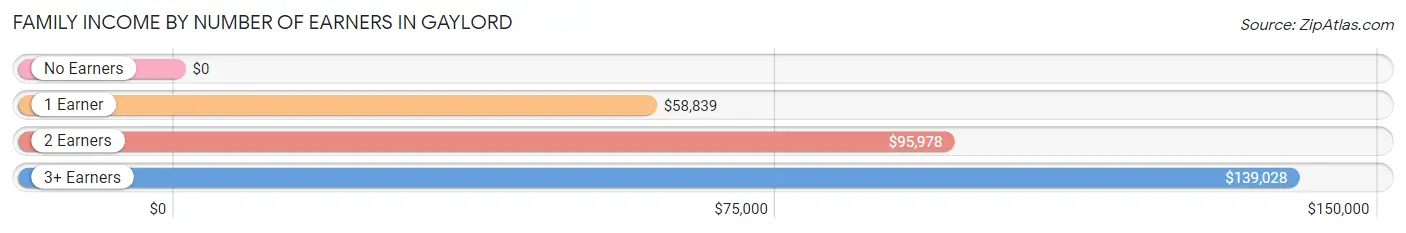
| Number of Earners | # Families | Median Income |
| No Earners | 42 (8.1%) | $0 |
| 1 Earner | 121 (23.2%) | $58,839 |
| 2 Earners | 308 (59.1%) | $95,978 |
| 3+ Earners | 50 (9.6%) | $139,028 |
| Total | 521 (100.0%) | $88,064 |
Household Income in Gaylord
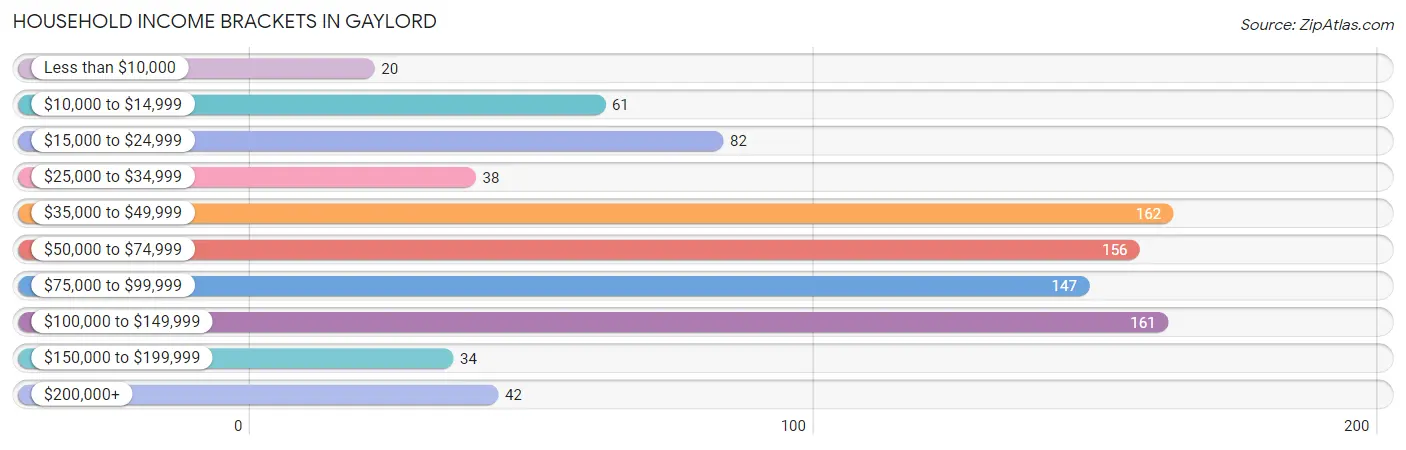
Household Income Brackets in Gaylord
With 162 households falling in the category, the $35,000 to $49,999 income range is the most frequent in Gaylord, accounting for 17.9% of all households. In contrast, only 20 households (2.2%) fall into the less than $10,000 income bracket, making it the least populous group.
| Income Bracket | # Households | % Households |
| Less than $10,000 | 20 | 2.2% |
| $10,000 to $14,999 | 61 | 6.8% |
| $15,000 to $24,999 | 82 | 9.1% |
| $25,000 to $34,999 | 38 | 4.2% |
| $35,000 to $49,999 | 162 | 17.9% |
| $50,000 to $74,999 | 156 | 17.3% |
| $75,000 to $99,999 | 147 | 16.3% |
| $100,000 to $149,999 | 161 | 17.8% |
| $150,000 to $199,999 | 34 | 3.8% |
| $200,000+ | 42 | 4.7% |
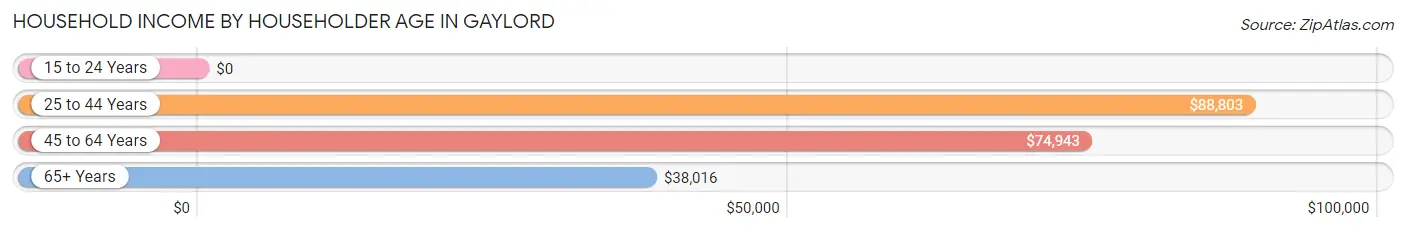
Household Income by Householder Age in Gaylord
The median household income in Gaylord is $62,083, with the highest median household income of $88,803 found in the 25 to 44 years age bracket for the primary householder. A total of 239 households (26.5%) fall into this category. Meanwhile, the 15 to 24 years age bracket for the primary householder has the lowest median household income of $0, with 30 households (3.3%) in this group.
| Income Bracket | # Households | Median Income |
| 15 to 24 Years | 30 (3.3%) | $0 |
| 25 to 44 Years | 239 (26.5%) | $88,803 |
| 45 to 64 Years | 307 (34.0%) | $74,943 |
| 65+ Years | 327 (36.2%) | $38,016 |
| Total | 903 (100.0%) | $62,083 |
Poverty in Gaylord
Income Below Poverty by Sex and Age in Gaylord
With 4.4% poverty level for males and 7.5% for females among the residents of Gaylord, 65 to 74 year old males and 65 to 74 year old females are the most vulnerable to poverty, with 14 males (16.3%) and 23 females (25.0%) in their respective age groups living below the poverty level.
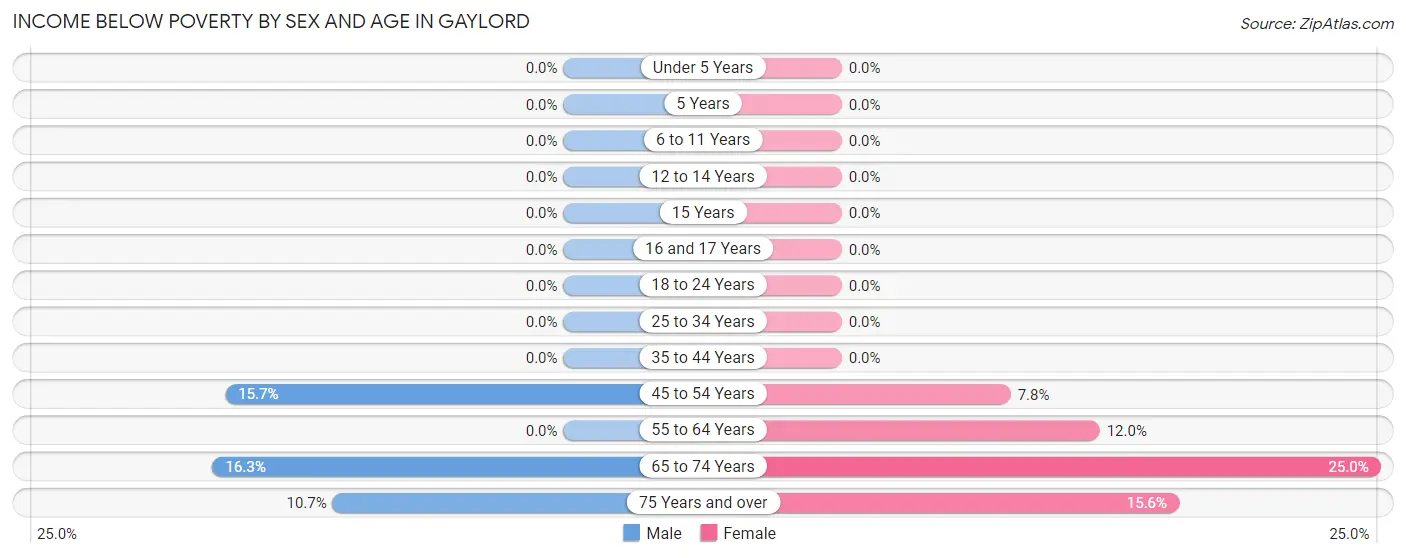
| Age Bracket | Male | Female |
| Under 5 Years | 0 (0.0%) | 0 (0.0%) |
| 5 Years | 0 (0.0%) | 0 (0.0%) |
| 6 to 11 Years | 0 (0.0%) | 0 (0.0%) |
| 12 to 14 Years | 0 (0.0%) | 0 (0.0%) |
| 15 Years | 0 (0.0%) | 0 (0.0%) |
| 16 and 17 Years | 0 (0.0%) | 0 (0.0%) |
| 18 to 24 Years | 0 (0.0%) | 0 (0.0%) |
| 25 to 34 Years | 0 (0.0%) | 0 (0.0%) |
| 35 to 44 Years | 0 (0.0%) | 0 (0.0%) |
| 45 to 54 Years | 24 (15.7%) | 12 (7.8%) |
| 55 to 64 Years | 0 (0.0%) | 14 (12.0%) |
| 65 to 74 Years | 14 (16.3%) | 23 (25.0%) |
| 75 Years and over | 6 (10.7%) | 28 (15.6%) |
| Total | 44 (4.4%) | 77 (7.5%) |
Income Above Poverty by Sex and Age in Gaylord
According to the poverty statistics in Gaylord, males aged under 5 years and females aged under 5 years are the age groups that are most secure financially, with 100.0% of males and 100.0% of females in these age groups living above the poverty line.
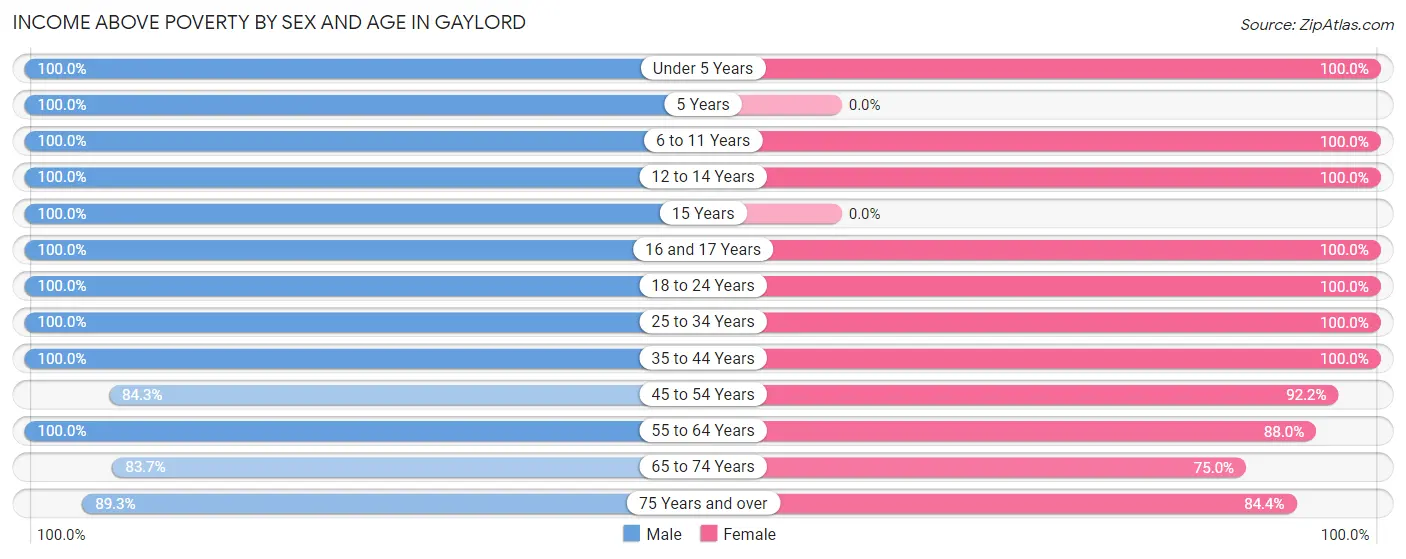
| Age Bracket | Male | Female |
| Under 5 Years | 16 (100.0%) | 68 (100.0%) |
| 5 Years | 34 (100.0%) | 0 (0.0%) |
| 6 to 11 Years | 38 (100.0%) | 40 (100.0%) |
| 12 to 14 Years | 21 (100.0%) | 61 (100.0%) |
| 15 Years | 9 (100.0%) | 0 (0.0%) |
| 16 and 17 Years | 50 (100.0%) | 22 (100.0%) |
| 18 to 24 Years | 110 (100.0%) | 91 (100.0%) |
| 25 to 34 Years | 148 (100.0%) | 84 (100.0%) |
| 35 to 44 Years | 117 (100.0%) | 123 (100.0%) |
| 45 to 54 Years | 129 (84.3%) | 141 (92.2%) |
| 55 to 64 Years | 154 (100.0%) | 103 (88.0%) |
| 65 to 74 Years | 72 (83.7%) | 69 (75.0%) |
| 75 Years and over | 50 (89.3%) | 151 (84.4%) |
| Total | 948 (95.6%) | 953 (92.5%) |
Income Below Poverty Among Married-Couple Families in Gaylord
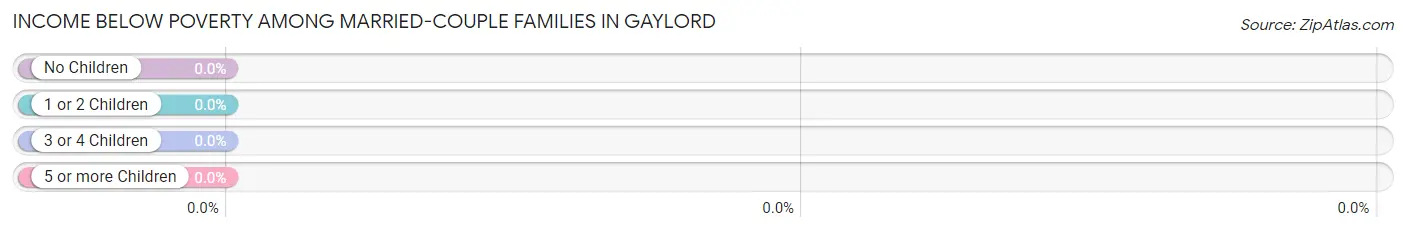
| Children | Above Poverty | Below Poverty |
| No Children | 285 (100.0%) | 0 (0.0%) |
| 1 or 2 Children | 155 (100.0%) | 0 (0.0%) |
| 3 or 4 Children | 11 (100.0%) | 0 (0.0%) |
| 5 or more Children | 0 (0.0%) | 0 (0.0%) |
| Total | 451 (100.0%) | 0 (0.0%) |
Income Below Poverty Among Single-Parent Households in Gaylord
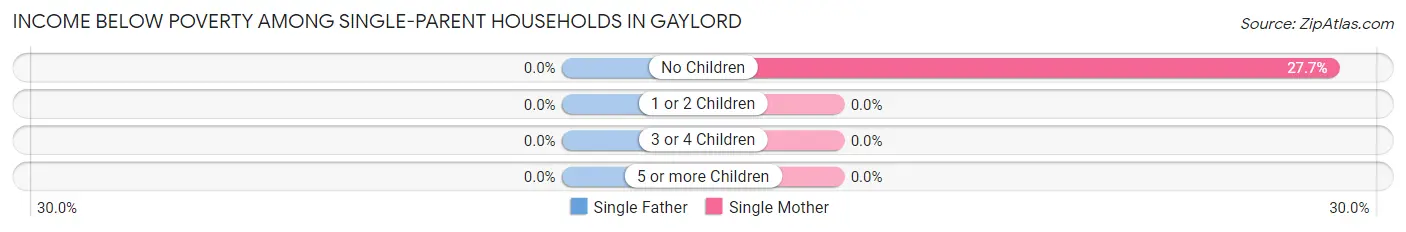
| Children | Single Father | Single Mother |
| No Children | 0 (0.0%) | 18 (27.7%) |
| 1 or 2 Children | 0 (0.0%) | 0 (0.0%) |
| 3 or 4 Children | 0 (0.0%) | 0 (0.0%) |
| 5 or more Children | 0 (0.0%) | 0 (0.0%) |
| Total | 0 (0.0%) | 18 (27.7%) |
Income Below Poverty Among Married-Couple vs Single-Parent Households in Gaylord
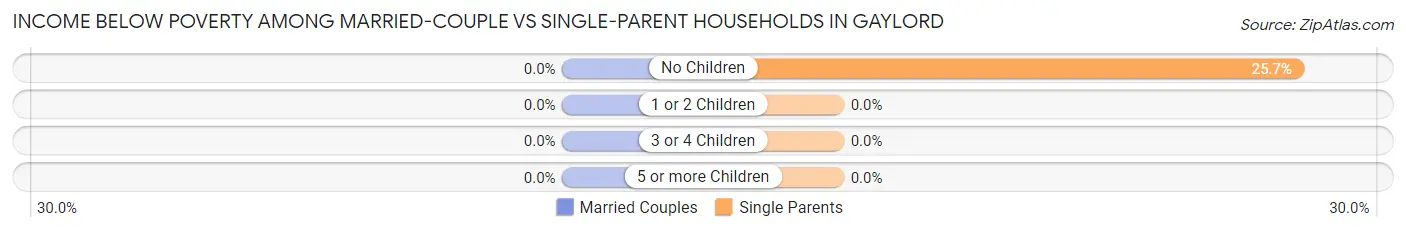
| Children | Married-Couple Families | Single-Parent Households |
| No Children | 0 (0.0%) | 18 (25.7%) |
| 1 or 2 Children | 0 (0.0%) | 0 (0.0%) |
| 3 or 4 Children | 0 (0.0%) | 0 (0.0%) |
| 5 or more Children | 0 (0.0%) | 0 (0.0%) |
| Total | 0 (0.0%) | 18 (25.7%) |
Race in Gaylord
The most populous races in Gaylord are White / Caucasian (1,499 | 72.0%), Hispanic or Latino (512 | 24.6%), and Some other Race (386 | 18.5%).
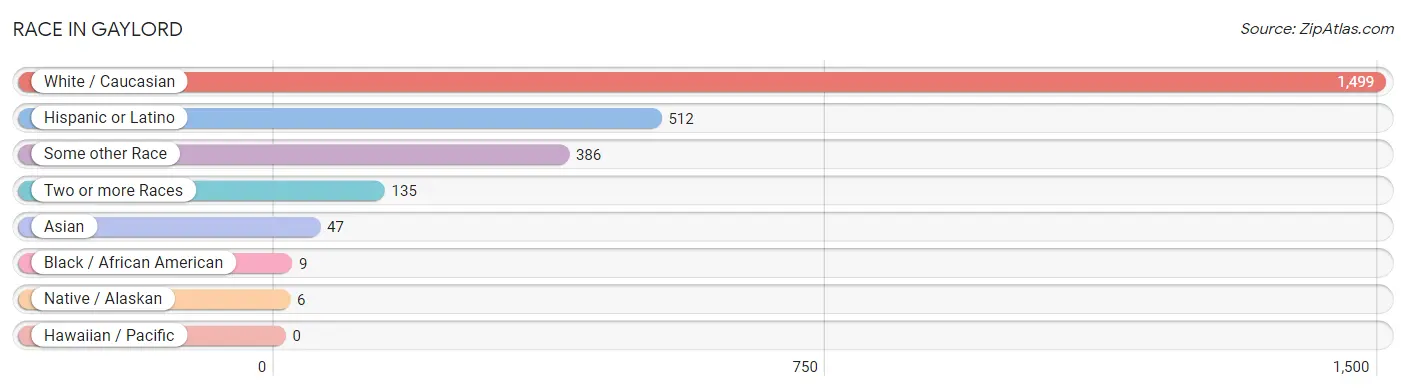
| Race | # Population | % Population |
| Asian | 47 | 2.3% |
| Black / African American | 9 | 0.4% |
| Hawaiian / Pacific | 0 | 0.0% |
| Hispanic or Latino | 512 | 24.6% |
| Native / Alaskan | 6 | 0.3% |
| White / Caucasian | 1,499 | 72.0% |
| Two or more Races | 135 | 6.5% |
| Some other Race | 386 | 18.5% |
| Total | 2,082 | 100.0% |
Ancestry in Gaylord
The most populous ancestries reported in Gaylord are German (1,056 | 50.7%), Mexican (472 | 22.7%), Irish (169 | 8.1%), Norwegian (159 | 7.6%), and Swedish (124 | 6.0%), together accounting for 95.1% of all Gaylord residents.
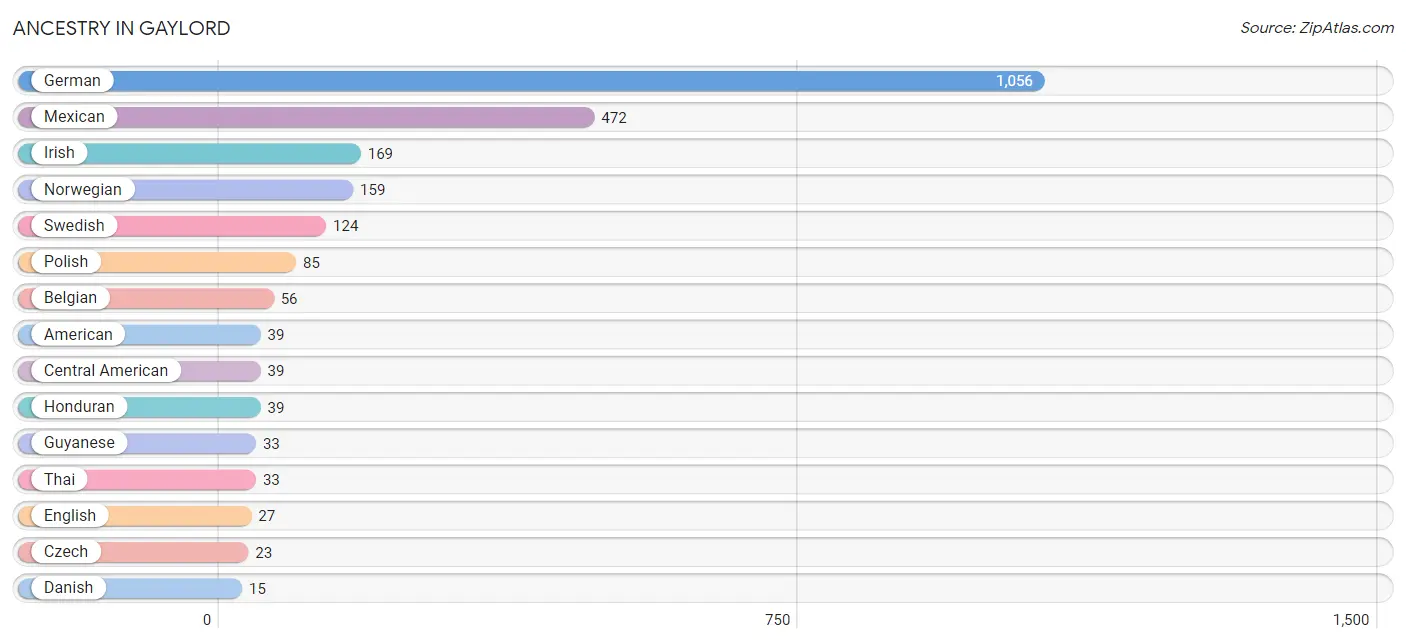
| Ancestry | # Population | % Population |
| American | 39 | 1.9% |
| Apache | 6 | 0.3% |
| Arab | 4 | 0.2% |
| Belgian | 56 | 2.7% |
| Bhutanese | 11 | 0.5% |
| Central American | 39 | 1.9% |
| Czech | 23 | 1.1% |
| Danish | 15 | 0.7% |
| Dutch | 15 | 0.7% |
| English | 27 | 1.3% |
| French | 6 | 0.3% |
| German | 1,056 | 50.7% |
| Guyanese | 33 | 1.6% |
| Honduran | 39 | 1.9% |
| Irish | 169 | 8.1% |
| Korean | 3 | 0.1% |
| Lebanese | 4 | 0.2% |
| Luxembourger | 6 | 0.3% |
| Mexican | 472 | 22.7% |
| Norwegian | 159 | 7.6% |
| Pennsylvania German | 6 | 0.3% |
| Polish | 85 | 4.1% |
| Scandinavian | 14 | 0.7% |
| Scottish | 6 | 0.3% |
| Swedish | 124 | 6.0% |
| Thai | 33 | 1.6% |
| Welsh | 5 | 0.2% | View All 27 Rows |
Immigrants in Gaylord
The most numerous immigrant groups reported in Gaylord came from Latin America (194 | 9.3%), Central America (165 | 7.9%), Mexico (126 | 6.0%), Honduras (39 | 1.9%), and Guyana (29 | 1.4%), together accounting for 26.6% of all Gaylord residents.
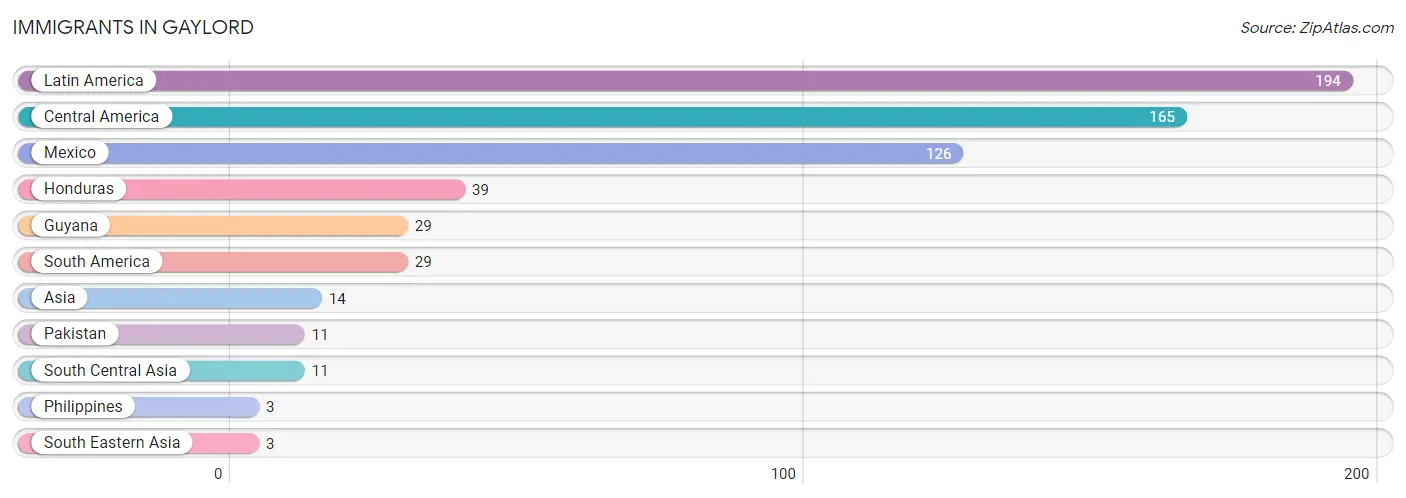
| Immigration Origin | # Population | % Population |
| Asia | 14 | 0.7% |
| Central America | 165 | 7.9% |
| Guyana | 29 | 1.4% |
| Honduras | 39 | 1.9% |
| Latin America | 194 | 9.3% |
| Mexico | 126 | 6.0% |
| Pakistan | 11 | 0.5% |
| Philippines | 3 | 0.1% |
| South America | 29 | 1.4% |
| South Central Asia | 11 | 0.5% |
| South Eastern Asia | 3 | 0.1% | View All 11 Rows |
Sex and Age in Gaylord
Sex and Age in Gaylord
The most populous age groups in Gaylord are 20 to 24 Years (98 | 9.7%) for men and 85 Years and over (118 | 11.1%) for women.
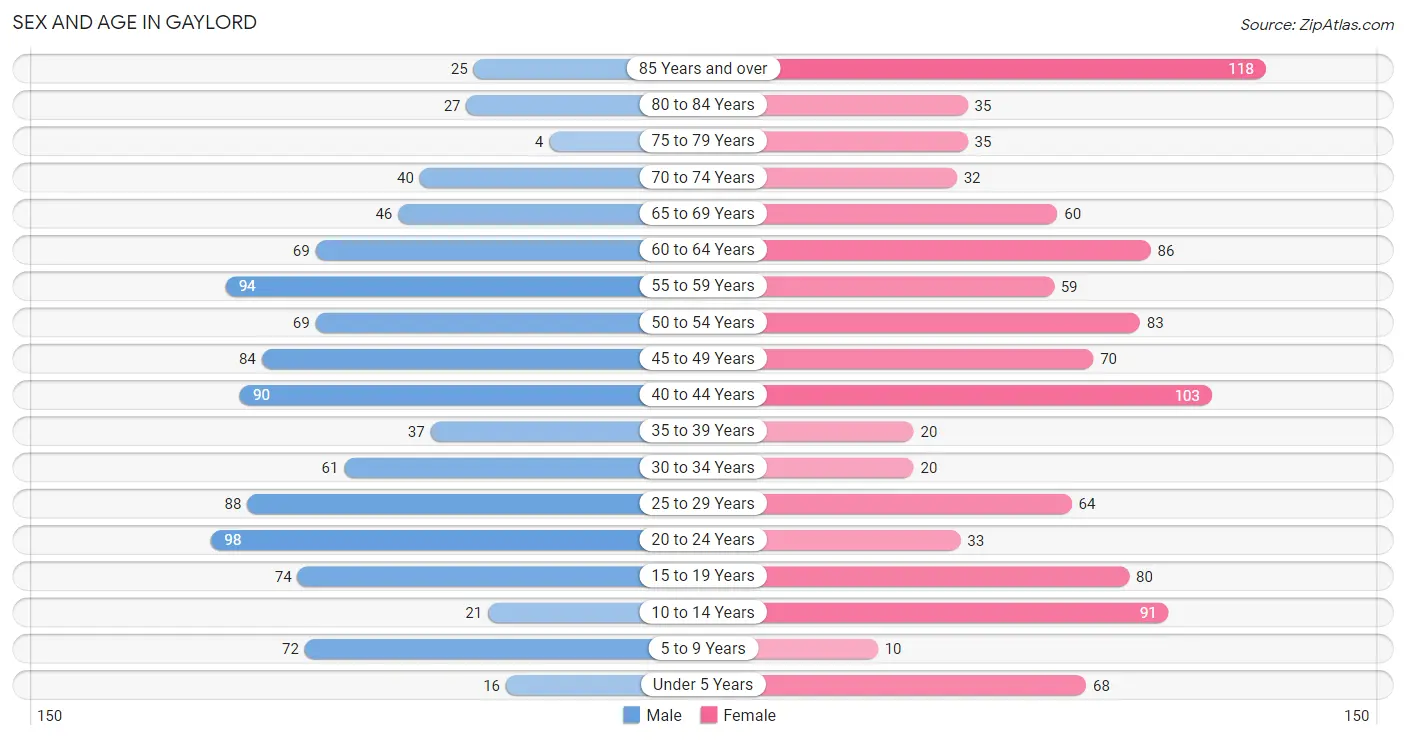
| Age Bracket | Male | Female |
| Under 5 Years | 16 (1.6%) | 68 (6.4%) |
| 5 to 9 Years | 72 (7.1%) | 10 (0.9%) |
| 10 to 14 Years | 21 (2.1%) | 91 (8.5%) |
| 15 to 19 Years | 74 (7.3%) | 80 (7.5%) |
| 20 to 24 Years | 98 (9.7%) | 33 (3.1%) |
| 25 to 29 Years | 88 (8.7%) | 64 (6.0%) |
| 30 to 34 Years | 61 (6.0%) | 20 (1.9%) |
| 35 to 39 Years | 37 (3.6%) | 20 (1.9%) |
| 40 to 44 Years | 90 (8.9%) | 103 (9.7%) |
| 45 to 49 Years | 84 (8.3%) | 70 (6.6%) |
| 50 to 54 Years | 69 (6.8%) | 83 (7.8%) |
| 55 to 59 Years | 94 (9.3%) | 59 (5.5%) |
| 60 to 64 Years | 69 (6.8%) | 86 (8.1%) |
| 65 to 69 Years | 46 (4.5%) | 60 (5.6%) |
| 70 to 74 Years | 40 (3.9%) | 32 (3.0%) |
| 75 to 79 Years | 4 (0.4%) | 35 (3.3%) |
| 80 to 84 Years | 27 (2.7%) | 35 (3.3%) |
| 85 Years and over | 25 (2.5%) | 118 (11.1%) |
| Total | 1,015 (100.0%) | 1,067 (100.0%) |
Families and Households in Gaylord
Median Family Size in Gaylord
The median family size in Gaylord is 3.05 persons per family, with married-couple families (451 | 86.6%) accounting for the largest median family size of 3.22 persons per family. On the other hand, single female/mother families (65 | 12.5%) represent the smallest median family size with 1.91 persons per family.
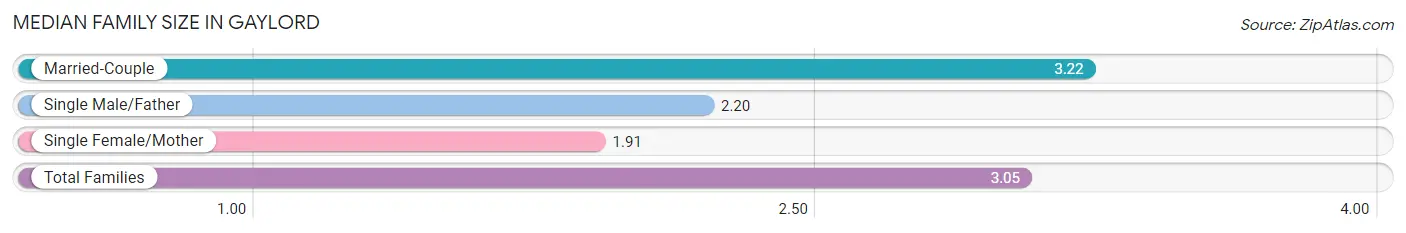
| Family Type | # Families | Family Size |
| Married-Couple | 451 (86.6%) | 3.22 |
| Single Male/Father | 5 (1.0%) | 2.20 |
| Single Female/Mother | 65 (12.5%) | 1.91 |
| Total Families | 521 (100.0%) | 3.05 |
Median Household Size in Gaylord
The median household size in Gaylord is 2.23 persons per household, with married-couple households (451 | 49.9%) accounting for the largest median household size of 3.24 persons per household. non-family households (382 | 42.3%) represent the smallest median household size with 1.10 persons per household.
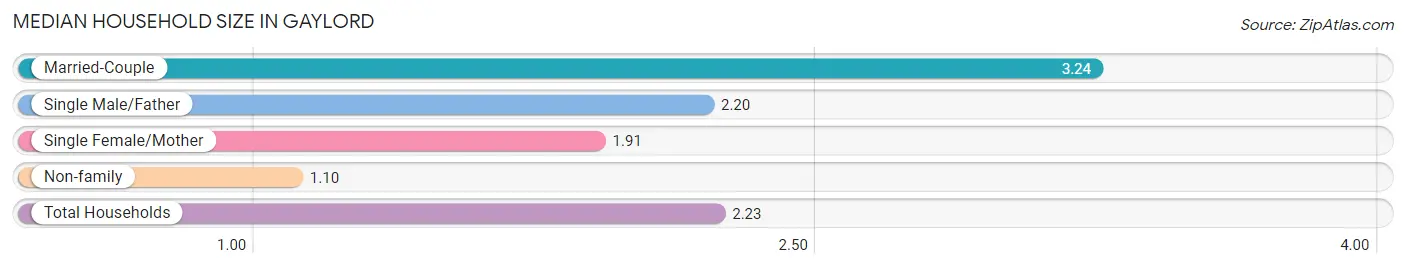
| Household Type | # Households | Household Size |
| Married-Couple | 451 (49.9%) | 3.24 |
| Single Male/Father | 5 (0.5%) | 2.20 |
| Single Female/Mother | 65 (7.2%) | 1.91 |
| Non-family | 382 (42.3%) | 1.10 |
| Total Households | 903 (100.0%) | 2.23 |
Household Size by Marriage Status in Gaylord
Out of a total of 903 households in Gaylord, 521 (57.7%) are family households, while 382 (42.3%) are nonfamily households. The most numerous type of family households are 2-person households, comprising 304, and the most common type of nonfamily households are 1-person households, comprising 342.
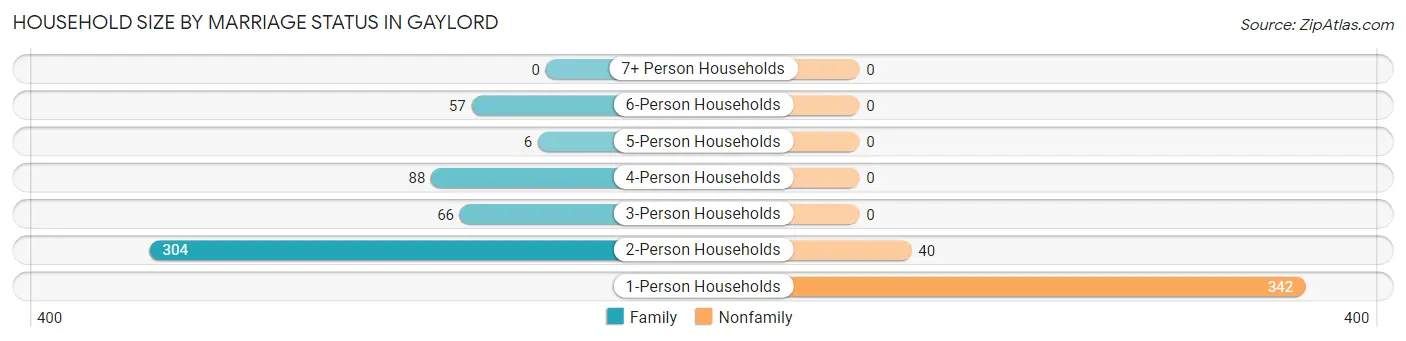
| Household Size | Family Households | Nonfamily Households |
| 1-Person Households | - | 342 (37.9%) |
| 2-Person Households | 304 (33.7%) | 40 (4.4%) |
| 3-Person Households | 66 (7.3%) | 0 (0.0%) |
| 4-Person Households | 88 (9.8%) | 0 (0.0%) |
| 5-Person Households | 6 (0.7%) | 0 (0.0%) |
| 6-Person Households | 57 (6.3%) | 0 (0.0%) |
| 7+ Person Households | 0 (0.0%) | 0 (0.0%) |
| Total | 521 (57.7%) | 382 (42.3%) |
Female Fertility in Gaylord
Fertility by Age in Gaylord
Average fertility rate in Gaylord is 15.0 births per 1,000 women. Women in the age bracket of 35 to 50 years have the highest fertility rate with 29.0 births per 1,000 women. Women in the age bracket of 35 to 50 years acount for 100.0% of all women with births.
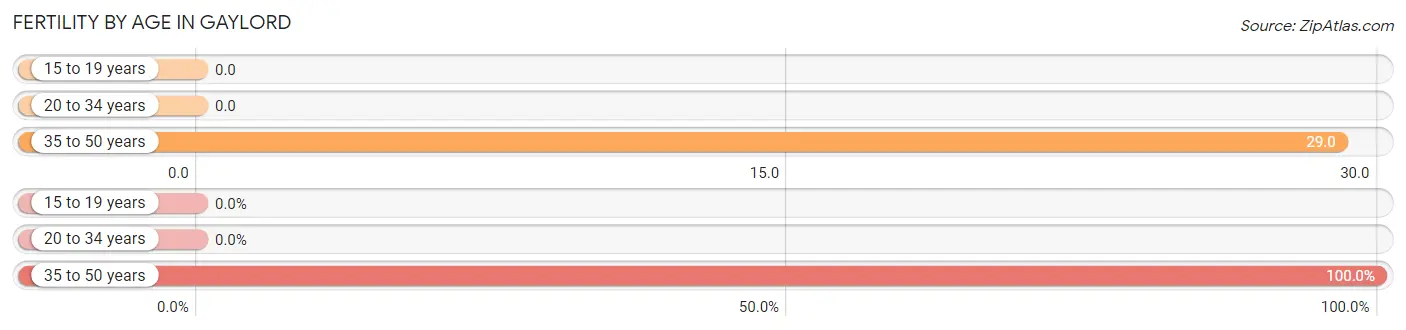
| Age Bracket | Women with Births | Births / 1,000 Women |
| 15 to 19 years | 0 (0.0%) | 0.0 |
| 20 to 34 years | 0 (0.0%) | 0.0 |
| 35 to 50 years | 6 (100.0%) | 29.0 |
| Total | 6 (100.0%) | 15.0 |
Fertility by Age by Marriage Status in Gaylord
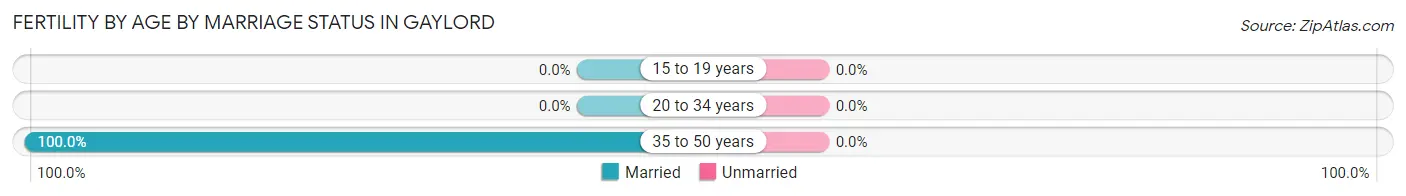
| Age Bracket | Married | Unmarried |
| 15 to 19 years | 0 (0.0%) | 0 (0.0%) |
| 20 to 34 years | 0 (0.0%) | 0 (0.0%) |
| 35 to 50 years | 6 (100.0%) | 0 (0.0%) |
| Total | 6 (100.0%) | 0 (0.0%) |
Fertility by Education in Gaylord
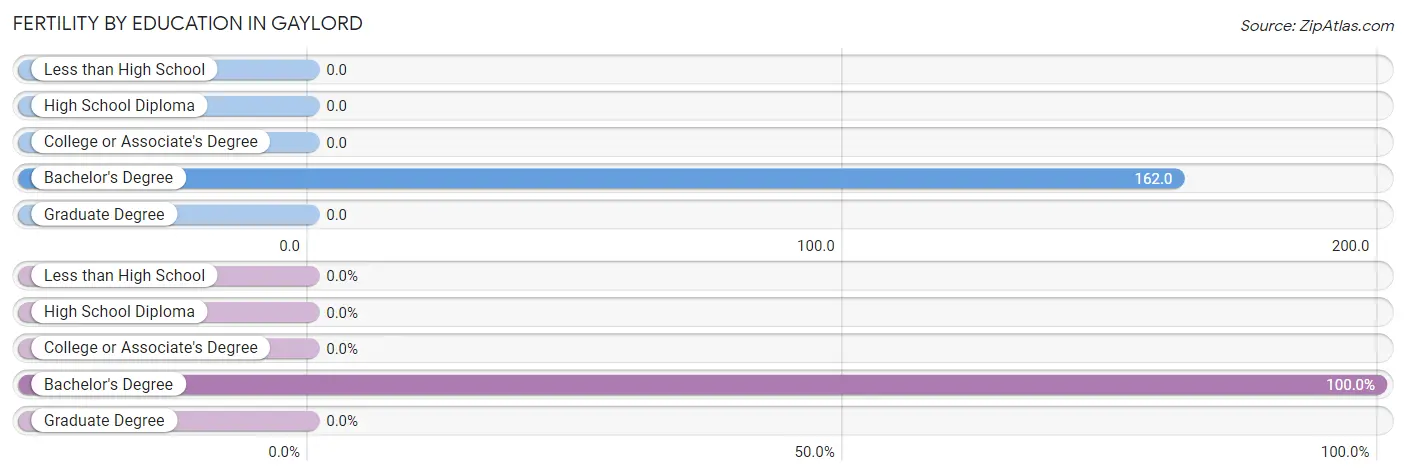
| Educational Attainment | Women with Births | Births / 1,000 Women |
| Less than High School | 0 (0.0%) | 0.0 |
| High School Diploma | 0 (0.0%) | 0.0 |
| College or Associate's Degree | 0 (0.0%) | 0.0 |
| Bachelor's Degree | 6 (100.0%) | 162.0 |
| Graduate Degree | 0 (0.0%) | 0.0 |
| Total | 6 (100.0%) | 15.0 |
Fertility by Education by Marriage Status in Gaylord
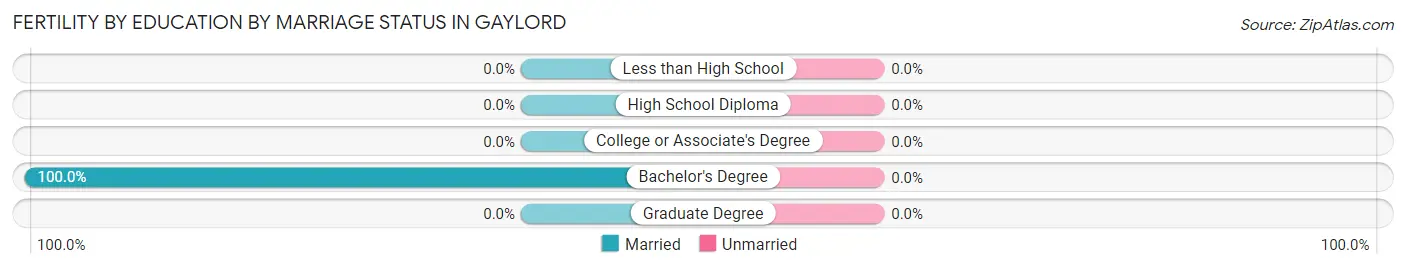
| Educational Attainment | Married | Unmarried |
| Less than High School | 0 (0.0%) | 0 (0.0%) |
| High School Diploma | 0 (0.0%) | 0 (0.0%) |
| College or Associate's Degree | 0 (0.0%) | 0 (0.0%) |
| Bachelor's Degree | 6 (100.0%) | 0 (0.0%) |
| Graduate Degree | 0 (0.0%) | 0 (0.0%) |
| Total | 6 (100.0%) | 0 (0.0%) |
Employment Characteristics in Gaylord
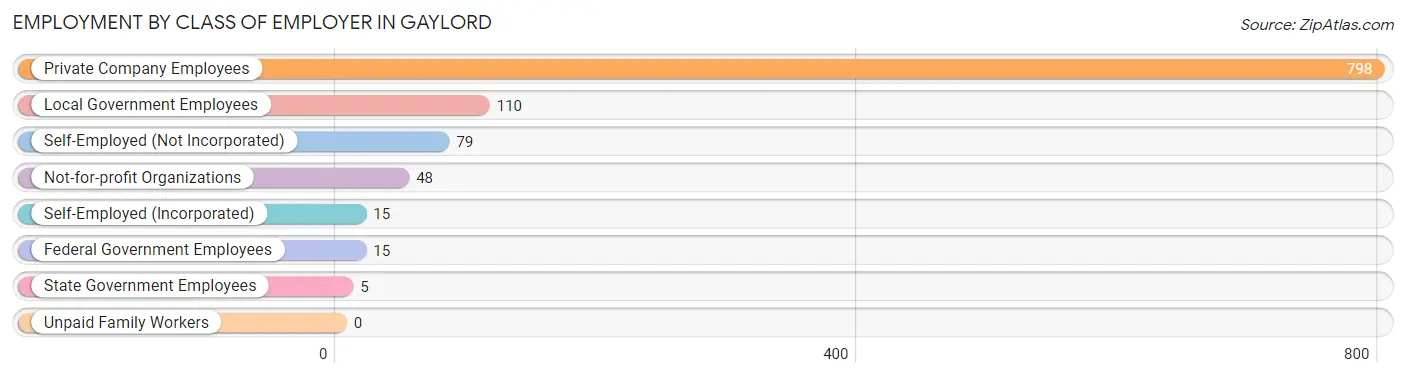
Employment by Class of Employer in Gaylord
Among the 1,070 employed individuals in Gaylord, private company employees (798 | 74.6%), local government employees (110 | 10.3%), and self-employed (not incorporated) (79 | 7.4%) make up the most common classes of employment.
| Employer Class | # Employees | % Employees |
| Private Company Employees | 798 | 74.6% |
| Self-Employed (Incorporated) | 15 | 1.4% |
| Self-Employed (Not Incorporated) | 79 | 7.4% |
| Not-for-profit Organizations | 48 | 4.5% |
| Local Government Employees | 110 | 10.3% |
| State Government Employees | 5 | 0.5% |
| Federal Government Employees | 15 | 1.4% |
| Unpaid Family Workers | 0 | 0.0% |
| Total | 1,070 | 100.0% |
Employment Status by Age in Gaylord
According to the labor force statistics for Gaylord, out of the total population over 16 years of age (1,795), 62.5% or 1,122 individuals are in the labor force, with 3.6% or 40 of them unemployed. The age group with the highest labor force participation rate is 30 to 34 years, with 100.0% or 81 individuals in the labor force. Within the labor force, the 20 to 24 years age range has the highest percentage of unemployed individuals, with 28.8% or 36 of them being unemployed.
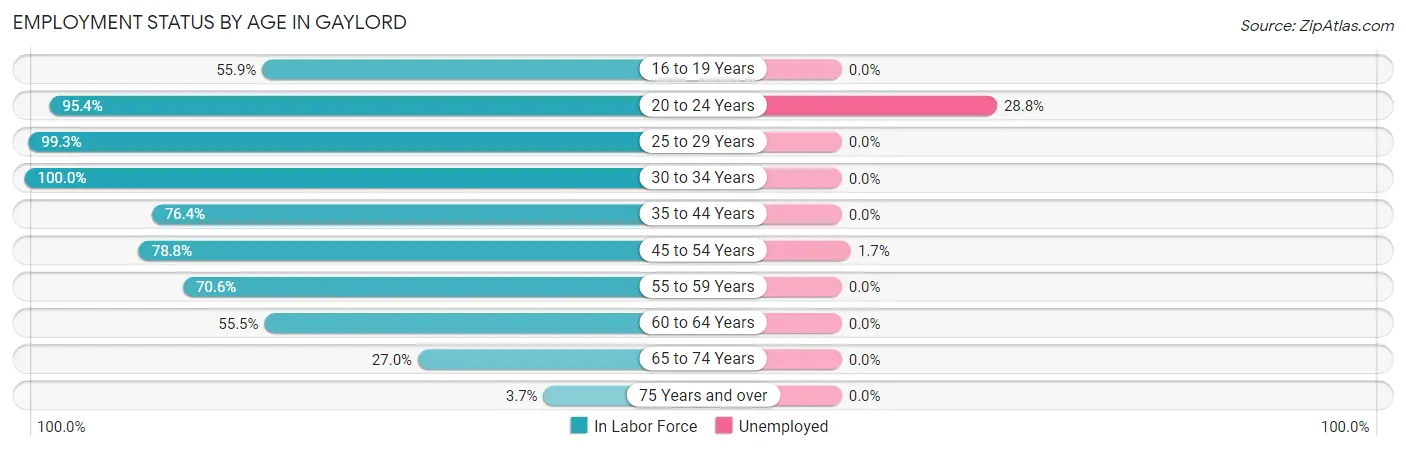
| Age Bracket | In Labor Force | Unemployed |
| 16 to 19 Years | 81 (55.9%) | 0 (0.0%) |
| 20 to 24 Years | 125 (95.4%) | 36 (28.8%) |
| 25 to 29 Years | 151 (99.3%) | 0 (0.0%) |
| 30 to 34 Years | 81 (100.0%) | 0 (0.0%) |
| 35 to 44 Years | 191 (76.4%) | 0 (0.0%) |
| 45 to 54 Years | 241 (78.8%) | 4 (1.7%) |
| 55 to 59 Years | 108 (70.6%) | 0 (0.0%) |
| 60 to 64 Years | 86 (55.5%) | 0 (0.0%) |
| 65 to 74 Years | 48 (27.0%) | 0 (0.0%) |
| 75 Years and over | 9 (3.7%) | 0 (0.0%) |
| Total | 1,122 (62.5%) | 40 (3.6%) |
Employment Status by Educational Attainment in Gaylord
According to labor force statistics for Gaylord, 78.2% of individuals (858) out of the total population between 25 and 64 years of age (1,097) are in the labor force, with 0.5% or 4 of them being unemployed. The group with the highest labor force participation rate are those with the educational attainment of college / associate degree, with 87.2% or 306 individuals in the labor force. Within the labor force, individuals with college / associate degree education have the highest percentage of unemployment, with 1.3% or 4 of them being unemployed.
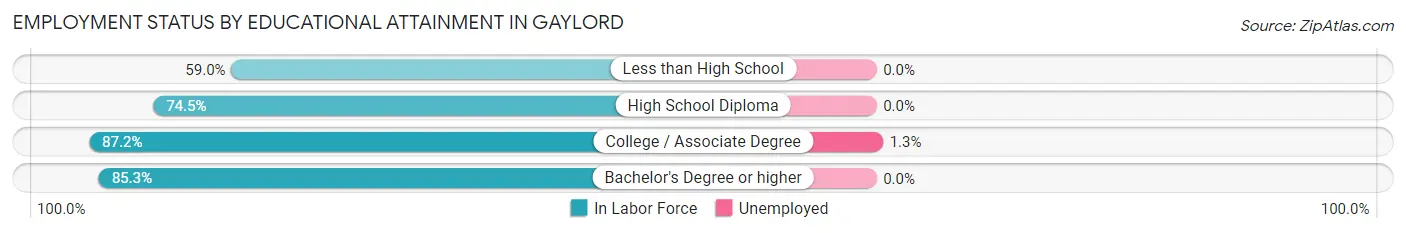
| Educational Attainment | In Labor Force | Unemployed |
| Less than High School | 82 (59.0%) | 0 (0.0%) |
| High School Diploma | 331 (74.5%) | 0 (0.0%) |
| College / Associate Degree | 306 (87.2%) | 5 (1.3%) |
| Bachelor's Degree or higher | 139 (85.3%) | 0 (0.0%) |
| Total | 858 (78.2%) | 5 (0.5%) |
Employment Occupations by Sex in Gaylord
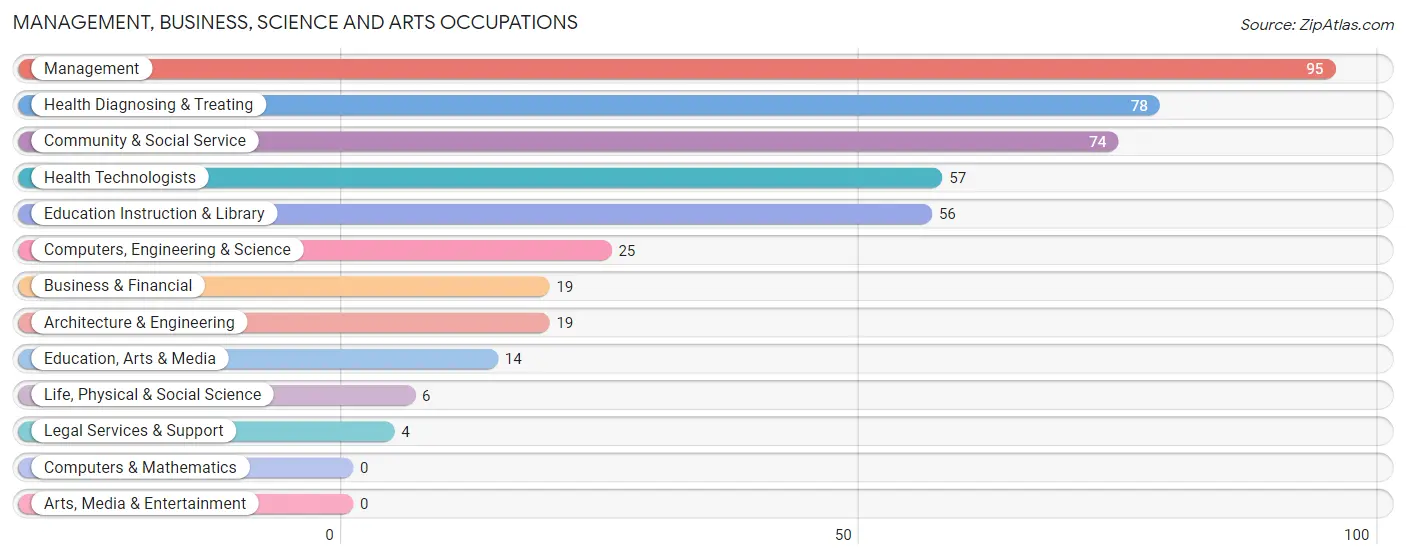
Management, Business, Science and Arts Occupations
The most common Management, Business, Science and Arts occupations in Gaylord are Management (95 | 8.8%), Health Diagnosing & Treating (78 | 7.2%), Community & Social Service (74 | 6.9%), Health Technologists (57 | 5.3%), and Education Instruction & Library (56 | 5.2%).
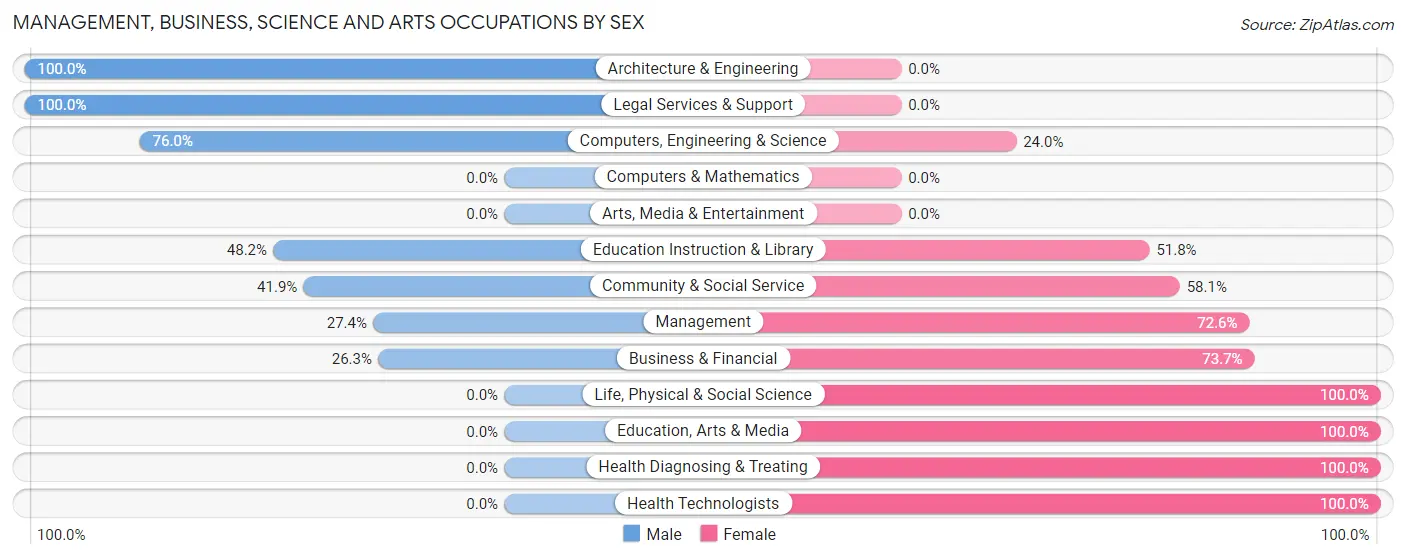
Management, Business, Science and Arts Occupations by Sex
Within the Management, Business, Science and Arts occupations in Gaylord, the most male-oriented occupations are Architecture & Engineering (100.0%), Legal Services & Support (100.0%), and Computers, Engineering & Science (76.0%), while the most female-oriented occupations are Life, Physical & Social Science (100.0%), Education, Arts & Media (100.0%), and Health Diagnosing & Treating (100.0%).
| Occupation | Male | Female |
| Management | 26 (27.4%) | 69 (72.6%) |
| Business & Financial | 5 (26.3%) | 14 (73.7%) |
| Computers, Engineering & Science | 19 (76.0%) | 6 (24.0%) |
| Computers & Mathematics | 0 (0.0%) | 0 (0.0%) |
| Architecture & Engineering | 19 (100.0%) | 0 (0.0%) |
| Life, Physical & Social Science | 0 (0.0%) | 6 (100.0%) |
| Community & Social Service | 31 (41.9%) | 43 (58.1%) |
| Education, Arts & Media | 0 (0.0%) | 14 (100.0%) |
| Legal Services & Support | 4 (100.0%) | 0 (0.0%) |
| Education Instruction & Library | 27 (48.2%) | 29 (51.8%) |
| Arts, Media & Entertainment | 0 (0.0%) | 0 (0.0%) |
| Health Diagnosing & Treating | 0 (0.0%) | 78 (100.0%) |
| Health Technologists | 0 (0.0%) | 57 (100.0%) |
| Total (Category) | 81 (27.8%) | 210 (72.2%) |
| Total (Overall) | 565 (52.3%) | 516 (47.7%) |
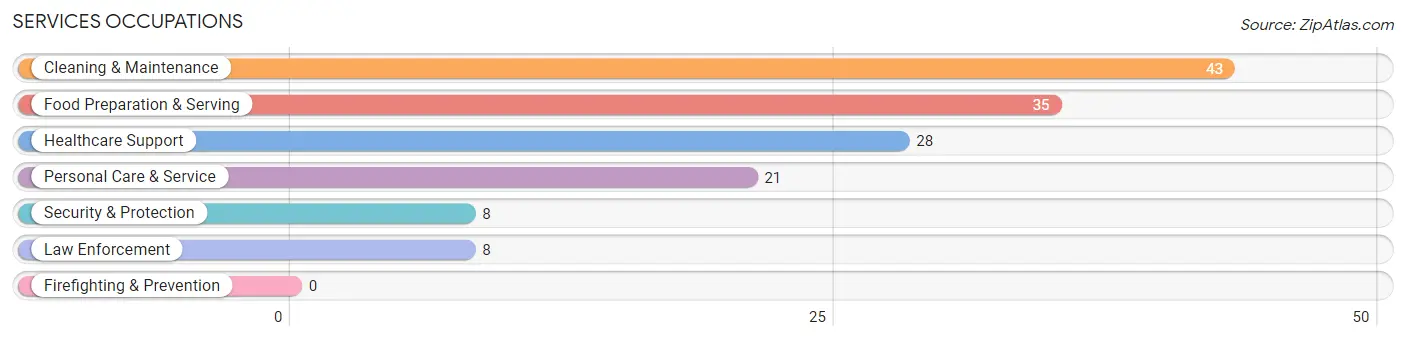
Services Occupations
The most common Services occupations in Gaylord are Cleaning & Maintenance (43 | 4.0%), Food Preparation & Serving (35 | 3.2%), Healthcare Support (28 | 2.6%), Personal Care & Service (21 | 1.9%), and Security & Protection (8 | 0.7%).
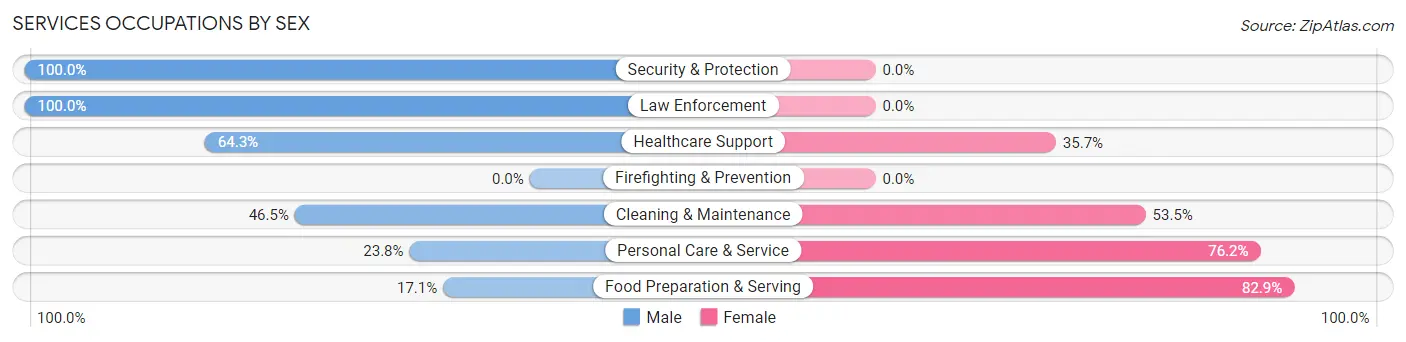
Services Occupations by Sex
Within the Services occupations in Gaylord, the most male-oriented occupations are Security & Protection (100.0%), Law Enforcement (100.0%), and Healthcare Support (64.3%), while the most female-oriented occupations are Food Preparation & Serving (82.9%), Personal Care & Service (76.2%), and Cleaning & Maintenance (53.5%).
| Occupation | Male | Female |
| Healthcare Support | 18 (64.3%) | 10 (35.7%) |
| Security & Protection | 8 (100.0%) | 0 (0.0%) |
| Firefighting & Prevention | 0 (0.0%) | 0 (0.0%) |
| Law Enforcement | 8 (100.0%) | 0 (0.0%) |
| Food Preparation & Serving | 6 (17.1%) | 29 (82.9%) |
| Cleaning & Maintenance | 20 (46.5%) | 23 (53.5%) |
| Personal Care & Service | 5 (23.8%) | 16 (76.2%) |
| Total (Category) | 57 (42.2%) | 78 (57.8%) |
| Total (Overall) | 565 (52.3%) | 516 (47.7%) |
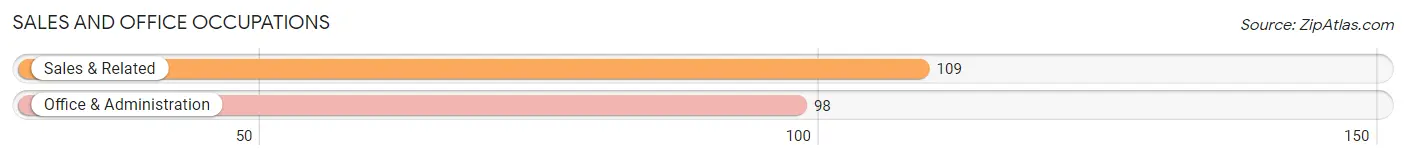
Sales and Office Occupations
The most common Sales and Office occupations in Gaylord are Sales & Related (109 | 10.1%), and Office & Administration (98 | 9.1%).
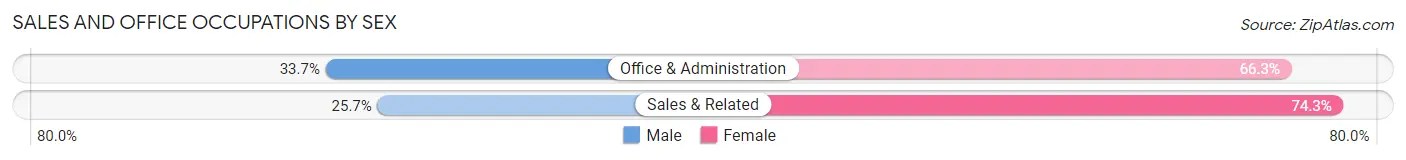
Sales and Office Occupations by Sex
| Occupation | Male | Female |
| Sales & Related | 28 (25.7%) | 81 (74.3%) |
| Office & Administration | 33 (33.7%) | 65 (66.3%) |
| Total (Category) | 61 (29.5%) | 146 (70.5%) |
| Total (Overall) | 565 (52.3%) | 516 (47.7%) |
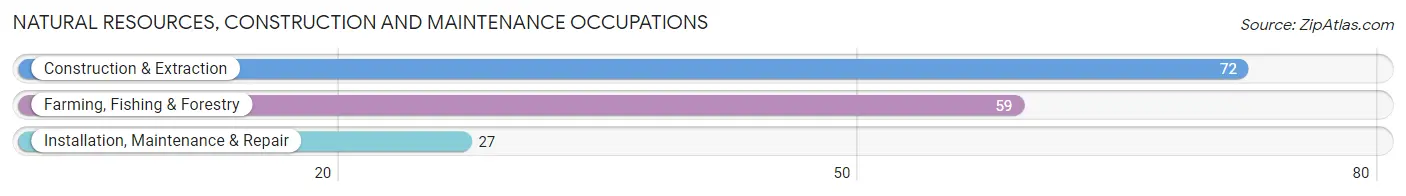
Natural Resources, Construction and Maintenance Occupations
The most common Natural Resources, Construction and Maintenance occupations in Gaylord are Construction & Extraction (72 | 6.7%), Farming, Fishing & Forestry (59 | 5.5%), and Installation, Maintenance & Repair (27 | 2.5%).
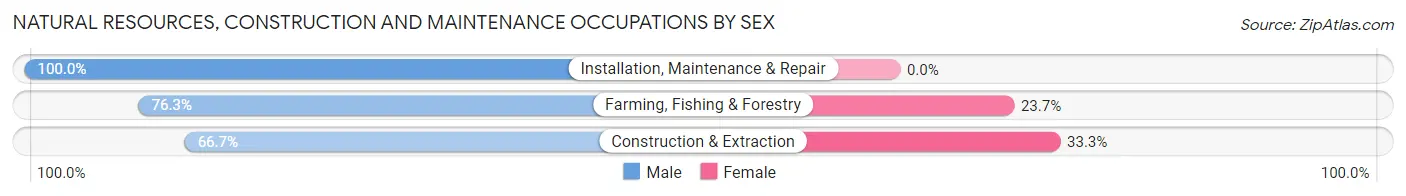
Natural Resources, Construction and Maintenance Occupations by Sex
| Occupation | Male | Female |
| Farming, Fishing & Forestry | 45 (76.3%) | 14 (23.7%) |
| Construction & Extraction | 48 (66.7%) | 24 (33.3%) |
| Installation, Maintenance & Repair | 27 (100.0%) | 0 (0.0%) |
| Total (Category) | 120 (75.9%) | 38 (24.0%) |
| Total (Overall) | 565 (52.3%) | 516 (47.7%) |
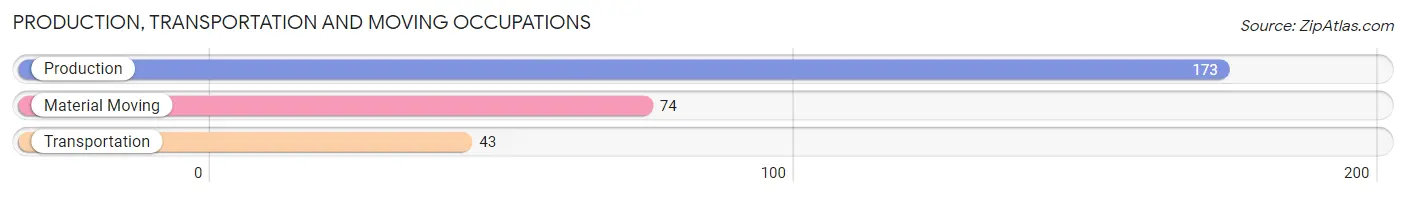
Production, Transportation and Moving Occupations
The most common Production, Transportation and Moving occupations in Gaylord are Production (173 | 16.0%), Material Moving (74 | 6.9%), and Transportation (43 | 4.0%).
Production, Transportation and Moving Occupations by Sex
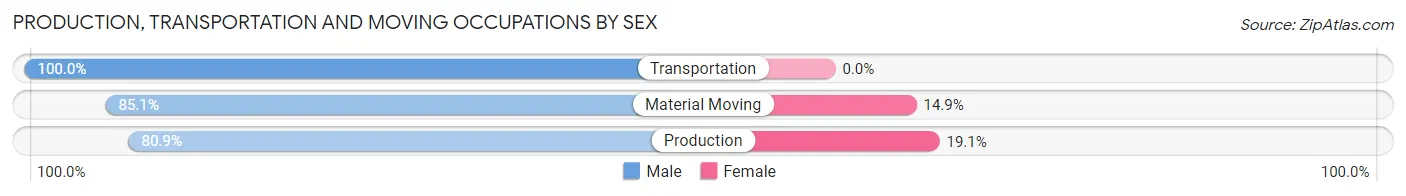
| Occupation | Male | Female |
| Production | 140 (80.9%) | 33 (19.1%) |
| Transportation | 43 (100.0%) | 0 (0.0%) |
| Material Moving | 63 (85.1%) | 11 (14.9%) |
| Total (Category) | 246 (84.8%) | 44 (15.2%) |
| Total (Overall) | 565 (52.3%) | 516 (47.7%) |
Employment Industries by Sex in Gaylord
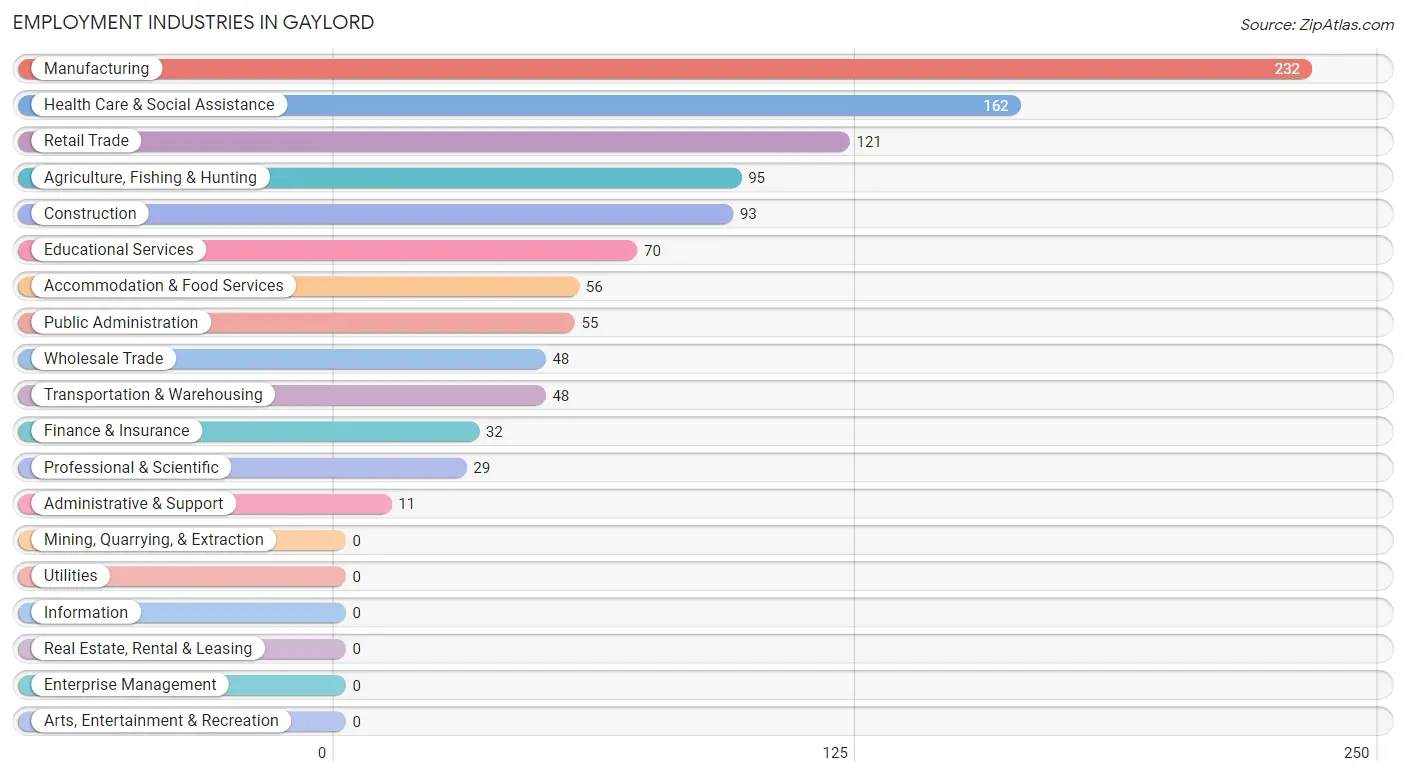
Employment Industries in Gaylord
The major employment industries in Gaylord include Manufacturing (232 | 21.5%), Health Care & Social Assistance (162 | 15.0%), Retail Trade (121 | 11.2%), Agriculture, Fishing & Hunting (95 | 8.8%), and Construction (93 | 8.6%).
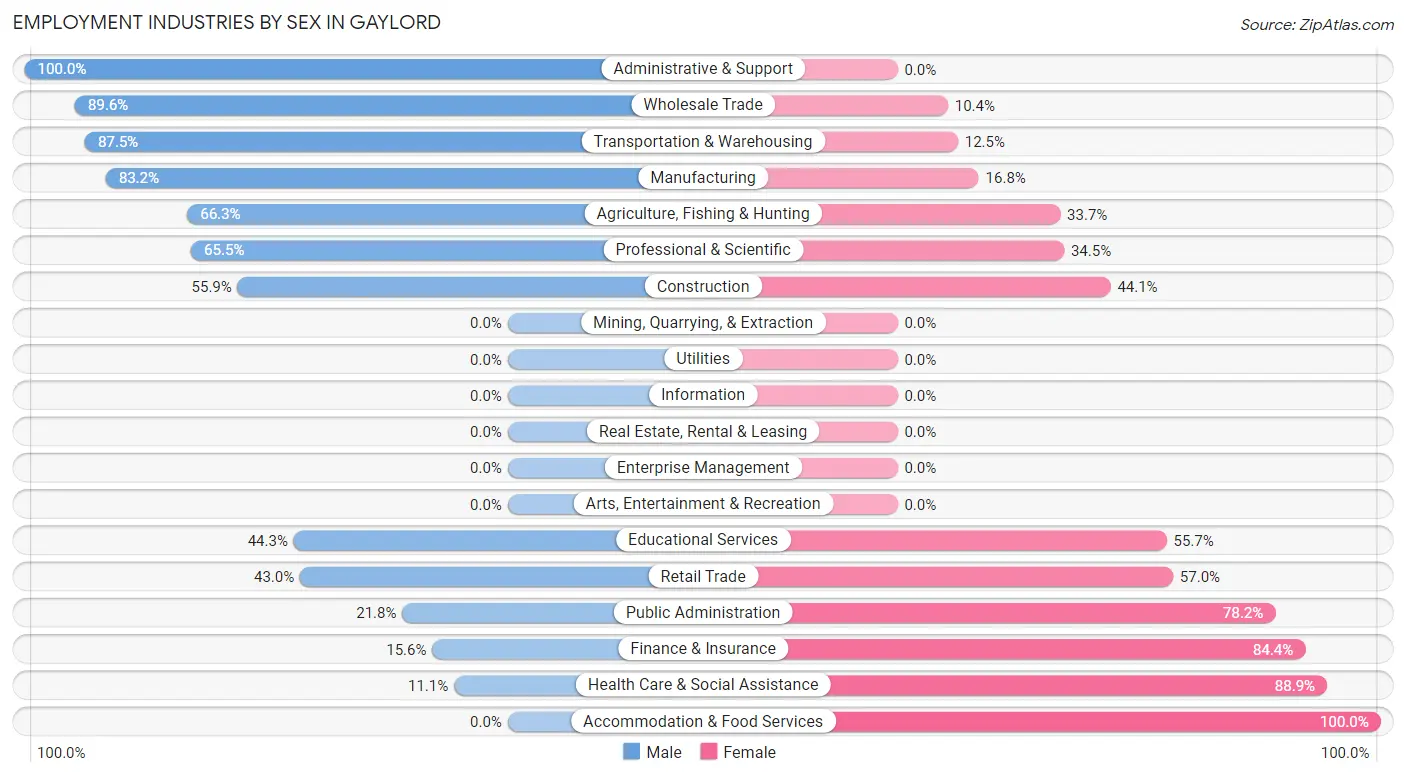
Employment Industries by Sex in Gaylord
The Gaylord industries that see more men than women are Administrative & Support (100.0%), Wholesale Trade (89.6%), and Transportation & Warehousing (87.5%), whereas the industries that tend to have a higher number of women are Accommodation & Food Services (100.0%), Health Care & Social Assistance (88.9%), and Finance & Insurance (84.4%).
| Industry | Male | Female |
| Agriculture, Fishing & Hunting | 63 (66.3%) | 32 (33.7%) |
| Mining, Quarrying, & Extraction | 0 (0.0%) | 0 (0.0%) |
| Construction | 52 (55.9%) | 41 (44.1%) |
| Manufacturing | 193 (83.2%) | 39 (16.8%) |
| Wholesale Trade | 43 (89.6%) | 5 (10.4%) |
| Retail Trade | 52 (43.0%) | 69 (57.0%) |
| Transportation & Warehousing | 42 (87.5%) | 6 (12.5%) |
| Utilities | 0 (0.0%) | 0 (0.0%) |
| Information | 0 (0.0%) | 0 (0.0%) |
| Finance & Insurance | 5 (15.6%) | 27 (84.4%) |
| Real Estate, Rental & Leasing | 0 (0.0%) | 0 (0.0%) |
| Professional & Scientific | 19 (65.5%) | 10 (34.5%) |
| Enterprise Management | 0 (0.0%) | 0 (0.0%) |
| Administrative & Support | 11 (100.0%) | 0 (0.0%) |
| Educational Services | 31 (44.3%) | 39 (55.7%) |
| Health Care & Social Assistance | 18 (11.1%) | 144 (88.9%) |
| Arts, Entertainment & Recreation | 0 (0.0%) | 0 (0.0%) |
| Accommodation & Food Services | 0 (0.0%) | 56 (100.0%) |
| Public Administration | 12 (21.8%) | 43 (78.2%) |
| Total | 565 (52.3%) | 516 (47.7%) |
Education in Gaylord
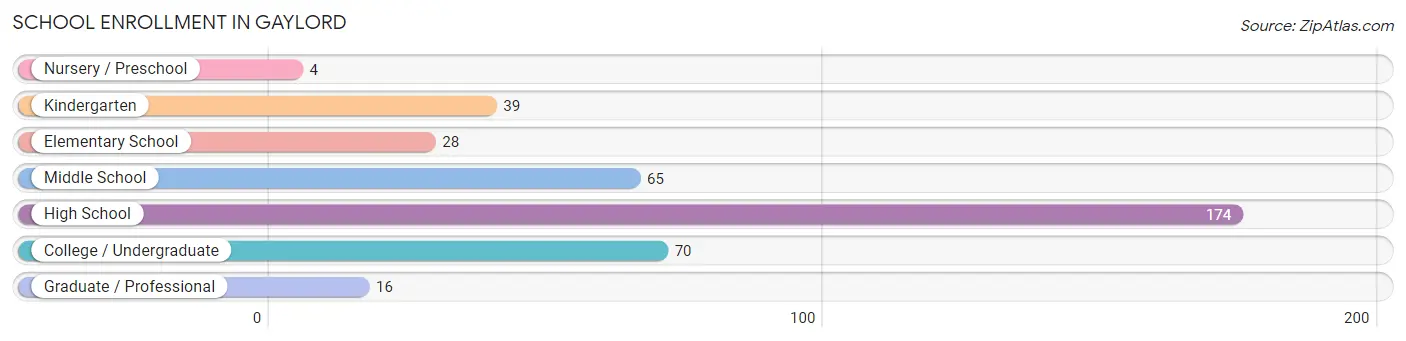
School Enrollment in Gaylord
The most common levels of schooling among the 396 students in Gaylord are high school (174 | 43.9%), college / undergraduate (70 | 17.7%), and middle school (65 | 16.4%).
| School Level | # Students | % Students |
| Nursery / Preschool | 4 | 1.0% |
| Kindergarten | 39 | 9.9% |
| Elementary School | 28 | 7.1% |
| Middle School | 65 | 16.4% |
| High School | 174 | 43.9% |
| College / Undergraduate | 70 | 17.7% |
| Graduate / Professional | 16 | 4.0% |
| Total | 396 | 100.0% |
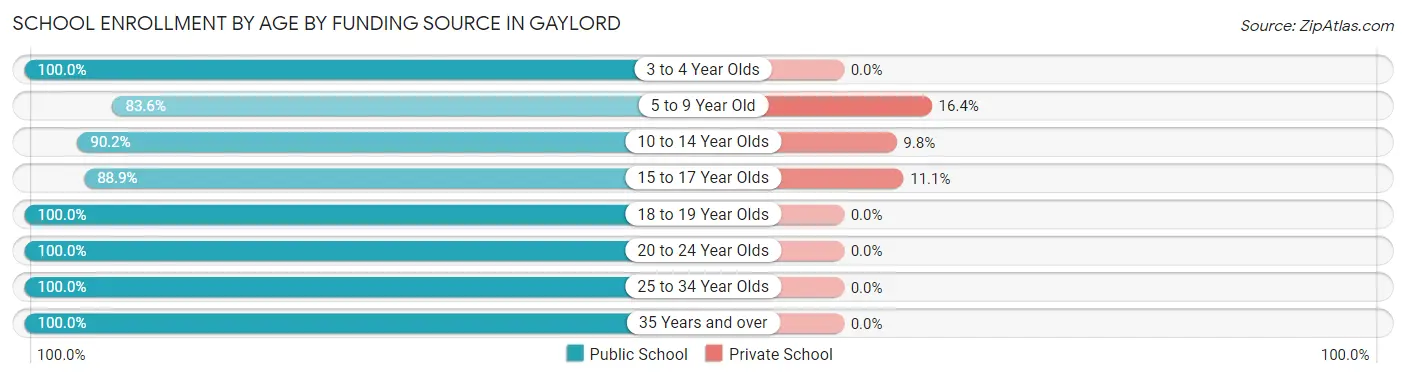
School Enrollment by Age by Funding Source in Gaylord
Out of a total of 396 students who are enrolled in schools in Gaylord, 30 (7.6%) attend a private institution, while the remaining 366 (92.4%) are enrolled in public schools. The age group of 5 to 9 year old has the highest likelihood of being enrolled in private schools, with 10 (16.4% in the age bracket) enrolled. Conversely, the age group of 3 to 4 year olds has the lowest likelihood of being enrolled in a private school, with 4 (100.0% in the age bracket) attending a public institution.
| Age Bracket | Public School | Private School |
| 3 to 4 Year Olds | 4 (100.0%) | 0 (0.0%) |
| 5 to 9 Year Old | 51 (83.6%) | 10 (16.4%) |
| 10 to 14 Year Olds | 101 (90.2%) | 11 (9.8%) |
| 15 to 17 Year Olds | 72 (88.9%) | 9 (11.1%) |
| 18 to 19 Year Olds | 68 (100.0%) | 0 (0.0%) |
| 20 to 24 Year Olds | 36 (100.0%) | 0 (0.0%) |
| 25 to 34 Year Olds | 7 (100.0%) | 0 (0.0%) |
| 35 Years and over | 27 (100.0%) | 0 (0.0%) |
| Total | 366 (92.4%) | 30 (7.6%) |
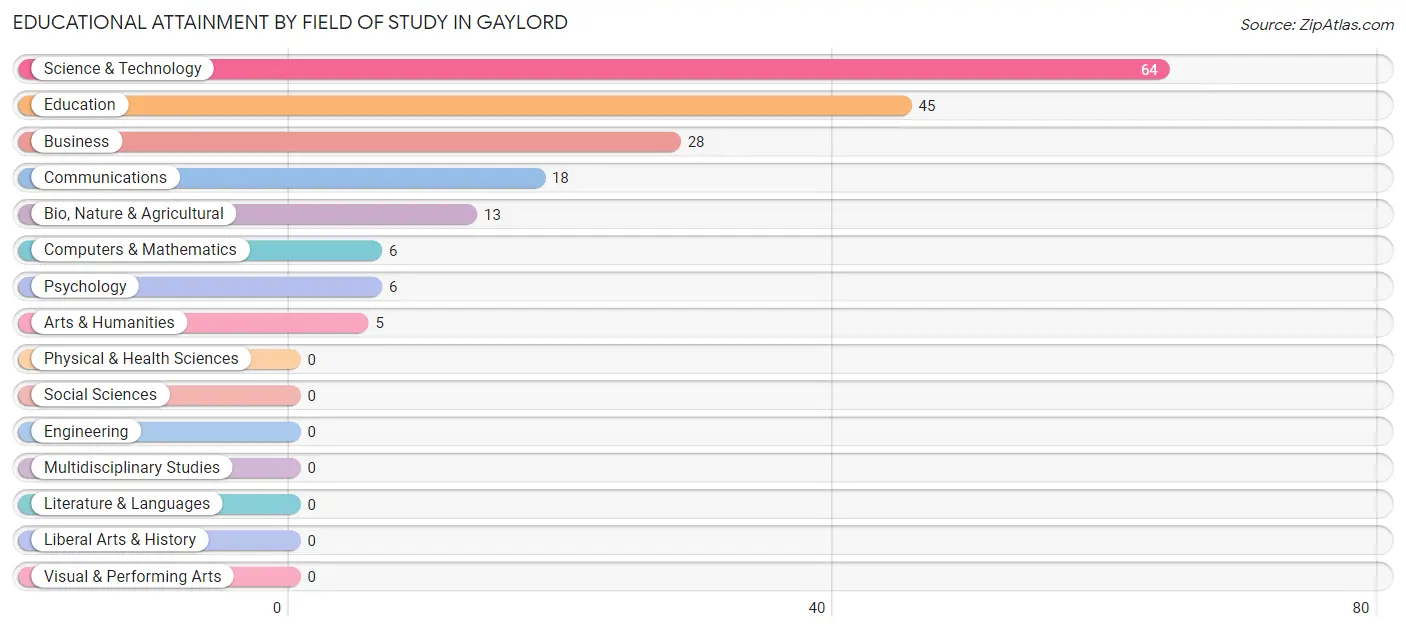
Educational Attainment by Field of Study in Gaylord
Science & technology (64 | 34.6%), education (45 | 24.3%), business (28 | 15.1%), communications (18 | 9.7%), and bio, nature & agricultural (13 | 7.0%) are the most common fields of study among 185 individuals in Gaylord who have obtained a bachelor's degree or higher.
| Field of Study | # Graduates | % Graduates |
| Computers & Mathematics | 6 | 3.2% |
| Bio, Nature & Agricultural | 13 | 7.0% |
| Physical & Health Sciences | 0 | 0.0% |
| Psychology | 6 | 3.2% |
| Social Sciences | 0 | 0.0% |
| Engineering | 0 | 0.0% |
| Multidisciplinary Studies | 0 | 0.0% |
| Science & Technology | 64 | 34.6% |
| Business | 28 | 15.1% |
| Education | 45 | 24.3% |
| Literature & Languages | 0 | 0.0% |
| Liberal Arts & History | 0 | 0.0% |
| Visual & Performing Arts | 0 | 0.0% |
| Communications | 18 | 9.7% |
| Arts & Humanities | 5 | 2.7% |
| Total | 185 | 100.0% |
Transportation & Commute in Gaylord
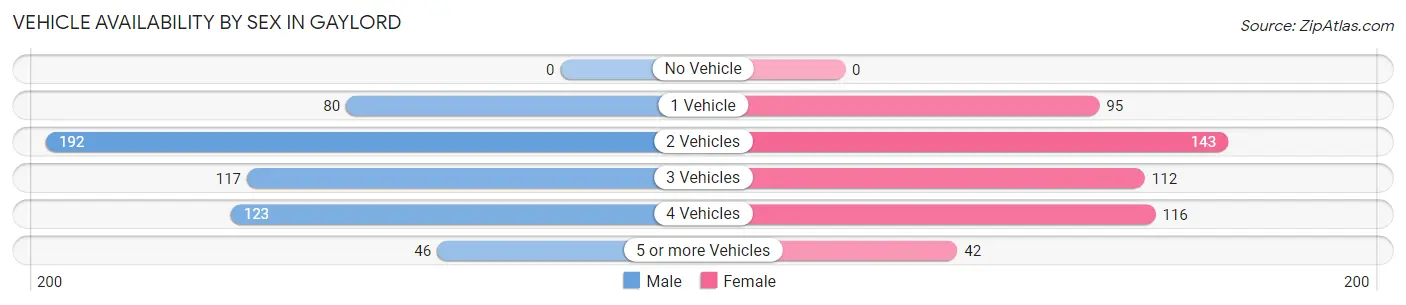
Vehicle Availability by Sex in Gaylord
The most prevalent vehicle ownership categories in Gaylord are males with 2 vehicles (192, accounting for 34.4%) and females with 2 vehicles (143, making up 37.8%).
| Vehicles Available | Male | Female |
| No Vehicle | 0 (0.0%) | 0 (0.0%) |
| 1 Vehicle | 80 (14.3%) | 95 (18.7%) |
| 2 Vehicles | 192 (34.4%) | 143 (28.1%) |
| 3 Vehicles | 117 (21.0%) | 112 (22.1%) |
| 4 Vehicles | 123 (22.0%) | 116 (22.8%) |
| 5 or more Vehicles | 46 (8.2%) | 42 (8.3%) |
| Total | 558 (100.0%) | 508 (100.0%) |
Commute Time in Gaylord
The most frequently occuring commute durations in Gaylord are 5 to 9 minutes (374 commuters, 37.8%), 30 to 34 minutes (140 commuters, 14.1%), and less than 5 minutes (94 commuters, 9.5%).
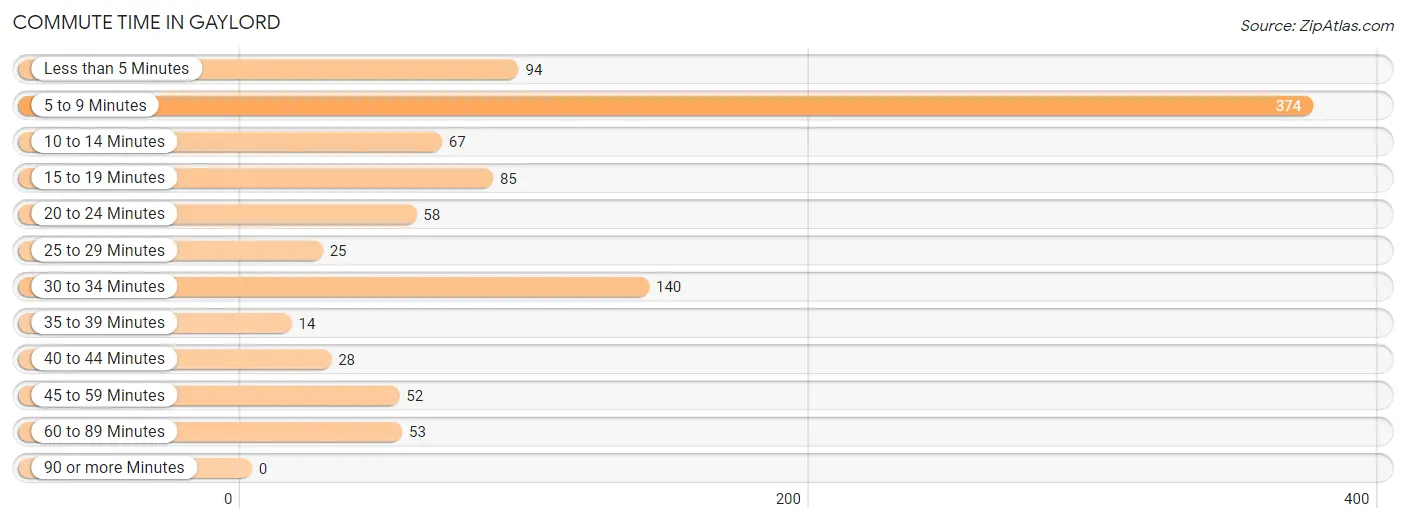
| Commute Time | # Commuters | % Commuters |
| Less than 5 Minutes | 94 | 9.5% |
| 5 to 9 Minutes | 374 | 37.8% |
| 10 to 14 Minutes | 67 | 6.8% |
| 15 to 19 Minutes | 85 | 8.6% |
| 20 to 24 Minutes | 58 | 5.9% |
| 25 to 29 Minutes | 25 | 2.5% |
| 30 to 34 Minutes | 140 | 14.1% |
| 35 to 39 Minutes | 14 | 1.4% |
| 40 to 44 Minutes | 28 | 2.8% |
| 45 to 59 Minutes | 52 | 5.2% |
| 60 to 89 Minutes | 53 | 5.3% |
| 90 or more Minutes | 0 | 0.0% |
Commute Time by Sex in Gaylord
The most common commute times in Gaylord are 5 to 9 minutes (187 commuters, 35.4%) for males and 5 to 9 minutes (187 commuters, 40.5%) for females.
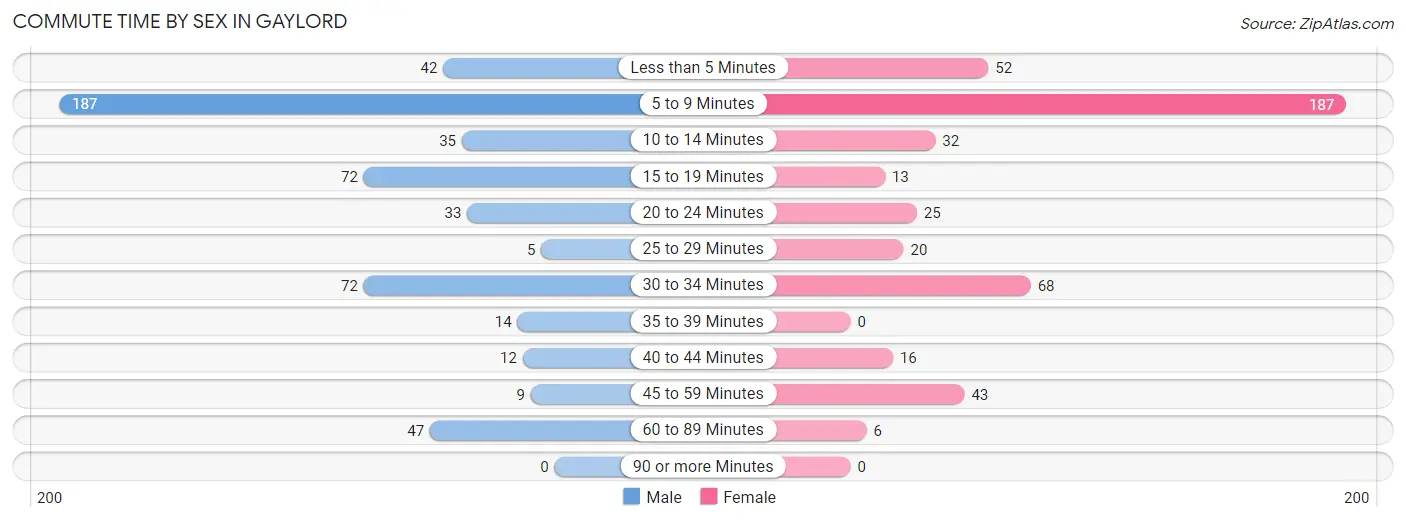
| Commute Time | Male | Female |
| Less than 5 Minutes | 42 (8.0%) | 52 (11.3%) |
| 5 to 9 Minutes | 187 (35.4%) | 187 (40.5%) |
| 10 to 14 Minutes | 35 (6.6%) | 32 (6.9%) |
| 15 to 19 Minutes | 72 (13.6%) | 13 (2.8%) |
| 20 to 24 Minutes | 33 (6.2%) | 25 (5.4%) |
| 25 to 29 Minutes | 5 (0.9%) | 20 (4.3%) |
| 30 to 34 Minutes | 72 (13.6%) | 68 (14.7%) |
| 35 to 39 Minutes | 14 (2.6%) | 0 (0.0%) |
| 40 to 44 Minutes | 12 (2.3%) | 16 (3.5%) |
| 45 to 59 Minutes | 9 (1.7%) | 43 (9.3%) |
| 60 to 89 Minutes | 47 (8.9%) | 6 (1.3%) |
| 90 or more Minutes | 0 (0.0%) | 0 (0.0%) |
Time of Departure to Work by Sex in Gaylord
The most frequent times of departure to work in Gaylord are 7:00 AM to 7:29 AM (147, 27.8%) for males and 6:00 AM to 6:29 AM (80, 17.3%) for females.
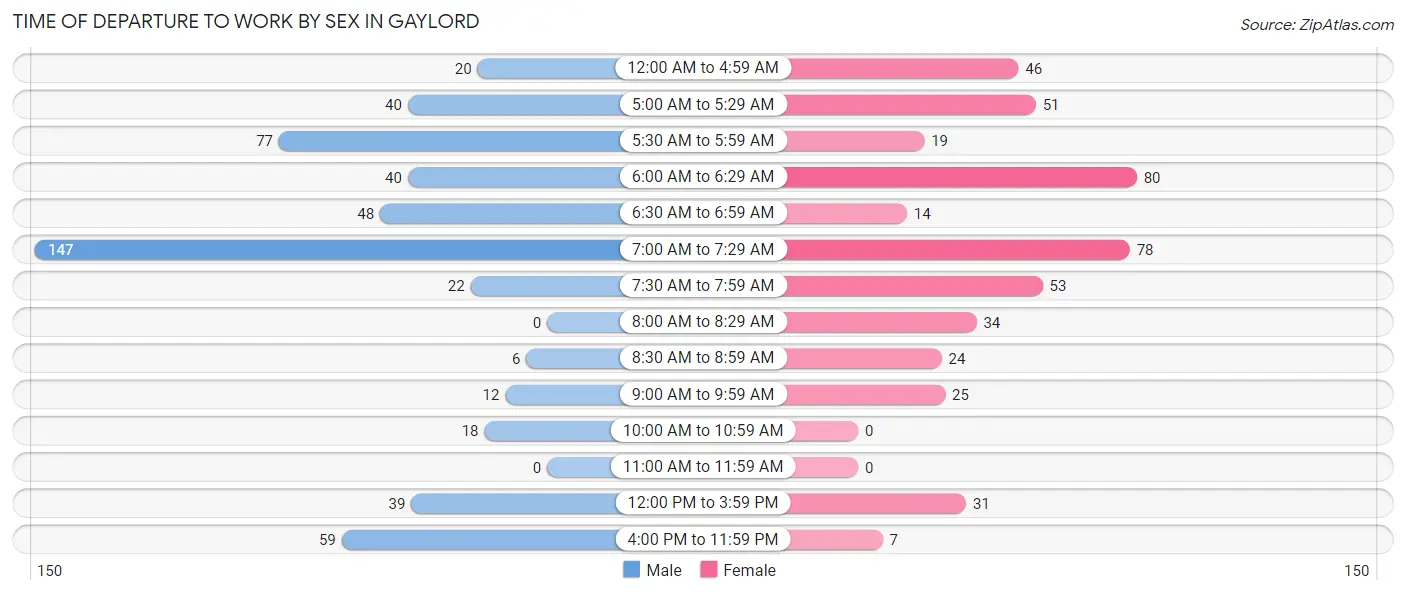
| Time of Departure | Male | Female |
| 12:00 AM to 4:59 AM | 20 (3.8%) | 46 (10.0%) |
| 5:00 AM to 5:29 AM | 40 (7.6%) | 51 (11.0%) |
| 5:30 AM to 5:59 AM | 77 (14.6%) | 19 (4.1%) |
| 6:00 AM to 6:29 AM | 40 (7.6%) | 80 (17.3%) |
| 6:30 AM to 6:59 AM | 48 (9.1%) | 14 (3.0%) |
| 7:00 AM to 7:29 AM | 147 (27.8%) | 78 (16.9%) |
| 7:30 AM to 7:59 AM | 22 (4.2%) | 53 (11.5%) |
| 8:00 AM to 8:29 AM | 0 (0.0%) | 34 (7.4%) |
| 8:30 AM to 8:59 AM | 6 (1.1%) | 24 (5.2%) |
| 9:00 AM to 9:59 AM | 12 (2.3%) | 25 (5.4%) |
| 10:00 AM to 10:59 AM | 18 (3.4%) | 0 (0.0%) |
| 11:00 AM to 11:59 AM | 0 (0.0%) | 0 (0.0%) |
| 12:00 PM to 3:59 PM | 39 (7.4%) | 31 (6.7%) |
| 4:00 PM to 11:59 PM | 59 (11.2%) | 7 (1.5%) |
| Total | 528 (100.0%) | 462 (100.0%) |
Housing Occupancy in Gaylord
Occupancy by Ownership in Gaylord
Of the total 903 dwellings in Gaylord, owner-occupied units account for 605 (67.0%), while renter-occupied units make up 298 (33.0%).
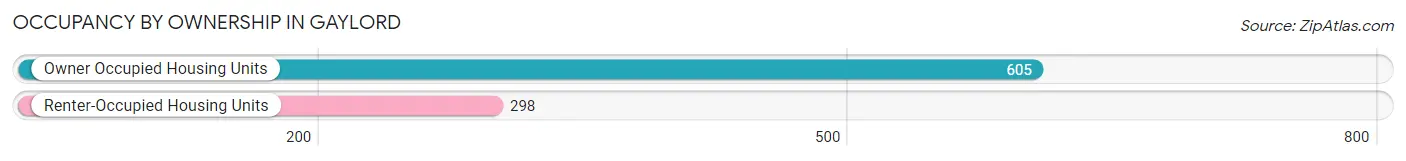
| Occupancy | # Housing Units | % Housing Units |
| Owner Occupied Housing Units | 605 | 67.0% |
| Renter-Occupied Housing Units | 298 | 33.0% |
| Total Occupied Housing Units | 903 | 100.0% |
Occupancy by Household Size in Gaylord
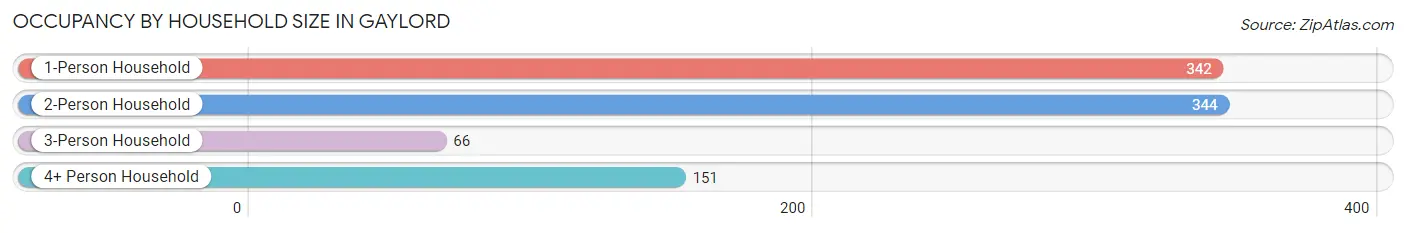
| Household Size | # Housing Units | % Housing Units |
| 1-Person Household | 342 | 37.9% |
| 2-Person Household | 344 | 38.1% |
| 3-Person Household | 66 | 7.3% |
| 4+ Person Household | 151 | 16.7% |
| Total Housing Units | 903 | 100.0% |
Occupancy by Ownership by Household Size in Gaylord
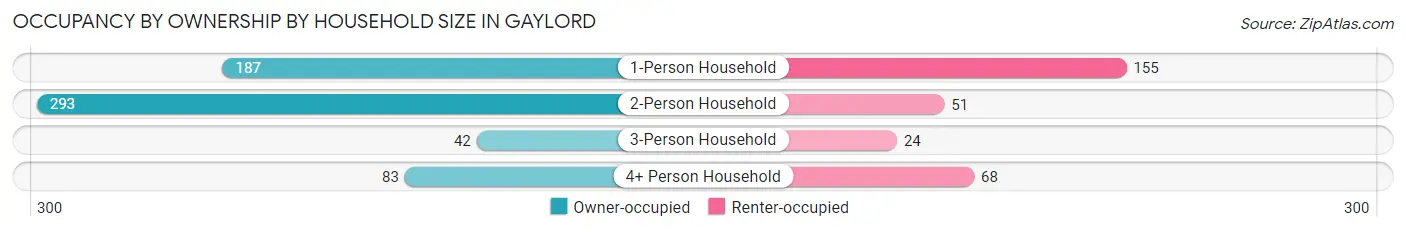
| Household Size | Owner-occupied | Renter-occupied |
| 1-Person Household | 187 (54.7%) | 155 (45.3%) |
| 2-Person Household | 293 (85.2%) | 51 (14.8%) |
| 3-Person Household | 42 (63.6%) | 24 (36.4%) |
| 4+ Person Household | 83 (55.0%) | 68 (45.0%) |
| Total Housing Units | 605 (67.0%) | 298 (33.0%) |
Occupancy by Educational Attainment in Gaylord
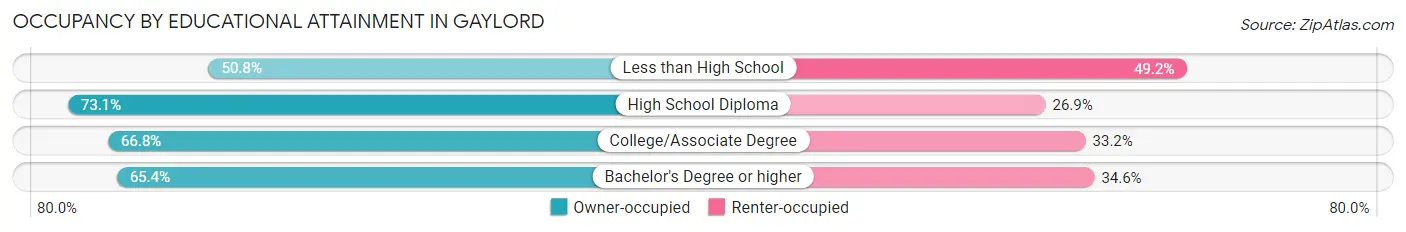
| Household Size | Owner-occupied | Renter-occupied |
| Less than High School | 61 (50.8%) | 59 (49.2%) |
| High School Diploma | 264 (73.1%) | 97 (26.9%) |
| College/Associate Degree | 195 (66.8%) | 97 (33.2%) |
| Bachelor's Degree or higher | 85 (65.4%) | 45 (34.6%) |
Occupancy by Age of Householder in Gaylord
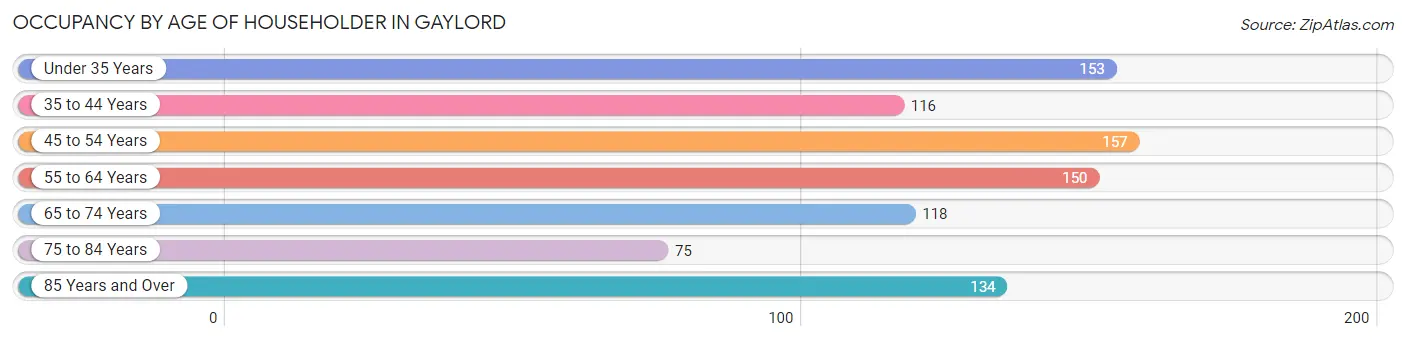
| Age Bracket | # Households | % Households |
| Under 35 Years | 153 | 16.9% |
| 35 to 44 Years | 116 | 12.9% |
| 45 to 54 Years | 157 | 17.4% |
| 55 to 64 Years | 150 | 16.6% |
| 65 to 74 Years | 118 | 13.1% |
| 75 to 84 Years | 75 | 8.3% |
| 85 Years and Over | 134 | 14.8% |
| Total | 903 | 100.0% |
Housing Finances in Gaylord
Median Income by Occupancy in Gaylord
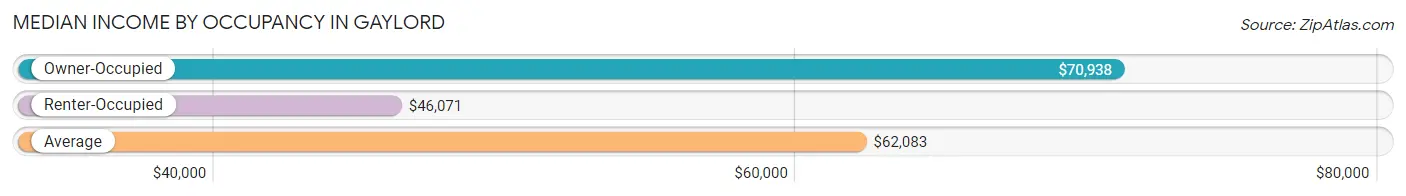
| Occupancy Type | # Households | Median Income |
| Owner-Occupied | 605 (67.0%) | $70,938 |
| Renter-Occupied | 298 (33.0%) | $46,071 |
| Average | 903 (100.0%) | $62,083 |
Occupancy by Householder Income Bracket in Gaylord
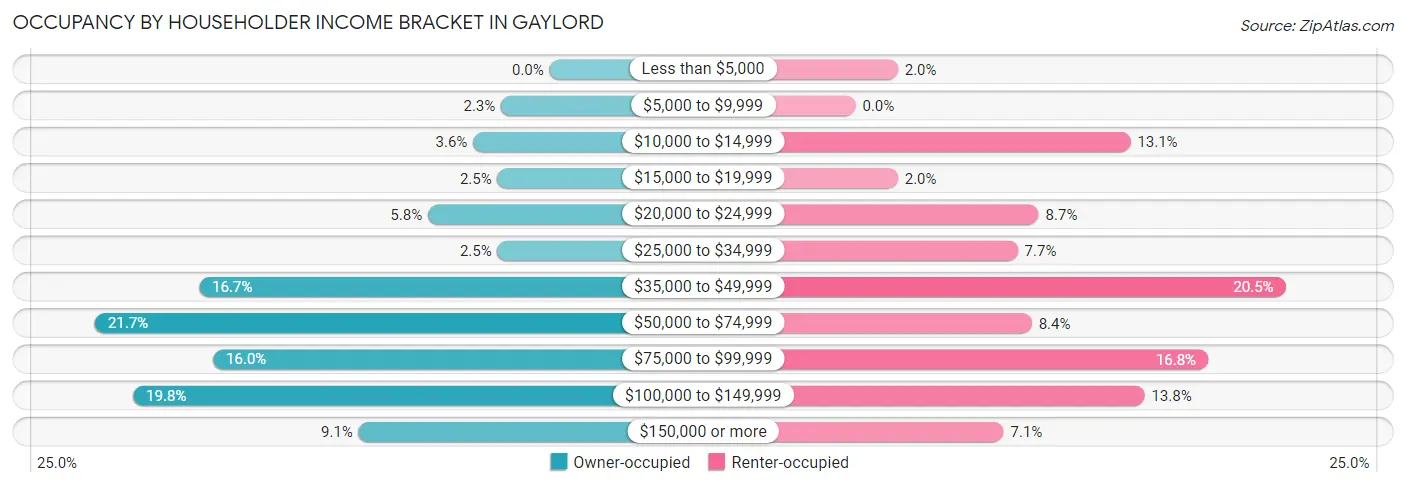
| Income Bracket | Owner-occupied | Renter-occupied |
| Less than $5,000 | 0 (0.0%) | 6 (2.0%) |
| $5,000 to $9,999 | 14 (2.3%) | 0 (0.0%) |
| $10,000 to $14,999 | 22 (3.6%) | 39 (13.1%) |
| $15,000 to $19,999 | 15 (2.5%) | 6 (2.0%) |
| $20,000 to $24,999 | 35 (5.8%) | 26 (8.7%) |
| $25,000 to $34,999 | 15 (2.5%) | 23 (7.7%) |
| $35,000 to $49,999 | 101 (16.7%) | 61 (20.5%) |
| $50,000 to $74,999 | 131 (21.6%) | 25 (8.4%) |
| $75,000 to $99,999 | 97 (16.0%) | 50 (16.8%) |
| $100,000 to $149,999 | 120 (19.8%) | 41 (13.8%) |
| $150,000 or more | 55 (9.1%) | 21 (7.0%) |
| Total | 605 (100.0%) | 298 (100.0%) |
Monthly Housing Cost Tiers in Gaylord
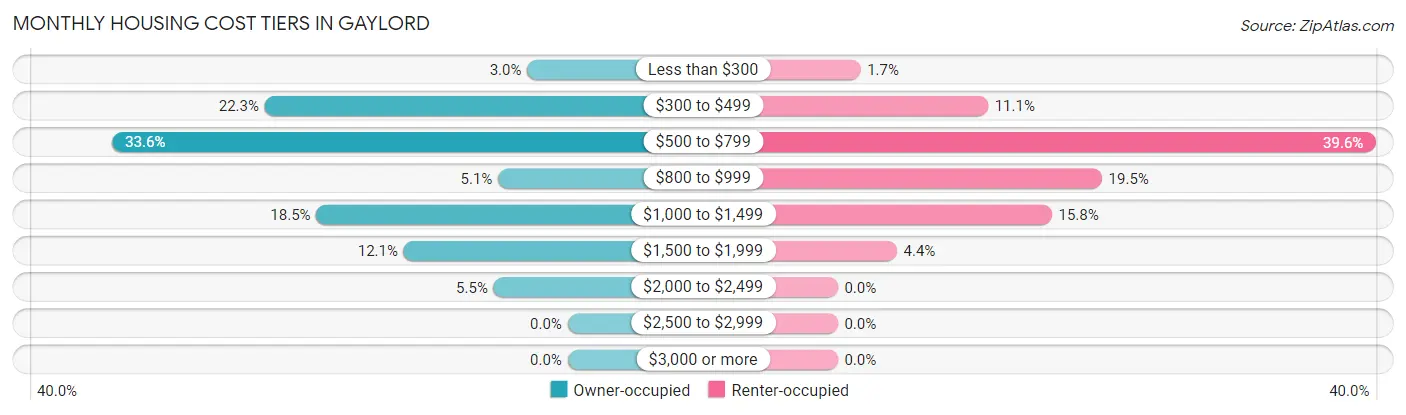
| Monthly Cost | Owner-occupied | Renter-occupied |
| Less than $300 | 18 (3.0%) | 5 (1.7%) |
| $300 to $499 | 135 (22.3%) | 33 (11.1%) |
| $500 to $799 | 203 (33.6%) | 118 (39.6%) |
| $800 to $999 | 31 (5.1%) | 58 (19.5%) |
| $1,000 to $1,499 | 112 (18.5%) | 47 (15.8%) |
| $1,500 to $1,999 | 73 (12.1%) | 13 (4.4%) |
| $2,000 to $2,499 | 33 (5.4%) | 0 (0.0%) |
| $2,500 to $2,999 | 0 (0.0%) | 0 (0.0%) |
| $3,000 or more | 0 (0.0%) | 0 (0.0%) |
| Total | 605 (100.0%) | 298 (100.0%) |
Physical Housing Characteristics in Gaylord
Housing Structures in Gaylord
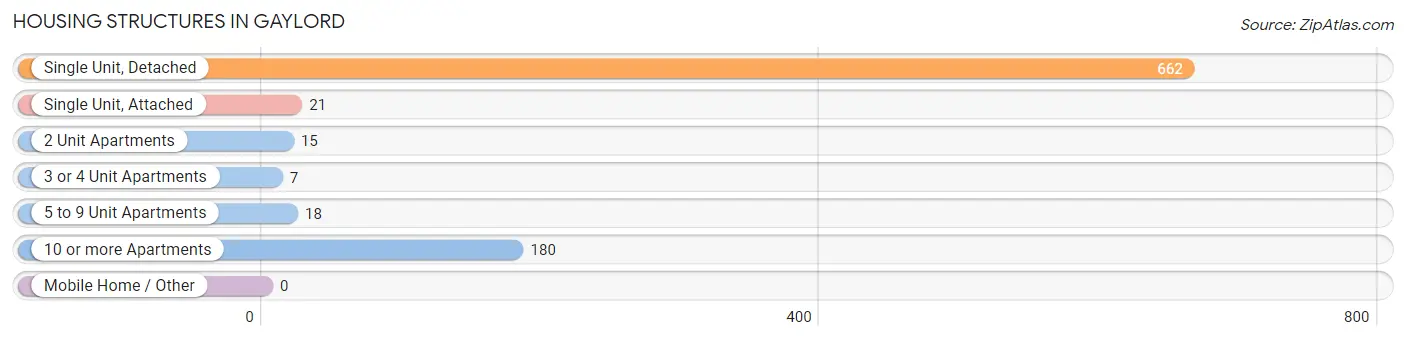
| Structure Type | # Housing Units | % Housing Units |
| Single Unit, Detached | 662 | 73.3% |
| Single Unit, Attached | 21 | 2.3% |
| 2 Unit Apartments | 15 | 1.7% |
| 3 or 4 Unit Apartments | 7 | 0.8% |
| 5 to 9 Unit Apartments | 18 | 2.0% |
| 10 or more Apartments | 180 | 19.9% |
| Mobile Home / Other | 0 | 0.0% |
| Total | 903 | 100.0% |
Housing Structures by Occupancy in Gaylord
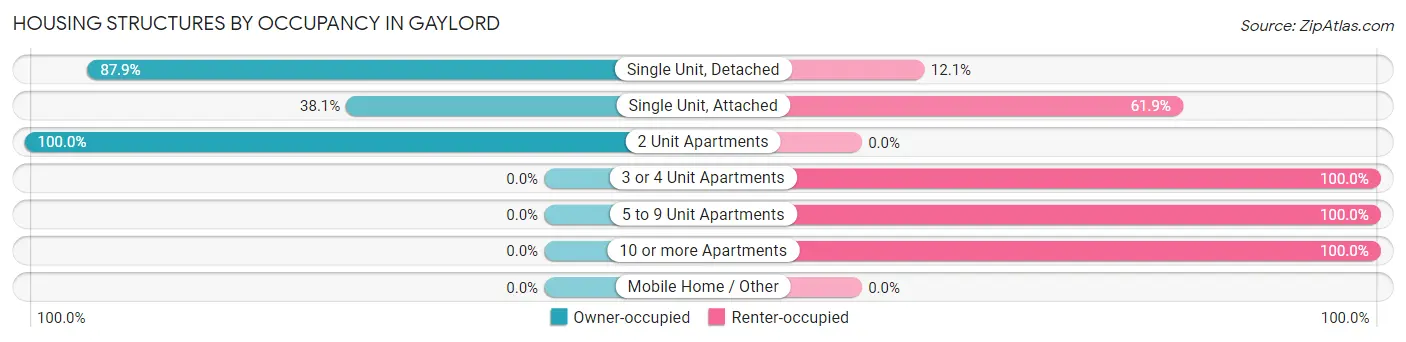
| Structure Type | Owner-occupied | Renter-occupied |
| Single Unit, Detached | 582 (87.9%) | 80 (12.1%) |
| Single Unit, Attached | 8 (38.1%) | 13 (61.9%) |
| 2 Unit Apartments | 15 (100.0%) | 0 (0.0%) |
| 3 or 4 Unit Apartments | 0 (0.0%) | 7 (100.0%) |
| 5 to 9 Unit Apartments | 0 (0.0%) | 18 (100.0%) |
| 10 or more Apartments | 0 (0.0%) | 180 (100.0%) |
| Mobile Home / Other | 0 (0.0%) | 0 (0.0%) |
| Total | 605 (67.0%) | 298 (33.0%) |
Housing Structures by Number of Rooms in Gaylord
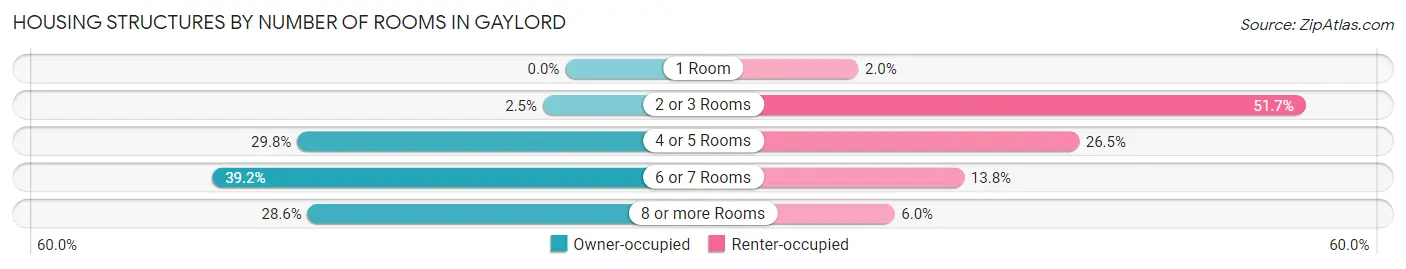
| Number of Rooms | Owner-occupied | Renter-occupied |
| 1 Room | 0 (0.0%) | 6 (2.0%) |
| 2 or 3 Rooms | 15 (2.5%) | 154 (51.7%) |
| 4 or 5 Rooms | 180 (29.7%) | 79 (26.5%) |
| 6 or 7 Rooms | 237 (39.2%) | 41 (13.8%) |
| 8 or more Rooms | 173 (28.6%) | 18 (6.0%) |
| Total | 605 (100.0%) | 298 (100.0%) |
Housing Structure by Heating Type in Gaylord
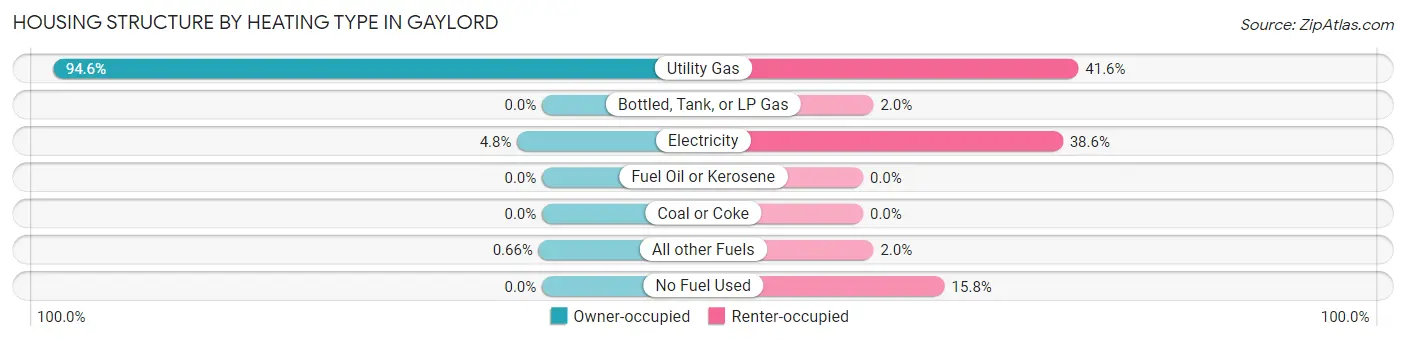
| Heating Type | Owner-occupied | Renter-occupied |
| Utility Gas | 572 (94.6%) | 124 (41.6%) |
| Bottled, Tank, or LP Gas | 0 (0.0%) | 6 (2.0%) |
| Electricity | 29 (4.8%) | 115 (38.6%) |
| Fuel Oil or Kerosene | 0 (0.0%) | 0 (0.0%) |
| Coal or Coke | 0 (0.0%) | 0 (0.0%) |
| All other Fuels | 4 (0.7%) | 6 (2.0%) |
| No Fuel Used | 0 (0.0%) | 47 (15.8%) |
| Total | 605 (100.0%) | 298 (100.0%) |
Household Vehicle Usage in Gaylord
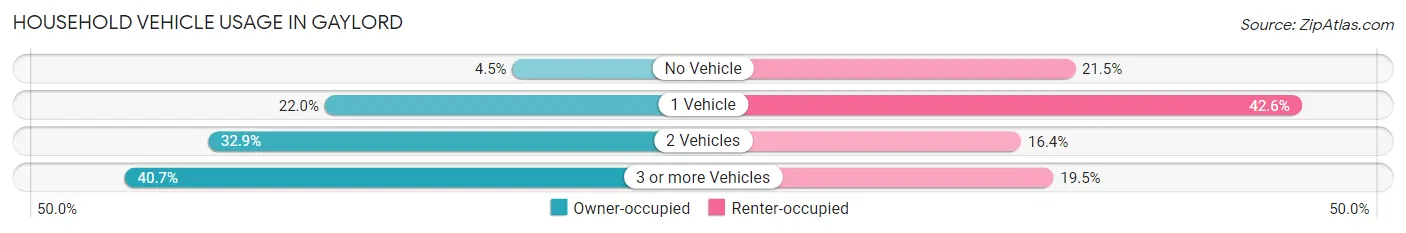
| Vehicles per Household | Owner-occupied | Renter-occupied |
| No Vehicle | 27 (4.5%) | 64 (21.5%) |
| 1 Vehicle | 133 (22.0%) | 127 (42.6%) |
| 2 Vehicles | 199 (32.9%) | 49 (16.4%) |
| 3 or more Vehicles | 246 (40.7%) | 58 (19.5%) |
| Total | 605 (100.0%) | 298 (100.0%) |
Real Estate & Mortgages in Gaylord
Real Estate and Mortgage Overview in Gaylord
| Characteristic | Without Mortgage | With Mortgage |
| Housing Units | 327 | 278 |
| Median Property Value | $137,200 | $170,800 |
| Median Household Income | $44,450 | $39 |
| Monthly Housing Costs | $531 | $0 |
| Real Estate Taxes | $2,112 | $3 |
Property Value by Mortgage Status in Gaylord
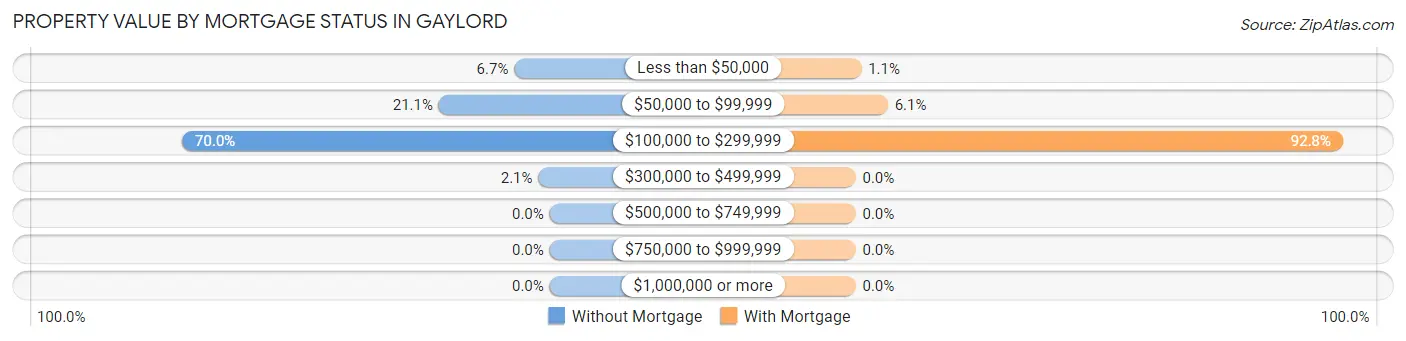
| Property Value | Without Mortgage | With Mortgage |
| Less than $50,000 | 22 (6.7%) | 3 (1.1%) |
| $50,000 to $99,999 | 69 (21.1%) | 17 (6.1%) |
| $100,000 to $299,999 | 229 (70.0%) | 258 (92.8%) |
| $300,000 to $499,999 | 7 (2.1%) | 0 (0.0%) |
| $500,000 to $749,999 | 0 (0.0%) | 0 (0.0%) |
| $750,000 to $999,999 | 0 (0.0%) | 0 (0.0%) |
| $1,000,000 or more | 0 (0.0%) | 0 (0.0%) |
| Total | 327 (100.0%) | 278 (100.0%) |
Household Income by Mortgage Status in Gaylord
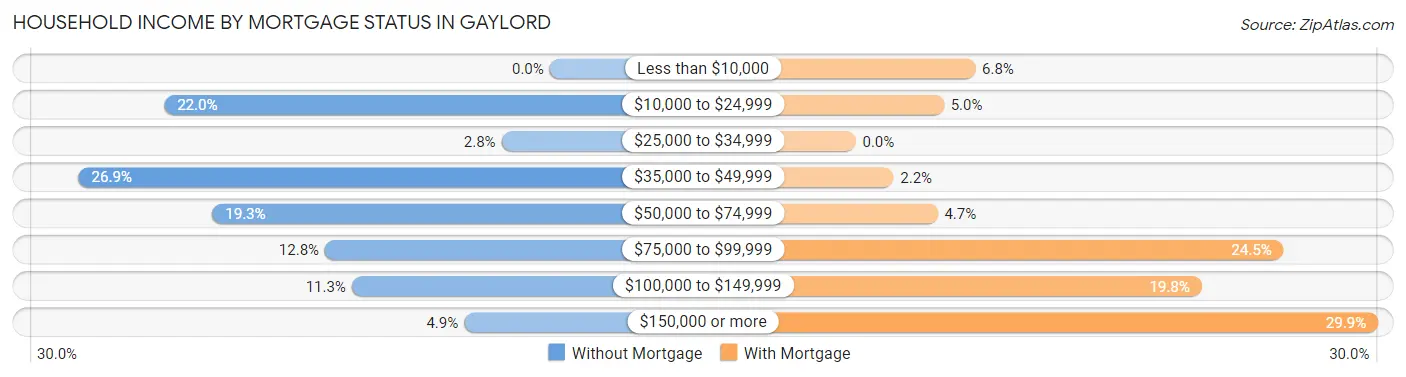
| Household Income | Without Mortgage | With Mortgage |
| Less than $10,000 | 0 (0.0%) | 19 (6.8%) |
| $10,000 to $24,999 | 72 (22.0%) | 14 (5.0%) |
| $25,000 to $34,999 | 9 (2.8%) | 0 (0.0%) |
| $35,000 to $49,999 | 88 (26.9%) | 6 (2.2%) |
| $50,000 to $74,999 | 63 (19.3%) | 13 (4.7%) |
| $75,000 to $99,999 | 42 (12.8%) | 68 (24.5%) |
| $100,000 to $149,999 | 37 (11.3%) | 55 (19.8%) |
| $150,000 or more | 16 (4.9%) | 83 (29.9%) |
| Total | 327 (100.0%) | 278 (100.0%) |
Property Value to Household Income Ratio in Gaylord
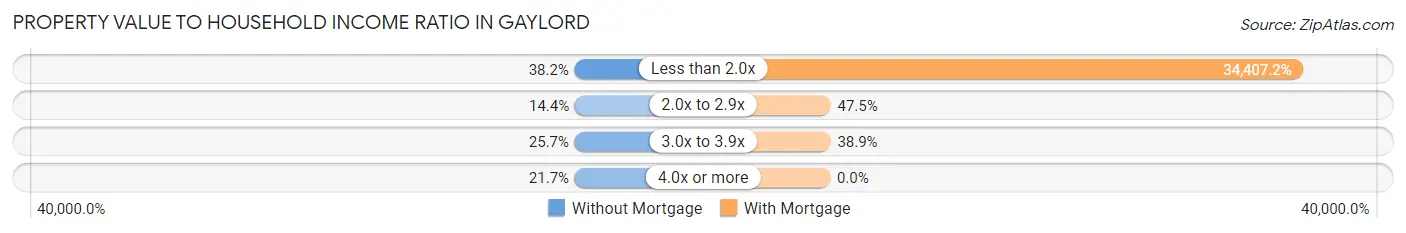
| Value-to-Income Ratio | Without Mortgage | With Mortgage |
| Less than 2.0x | 125 (38.2%) | 95,652 (34,407.2%) |
| 2.0x to 2.9x | 47 (14.4%) | 132 (47.5%) |
| 3.0x to 3.9x | 84 (25.7%) | 108 (38.9%) |
| 4.0x or more | 71 (21.7%) | 0 (0.0%) |
| Total | 327 (100.0%) | 278 (100.0%) |
Real Estate Taxes by Mortgage Status in Gaylord
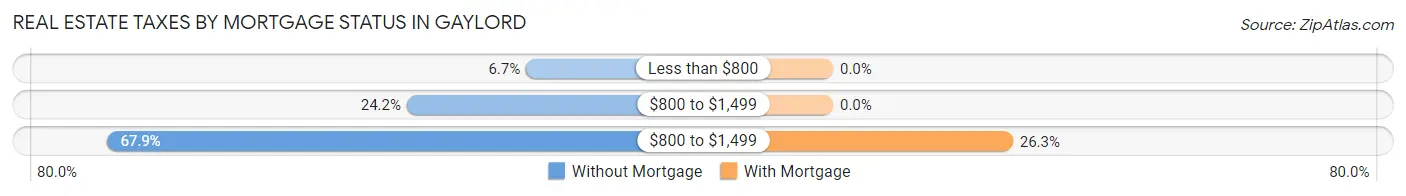
| Property Taxes | Without Mortgage | With Mortgage |
| Less than $800 | 22 (6.7%) | 0 (0.0%) |
| $800 to $1,499 | 79 (24.2%) | 0 (0.0%) |
| $800 to $1,499 | 222 (67.9%) | 73 (26.3%) |
| Total | 327 (100.0%) | 278 (100.0%) |
Health & Disability in Gaylord
Health Insurance Coverage by Age in Gaylord
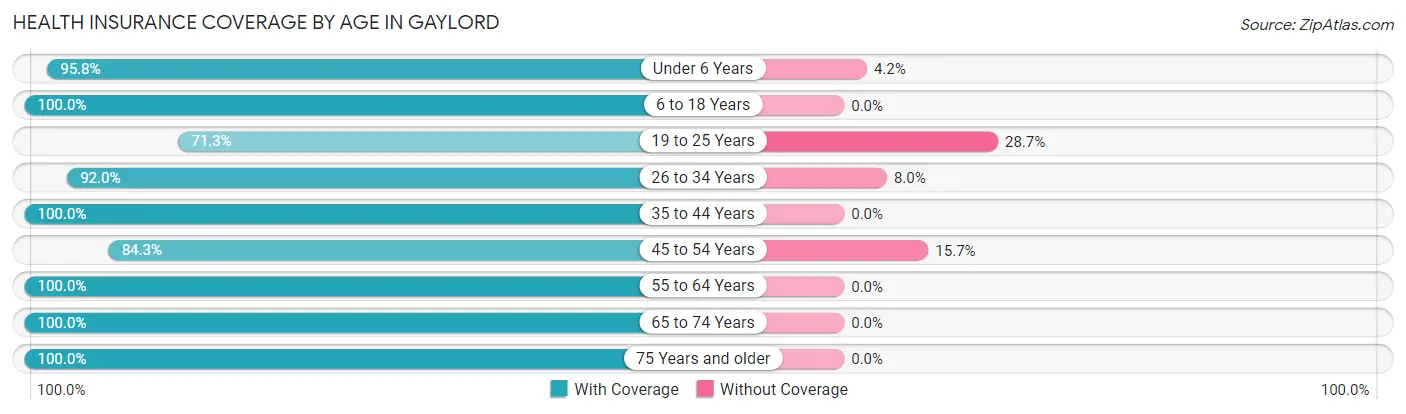
| Age Bracket | With Coverage | Without Coverage |
| Under 6 Years | 113 (95.8%) | 5 (4.2%) |
| 6 to 18 Years | 298 (100.0%) | 0 (0.0%) |
| 19 to 25 Years | 107 (71.3%) | 43 (28.7%) |
| 26 to 34 Years | 208 (92.0%) | 18 (8.0%) |
| 35 to 44 Years | 240 (100.0%) | 0 (0.0%) |
| 45 to 54 Years | 258 (84.3%) | 48 (15.7%) |
| 55 to 64 Years | 271 (100.0%) | 0 (0.0%) |
| 65 to 74 Years | 178 (100.0%) | 0 (0.0%) |
| 75 Years and older | 235 (100.0%) | 0 (0.0%) |
| Total | 1,908 (94.4%) | 114 (5.6%) |
Health Insurance Coverage by Citizenship Status in Gaylord
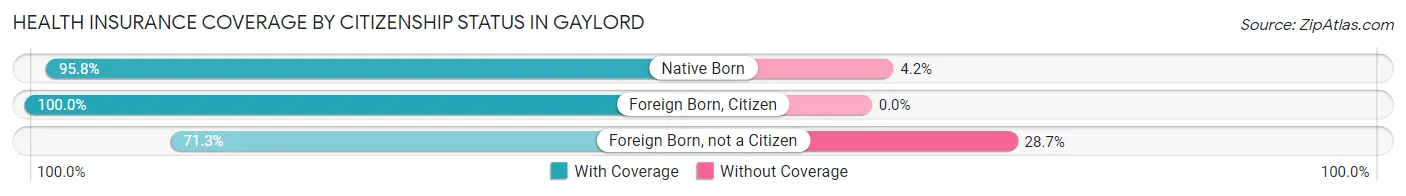
| Citizenship Status | With Coverage | Without Coverage |
| Native Born | 113 (95.8%) | 5 (4.2%) |
| Foreign Born, Citizen | 298 (100.0%) | 0 (0.0%) |
| Foreign Born, not a Citizen | 107 (71.3%) | 43 (28.7%) |
Health Insurance Coverage by Household Income in Gaylord
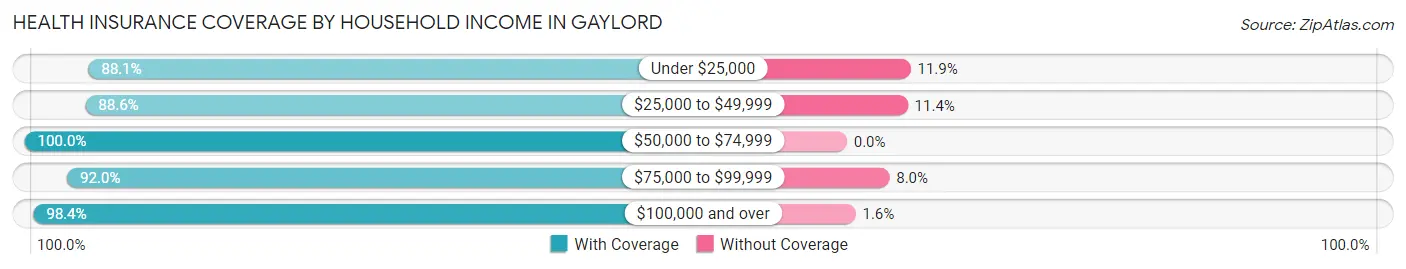
| Household Income | With Coverage | Without Coverage |
| Under $25,000 | 177 (88.1%) | 24 (11.9%) |
| $25,000 to $49,999 | 272 (88.6%) | 35 (11.4%) |
| $50,000 to $74,999 | 235 (100.0%) | 0 (0.0%) |
| $75,000 to $99,999 | 497 (92.0%) | 43 (8.0%) |
| $100,000 and over | 721 (98.4%) | 12 (1.6%) |
Public vs Private Health Insurance Coverage by Age in Gaylord
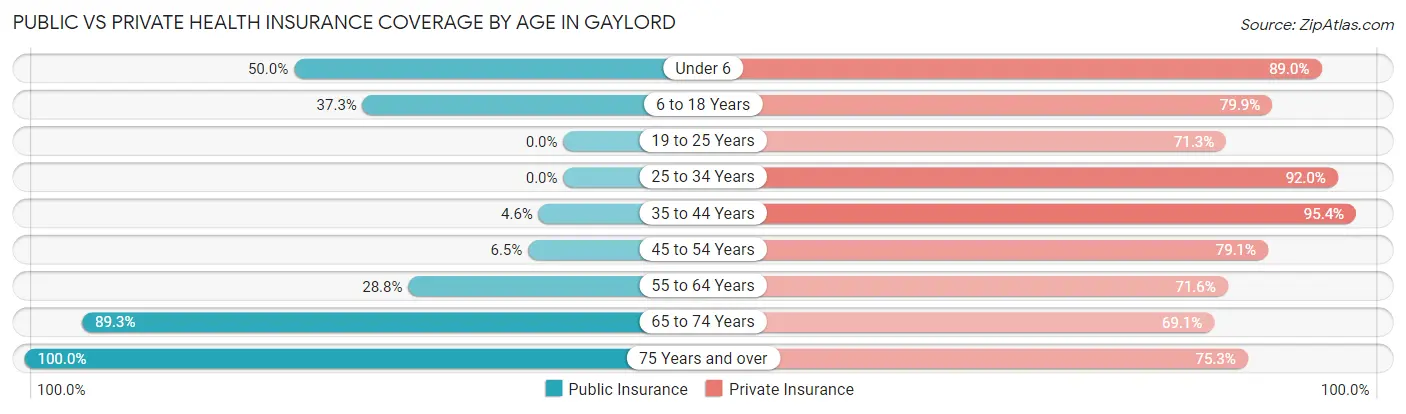
| Age Bracket | Public Insurance | Private Insurance |
| Under 6 | 59 (50.0%) | 105 (89.0%) |
| 6 to 18 Years | 111 (37.2%) | 238 (79.9%) |
| 19 to 25 Years | 0 (0.0%) | 107 (71.3%) |
| 25 to 34 Years | 0 (0.0%) | 208 (92.0%) |
| 35 to 44 Years | 11 (4.6%) | 229 (95.4%) |
| 45 to 54 Years | 20 (6.5%) | 242 (79.1%) |
| 55 to 64 Years | 78 (28.8%) | 194 (71.6%) |
| 65 to 74 Years | 159 (89.3%) | 123 (69.1%) |
| 75 Years and over | 235 (100.0%) | 177 (75.3%) |
| Total | 673 (33.3%) | 1,623 (80.3%) |
Disability Status by Sex by Age in Gaylord
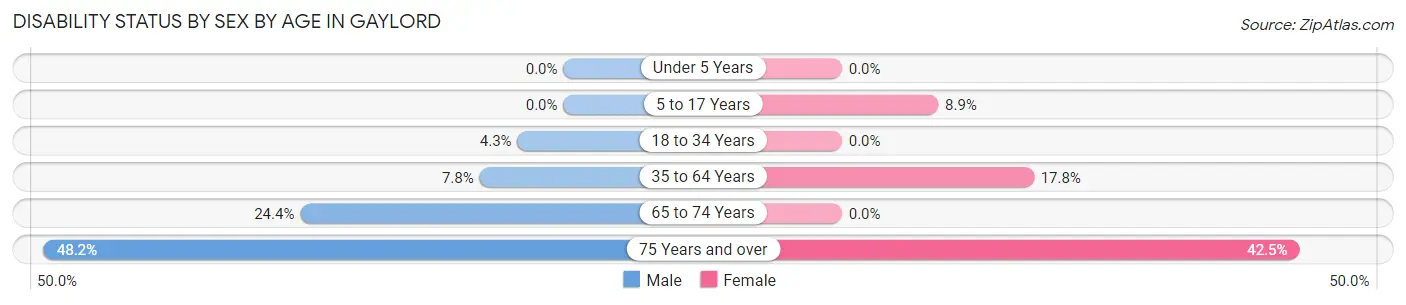
| Age Bracket | Male | Female |
| Under 5 Years | 0 (0.0%) | 0 (0.0%) |
| 5 to 17 Years | 0 (0.0%) | 11 (8.9%) |
| 18 to 34 Years | 11 (4.3%) | 0 (0.0%) |
| 35 to 64 Years | 33 (7.8%) | 70 (17.8%) |
| 65 to 74 Years | 21 (24.4%) | 0 (0.0%) |
| 75 Years and over | 27 (48.2%) | 76 (42.5%) |
Disability Class by Sex by Age in Gaylord
Disability Class: Hearing Difficulty
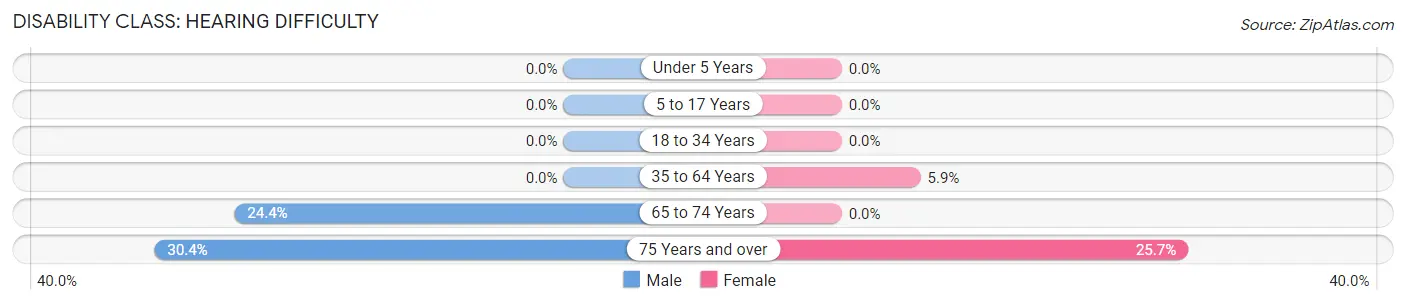
| Age Bracket | Male | Female |
| Under 5 Years | 0 (0.0%) | 0 (0.0%) |
| 5 to 17 Years | 0 (0.0%) | 0 (0.0%) |
| 18 to 34 Years | 0 (0.0%) | 0 (0.0%) |
| 35 to 64 Years | 0 (0.0%) | 23 (5.9%) |
| 65 to 74 Years | 21 (24.4%) | 0 (0.0%) |
| 75 Years and over | 17 (30.4%) | 46 (25.7%) |
Disability Class: Vision Difficulty
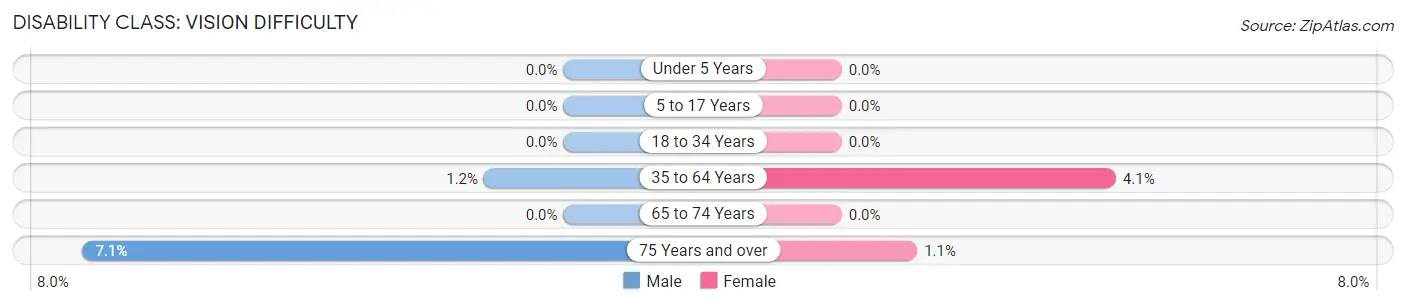
| Age Bracket | Male | Female |
| Under 5 Years | 0 (0.0%) | 0 (0.0%) |
| 5 to 17 Years | 0 (0.0%) | 0 (0.0%) |
| 18 to 34 Years | 0 (0.0%) | 0 (0.0%) |
| 35 to 64 Years | 5 (1.2%) | 16 (4.1%) |
| 65 to 74 Years | 0 (0.0%) | 0 (0.0%) |
| 75 Years and over | 4 (7.1%) | 2 (1.1%) |
Disability Class: Cognitive Difficulty
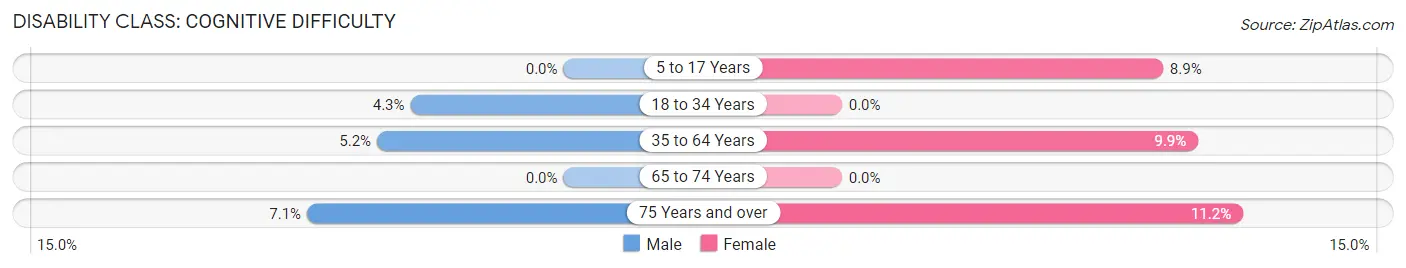
| Age Bracket | Male | Female |
| 5 to 17 Years | 0 (0.0%) | 11 (8.9%) |
| 18 to 34 Years | 11 (4.3%) | 0 (0.0%) |
| 35 to 64 Years | 22 (5.2%) | 39 (9.9%) |
| 65 to 74 Years | 0 (0.0%) | 0 (0.0%) |
| 75 Years and over | 4 (7.1%) | 20 (11.2%) |
Disability Class: Ambulatory Difficulty
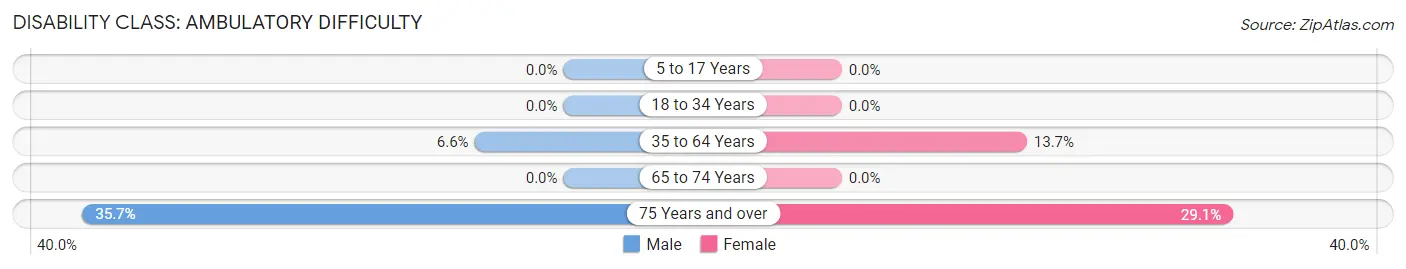
| Age Bracket | Male | Female |
| 5 to 17 Years | 0 (0.0%) | 0 (0.0%) |
| 18 to 34 Years | 0 (0.0%) | 0 (0.0%) |
| 35 to 64 Years | 28 (6.6%) | 54 (13.7%) |
| 65 to 74 Years | 0 (0.0%) | 0 (0.0%) |
| 75 Years and over | 20 (35.7%) | 52 (29.0%) |
Disability Class: Self-Care Difficulty
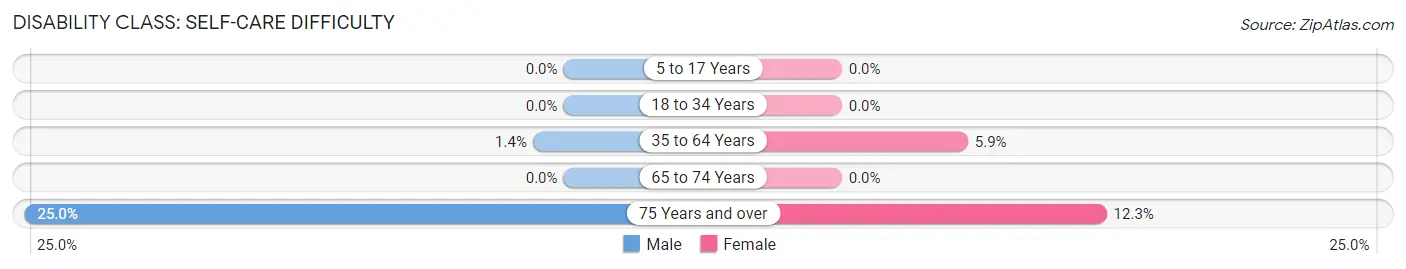
| Age Bracket | Male | Female |
| 5 to 17 Years | 0 (0.0%) | 0 (0.0%) |
| 18 to 34 Years | 0 (0.0%) | 0 (0.0%) |
| 35 to 64 Years | 6 (1.4%) | 23 (5.9%) |
| 65 to 74 Years | 0 (0.0%) | 0 (0.0%) |
| 75 Years and over | 14 (25.0%) | 22 (12.3%) |
Technology Access in Gaylord
Computing Device Access in Gaylord
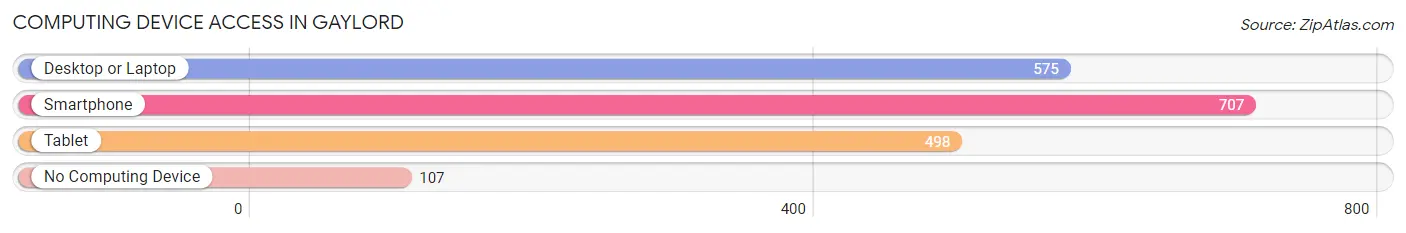
| Device Type | # Households | % Households |
| Desktop or Laptop | 575 | 63.7% |
| Smartphone | 707 | 78.3% |
| Tablet | 498 | 55.1% |
| No Computing Device | 107 | 11.8% |
| Total | 903 | 100.0% |
Internet Access in Gaylord
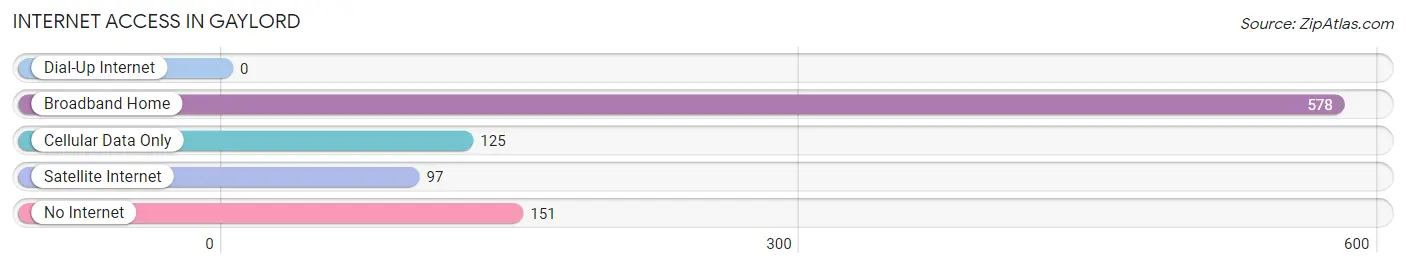
| Internet Type | # Households | % Households |
| Dial-Up Internet | 0 | 0.0% |
| Broadband Home | 578 | 64.0% |
| Cellular Data Only | 125 | 13.8% |
| Satellite Internet | 97 | 10.7% |
| No Internet | 151 | 16.7% |
| Total | 903 | 100.0% |
Gaylord Summary
Geography
The city of Gaylord, Minnesota is located in the south-central part of the state, in Sibley County. It is situated on the banks of the Minnesota River, about 40 miles southwest of Minneapolis. The city is surrounded by rolling hills and farmland, and is located in the heart of the Minnesota River Valley. The city is located at the intersection of two major highways, US Highway 212 and Minnesota State Highway 19.
The city of Gaylord covers an area of 2.3 square miles, with a population of 2,845 people as of the 2010 census. The city is divided into two distinct sections, the downtown area and the residential area. The downtown area is home to a variety of businesses, including restaurants, shops, and other services. The residential area is made up of single-family homes, apartments, and condominiums.
History
The city of Gaylord was founded in 1856 by a group of settlers from New York. The city was named after the first settler, John Gaylord, who was a prominent businessman in the area. The city quickly grew and became an important trading center for the surrounding area.
In the late 19th century, the city was a major hub for the lumber industry. The city was also home to a number of manufacturing businesses, including a flour mill, a creamery, and a furniture factory.
In the early 20th century, the city experienced a period of growth and prosperity. The city was home to a number of businesses, including a bank, a hotel, and a movie theater. The city also had a number of churches, schools, and other civic organizations.
Economy
The economy of Gaylord is largely based on agriculture and manufacturing. The city is home to a number of agricultural businesses, including dairy farms, grain elevators, and feed mills. The city is also home to a number of manufacturing businesses, including a furniture factory, a printing company, and a plastics factory.
The city is also home to a number of retail businesses, including restaurants, shops, and other services. The city is also home to a number of medical and professional services, including doctors, dentists, and lawyers.
Demographics
As of the 2010 census, the population of Gaylord was 2,845 people. The racial makeup of the city was 97.3% White, 0.7% African American, 0.3% Native American, 0.3% Asian, 0.1% Pacific Islander, 0.3% from other races, and 1.0% from two or more races. Hispanic or Latino of any race were 1.2% of the population.
The median income for a household in the city was $45,938, and the median income for a family was $51,938. The per capita income for the city was $20,938. About 8.3% of families and 10.2% of the population were below the poverty line, including 14.2% of those under age 18 and 8.3% of those age 65 or over.
Common Questions
What is Per Capita Income in Gaylord?
Per Capita income in Gaylord is $37,133.
What is the Median Family Income in Gaylord?
Median Family Income in Gaylord is $88,064.
What is the Median Household income in Gaylord?
Median Household Income in Gaylord is $62,083.
What is Income or Wage Gap in Gaylord?
Income or Wage Gap in Gaylord is 18.0%.
Women in Gaylord earn 82.0 cents for every dollar earned by a man.
What is Inequality or Gini Index in Gaylord?
Inequality or Gini Index in Gaylord is 0.45.
What is the Total Population of Gaylord?
Total Population of Gaylord is 2,082.
What is the Total Male Population of Gaylord?
Total Male Population of Gaylord is 1,015.
What is the Total Female Population of Gaylord?
Total Female Population of Gaylord is 1,067.
What is the Ratio of Males per 100 Females in Gaylord?
There are 95.13 Males per 100 Females in Gaylord.
What is the Ratio of Females per 100 Males in Gaylord?
There are 105.12 Females per 100 Males in Gaylord.
What is the Median Population Age in Gaylord?
Median Population Age in Gaylord is 44.9 Years.
What is the Average Family Size in Gaylord
Average Family Size in Gaylord is 3.0 People.
What is the Average Household Size in Gaylord
Average Household Size in Gaylord is 2.2 People.
How Large is the Labor Force in Gaylord?
There are 1,122 People in the Labor Forcein in Gaylord.
What is the Percentage of People in the Labor Force in Gaylord?
62.5% of People are in the Labor Force in Gaylord.
What is the Unemployment Rate in Gaylord?
Unemployment Rate in Gaylord is 3.6%.