Bordentown, NJ Map & Demographics
Bordentown Map
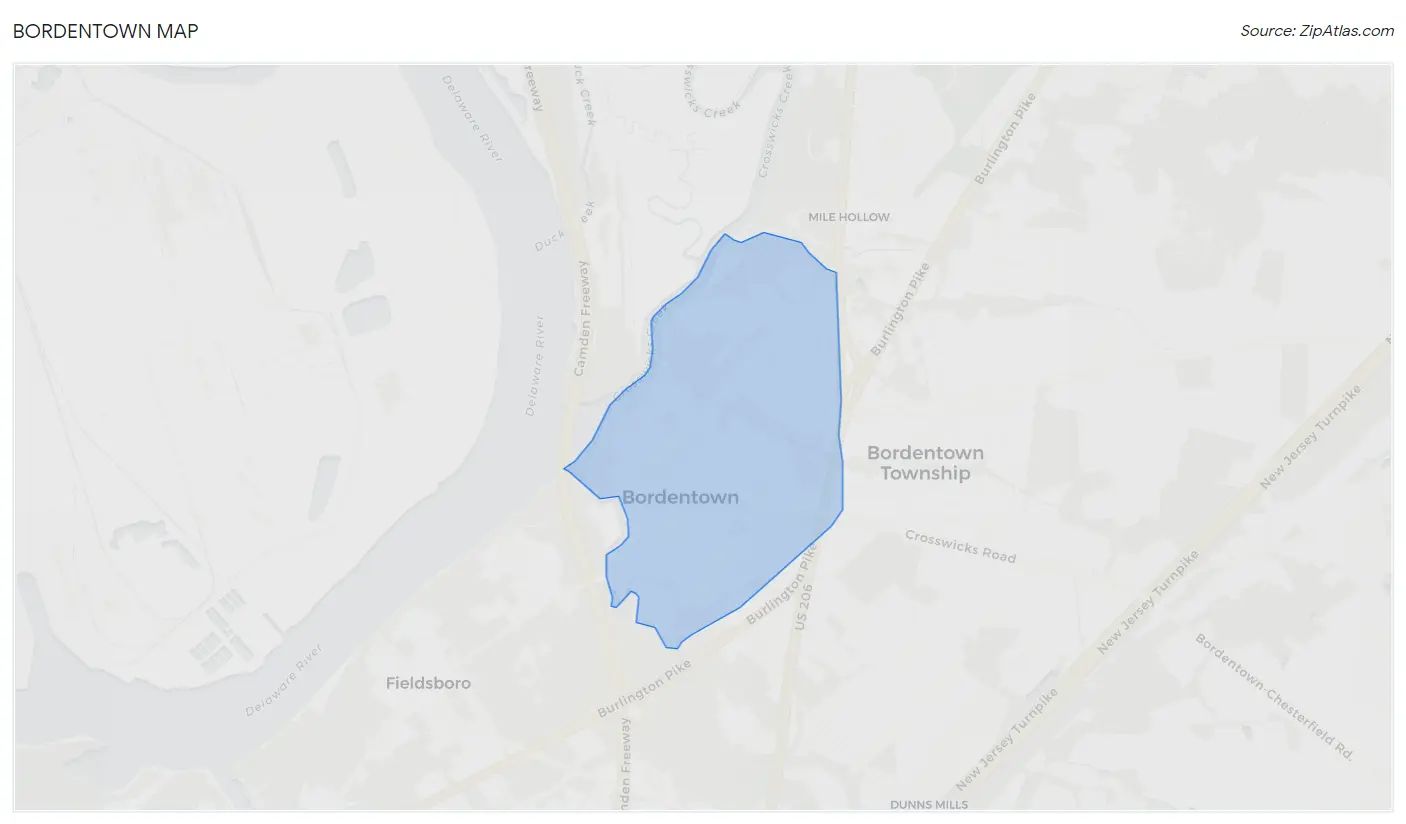
Bordentown Overview
$48,757
PER CAPITA INCOME
$115,307
AVG FAMILY INCOME
$88,153
AVG HOUSEHOLD INCOME
10.7%
WAGE / INCOME GAP [ % ]
89.3¢/ $1
WAGE / INCOME GAP [ $ ]
0.35
INEQUALITY / GINI INDEX
3,989
TOTAL POPULATION
2,019
MALE POPULATION
1,970
FEMALE POPULATION
102.49
MALES / 100 FEMALES
97.57
FEMALES / 100 MALES
41.4
MEDIAN AGE
2.8
AVG FAMILY SIZE
2.1
AVG HOUSEHOLD SIZE
2,383
LABOR FORCE [ PEOPLE ]
71.3%
PERCENT IN LABOR FORCE
3.0%
UNEMPLOYMENT RATE
Bordentown Zip Codes
Bordentown Area Codes
Income in Bordentown
Income Overview in Bordentown
Per Capita Income in Bordentown is $48,757, while median incomes of families and households are $115,307 and $88,153 respectively.
| Characteristic | Number | Measure |
| Per Capita Income | 3,989 | $48,757 |
| Median Family Income | 926 | $115,307 |
| Mean Family Income | 926 | $120,216 |
| Median Household Income | 1,849 | $88,153 |
| Mean Household Income | 1,849 | $102,662 |
| Income Deficit | 926 | $0 |
| Wage / Income Gap (%) | 3,989 | 10.73% |
| Wage / Income Gap ($) | 3,989 | 89.27¢ per $1 |
| Gini / Inequality Index | 3,989 | 0.35 |
Earnings by Sex in Bordentown
Average Earnings in Bordentown are $57,992, $60,208 for men and $53,750 for women, a difference of 10.7%.
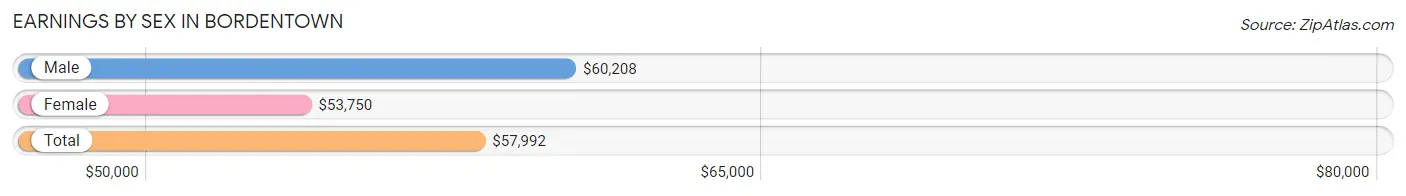
| Sex | Number | Average Earnings |
| Male | 1,200 (49.3%) | $60,208 |
| Female | 1,236 (50.7%) | $53,750 |
| Total | 2,436 (100.0%) | $57,992 |
Earnings by Sex by Income Bracket in Bordentown
The most common earnings brackets in Bordentown are $100,000+ for men (295 | 24.6%) and $65,000 to $74,999 for women (172 | 13.9%).
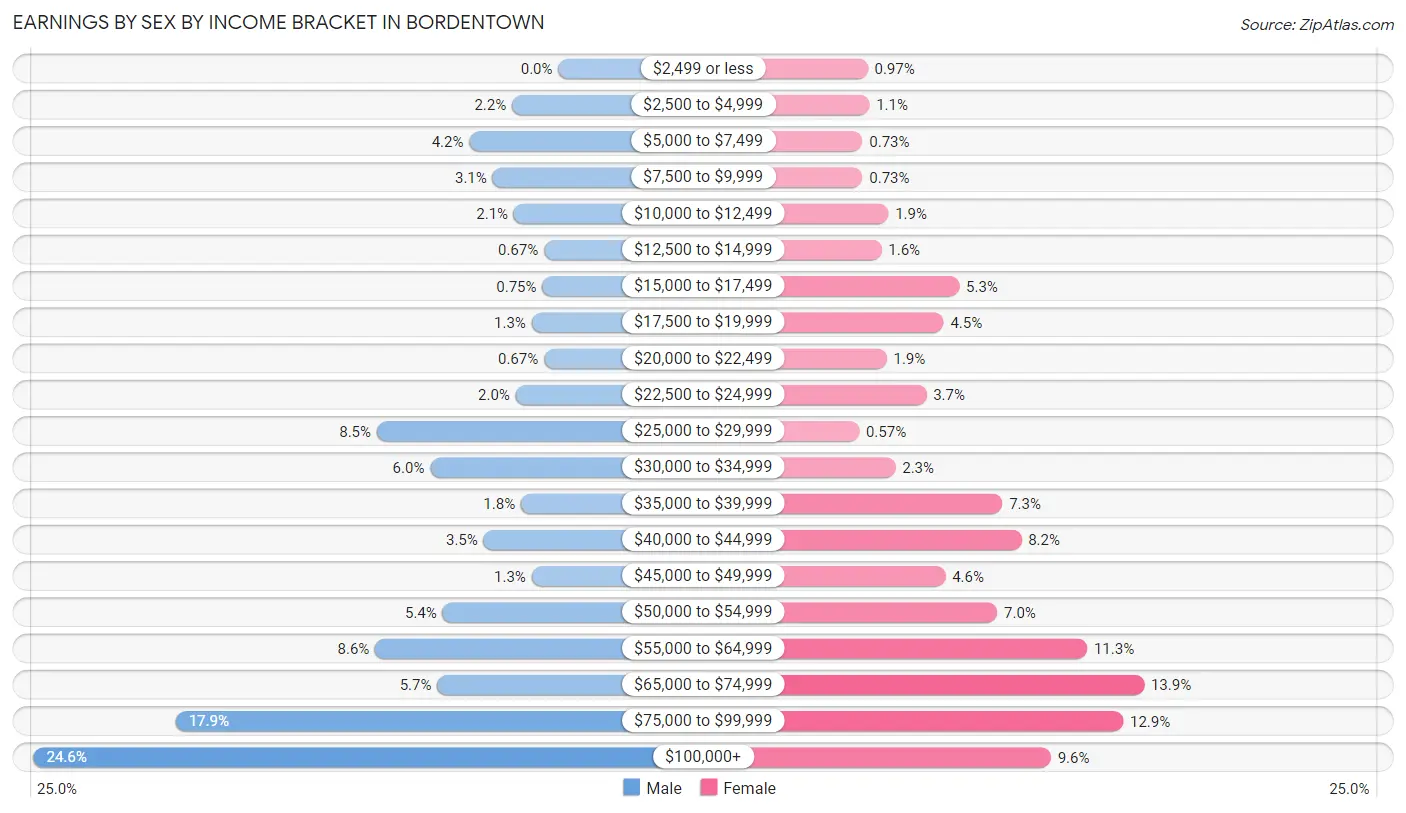
| Income | Male | Female |
| $2,499 or less | 0 (0.0%) | 12 (1.0%) |
| $2,500 to $4,999 | 26 (2.2%) | 13 (1.1%) |
| $5,000 to $7,499 | 50 (4.2%) | 9 (0.7%) |
| $7,500 to $9,999 | 37 (3.1%) | 9 (0.7%) |
| $10,000 to $12,499 | 25 (2.1%) | 24 (1.9%) |
| $12,500 to $14,999 | 8 (0.7%) | 20 (1.6%) |
| $15,000 to $17,499 | 9 (0.7%) | 65 (5.3%) |
| $17,500 to $19,999 | 15 (1.3%) | 56 (4.5%) |
| $20,000 to $22,499 | 8 (0.7%) | 23 (1.9%) |
| $22,500 to $24,999 | 24 (2.0%) | 46 (3.7%) |
| $25,000 to $29,999 | 102 (8.5%) | 7 (0.6%) |
| $30,000 to $34,999 | 72 (6.0%) | 28 (2.3%) |
| $35,000 to $39,999 | 21 (1.8%) | 90 (7.3%) |
| $40,000 to $44,999 | 42 (3.5%) | 101 (8.2%) |
| $45,000 to $49,999 | 15 (1.3%) | 57 (4.6%) |
| $50,000 to $54,999 | 65 (5.4%) | 87 (7.0%) |
| $55,000 to $64,999 | 103 (8.6%) | 139 (11.3%) |
| $65,000 to $74,999 | 68 (5.7%) | 172 (13.9%) |
| $75,000 to $99,999 | 215 (17.9%) | 160 (12.9%) |
| $100,000+ | 295 (24.6%) | 118 (9.6%) |
| Total | 1,200 (100.0%) | 1,236 (100.0%) |
Earnings by Sex by Educational Attainment in Bordentown
Average earnings in Bordentown are $70,444 for men and $54,515 for women, a difference of 22.6%. Men with an educational attainment of graduate degree enjoy the highest average annual earnings of $96,786, while those with high school diploma education earn the least with $54,375. Women with an educational attainment of graduate degree earn the most with the average annual earnings of $68,631, while those with high school diploma education have the smallest earnings of $38,304.
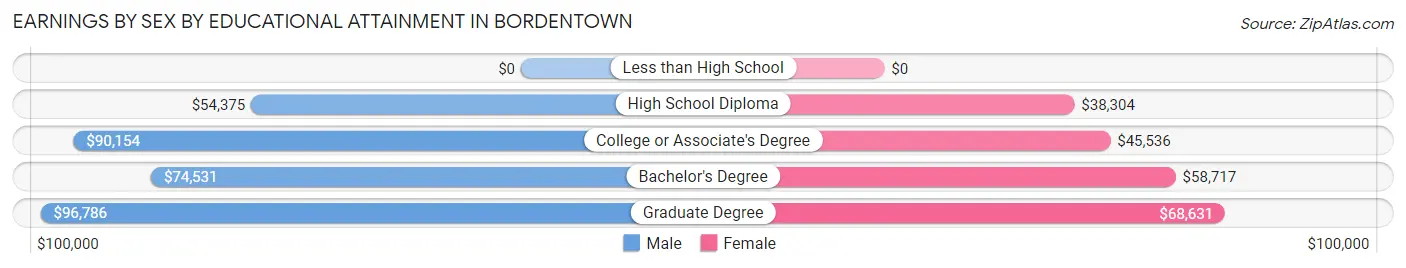
| Educational Attainment | Male Income | Female Income |
| Less than High School | - | - |
| High School Diploma | $54,375 | $38,304 |
| College or Associate's Degree | $90,154 | $45,536 |
| Bachelor's Degree | $74,531 | $58,717 |
| Graduate Degree | $96,786 | $68,631 |
| Total | $70,444 | $54,515 |
Family Income in Bordentown
Family Income Brackets in Bordentown
According to the Bordentown family income data, there are 302 families falling into the $100,000 to $149,999 income range, which is the most common income bracket and makes up 32.6% of all families.
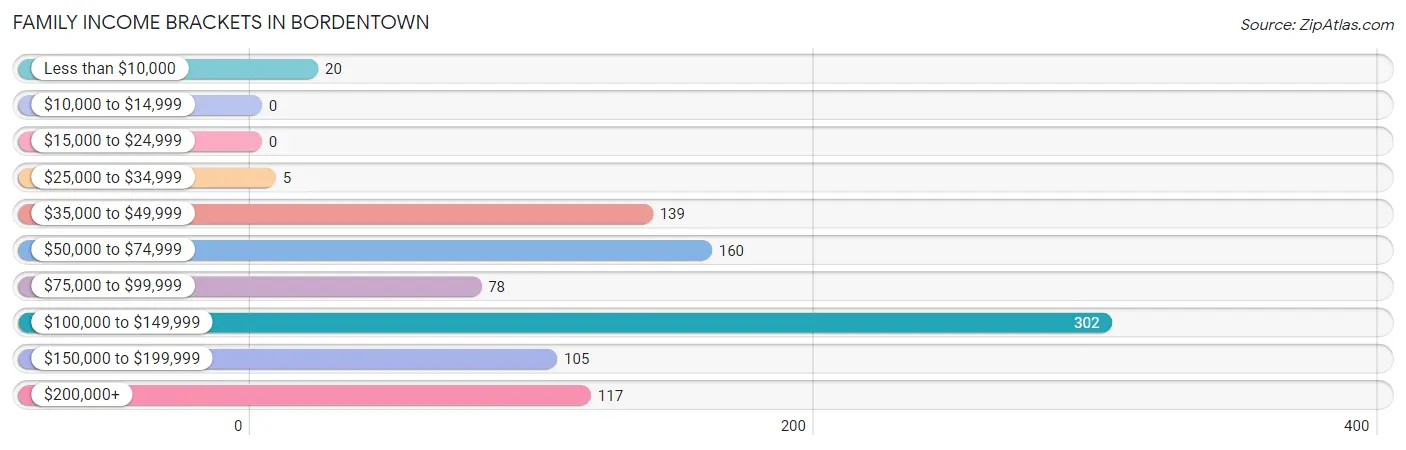
| Income Bracket | # Families | % Families |
| Less than $10,000 | 20 | 2.2% |
| $10,000 to $14,999 | 0 | 0.0% |
| $15,000 to $24,999 | 0 | 0.0% |
| $25,000 to $34,999 | 5 | 0.5% |
| $35,000 to $49,999 | 139 | 15.0% |
| $50,000 to $74,999 | 160 | 17.3% |
| $75,000 to $99,999 | 78 | 8.4% |
| $100,000 to $149,999 | 302 | 32.6% |
| $150,000 to $199,999 | 105 | 11.3% |
| $200,000+ | 117 | 12.6% |
Family Income by Famaliy Size in Bordentown
4-person families (134 | 14.5%) account for the highest median family income in Bordentown with $185,000 per family, while 2-person families (540 | 58.3%) have the highest median income of $51,084 per family member.
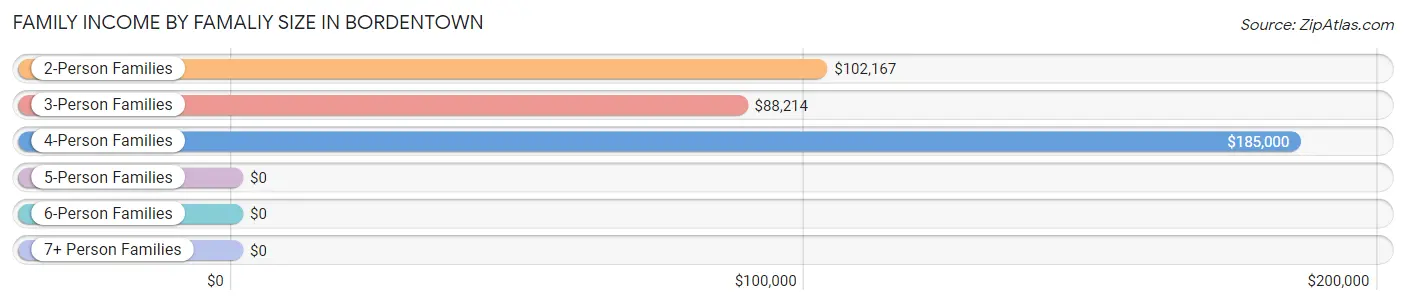
| Income Bracket | # Families | Median Income |
| 2-Person Families | 540 (58.3%) | $102,167 |
| 3-Person Families | 218 (23.5%) | $88,214 |
| 4-Person Families | 134 (14.5%) | $185,000 |
| 5-Person Families | 22 (2.4%) | $0 |
| 6-Person Families | 5 (0.5%) | $0 |
| 7+ Person Families | 7 (0.8%) | $0 |
| Total | 926 (100.0%) | $115,307 |
Family Income by Number of Earners in Bordentown
The median family income in Bordentown is $115,307, with families comprising 3+ earners (71) having the highest median family income of $177,250, while families with no earners (147) have the lowest median family income of $49,867, accounting for 7.7% and 15.9% of families, respectively.
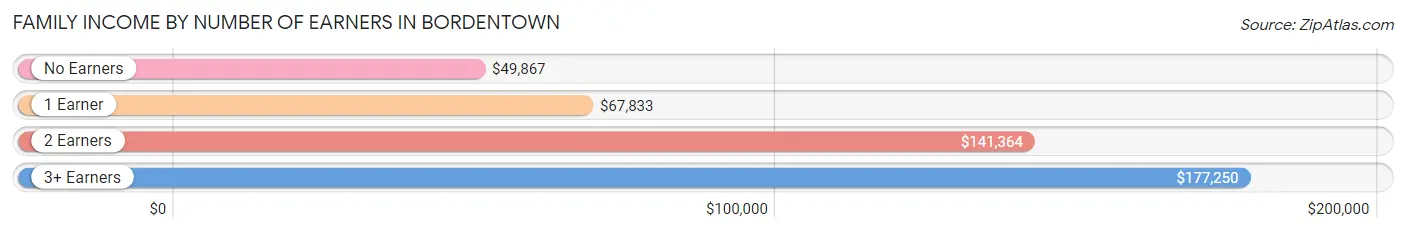
| Number of Earners | # Families | Median Income |
| No Earners | 147 (15.9%) | $49,867 |
| 1 Earner | 356 (38.4%) | $67,833 |
| 2 Earners | 352 (38.0%) | $141,364 |
| 3+ Earners | 71 (7.7%) | $177,250 |
| Total | 926 (100.0%) | $115,307 |
Household Income in Bordentown
Household Income Brackets in Bordentown
With 523 households falling in the category, the $100,000 to $149,999 income range is the most frequent in Bordentown, accounting for 28.3% of all households. In contrast, only 17 households (0.9%) fall into the $10,000 to $14,999 income bracket, making it the least populous group.
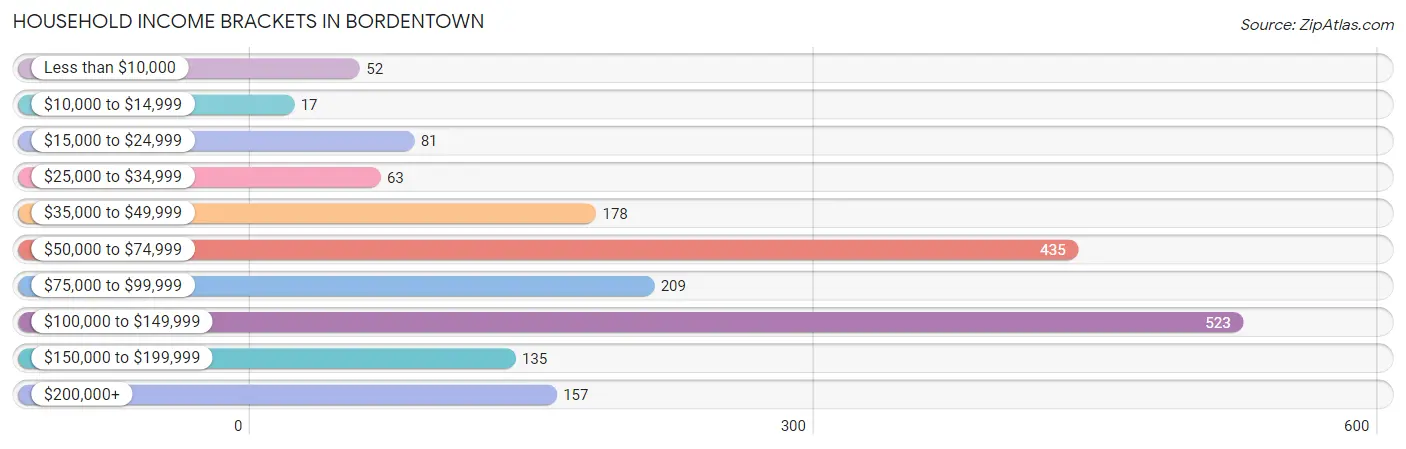
| Income Bracket | # Households | % Households |
| Less than $10,000 | 52 | 2.8% |
| $10,000 to $14,999 | 17 | 0.9% |
| $15,000 to $24,999 | 81 | 4.4% |
| $25,000 to $34,999 | 63 | 3.4% |
| $35,000 to $49,999 | 178 | 9.6% |
| $50,000 to $74,999 | 435 | 23.5% |
| $75,000 to $99,999 | 209 | 11.3% |
| $100,000 to $149,999 | 523 | 28.3% |
| $150,000 to $199,999 | 135 | 7.3% |
| $200,000+ | 157 | 8.5% |
Household Income by Householder Age in Bordentown
The median household income in Bordentown is $88,153, with the highest median household income of $131,806 found in the 15 to 24 years age bracket for the primary householder. A total of 71 households (3.8%) fall into this category. Meanwhile, the 65+ years age bracket for the primary householder has the lowest median household income of $65,579, with 473 households (25.6%) in this group.

| Income Bracket | # Households | Median Income |
| 15 to 24 Years | 71 (3.8%) | $131,806 |
| 25 to 44 Years | 689 (37.3%) | $75,208 |
| 45 to 64 Years | 616 (33.3%) | $117,135 |
| 65+ Years | 473 (25.6%) | $65,579 |
| Total | 1,849 (100.0%) | $88,153 |
Poverty in Bordentown
Income Below Poverty by Sex and Age in Bordentown
With 7.1% poverty level for males and 3.4% for females among the residents of Bordentown, 16 and 17 year old males and 65 to 74 year old females are the most vulnerable to poverty, with 17 males (41.5%) and 19 females (9.6%) in their respective age groups living below the poverty level.
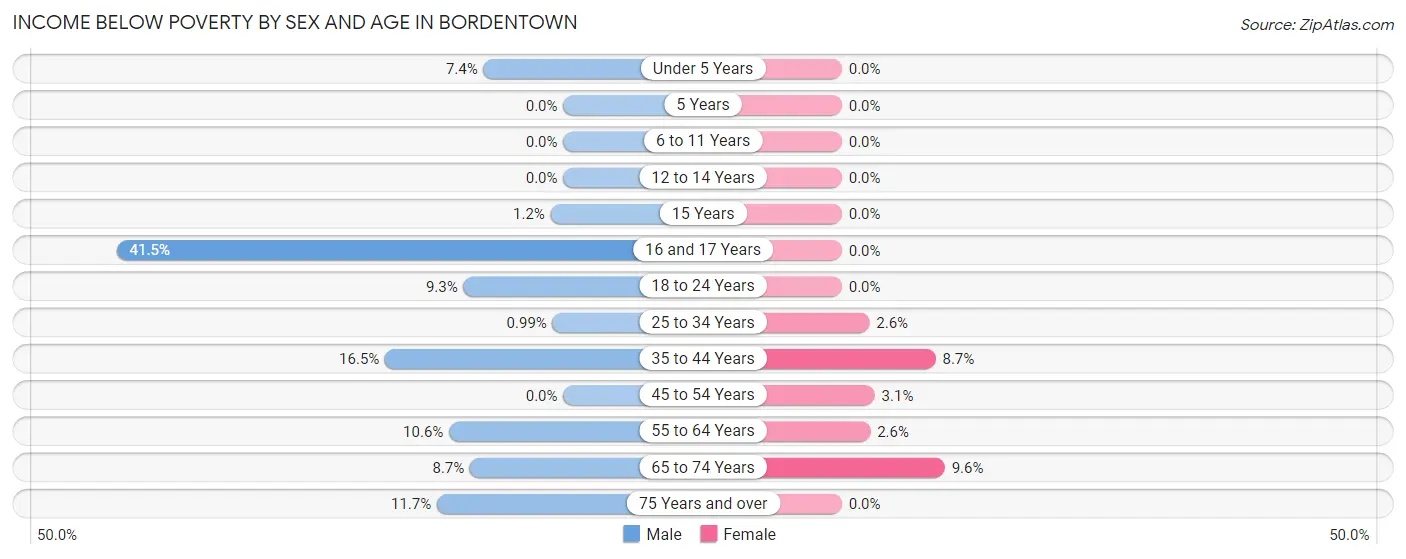
| Age Bracket | Male | Female |
| Under 5 Years | 8 (7.4%) | 0 (0.0%) |
| 5 Years | 0 (0.0%) | 0 (0.0%) |
| 6 to 11 Years | 0 (0.0%) | 0 (0.0%) |
| 12 to 14 Years | 0 (0.0%) | 0 (0.0%) |
| 15 Years | 1 (1.2%) | 0 (0.0%) |
| 16 and 17 Years | 17 (41.5%) | 0 (0.0%) |
| 18 to 24 Years | 10 (9.3%) | 0 (0.0%) |
| 25 to 34 Years | 4 (1.0%) | 9 (2.6%) |
| 35 to 44 Years | 42 (16.5%) | 22 (8.7%) |
| 45 to 54 Years | 0 (0.0%) | 8 (3.0%) |
| 55 to 64 Years | 30 (10.6%) | 7 (2.6%) |
| 65 to 74 Years | 16 (8.6%) | 19 (9.6%) |
| 75 Years and over | 15 (11.7%) | 0 (0.0%) |
| Total | 143 (7.1%) | 65 (3.4%) |
Income Above Poverty by Sex and Age in Bordentown
According to the poverty statistics in Bordentown, males aged 5 years and females aged under 5 years are the age groups that are most secure financially, with 100.0% of males and 100.0% of females in these age groups living above the poverty line.
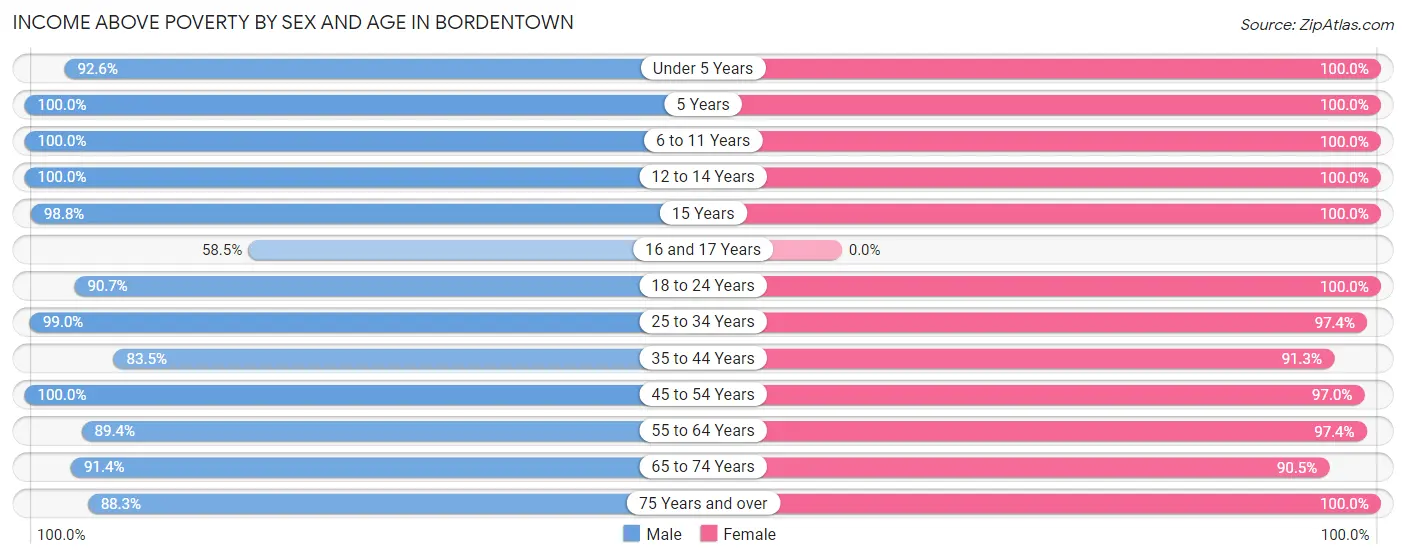
| Age Bracket | Male | Female |
| Under 5 Years | 100 (92.6%) | 142 (100.0%) |
| 5 Years | 26 (100.0%) | 9 (100.0%) |
| 6 to 11 Years | 116 (100.0%) | 58 (100.0%) |
| 12 to 14 Years | 36 (100.0%) | 42 (100.0%) |
| 15 Years | 84 (98.8%) | 23 (100.0%) |
| 16 and 17 Years | 24 (58.5%) | 0 (0.0%) |
| 18 to 24 Years | 98 (90.7%) | 119 (100.0%) |
| 25 to 34 Years | 402 (99.0%) | 342 (97.4%) |
| 35 to 44 Years | 212 (83.5%) | 231 (91.3%) |
| 45 to 54 Years | 233 (100.0%) | 254 (97.0%) |
| 55 to 64 Years | 253 (89.4%) | 258 (97.4%) |
| 65 to 74 Years | 169 (91.3%) | 180 (90.4%) |
| 75 Years and over | 113 (88.3%) | 184 (100.0%) |
| Total | 1,866 (92.9%) | 1,842 (96.6%) |
Income Below Poverty Among Married-Couple Families in Bordentown
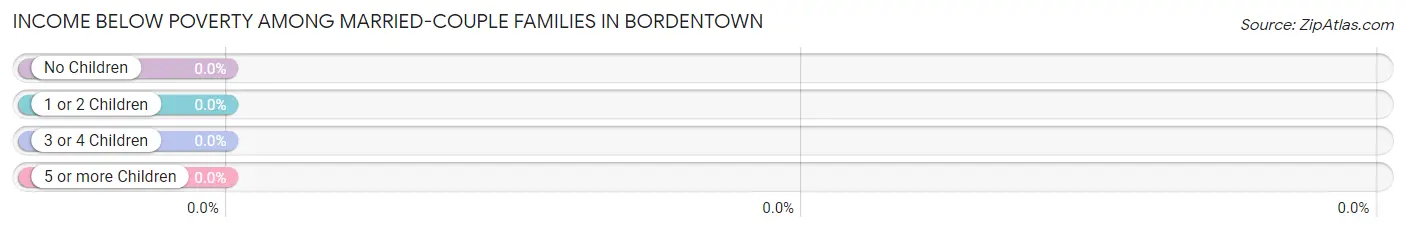
| Children | Above Poverty | Below Poverty |
| No Children | 398 (100.0%) | 0 (0.0%) |
| 1 or 2 Children | 168 (100.0%) | 0 (0.0%) |
| 3 or 4 Children | 22 (100.0%) | 0 (0.0%) |
| 5 or more Children | 0 (0.0%) | 0 (0.0%) |
| Total | 588 (100.0%) | 0 (0.0%) |
Income Below Poverty Among Single-Parent Households in Bordentown
According to the poverty data in Bordentown, 10.7% or 11 single-father households and 3.8% or 9 single-mother households are living below the poverty line. Among single-father households, those with no children have the highest poverty rate, with 11 households (18.6%) experiencing poverty. Likewise, among single-mother households, those with 1 or 2 children have the highest poverty rate, with 9 households (6.1%) falling below the poverty line.
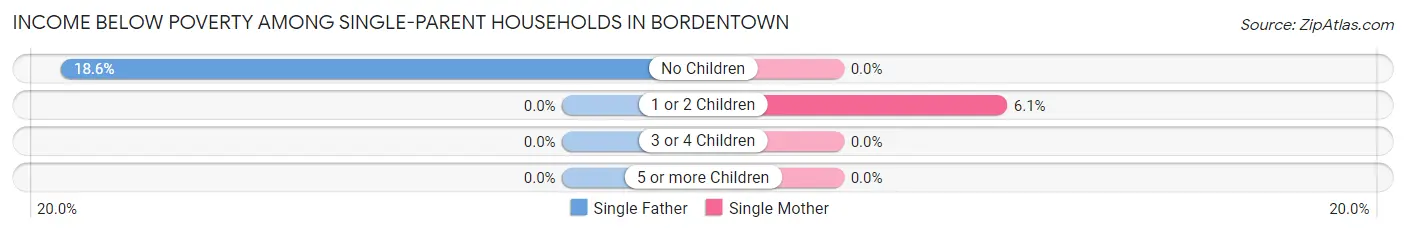
| Children | Single Father | Single Mother |
| No Children | 11 (18.6%) | 0 (0.0%) |
| 1 or 2 Children | 0 (0.0%) | 9 (6.1%) |
| 3 or 4 Children | 0 (0.0%) | 0 (0.0%) |
| 5 or more Children | 0 (0.0%) | 0 (0.0%) |
| Total | 11 (10.7%) | 9 (3.8%) |
Income Below Poverty Among Married-Couple vs Single-Parent Households in Bordentown
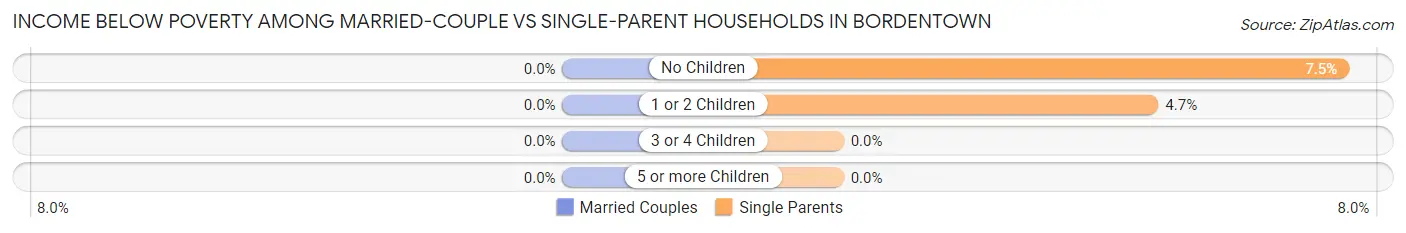
| Children | Married-Couple Families | Single-Parent Households |
| No Children | 0 (0.0%) | 11 (7.5%) |
| 1 or 2 Children | 0 (0.0%) | 9 (4.7%) |
| 3 or 4 Children | 0 (0.0%) | 0 (0.0%) |
| 5 or more Children | 0 (0.0%) | 0 (0.0%) |
| Total | 0 (0.0%) | 20 (5.9%) |
Race in Bordentown
The most populous races in Bordentown are White / Caucasian (3,058 | 76.7%), Black / African American (445 | 11.2%), and Two or more Races (341 | 8.6%).
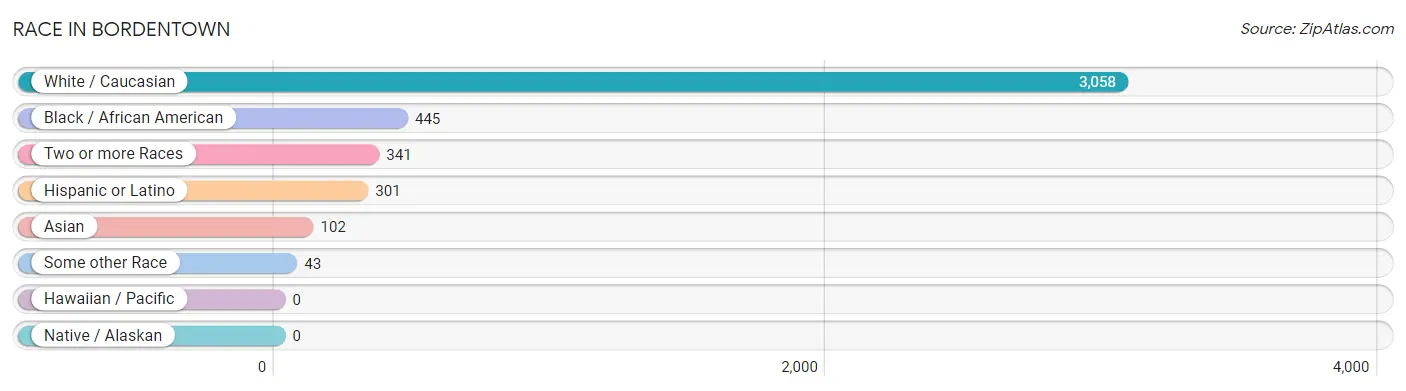
| Race | # Population | % Population |
| Asian | 102 | 2.6% |
| Black / African American | 445 | 11.2% |
| Hawaiian / Pacific | 0 | 0.0% |
| Hispanic or Latino | 301 | 7.5% |
| Native / Alaskan | 0 | 0.0% |
| White / Caucasian | 3,058 | 76.7% |
| Two or more Races | 341 | 8.6% |
| Some other Race | 43 | 1.1% |
| Total | 3,989 | 100.0% |
Ancestry in Bordentown
The most populous ancestries reported in Bordentown are Irish (831 | 20.8%), Italian (682 | 17.1%), German (637 | 16.0%), English (430 | 10.8%), and Polish (307 | 7.7%), together accounting for 72.4% of all Bordentown residents.
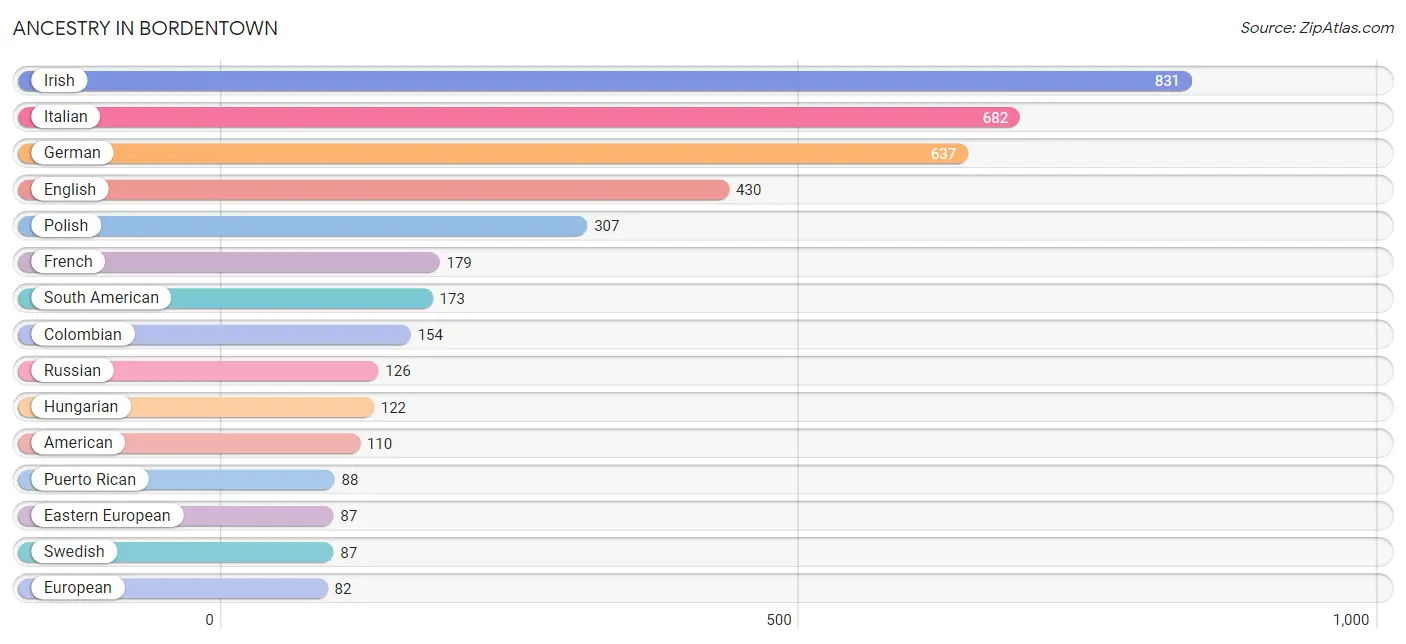
| Ancestry | # Population | % Population |
| African | 20 | 0.5% |
| Albanian | 8 | 0.2% |
| American | 110 | 2.8% |
| Armenian | 26 | 0.6% |
| Brazilian | 16 | 0.4% |
| British | 23 | 0.6% |
| Burmese | 11 | 0.3% |
| Cherokee | 4 | 0.1% |
| Chilean | 19 | 0.5% |
| Colombian | 154 | 3.9% |
| Croatian | 8 | 0.2% |
| Cypriot | 6 | 0.2% |
| Czech | 13 | 0.3% |
| Czechoslovakian | 19 | 0.5% |
| Danish | 9 | 0.2% |
| Dominican | 19 | 0.5% |
| Dutch | 10 | 0.3% |
| Eastern European | 87 | 2.2% |
| English | 430 | 10.8% |
| European | 82 | 2.1% |
| French | 179 | 4.5% |
| German | 637 | 16.0% |
| Greek | 37 | 0.9% |
| Hungarian | 122 | 3.1% |
| Indian (Asian) | 74 | 1.9% |
| Irish | 831 | 20.8% |
| Italian | 682 | 17.1% |
| Korean | 30 | 0.7% |
| Latvian | 11 | 0.3% |
| Lithuanian | 75 | 1.9% |
| Mexican | 9 | 0.2% |
| Norwegian | 7 | 0.2% |
| Polish | 307 | 7.7% |
| Portuguese | 16 | 0.4% |
| Puerto Rican | 88 | 2.2% |
| Russian | 126 | 3.2% |
| Scandinavian | 6 | 0.2% |
| Scottish | 45 | 1.1% |
| Slavic | 21 | 0.5% |
| Slovak | 31 | 0.8% |
| Slovene | 13 | 0.3% |
| South American | 173 | 4.3% |
| Spaniard | 12 | 0.3% |
| Sri Lankan | 1 | 0.0% |
| Subsaharan African | 20 | 0.5% |
| Swedish | 87 | 2.2% |
| Thai | 16 | 0.4% |
| Turkish | 23 | 0.6% |
| Ukrainian | 52 | 1.3% |
| Welsh | 23 | 0.6% | View All 50 Rows |
Immigrants in Bordentown
The most numerous immigrant groups reported in Bordentown came from Latin America (65 | 1.6%), Asia (53 | 1.3%), Eastern Asia (52 | 1.3%), China (49 | 1.2%), and Europe (48 | 1.2%), together accounting for 6.7% of all Bordentown residents.
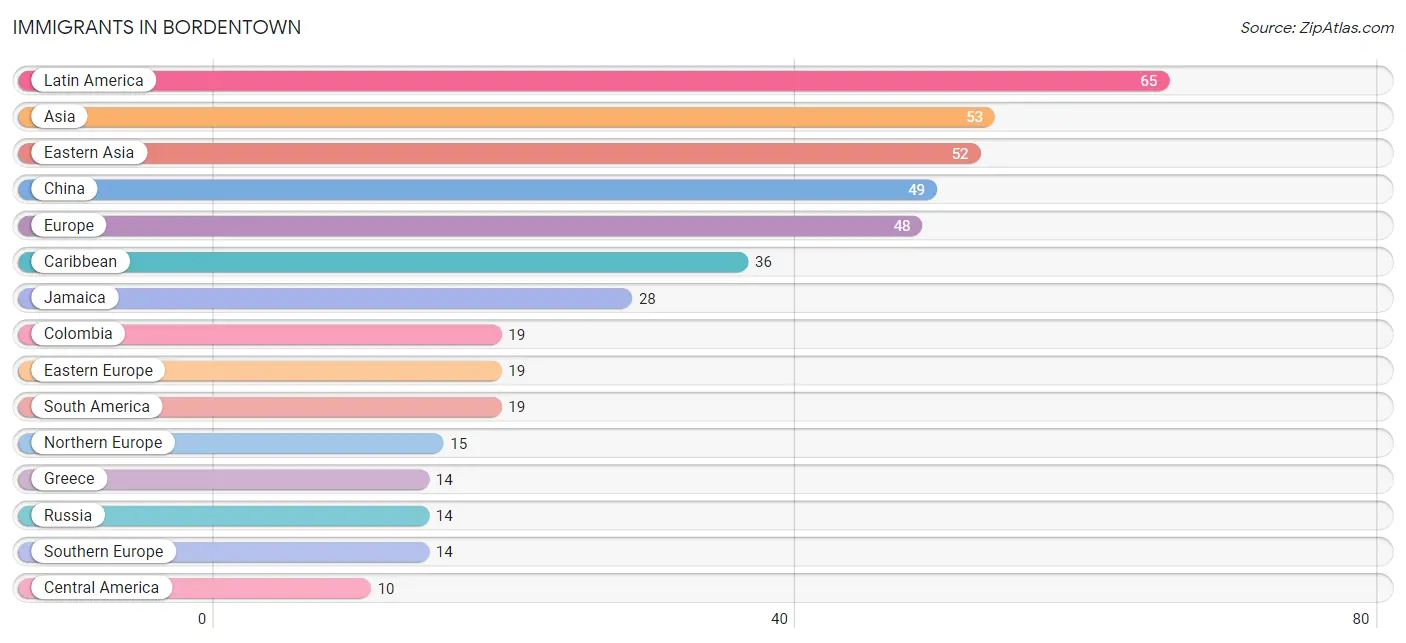
| Immigration Origin | # Population | % Population |
| Asia | 53 | 1.3% |
| Caribbean | 36 | 0.9% |
| Central America | 10 | 0.3% |
| China | 49 | 1.2% |
| Colombia | 19 | 0.5% |
| Dominican Republic | 8 | 0.2% |
| Eastern Asia | 52 | 1.3% |
| Eastern Europe | 19 | 0.5% |
| Europe | 48 | 1.2% |
| Greece | 14 | 0.4% |
| Guatemala | 10 | 0.3% |
| Jamaica | 28 | 0.7% |
| Korea | 3 | 0.1% |
| Latin America | 65 | 1.6% |
| Northern Europe | 15 | 0.4% |
| Poland | 5 | 0.1% |
| Russia | 14 | 0.4% |
| South America | 19 | 0.5% |
| South Eastern Asia | 1 | 0.0% |
| Southern Europe | 14 | 0.4% |
| Vietnam | 1 | 0.0% | View All 21 Rows |
Sex and Age in Bordentown
Sex and Age in Bordentown
The most populous age groups in Bordentown are 25 to 29 Years (217 | 10.7%) for men and 25 to 29 Years (216 | 11.0%) for women.
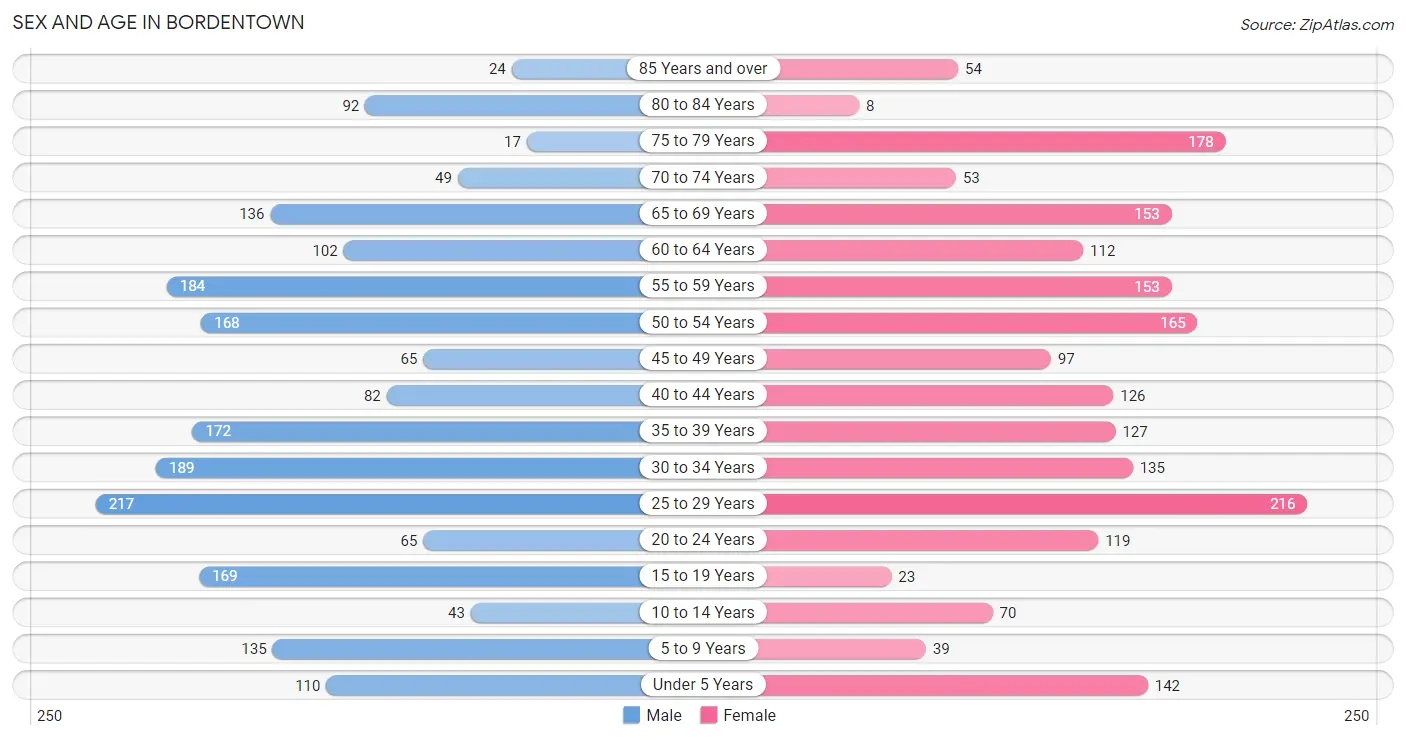
| Age Bracket | Male | Female |
| Under 5 Years | 110 (5.4%) | 142 (7.2%) |
| 5 to 9 Years | 135 (6.7%) | 39 (2.0%) |
| 10 to 14 Years | 43 (2.1%) | 70 (3.5%) |
| 15 to 19 Years | 169 (8.4%) | 23 (1.2%) |
| 20 to 24 Years | 65 (3.2%) | 119 (6.0%) |
| 25 to 29 Years | 217 (10.7%) | 216 (11.0%) |
| 30 to 34 Years | 189 (9.4%) | 135 (6.9%) |
| 35 to 39 Years | 172 (8.5%) | 127 (6.5%) |
| 40 to 44 Years | 82 (4.1%) | 126 (6.4%) |
| 45 to 49 Years | 65 (3.2%) | 97 (4.9%) |
| 50 to 54 Years | 168 (8.3%) | 165 (8.4%) |
| 55 to 59 Years | 184 (9.1%) | 153 (7.8%) |
| 60 to 64 Years | 102 (5.1%) | 112 (5.7%) |
| 65 to 69 Years | 136 (6.7%) | 153 (7.8%) |
| 70 to 74 Years | 49 (2.4%) | 53 (2.7%) |
| 75 to 79 Years | 17 (0.8%) | 178 (9.0%) |
| 80 to 84 Years | 92 (4.6%) | 8 (0.4%) |
| 85 Years and over | 24 (1.2%) | 54 (2.7%) |
| Total | 2,019 (100.0%) | 1,970 (100.0%) |
Families and Households in Bordentown
Median Family Size in Bordentown
The median family size in Bordentown is 2.82 persons per family, with married-couple families (588 | 63.5%) accounting for the largest median family size of 2.9 persons per family. On the other hand, single male/father families (103 | 11.1%) represent the smallest median family size with 2.25 persons per family.
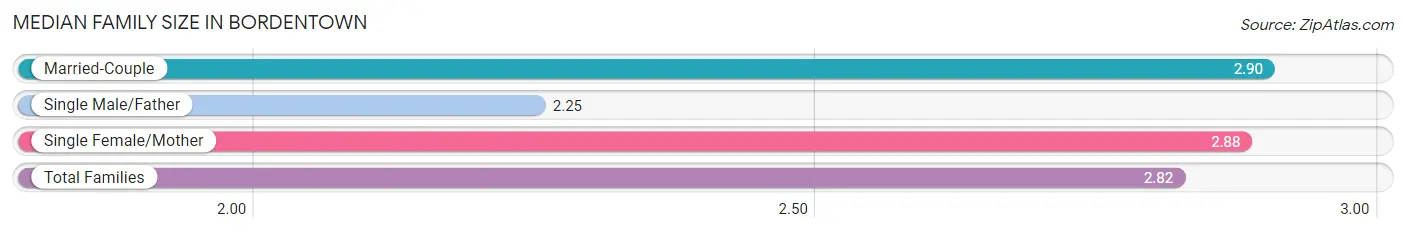
| Family Type | # Families | Family Size |
| Married-Couple | 588 (63.5%) | 2.90 |
| Single Male/Father | 103 (11.1%) | 2.25 |
| Single Female/Mother | 235 (25.4%) | 2.88 |
| Total Families | 926 (100.0%) | 2.82 |
Median Household Size in Bordentown
The median household size in Bordentown is 2.11 persons per household, with single male/father households (103 | 5.6%) accounting for the largest median household size of 3.25 persons per household. non-family households (923 | 49.9%) represent the smallest median household size with 1.23 persons per household.
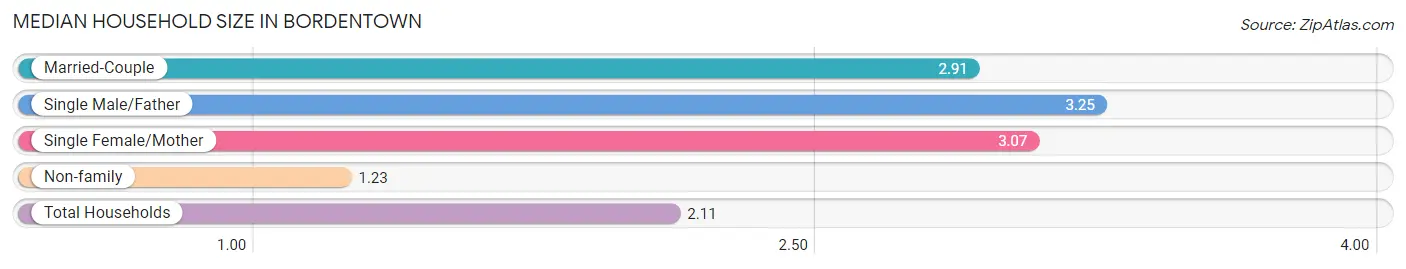
| Household Type | # Households | Household Size |
| Married-Couple | 588 (31.8%) | 2.91 |
| Single Male/Father | 103 (5.6%) | 3.25 |
| Single Female/Mother | 235 (12.7%) | 3.07 |
| Non-family | 923 (49.9%) | 1.23 |
| Total Households | 1,849 (100.0%) | 2.11 |
Household Size by Marriage Status in Bordentown
Out of a total of 1,849 households in Bordentown, 926 (50.1%) are family households, while 923 (49.9%) are nonfamily households. The most numerous type of family households are 2-person households, comprising 469, and the most common type of nonfamily households are 1-person households, comprising 725.
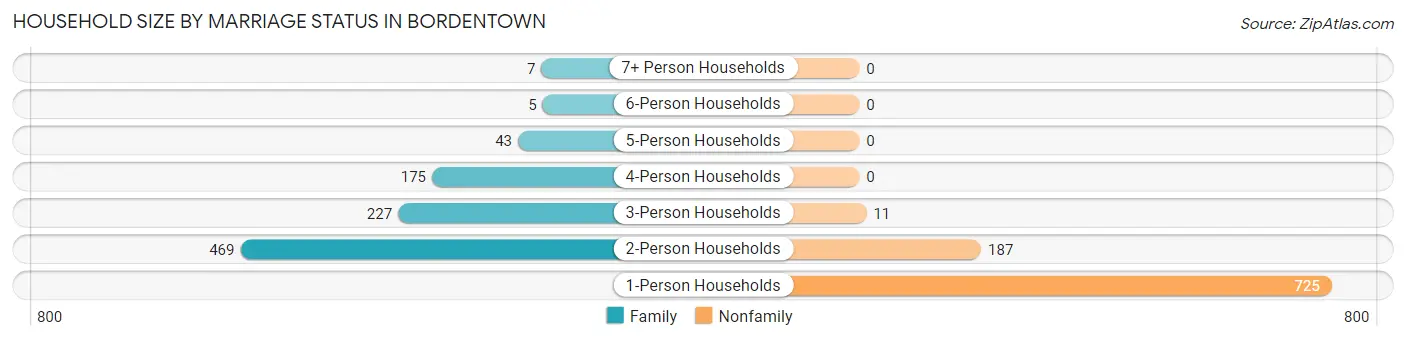
| Household Size | Family Households | Nonfamily Households |
| 1-Person Households | - | 725 (39.2%) |
| 2-Person Households | 469 (25.4%) | 187 (10.1%) |
| 3-Person Households | 227 (12.3%) | 11 (0.6%) |
| 4-Person Households | 175 (9.5%) | 0 (0.0%) |
| 5-Person Households | 43 (2.3%) | 0 (0.0%) |
| 6-Person Households | 5 (0.3%) | 0 (0.0%) |
| 7+ Person Households | 7 (0.4%) | 0 (0.0%) |
| Total | 926 (50.1%) | 923 (49.9%) |
Female Fertility in Bordentown
Fertility by Age in Bordentown
Average fertility rate in Bordentown is 48.0 births per 1,000 women. Women in the age bracket of 20 to 34 years have the highest fertility rate with 53.0 births per 1,000 women. Women in the age bracket of 20 to 34 years acount for 61.0% of all women with births.
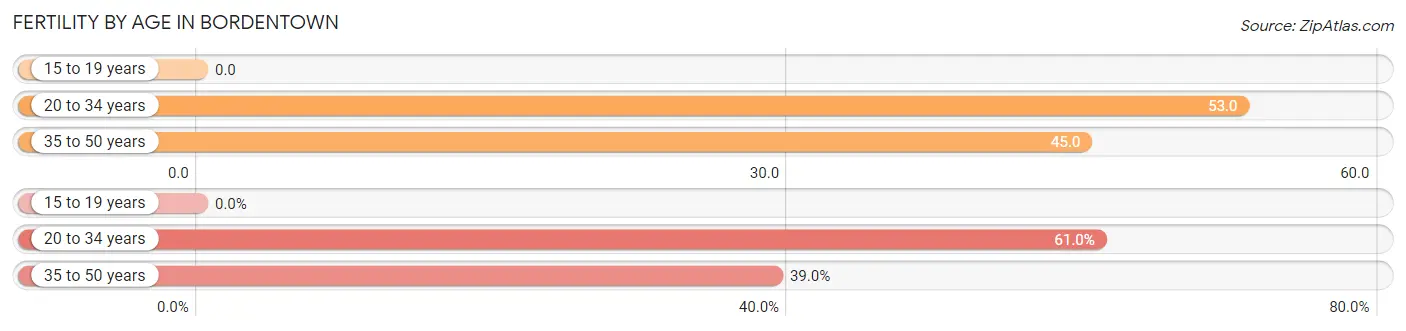
| Age Bracket | Women with Births | Births / 1,000 Women |
| 15 to 19 years | 0 (0.0%) | 0.0 |
| 20 to 34 years | 25 (61.0%) | 53.0 |
| 35 to 50 years | 16 (39.0%) | 45.0 |
| Total | 41 (100.0%) | 48.0 |
Fertility by Age by Marriage Status in Bordentown
65.9% of women with births (41) in Bordentown are married. The highest percentage of unmarried women with births falls into 35 to 50 years age bracket with 50.0% of them unmarried at the time of birth, while the lowest percentage of unmarried women with births belong to 20 to 34 years age bracket with 24.0% of them unmarried.
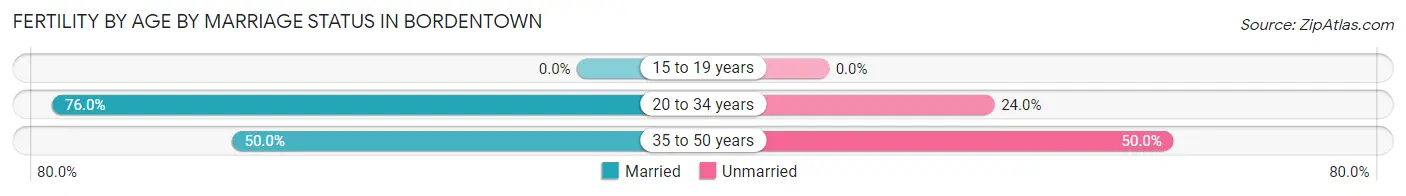
| Age Bracket | Married | Unmarried |
| 15 to 19 years | 0 (0.0%) | 0 (0.0%) |
| 20 to 34 years | 19 (76.0%) | 6 (24.0%) |
| 35 to 50 years | 8 (50.0%) | 8 (50.0%) |
| Total | 27 (65.8%) | 14 (34.2%) |
Fertility by Education in Bordentown
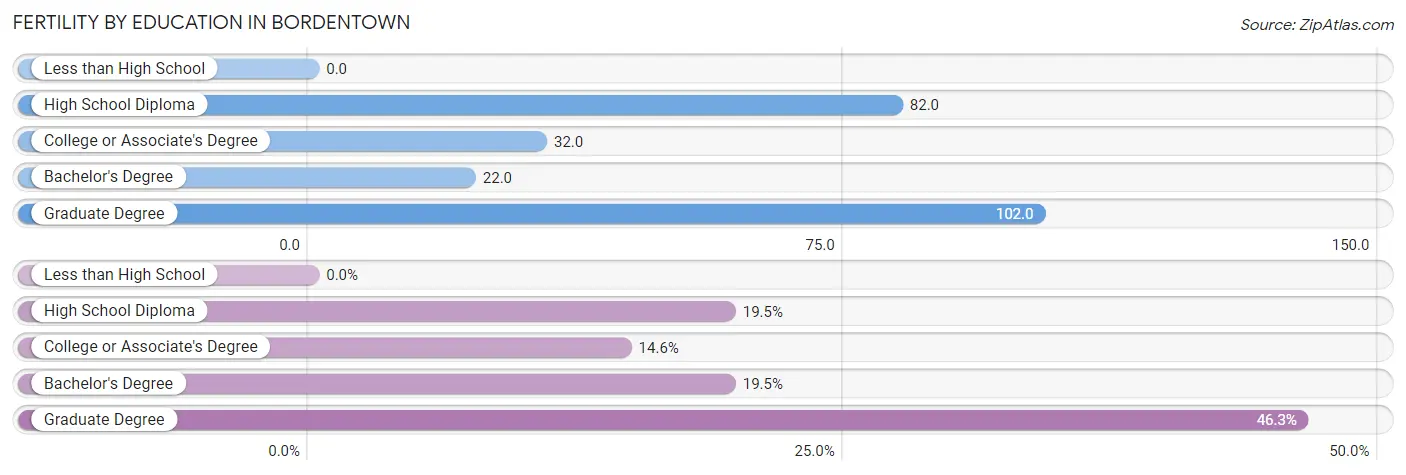
| Educational Attainment | Women with Births | Births / 1,000 Women |
| Less than High School | 0 (0.0%) | 0.0 |
| High School Diploma | 8 (19.5%) | 82.0 |
| College or Associate's Degree | 6 (14.6%) | 32.0 |
| Bachelor's Degree | 8 (19.5%) | 22.0 |
| Graduate Degree | 19 (46.3%) | 102.0 |
| Total | 41 (100.0%) | 48.0 |
Fertility by Education by Marriage Status in Bordentown
34.2% of women with births in Bordentown are unmarried. Women with the educational attainment of bachelor's degree are most likely to be married with 100.0% of them married at childbirth, while women with the educational attainment of high school diploma are least likely to be married with 100.0% of them unmarried at childbirth.
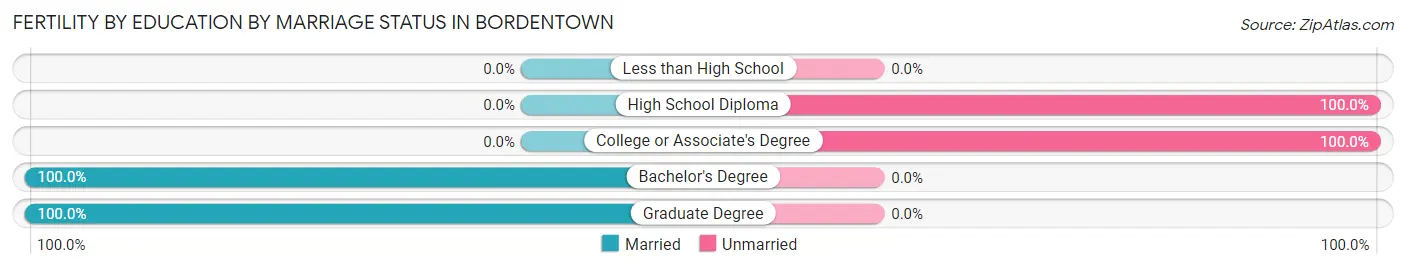
| Educational Attainment | Married | Unmarried |
| Less than High School | 0 (0.0%) | 0 (0.0%) |
| High School Diploma | 0 (0.0%) | 8 (100.0%) |
| College or Associate's Degree | 0 (0.0%) | 6 (100.0%) |
| Bachelor's Degree | 8 (100.0%) | 0 (0.0%) |
| Graduate Degree | 19 (100.0%) | 0 (0.0%) |
| Total | 27 (65.8%) | 14 (34.2%) |
Employment Characteristics in Bordentown
Employment by Class of Employer in Bordentown
Among the 2,220 employed individuals in Bordentown, private company employees (1,295 | 58.3%), state government employees (337 | 15.2%), and not-for-profit organizations (239 | 10.8%) make up the most common classes of employment.
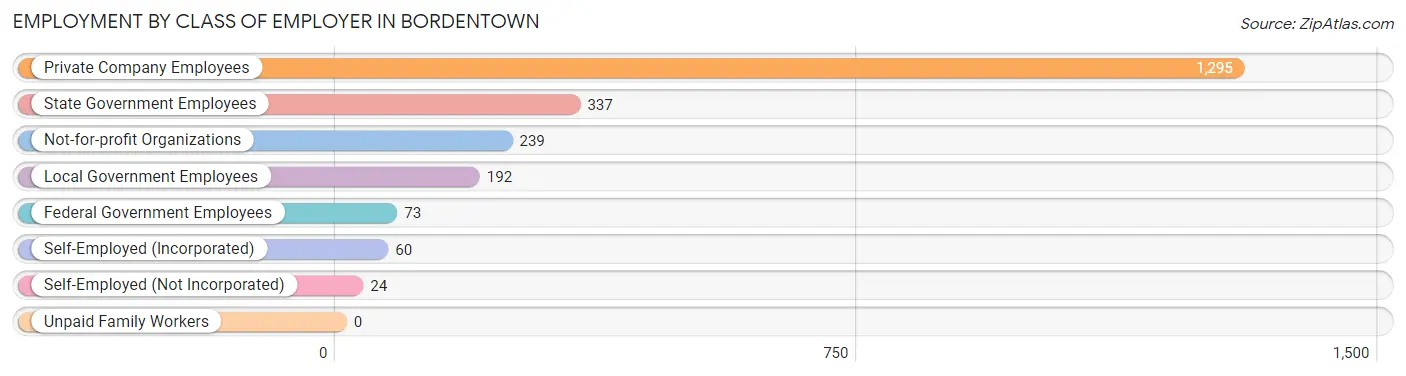
| Employer Class | # Employees | % Employees |
| Private Company Employees | 1,295 | 58.3% |
| Self-Employed (Incorporated) | 60 | 2.7% |
| Self-Employed (Not Incorporated) | 24 | 1.1% |
| Not-for-profit Organizations | 239 | 10.8% |
| Local Government Employees | 192 | 8.6% |
| State Government Employees | 337 | 15.2% |
| Federal Government Employees | 73 | 3.3% |
| Unpaid Family Workers | 0 | 0.0% |
| Total | 2,220 | 100.0% |
Employment Status by Age in Bordentown
According to the labor force statistics for Bordentown, out of the total population over 16 years of age (3,342), 71.3% or 2,383 individuals are in the labor force, with 3.0% or 71 of them unemployed. The age group with the highest labor force participation rate is 30 to 34 years, with 98.1% or 318 individuals in the labor force. Within the labor force, the 60 to 64 years age range has the highest percentage of unemployed individuals, with 19.6% or 19 of them being unemployed.
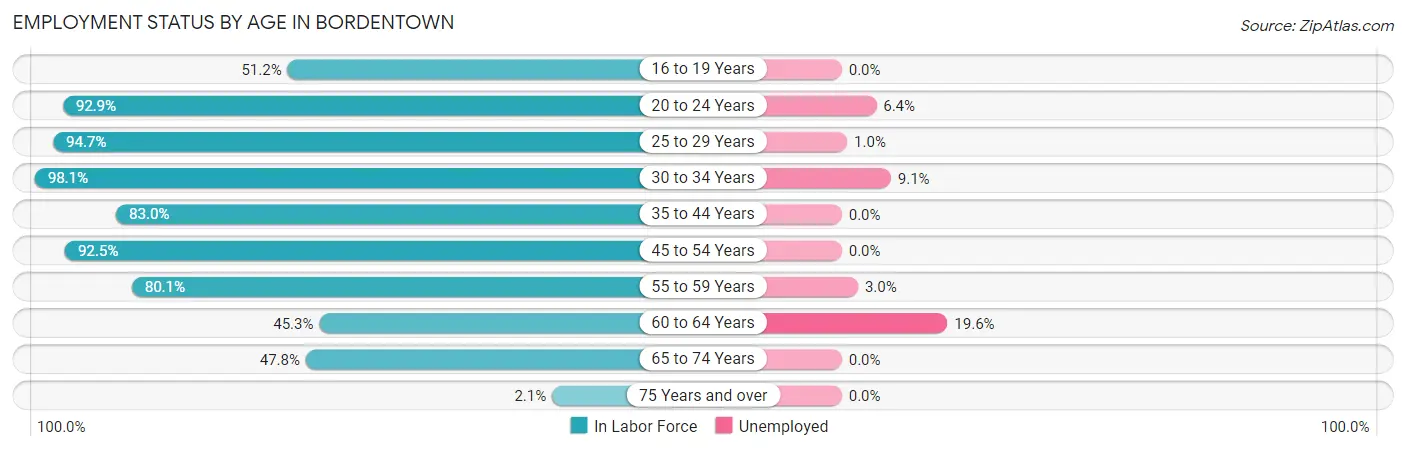
| Age Bracket | In Labor Force | Unemployed |
| 16 to 19 Years | 43 (51.2%) | 0 (0.0%) |
| 20 to 24 Years | 171 (92.9%) | 11 (6.4%) |
| 25 to 29 Years | 410 (94.7%) | 4 (1.0%) |
| 30 to 34 Years | 318 (98.1%) | 29 (9.1%) |
| 35 to 44 Years | 421 (83.0%) | 0 (0.0%) |
| 45 to 54 Years | 458 (92.5%) | 0 (0.0%) |
| 55 to 59 Years | 270 (80.1%) | 8 (3.0%) |
| 60 to 64 Years | 97 (45.3%) | 19 (19.6%) |
| 65 to 74 Years | 187 (47.8%) | 0 (0.0%) |
| 75 Years and over | 8 (2.1%) | 0 (0.0%) |
| Total | 2,383 (71.3%) | 71 (3.0%) |
Employment Status by Educational Attainment in Bordentown
According to labor force statistics for Bordentown, 85.5% of individuals (1,975) out of the total population between 25 and 64 years of age (2,310) are in the labor force, with 3.1% or 61 of them being unemployed. The group with the highest labor force participation rate are those with the educational attainment of bachelor's degree or higher, with 92.9% or 1,129 individuals in the labor force. Within the labor force, individuals with less than high school education have the highest percentage of unemployment, with 67.4% or 29 of them being unemployed.
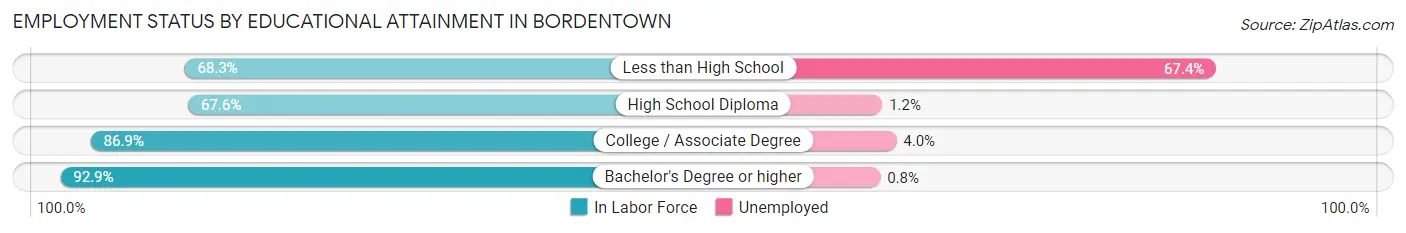
| Educational Attainment | In Labor Force | Unemployed |
| Less than High School | 43 (68.3%) | 42 (67.4%) |
| High School Diploma | 332 (67.6%) | 6 (1.2%) |
| College / Associate Degree | 470 (86.9%) | 22 (4.0%) |
| Bachelor's Degree or higher | 1,129 (92.9%) | 10 (0.8%) |
| Total | 1,975 (85.5%) | 72 (3.1%) |
Employment Occupations by Sex in Bordentown
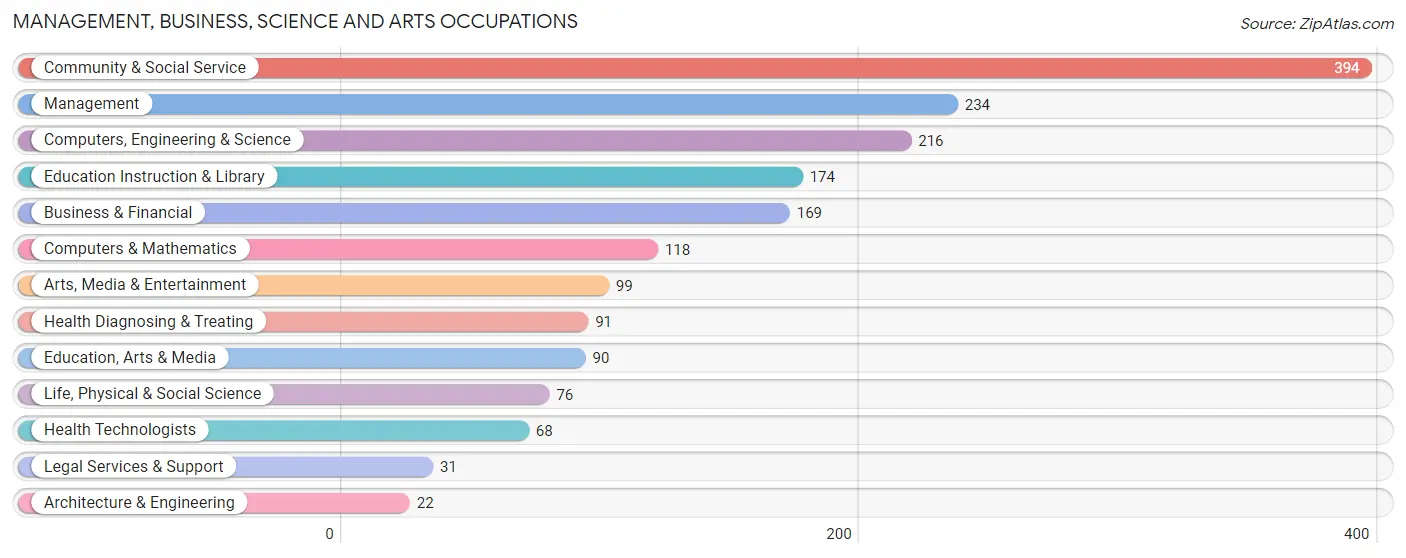
Management, Business, Science and Arts Occupations
The most common Management, Business, Science and Arts occupations in Bordentown are Community & Social Service (394 | 17.2%), Management (234 | 10.2%), Computers, Engineering & Science (216 | 9.4%), Education Instruction & Library (174 | 7.6%), and Business & Financial (169 | 7.4%).
Management, Business, Science and Arts Occupations by Sex
Within the Management, Business, Science and Arts occupations in Bordentown, the most male-oriented occupations are Architecture & Engineering (100.0%), Legal Services & Support (80.6%), and Computers & Mathematics (51.7%), while the most female-oriented occupations are Health Technologists (89.7%), Life, Physical & Social Science (89.5%), and Health Diagnosing & Treating (75.8%).
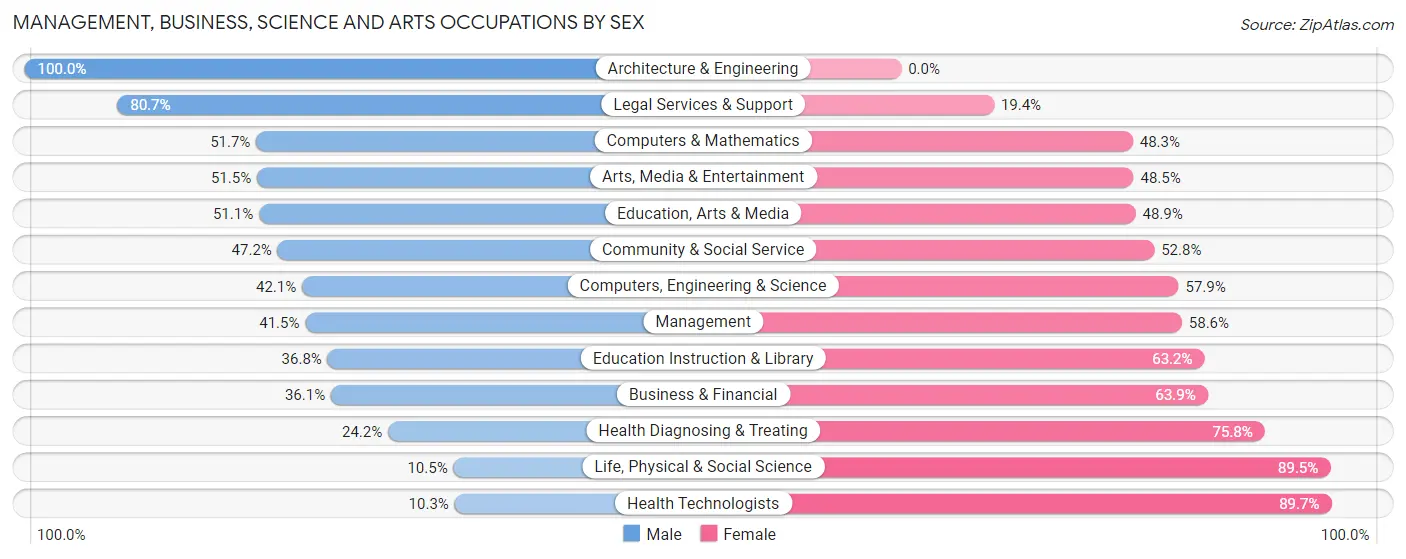
| Occupation | Male | Female |
| Management | 97 (41.4%) | 137 (58.6%) |
| Business & Financial | 61 (36.1%) | 108 (63.9%) |
| Computers, Engineering & Science | 91 (42.1%) | 125 (57.9%) |
| Computers & Mathematics | 61 (51.7%) | 57 (48.3%) |
| Architecture & Engineering | 22 (100.0%) | 0 (0.0%) |
| Life, Physical & Social Science | 8 (10.5%) | 68 (89.5%) |
| Community & Social Service | 186 (47.2%) | 208 (52.8%) |
| Education, Arts & Media | 46 (51.1%) | 44 (48.9%) |
| Legal Services & Support | 25 (80.6%) | 6 (19.4%) |
| Education Instruction & Library | 64 (36.8%) | 110 (63.2%) |
| Arts, Media & Entertainment | 51 (51.5%) | 48 (48.5%) |
| Health Diagnosing & Treating | 22 (24.2%) | 69 (75.8%) |
| Health Technologists | 7 (10.3%) | 61 (89.7%) |
| Total (Category) | 457 (41.4%) | 647 (58.6%) |
| Total (Overall) | 1,109 (48.3%) | 1,186 (51.7%) |
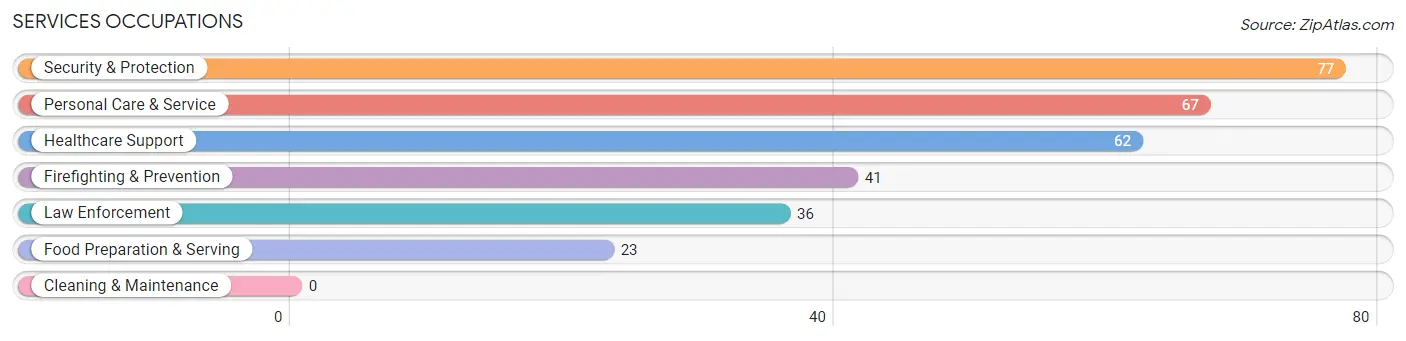
Services Occupations
The most common Services occupations in Bordentown are Security & Protection (77 | 3.4%), Personal Care & Service (67 | 2.9%), Healthcare Support (62 | 2.7%), Firefighting & Prevention (41 | 1.8%), and Law Enforcement (36 | 1.6%).
Services Occupations by Sex
Within the Services occupations in Bordentown, the most male-oriented occupations are Food Preparation & Serving (100.0%), Law Enforcement (77.8%), and Security & Protection (58.4%), while the most female-oriented occupations are Personal Care & Service (100.0%), Healthcare Support (61.3%), and Firefighting & Prevention (58.5%).
| Occupation | Male | Female |
| Healthcare Support | 24 (38.7%) | 38 (61.3%) |
| Security & Protection | 45 (58.4%) | 32 (41.6%) |
| Firefighting & Prevention | 17 (41.5%) | 24 (58.5%) |
| Law Enforcement | 28 (77.8%) | 8 (22.2%) |
| Food Preparation & Serving | 23 (100.0%) | 0 (0.0%) |
| Cleaning & Maintenance | 0 (0.0%) | 0 (0.0%) |
| Personal Care & Service | 0 (0.0%) | 67 (100.0%) |
| Total (Category) | 92 (40.2%) | 137 (59.8%) |
| Total (Overall) | 1,109 (48.3%) | 1,186 (51.7%) |
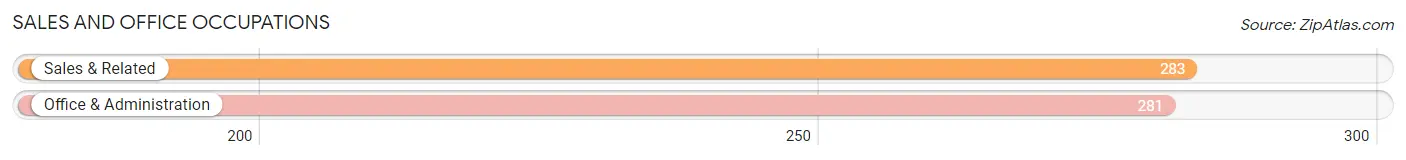
Sales and Office Occupations
The most common Sales and Office occupations in Bordentown are Sales & Related (283 | 12.3%), and Office & Administration (281 | 12.2%).
Sales and Office Occupations by Sex
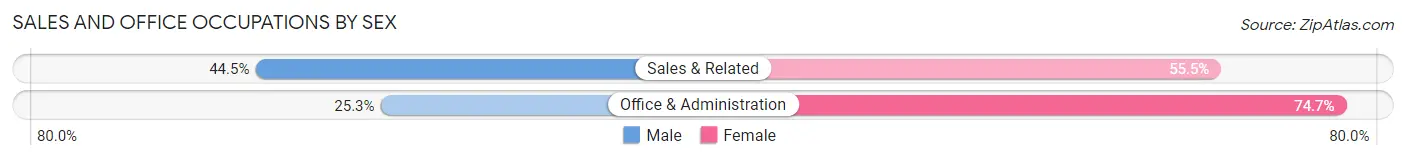
| Occupation | Male | Female |
| Sales & Related | 126 (44.5%) | 157 (55.5%) |
| Office & Administration | 71 (25.3%) | 210 (74.7%) |
| Total (Category) | 197 (34.9%) | 367 (65.1%) |
| Total (Overall) | 1,109 (48.3%) | 1,186 (51.7%) |
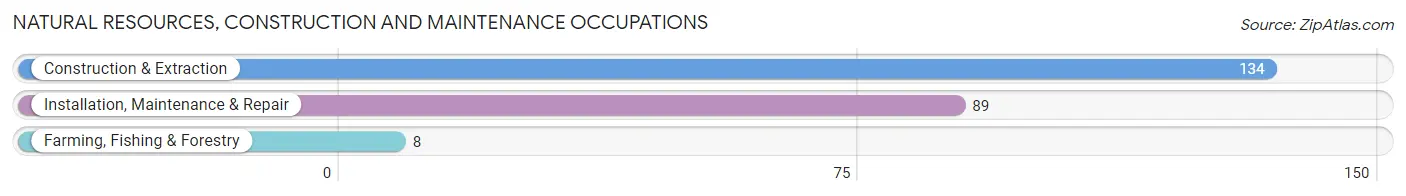
Natural Resources, Construction and Maintenance Occupations
The most common Natural Resources, Construction and Maintenance occupations in Bordentown are Construction & Extraction (134 | 5.8%), Installation, Maintenance & Repair (89 | 3.9%), and Farming, Fishing & Forestry (8 | 0.4%).
Natural Resources, Construction and Maintenance Occupations by Sex
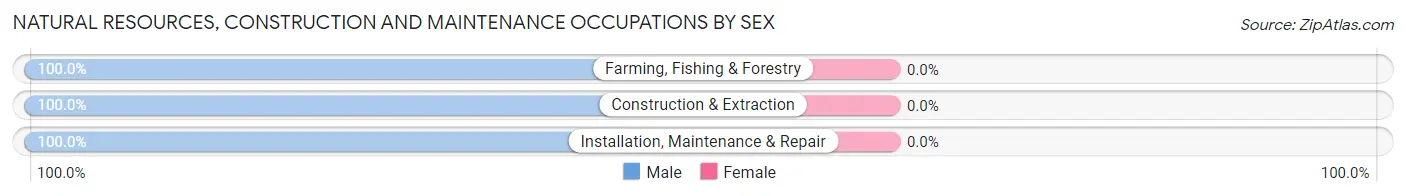
| Occupation | Male | Female |
| Farming, Fishing & Forestry | 8 (100.0%) | 0 (0.0%) |
| Construction & Extraction | 134 (100.0%) | 0 (0.0%) |
| Installation, Maintenance & Repair | 89 (100.0%) | 0 (0.0%) |
| Total (Category) | 231 (100.0%) | 0 (0.0%) |
| Total (Overall) | 1,109 (48.3%) | 1,186 (51.7%) |
Production, Transportation and Moving Occupations
The most common Production, Transportation and Moving occupations in Bordentown are Production (86 | 3.7%), Transportation (58 | 2.5%), and Material Moving (23 | 1.0%).
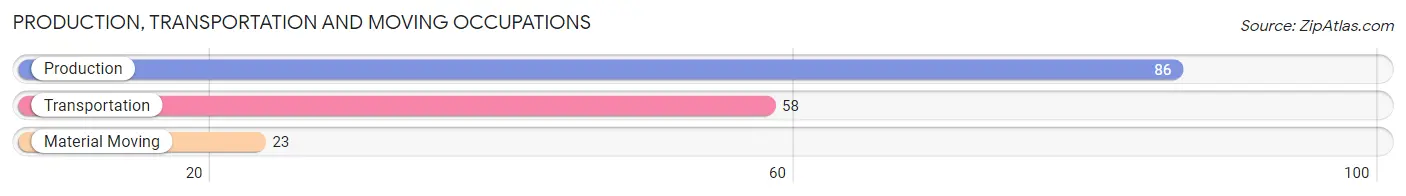
Production, Transportation and Moving Occupations by Sex
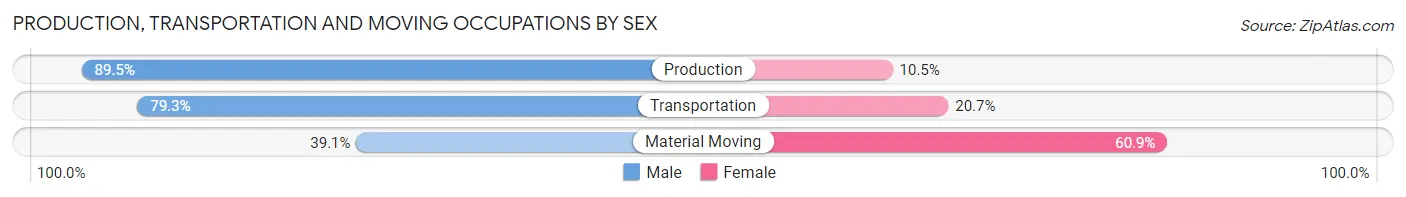
| Occupation | Male | Female |
| Production | 77 (89.5%) | 9 (10.5%) |
| Transportation | 46 (79.3%) | 12 (20.7%) |
| Material Moving | 9 (39.1%) | 14 (60.9%) |
| Total (Category) | 132 (79.0%) | 35 (21.0%) |
| Total (Overall) | 1,109 (48.3%) | 1,186 (51.7%) |
Employment Industries by Sex in Bordentown
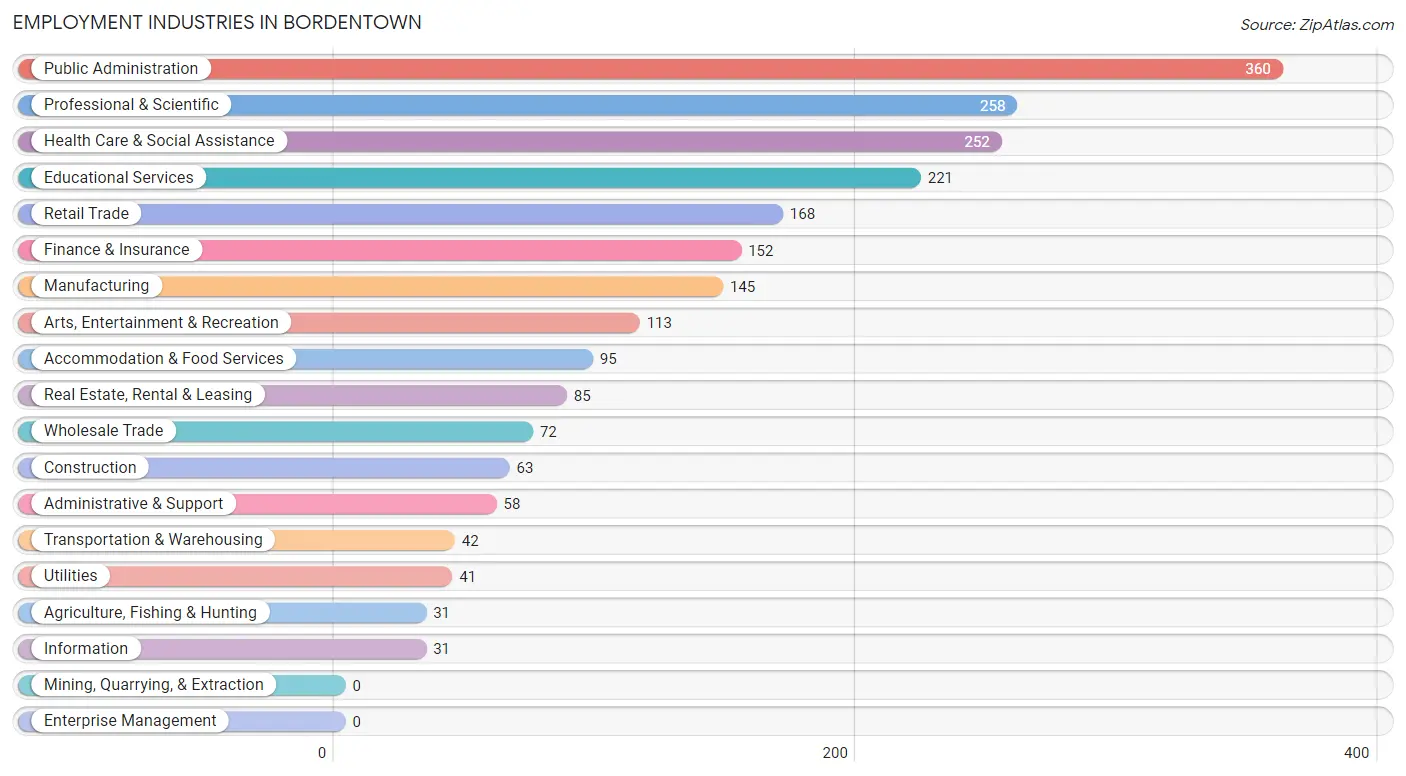
Employment Industries in Bordentown
The major employment industries in Bordentown include Public Administration (360 | 15.7%), Professional & Scientific (258 | 11.2%), Health Care & Social Assistance (252 | 11.0%), Educational Services (221 | 9.6%), and Retail Trade (168 | 7.3%).
Employment Industries by Sex in Bordentown
The Bordentown industries that see more men than women are Agriculture, Fishing & Hunting (100.0%), Construction (100.0%), and Utilities (85.4%), whereas the industries that tend to have a higher number of women are Health Care & Social Assistance (79.8%), Finance & Insurance (78.9%), and Accommodation & Food Services (65.3%).
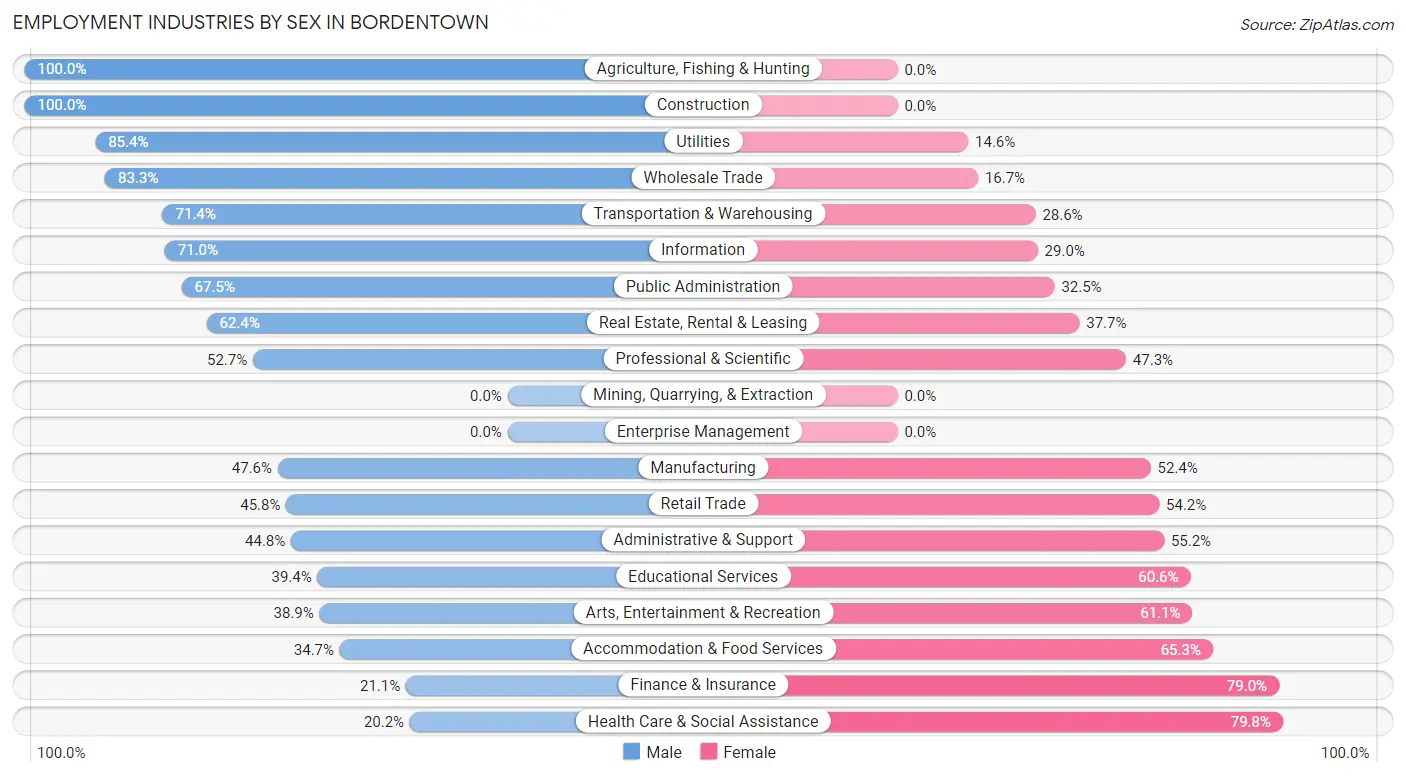
| Industry | Male | Female |
| Agriculture, Fishing & Hunting | 31 (100.0%) | 0 (0.0%) |
| Mining, Quarrying, & Extraction | 0 (0.0%) | 0 (0.0%) |
| Construction | 63 (100.0%) | 0 (0.0%) |
| Manufacturing | 69 (47.6%) | 76 (52.4%) |
| Wholesale Trade | 60 (83.3%) | 12 (16.7%) |
| Retail Trade | 77 (45.8%) | 91 (54.2%) |
| Transportation & Warehousing | 30 (71.4%) | 12 (28.6%) |
| Utilities | 35 (85.4%) | 6 (14.6%) |
| Information | 22 (71.0%) | 9 (29.0%) |
| Finance & Insurance | 32 (21.0%) | 120 (78.9%) |
| Real Estate, Rental & Leasing | 53 (62.4%) | 32 (37.7%) |
| Professional & Scientific | 136 (52.7%) | 122 (47.3%) |
| Enterprise Management | 0 (0.0%) | 0 (0.0%) |
| Administrative & Support | 26 (44.8%) | 32 (55.2%) |
| Educational Services | 87 (39.4%) | 134 (60.6%) |
| Health Care & Social Assistance | 51 (20.2%) | 201 (79.8%) |
| Arts, Entertainment & Recreation | 44 (38.9%) | 69 (61.1%) |
| Accommodation & Food Services | 33 (34.7%) | 62 (65.3%) |
| Public Administration | 243 (67.5%) | 117 (32.5%) |
| Total | 1,109 (48.3%) | 1,186 (51.7%) |
Education in Bordentown
School Enrollment in Bordentown
The most common levels of schooling among the 722 students in Bordentown are high school (186 | 25.8%), college / undergraduate (131 | 18.1%), and elementary school (94 | 13.0%).
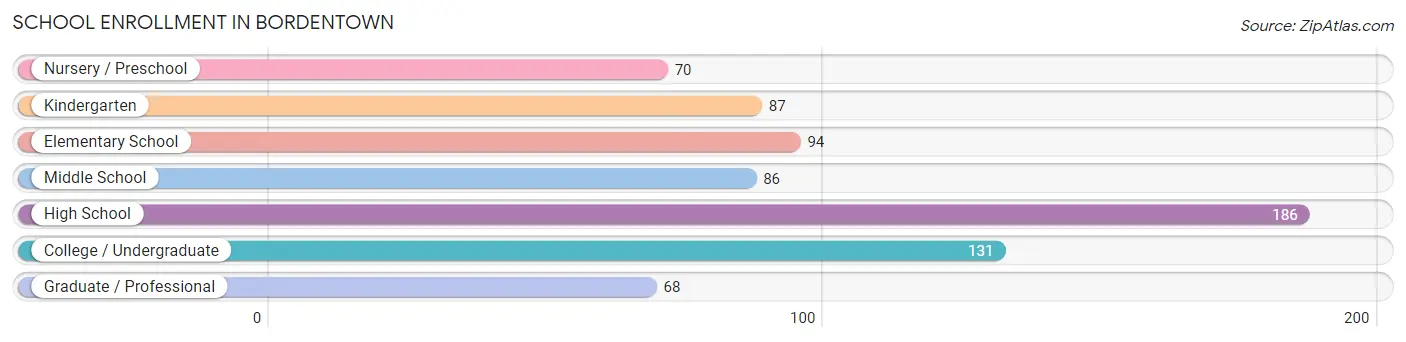
| School Level | # Students | % Students |
| Nursery / Preschool | 70 | 9.7% |
| Kindergarten | 87 | 12.0% |
| Elementary School | 94 | 13.0% |
| Middle School | 86 | 11.9% |
| High School | 186 | 25.8% |
| College / Undergraduate | 131 | 18.1% |
| Graduate / Professional | 68 | 9.4% |
| Total | 722 | 100.0% |
School Enrollment by Age by Funding Source in Bordentown
Out of a total of 722 students who are enrolled in schools in Bordentown, 163 (22.6%) attend a private institution, while the remaining 559 (77.4%) are enrolled in public schools. The age group of 3 to 4 year olds has the highest likelihood of being enrolled in private schools, with 61 (87.1% in the age bracket) enrolled. Conversely, the age group of 10 to 14 year olds has the lowest likelihood of being enrolled in a private school, with 113 (100.0% in the age bracket) attending a public institution.
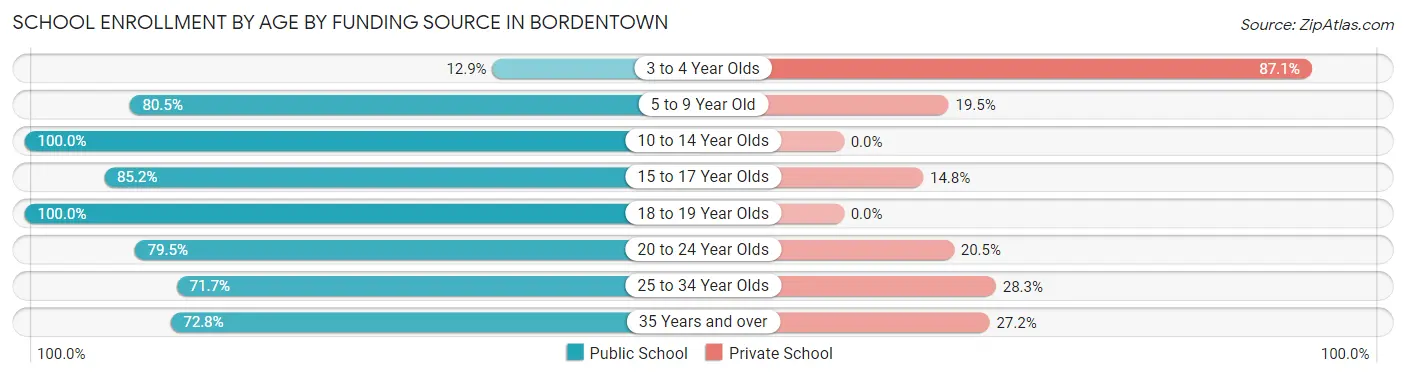
| Age Bracket | Public School | Private School |
| 3 to 4 Year Olds | 9 (12.9%) | 61 (87.1%) |
| 5 to 9 Year Old | 140 (80.5%) | 34 (19.5%) |
| 10 to 14 Year Olds | 113 (100.0%) | 0 (0.0%) |
| 15 to 17 Year Olds | 121 (85.2%) | 21 (14.8%) |
| 18 to 19 Year Olds | 43 (100.0%) | 0 (0.0%) |
| 20 to 24 Year Olds | 31 (79.5%) | 8 (20.5%) |
| 25 to 34 Year Olds | 43 (71.7%) | 17 (28.3%) |
| 35 Years and over | 59 (72.8%) | 22 (27.2%) |
| Total | 559 (77.4%) | 163 (22.6%) |
Educational Attainment by Field of Study in Bordentown
Social sciences (293 | 18.9%), business (226 | 14.6%), education (126 | 8.1%), psychology (117 | 7.5%), and visual & performing arts (117 | 7.5%) are the most common fields of study among 1,550 individuals in Bordentown who have obtained a bachelor's degree or higher.
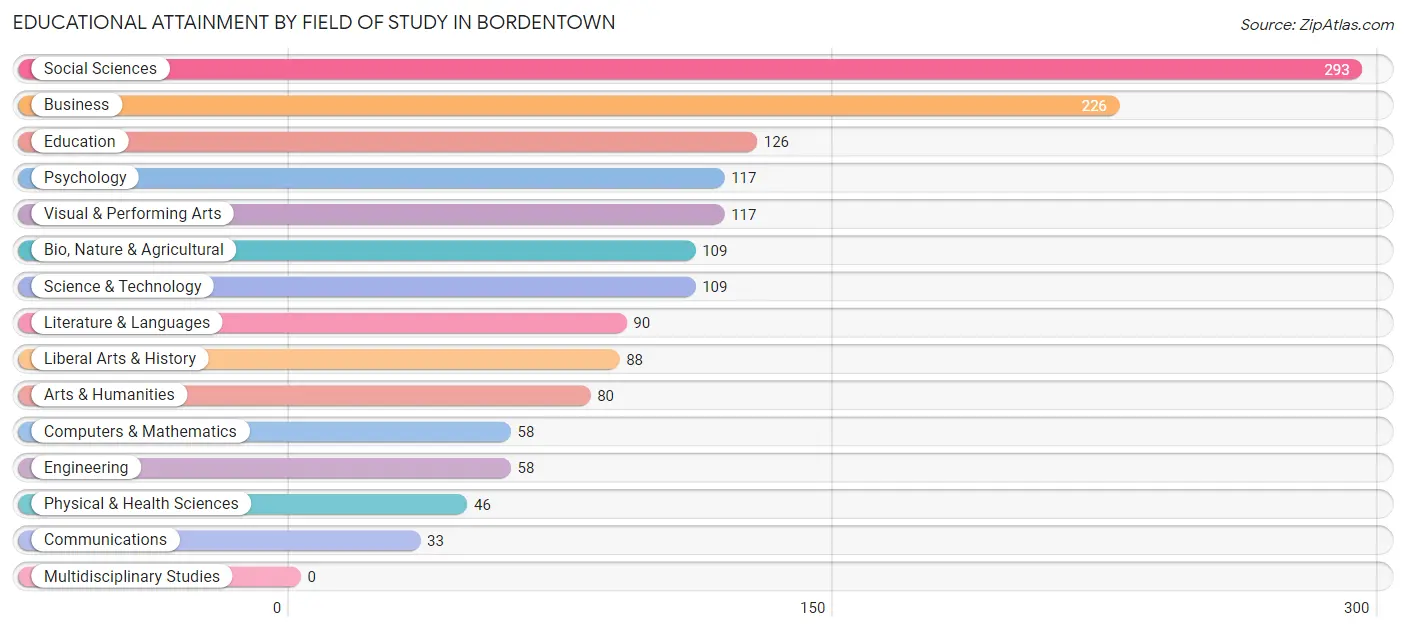
| Field of Study | # Graduates | % Graduates |
| Computers & Mathematics | 58 | 3.7% |
| Bio, Nature & Agricultural | 109 | 7.0% |
| Physical & Health Sciences | 46 | 3.0% |
| Psychology | 117 | 7.5% |
| Social Sciences | 293 | 18.9% |
| Engineering | 58 | 3.7% |
| Multidisciplinary Studies | 0 | 0.0% |
| Science & Technology | 109 | 7.0% |
| Business | 226 | 14.6% |
| Education | 126 | 8.1% |
| Literature & Languages | 90 | 5.8% |
| Liberal Arts & History | 88 | 5.7% |
| Visual & Performing Arts | 117 | 7.5% |
| Communications | 33 | 2.1% |
| Arts & Humanities | 80 | 5.2% |
| Total | 1,550 | 100.0% |
Transportation & Commute in Bordentown
Vehicle Availability by Sex in Bordentown
The most prevalent vehicle ownership categories in Bordentown are males with 1 vehicle (412, accounting for 39.1%) and females with 1 vehicle (421, making up 35.4%).
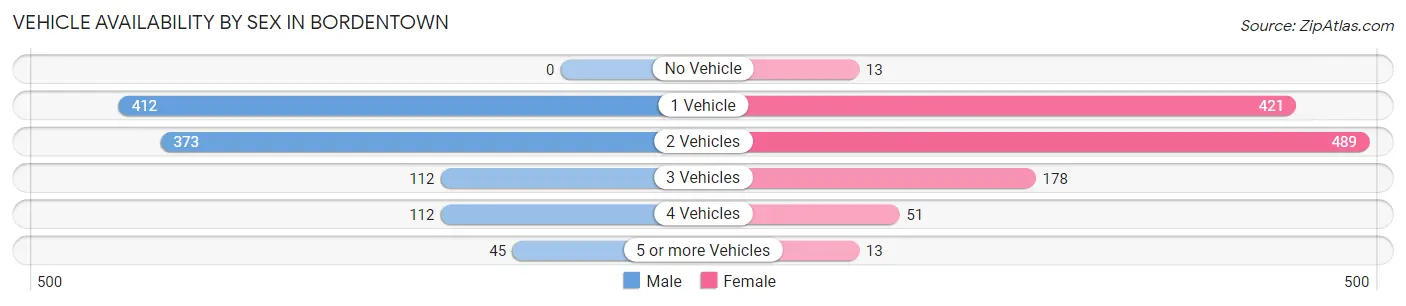
| Vehicles Available | Male | Female |
| No Vehicle | 0 (0.0%) | 13 (1.1%) |
| 1 Vehicle | 412 (39.1%) | 421 (36.1%) |
| 2 Vehicles | 373 (35.4%) | 489 (42.0%) |
| 3 Vehicles | 112 (10.6%) | 178 (15.3%) |
| 4 Vehicles | 112 (10.6%) | 51 (4.4%) |
| 5 or more Vehicles | 45 (4.3%) | 13 (1.1%) |
| Total | 1,054 (100.0%) | 1,165 (100.0%) |
Commute Time in Bordentown
The most frequently occuring commute durations in Bordentown are 20 to 24 minutes (474 commuters, 23.9%), 15 to 19 minutes (309 commuters, 15.6%), and 30 to 34 minutes (286 commuters, 14.4%).
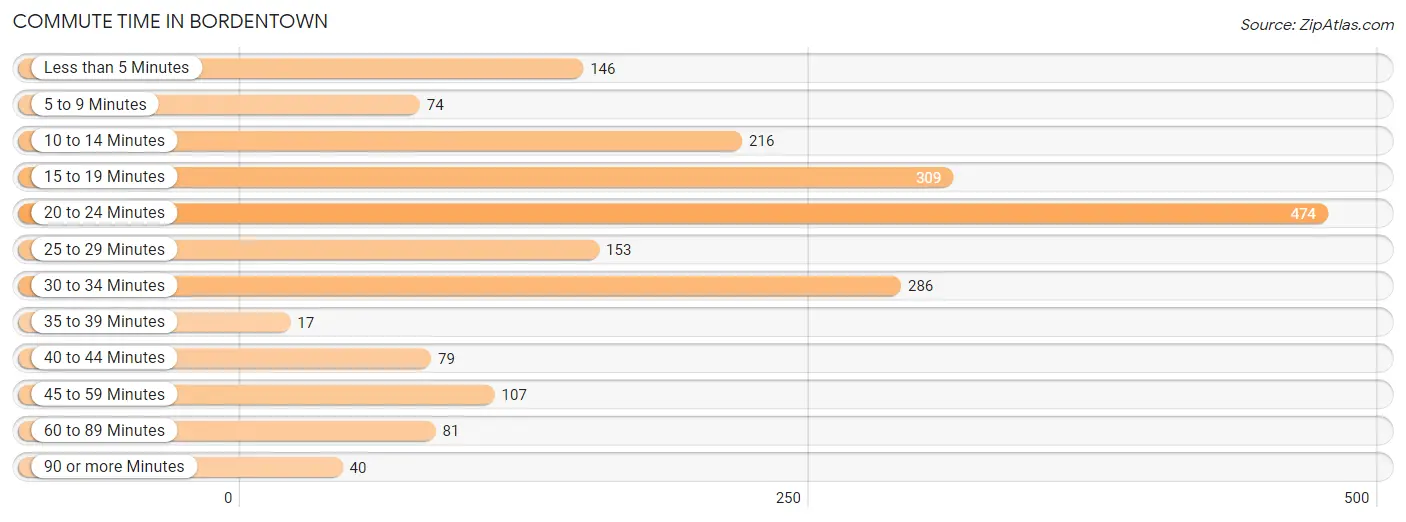
| Commute Time | # Commuters | % Commuters |
| Less than 5 Minutes | 146 | 7.4% |
| 5 to 9 Minutes | 74 | 3.7% |
| 10 to 14 Minutes | 216 | 10.9% |
| 15 to 19 Minutes | 309 | 15.6% |
| 20 to 24 Minutes | 474 | 23.9% |
| 25 to 29 Minutes | 153 | 7.7% |
| 30 to 34 Minutes | 286 | 14.4% |
| 35 to 39 Minutes | 17 | 0.9% |
| 40 to 44 Minutes | 79 | 4.0% |
| 45 to 59 Minutes | 107 | 5.4% |
| 60 to 89 Minutes | 81 | 4.1% |
| 90 or more Minutes | 40 | 2.0% |
Commute Time by Sex in Bordentown
The most common commute times in Bordentown are 20 to 24 minutes (183 commuters, 19.1%) for males and 20 to 24 minutes (291 commuters, 28.5%) for females.
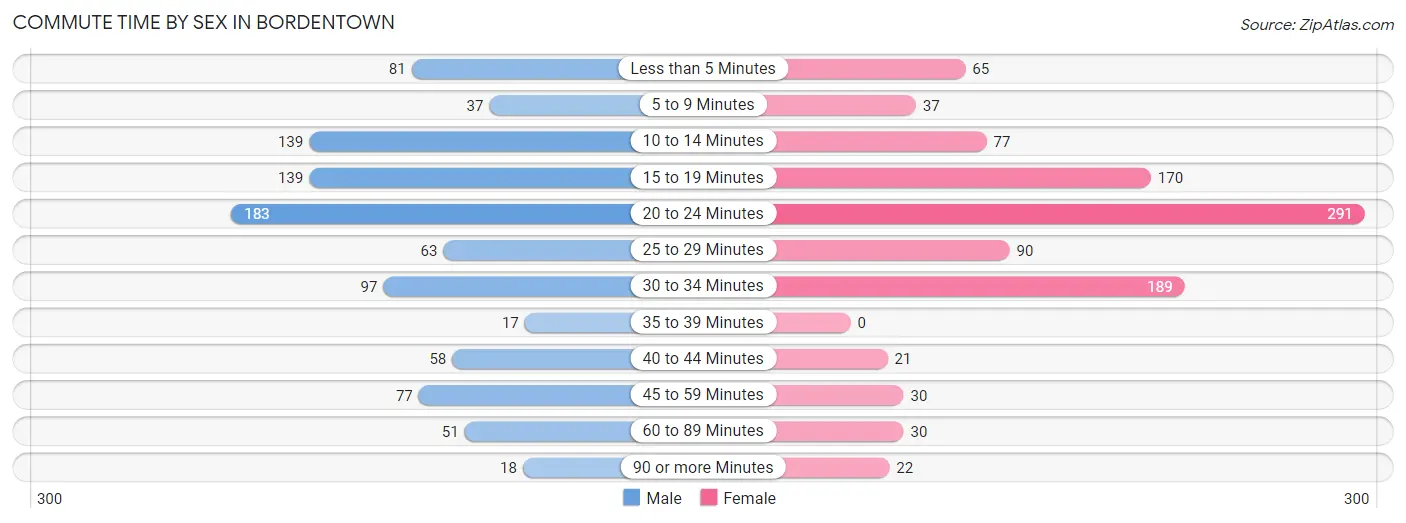
| Commute Time | Male | Female |
| Less than 5 Minutes | 81 (8.4%) | 65 (6.4%) |
| 5 to 9 Minutes | 37 (3.8%) | 37 (3.6%) |
| 10 to 14 Minutes | 139 (14.5%) | 77 (7.5%) |
| 15 to 19 Minutes | 139 (14.5%) | 170 (16.6%) |
| 20 to 24 Minutes | 183 (19.1%) | 291 (28.5%) |
| 25 to 29 Minutes | 63 (6.6%) | 90 (8.8%) |
| 30 to 34 Minutes | 97 (10.1%) | 189 (18.5%) |
| 35 to 39 Minutes | 17 (1.8%) | 0 (0.0%) |
| 40 to 44 Minutes | 58 (6.0%) | 21 (2.1%) |
| 45 to 59 Minutes | 77 (8.0%) | 30 (2.9%) |
| 60 to 89 Minutes | 51 (5.3%) | 30 (2.9%) |
| 90 or more Minutes | 18 (1.9%) | 22 (2.1%) |
Time of Departure to Work by Sex in Bordentown
The most frequent times of departure to work in Bordentown are 8:00 AM to 8:29 AM (158, 16.5%) for males and 8:30 AM to 8:59 AM (214, 20.9%) for females.
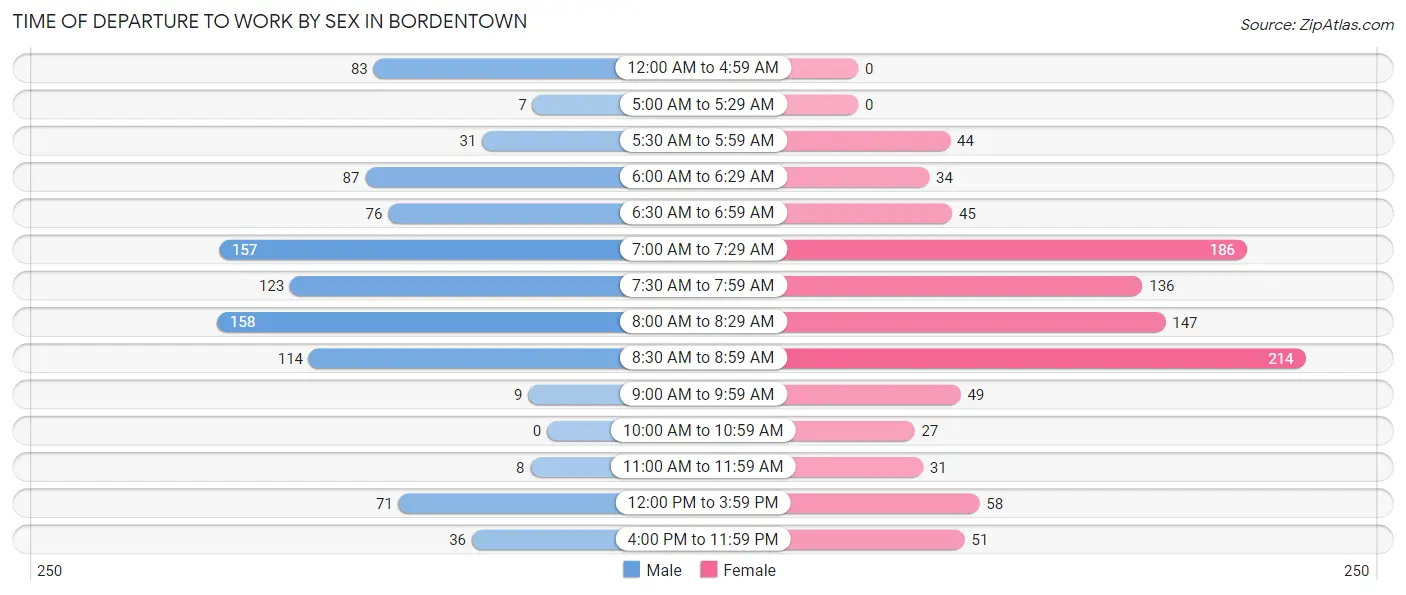
| Time of Departure | Male | Female |
| 12:00 AM to 4:59 AM | 83 (8.6%) | 0 (0.0%) |
| 5:00 AM to 5:29 AM | 7 (0.7%) | 0 (0.0%) |
| 5:30 AM to 5:59 AM | 31 (3.2%) | 44 (4.3%) |
| 6:00 AM to 6:29 AM | 87 (9.1%) | 34 (3.3%) |
| 6:30 AM to 6:59 AM | 76 (7.9%) | 45 (4.4%) |
| 7:00 AM to 7:29 AM | 157 (16.4%) | 186 (18.2%) |
| 7:30 AM to 7:59 AM | 123 (12.8%) | 136 (13.3%) |
| 8:00 AM to 8:29 AM | 158 (16.5%) | 147 (14.4%) |
| 8:30 AM to 8:59 AM | 114 (11.9%) | 214 (20.9%) |
| 9:00 AM to 9:59 AM | 9 (0.9%) | 49 (4.8%) |
| 10:00 AM to 10:59 AM | 0 (0.0%) | 27 (2.6%) |
| 11:00 AM to 11:59 AM | 8 (0.8%) | 31 (3.0%) |
| 12:00 PM to 3:59 PM | 71 (7.4%) | 58 (5.7%) |
| 4:00 PM to 11:59 PM | 36 (3.7%) | 51 (5.0%) |
| Total | 960 (100.0%) | 1,022 (100.0%) |
Housing Occupancy in Bordentown
Occupancy by Ownership in Bordentown
Of the total 1,849 dwellings in Bordentown, owner-occupied units account for 959 (51.9%), while renter-occupied units make up 890 (48.1%).
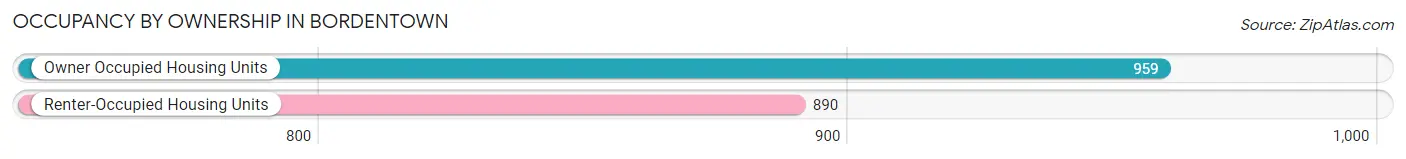
| Occupancy | # Housing Units | % Housing Units |
| Owner Occupied Housing Units | 959 | 51.9% |
| Renter-Occupied Housing Units | 890 | 48.1% |
| Total Occupied Housing Units | 1,849 | 100.0% |
Occupancy by Household Size in Bordentown
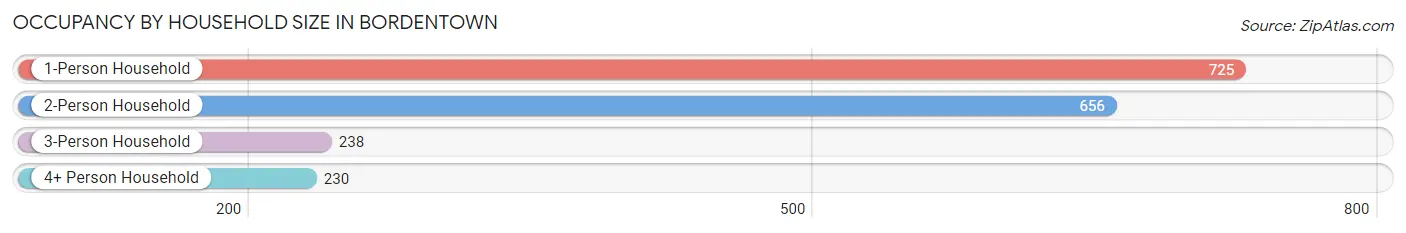
| Household Size | # Housing Units | % Housing Units |
| 1-Person Household | 725 | 39.2% |
| 2-Person Household | 656 | 35.5% |
| 3-Person Household | 238 | 12.9% |
| 4+ Person Household | 230 | 12.4% |
| Total Housing Units | 1,849 | 100.0% |
Occupancy by Ownership by Household Size in Bordentown
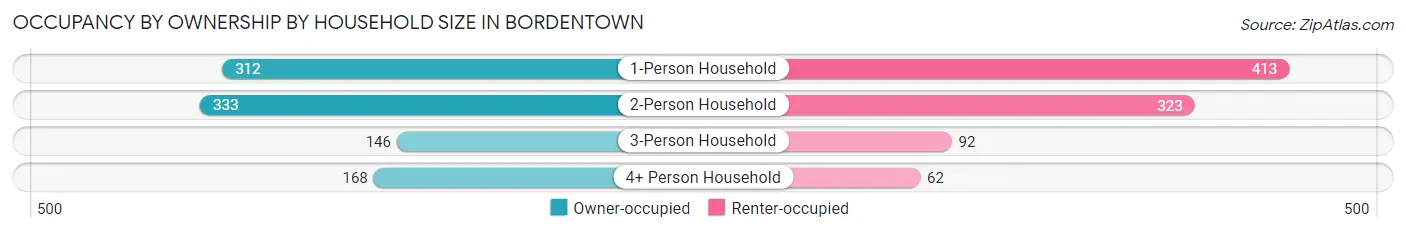
| Household Size | Owner-occupied | Renter-occupied |
| 1-Person Household | 312 (43.0%) | 413 (57.0%) |
| 2-Person Household | 333 (50.8%) | 323 (49.2%) |
| 3-Person Household | 146 (61.3%) | 92 (38.7%) |
| 4+ Person Household | 168 (73.0%) | 62 (27.0%) |
| Total Housing Units | 959 (51.9%) | 890 (48.1%) |
Occupancy by Educational Attainment in Bordentown
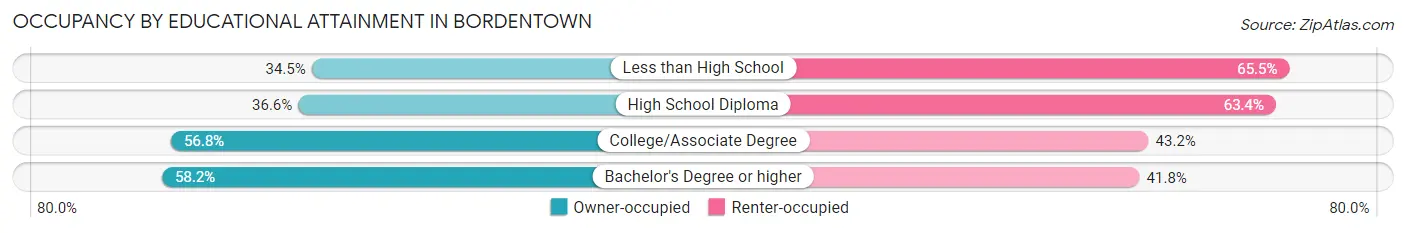
| Household Size | Owner-occupied | Renter-occupied |
| Less than High School | 50 (34.5%) | 95 (65.5%) |
| High School Diploma | 130 (36.6%) | 225 (63.4%) |
| College/Associate Degree | 247 (56.8%) | 188 (43.2%) |
| Bachelor's Degree or higher | 532 (58.2%) | 382 (41.8%) |
Occupancy by Age of Householder in Bordentown
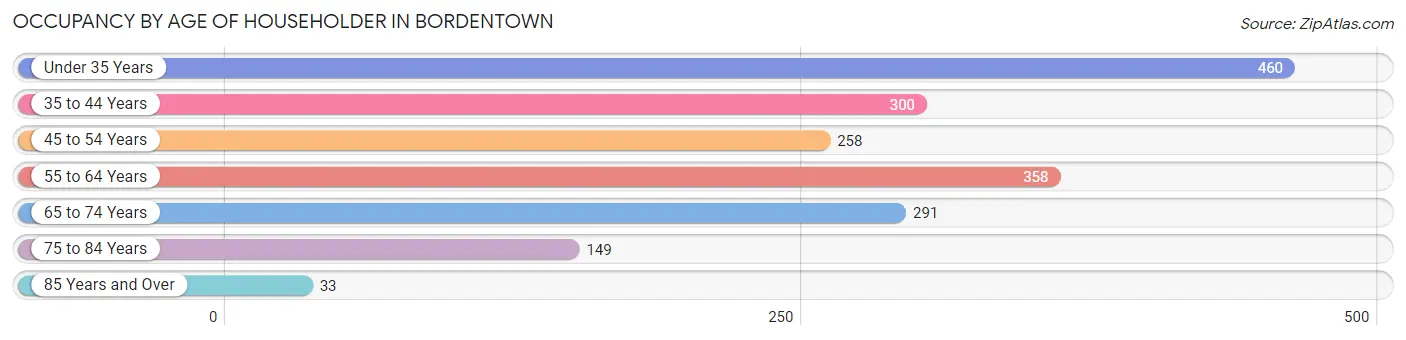
| Age Bracket | # Households | % Households |
| Under 35 Years | 460 | 24.9% |
| 35 to 44 Years | 300 | 16.2% |
| 45 to 54 Years | 258 | 14.0% |
| 55 to 64 Years | 358 | 19.4% |
| 65 to 74 Years | 291 | 15.7% |
| 75 to 84 Years | 149 | 8.1% |
| 85 Years and Over | 33 | 1.8% |
| Total | 1,849 | 100.0% |
Housing Finances in Bordentown
Median Income by Occupancy in Bordentown
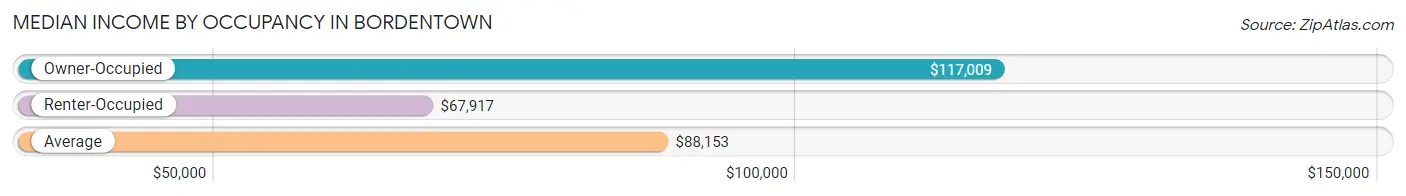
| Occupancy Type | # Households | Median Income |
| Owner-Occupied | 959 (51.9%) | $117,009 |
| Renter-Occupied | 890 (48.1%) | $67,917 |
| Average | 1,849 (100.0%) | $88,153 |
Occupancy by Householder Income Bracket in Bordentown
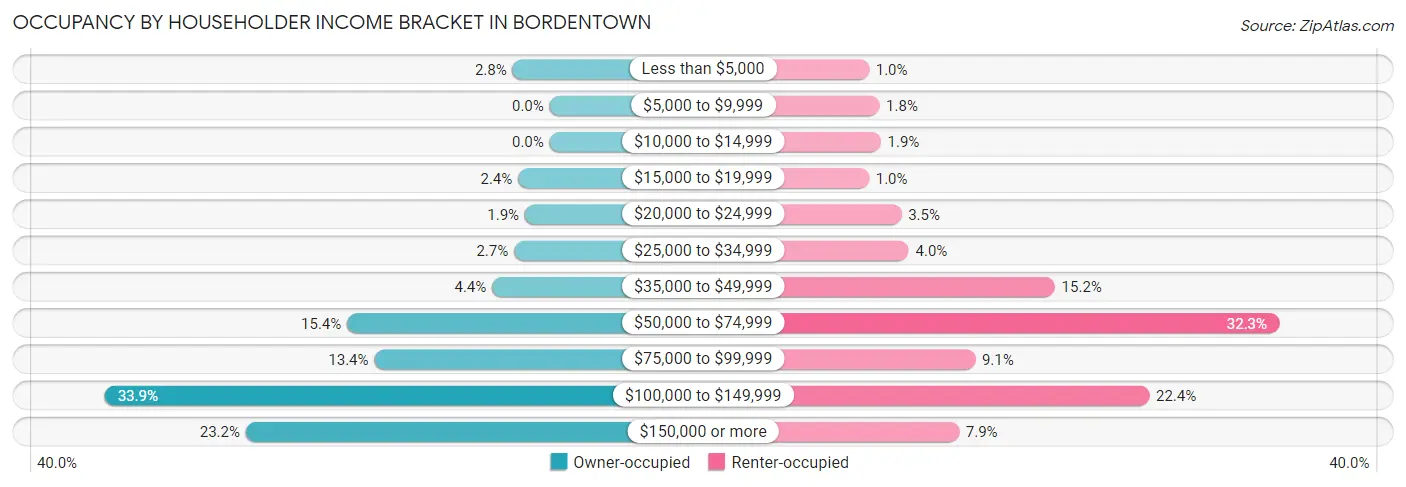
| Income Bracket | Owner-occupied | Renter-occupied |
| Less than $5,000 | 27 (2.8%) | 9 (1.0%) |
| $5,000 to $9,999 | 0 (0.0%) | 16 (1.8%) |
| $10,000 to $14,999 | 0 (0.0%) | 17 (1.9%) |
| $15,000 to $19,999 | 23 (2.4%) | 9 (1.0%) |
| $20,000 to $24,999 | 18 (1.9%) | 31 (3.5%) |
| $25,000 to $34,999 | 26 (2.7%) | 36 (4.0%) |
| $35,000 to $49,999 | 42 (4.4%) | 135 (15.2%) |
| $50,000 to $74,999 | 148 (15.4%) | 287 (32.3%) |
| $75,000 to $99,999 | 128 (13.4%) | 81 (9.1%) |
| $100,000 to $149,999 | 325 (33.9%) | 199 (22.4%) |
| $150,000 or more | 222 (23.2%) | 70 (7.9%) |
| Total | 959 (100.0%) | 890 (100.0%) |
Monthly Housing Cost Tiers in Bordentown
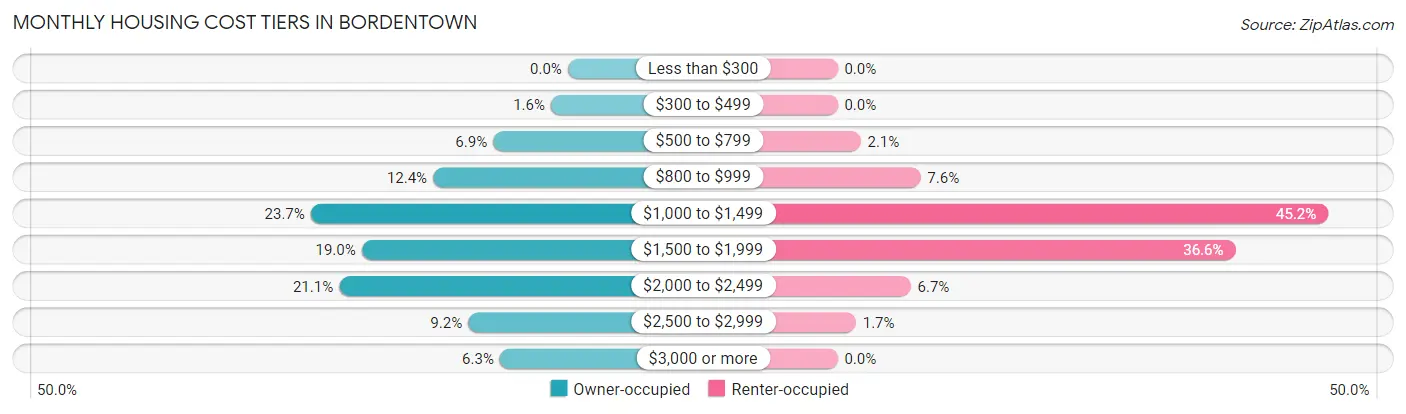
| Monthly Cost | Owner-occupied | Renter-occupied |
| Less than $300 | 0 (0.0%) | 0 (0.0%) |
| $300 to $499 | 15 (1.6%) | 0 (0.0%) |
| $500 to $799 | 66 (6.9%) | 19 (2.1%) |
| $800 to $999 | 119 (12.4%) | 68 (7.6%) |
| $1,000 to $1,499 | 227 (23.7%) | 402 (45.2%) |
| $1,500 to $1,999 | 182 (19.0%) | 326 (36.6%) |
| $2,000 to $2,499 | 202 (21.1%) | 60 (6.7%) |
| $2,500 to $2,999 | 88 (9.2%) | 15 (1.7%) |
| $3,000 or more | 60 (6.3%) | 0 (0.0%) |
| Total | 959 (100.0%) | 890 (100.0%) |
Physical Housing Characteristics in Bordentown
Housing Structures in Bordentown
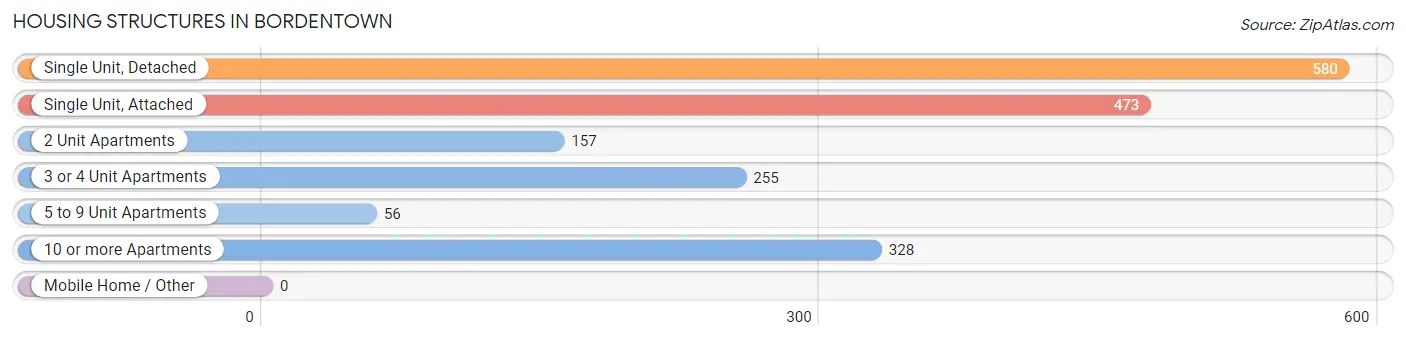
| Structure Type | # Housing Units | % Housing Units |
| Single Unit, Detached | 580 | 31.4% |
| Single Unit, Attached | 473 | 25.6% |
| 2 Unit Apartments | 157 | 8.5% |
| 3 or 4 Unit Apartments | 255 | 13.8% |
| 5 to 9 Unit Apartments | 56 | 3.0% |
| 10 or more Apartments | 328 | 17.7% |
| Mobile Home / Other | 0 | 0.0% |
| Total | 1,849 | 100.0% |
Housing Structures by Occupancy in Bordentown
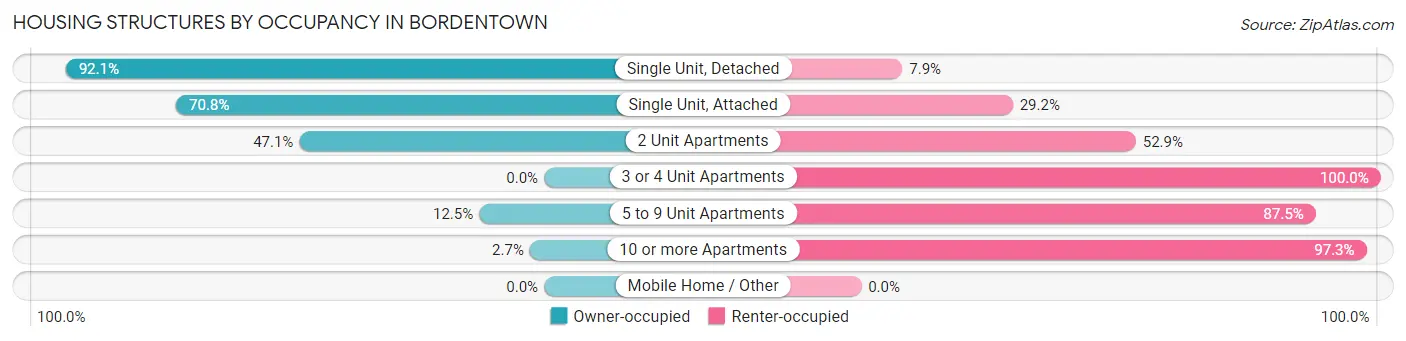
| Structure Type | Owner-occupied | Renter-occupied |
| Single Unit, Detached | 534 (92.1%) | 46 (7.9%) |
| Single Unit, Attached | 335 (70.8%) | 138 (29.2%) |
| 2 Unit Apartments | 74 (47.1%) | 83 (52.9%) |
| 3 or 4 Unit Apartments | 0 (0.0%) | 255 (100.0%) |
| 5 to 9 Unit Apartments | 7 (12.5%) | 49 (87.5%) |
| 10 or more Apartments | 9 (2.7%) | 319 (97.3%) |
| Mobile Home / Other | 0 (0.0%) | 0 (0.0%) |
| Total | 959 (51.9%) | 890 (48.1%) |
Housing Structures by Number of Rooms in Bordentown
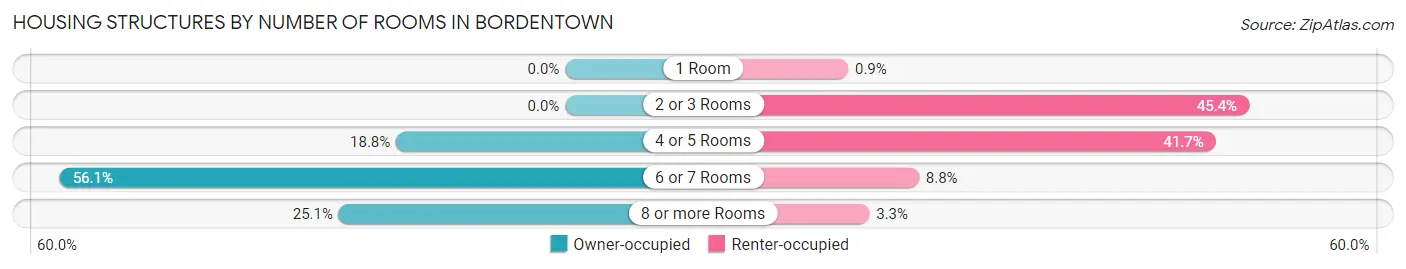
| Number of Rooms | Owner-occupied | Renter-occupied |
| 1 Room | 0 (0.0%) | 8 (0.9%) |
| 2 or 3 Rooms | 0 (0.0%) | 404 (45.4%) |
| 4 or 5 Rooms | 180 (18.8%) | 371 (41.7%) |
| 6 or 7 Rooms | 538 (56.1%) | 78 (8.8%) |
| 8 or more Rooms | 241 (25.1%) | 29 (3.3%) |
| Total | 959 (100.0%) | 890 (100.0%) |
Housing Structure by Heating Type in Bordentown
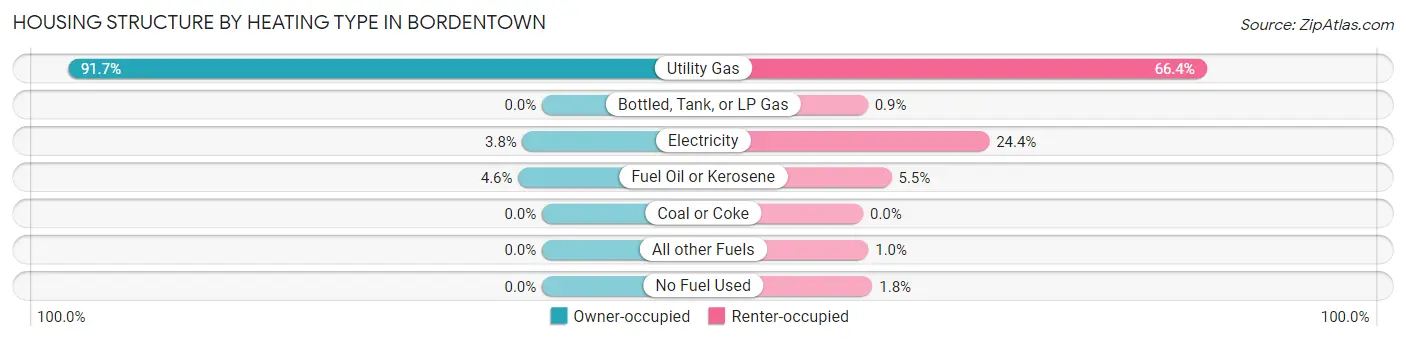
| Heating Type | Owner-occupied | Renter-occupied |
| Utility Gas | 879 (91.7%) | 591 (66.4%) |
| Bottled, Tank, or LP Gas | 0 (0.0%) | 8 (0.9%) |
| Electricity | 36 (3.7%) | 217 (24.4%) |
| Fuel Oil or Kerosene | 44 (4.6%) | 49 (5.5%) |
| Coal or Coke | 0 (0.0%) | 0 (0.0%) |
| All other Fuels | 0 (0.0%) | 9 (1.0%) |
| No Fuel Used | 0 (0.0%) | 16 (1.8%) |
| Total | 959 (100.0%) | 890 (100.0%) |
Household Vehicle Usage in Bordentown
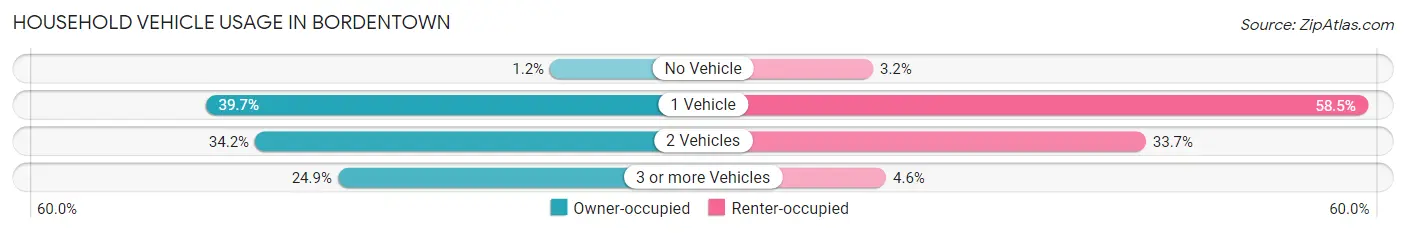
| Vehicles per Household | Owner-occupied | Renter-occupied |
| No Vehicle | 11 (1.1%) | 28 (3.2%) |
| 1 Vehicle | 381 (39.7%) | 521 (58.5%) |
| 2 Vehicles | 328 (34.2%) | 300 (33.7%) |
| 3 or more Vehicles | 239 (24.9%) | 41 (4.6%) |
| Total | 959 (100.0%) | 890 (100.0%) |
Real Estate & Mortgages in Bordentown
Real Estate and Mortgage Overview in Bordentown
| Characteristic | Without Mortgage | With Mortgage |
| Housing Units | 317 | 642 |
| Median Property Value | $351,500 | $259,100 |
| Median Household Income | $89,148 | $202 |
| Monthly Housing Costs | $985 | $60 |
| Real Estate Taxes | $8,385 | $0 |
Property Value by Mortgage Status in Bordentown
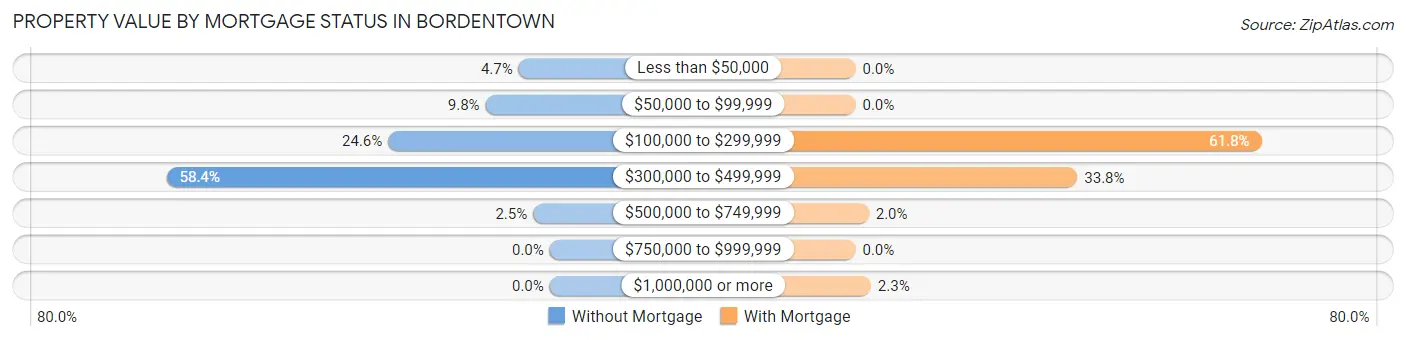
| Property Value | Without Mortgage | With Mortgage |
| Less than $50,000 | 15 (4.7%) | 0 (0.0%) |
| $50,000 to $99,999 | 31 (9.8%) | 0 (0.0%) |
| $100,000 to $299,999 | 78 (24.6%) | 397 (61.8%) |
| $300,000 to $499,999 | 185 (58.4%) | 217 (33.8%) |
| $500,000 to $749,999 | 8 (2.5%) | 13 (2.0%) |
| $750,000 to $999,999 | 0 (0.0%) | 0 (0.0%) |
| $1,000,000 or more | 0 (0.0%) | 15 (2.3%) |
| Total | 317 (100.0%) | 642 (100.0%) |
Household Income by Mortgage Status in Bordentown
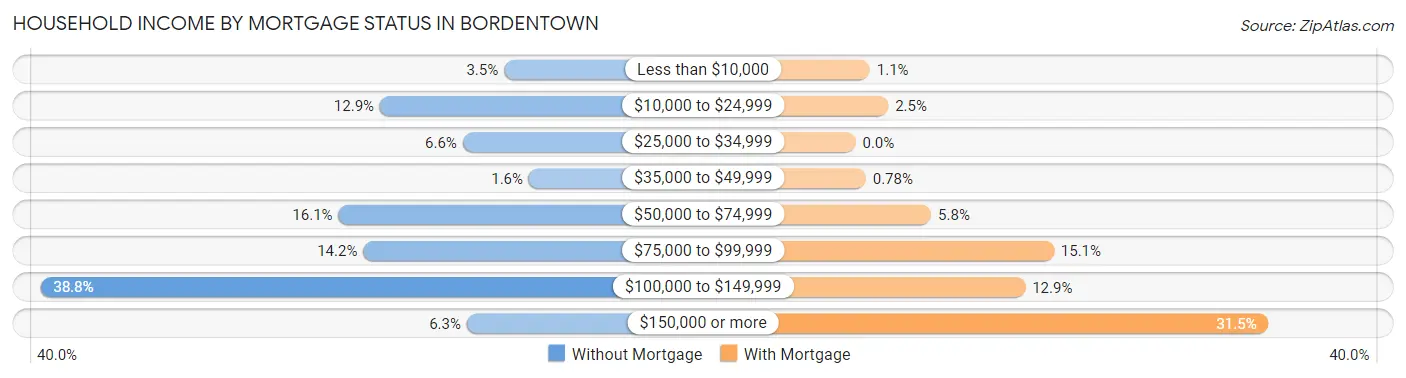
| Household Income | Without Mortgage | With Mortgage |
| Less than $10,000 | 11 (3.5%) | 7 (1.1%) |
| $10,000 to $24,999 | 41 (12.9%) | 16 (2.5%) |
| $25,000 to $34,999 | 21 (6.6%) | 0 (0.0%) |
| $35,000 to $49,999 | 5 (1.6%) | 5 (0.8%) |
| $50,000 to $74,999 | 51 (16.1%) | 37 (5.8%) |
| $75,000 to $99,999 | 45 (14.2%) | 97 (15.1%) |
| $100,000 to $149,999 | 123 (38.8%) | 83 (12.9%) |
| $150,000 or more | 20 (6.3%) | 202 (31.5%) |
| Total | 317 (100.0%) | 642 (100.0%) |
Property Value to Household Income Ratio in Bordentown
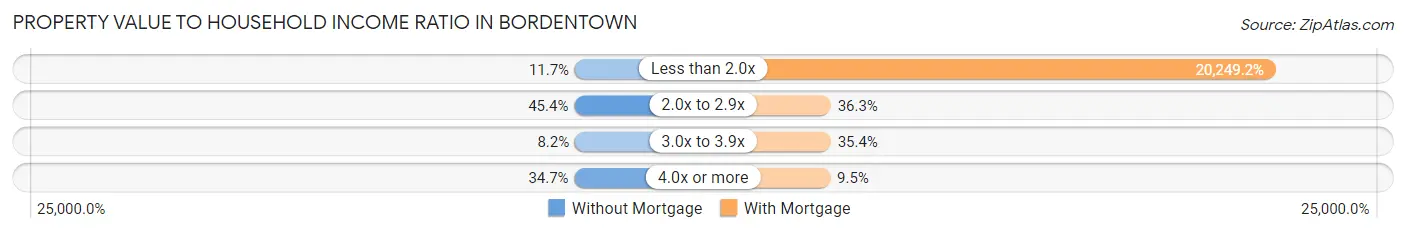
| Value-to-Income Ratio | Without Mortgage | With Mortgage |
| Less than 2.0x | 37 (11.7%) | 130,000 (20,249.2%) |
| 2.0x to 2.9x | 144 (45.4%) | 233 (36.3%) |
| 3.0x to 3.9x | 26 (8.2%) | 227 (35.4%) |
| 4.0x or more | 110 (34.7%) | 61 (9.5%) |
| Total | 317 (100.0%) | 642 (100.0%) |
Real Estate Taxes by Mortgage Status in Bordentown
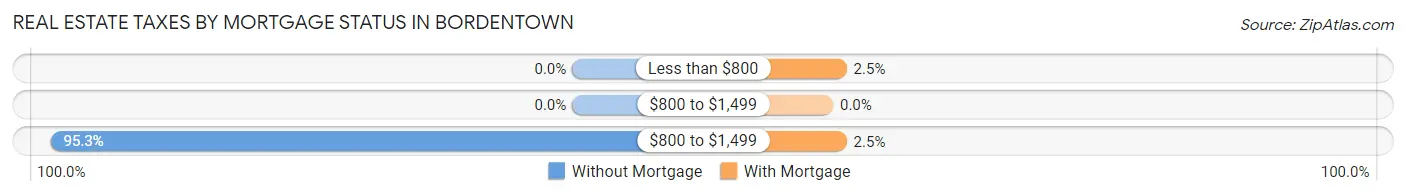
| Property Taxes | Without Mortgage | With Mortgage |
| Less than $800 | 0 (0.0%) | 16 (2.5%) |
| $800 to $1,499 | 0 (0.0%) | 0 (0.0%) |
| $800 to $1,499 | 302 (95.3%) | 16 (2.5%) |
| Total | 317 (100.0%) | 642 (100.0%) |
Health & Disability in Bordentown
Health Insurance Coverage by Age in Bordentown
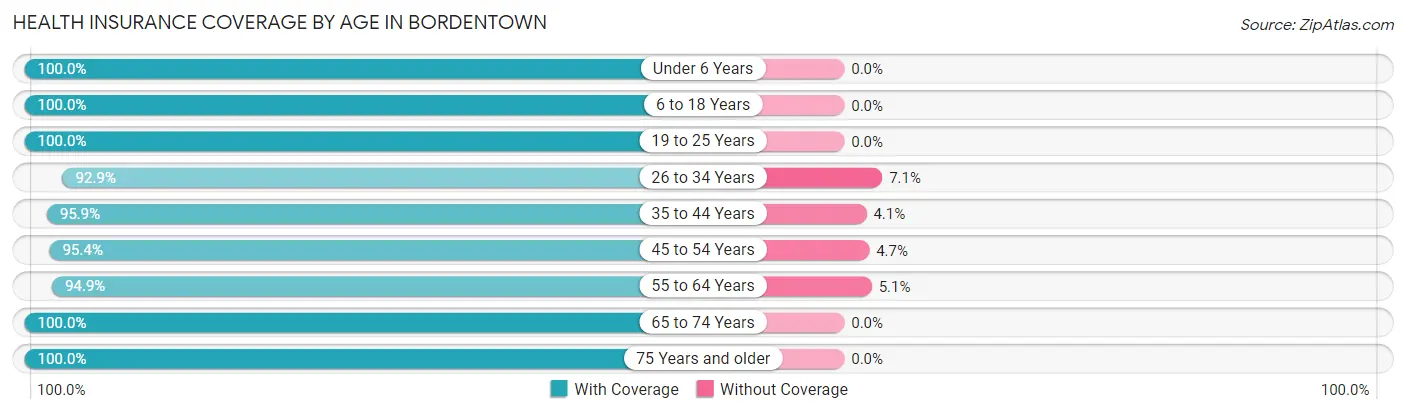
| Age Bracket | With Coverage | Without Coverage |
| Under 6 Years | 287 (100.0%) | 0 (0.0%) |
| 6 to 18 Years | 425 (100.0%) | 0 (0.0%) |
| 19 to 25 Years | 278 (100.0%) | 0 (0.0%) |
| 26 to 34 Years | 618 (92.9%) | 47 (7.1%) |
| 35 to 44 Years | 486 (95.9%) | 21 (4.1%) |
| 45 to 54 Years | 472 (95.4%) | 23 (4.6%) |
| 55 to 64 Years | 520 (94.9%) | 28 (5.1%) |
| 65 to 74 Years | 384 (100.0%) | 0 (0.0%) |
| 75 Years and older | 312 (100.0%) | 0 (0.0%) |
| Total | 3,782 (97.0%) | 119 (3.0%) |
Health Insurance Coverage by Citizenship Status in Bordentown
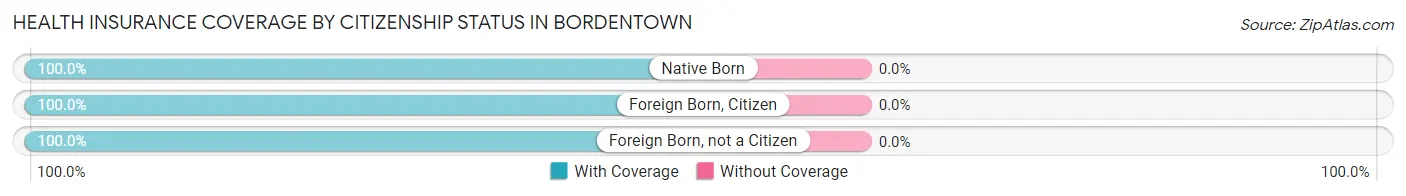
| Citizenship Status | With Coverage | Without Coverage |
| Native Born | 287 (100.0%) | 0 (0.0%) |
| Foreign Born, Citizen | 425 (100.0%) | 0 (0.0%) |
| Foreign Born, not a Citizen | 278 (100.0%) | 0 (0.0%) |
Health Insurance Coverage by Household Income in Bordentown
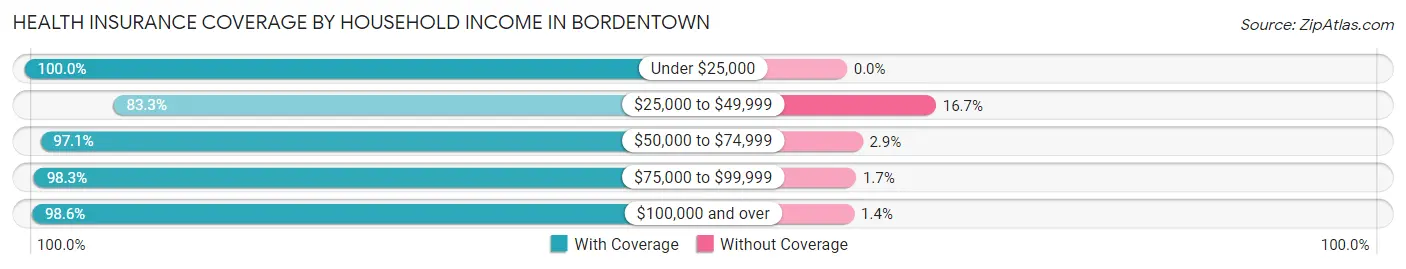
| Household Income | With Coverage | Without Coverage |
| Under $25,000 | 178 (100.0%) | 0 (0.0%) |
| $25,000 to $49,999 | 285 (83.3%) | 57 (16.7%) |
| $50,000 to $74,999 | 825 (97.1%) | 25 (2.9%) |
| $75,000 to $99,999 | 342 (98.3%) | 6 (1.7%) |
| $100,000 and over | 2,139 (98.6%) | 30 (1.4%) |
Public vs Private Health Insurance Coverage by Age in Bordentown
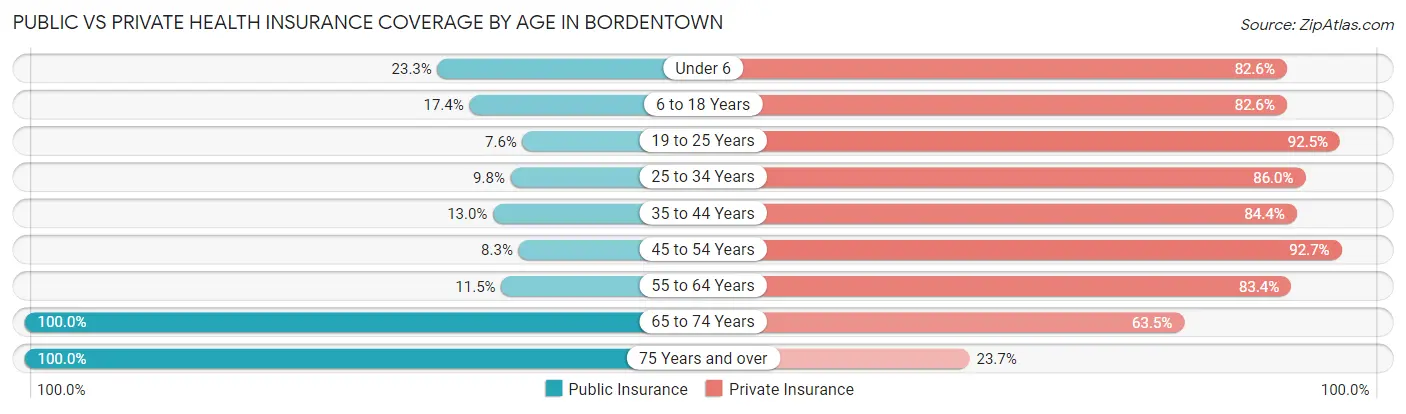
| Age Bracket | Public Insurance | Private Insurance |
| Under 6 | 67 (23.3%) | 237 (82.6%) |
| 6 to 18 Years | 74 (17.4%) | 351 (82.6%) |
| 19 to 25 Years | 21 (7.5%) | 257 (92.4%) |
| 25 to 34 Years | 65 (9.8%) | 572 (86.0%) |
| 35 to 44 Years | 66 (13.0%) | 428 (84.4%) |
| 45 to 54 Years | 41 (8.3%) | 459 (92.7%) |
| 55 to 64 Years | 63 (11.5%) | 457 (83.4%) |
| 65 to 74 Years | 384 (100.0%) | 244 (63.5%) |
| 75 Years and over | 312 (100.0%) | 74 (23.7%) |
| Total | 1,093 (28.0%) | 3,079 (78.9%) |
Disability Status by Sex by Age in Bordentown
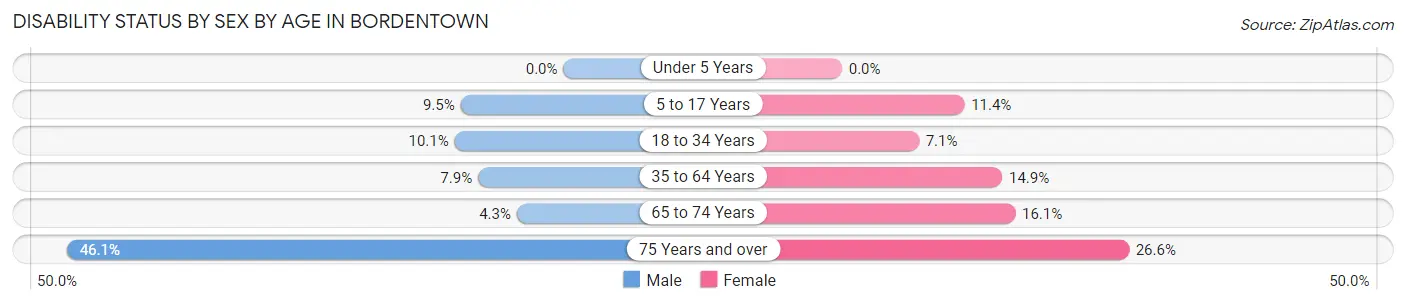
| Age Bracket | Male | Female |
| Under 5 Years | 0 (0.0%) | 0 (0.0%) |
| 5 to 17 Years | 29 (9.5%) | 15 (11.4%) |
| 18 to 34 Years | 51 (10.1%) | 33 (7.1%) |
| 35 to 64 Years | 61 (7.9%) | 116 (14.9%) |
| 65 to 74 Years | 8 (4.3%) | 32 (16.1%) |
| 75 Years and over | 59 (46.1%) | 49 (26.6%) |
Disability Class by Sex by Age in Bordentown
Disability Class: Hearing Difficulty
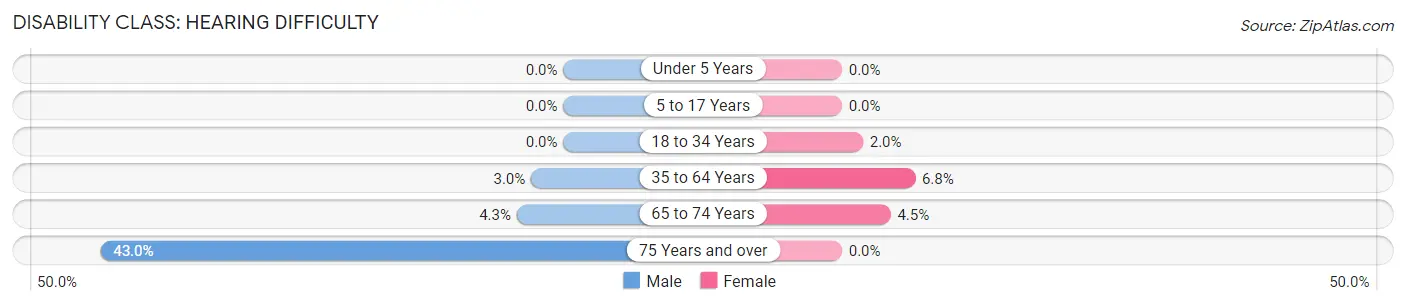
| Age Bracket | Male | Female |
| Under 5 Years | 0 (0.0%) | 0 (0.0%) |
| 5 to 17 Years | 0 (0.0%) | 0 (0.0%) |
| 18 to 34 Years | 0 (0.0%) | 9 (1.9%) |
| 35 to 64 Years | 23 (3.0%) | 53 (6.8%) |
| 65 to 74 Years | 8 (4.3%) | 9 (4.5%) |
| 75 Years and over | 55 (43.0%) | 0 (0.0%) |
Disability Class: Vision Difficulty
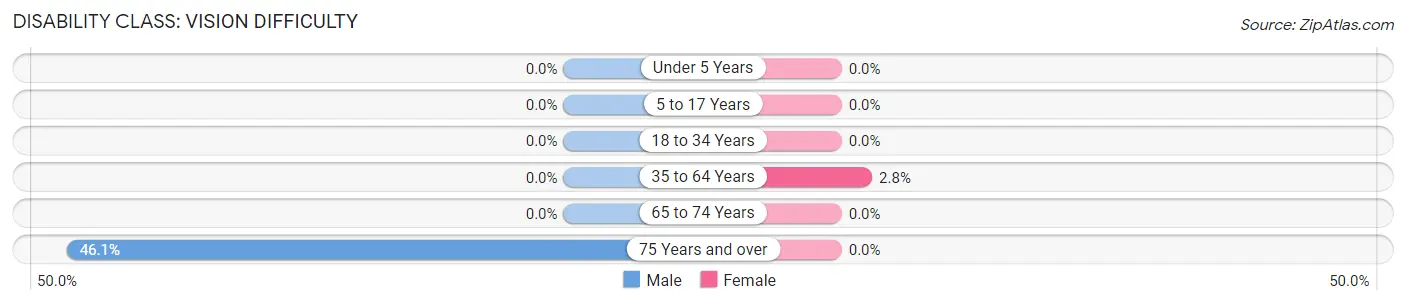
| Age Bracket | Male | Female |
| Under 5 Years | 0 (0.0%) | 0 (0.0%) |
| 5 to 17 Years | 0 (0.0%) | 0 (0.0%) |
| 18 to 34 Years | 0 (0.0%) | 0 (0.0%) |
| 35 to 64 Years | 0 (0.0%) | 22 (2.8%) |
| 65 to 74 Years | 0 (0.0%) | 0 (0.0%) |
| 75 Years and over | 59 (46.1%) | 0 (0.0%) |
Disability Class: Cognitive Difficulty
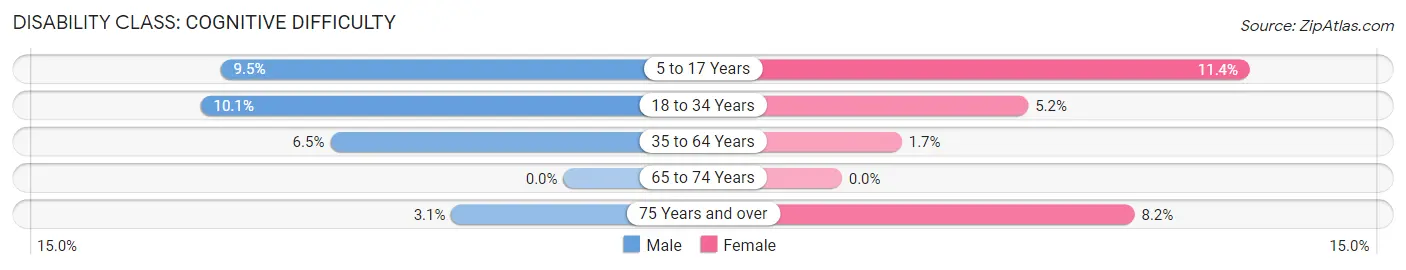
| Age Bracket | Male | Female |
| 5 to 17 Years | 29 (9.5%) | 15 (11.4%) |
| 18 to 34 Years | 51 (10.1%) | 24 (5.2%) |
| 35 to 64 Years | 50 (6.5%) | 13 (1.7%) |
| 65 to 74 Years | 0 (0.0%) | 0 (0.0%) |
| 75 Years and over | 4 (3.1%) | 15 (8.2%) |
Disability Class: Ambulatory Difficulty
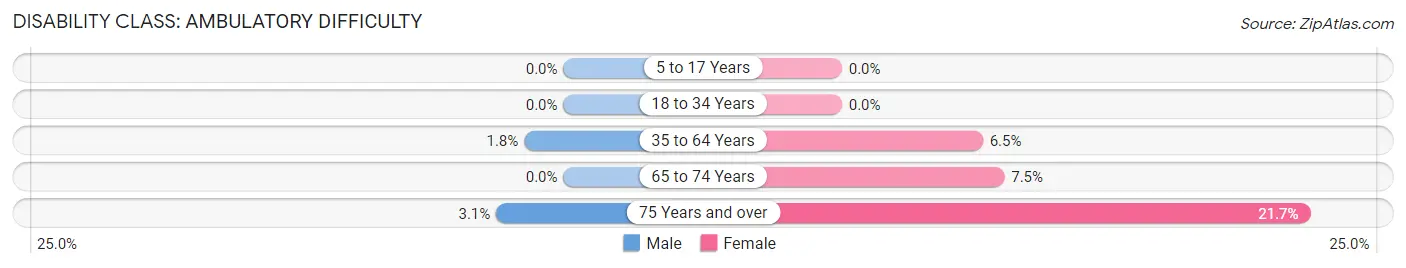
| Age Bracket | Male | Female |
| 5 to 17 Years | 0 (0.0%) | 0 (0.0%) |
| 18 to 34 Years | 0 (0.0%) | 0 (0.0%) |
| 35 to 64 Years | 14 (1.8%) | 51 (6.5%) |
| 65 to 74 Years | 0 (0.0%) | 15 (7.5%) |
| 75 Years and over | 4 (3.1%) | 40 (21.7%) |
Disability Class: Self-Care Difficulty
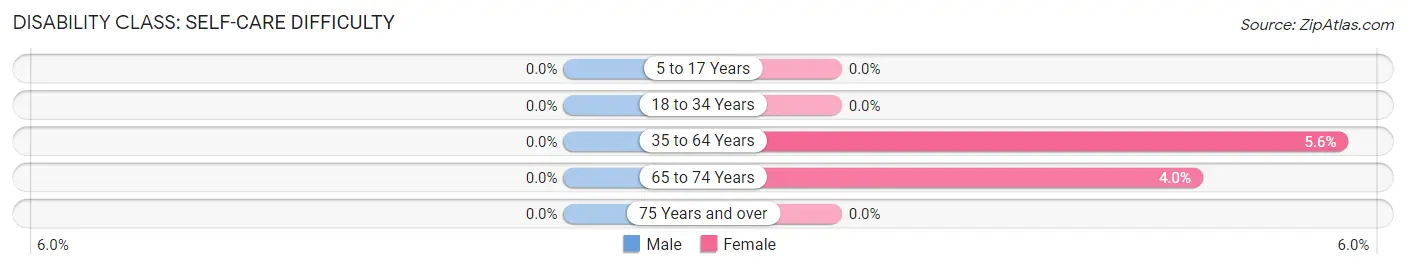
| Age Bracket | Male | Female |
| 5 to 17 Years | 0 (0.0%) | 0 (0.0%) |
| 18 to 34 Years | 0 (0.0%) | 0 (0.0%) |
| 35 to 64 Years | 0 (0.0%) | 44 (5.6%) |
| 65 to 74 Years | 0 (0.0%) | 8 (4.0%) |
| 75 Years and over | 0 (0.0%) | 0 (0.0%) |
Technology Access in Bordentown
Computing Device Access in Bordentown
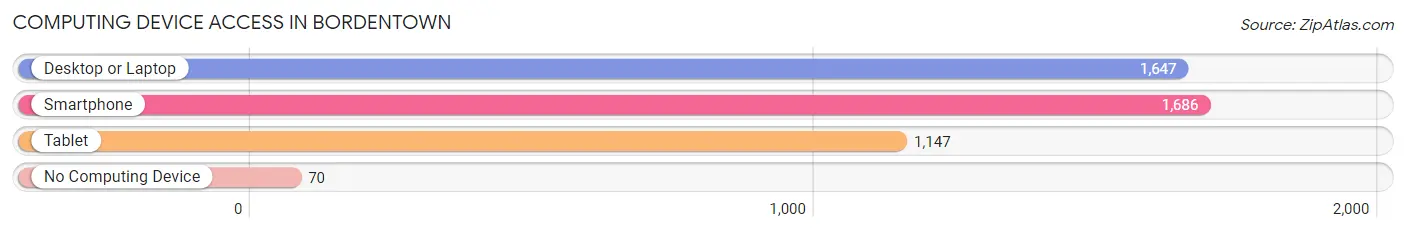
| Device Type | # Households | % Households |
| Desktop or Laptop | 1,647 | 89.1% |
| Smartphone | 1,686 | 91.2% |
| Tablet | 1,147 | 62.0% |
| No Computing Device | 70 | 3.8% |
| Total | 1,849 | 100.0% |
Internet Access in Bordentown
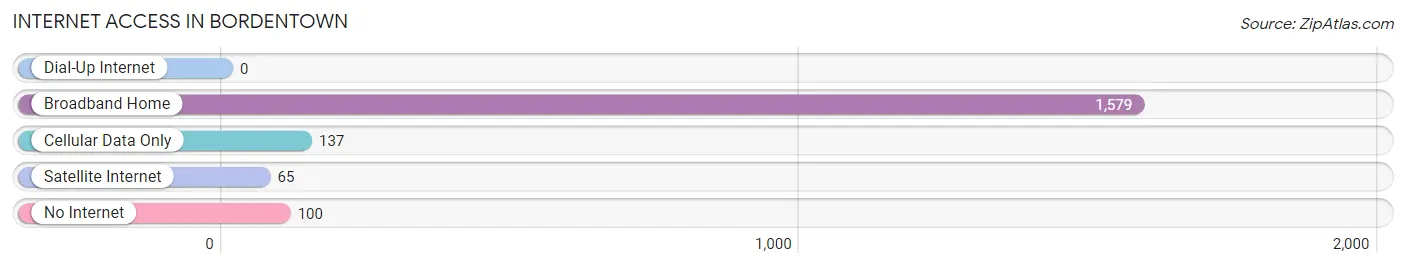
| Internet Type | # Households | % Households |
| Dial-Up Internet | 0 | 0.0% |
| Broadband Home | 1,579 | 85.4% |
| Cellular Data Only | 137 | 7.4% |
| Satellite Internet | 65 | 3.5% |
| No Internet | 100 | 5.4% |
| Total | 1,849 | 100.0% |
Bordentown Summary
Bordentown is a small city located in Burlington County, New Jersey. It is situated along the Delaware River, approximately 10 miles northeast of Trenton, the state capital. The city has a population of approximately 3,924 people, according to the 2010 United States Census.
History
Bordentown was founded in 1682 by Thomas Farnsworth, an English Quaker. The city was originally known as Farnsworth’s Landing, and was later renamed after Joseph Borden, who purchased the land in 1717. Borden was a prominent Quaker and a leader in the local community. He was also a successful merchant and shipbuilder, and his business interests helped to shape the city’s economy.
In the late 18th century, Bordentown became an important stop on the Underground Railroad. It was a safe haven for escaped slaves, and many of them settled in the city. During the Civil War, Bordentown was a major supply center for the Union Army.
Geography
Bordentown is located in the Delaware Valley, approximately 10 miles northeast of Trenton. The city is situated along the Delaware River, and is bordered by the towns of Florence, Fieldsboro, and Crosswicks. The city covers an area of 2.2 square miles, and has a population density of 1,764 people per square mile.
The city is located in a humid subtropical climate zone, and experiences hot, humid summers and cold, wet winters. The average annual temperature is 54 degrees Fahrenheit, and the average annual precipitation is 44 inches.
Economy
Bordentown’s economy is largely based on manufacturing and retail. The city is home to several large manufacturing companies, including Borden Chemical, Borden Foods, and Borden Plastics. The city also has a thriving retail sector, with several large shopping centers and a variety of small businesses.
The city is also home to several educational institutions, including the Bordentown Military Institute, the Bordentown School of Nursing, and the Bordentown Regional High School.
Demographics
According to the 2010 United States Census, the population of Bordentown was 3,924 people. The racial makeup of the city was 79.3% White, 14.2% African American, 0.3% Native American, 1.2% Asian, 0.1% Pacific Islander, and 4.9% from other races. The median household income was $50,945, and the median family income was $60,945.
Conclusion
Bordentown is a small city located in Burlington County, New Jersey. It was founded in 1682 by Thomas Farnsworth, and was later renamed after Joseph Borden. The city has a population of approximately 3,924 people, and is situated along the Delaware River. Bordentown’s economy is largely based on manufacturing and retail, and the city is home to several educational institutions. The racial makeup of the city is 79.3% White, 14.2% African American, 0.3% Native American, 1.2% Asian, 0.1% Pacific Islander, and 4.9% from other races. The median household income was $50,945, and the median family income was $60,945.
Common Questions
What is Per Capita Income in Bordentown?
Per Capita income in Bordentown is $48,757.
What is the Median Family Income in Bordentown?
Median Family Income in Bordentown is $115,307.
What is the Median Household income in Bordentown?
Median Household Income in Bordentown is $88,153.
What is Income or Wage Gap in Bordentown?
Income or Wage Gap in Bordentown is 10.7%.
Women in Bordentown earn 89.3 cents for every dollar earned by a man.
What is Inequality or Gini Index in Bordentown?
Inequality or Gini Index in Bordentown is 0.35.
What is the Total Population of Bordentown?
Total Population of Bordentown is 3,989.
What is the Total Male Population of Bordentown?
Total Male Population of Bordentown is 2,019.
What is the Total Female Population of Bordentown?
Total Female Population of Bordentown is 1,970.
What is the Ratio of Males per 100 Females in Bordentown?
There are 102.49 Males per 100 Females in Bordentown.
What is the Ratio of Females per 100 Males in Bordentown?
There are 97.57 Females per 100 Males in Bordentown.
What is the Median Population Age in Bordentown?
Median Population Age in Bordentown is 41.4 Years.
What is the Average Family Size in Bordentown
Average Family Size in Bordentown is 2.8 People.
What is the Average Household Size in Bordentown
Average Household Size in Bordentown is 2.1 People.
How Large is the Labor Force in Bordentown?
There are 2,383 People in the Labor Forcein in Bordentown.
What is the Percentage of People in the Labor Force in Bordentown?
71.3% of People are in the Labor Force in Bordentown.
What is the Unemployment Rate in Bordentown?
Unemployment Rate in Bordentown is 3.0%.