Linwood, NJ Map & Demographics
Linwood Map
Linwood Overview
$73,858
PER CAPITA INCOME
$156,737
AVG FAMILY INCOME
$133,487
AVG HOUSEHOLD INCOME
41.1%
WAGE / INCOME GAP [ % ]
58.9¢/ $1
WAGE / INCOME GAP [ $ ]
0.47
INEQUALITY / GINI INDEX
6,952
TOTAL POPULATION
3,203
MALE POPULATION
3,749
FEMALE POPULATION
85.44
MALES / 100 FEMALES
117.05
FEMALES / 100 MALES
48.2
MEDIAN AGE
3.0
AVG FAMILY SIZE
2.6
AVG HOUSEHOLD SIZE
3,682
LABOR FORCE [ PEOPLE ]
64.9%
PERCENT IN LABOR FORCE
5.4%
UNEMPLOYMENT RATE
Linwood Zip Codes
Income in Linwood
Income Overview in Linwood
Per Capita Income in Linwood is $73,858, while median incomes of families and households are $156,737 and $133,487 respectively.
| Characteristic | Number | Measure |
| Per Capita Income | 6,952 | $73,858 |
| Median Family Income | 1,961 | $156,737 |
| Mean Family Income | 1,961 | $228,601 |
| Median Household Income | 2,655 | $133,487 |
| Mean Household Income | 2,655 | $192,622 |
| Income Deficit | 1,961 | $0 |
| Wage / Income Gap (%) | 6,952 | 41.07% |
| Wage / Income Gap ($) | 6,952 | 58.93¢ per $1 |
| Gini / Inequality Index | 6,952 | 0.47 |
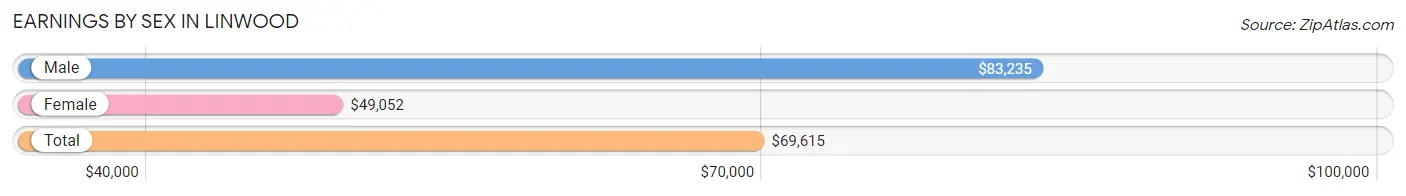
Earnings by Sex in Linwood
Average Earnings in Linwood are $69,615, $83,235 for men and $49,052 for women, a difference of 41.1%.
| Sex | Number | Average Earnings |
| Male | 1,926 (49.9%) | $83,235 |
| Female | 1,930 (50.0%) | $49,052 |
| Total | 3,856 (100.0%) | $69,615 |
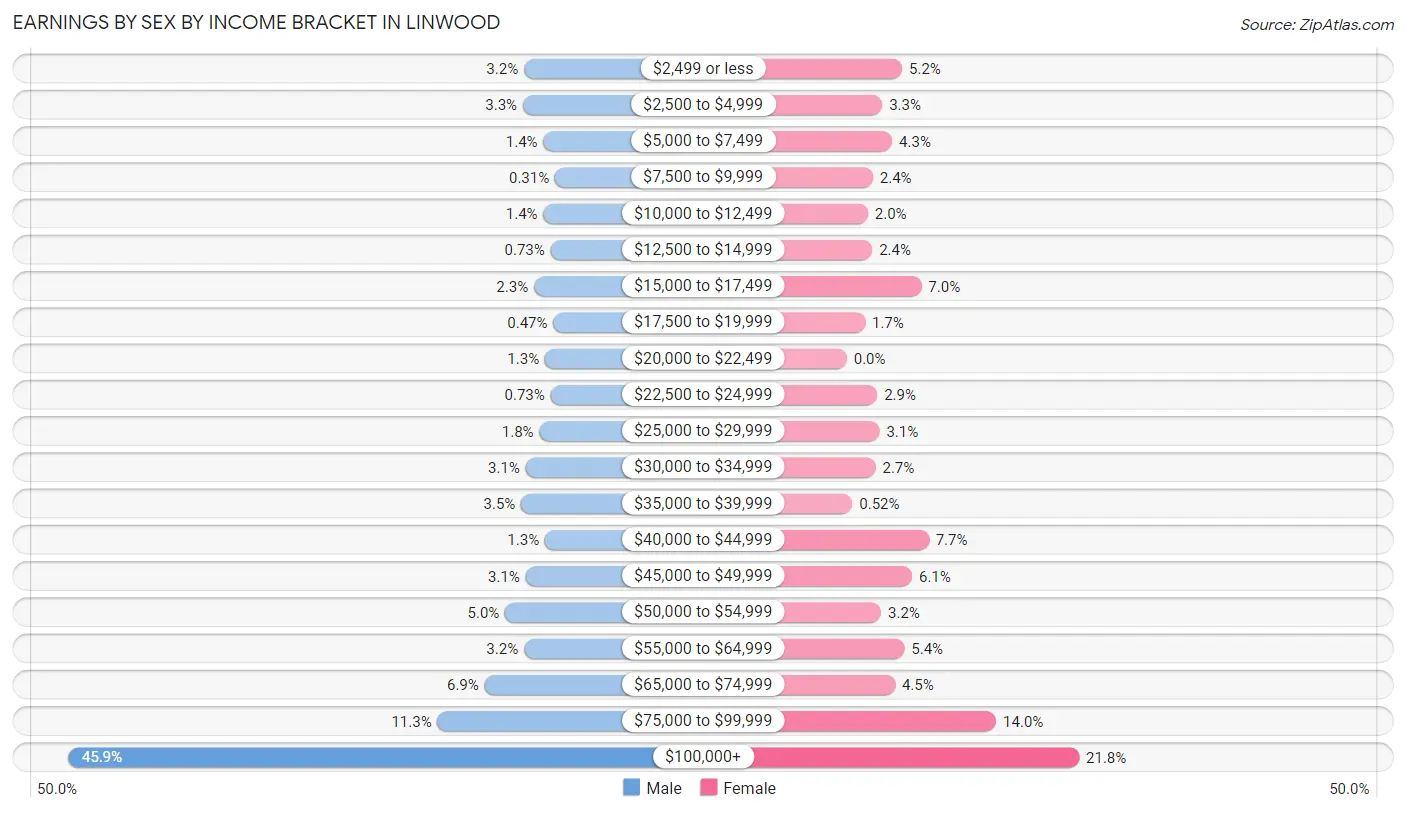
Earnings by Sex by Income Bracket in Linwood
The most common earnings brackets in Linwood are $100,000+ for men (883 | 45.9%) and $100,000+ for women (420 | 21.8%).
| Income | Male | Female |
| $2,499 or less | 62 (3.2%) | 100 (5.2%) |
| $2,500 to $4,999 | 64 (3.3%) | 64 (3.3%) |
| $5,000 to $7,499 | 27 (1.4%) | 82 (4.3%) |
| $7,500 to $9,999 | 6 (0.3%) | 47 (2.4%) |
| $10,000 to $12,499 | 27 (1.4%) | 38 (2.0%) |
| $12,500 to $14,999 | 14 (0.7%) | 46 (2.4%) |
| $15,000 to $17,499 | 44 (2.3%) | 135 (7.0%) |
| $17,500 to $19,999 | 9 (0.5%) | 33 (1.7%) |
| $20,000 to $22,499 | 24 (1.3%) | 0 (0.0%) |
| $22,500 to $24,999 | 14 (0.7%) | 55 (2.9%) |
| $25,000 to $29,999 | 34 (1.8%) | 59 (3.1%) |
| $30,000 to $34,999 | 59 (3.1%) | 52 (2.7%) |
| $35,000 to $39,999 | 67 (3.5%) | 10 (0.5%) |
| $40,000 to $44,999 | 24 (1.3%) | 148 (7.7%) |
| $45,000 to $49,999 | 59 (3.1%) | 118 (6.1%) |
| $50,000 to $54,999 | 96 (5.0%) | 62 (3.2%) |
| $55,000 to $64,999 | 62 (3.2%) | 104 (5.4%) |
| $65,000 to $74,999 | 133 (6.9%) | 87 (4.5%) |
| $75,000 to $99,999 | 218 (11.3%) | 270 (14.0%) |
| $100,000+ | 883 (45.9%) | 420 (21.8%) |
| Total | 1,926 (100.0%) | 1,930 (100.0%) |
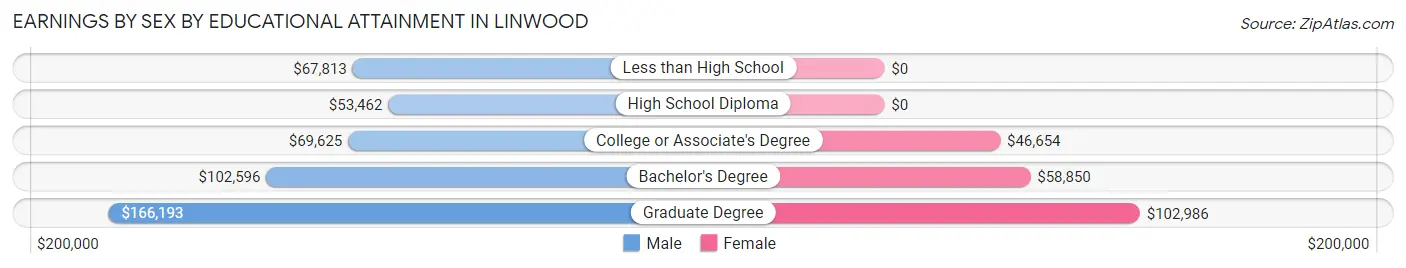
Earnings by Sex by Educational Attainment in Linwood
Average earnings in Linwood are $102,847 for men and $55,865 for women, a difference of 45.7%. Men with an educational attainment of graduate degree enjoy the highest average annual earnings of $166,193, while those with high school diploma education earn the least with $53,462. Women with an educational attainment of graduate degree earn the most with the average annual earnings of $102,986, while those with college or associate's degree education have the smallest earnings of $46,654.
| Educational Attainment | Male Income | Female Income |
| Less than High School | $67,813 | $0 |
| High School Diploma | $53,462 | $0 |
| College or Associate's Degree | $69,625 | $46,654 |
| Bachelor's Degree | $102,596 | $58,850 |
| Graduate Degree | $166,193 | $102,986 |
| Total | $102,847 | $55,865 |
Family Income in Linwood
Family Income Brackets in Linwood
According to the Linwood family income data, there are 722 families falling into the $200,000+ income range, which is the most common income bracket and makes up 36.8% of all families. Conversely, the $15,000 to $24,999 income bracket is the least frequent group with only 10 families (0.5%) belonging to this category.
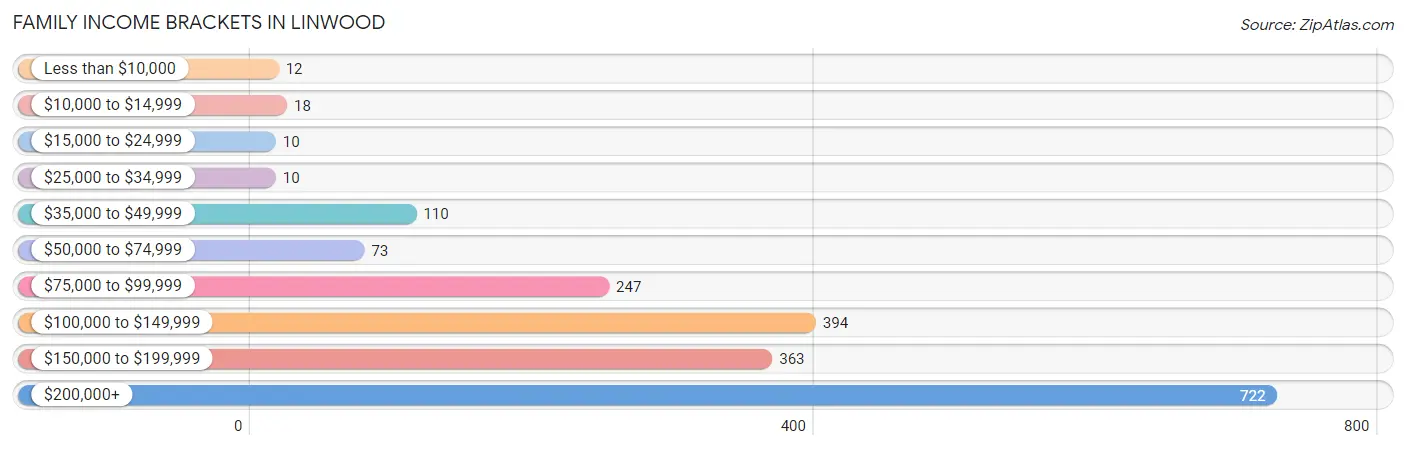
| Income Bracket | # Families | % Families |
| Less than $10,000 | 12 | 0.6% |
| $10,000 to $14,999 | 18 | 0.9% |
| $15,000 to $24,999 | 10 | 0.5% |
| $25,000 to $34,999 | 10 | 0.5% |
| $35,000 to $49,999 | 110 | 5.6% |
| $50,000 to $74,999 | 73 | 3.7% |
| $75,000 to $99,999 | 247 | 12.6% |
| $100,000 to $149,999 | 394 | 20.1% |
| $150,000 to $199,999 | 363 | 18.5% |
| $200,000+ | 722 | 36.8% |
Family Income by Famaliy Size in Linwood
6-person families (38 | 1.9%) account for the highest median family income in Linwood with $250,001 per family, while 2-person families (994 | 50.7%) have the highest median income of $63,542 per family member.
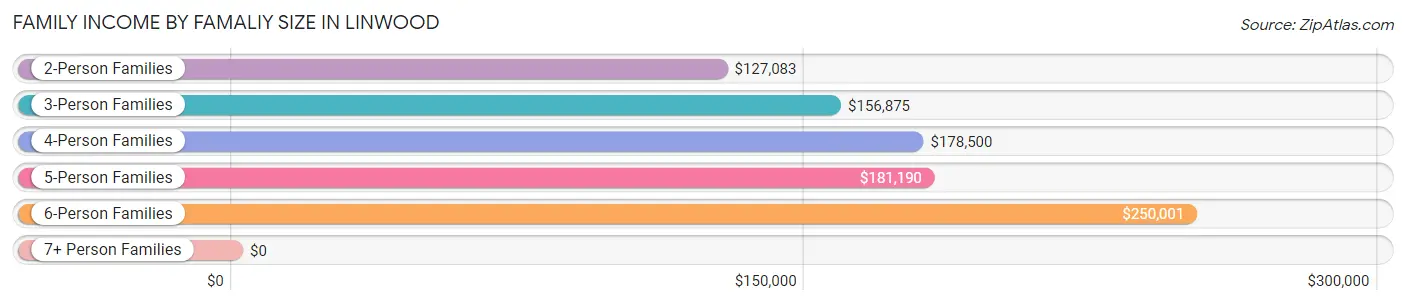
| Income Bracket | # Families | Median Income |
| 2-Person Families | 994 (50.7%) | $127,083 |
| 3-Person Families | 362 (18.5%) | $156,875 |
| 4-Person Families | 370 (18.9%) | $178,500 |
| 5-Person Families | 188 (9.6%) | $181,190 |
| 6-Person Families | 38 (1.9%) | $250,001 |
| 7+ Person Families | 9 (0.5%) | $0 |
| Total | 1,961 (100.0%) | $156,737 |
Family Income by Number of Earners in Linwood
The median family income in Linwood is $156,737, with families comprising 3+ earners (241) having the highest median family income of $185,268, while families with no earners (225) have the lowest median family income of $51,776, accounting for 12.3% and 11.5% of families, respectively.
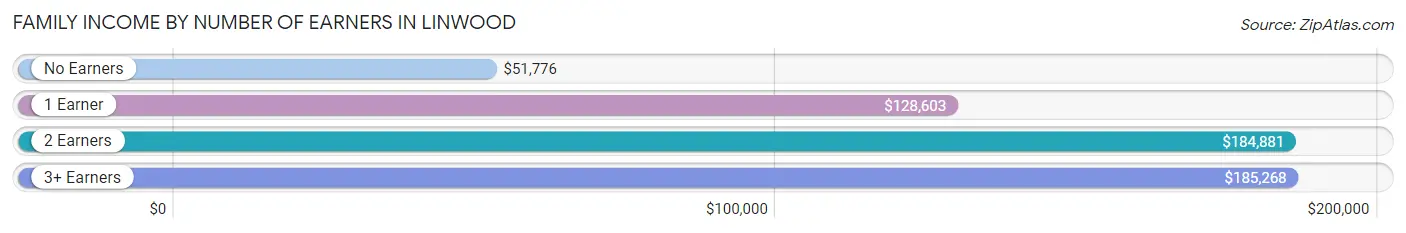
| Number of Earners | # Families | Median Income |
| No Earners | 225 (11.5%) | $51,776 |
| 1 Earner | 517 (26.4%) | $128,603 |
| 2 Earners | 978 (49.9%) | $184,881 |
| 3+ Earners | 241 (12.3%) | $185,268 |
| Total | 1,961 (100.0%) | $156,737 |
Household Income in Linwood
Household Income Brackets in Linwood
With 807 households falling in the category, the $200,000+ income range is the most frequent in Linwood, accounting for 30.4% of all households. In contrast, only 24 households (0.9%) fall into the $10,000 to $14,999 income bracket, making it the least populous group.
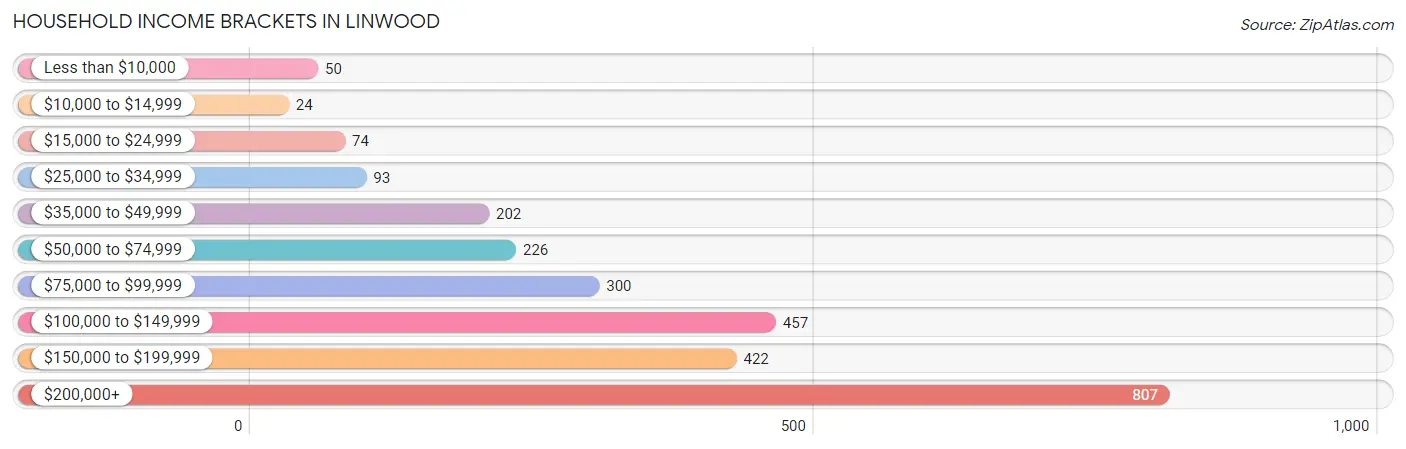
| Income Bracket | # Households | % Households |
| Less than $10,000 | 50 | 1.9% |
| $10,000 to $14,999 | 24 | 0.9% |
| $15,000 to $24,999 | 74 | 2.8% |
| $25,000 to $34,999 | 93 | 3.5% |
| $35,000 to $49,999 | 202 | 7.6% |
| $50,000 to $74,999 | 226 | 8.5% |
| $75,000 to $99,999 | 300 | 11.3% |
| $100,000 to $149,999 | 457 | 17.2% |
| $150,000 to $199,999 | 422 | 15.9% |
| $200,000+ | 807 | 30.4% |
Household Income by Householder Age in Linwood
The median household income in Linwood is $133,487, with the highest median household income of $167,500 found in the 45 to 64 years age bracket for the primary householder. A total of 1,136 households (42.8%) fall into this category. Meanwhile, the 15 to 24 years age bracket for the primary householder has the lowest median household income of $0, with 12 households (0.4%) in this group.
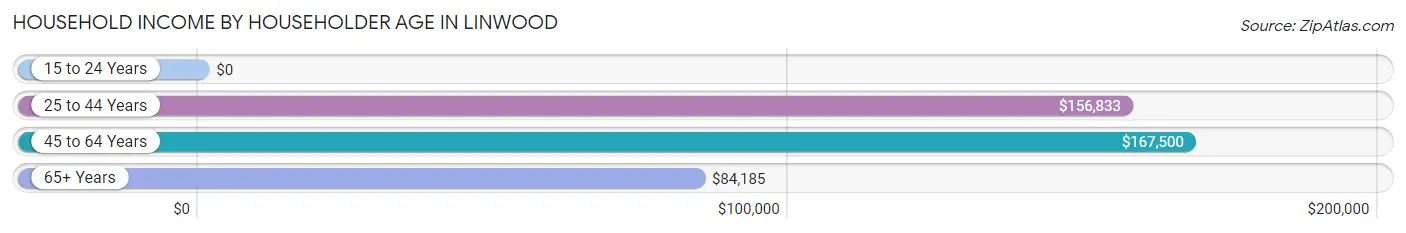
| Income Bracket | # Households | Median Income |
| 15 to 24 Years | 12 (0.4%) | $0 |
| 25 to 44 Years | 500 (18.8%) | $156,833 |
| 45 to 64 Years | 1,136 (42.8%) | $167,500 |
| 65+ Years | 1,007 (37.9%) | $84,185 |
| Total | 2,655 (100.0%) | $133,487 |
Poverty in Linwood
Income Below Poverty by Sex and Age in Linwood
With 2.3% poverty level for males and 3.4% for females among the residents of Linwood, 15 year old males and 6 to 11 year old females are the most vulnerable to poverty, with 10 males (32.3%) and 37 females (13.6%) in their respective age groups living below the poverty level.
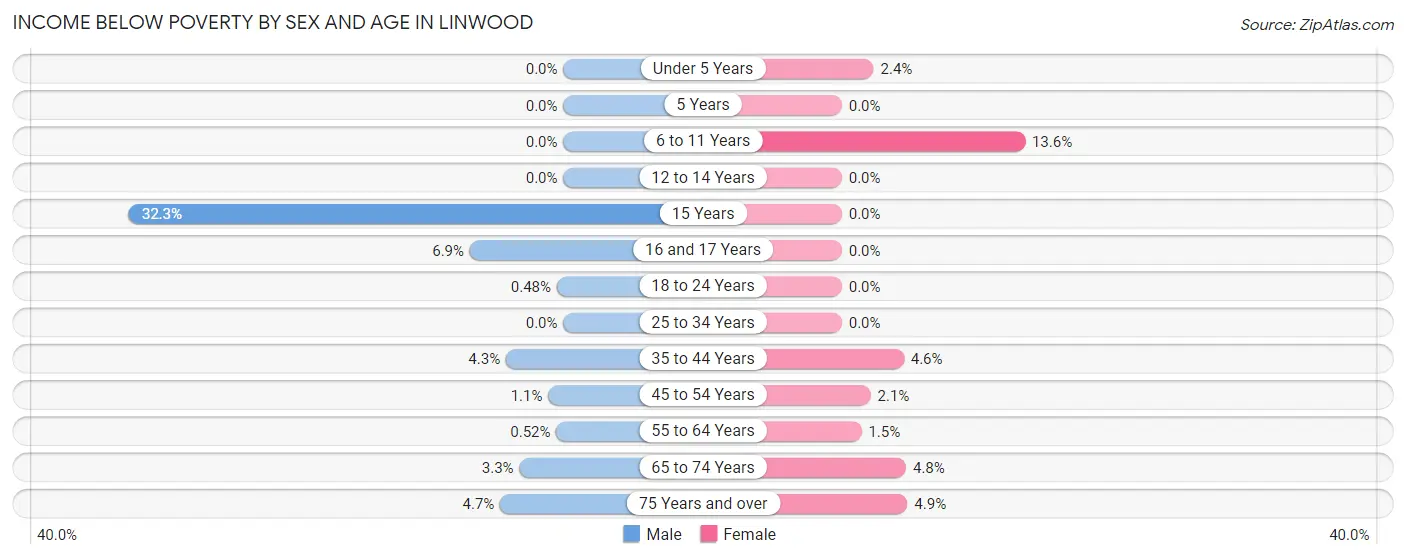
| Age Bracket | Male | Female |
| Under 5 Years | 0 (0.0%) | 5 (2.4%) |
| 5 Years | 0 (0.0%) | 0 (0.0%) |
| 6 to 11 Years | 0 (0.0%) | 37 (13.6%) |
| 12 to 14 Years | 0 (0.0%) | 0 (0.0%) |
| 15 Years | 10 (32.3%) | 0 (0.0%) |
| 16 and 17 Years | 10 (6.9%) | 0 (0.0%) |
| 18 to 24 Years | 1 (0.5%) | 0 (0.0%) |
| 25 to 34 Years | 0 (0.0%) | 0 (0.0%) |
| 35 to 44 Years | 18 (4.3%) | 19 (4.6%) |
| 45 to 54 Years | 5 (1.1%) | 11 (2.1%) |
| 55 to 64 Years | 2 (0.5%) | 10 (1.5%) |
| 65 to 74 Years | 13 (3.3%) | 20 (4.8%) |
| 75 Years and over | 13 (4.7%) | 22 (4.9%) |
| Total | 72 (2.3%) | 124 (3.4%) |
Income Above Poverty by Sex and Age in Linwood
According to the poverty statistics in Linwood, males aged under 5 years and females aged 5 years are the age groups that are most secure financially, with 100.0% of males and 100.0% of females in these age groups living above the poverty line.
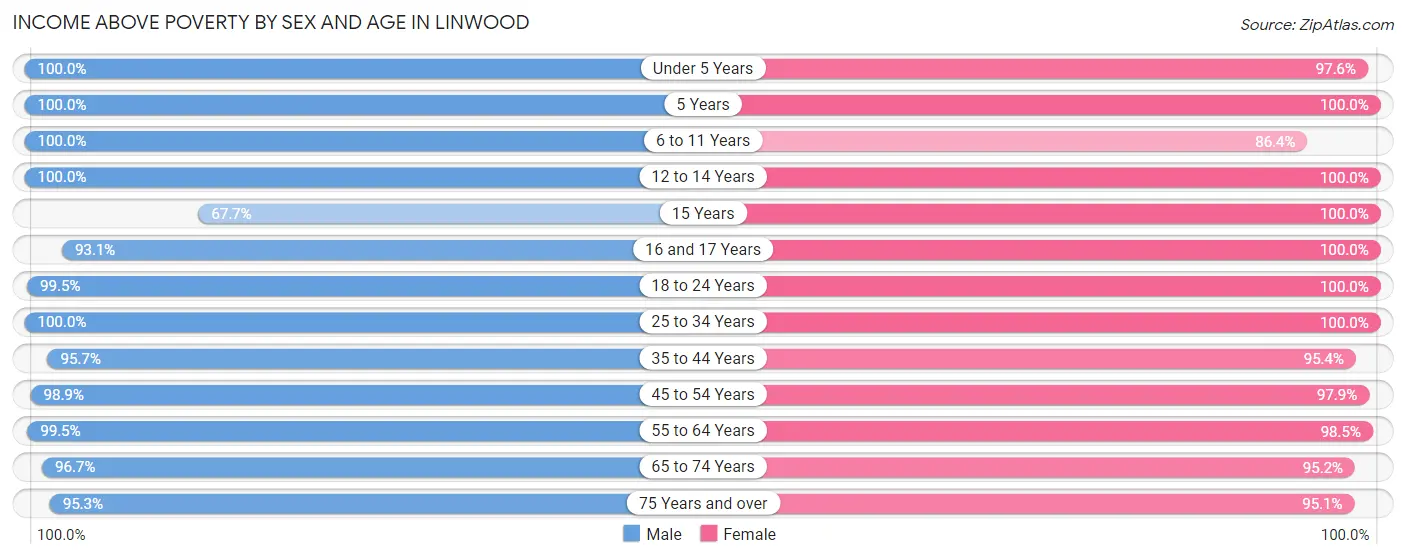
| Age Bracket | Male | Female |
| Under 5 Years | 136 (100.0%) | 207 (97.6%) |
| 5 Years | 26 (100.0%) | 60 (100.0%) |
| 6 to 11 Years | 298 (100.0%) | 235 (86.4%) |
| 12 to 14 Years | 74 (100.0%) | 142 (100.0%) |
| 15 Years | 21 (67.7%) | 27 (100.0%) |
| 16 and 17 Years | 134 (93.1%) | 38 (100.0%) |
| 18 to 24 Years | 206 (99.5%) | 270 (100.0%) |
| 25 to 34 Years | 283 (100.0%) | 180 (100.0%) |
| 35 to 44 Years | 405 (95.7%) | 394 (95.4%) |
| 45 to 54 Years | 441 (98.9%) | 504 (97.9%) |
| 55 to 64 Years | 386 (99.5%) | 677 (98.5%) |
| 65 to 74 Years | 386 (96.7%) | 399 (95.2%) |
| 75 Years and over | 264 (95.3%) | 430 (95.1%) |
| Total | 3,060 (97.7%) | 3,563 (96.6%) |
Income Below Poverty Among Married-Couple Families in Linwood
The poverty statistics for married-couple families in Linwood show that 1.5% or 25 of the total 1,621 families live below the poverty line. Families with 1 or 2 children have the highest poverty rate of 3.4%, comprising of 18 families. On the other hand, families with 3 or 4 children have the lowest poverty rate of 0.0%, which includes 0 families.
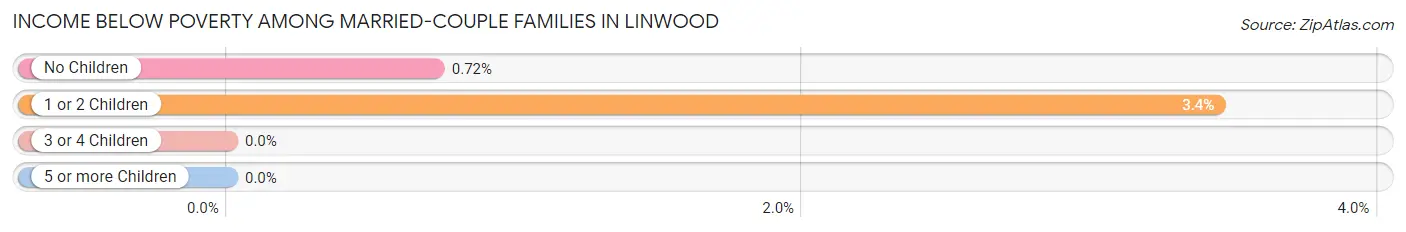
| Children | Above Poverty | Below Poverty |
| No Children | 972 (99.3%) | 7 (0.7%) |
| 1 or 2 Children | 506 (96.6%) | 18 (3.4%) |
| 3 or 4 Children | 117 (100.0%) | 0 (0.0%) |
| 5 or more Children | 1 (100.0%) | 0 (0.0%) |
| Total | 1,596 (98.5%) | 25 (1.5%) |
Income Below Poverty Among Single-Parent Households in Linwood
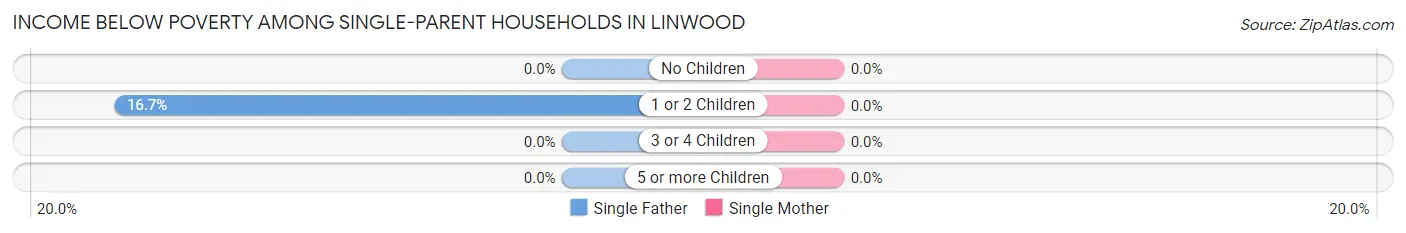
| Children | Single Father | Single Mother |
| No Children | 0 (0.0%) | 0 (0.0%) |
| 1 or 2 Children | 5 (16.7%) | 0 (0.0%) |
| 3 or 4 Children | 0 (0.0%) | 0 (0.0%) |
| 5 or more Children | 0 (0.0%) | 0 (0.0%) |
| Total | 5 (6.1%) | 0 (0.0%) |
Income Below Poverty Among Married-Couple vs Single-Parent Households in Linwood
The poverty data for Linwood shows that 25 of the married-couple family households (1.5%) and 5 of the single-parent households (1.5%) are living below the poverty level. Within the married-couple family households, those with 1 or 2 children have the highest poverty rate, with 18 households (3.4%) falling below the poverty line. Among the single-parent households, those with 1 or 2 children have the highest poverty rate, with 5 household (3.0%) living below poverty.
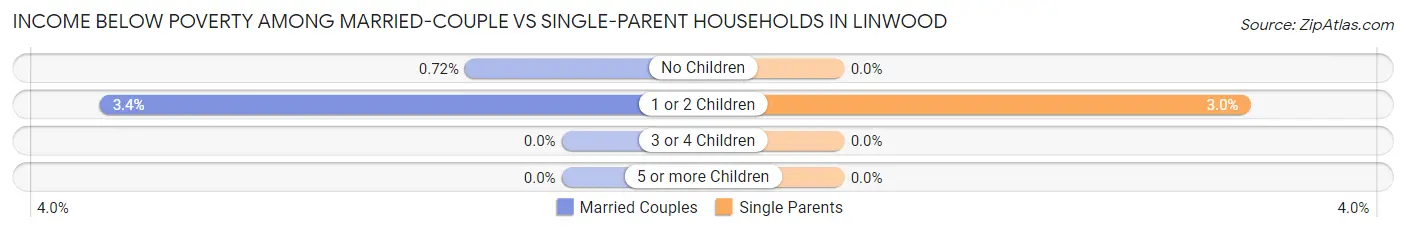
| Children | Married-Couple Families | Single-Parent Households |
| No Children | 7 (0.7%) | 0 (0.0%) |
| 1 or 2 Children | 18 (3.4%) | 5 (3.0%) |
| 3 or 4 Children | 0 (0.0%) | 0 (0.0%) |
| 5 or more Children | 0 (0.0%) | 0 (0.0%) |
| Total | 25 (1.5%) | 5 (1.5%) |
Race in Linwood
The most populous races in Linwood are White / Caucasian (5,865 | 84.4%), Hispanic or Latino (409 | 5.9%), and Asian (408 | 5.9%).
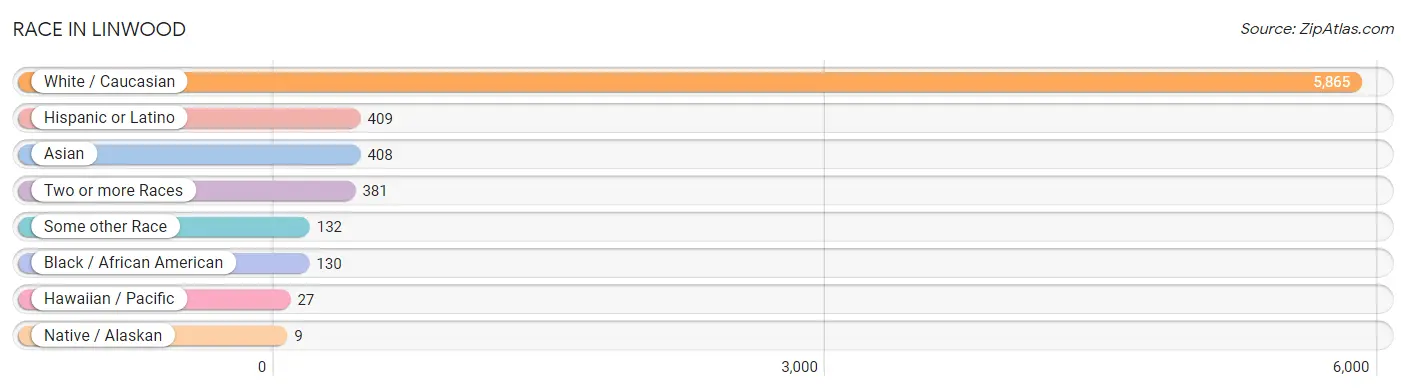
| Race | # Population | % Population |
| Asian | 408 | 5.9% |
| Black / African American | 130 | 1.9% |
| Hawaiian / Pacific | 27 | 0.4% |
| Hispanic or Latino | 409 | 5.9% |
| Native / Alaskan | 9 | 0.1% |
| White / Caucasian | 5,865 | 84.4% |
| Two or more Races | 381 | 5.5% |
| Some other Race | 132 | 1.9% |
| Total | 6,952 | 100.0% |
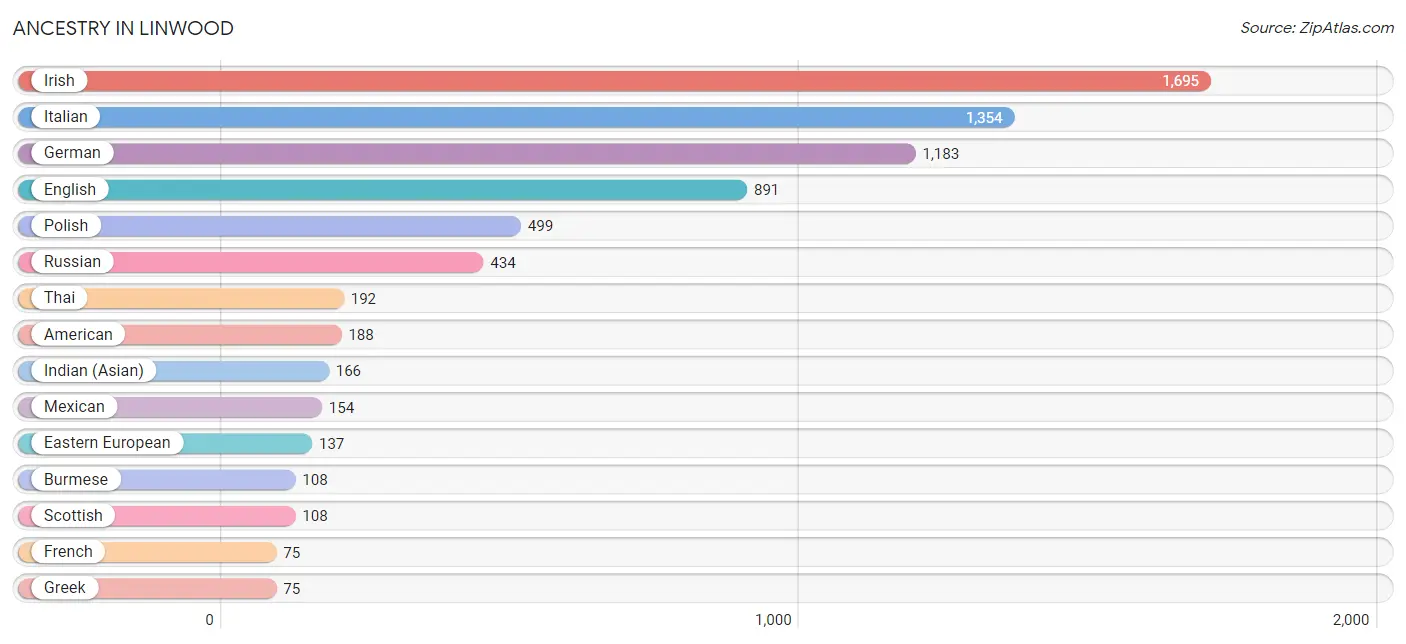
Ancestry in Linwood
The most populous ancestries reported in Linwood are Irish (1,695 | 24.4%), Italian (1,354 | 19.5%), German (1,183 | 17.0%), English (891 | 12.8%), and Polish (499 | 7.2%), together accounting for 80.9% of all Linwood residents.
| Ancestry | # Population | % Population |
| African | 16 | 0.2% |
| Alsatian | 8 | 0.1% |
| American | 188 | 2.7% |
| Arab | 41 | 0.6% |
| Argentinean | 4 | 0.1% |
| Armenian | 11 | 0.2% |
| Austrian | 62 | 0.9% |
| Bhutanese | 23 | 0.3% |
| British | 17 | 0.2% |
| Bulgarian | 17 | 0.2% |
| Burmese | 108 | 1.5% |
| Central American | 22 | 0.3% |
| Central American Indian | 9 | 0.1% |
| Croatian | 5 | 0.1% |
| Cuban | 15 | 0.2% |
| Cypriot | 8 | 0.1% |
| Czech | 35 | 0.5% |
| Czechoslovakian | 17 | 0.2% |
| Danish | 10 | 0.1% |
| Dominican | 40 | 0.6% |
| Dutch | 32 | 0.5% |
| Eastern European | 137 | 2.0% |
| Ecuadorian | 42 | 0.6% |
| Egyptian | 18 | 0.3% |
| English | 891 | 12.8% |
| European | 60 | 0.9% |
| French | 75 | 1.1% |
| French Canadian | 13 | 0.2% |
| German | 1,183 | 17.0% |
| Greek | 75 | 1.1% |
| Guamanian / Chamorro | 22 | 0.3% |
| Guatemalan | 22 | 0.3% |
| Haitian | 3 | 0.0% |
| Hungarian | 65 | 0.9% |
| Indian (Asian) | 166 | 2.4% |
| Iranian | 18 | 0.3% |
| Irish | 1,695 | 24.4% |
| Israeli | 1 | 0.0% |
| Italian | 1,354 | 19.5% |
| Jamaican | 3 | 0.0% |
| Korean | 31 | 0.4% |
| Latvian | 16 | 0.2% |
| Lebanese | 23 | 0.3% |
| Lithuanian | 43 | 0.6% |
| Mexican | 154 | 2.2% |
| Norwegian | 14 | 0.2% |
| Polish | 499 | 7.2% |
| Portuguese | 3 | 0.0% |
| Puerto Rican | 61 | 0.9% |
| Russian | 434 | 6.2% |
| Samoan | 8 | 0.1% |
| Scandinavian | 31 | 0.4% |
| Scotch-Irish | 37 | 0.5% |
| Scottish | 108 | 1.5% |
| Serbian | 15 | 0.2% |
| Slovak | 26 | 0.4% |
| South American | 46 | 0.7% |
| Spaniard | 5 | 0.1% |
| Sri Lankan | 51 | 0.7% |
| Subsaharan African | 16 | 0.2% |
| Swedish | 53 | 0.8% |
| Swiss | 8 | 0.1% |
| Thai | 192 | 2.8% |
| Trinidadian and Tobagonian | 25 | 0.4% |
| Ukrainian | 61 | 0.9% |
| Welsh | 13 | 0.2% |
| West Indian | 16 | 0.2% | View All 67 Rows |
Immigrants in Linwood
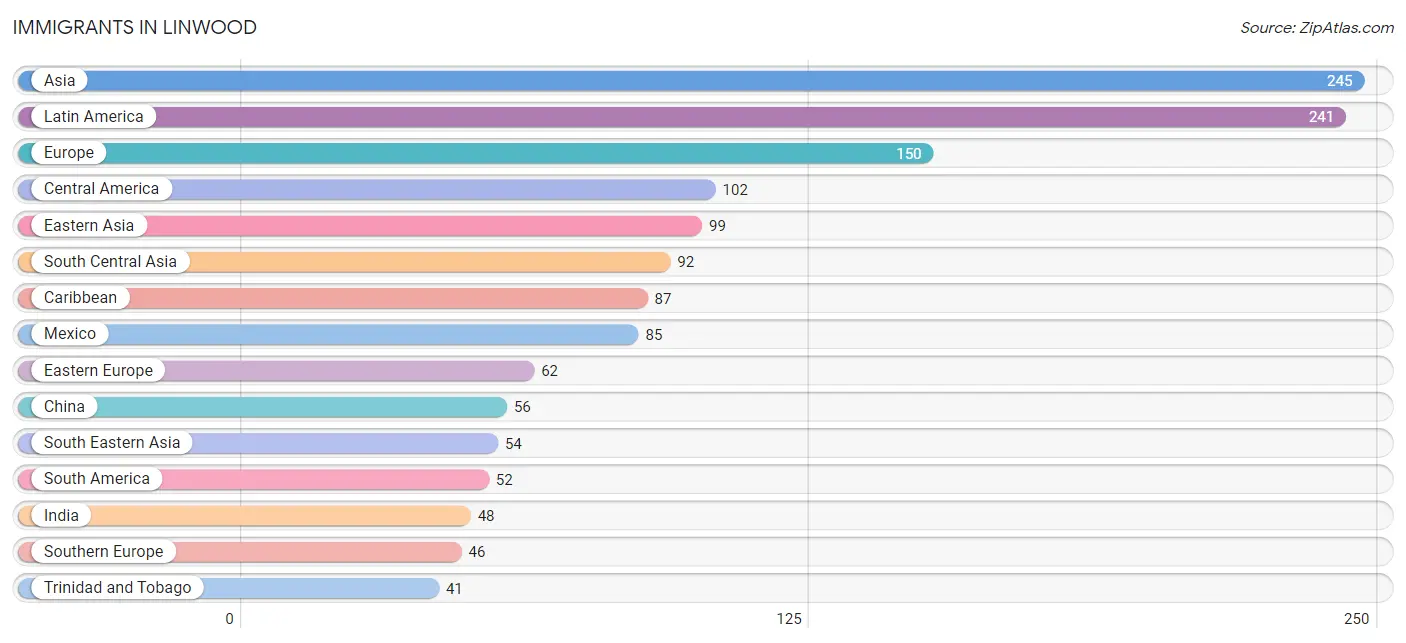
The most numerous immigrant groups reported in Linwood came from Asia (245 | 3.5%), Latin America (241 | 3.5%), Europe (150 | 2.2%), Central America (102 | 1.5%), and Eastern Asia (99 | 1.4%), together accounting for 12.0% of all Linwood residents.
| Immigration Origin | # Population | % Population |
| Africa | 21 | 0.3% |
| Argentina | 4 | 0.1% |
| Asia | 245 | 3.5% |
| Brazil | 12 | 0.2% |
| Bulgaria | 17 | 0.2% |
| Caribbean | 87 | 1.3% |
| Central America | 102 | 1.5% |
| China | 56 | 0.8% |
| Colombia | 6 | 0.1% |
| Congo | 3 | 0.0% |
| Cuba | 4 | 0.1% |
| Dominican Republic | 36 | 0.5% |
| Eastern Asia | 99 | 1.4% |
| Eastern Europe | 62 | 0.9% |
| Egypt | 18 | 0.3% |
| El Salvador | 10 | 0.1% |
| England | 18 | 0.3% |
| Europe | 150 | 2.2% |
| Germany | 5 | 0.1% |
| Greece | 18 | 0.3% |
| Guatemala | 7 | 0.1% |
| Haiti | 3 | 0.0% |
| India | 48 | 0.7% |
| Indonesia | 6 | 0.1% |
| Iran | 6 | 0.1% |
| Ireland | 6 | 0.1% |
| Italy | 28 | 0.4% |
| Jamaica | 3 | 0.0% |
| Japan | 6 | 0.1% |
| Korea | 37 | 0.5% |
| Latin America | 241 | 3.5% |
| Latvia | 9 | 0.1% |
| Malaysia | 11 | 0.2% |
| Mexico | 85 | 1.2% |
| Middle Africa | 3 | 0.0% |
| Northern Africa | 18 | 0.3% |
| Northern Europe | 37 | 0.5% |
| Oceania | 8 | 0.1% |
| Pakistan | 38 | 0.5% |
| Peru | 30 | 0.4% |
| Philippines | 18 | 0.3% |
| Poland | 33 | 0.5% |
| Russia | 3 | 0.0% |
| Scotland | 6 | 0.1% |
| South America | 52 | 0.7% |
| South Central Asia | 92 | 1.3% |
| South Eastern Asia | 54 | 0.8% |
| Southern Europe | 46 | 0.7% |
| Taiwan | 32 | 0.5% |
| Trinidad and Tobago | 41 | 0.6% |
| Vietnam | 19 | 0.3% |
| Western Europe | 5 | 0.1% | View All 52 Rows |
Sex and Age in Linwood
Sex and Age in Linwood
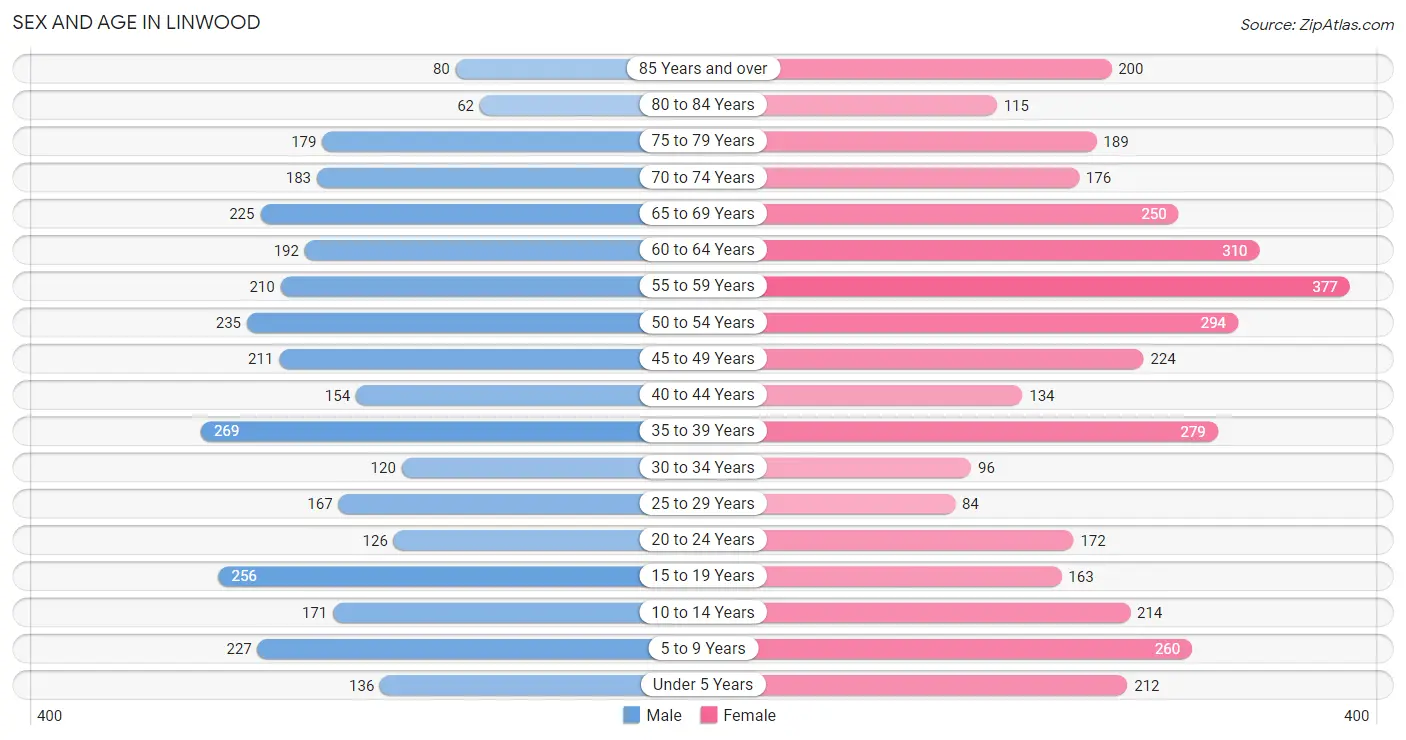
The most populous age groups in Linwood are 35 to 39 Years (269 | 8.4%) for men and 55 to 59 Years (377 | 10.1%) for women.
| Age Bracket | Male | Female |
| Under 5 Years | 136 (4.3%) | 212 (5.7%) |
| 5 to 9 Years | 227 (7.1%) | 260 (6.9%) |
| 10 to 14 Years | 171 (5.3%) | 214 (5.7%) |
| 15 to 19 Years | 256 (8.0%) | 163 (4.3%) |
| 20 to 24 Years | 126 (3.9%) | 172 (4.6%) |
| 25 to 29 Years | 167 (5.2%) | 84 (2.2%) |
| 30 to 34 Years | 120 (3.7%) | 96 (2.6%) |
| 35 to 39 Years | 269 (8.4%) | 279 (7.4%) |
| 40 to 44 Years | 154 (4.8%) | 134 (3.6%) |
| 45 to 49 Years | 211 (6.6%) | 224 (6.0%) |
| 50 to 54 Years | 235 (7.3%) | 294 (7.8%) |
| 55 to 59 Years | 210 (6.6%) | 377 (10.1%) |
| 60 to 64 Years | 192 (6.0%) | 310 (8.3%) |
| 65 to 69 Years | 225 (7.0%) | 250 (6.7%) |
| 70 to 74 Years | 183 (5.7%) | 176 (4.7%) |
| 75 to 79 Years | 179 (5.6%) | 189 (5.0%) |
| 80 to 84 Years | 62 (1.9%) | 115 (3.1%) |
| 85 Years and over | 80 (2.5%) | 200 (5.3%) |
| Total | 3,203 (100.0%) | 3,749 (100.0%) |
Families and Households in Linwood
Median Family Size in Linwood
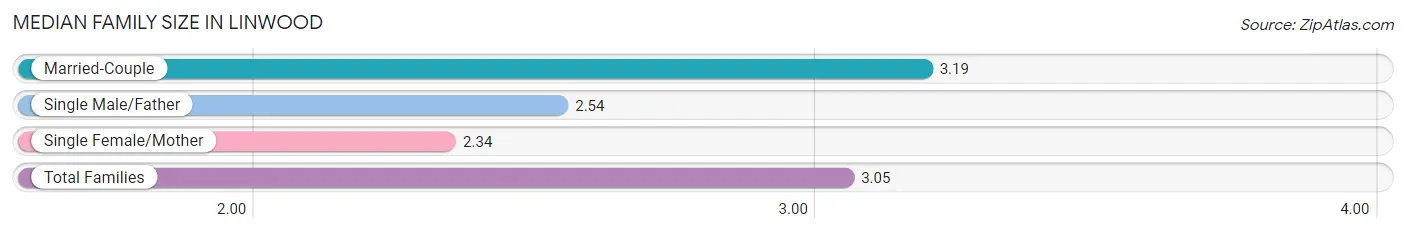
The median family size in Linwood is 3.05 persons per family, with married-couple families (1,621 | 82.7%) accounting for the largest median family size of 3.19 persons per family. On the other hand, single female/mother families (258 | 13.2%) represent the smallest median family size with 2.34 persons per family.
| Family Type | # Families | Family Size |
| Married-Couple | 1,621 (82.7%) | 3.19 |
| Single Male/Father | 82 (4.2%) | 2.54 |
| Single Female/Mother | 258 (13.2%) | 2.34 |
| Total Families | 1,961 (100.0%) | 3.05 |
Median Household Size in Linwood
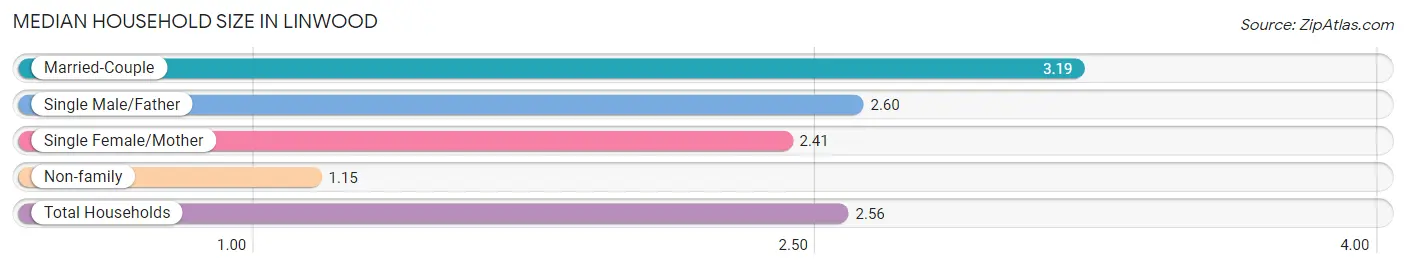
The median household size in Linwood is 2.56 persons per household, with married-couple households (1,621 | 61.1%) accounting for the largest median household size of 3.19 persons per household. non-family households (694 | 26.1%) represent the smallest median household size with 1.15 persons per household.
| Household Type | # Households | Household Size |
| Married-Couple | 1,621 (61.1%) | 3.19 |
| Single Male/Father | 82 (3.1%) | 2.60 |
| Single Female/Mother | 258 (9.7%) | 2.41 |
| Non-family | 694 (26.1%) | 1.15 |
| Total Households | 2,655 (100.0%) | 2.56 |
Household Size by Marriage Status in Linwood
Out of a total of 2,655 households in Linwood, 1,961 (73.9%) are family households, while 694 (26.1%) are nonfamily households. The most numerous type of family households are 2-person households, comprising 958, and the most common type of nonfamily households are 1-person households, comprising 619.
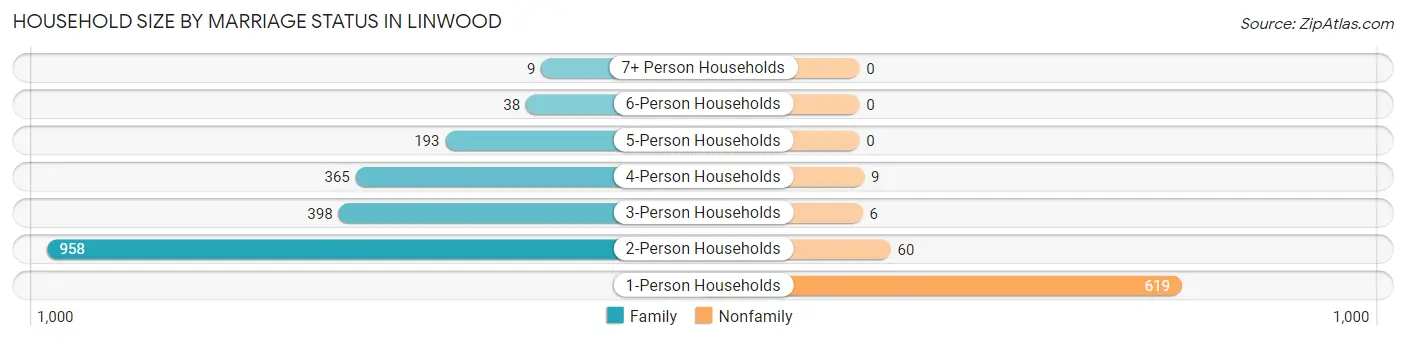
| Household Size | Family Households | Nonfamily Households |
| 1-Person Households | - | 619 (23.3%) |
| 2-Person Households | 958 (36.1%) | 60 (2.3%) |
| 3-Person Households | 398 (15.0%) | 6 (0.2%) |
| 4-Person Households | 365 (13.8%) | 9 (0.3%) |
| 5-Person Households | 193 (7.3%) | 0 (0.0%) |
| 6-Person Households | 38 (1.4%) | 0 (0.0%) |
| 7+ Person Households | 9 (0.3%) | 0 (0.0%) |
| Total | 1,961 (73.9%) | 694 (26.1%) |
Female Fertility in Linwood
Fertility by Age in Linwood
Average fertility rate in Linwood is 85.0 births per 1,000 women. Women in the age bracket of 20 to 34 years have the highest fertility rate with 151.0 births per 1,000 women. Women in the age bracket of 20 to 34 years acount for 51.5% of all women with births.
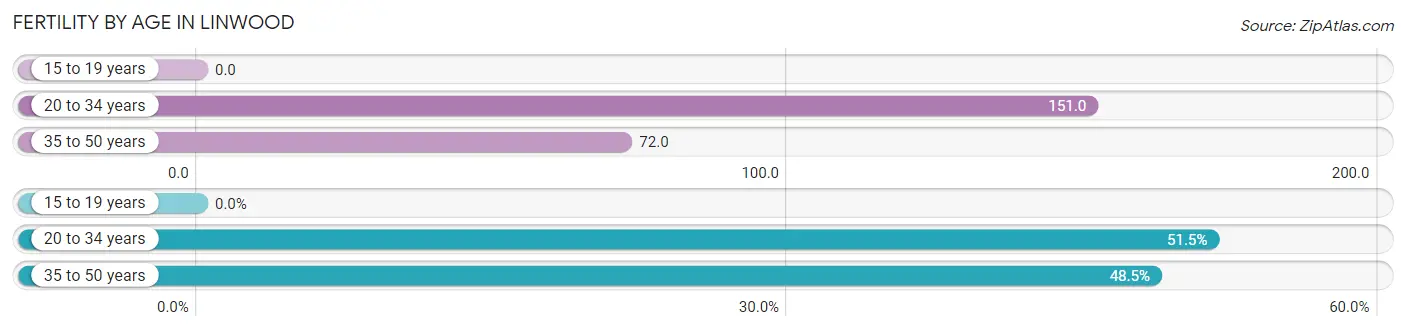
| Age Bracket | Women with Births | Births / 1,000 Women |
| 15 to 19 years | 0 (0.0%) | 0.0 |
| 20 to 34 years | 53 (51.5%) | 151.0 |
| 35 to 50 years | 50 (48.5%) | 72.0 |
| Total | 103 (100.0%) | 85.0 |
Fertility by Age by Marriage Status in Linwood
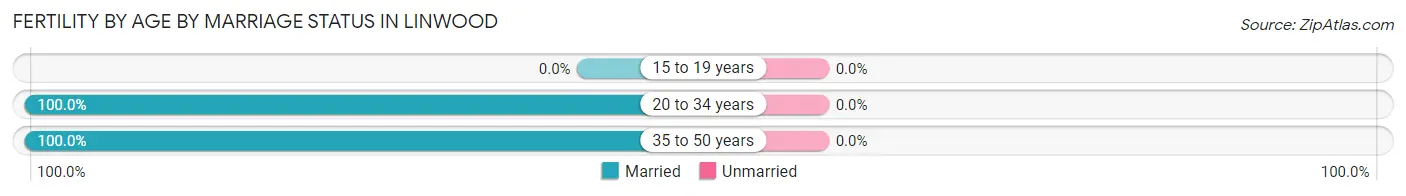
| Age Bracket | Married | Unmarried |
| 15 to 19 years | 0 (0.0%) | 0 (0.0%) |
| 20 to 34 years | 53 (100.0%) | 0 (0.0%) |
| 35 to 50 years | 50 (100.0%) | 0 (0.0%) |
| Total | 103 (100.0%) | 0 (0.0%) |
Fertility by Education in Linwood
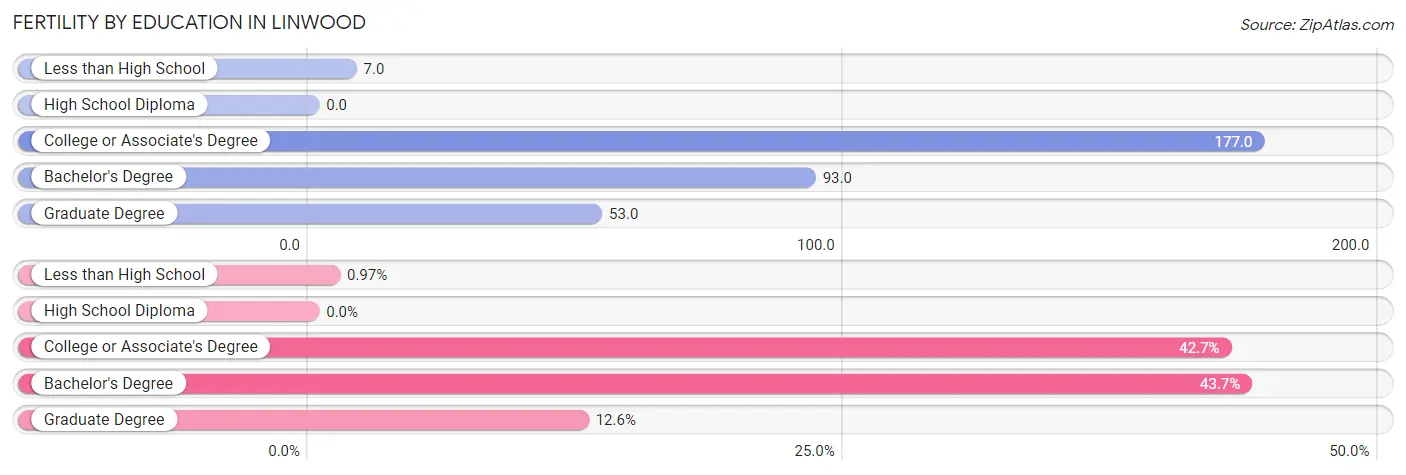
| Educational Attainment | Women with Births | Births / 1,000 Women |
| Less than High School | 1 (1.0%) | 7.0 |
| High School Diploma | 0 (0.0%) | 0.0 |
| College or Associate's Degree | 44 (42.7%) | 177.0 |
| Bachelor's Degree | 45 (43.7%) | 93.0 |
| Graduate Degree | 13 (12.6%) | 53.0 |
| Total | 103 (100.0%) | 85.0 |
Fertility by Education by Marriage Status in Linwood
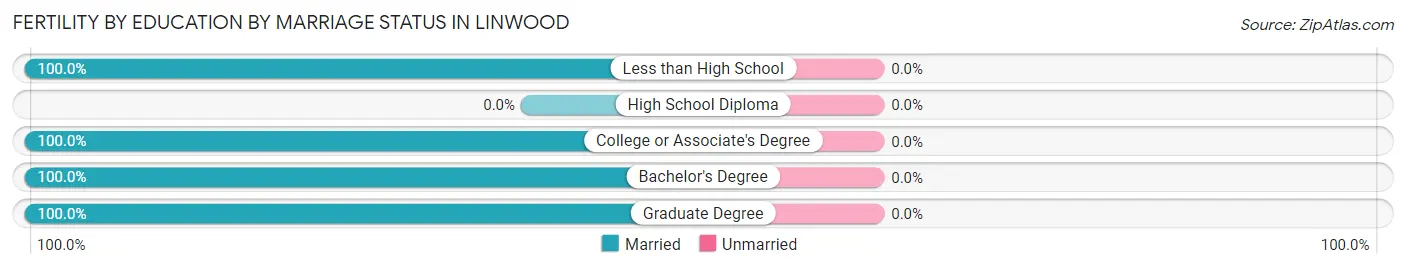
| Educational Attainment | Married | Unmarried |
| Less than High School | 1 (100.0%) | 0 (0.0%) |
| High School Diploma | 0 (0.0%) | 0 (0.0%) |
| College or Associate's Degree | 44 (100.0%) | 0 (0.0%) |
| Bachelor's Degree | 45 (100.0%) | 0 (0.0%) |
| Graduate Degree | 13 (100.0%) | 0 (0.0%) |
| Total | 103 (100.0%) | 0 (0.0%) |
Employment Characteristics in Linwood
Employment by Class of Employer in Linwood
Among the 3,441 employed individuals in Linwood, private company employees (2,075 | 60.3%), local government employees (421 | 12.2%), and self-employed (not incorporated) (285 | 8.3%) make up the most common classes of employment.
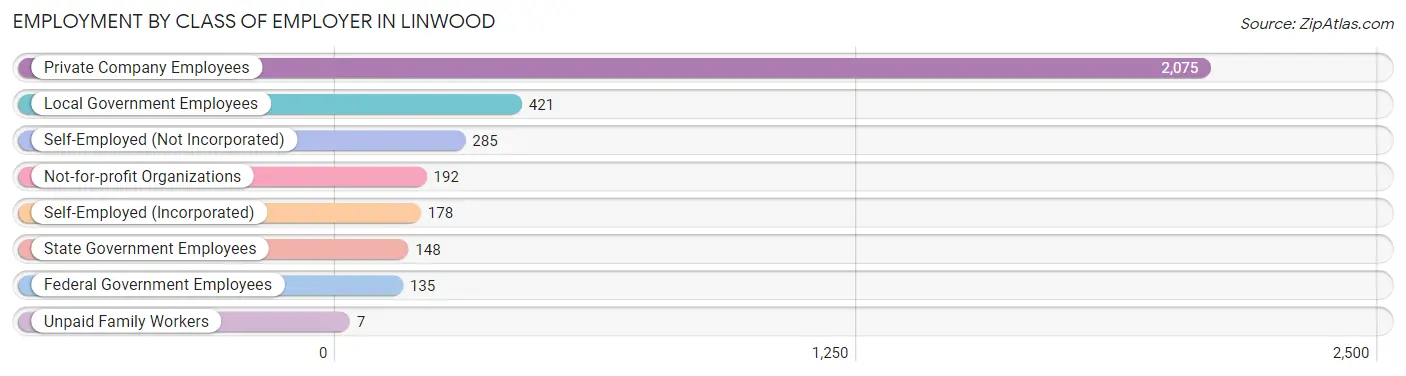
| Employer Class | # Employees | % Employees |
| Private Company Employees | 2,075 | 60.3% |
| Self-Employed (Incorporated) | 178 | 5.2% |
| Self-Employed (Not Incorporated) | 285 | 8.3% |
| Not-for-profit Organizations | 192 | 5.6% |
| Local Government Employees | 421 | 12.2% |
| State Government Employees | 148 | 4.3% |
| Federal Government Employees | 135 | 3.9% |
| Unpaid Family Workers | 7 | 0.2% |
| Total | 3,441 | 100.0% |
Employment Status by Age in Linwood
According to the labor force statistics for Linwood, out of the total population over 16 years of age (5,674), 64.9% or 3,682 individuals are in the labor force, with 5.4% or 199 of them unemployed. The age group with the highest labor force participation rate is 25 to 29 years, with 95.2% or 239 individuals in the labor force. Within the labor force, the 16 to 19 years age range has the highest percentage of unemployed individuals, with 36.5% or 50 of them being unemployed.
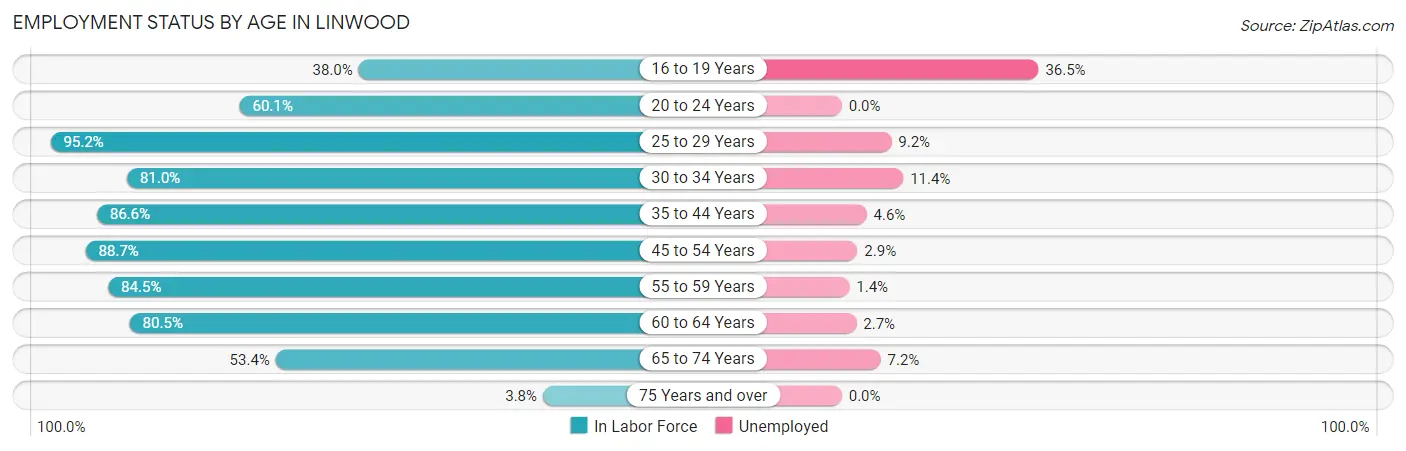
| Age Bracket | In Labor Force | Unemployed |
| 16 to 19 Years | 137 (38.0%) | 50 (36.5%) |
| 20 to 24 Years | 179 (60.1%) | 0 (0.0%) |
| 25 to 29 Years | 239 (95.2%) | 22 (9.2%) |
| 30 to 34 Years | 175 (81.0%) | 20 (11.4%) |
| 35 to 44 Years | 724 (86.6%) | 33 (4.6%) |
| 45 to 54 Years | 855 (88.7%) | 25 (2.9%) |
| 55 to 59 Years | 496 (84.5%) | 7 (1.4%) |
| 60 to 64 Years | 404 (80.5%) | 11 (2.7%) |
| 65 to 74 Years | 445 (53.4%) | 32 (7.2%) |
| 75 Years and over | 31 (3.8%) | 0 (0.0%) |
| Total | 3,682 (64.9%) | 199 (5.4%) |
Employment Status by Educational Attainment in Linwood
According to labor force statistics for Linwood, 86.2% of individuals (2,893) out of the total population between 25 and 64 years of age (3,356) are in the labor force, with 4.1% or 119 of them being unemployed. The group with the highest labor force participation rate are those with the educational attainment of high school diploma, with 92.0% or 404 individuals in the labor force. Within the labor force, individuals with high school diploma education have the highest percentage of unemployment, with 5.2% or 21 of them being unemployed.
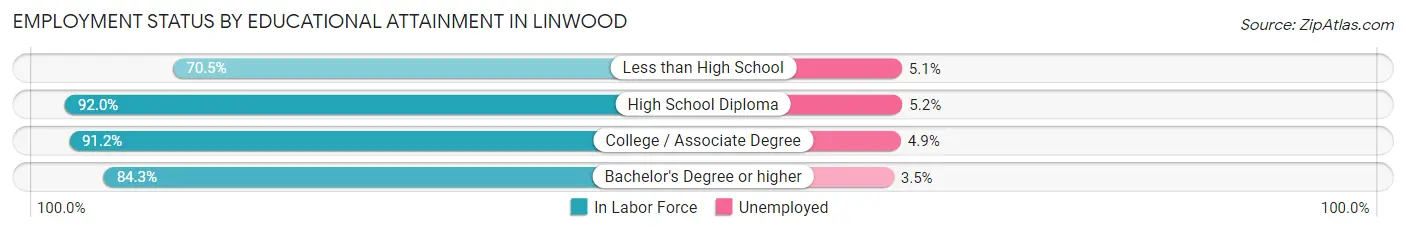
| Educational Attainment | In Labor Force | Unemployed |
| Less than High School | 98 (70.5%) | 7 (5.1%) |
| High School Diploma | 404 (92.0%) | 23 (5.2%) |
| College / Associate Degree | 636 (91.2%) | 34 (4.9%) |
| Bachelor's Degree or higher | 1,754 (84.3%) | 73 (3.5%) |
| Total | 2,893 (86.2%) | 138 (4.1%) |
Employment Occupations by Sex in Linwood
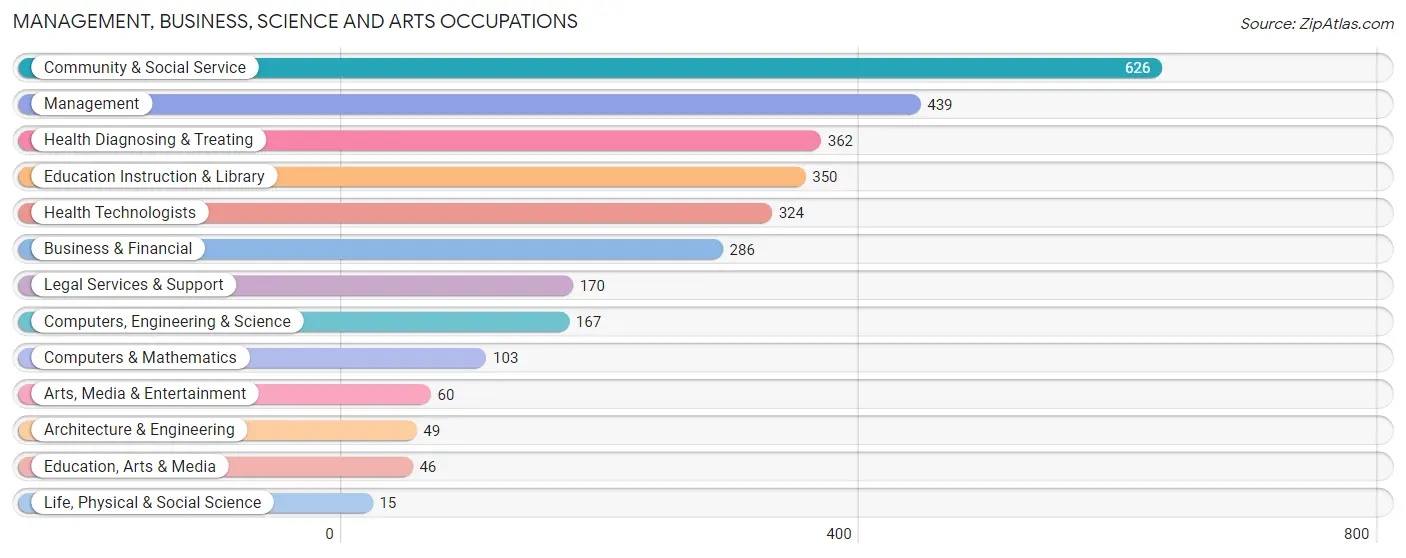
Management, Business, Science and Arts Occupations
The most common Management, Business, Science and Arts occupations in Linwood are Community & Social Service (626 | 18.0%), Management (439 | 12.6%), Health Diagnosing & Treating (362 | 10.4%), Education Instruction & Library (350 | 10.0%), and Health Technologists (324 | 9.3%).
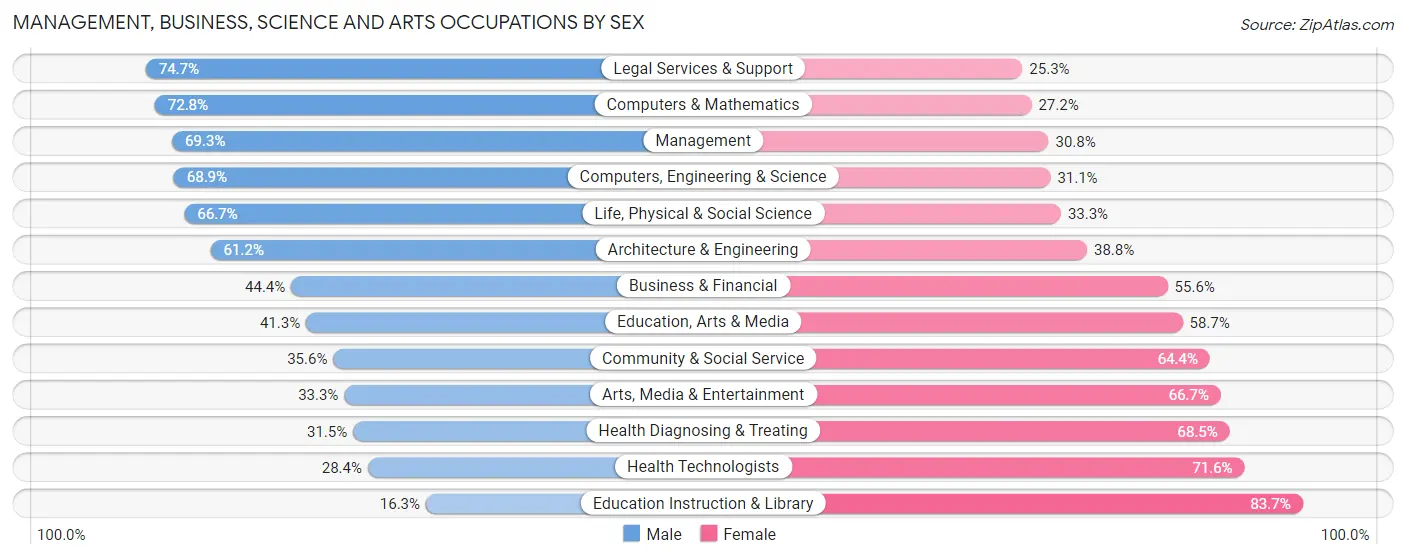
Management, Business, Science and Arts Occupations by Sex
Within the Management, Business, Science and Arts occupations in Linwood, the most male-oriented occupations are Legal Services & Support (74.7%), Computers & Mathematics (72.8%), and Management (69.3%), while the most female-oriented occupations are Education Instruction & Library (83.7%), Health Technologists (71.6%), and Health Diagnosing & Treating (68.5%).
| Occupation | Male | Female |
| Management | 304 (69.3%) | 135 (30.7%) |
| Business & Financial | 127 (44.4%) | 159 (55.6%) |
| Computers, Engineering & Science | 115 (68.9%) | 52 (31.1%) |
| Computers & Mathematics | 75 (72.8%) | 28 (27.2%) |
| Architecture & Engineering | 30 (61.2%) | 19 (38.8%) |
| Life, Physical & Social Science | 10 (66.7%) | 5 (33.3%) |
| Community & Social Service | 223 (35.6%) | 403 (64.4%) |
| Education, Arts & Media | 19 (41.3%) | 27 (58.7%) |
| Legal Services & Support | 127 (74.7%) | 43 (25.3%) |
| Education Instruction & Library | 57 (16.3%) | 293 (83.7%) |
| Arts, Media & Entertainment | 20 (33.3%) | 40 (66.7%) |
| Health Diagnosing & Treating | 114 (31.5%) | 248 (68.5%) |
| Health Technologists | 92 (28.4%) | 232 (71.6%) |
| Total (Category) | 883 (47.0%) | 997 (53.0%) |
| Total (Overall) | 1,787 (51.3%) | 1,698 (48.7%) |
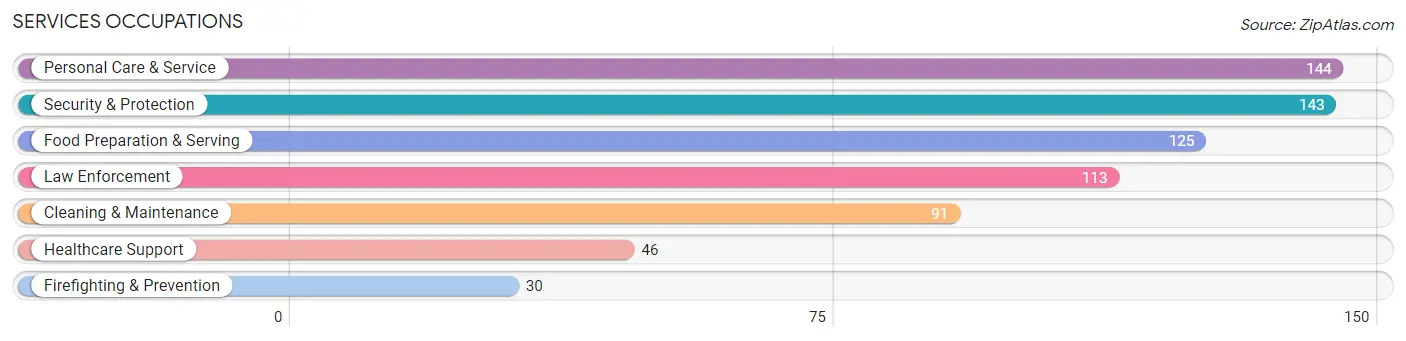
Services Occupations
The most common Services occupations in Linwood are Personal Care & Service (144 | 4.1%), Security & Protection (143 | 4.1%), Food Preparation & Serving (125 | 3.6%), Law Enforcement (113 | 3.2%), and Cleaning & Maintenance (91 | 2.6%).
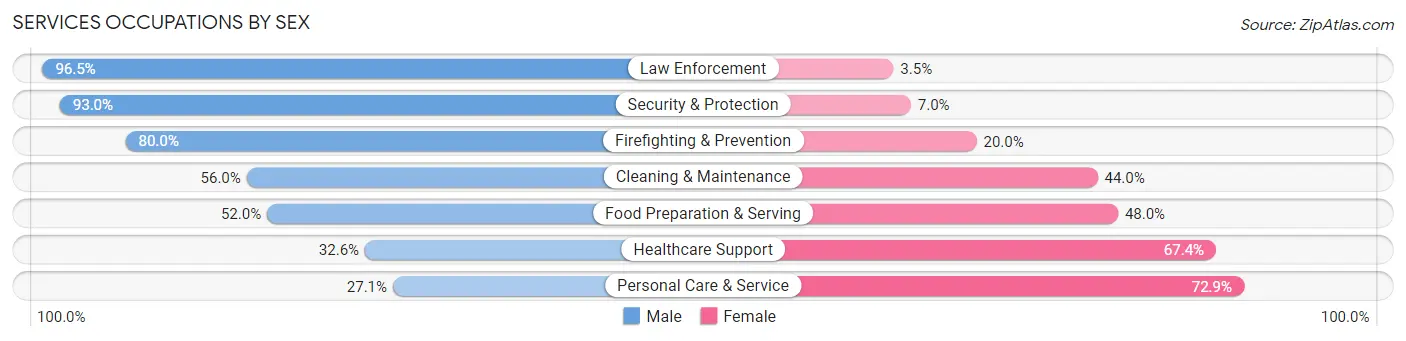
Services Occupations by Sex
Within the Services occupations in Linwood, the most male-oriented occupations are Law Enforcement (96.5%), Security & Protection (93.0%), and Firefighting & Prevention (80.0%), while the most female-oriented occupations are Personal Care & Service (72.9%), Healthcare Support (67.4%), and Food Preparation & Serving (48.0%).
| Occupation | Male | Female |
| Healthcare Support | 15 (32.6%) | 31 (67.4%) |
| Security & Protection | 133 (93.0%) | 10 (7.0%) |
| Firefighting & Prevention | 24 (80.0%) | 6 (20.0%) |
| Law Enforcement | 109 (96.5%) | 4 (3.5%) |
| Food Preparation & Serving | 65 (52.0%) | 60 (48.0%) |
| Cleaning & Maintenance | 51 (56.0%) | 40 (44.0%) |
| Personal Care & Service | 39 (27.1%) | 105 (72.9%) |
| Total (Category) | 303 (55.2%) | 246 (44.8%) |
| Total (Overall) | 1,787 (51.3%) | 1,698 (48.7%) |
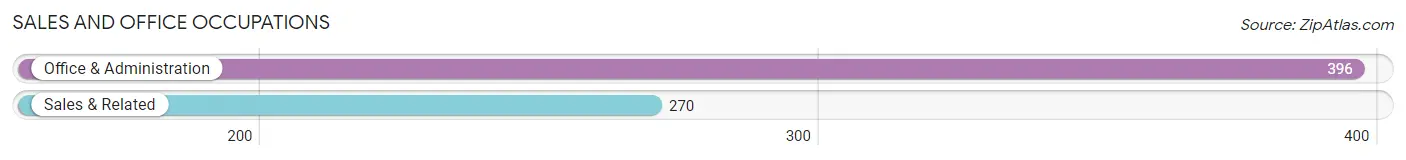
Sales and Office Occupations
The most common Sales and Office occupations in Linwood are Office & Administration (396 | 11.4%), and Sales & Related (270 | 7.7%).
Sales and Office Occupations by Sex
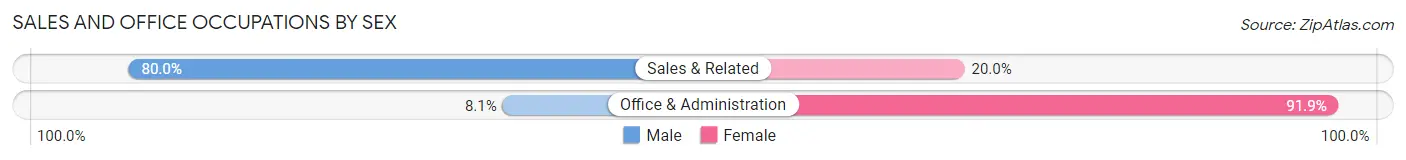
| Occupation | Male | Female |
| Sales & Related | 216 (80.0%) | 54 (20.0%) |
| Office & Administration | 32 (8.1%) | 364 (91.9%) |
| Total (Category) | 248 (37.2%) | 418 (62.8%) |
| Total (Overall) | 1,787 (51.3%) | 1,698 (48.7%) |
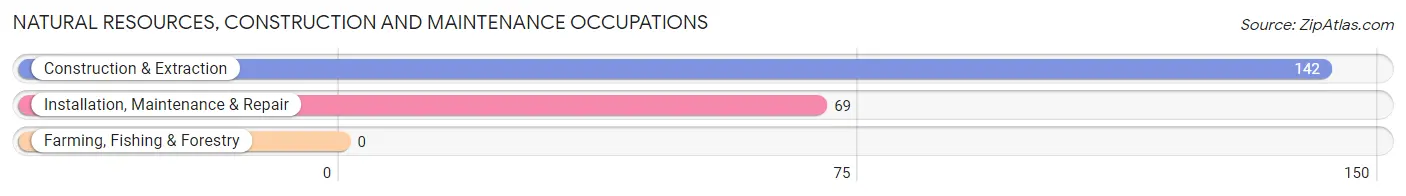
Natural Resources, Construction and Maintenance Occupations
The most common Natural Resources, Construction and Maintenance occupations in Linwood are Construction & Extraction (142 | 4.1%), and Installation, Maintenance & Repair (69 | 2.0%).
Natural Resources, Construction and Maintenance Occupations by Sex
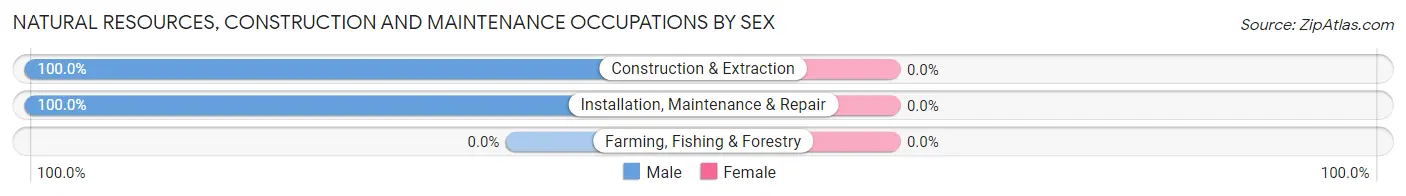
| Occupation | Male | Female |
| Farming, Fishing & Forestry | 0 (0.0%) | 0 (0.0%) |
| Construction & Extraction | 142 (100.0%) | 0 (0.0%) |
| Installation, Maintenance & Repair | 69 (100.0%) | 0 (0.0%) |
| Total (Category) | 211 (100.0%) | 0 (0.0%) |
| Total (Overall) | 1,787 (51.3%) | 1,698 (48.7%) |
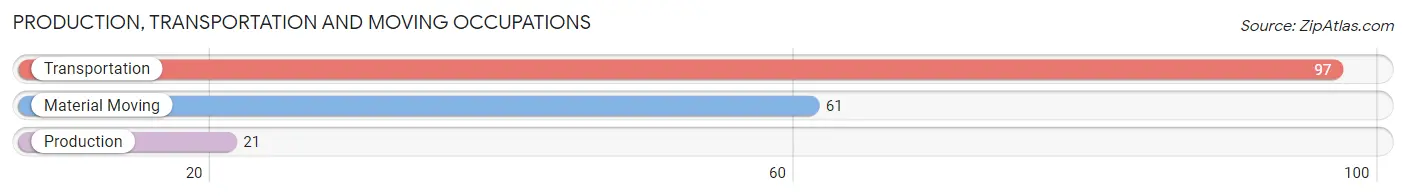
Production, Transportation and Moving Occupations
The most common Production, Transportation and Moving occupations in Linwood are Transportation (97 | 2.8%), Material Moving (61 | 1.8%), and Production (21 | 0.6%).
Production, Transportation and Moving Occupations by Sex
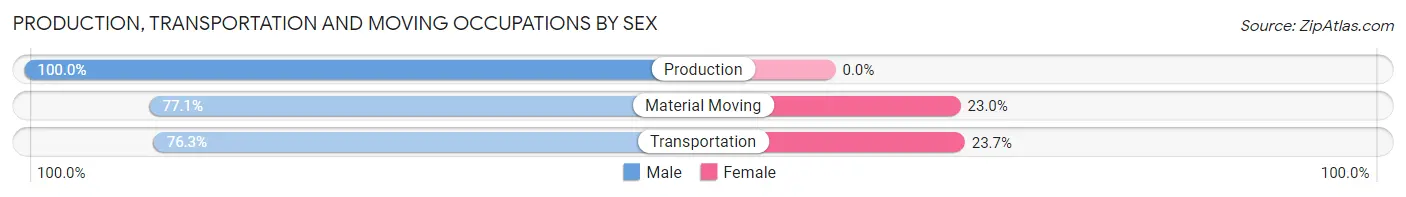
| Occupation | Male | Female |
| Production | 21 (100.0%) | 0 (0.0%) |
| Transportation | 74 (76.3%) | 23 (23.7%) |
| Material Moving | 47 (77.0%) | 14 (23.0%) |
| Total (Category) | 142 (79.3%) | 37 (20.7%) |
| Total (Overall) | 1,787 (51.3%) | 1,698 (48.7%) |
Employment Industries by Sex in Linwood
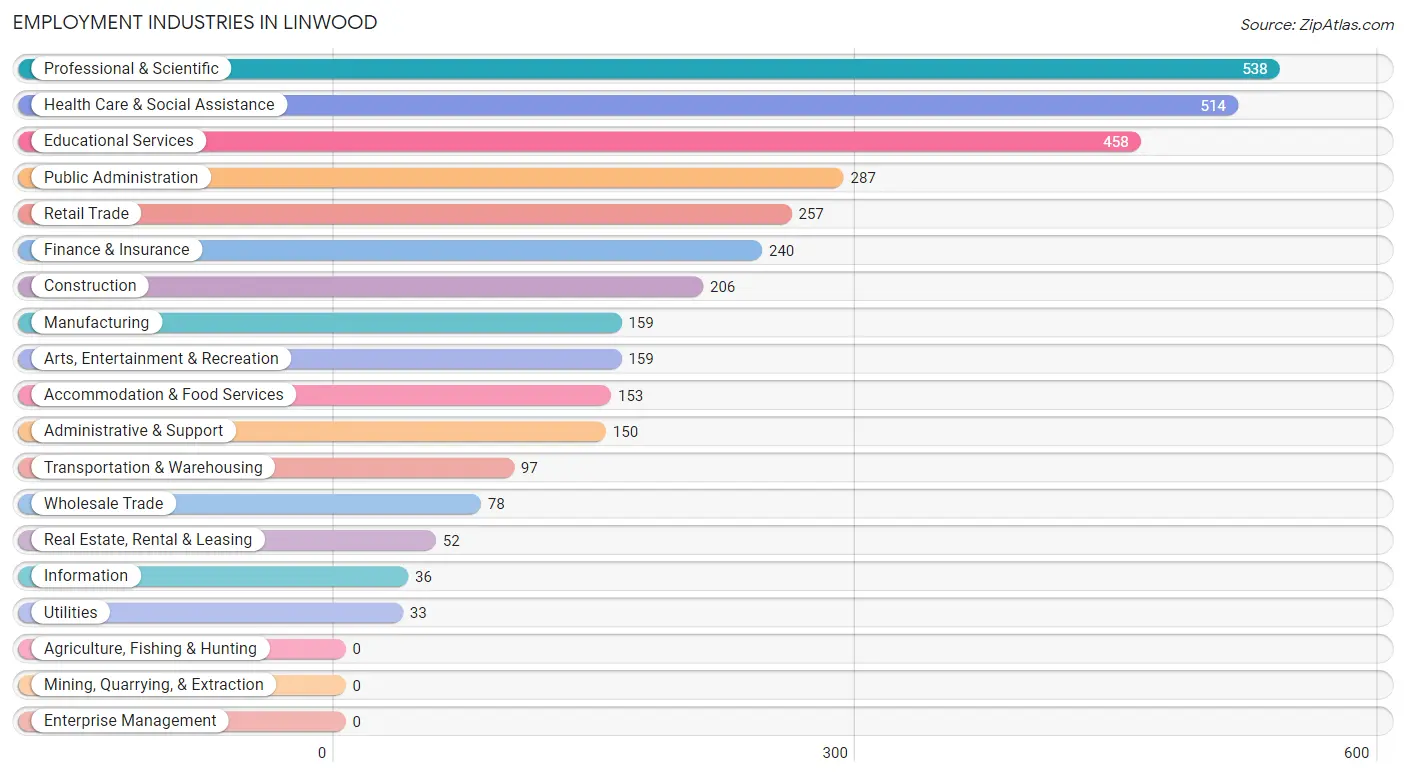
Employment Industries in Linwood
The major employment industries in Linwood include Professional & Scientific (538 | 15.4%), Health Care & Social Assistance (514 | 14.7%), Educational Services (458 | 13.1%), Public Administration (287 | 8.2%), and Retail Trade (257 | 7.4%).
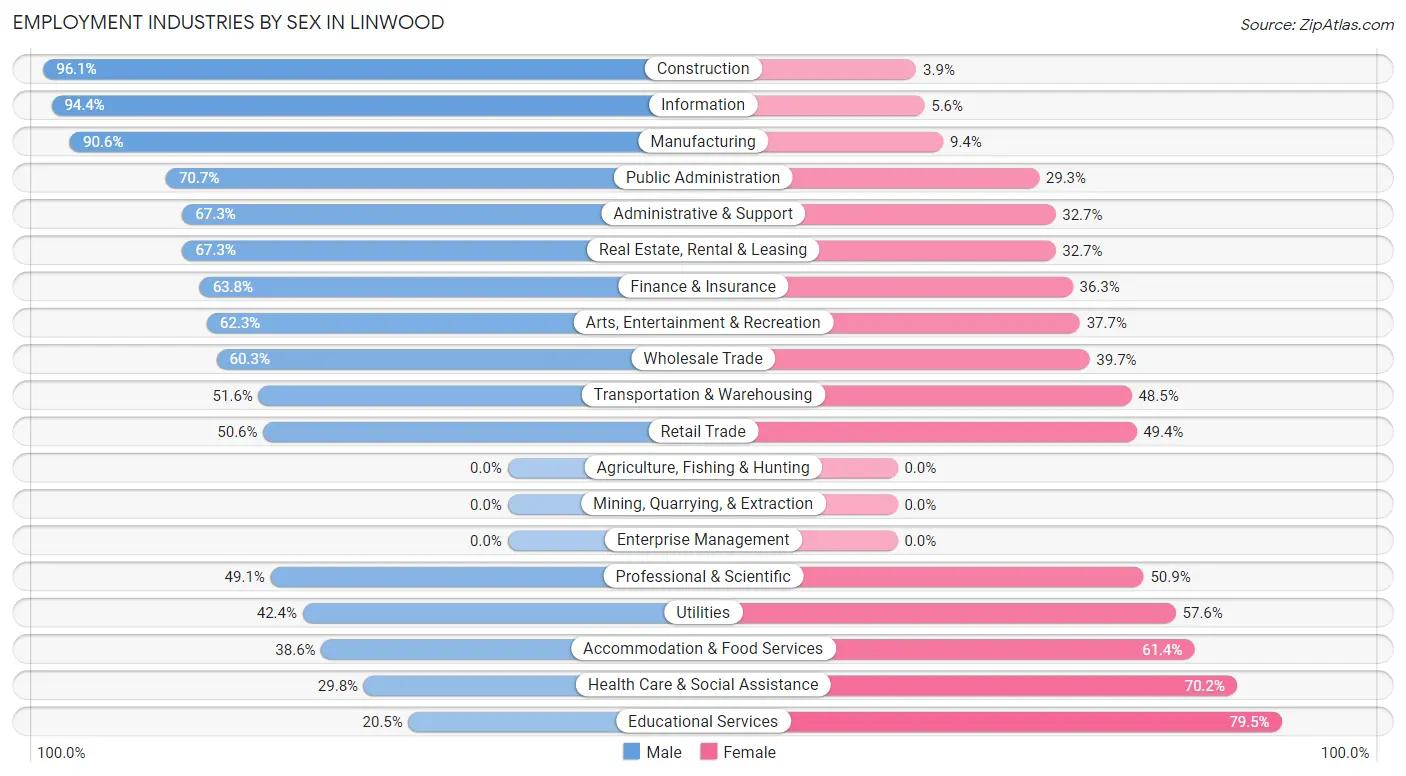
Employment Industries by Sex in Linwood
The Linwood industries that see more men than women are Construction (96.1%), Information (94.4%), and Manufacturing (90.6%), whereas the industries that tend to have a higher number of women are Educational Services (79.5%), Health Care & Social Assistance (70.2%), and Accommodation & Food Services (61.4%).
| Industry | Male | Female |
| Agriculture, Fishing & Hunting | 0 (0.0%) | 0 (0.0%) |
| Mining, Quarrying, & Extraction | 0 (0.0%) | 0 (0.0%) |
| Construction | 198 (96.1%) | 8 (3.9%) |
| Manufacturing | 144 (90.6%) | 15 (9.4%) |
| Wholesale Trade | 47 (60.3%) | 31 (39.7%) |
| Retail Trade | 130 (50.6%) | 127 (49.4%) |
| Transportation & Warehousing | 50 (51.5%) | 47 (48.4%) |
| Utilities | 14 (42.4%) | 19 (57.6%) |
| Information | 34 (94.4%) | 2 (5.6%) |
| Finance & Insurance | 153 (63.7%) | 87 (36.2%) |
| Real Estate, Rental & Leasing | 35 (67.3%) | 17 (32.7%) |
| Professional & Scientific | 264 (49.1%) | 274 (50.9%) |
| Enterprise Management | 0 (0.0%) | 0 (0.0%) |
| Administrative & Support | 101 (67.3%) | 49 (32.7%) |
| Educational Services | 94 (20.5%) | 364 (79.5%) |
| Health Care & Social Assistance | 153 (29.8%) | 361 (70.2%) |
| Arts, Entertainment & Recreation | 99 (62.3%) | 60 (37.7%) |
| Accommodation & Food Services | 59 (38.6%) | 94 (61.4%) |
| Public Administration | 203 (70.7%) | 84 (29.3%) |
| Total | 1,787 (51.3%) | 1,698 (48.7%) |
Education in Linwood
School Enrollment in Linwood
The most common levels of schooling among the 1,677 students in Linwood are elementary school (403 | 24.0%), high school (336 | 20.0%), and middle school (314 | 18.7%).
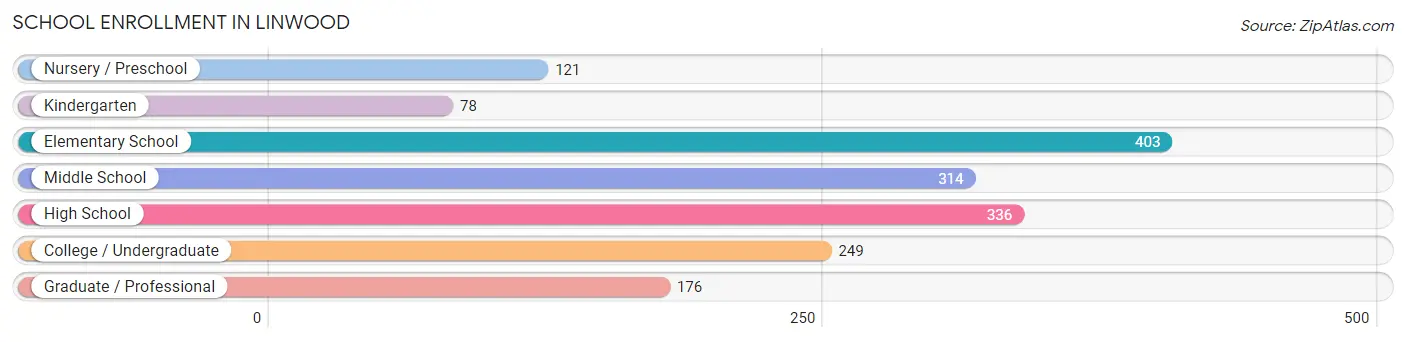
| School Level | # Students | % Students |
| Nursery / Preschool | 121 | 7.2% |
| Kindergarten | 78 | 4.6% |
| Elementary School | 403 | 24.0% |
| Middle School | 314 | 18.7% |
| High School | 336 | 20.0% |
| College / Undergraduate | 249 | 14.8% |
| Graduate / Professional | 176 | 10.5% |
| Total | 1,677 | 100.0% |
School Enrollment by Age by Funding Source in Linwood
Out of a total of 1,677 students who are enrolled in schools in Linwood, 228 (13.6%) attend a private institution, while the remaining 1,449 (86.4%) are enrolled in public schools. The age group of 3 to 4 year olds has the highest likelihood of being enrolled in private schools, with 33 (46.5% in the age bracket) enrolled. Conversely, the age group of 15 to 17 year olds has the lowest likelihood of being enrolled in a private school, with 230 (97.1% in the age bracket) attending a public institution.
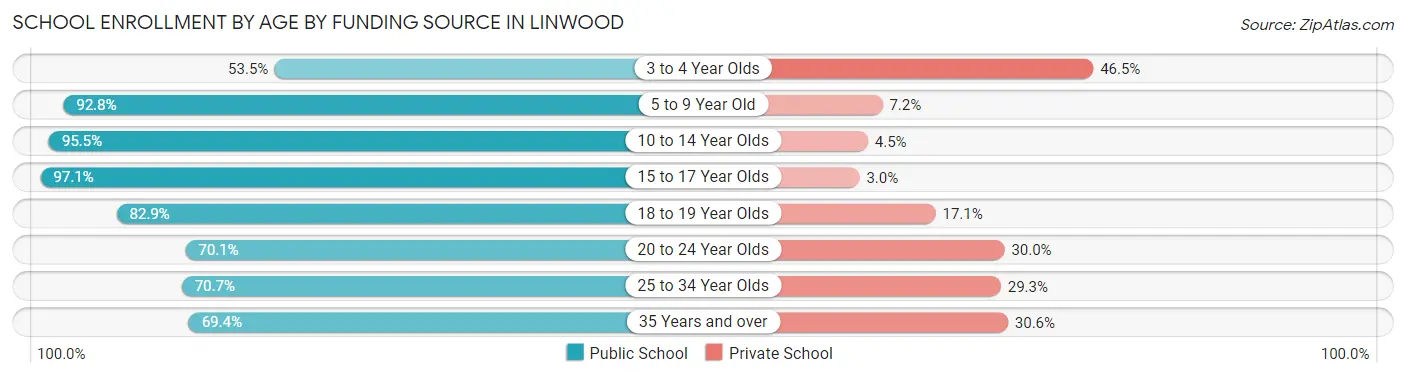
| Age Bracket | Public School | Private School |
| 3 to 4 Year Olds | 38 (53.5%) | 33 (46.5%) |
| 5 to 9 Year Old | 437 (92.8%) | 34 (7.2%) |
| 10 to 14 Year Olds | 360 (95.5%) | 17 (4.5%) |
| 15 to 17 Year Olds | 230 (97.1%) | 7 (2.9%) |
| 18 to 19 Year Olds | 126 (82.9%) | 26 (17.1%) |
| 20 to 24 Year Olds | 145 (70.1%) | 62 (29.9%) |
| 25 to 34 Year Olds | 29 (70.7%) | 12 (29.3%) |
| 35 Years and over | 84 (69.4%) | 37 (30.6%) |
| Total | 1,449 (86.4%) | 228 (13.6%) |
Educational Attainment by Field of Study in Linwood
Business (698 | 22.3%), education (446 | 14.3%), bio, nature & agricultural (306 | 9.8%), science & technology (280 | 9.0%), and liberal arts & history (229 | 7.3%) are the most common fields of study among 3,124 individuals in Linwood who have obtained a bachelor's degree or higher.
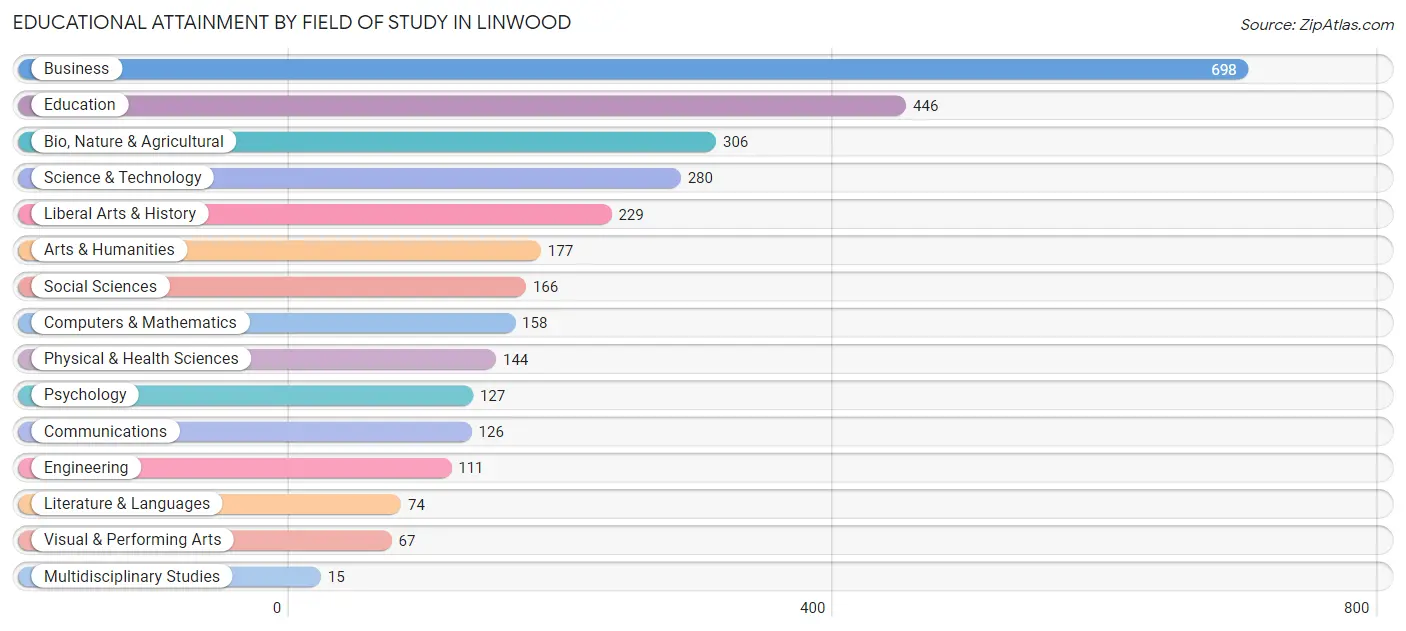
| Field of Study | # Graduates | % Graduates |
| Computers & Mathematics | 158 | 5.1% |
| Bio, Nature & Agricultural | 306 | 9.8% |
| Physical & Health Sciences | 144 | 4.6% |
| Psychology | 127 | 4.1% |
| Social Sciences | 166 | 5.3% |
| Engineering | 111 | 3.5% |
| Multidisciplinary Studies | 15 | 0.5% |
| Science & Technology | 280 | 9.0% |
| Business | 698 | 22.3% |
| Education | 446 | 14.3% |
| Literature & Languages | 74 | 2.4% |
| Liberal Arts & History | 229 | 7.3% |
| Visual & Performing Arts | 67 | 2.1% |
| Communications | 126 | 4.0% |
| Arts & Humanities | 177 | 5.7% |
| Total | 3,124 | 100.0% |
Transportation & Commute in Linwood
Vehicle Availability by Sex in Linwood
The most prevalent vehicle ownership categories in Linwood are males with 2 vehicles (826, accounting for 47.1%) and females with 2 vehicles (700, making up 49.0%).
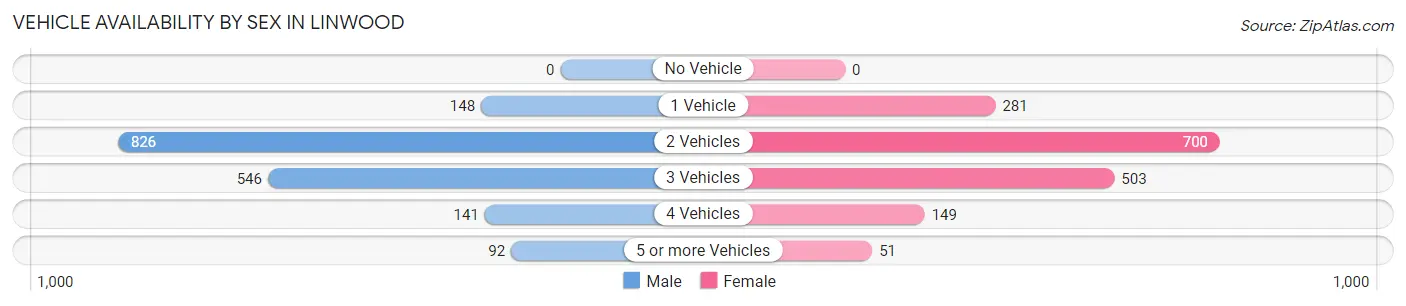
| Vehicles Available | Male | Female |
| No Vehicle | 0 (0.0%) | 0 (0.0%) |
| 1 Vehicle | 148 (8.4%) | 281 (16.7%) |
| 2 Vehicles | 826 (47.1%) | 700 (41.6%) |
| 3 Vehicles | 546 (31.1%) | 503 (29.9%) |
| 4 Vehicles | 141 (8.0%) | 149 (8.8%) |
| 5 or more Vehicles | 92 (5.2%) | 51 (3.0%) |
| Total | 1,753 (100.0%) | 1,684 (100.0%) |
Commute Time in Linwood
The most frequently occuring commute durations in Linwood are 20 to 24 minutes (873 commuters, 28.9%), 15 to 19 minutes (532 commuters, 17.6%), and 5 to 9 minutes (453 commuters, 15.0%).
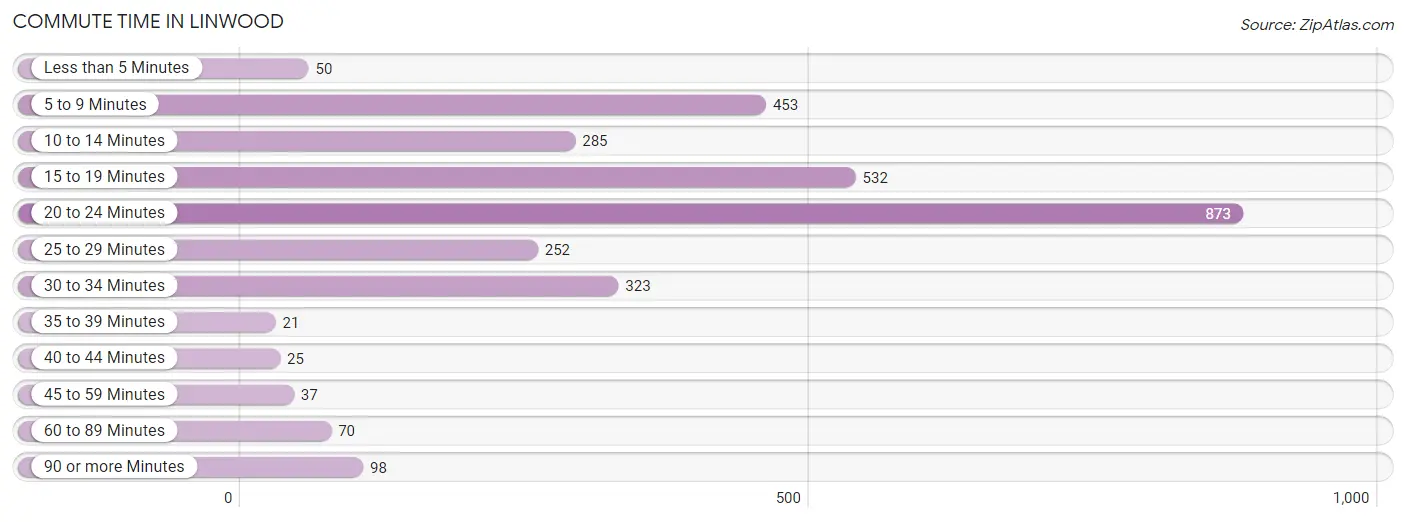
| Commute Time | # Commuters | % Commuters |
| Less than 5 Minutes | 50 | 1.7% |
| 5 to 9 Minutes | 453 | 15.0% |
| 10 to 14 Minutes | 285 | 9.4% |
| 15 to 19 Minutes | 532 | 17.6% |
| 20 to 24 Minutes | 873 | 28.9% |
| 25 to 29 Minutes | 252 | 8.4% |
| 30 to 34 Minutes | 323 | 10.7% |
| 35 to 39 Minutes | 21 | 0.7% |
| 40 to 44 Minutes | 25 | 0.8% |
| 45 to 59 Minutes | 37 | 1.2% |
| 60 to 89 Minutes | 70 | 2.3% |
| 90 or more Minutes | 98 | 3.3% |
Commute Time by Sex in Linwood
The most common commute times in Linwood are 20 to 24 minutes (457 commuters, 27.9%) for males and 20 to 24 minutes (416 commuters, 30.1%) for females.
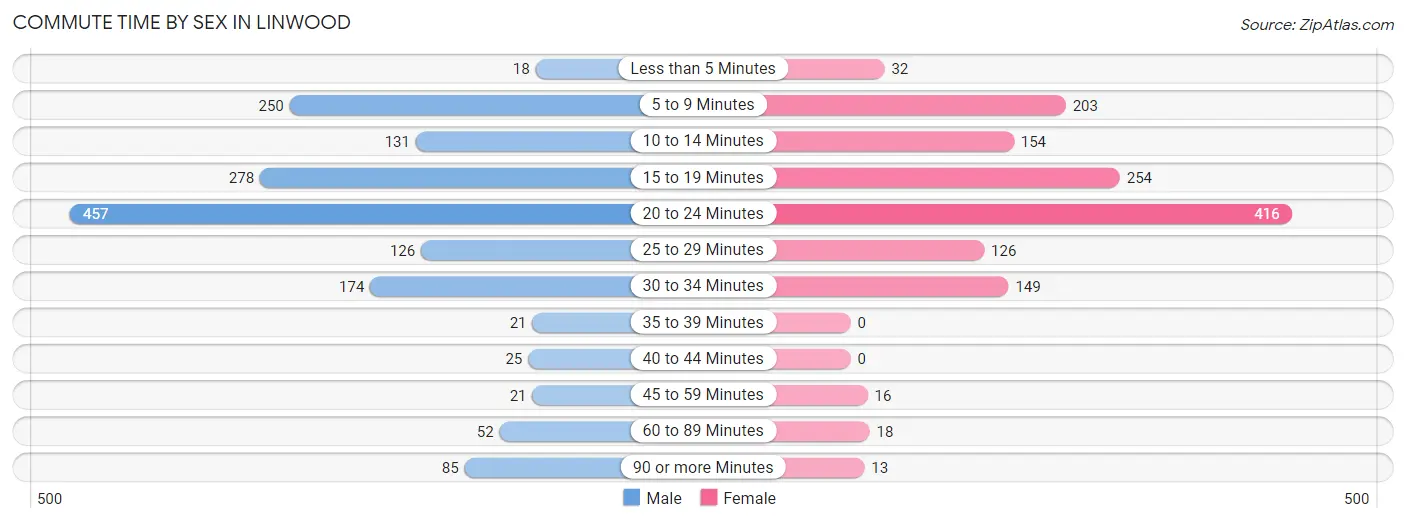
| Commute Time | Male | Female |
| Less than 5 Minutes | 18 (1.1%) | 32 (2.3%) |
| 5 to 9 Minutes | 250 (15.3%) | 203 (14.7%) |
| 10 to 14 Minutes | 131 (8.0%) | 154 (11.2%) |
| 15 to 19 Minutes | 278 (17.0%) | 254 (18.4%) |
| 20 to 24 Minutes | 457 (27.9%) | 416 (30.1%) |
| 25 to 29 Minutes | 126 (7.7%) | 126 (9.1%) |
| 30 to 34 Minutes | 174 (10.6%) | 149 (10.8%) |
| 35 to 39 Minutes | 21 (1.3%) | 0 (0.0%) |
| 40 to 44 Minutes | 25 (1.5%) | 0 (0.0%) |
| 45 to 59 Minutes | 21 (1.3%) | 16 (1.2%) |
| 60 to 89 Minutes | 52 (3.2%) | 18 (1.3%) |
| 90 or more Minutes | 85 (5.2%) | 13 (0.9%) |
Time of Departure to Work by Sex in Linwood
The most frequent times of departure to work in Linwood are 8:00 AM to 8:29 AM (322, 19.7%) for males and 8:30 AM to 8:59 AM (318, 23.0%) for females.
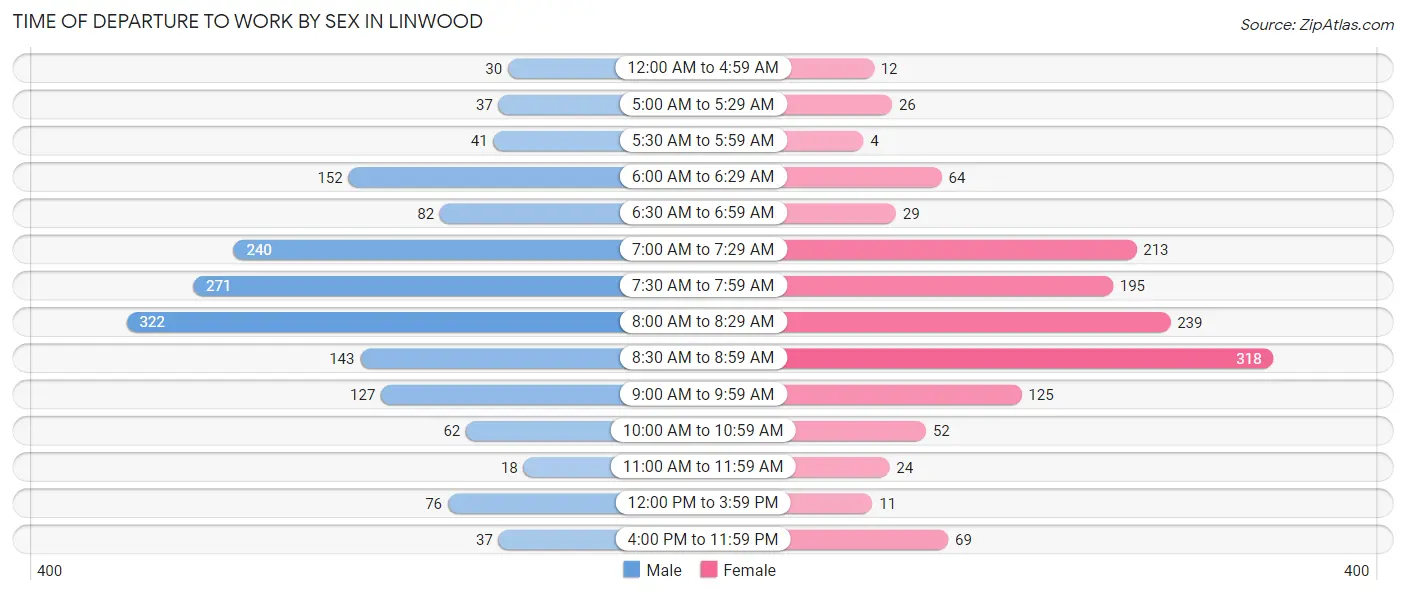
| Time of Departure | Male | Female |
| 12:00 AM to 4:59 AM | 30 (1.8%) | 12 (0.9%) |
| 5:00 AM to 5:29 AM | 37 (2.3%) | 26 (1.9%) |
| 5:30 AM to 5:59 AM | 41 (2.5%) | 4 (0.3%) |
| 6:00 AM to 6:29 AM | 152 (9.3%) | 64 (4.6%) |
| 6:30 AM to 6:59 AM | 82 (5.0%) | 29 (2.1%) |
| 7:00 AM to 7:29 AM | 240 (14.6%) | 213 (15.4%) |
| 7:30 AM to 7:59 AM | 271 (16.5%) | 195 (14.1%) |
| 8:00 AM to 8:29 AM | 322 (19.7%) | 239 (17.3%) |
| 8:30 AM to 8:59 AM | 143 (8.7%) | 318 (23.0%) |
| 9:00 AM to 9:59 AM | 127 (7.7%) | 125 (9.0%) |
| 10:00 AM to 10:59 AM | 62 (3.8%) | 52 (3.8%) |
| 11:00 AM to 11:59 AM | 18 (1.1%) | 24 (1.7%) |
| 12:00 PM to 3:59 PM | 76 (4.6%) | 11 (0.8%) |
| 4:00 PM to 11:59 PM | 37 (2.3%) | 69 (5.0%) |
| Total | 1,638 (100.0%) | 1,381 (100.0%) |
Housing Occupancy in Linwood
Occupancy by Ownership in Linwood
Of the total 2,655 dwellings in Linwood, owner-occupied units account for 2,394 (90.2%), while renter-occupied units make up 261 (9.8%).
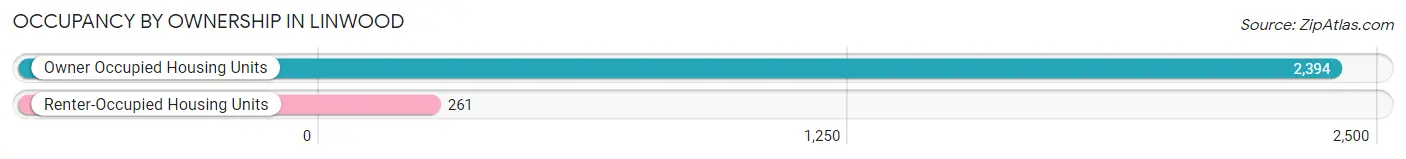
| Occupancy | # Housing Units | % Housing Units |
| Owner Occupied Housing Units | 2,394 | 90.2% |
| Renter-Occupied Housing Units | 261 | 9.8% |
| Total Occupied Housing Units | 2,655 | 100.0% |
Occupancy by Household Size in Linwood
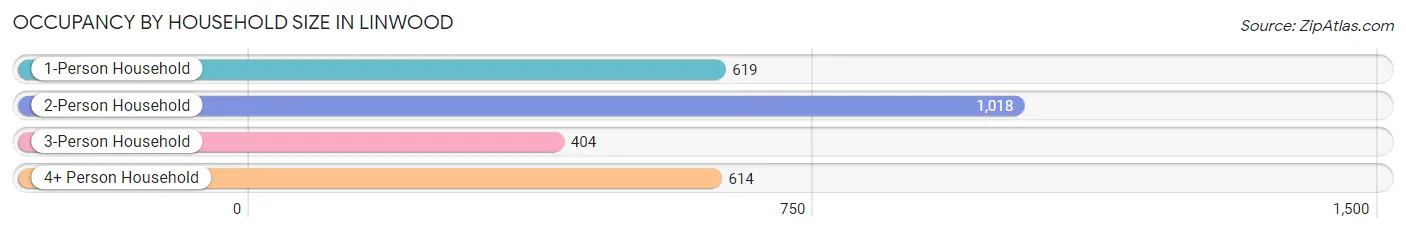
| Household Size | # Housing Units | % Housing Units |
| 1-Person Household | 619 | 23.3% |
| 2-Person Household | 1,018 | 38.3% |
| 3-Person Household | 404 | 15.2% |
| 4+ Person Household | 614 | 23.1% |
| Total Housing Units | 2,655 | 100.0% |
Occupancy by Ownership by Household Size in Linwood
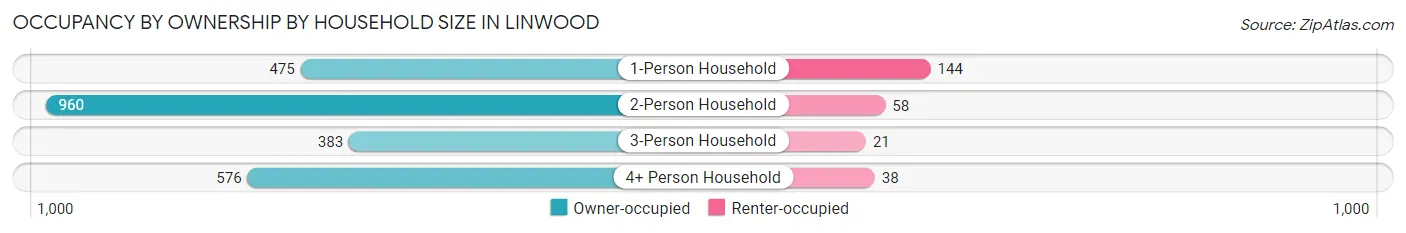
| Household Size | Owner-occupied | Renter-occupied |
| 1-Person Household | 475 (76.7%) | 144 (23.3%) |
| 2-Person Household | 960 (94.3%) | 58 (5.7%) |
| 3-Person Household | 383 (94.8%) | 21 (5.2%) |
| 4+ Person Household | 576 (93.8%) | 38 (6.2%) |
| Total Housing Units | 2,394 (90.2%) | 261 (9.8%) |
Occupancy by Educational Attainment in Linwood
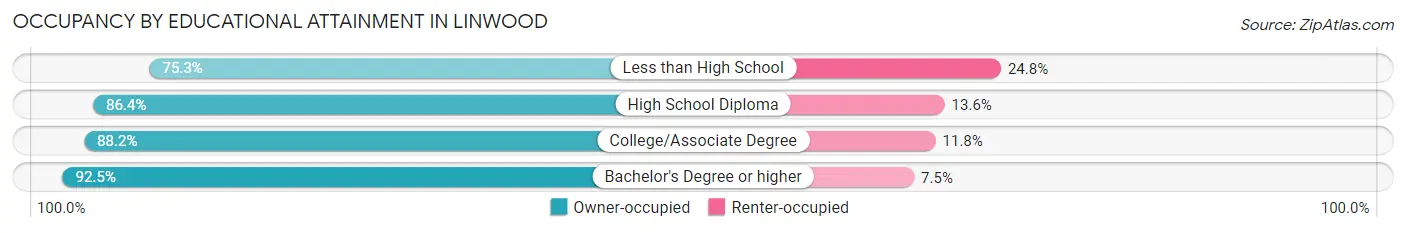
| Household Size | Owner-occupied | Renter-occupied |
| Less than High School | 76 (75.2%) | 25 (24.7%) |
| High School Diploma | 280 (86.4%) | 44 (13.6%) |
| College/Associate Degree | 502 (88.2%) | 67 (11.8%) |
| Bachelor's Degree or higher | 1,536 (92.5%) | 125 (7.5%) |
Occupancy by Age of Householder in Linwood
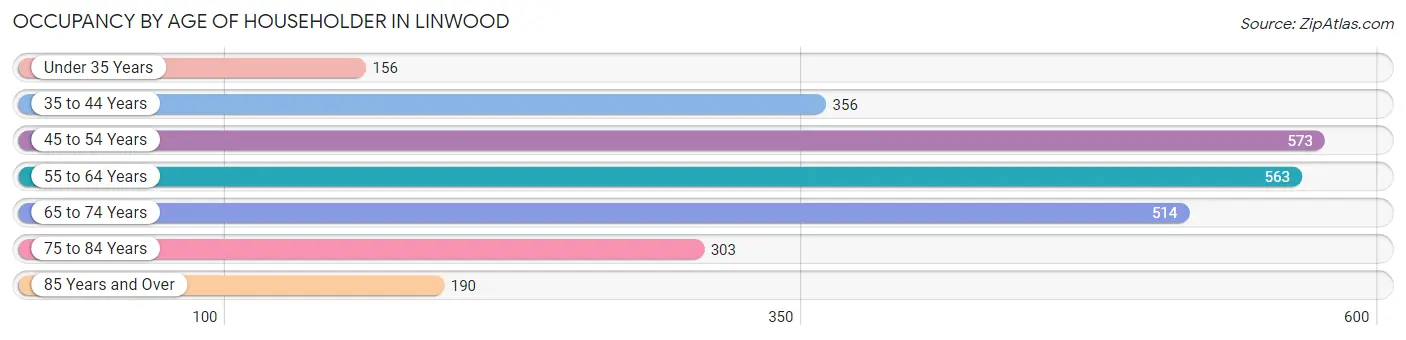
| Age Bracket | # Households | % Households |
| Under 35 Years | 156 | 5.9% |
| 35 to 44 Years | 356 | 13.4% |
| 45 to 54 Years | 573 | 21.6% |
| 55 to 64 Years | 563 | 21.2% |
| 65 to 74 Years | 514 | 19.4% |
| 75 to 84 Years | 303 | 11.4% |
| 85 Years and Over | 190 | 7.2% |
| Total | 2,655 | 100.0% |
Housing Finances in Linwood
Median Income by Occupancy in Linwood
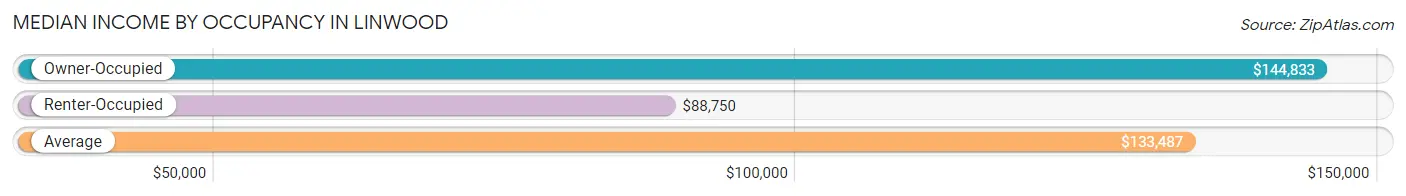
| Occupancy Type | # Households | Median Income |
| Owner-Occupied | 2,394 (90.2%) | $144,833 |
| Renter-Occupied | 261 (9.8%) | $88,750 |
| Average | 2,655 (100.0%) | $133,487 |
Occupancy by Householder Income Bracket in Linwood
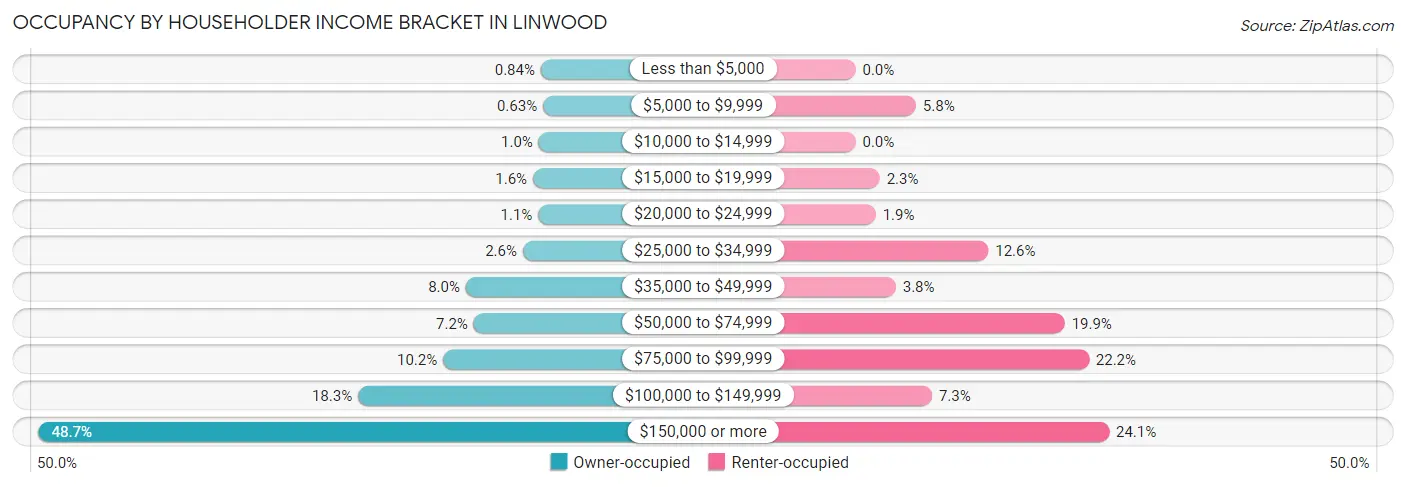
| Income Bracket | Owner-occupied | Renter-occupied |
| Less than $5,000 | 20 (0.8%) | 0 (0.0%) |
| $5,000 to $9,999 | 15 (0.6%) | 15 (5.8%) |
| $10,000 to $14,999 | 25 (1.0%) | 0 (0.0%) |
| $15,000 to $19,999 | 38 (1.6%) | 6 (2.3%) |
| $20,000 to $24,999 | 26 (1.1%) | 5 (1.9%) |
| $25,000 to $34,999 | 61 (2.5%) | 33 (12.6%) |
| $35,000 to $49,999 | 191 (8.0%) | 10 (3.8%) |
| $50,000 to $74,999 | 173 (7.2%) | 52 (19.9%) |
| $75,000 to $99,999 | 243 (10.2%) | 58 (22.2%) |
| $100,000 to $149,999 | 437 (18.2%) | 19 (7.3%) |
| $150,000 or more | 1,165 (48.7%) | 63 (24.1%) |
| Total | 2,394 (100.0%) | 261 (100.0%) |
Monthly Housing Cost Tiers in Linwood
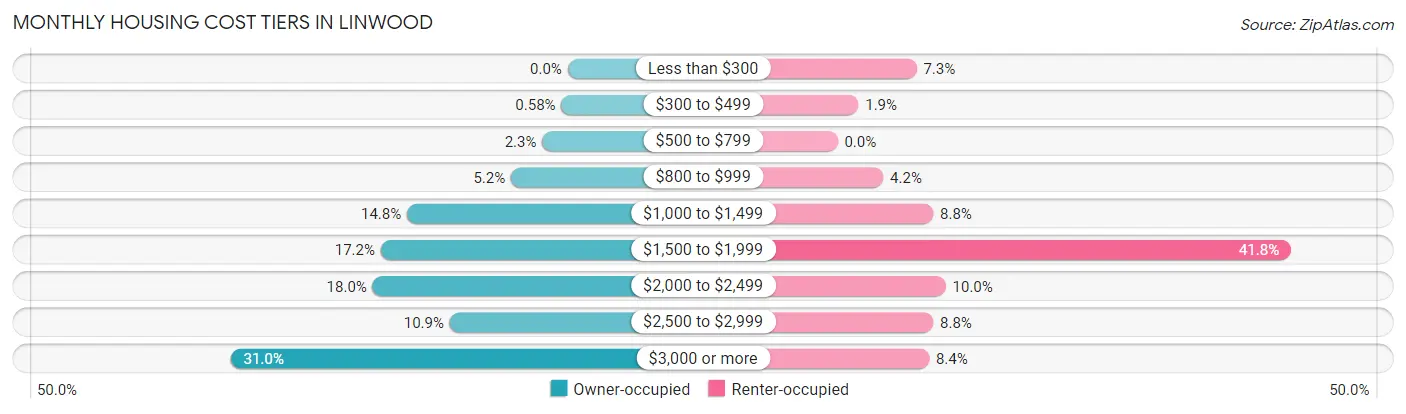
| Monthly Cost | Owner-occupied | Renter-occupied |
| Less than $300 | 0 (0.0%) | 19 (7.3%) |
| $300 to $499 | 14 (0.6%) | 5 (1.9%) |
| $500 to $799 | 56 (2.3%) | 0 (0.0%) |
| $800 to $999 | 125 (5.2%) | 11 (4.2%) |
| $1,000 to $1,499 | 354 (14.8%) | 23 (8.8%) |
| $1,500 to $1,999 | 412 (17.2%) | 109 (41.8%) |
| $2,000 to $2,499 | 430 (18.0%) | 26 (10.0%) |
| $2,500 to $2,999 | 260 (10.9%) | 23 (8.8%) |
| $3,000 or more | 743 (31.0%) | 22 (8.4%) |
| Total | 2,394 (100.0%) | 261 (100.0%) |
Physical Housing Characteristics in Linwood
Housing Structures in Linwood
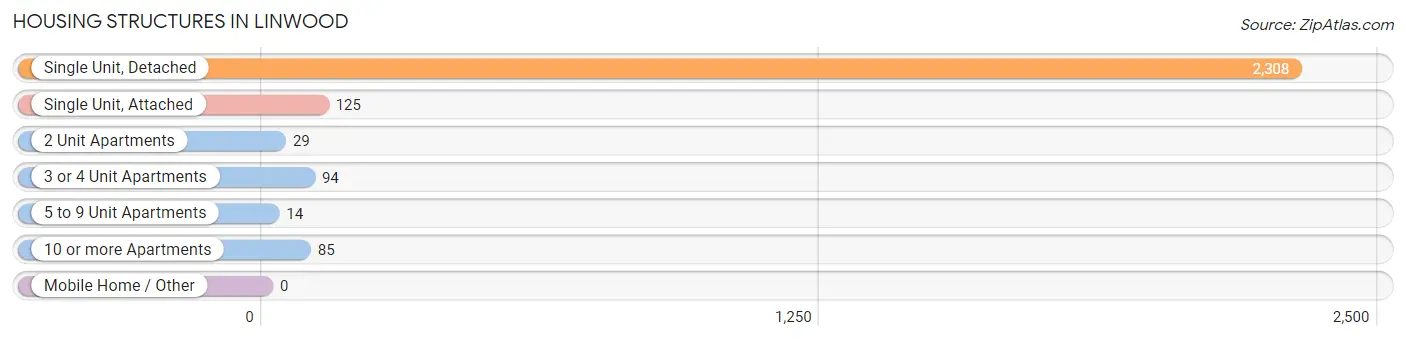
| Structure Type | # Housing Units | % Housing Units |
| Single Unit, Detached | 2,308 | 86.9% |
| Single Unit, Attached | 125 | 4.7% |
| 2 Unit Apartments | 29 | 1.1% |
| 3 or 4 Unit Apartments | 94 | 3.5% |
| 5 to 9 Unit Apartments | 14 | 0.5% |
| 10 or more Apartments | 85 | 3.2% |
| Mobile Home / Other | 0 | 0.0% |
| Total | 2,655 | 100.0% |
Housing Structures by Occupancy in Linwood
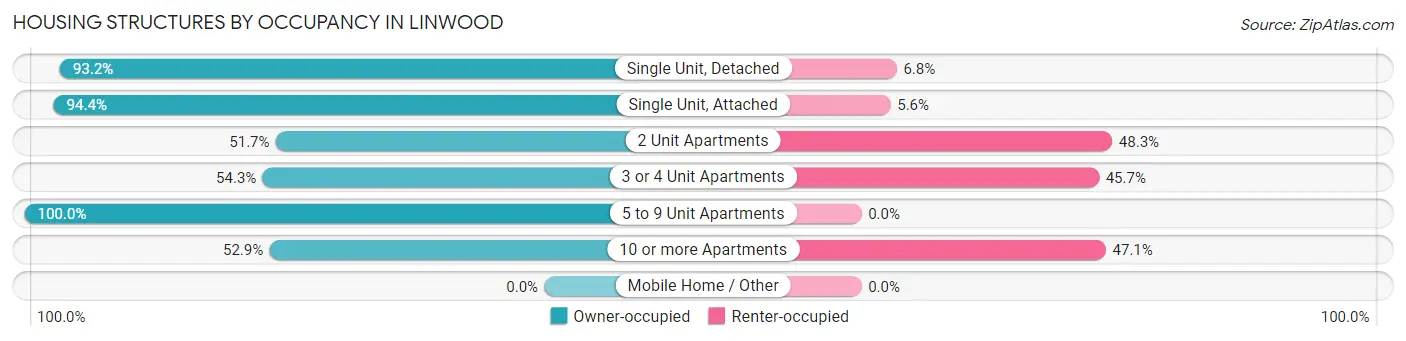
| Structure Type | Owner-occupied | Renter-occupied |
| Single Unit, Detached | 2,151 (93.2%) | 157 (6.8%) |
| Single Unit, Attached | 118 (94.4%) | 7 (5.6%) |
| 2 Unit Apartments | 15 (51.7%) | 14 (48.3%) |
| 3 or 4 Unit Apartments | 51 (54.3%) | 43 (45.7%) |
| 5 to 9 Unit Apartments | 14 (100.0%) | 0 (0.0%) |
| 10 or more Apartments | 45 (52.9%) | 40 (47.1%) |
| Mobile Home / Other | 0 (0.0%) | 0 (0.0%) |
| Total | 2,394 (90.2%) | 261 (9.8%) |
Housing Structures by Number of Rooms in Linwood
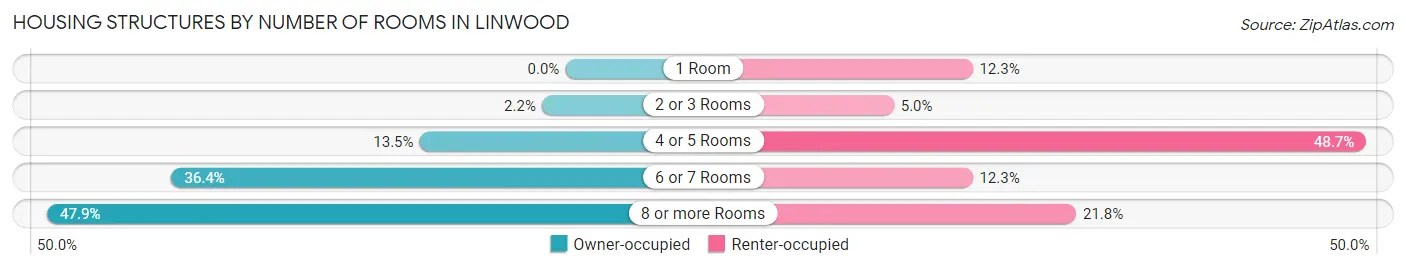
| Number of Rooms | Owner-occupied | Renter-occupied |
| 1 Room | 0 (0.0%) | 32 (12.3%) |
| 2 or 3 Rooms | 52 (2.2%) | 13 (5.0%) |
| 4 or 5 Rooms | 323 (13.5%) | 127 (48.7%) |
| 6 or 7 Rooms | 872 (36.4%) | 32 (12.3%) |
| 8 or more Rooms | 1,147 (47.9%) | 57 (21.8%) |
| Total | 2,394 (100.0%) | 261 (100.0%) |
Housing Structure by Heating Type in Linwood
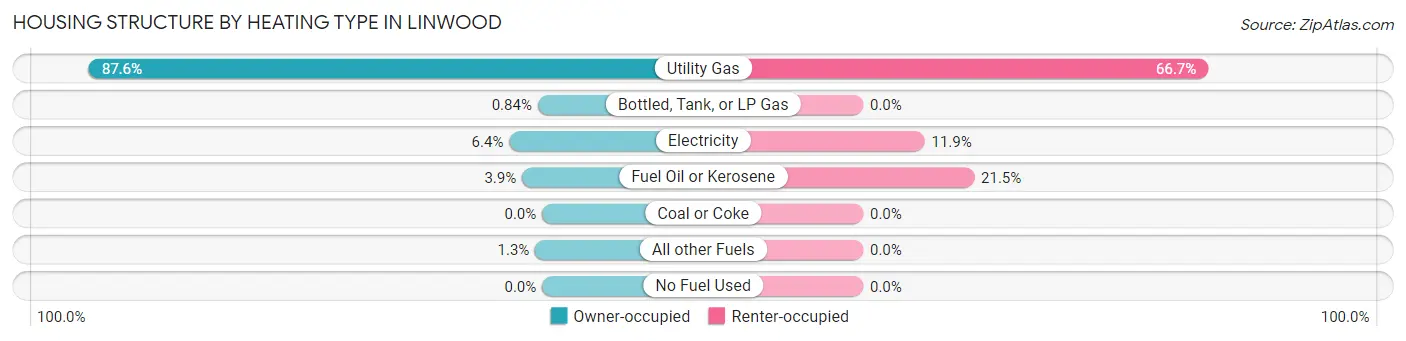
| Heating Type | Owner-occupied | Renter-occupied |
| Utility Gas | 2,097 (87.6%) | 174 (66.7%) |
| Bottled, Tank, or LP Gas | 20 (0.8%) | 0 (0.0%) |
| Electricity | 152 (6.4%) | 31 (11.9%) |
| Fuel Oil or Kerosene | 93 (3.9%) | 56 (21.5%) |
| Coal or Coke | 0 (0.0%) | 0 (0.0%) |
| All other Fuels | 32 (1.3%) | 0 (0.0%) |
| No Fuel Used | 0 (0.0%) | 0 (0.0%) |
| Total | 2,394 (100.0%) | 261 (100.0%) |
Household Vehicle Usage in Linwood
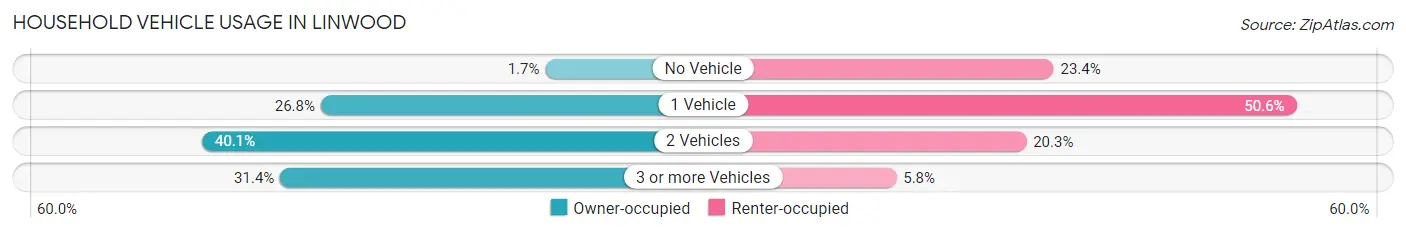
| Vehicles per Household | Owner-occupied | Renter-occupied |
| No Vehicle | 40 (1.7%) | 61 (23.4%) |
| 1 Vehicle | 642 (26.8%) | 132 (50.6%) |
| 2 Vehicles | 961 (40.1%) | 53 (20.3%) |
| 3 or more Vehicles | 751 (31.4%) | 15 (5.8%) |
| Total | 2,394 (100.0%) | 261 (100.0%) |
Real Estate & Mortgages in Linwood
Real Estate and Mortgage Overview in Linwood
| Characteristic | Without Mortgage | With Mortgage |
| Housing Units | 818 | 1,576 |
| Median Property Value | $301,400 | $350,200 |
| Median Household Income | $105,227 | $891 |
| Monthly Housing Costs | $1,327 | $690 |
| Real Estate Taxes | $9,507 | $0 |
Property Value by Mortgage Status in Linwood
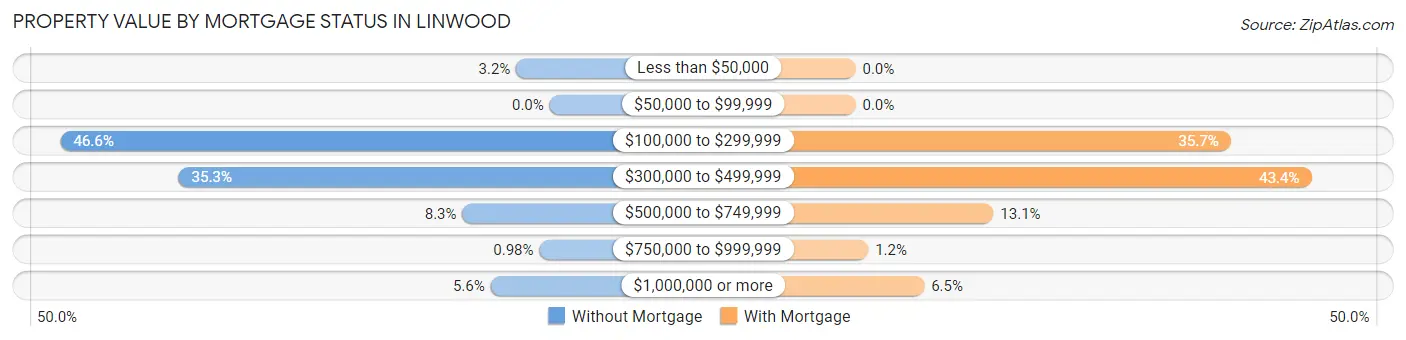
| Property Value | Without Mortgage | With Mortgage |
| Less than $50,000 | 26 (3.2%) | 0 (0.0%) |
| $50,000 to $99,999 | 0 (0.0%) | 0 (0.0%) |
| $100,000 to $299,999 | 381 (46.6%) | 563 (35.7%) |
| $300,000 to $499,999 | 289 (35.3%) | 684 (43.4%) |
| $500,000 to $749,999 | 68 (8.3%) | 207 (13.1%) |
| $750,000 to $999,999 | 8 (1.0%) | 19 (1.2%) |
| $1,000,000 or more | 46 (5.6%) | 103 (6.5%) |
| Total | 818 (100.0%) | 1,576 (100.0%) |
Household Income by Mortgage Status in Linwood
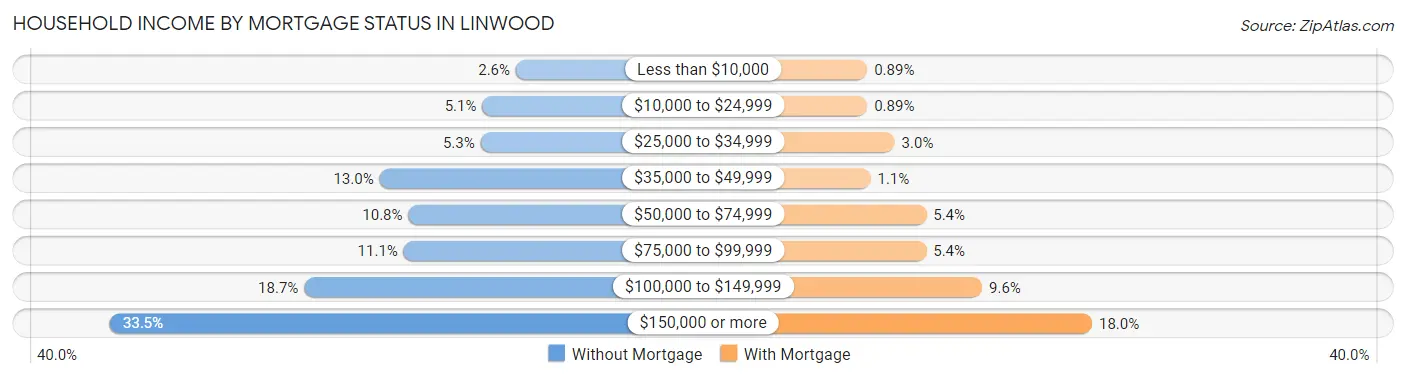
| Household Income | Without Mortgage | With Mortgage |
| Less than $10,000 | 21 (2.6%) | 14 (0.9%) |
| $10,000 to $24,999 | 42 (5.1%) | 14 (0.9%) |
| $25,000 to $34,999 | 43 (5.3%) | 47 (3.0%) |
| $35,000 to $49,999 | 106 (13.0%) | 18 (1.1%) |
| $50,000 to $74,999 | 88 (10.8%) | 85 (5.4%) |
| $75,000 to $99,999 | 91 (11.1%) | 85 (5.4%) |
| $100,000 to $149,999 | 153 (18.7%) | 152 (9.6%) |
| $150,000 or more | 274 (33.5%) | 284 (18.0%) |
| Total | 818 (100.0%) | 1,576 (100.0%) |
Property Value to Household Income Ratio in Linwood
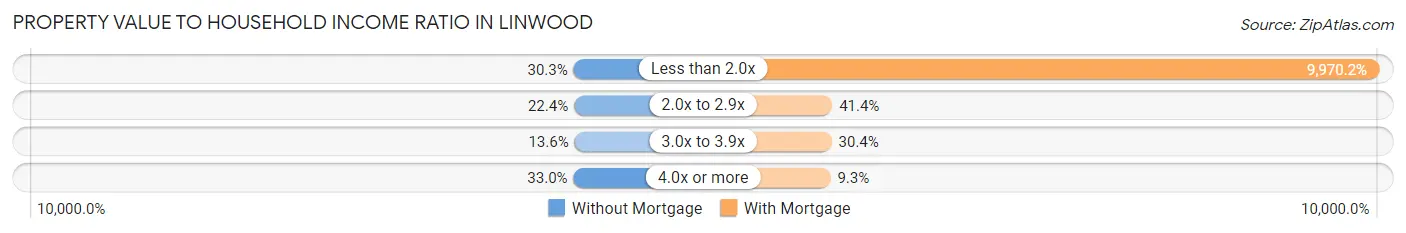
| Value-to-Income Ratio | Without Mortgage | With Mortgage |
| Less than 2.0x | 248 (30.3%) | 157,131 (9,970.2%) |
| 2.0x to 2.9x | 183 (22.4%) | 652 (41.4%) |
| 3.0x to 3.9x | 111 (13.6%) | 479 (30.4%) |
| 4.0x or more | 270 (33.0%) | 146 (9.3%) |
| Total | 818 (100.0%) | 1,576 (100.0%) |
Real Estate Taxes by Mortgage Status in Linwood
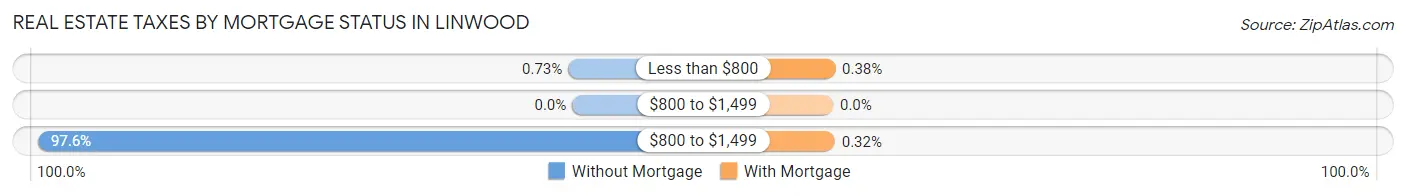
| Property Taxes | Without Mortgage | With Mortgage |
| Less than $800 | 6 (0.7%) | 6 (0.4%) |
| $800 to $1,499 | 0 (0.0%) | 0 (0.0%) |
| $800 to $1,499 | 798 (97.6%) | 5 (0.3%) |
| Total | 818 (100.0%) | 1,576 (100.0%) |
Health & Disability in Linwood
Health Insurance Coverage by Age in Linwood
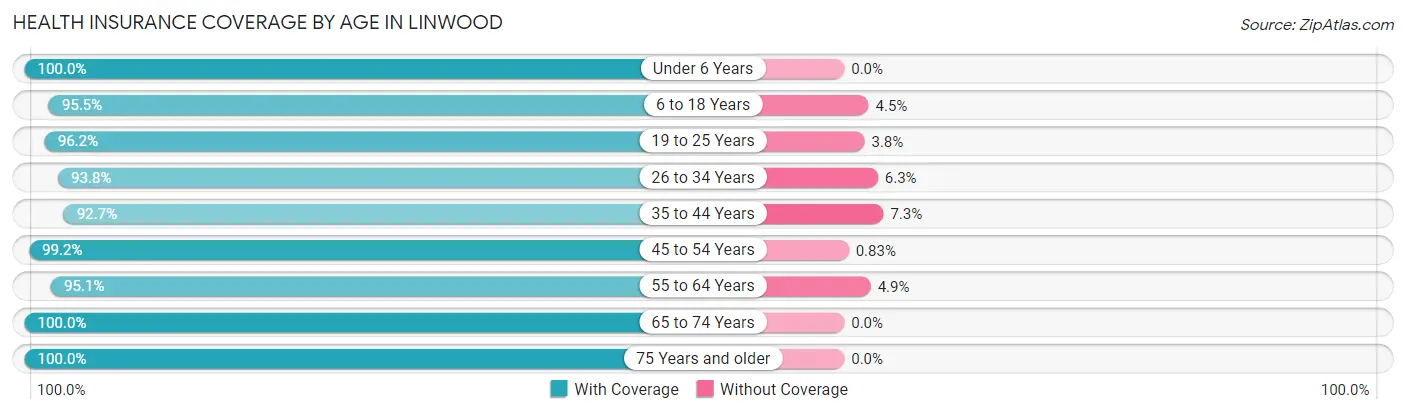
| Age Bracket | With Coverage | Without Coverage |
| Under 6 Years | 434 (100.0%) | 0 (0.0%) |
| 6 to 18 Years | 1,095 (95.5%) | 52 (4.5%) |
| 19 to 25 Years | 434 (96.2%) | 17 (3.8%) |
| 26 to 34 Years | 345 (93.8%) | 23 (6.2%) |
| 35 to 44 Years | 775 (92.7%) | 61 (7.3%) |
| 45 to 54 Years | 953 (99.2%) | 8 (0.8%) |
| 55 to 64 Years | 1,022 (95.1%) | 53 (4.9%) |
| 65 to 74 Years | 818 (100.0%) | 0 (0.0%) |
| 75 Years and older | 729 (100.0%) | 0 (0.0%) |
| Total | 6,605 (96.9%) | 214 (3.1%) |
Health Insurance Coverage by Citizenship Status in Linwood
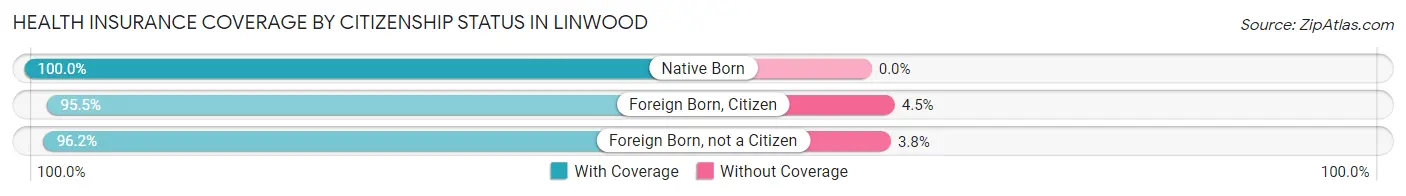
| Citizenship Status | With Coverage | Without Coverage |
| Native Born | 434 (100.0%) | 0 (0.0%) |
| Foreign Born, Citizen | 1,095 (95.5%) | 52 (4.5%) |
| Foreign Born, not a Citizen | 434 (96.2%) | 17 (3.8%) |
Health Insurance Coverage by Household Income in Linwood
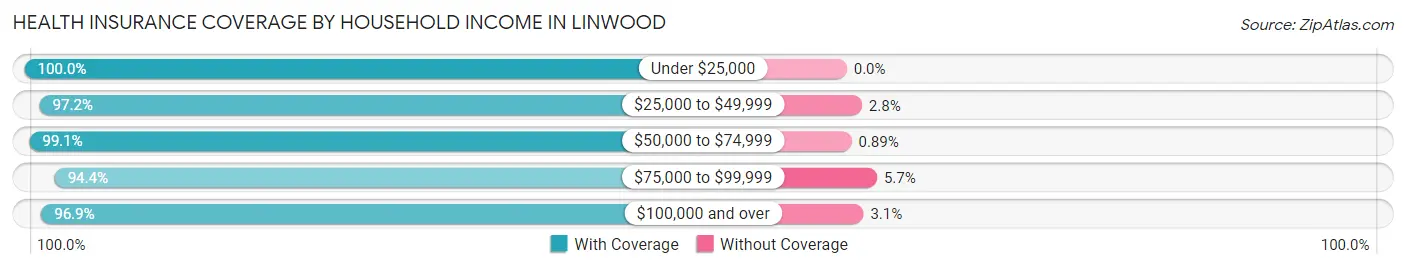
| Household Income | With Coverage | Without Coverage |
| Under $25,000 | 229 (100.0%) | 0 (0.0%) |
| $25,000 to $49,999 | 481 (97.2%) | 14 (2.8%) |
| $50,000 to $74,999 | 333 (99.1%) | 3 (0.9%) |
| $75,000 to $99,999 | 601 (94.4%) | 36 (5.7%) |
| $100,000 and over | 4,952 (96.9%) | 160 (3.1%) |
Public vs Private Health Insurance Coverage by Age in Linwood
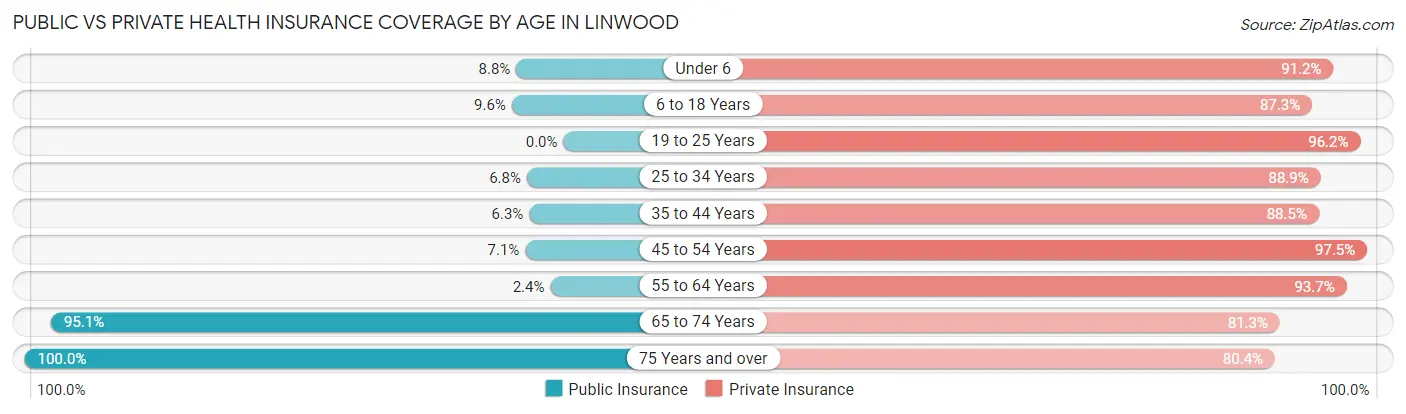
| Age Bracket | Public Insurance | Private Insurance |
| Under 6 | 38 (8.8%) | 396 (91.2%) |
| 6 to 18 Years | 110 (9.6%) | 1,001 (87.3%) |
| 19 to 25 Years | 0 (0.0%) | 434 (96.2%) |
| 25 to 34 Years | 25 (6.8%) | 327 (88.9%) |
| 35 to 44 Years | 53 (6.3%) | 740 (88.5%) |
| 45 to 54 Years | 68 (7.1%) | 937 (97.5%) |
| 55 to 64 Years | 26 (2.4%) | 1,007 (93.7%) |
| 65 to 74 Years | 778 (95.1%) | 665 (81.3%) |
| 75 Years and over | 729 (100.0%) | 586 (80.4%) |
| Total | 1,827 (26.8%) | 6,093 (89.3%) |
Disability Status by Sex by Age in Linwood
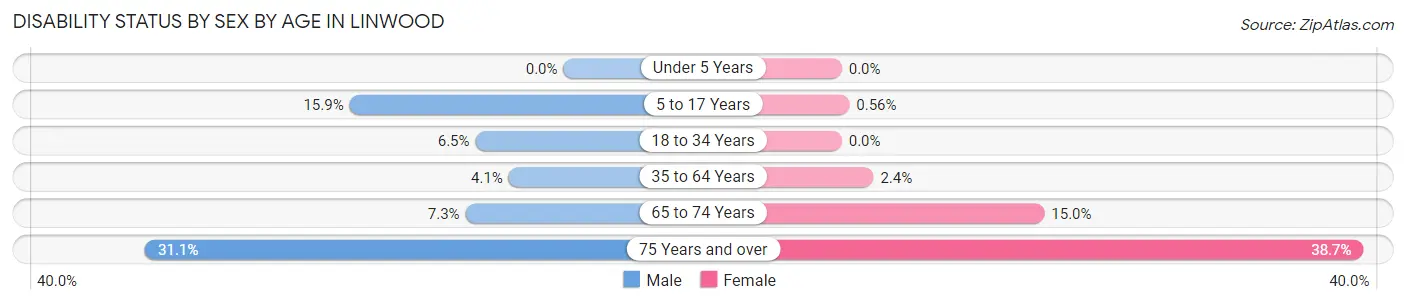
| Age Bracket | Male | Female |
| Under 5 Years | 0 (0.0%) | 0 (0.0%) |
| 5 to 17 Years | 91 (15.9%) | 3 (0.6%) |
| 18 to 34 Years | 32 (6.5%) | 0 (0.0%) |
| 35 to 64 Years | 51 (4.1%) | 38 (2.4%) |
| 65 to 74 Years | 29 (7.3%) | 63 (15.0%) |
| 75 Years and over | 86 (31.0%) | 175 (38.7%) |
Disability Class by Sex by Age in Linwood
Disability Class: Hearing Difficulty
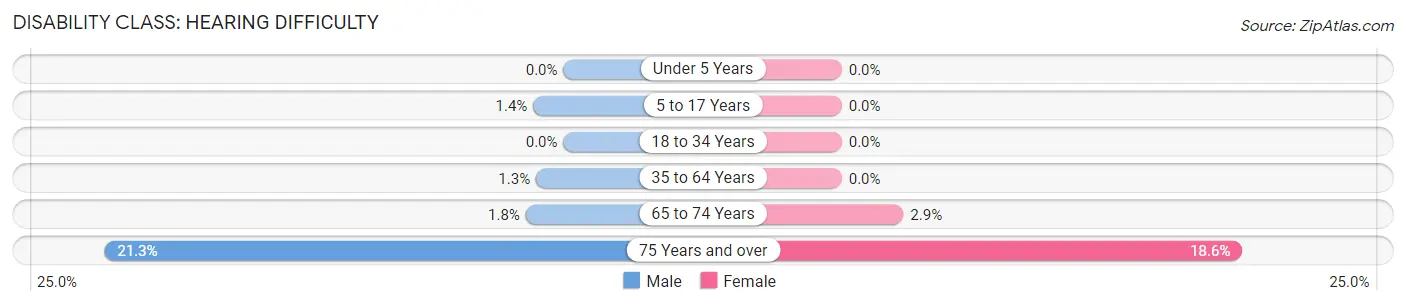
| Age Bracket | Male | Female |
| Under 5 Years | 0 (0.0%) | 0 (0.0%) |
| 5 to 17 Years | 8 (1.4%) | 0 (0.0%) |
| 18 to 34 Years | 0 (0.0%) | 0 (0.0%) |
| 35 to 64 Years | 16 (1.3%) | 0 (0.0%) |
| 65 to 74 Years | 7 (1.8%) | 12 (2.9%) |
| 75 Years and over | 59 (21.3%) | 84 (18.6%) |
Disability Class: Vision Difficulty
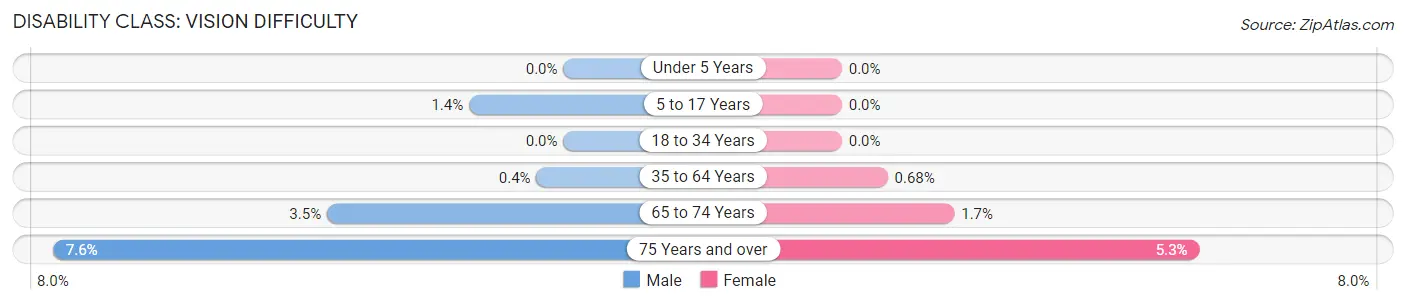
| Age Bracket | Male | Female |
| Under 5 Years | 0 (0.0%) | 0 (0.0%) |
| 5 to 17 Years | 8 (1.4%) | 0 (0.0%) |
| 18 to 34 Years | 0 (0.0%) | 0 (0.0%) |
| 35 to 64 Years | 5 (0.4%) | 11 (0.7%) |
| 65 to 74 Years | 14 (3.5%) | 7 (1.7%) |
| 75 Years and over | 21 (7.6%) | 24 (5.3%) |
Disability Class: Cognitive Difficulty
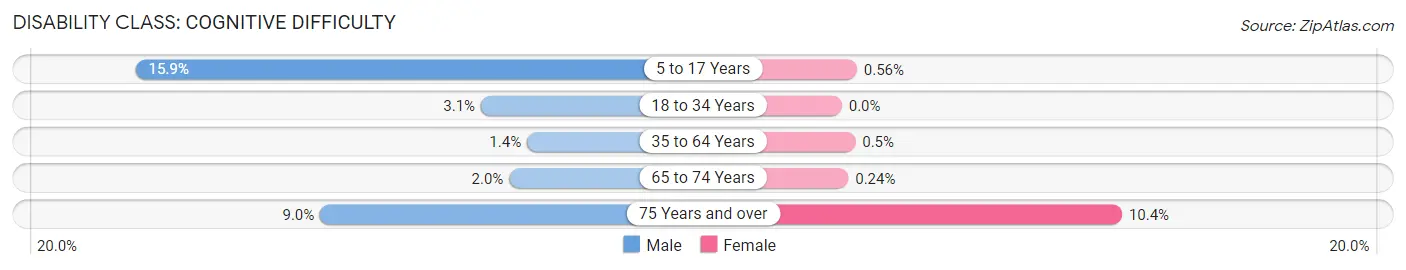
| Age Bracket | Male | Female |
| 5 to 17 Years | 91 (15.9%) | 3 (0.6%) |
| 18 to 34 Years | 15 (3.1%) | 0 (0.0%) |
| 35 to 64 Years | 17 (1.3%) | 8 (0.5%) |
| 65 to 74 Years | 8 (2.0%) | 1 (0.2%) |
| 75 Years and over | 25 (9.0%) | 47 (10.4%) |
Disability Class: Ambulatory Difficulty
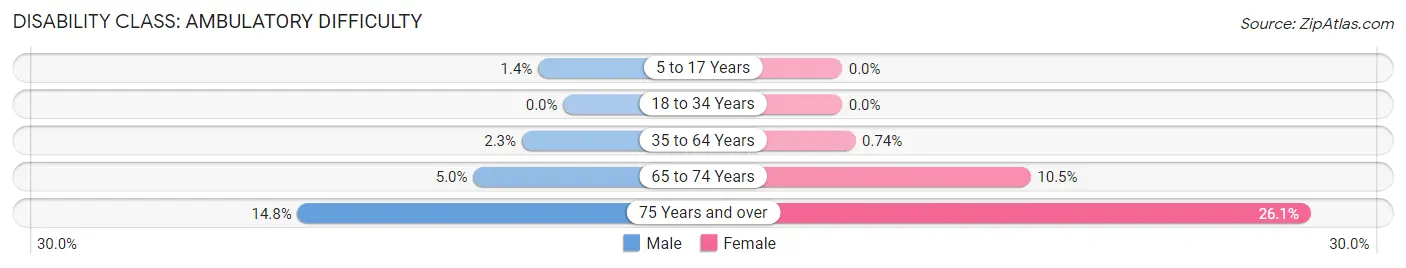
| Age Bracket | Male | Female |
| 5 to 17 Years | 8 (1.4%) | 0 (0.0%) |
| 18 to 34 Years | 0 (0.0%) | 0 (0.0%) |
| 35 to 64 Years | 29 (2.3%) | 12 (0.7%) |
| 65 to 74 Years | 20 (5.0%) | 44 (10.5%) |
| 75 Years and over | 41 (14.8%) | 118 (26.1%) |
Disability Class: Self-Care Difficulty
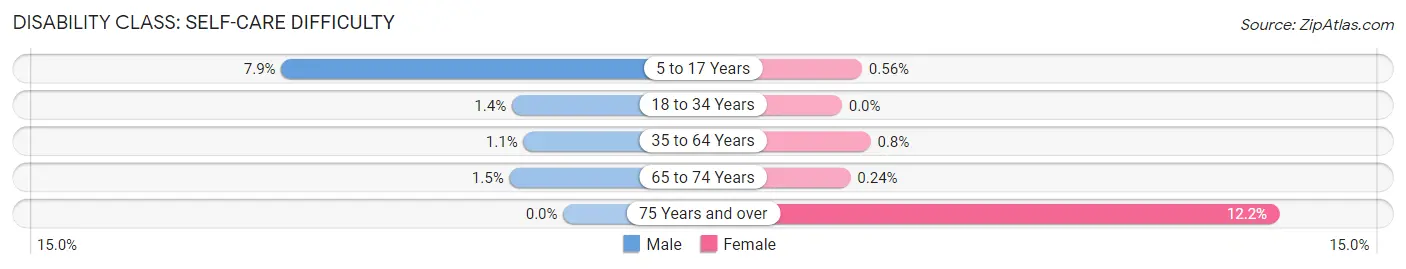
| Age Bracket | Male | Female |
| 5 to 17 Years | 45 (7.9%) | 3 (0.6%) |
| 18 to 34 Years | 7 (1.4%) | 0 (0.0%) |
| 35 to 64 Years | 14 (1.1%) | 13 (0.8%) |
| 65 to 74 Years | 6 (1.5%) | 1 (0.2%) |
| 75 Years and over | 0 (0.0%) | 55 (12.2%) |
Technology Access in Linwood
Computing Device Access in Linwood
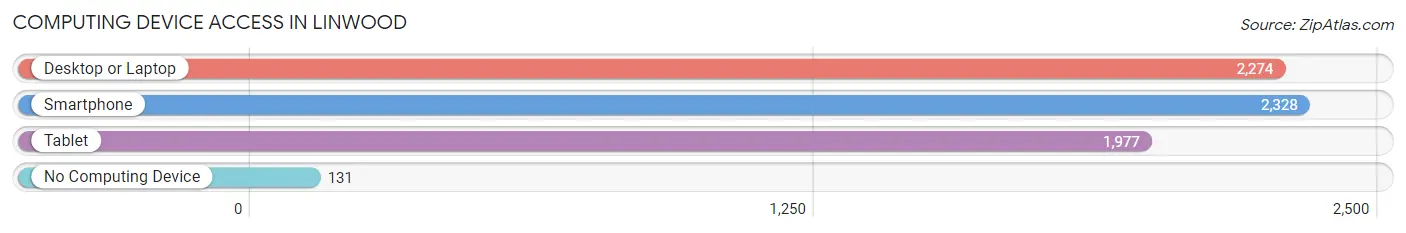
| Device Type | # Households | % Households |
| Desktop or Laptop | 2,274 | 85.7% |
| Smartphone | 2,328 | 87.7% |
| Tablet | 1,977 | 74.5% |
| No Computing Device | 131 | 4.9% |
| Total | 2,655 | 100.0% |
Internet Access in Linwood
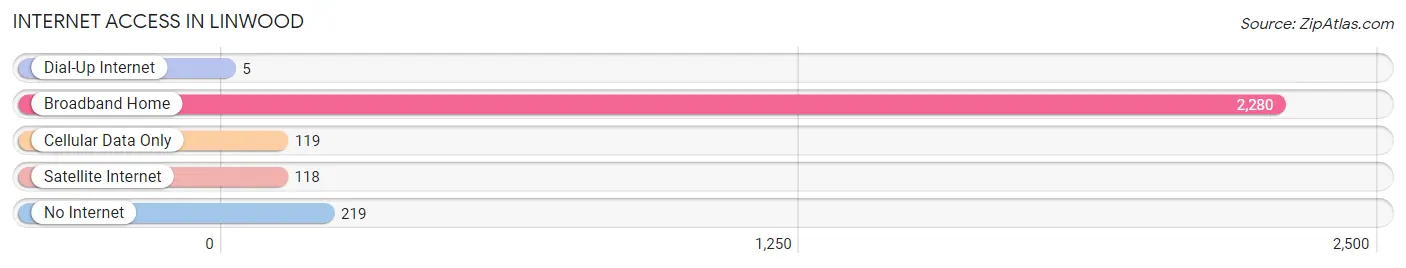
| Internet Type | # Households | % Households |
| Dial-Up Internet | 5 | 0.2% |
| Broadband Home | 2,280 | 85.9% |
| Cellular Data Only | 119 | 4.5% |
| Satellite Internet | 118 | 4.4% |
| No Internet | 219 | 8.3% |
| Total | 2,655 | 100.0% |
Linwood Summary
History
Linwood, New Jersey is a small city located in Atlantic County, New Jersey. It is situated on the banks of the Great Egg Harbor River and is part of the Atlantic City metropolitan area. The city was founded in 1871 and was originally known as “Linwood Park”. The city was named after the Linwood family, who were early settlers in the area.
The city of Linwood has a rich history that dates back to the early 1700s. The area was originally inhabited by the Lenni Lenape Native Americans. The first European settlers arrived in the area in the late 1700s and early 1800s. These settlers were mostly of English and Dutch descent. The city was officially incorporated in 1871 and was named after the Linwood family.
The city of Linwood has a long history of industry and commerce. In the late 1800s, the city was home to several factories, including a paper mill, a glass factory, and a brickyard. The city also had a thriving fishing industry, which was centered around the Great Egg Harbor River.
In the early 1900s, the city experienced a period of growth and prosperity. The city was home to several large businesses, including a shipbuilding company, a canning factory, and a furniture factory. The city also had a thriving tourism industry, with several hotels and resorts located in the area.
Geography
Linwood is located in Atlantic County, New Jersey. It is situated on the banks of the Great Egg Harbor River and is part of the Atlantic City metropolitan area. The city is located approximately 10 miles south of Atlantic City and is bordered by Egg Harbor Township to the north, Absecon to the east, and Northfield to the south.
The city of Linwood covers an area of approximately 4.5 square miles. The city is mostly flat, with some rolling hills in the northern part of the city. The city is located in a temperate climate zone, with hot summers and mild winters. The average annual temperature is around 60 degrees Fahrenheit.
Economy
The economy of Linwood is largely based on tourism and retail. The city is home to several large hotels and resorts, as well as numerous restaurants and shops. The city also has a thriving fishing industry, with several commercial fishing boats operating out of the Great Egg Harbor River.
The city is also home to several large businesses, including a shipbuilding company, a canning factory, and a furniture factory. The city also has a thriving real estate market, with several residential and commercial properties located in the area.
Demographics
As of the 2010 census, the city of Linwood had a population of 8,092. The population is largely white (83.3%), with a small African American population (7.2%) and a small Hispanic population (4.7%). The median household income in the city is $50,945, and the median home value is $220,000. The city has a high rate of homeownership (77.2%), and the unemployment rate is 4.2%.
Common Questions
What is Per Capita Income in Linwood?
Per Capita income in Linwood is $73,858.
What is the Median Family Income in Linwood?
Median Family Income in Linwood is $156,737.
What is the Median Household income in Linwood?
Median Household Income in Linwood is $133,487.
What is Income or Wage Gap in Linwood?
Income or Wage Gap in Linwood is 41.1%.
Women in Linwood earn 58.9 cents for every dollar earned by a man.
What is Inequality or Gini Index in Linwood?
Inequality or Gini Index in Linwood is 0.47.
What is the Total Population of Linwood?
Total Population of Linwood is 6,952.
What is the Total Male Population of Linwood?
Total Male Population of Linwood is 3,203.
What is the Total Female Population of Linwood?
Total Female Population of Linwood is 3,749.
What is the Ratio of Males per 100 Females in Linwood?
There are 85.44 Males per 100 Females in Linwood.
What is the Ratio of Females per 100 Males in Linwood?
There are 117.05 Females per 100 Males in Linwood.
What is the Median Population Age in Linwood?
Median Population Age in Linwood is 48.2 Years.
What is the Average Family Size in Linwood
Average Family Size in Linwood is 3.0 People.
What is the Average Household Size in Linwood
Average Household Size in Linwood is 2.6 People.
How Large is the Labor Force in Linwood?
There are 3,682 People in the Labor Forcein in Linwood.
What is the Percentage of People in the Labor Force in Linwood?
64.9% of People are in the Labor Force in Linwood.
What is the Unemployment Rate in Linwood?
Unemployment Rate in Linwood is 5.4%.