Shamokin Dam borough, PA Map & Demographics
Shamokin Dam borough Overview
$34,793
PER CAPITA INCOME
$91,375
AVG FAMILY INCOME
$73,462
AVG HOUSEHOLD INCOME
32.7%
WAGE / INCOME GAP [ % ]
67.3¢/ $1
WAGE / INCOME GAP [ $ ]
0.37
INEQUALITY / GINI INDEX
1,829
TOTAL POPULATION
865
MALE POPULATION
964
FEMALE POPULATION
89.73
MALES / 100 FEMALES
111.45
FEMALES / 100 MALES
49.1
MEDIAN AGE
2.9
AVG FAMILY SIZE
2.4
AVG HOUSEHOLD SIZE
970
LABOR FORCE [ PEOPLE ]
61.5%
PERCENT IN LABOR FORCE
3.3%
UNEMPLOYMENT RATE
Income in Shamokin Dam borough
Income Overview in Shamokin Dam borough
Per Capita Income in Shamokin Dam borough is $34,793, while median incomes of families and households are $91,375 and $73,462 respectively.
| Characteristic | Number | Measure |
| Per Capita Income | 1,829 | $34,793 |
| Median Family Income | 487 | $91,375 |
| Mean Family Income | 487 | $96,145 |
| Median Household Income | 772 | $73,462 |
| Mean Household Income | 772 | $80,398 |
| Income Deficit | 487 | $0 |
| Wage / Income Gap (%) | 1,829 | 32.65% |
| Wage / Income Gap ($) | 1,829 | 67.35¢ per $1 |
| Gini / Inequality Index | 1,829 | 0.37 |
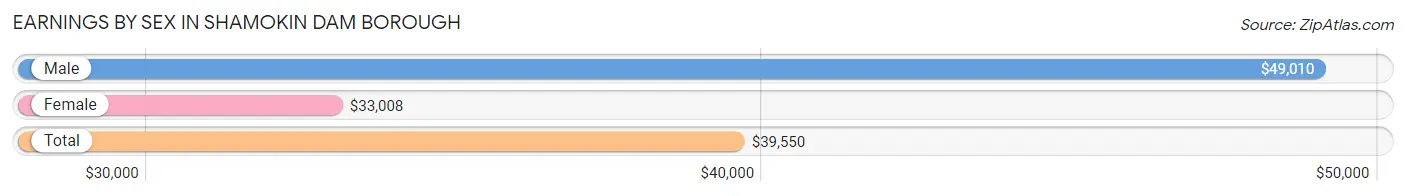
Earnings by Sex in Shamokin Dam borough
Average Earnings in Shamokin Dam borough are $39,550, $49,010 for men and $33,008 for women, a difference of 32.7%.
| Sex | Number | Average Earnings |
| Male | 477 (47.7%) | $49,010 |
| Female | 523 (52.3%) | $33,008 |
| Total | 1,000 (100.0%) | $39,550 |
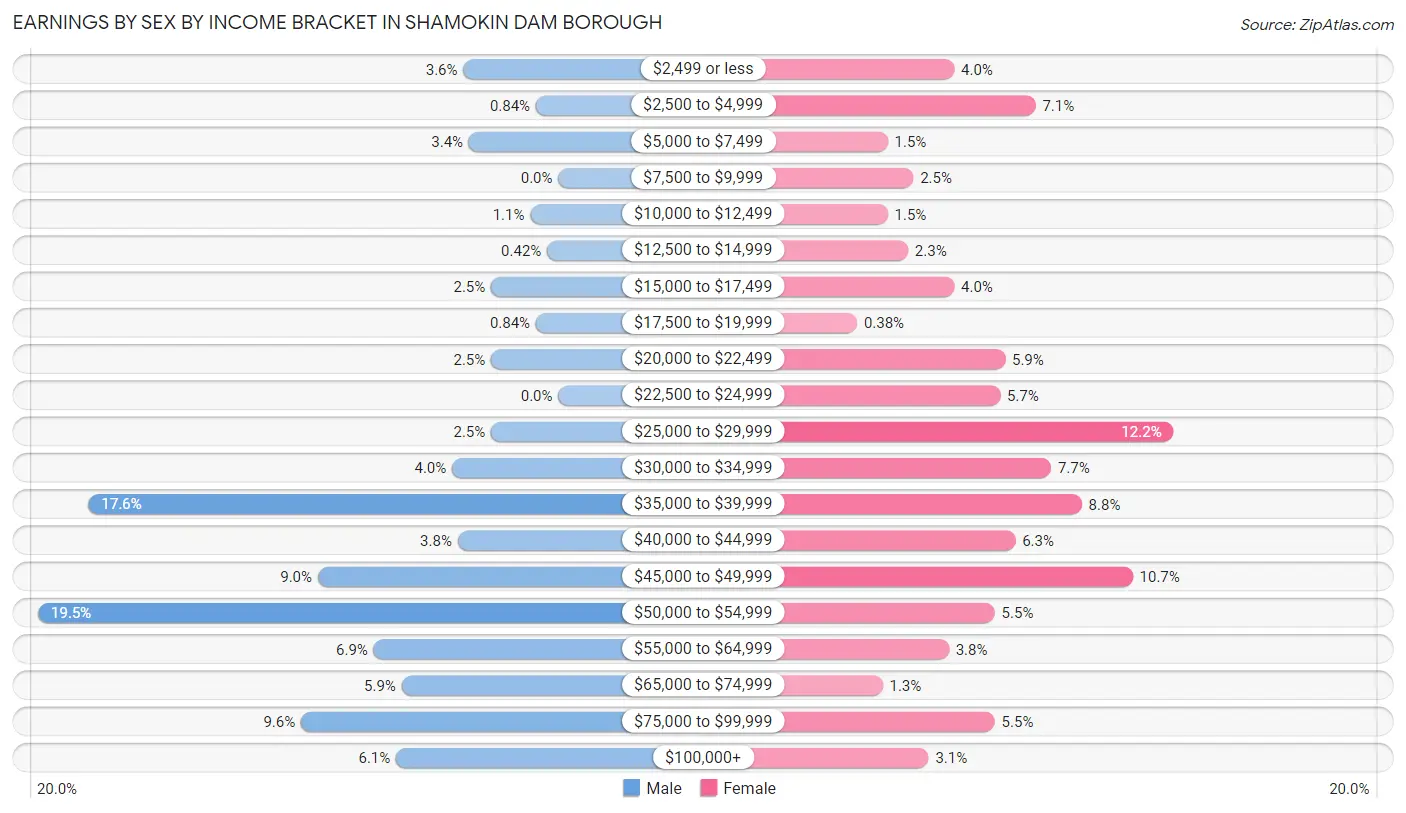
Earnings by Sex by Income Bracket in Shamokin Dam borough
The most common earnings brackets in Shamokin Dam borough are $50,000 to $54,999 for men (93 | 19.5%) and $25,000 to $29,999 for women (64 | 12.2%).
| Income | Male | Female |
| $2,499 or less | 17 (3.6%) | 21 (4.0%) |
| $2,500 to $4,999 | 4 (0.8%) | 37 (7.1%) |
| $5,000 to $7,499 | 16 (3.4%) | 8 (1.5%) |
| $7,500 to $9,999 | 0 (0.0%) | 13 (2.5%) |
| $10,000 to $12,499 | 5 (1.1%) | 8 (1.5%) |
| $12,500 to $14,999 | 2 (0.4%) | 12 (2.3%) |
| $15,000 to $17,499 | 12 (2.5%) | 21 (4.0%) |
| $17,500 to $19,999 | 4 (0.8%) | 2 (0.4%) |
| $20,000 to $22,499 | 12 (2.5%) | 31 (5.9%) |
| $22,500 to $24,999 | 0 (0.0%) | 30 (5.7%) |
| $25,000 to $29,999 | 12 (2.5%) | 64 (12.2%) |
| $30,000 to $34,999 | 19 (4.0%) | 40 (7.6%) |
| $35,000 to $39,999 | 84 (17.6%) | 46 (8.8%) |
| $40,000 to $44,999 | 18 (3.8%) | 33 (6.3%) |
| $45,000 to $49,999 | 43 (9.0%) | 56 (10.7%) |
| $50,000 to $54,999 | 93 (19.5%) | 29 (5.5%) |
| $55,000 to $64,999 | 33 (6.9%) | 20 (3.8%) |
| $65,000 to $74,999 | 28 (5.9%) | 7 (1.3%) |
| $75,000 to $99,999 | 46 (9.6%) | 29 (5.5%) |
| $100,000+ | 29 (6.1%) | 16 (3.1%) |
| Total | 477 (100.0%) | 523 (100.0%) |
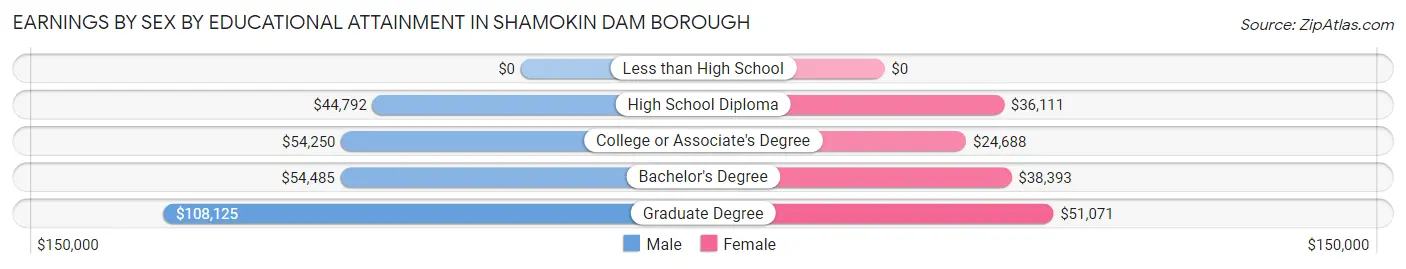
Earnings by Sex by Educational Attainment in Shamokin Dam borough
Average earnings in Shamokin Dam borough are $50,459 for men and $37,212 for women, a difference of 26.3%. Men with an educational attainment of graduate degree enjoy the highest average annual earnings of $108,125, while those with high school diploma education earn the least with $44,792. Women with an educational attainment of graduate degree earn the most with the average annual earnings of $51,071, while those with college or associate's degree education have the smallest earnings of $24,688.
| Educational Attainment | Male Income | Female Income |
| Less than High School | - | - |
| High School Diploma | $44,792 | $36,111 |
| College or Associate's Degree | $54,250 | $24,688 |
| Bachelor's Degree | $54,485 | $38,393 |
| Graduate Degree | $108,125 | $51,071 |
| Total | $50,459 | $37,212 |
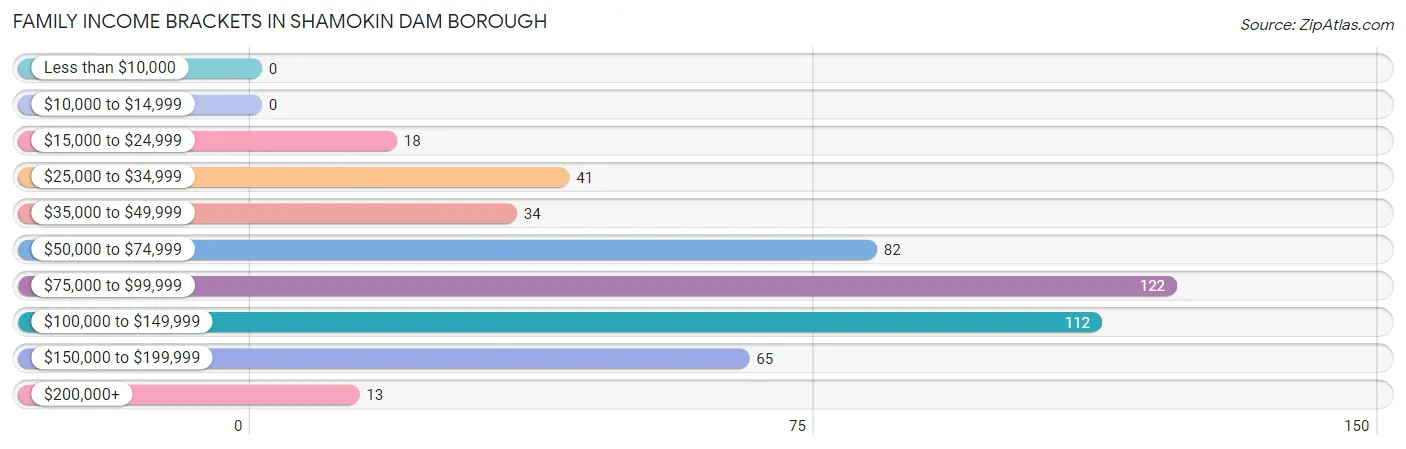
Family Income in Shamokin Dam borough
Family Income Brackets in Shamokin Dam borough
According to the Shamokin Dam borough family income data, there are 122 families falling into the $75,000 to $99,999 income range, which is the most common income bracket and makes up 25.1% of all families.
| Income Bracket | # Families | % Families |
| Less than $10,000 | 0 | 0.0% |
| $10,000 to $14,999 | 0 | 0.0% |
| $15,000 to $24,999 | 18 | 3.7% |
| $25,000 to $34,999 | 41 | 8.4% |
| $35,000 to $49,999 | 34 | 7.0% |
| $50,000 to $74,999 | 82 | 16.8% |
| $75,000 to $99,999 | 122 | 25.1% |
| $100,000 to $149,999 | 112 | 23.0% |
| $150,000 to $199,999 | 65 | 13.3% |
| $200,000+ | 13 | 2.7% |
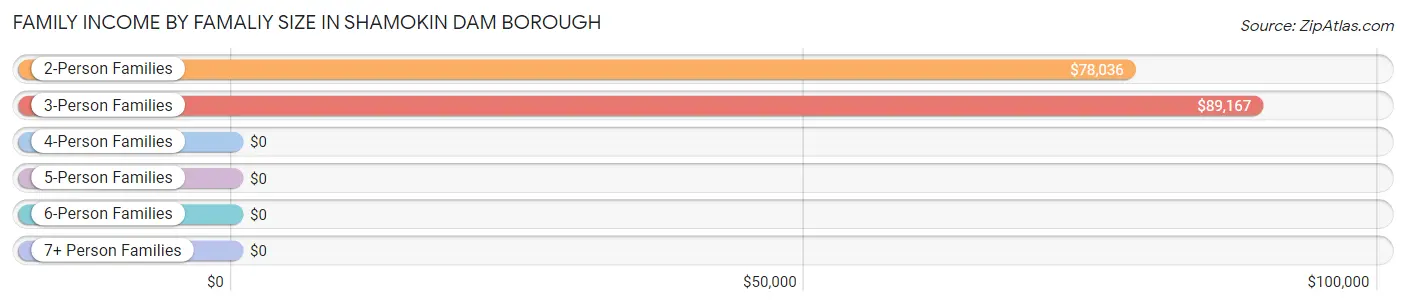
Family Income by Famaliy Size in Shamokin Dam borough
3-person families (68 | 14.0%) account for the highest median family income in Shamokin Dam borough with $89,167 per family, while 2-person families (274 | 56.3%) have the highest median income of $39,018 per family member.
| Income Bracket | # Families | Median Income |
| 2-Person Families | 274 (56.3%) | $78,036 |
| 3-Person Families | 68 (14.0%) | $89,167 |
| 4-Person Families | 110 (22.6%) | $0 |
| 5-Person Families | 18 (3.7%) | $0 |
| 6-Person Families | 17 (3.5%) | $0 |
| 7+ Person Families | 0 (0.0%) | $0 |
| Total | 487 (100.0%) | $91,375 |
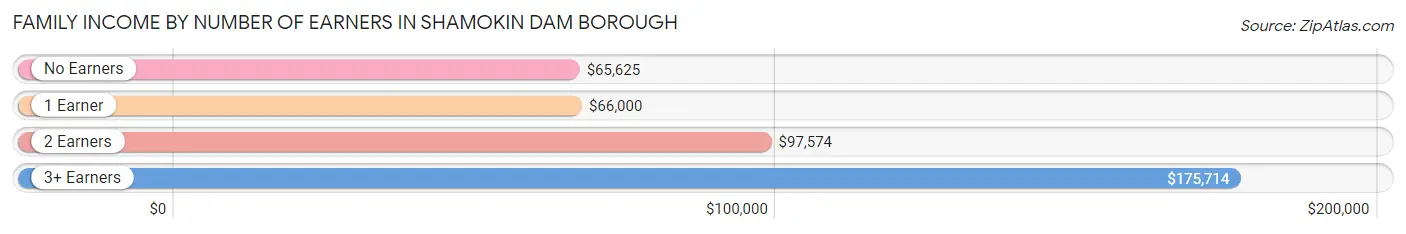
Family Income by Number of Earners in Shamokin Dam borough
The median family income in Shamokin Dam borough is $91,375, with families comprising 3+ earners (100) having the highest median family income of $175,714, while families with no earners (96) have the lowest median family income of $65,625, accounting for 20.5% and 19.7% of families, respectively.
| Number of Earners | # Families | Median Income |
| No Earners | 96 (19.7%) | $65,625 |
| 1 Earner | 152 (31.2%) | $66,000 |
| 2 Earners | 139 (28.5%) | $97,574 |
| 3+ Earners | 100 (20.5%) | $175,714 |
| Total | 487 (100.0%) | $91,375 |
Household Income in Shamokin Dam borough
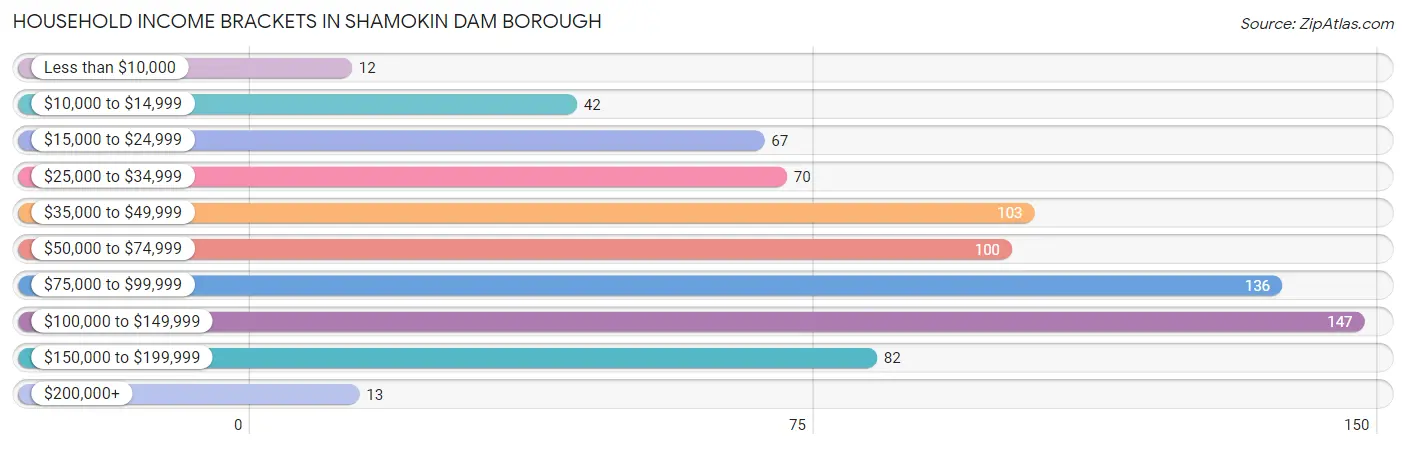
Household Income Brackets in Shamokin Dam borough
With 147 households falling in the category, the $100,000 to $149,999 income range is the most frequent in Shamokin Dam borough, accounting for 19.0% of all households. In contrast, only 12 households (1.5%) fall into the less than $10,000 income bracket, making it the least populous group.
| Income Bracket | # Households | % Households |
| Less than $10,000 | 12 | 1.6% |
| $10,000 to $14,999 | 42 | 5.4% |
| $15,000 to $24,999 | 67 | 8.7% |
| $25,000 to $34,999 | 70 | 9.1% |
| $35,000 to $49,999 | 103 | 13.3% |
| $50,000 to $74,999 | 100 | 13.0% |
| $75,000 to $99,999 | 136 | 17.6% |
| $100,000 to $149,999 | 147 | 19.0% |
| $150,000 to $199,999 | 82 | 10.6% |
| $200,000+ | 13 | 1.7% |
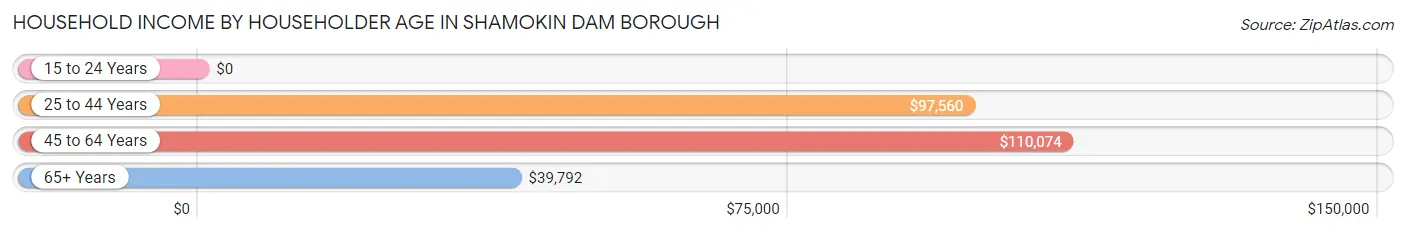
Household Income by Householder Age in Shamokin Dam borough
The median household income in Shamokin Dam borough is $73,462, with the highest median household income of $110,074 found in the 45 to 64 years age bracket for the primary householder. A total of 265 households (34.3%) fall into this category. Meanwhile, the 15 to 24 years age bracket for the primary householder has the lowest median household income of $0, with 12 households (1.5%) in this group.
| Income Bracket | # Households | Median Income |
| 15 to 24 Years | 12 (1.5%) | $0 |
| 25 to 44 Years | 145 (18.8%) | $97,560 |
| 45 to 64 Years | 265 (34.3%) | $110,074 |
| 65+ Years | 350 (45.3%) | $39,792 |
| Total | 772 (100.0%) | $73,462 |
Poverty in Shamokin Dam borough
Income Below Poverty by Sex and Age in Shamokin Dam borough
With 4.6% poverty level for males and 4.3% for females among the residents of Shamokin Dam borough, 65 to 74 year old males and 16 and 17 year old females are the most vulnerable to poverty, with 17 males (15.3%) and 11 females (22.0%) in their respective age groups living below the poverty level.
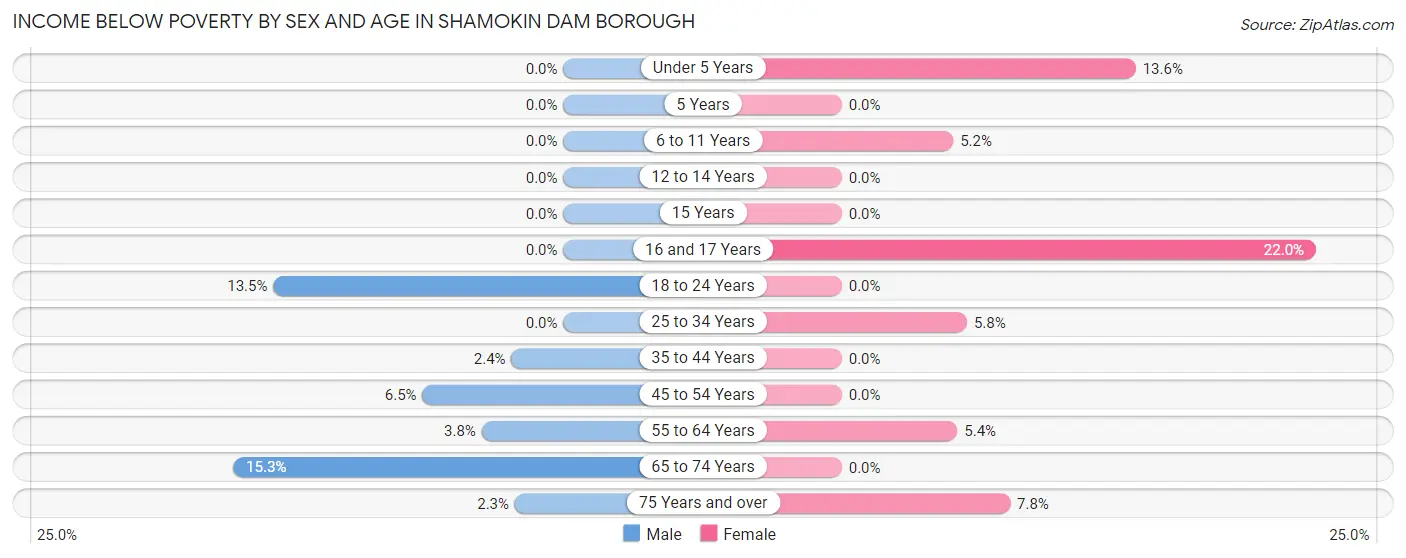
| Age Bracket | Male | Female |
| Under 5 Years | 0 (0.0%) | 3 (13.6%) |
| 5 Years | 0 (0.0%) | 0 (0.0%) |
| 6 to 11 Years | 0 (0.0%) | 3 (5.2%) |
| 12 to 14 Years | 0 (0.0%) | 0 (0.0%) |
| 15 Years | 0 (0.0%) | 0 (0.0%) |
| 16 and 17 Years | 0 (0.0%) | 11 (22.0%) |
| 18 to 24 Years | 7 (13.5%) | 0 (0.0%) |
| 25 to 34 Years | 0 (0.0%) | 5 (5.8%) |
| 35 to 44 Years | 2 (2.4%) | 0 (0.0%) |
| 45 to 54 Years | 7 (6.5%) | 0 (0.0%) |
| 55 to 64 Years | 5 (3.8%) | 9 (5.4%) |
| 65 to 74 Years | 17 (15.3%) | 0 (0.0%) |
| 75 Years and over | 2 (2.2%) | 10 (7.8%) |
| Total | 40 (4.6%) | 41 (4.3%) |
Income Above Poverty by Sex and Age in Shamokin Dam borough
According to the poverty statistics in Shamokin Dam borough, males aged under 5 years and females aged 5 years are the age groups that are most secure financially, with 100.0% of males and 100.0% of females in these age groups living above the poverty line.
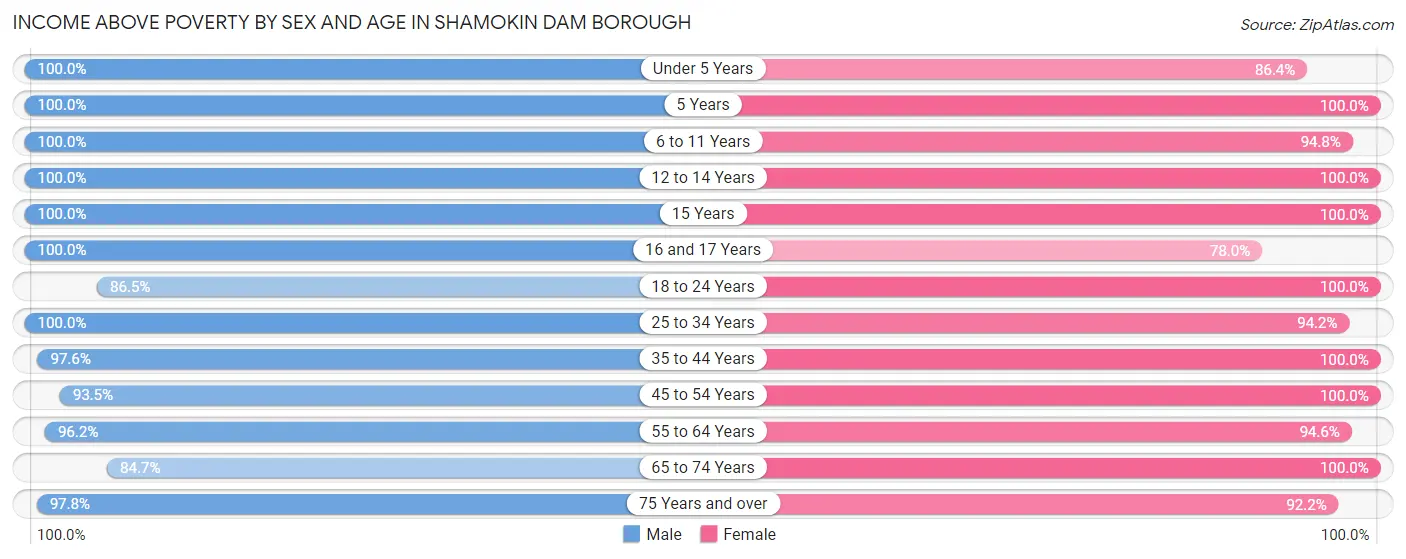
| Age Bracket | Male | Female |
| Under 5 Years | 36 (100.0%) | 19 (86.4%) |
| 5 Years | 15 (100.0%) | 2 (100.0%) |
| 6 to 11 Years | 63 (100.0%) | 55 (94.8%) |
| 12 to 14 Years | 16 (100.0%) | 14 (100.0%) |
| 15 Years | 17 (100.0%) | 9 (100.0%) |
| 16 and 17 Years | 11 (100.0%) | 39 (78.0%) |
| 18 to 24 Years | 45 (86.5%) | 81 (100.0%) |
| 25 to 34 Years | 133 (100.0%) | 81 (94.2%) |
| 35 to 44 Years | 81 (97.6%) | 81 (100.0%) |
| 45 to 54 Years | 100 (93.5%) | 107 (100.0%) |
| 55 to 64 Years | 127 (96.2%) | 159 (94.6%) |
| 65 to 74 Years | 94 (84.7%) | 158 (100.0%) |
| 75 Years and over | 87 (97.8%) | 118 (92.2%) |
| Total | 825 (95.4%) | 923 (95.8%) |
Income Below Poverty Among Married-Couple Families in Shamokin Dam borough
The poverty statistics for married-couple families in Shamokin Dam borough show that 0.8% or 3 of the total 360 families live below the poverty line. Families with 1 or 2 children have the highest poverty rate of 2.4%, comprising of 2 families. On the other hand, families with 3 or 4 children have the lowest poverty rate of 0.0%, which includes 0 families.
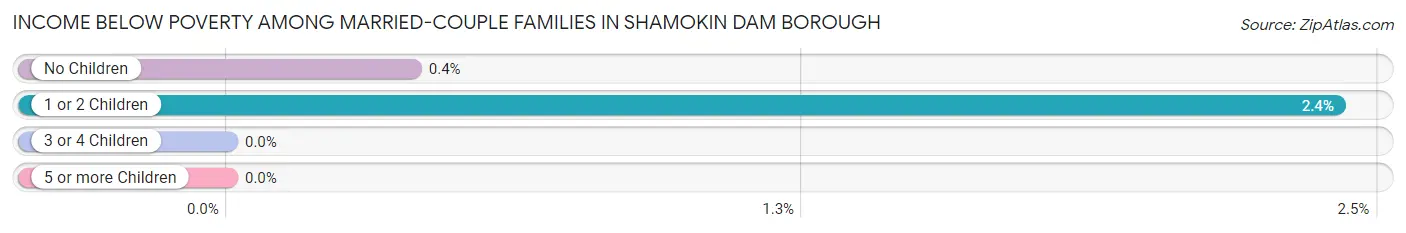
| Children | Above Poverty | Below Poverty |
| No Children | 252 (99.6%) | 1 (0.4%) |
| 1 or 2 Children | 81 (97.6%) | 2 (2.4%) |
| 3 or 4 Children | 24 (100.0%) | 0 (0.0%) |
| 5 or more Children | 0 (0.0%) | 0 (0.0%) |
| Total | 357 (99.2%) | 3 (0.8%) |
Income Below Poverty Among Single-Parent Households in Shamokin Dam borough
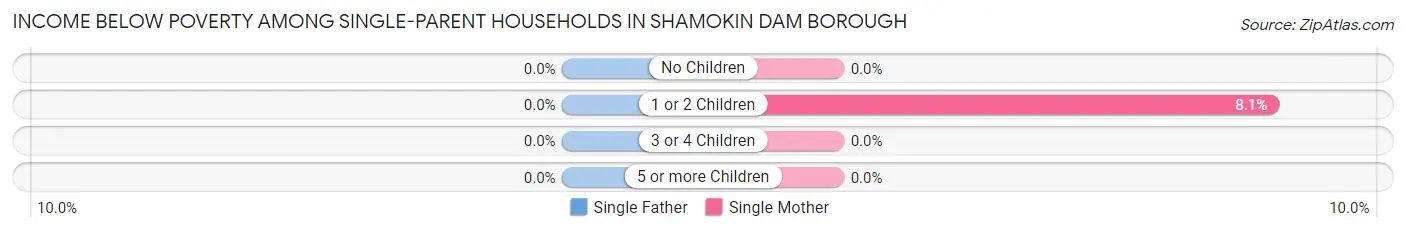
| Children | Single Father | Single Mother |
| No Children | 0 (0.0%) | 0 (0.0%) |
| 1 or 2 Children | 0 (0.0%) | 3 (8.1%) |
| 3 or 4 Children | 0 (0.0%) | 0 (0.0%) |
| 5 or more Children | 0 (0.0%) | 0 (0.0%) |
| Total | 0 (0.0%) | 3 (3.7%) |
Income Below Poverty Among Married-Couple vs Single-Parent Households in Shamokin Dam borough
The poverty data for Shamokin Dam borough shows that 3 of the married-couple family households (0.8%) and 3 of the single-parent households (2.4%) are living below the poverty level. Within the married-couple family households, those with 1 or 2 children have the highest poverty rate, with 2 households (2.4%) falling below the poverty line. Among the single-parent households, those with 1 or 2 children have the highest poverty rate, with 3 household (4.5%) living below poverty.
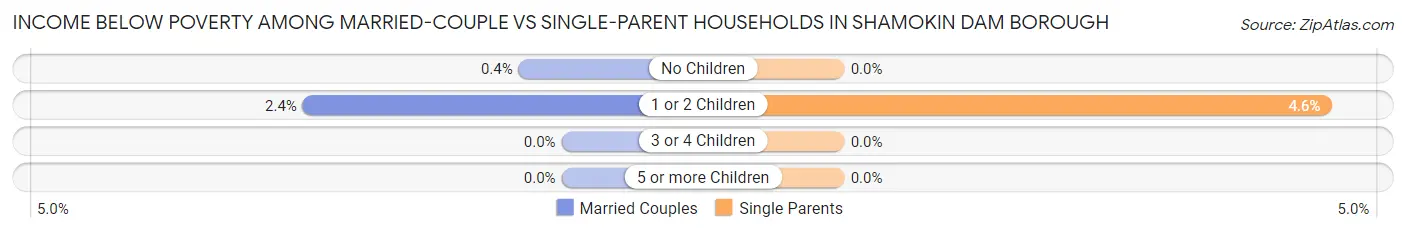
| Children | Married-Couple Families | Single-Parent Households |
| No Children | 1 (0.4%) | 0 (0.0%) |
| 1 or 2 Children | 2 (2.4%) | 3 (4.5%) |
| 3 or 4 Children | 0 (0.0%) | 0 (0.0%) |
| 5 or more Children | 0 (0.0%) | 0 (0.0%) |
| Total | 3 (0.8%) | 3 (2.4%) |
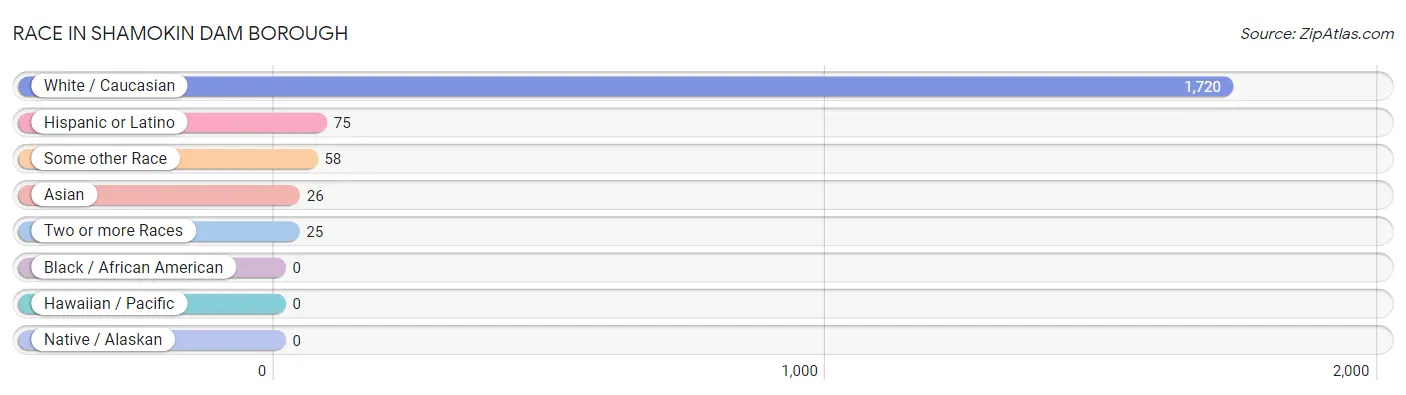
Race in Shamokin Dam borough
The most populous races in Shamokin Dam borough are White / Caucasian (1,720 | 94.0%), Hispanic or Latino (75 | 4.1%), and Some other Race (58 | 3.2%).
| Race | # Population | % Population |
| Asian | 26 | 1.4% |
| Black / African American | 0 | 0.0% |
| Hawaiian / Pacific | 0 | 0.0% |
| Hispanic or Latino | 75 | 4.1% |
| Native / Alaskan | 0 | 0.0% |
| White / Caucasian | 1,720 | 94.0% |
| Two or more Races | 25 | 1.4% |
| Some other Race | 58 | 3.2% |
| Total | 1,829 | 100.0% |
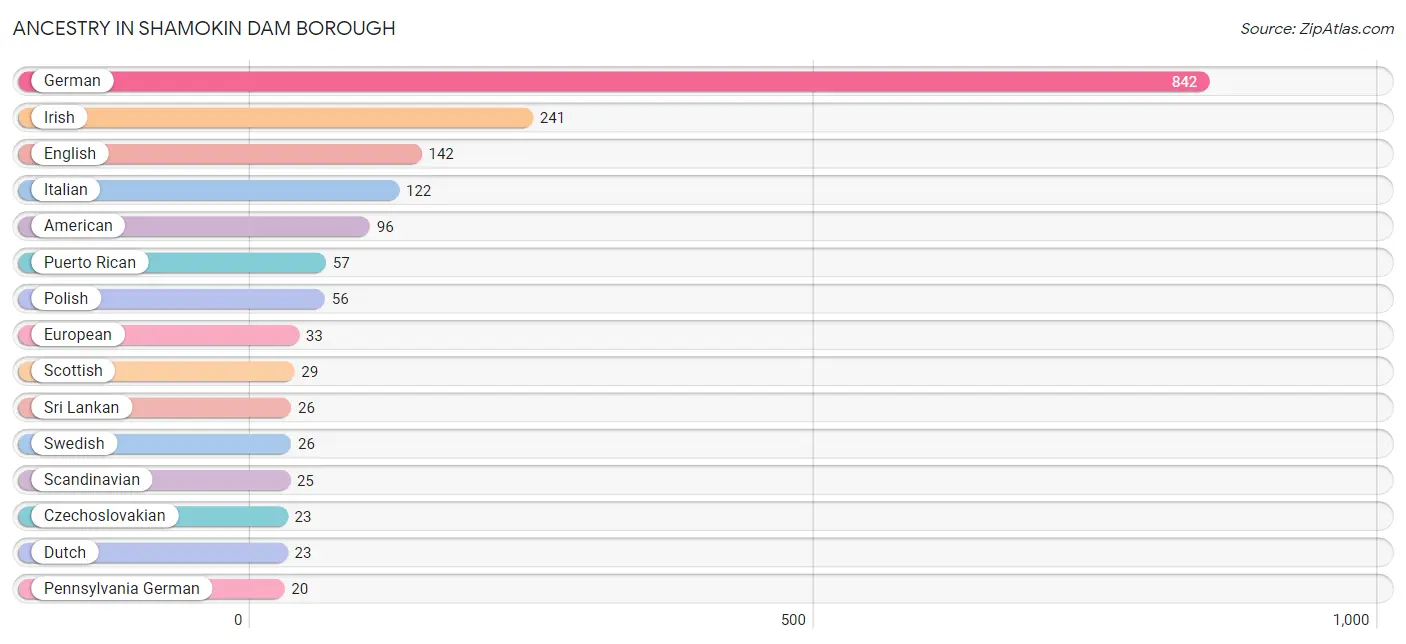
Ancestry in Shamokin Dam borough
The most populous ancestries reported in Shamokin Dam borough are German (842 | 46.0%), Irish (241 | 13.2%), English (142 | 7.8%), Italian (122 | 6.7%), and American (96 | 5.2%), together accounting for 78.9% of all Shamokin Dam borough residents.
| Ancestry | # Population | % Population |
| American | 96 | 5.2% |
| Austrian | 3 | 0.2% |
| British | 2 | 0.1% |
| Cypriot | 4 | 0.2% |
| Czechoslovakian | 23 | 1.3% |
| Dutch | 23 | 1.3% |
| Eastern European | 5 | 0.3% |
| English | 142 | 7.8% |
| European | 33 | 1.8% |
| French | 9 | 0.5% |
| French Canadian | 7 | 0.4% |
| German | 842 | 46.0% |
| Irish | 241 | 13.2% |
| Italian | 122 | 6.7% |
| Lithuanian | 1 | 0.1% |
| Mexican | 15 | 0.8% |
| Pennsylvania German | 20 | 1.1% |
| Polish | 56 | 3.1% |
| Puerto Rican | 57 | 3.1% |
| Scandinavian | 25 | 1.4% |
| Scotch-Irish | 10 | 0.5% |
| Scottish | 29 | 1.6% |
| Sri Lankan | 26 | 1.4% |
| Swedish | 26 | 1.4% |
| Swiss | 14 | 0.8% |
| Welsh | 4 | 0.2% | View All 26 Rows |
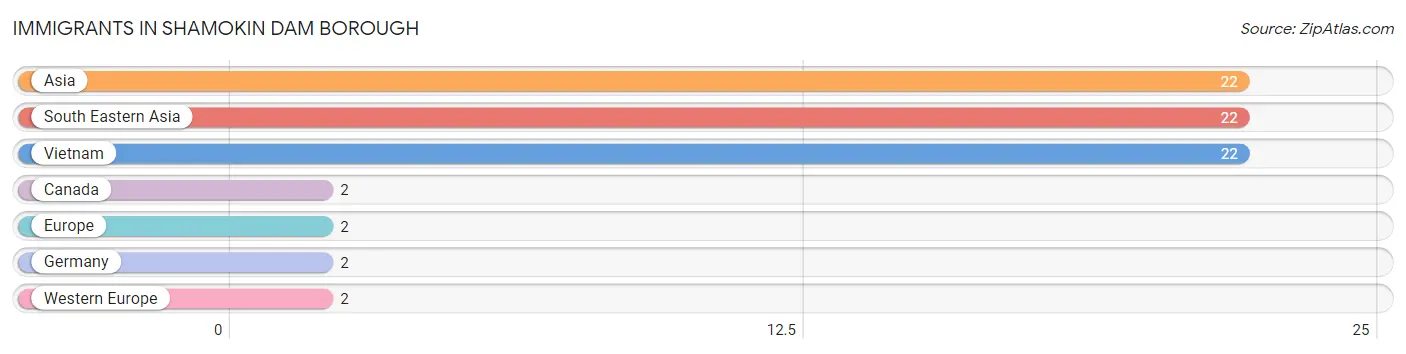
Immigrants in Shamokin Dam borough
The most numerous immigrant groups reported in Shamokin Dam borough came from Asia (22 | 1.2%), South Eastern Asia (22 | 1.2%), Vietnam (22 | 1.2%), Canada (2 | 0.1%), and Europe (2 | 0.1%), together accounting for 3.8% of all Shamokin Dam borough residents.
| Immigration Origin | # Population | % Population |
| Asia | 22 | 1.2% |
| Canada | 2 | 0.1% |
| Europe | 2 | 0.1% |
| Germany | 2 | 0.1% |
| South Eastern Asia | 22 | 1.2% |
| Vietnam | 22 | 1.2% |
| Western Europe | 2 | 0.1% | View All 7 Rows |
Sex and Age in Shamokin Dam borough
Sex and Age in Shamokin Dam borough
The most populous age groups in Shamokin Dam borough are 55 to 59 Years (91 | 10.5%) for men and 55 to 59 Years (91 | 9.4%) for women.
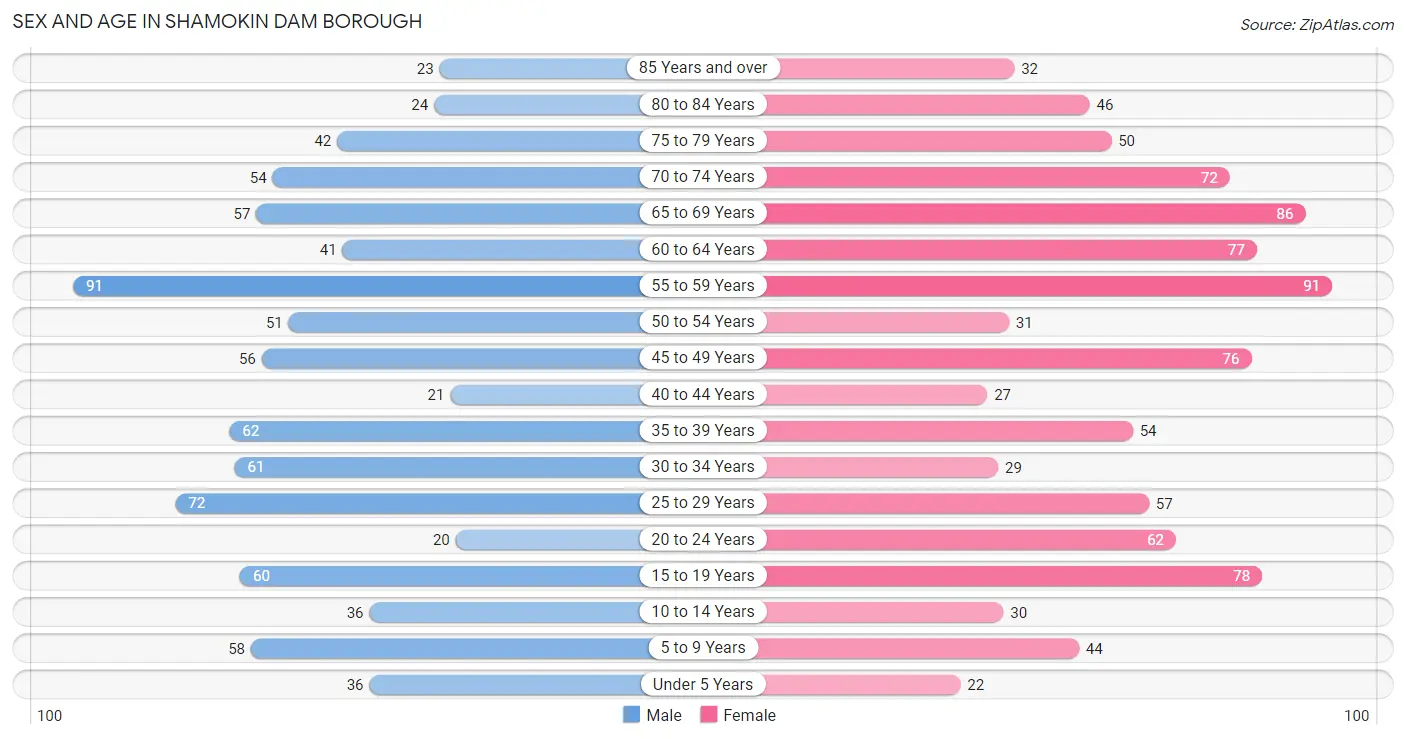
| Age Bracket | Male | Female |
| Under 5 Years | 36 (4.2%) | 22 (2.3%) |
| 5 to 9 Years | 58 (6.7%) | 44 (4.6%) |
| 10 to 14 Years | 36 (4.2%) | 30 (3.1%) |
| 15 to 19 Years | 60 (6.9%) | 78 (8.1%) |
| 20 to 24 Years | 20 (2.3%) | 62 (6.4%) |
| 25 to 29 Years | 72 (8.3%) | 57 (5.9%) |
| 30 to 34 Years | 61 (7.0%) | 29 (3.0%) |
| 35 to 39 Years | 62 (7.2%) | 54 (5.6%) |
| 40 to 44 Years | 21 (2.4%) | 27 (2.8%) |
| 45 to 49 Years | 56 (6.5%) | 76 (7.9%) |
| 50 to 54 Years | 51 (5.9%) | 31 (3.2%) |
| 55 to 59 Years | 91 (10.5%) | 91 (9.4%) |
| 60 to 64 Years | 41 (4.7%) | 77 (8.0%) |
| 65 to 69 Years | 57 (6.6%) | 86 (8.9%) |
| 70 to 74 Years | 54 (6.2%) | 72 (7.5%) |
| 75 to 79 Years | 42 (4.9%) | 50 (5.2%) |
| 80 to 84 Years | 24 (2.8%) | 46 (4.8%) |
| 85 Years and over | 23 (2.7%) | 32 (3.3%) |
| Total | 865 (100.0%) | 964 (100.0%) |
Families and Households in Shamokin Dam borough
Median Family Size in Shamokin Dam borough
The median family size in Shamokin Dam borough is 2.90 persons per family, with married-couple families (360 | 73.9%) accounting for the largest median family size of 3.04 persons per family. On the other hand, single male/father families (46 | 9.5%) represent the smallest median family size with 2.26 persons per family.
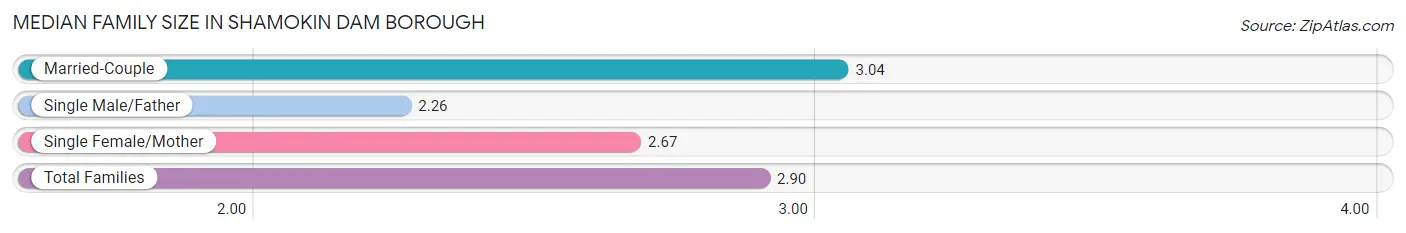
| Family Type | # Families | Family Size |
| Married-Couple | 360 (73.9%) | 3.04 |
| Single Male/Father | 46 (9.5%) | 2.26 |
| Single Female/Mother | 81 (16.6%) | 2.67 |
| Total Families | 487 (100.0%) | 2.90 |
Median Household Size in Shamokin Dam borough
The median household size in Shamokin Dam borough is 2.36 persons per household, with single male/father households (46 | 6.0%) accounting for the largest median household size of 3.39 persons per household. non-family households (285 | 36.9%) represent the smallest median household size with 1.12 persons per household.
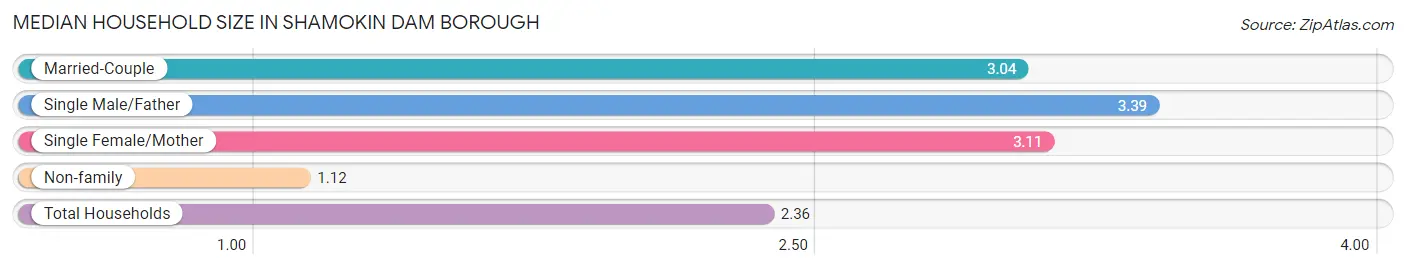
| Household Type | # Households | Household Size |
| Married-Couple | 360 (46.6%) | 3.04 |
| Single Male/Father | 46 (6.0%) | 3.39 |
| Single Female/Mother | 81 (10.5%) | 3.11 |
| Non-family | 285 (36.9%) | 1.12 |
| Total Households | 772 (100.0%) | 2.36 |
Household Size by Marriage Status in Shamokin Dam borough
Out of a total of 772 households in Shamokin Dam borough, 487 (63.1%) are family households, while 285 (36.9%) are nonfamily households. The most numerous type of family households are 2-person households, comprising 242, and the most common type of nonfamily households are 1-person households, comprising 258.
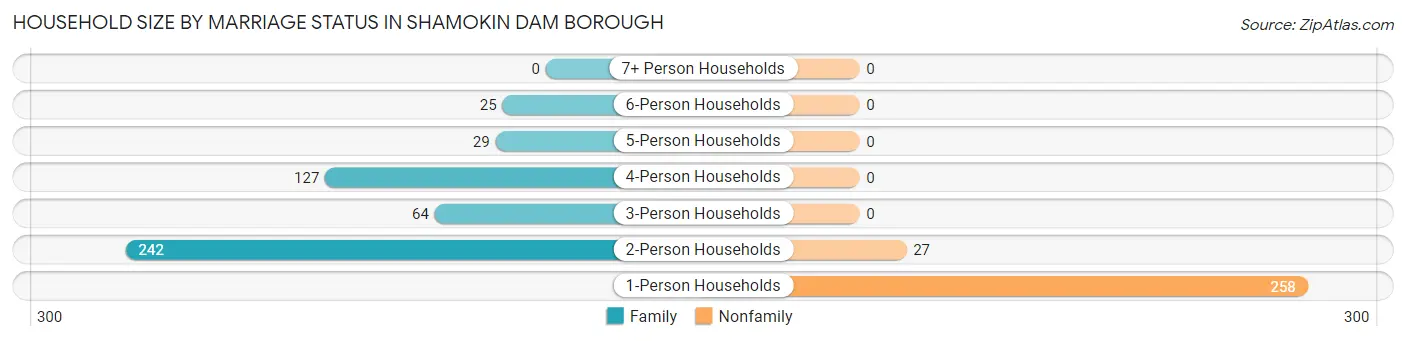
| Household Size | Family Households | Nonfamily Households |
| 1-Person Households | - | 258 (33.4%) |
| 2-Person Households | 242 (31.4%) | 27 (3.5%) |
| 3-Person Households | 64 (8.3%) | 0 (0.0%) |
| 4-Person Households | 127 (16.5%) | 0 (0.0%) |
| 5-Person Households | 29 (3.8%) | 0 (0.0%) |
| 6-Person Households | 25 (3.2%) | 0 (0.0%) |
| 7+ Person Households | 0 (0.0%) | 0 (0.0%) |
| Total | 487 (63.1%) | 285 (36.9%) |
Female Fertility in Shamokin Dam borough
Fertility by Age in Shamokin Dam borough
Average fertility rate in Shamokin Dam borough is 47.0 births per 1,000 women. Women in the age bracket of 20 to 34 years have the highest fertility rate with 95.0 births per 1,000 women. Women in the age bracket of 20 to 34 years acount for 77.8% of all women with births.
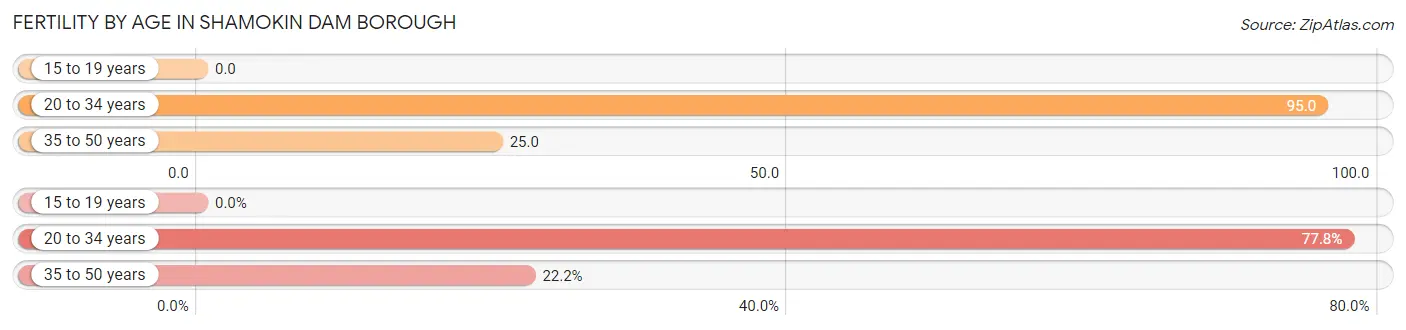
| Age Bracket | Women with Births | Births / 1,000 Women |
| 15 to 19 years | 0 (0.0%) | 0.0 |
| 20 to 34 years | 14 (77.8%) | 95.0 |
| 35 to 50 years | 4 (22.2%) | 25.0 |
| Total | 18 (100.0%) | 47.0 |
Fertility by Age by Marriage Status in Shamokin Dam borough
50.0% of women with births (18) in Shamokin Dam borough are married. The highest percentage of unmarried women with births falls into 20 to 34 years age bracket with 64.3% of them unmarried at the time of birth, while the lowest percentage of unmarried women with births belong to 35 to 50 years age bracket with 0.0% of them unmarried.
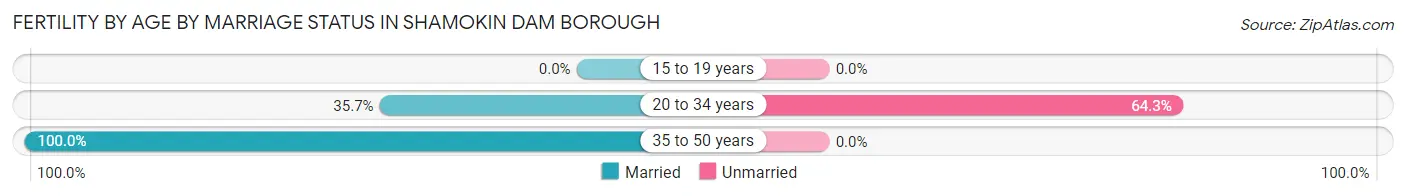
| Age Bracket | Married | Unmarried |
| 15 to 19 years | 0 (0.0%) | 0 (0.0%) |
| 20 to 34 years | 5 (35.7%) | 9 (64.3%) |
| 35 to 50 years | 4 (100.0%) | 0 (0.0%) |
| Total | 9 (50.0%) | 9 (50.0%) |
Fertility by Education in Shamokin Dam borough
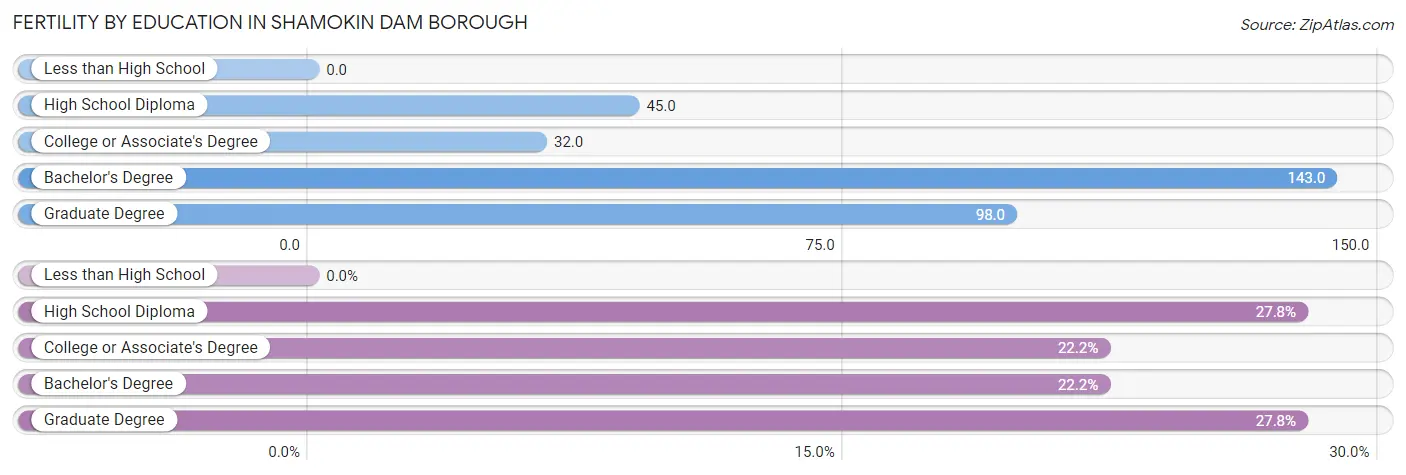
| Educational Attainment | Women with Births | Births / 1,000 Women |
| Less than High School | 0 (0.0%) | 0.0 |
| High School Diploma | 5 (27.8%) | 45.0 |
| College or Associate's Degree | 4 (22.2%) | 32.0 |
| Bachelor's Degree | 4 (22.2%) | 143.0 |
| Graduate Degree | 5 (27.8%) | 98.0 |
| Total | 18 (100.0%) | 47.0 |
Fertility by Education by Marriage Status in Shamokin Dam borough
50.0% of women with births in Shamokin Dam borough are unmarried. Women with the educational attainment of college or associate's degree are most likely to be married with 100.0% of them married at childbirth, while women with the educational attainment of high school diploma are least likely to be married with 100.0% of them unmarried at childbirth.
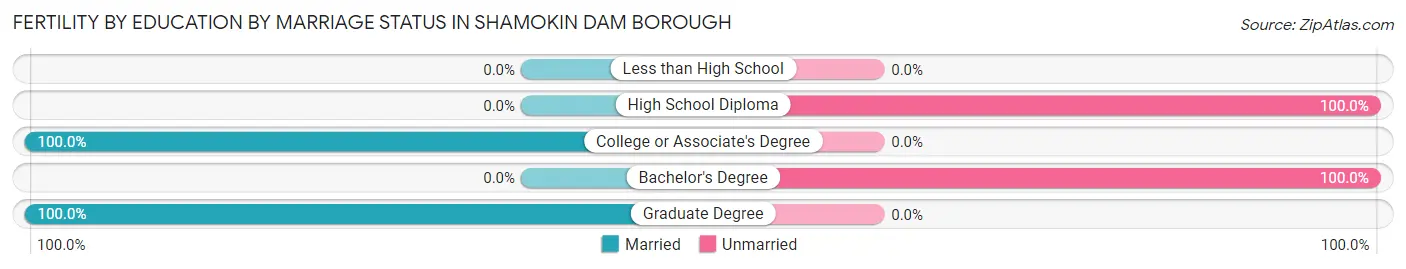
| Educational Attainment | Married | Unmarried |
| Less than High School | 0 (0.0%) | 0 (0.0%) |
| High School Diploma | 0 (0.0%) | 5 (100.0%) |
| College or Associate's Degree | 4 (100.0%) | 0 (0.0%) |
| Bachelor's Degree | 0 (0.0%) | 4 (100.0%) |
| Graduate Degree | 5 (100.0%) | 0 (0.0%) |
| Total | 9 (50.0%) | 9 (50.0%) |
Employment Characteristics in Shamokin Dam borough
Employment by Class of Employer in Shamokin Dam borough
Among the 938 employed individuals in Shamokin Dam borough, private company employees (592 | 63.1%), not-for-profit organizations (139 | 14.8%), and state government employees (87 | 9.3%) make up the most common classes of employment.
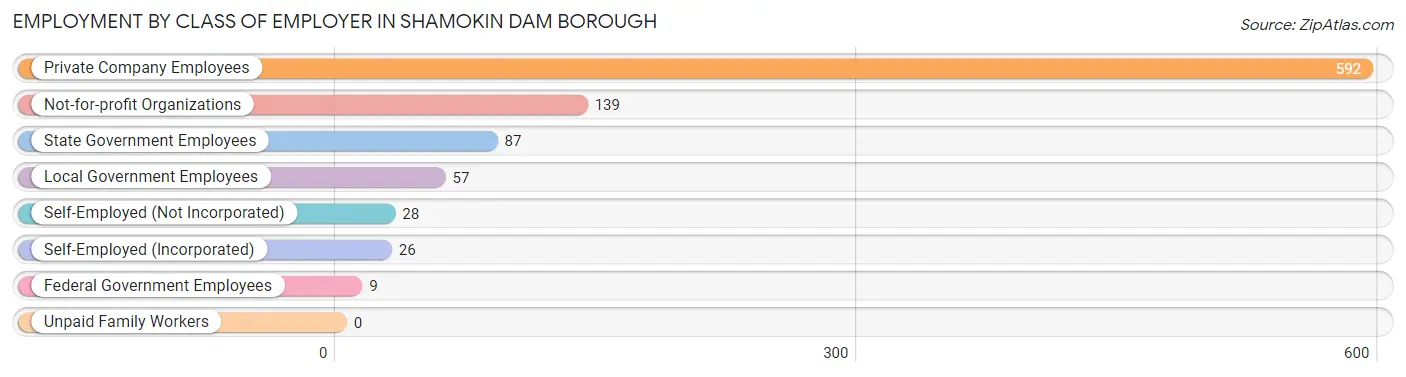
| Employer Class | # Employees | % Employees |
| Private Company Employees | 592 | 63.1% |
| Self-Employed (Incorporated) | 26 | 2.8% |
| Self-Employed (Not Incorporated) | 28 | 3.0% |
| Not-for-profit Organizations | 139 | 14.8% |
| Local Government Employees | 57 | 6.1% |
| State Government Employees | 87 | 9.3% |
| Federal Government Employees | 9 | 1.0% |
| Unpaid Family Workers | 0 | 0.0% |
| Total | 938 | 100.0% |
Employment Status by Age in Shamokin Dam borough
According to the labor force statistics for Shamokin Dam borough, out of the total population over 16 years of age (1,577), 61.5% or 970 individuals are in the labor force, with 3.3% or 32 of them unemployed. The age group with the highest labor force participation rate is 45 to 54 years, with 97.7% or 209 individuals in the labor force. Within the labor force, the 16 to 19 years age range has the highest percentage of unemployed individuals, with 11.3% or 8 of them being unemployed.
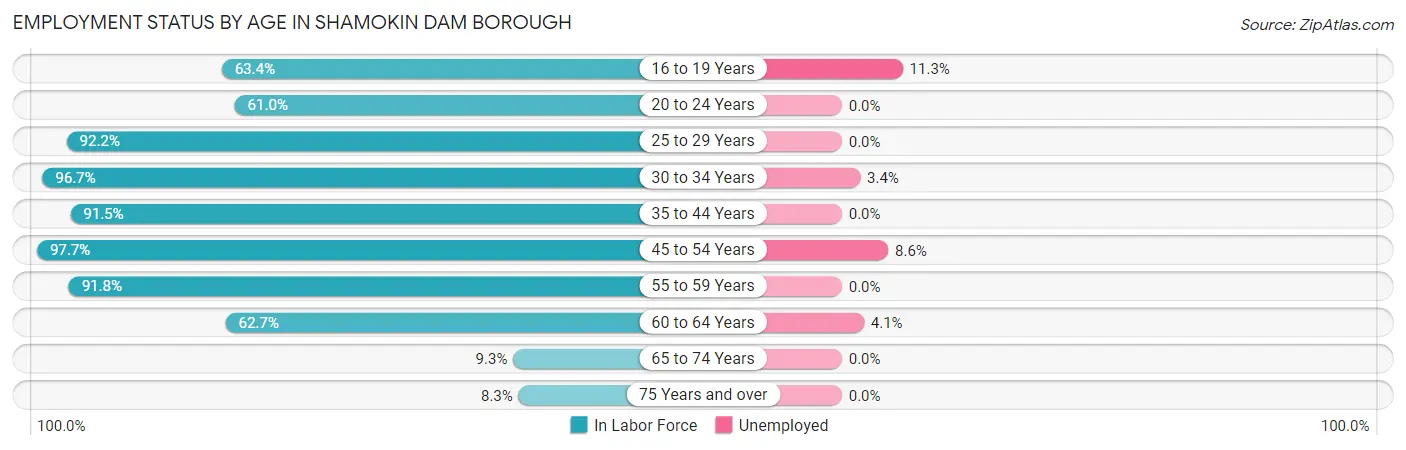
| Age Bracket | In Labor Force | Unemployed |
| 16 to 19 Years | 71 (63.4%) | 8 (11.3%) |
| 20 to 24 Years | 50 (61.0%) | 0 (0.0%) |
| 25 to 29 Years | 119 (92.2%) | 0 (0.0%) |
| 30 to 34 Years | 87 (96.7%) | 3 (3.4%) |
| 35 to 44 Years | 150 (91.5%) | 0 (0.0%) |
| 45 to 54 Years | 209 (97.7%) | 18 (8.6%) |
| 55 to 59 Years | 167 (91.8%) | 0 (0.0%) |
| 60 to 64 Years | 74 (62.7%) | 3 (4.1%) |
| 65 to 74 Years | 25 (9.3%) | 0 (0.0%) |
| 75 Years and over | 18 (8.3%) | 0 (0.0%) |
| Total | 970 (61.5%) | 32 (3.3%) |
Employment Status by Educational Attainment in Shamokin Dam borough
According to labor force statistics for Shamokin Dam borough, 89.9% of individuals (806) out of the total population between 25 and 64 years of age (897) are in the labor force, with 3.0% or 24 of them being unemployed. The group with the highest labor force participation rate are those with the educational attainment of college / associate degree, with 92.7% or 178 individuals in the labor force. Within the labor force, individuals with less than high school education have the highest percentage of unemployment, with 10.5% or 4 of them being unemployed.
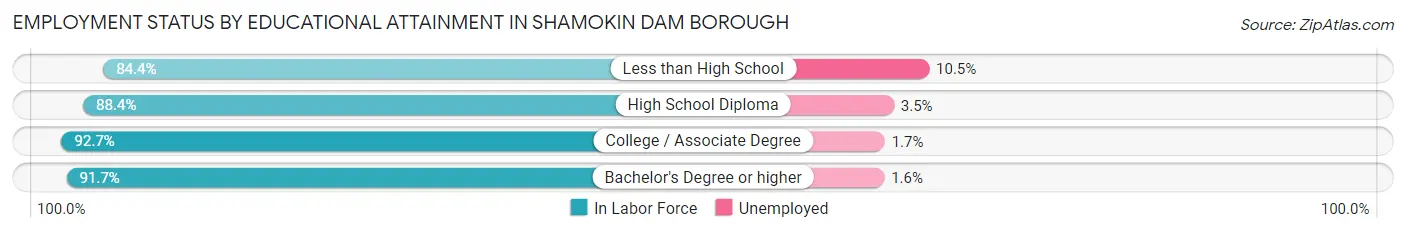
| Educational Attainment | In Labor Force | Unemployed |
| Less than High School | 38 (84.4%) | 5 (10.5%) |
| High School Diploma | 403 (88.4%) | 16 (3.5%) |
| College / Associate Degree | 178 (92.7%) | 3 (1.7%) |
| Bachelor's Degree or higher | 187 (91.7%) | 3 (1.6%) |
| Total | 806 (89.9%) | 27 (3.0%) |
Employment Occupations by Sex in Shamokin Dam borough
Management, Business, Science and Arts Occupations
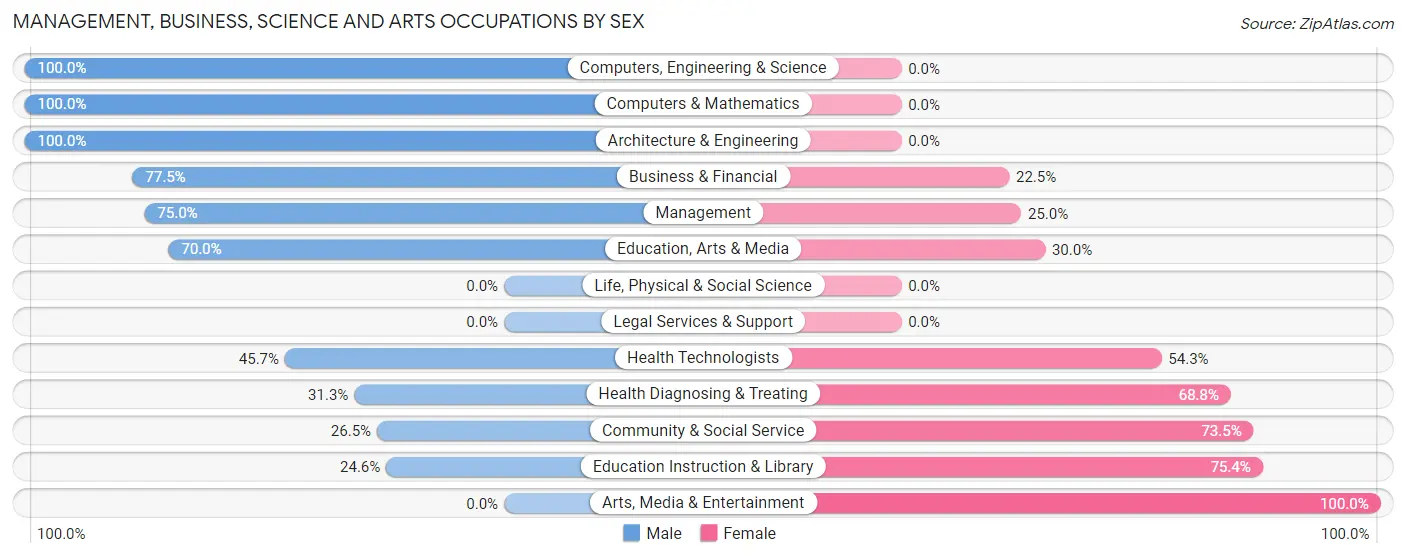
The most common Management, Business, Science and Arts occupations in Shamokin Dam borough are Community & Social Service (83 | 8.8%), Health Diagnosing & Treating (64 | 6.8%), Education Instruction & Library (61 | 6.5%), Business & Financial (40 | 4.3%), and Health Technologists (35 | 3.7%).
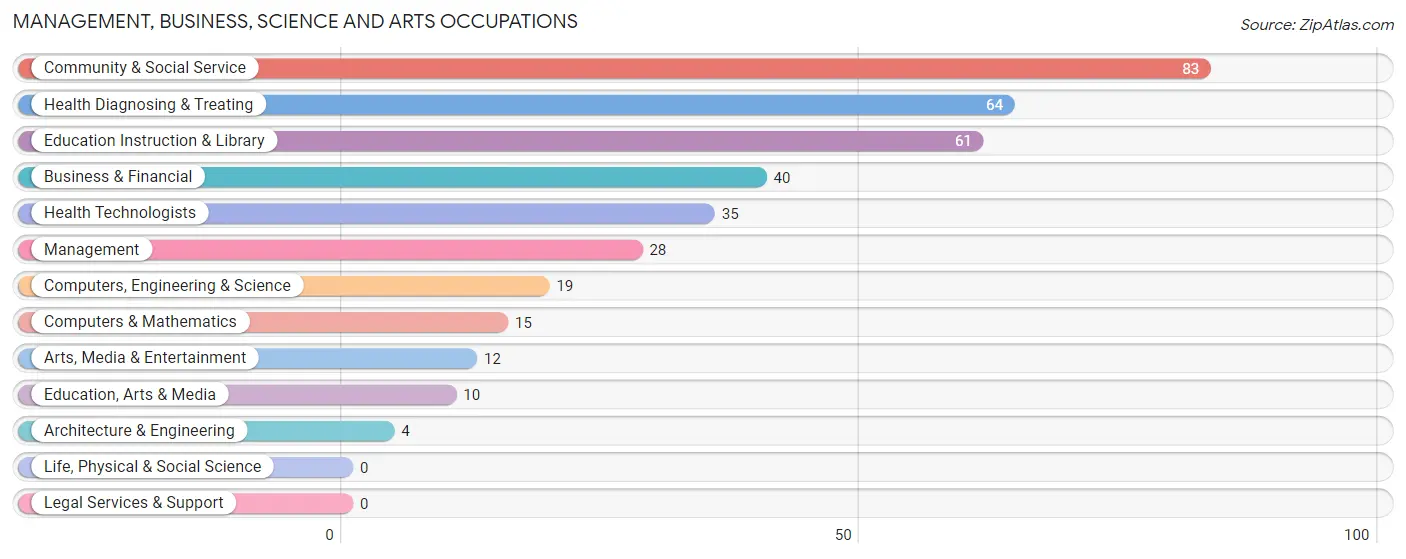
Management, Business, Science and Arts Occupations by Sex
Within the Management, Business, Science and Arts occupations in Shamokin Dam borough, the most male-oriented occupations are Computers, Engineering & Science (100.0%), Computers & Mathematics (100.0%), and Architecture & Engineering (100.0%), while the most female-oriented occupations are Arts, Media & Entertainment (100.0%), Education Instruction & Library (75.4%), and Community & Social Service (73.5%).
| Occupation | Male | Female |
| Management | 21 (75.0%) | 7 (25.0%) |
| Business & Financial | 31 (77.5%) | 9 (22.5%) |
| Computers, Engineering & Science | 19 (100.0%) | 0 (0.0%) |
| Computers & Mathematics | 15 (100.0%) | 0 (0.0%) |
| Architecture & Engineering | 4 (100.0%) | 0 (0.0%) |
| Life, Physical & Social Science | 0 (0.0%) | 0 (0.0%) |
| Community & Social Service | 22 (26.5%) | 61 (73.5%) |
| Education, Arts & Media | 7 (70.0%) | 3 (30.0%) |
| Legal Services & Support | 0 (0.0%) | 0 (0.0%) |
| Education Instruction & Library | 15 (24.6%) | 46 (75.4%) |
| Arts, Media & Entertainment | 0 (0.0%) | 12 (100.0%) |
| Health Diagnosing & Treating | 20 (31.2%) | 44 (68.8%) |
| Health Technologists | 16 (45.7%) | 19 (54.3%) |
| Total (Category) | 113 (48.3%) | 121 (51.7%) |
| Total (Overall) | 453 (48.3%) | 485 (51.7%) |
Services Occupations
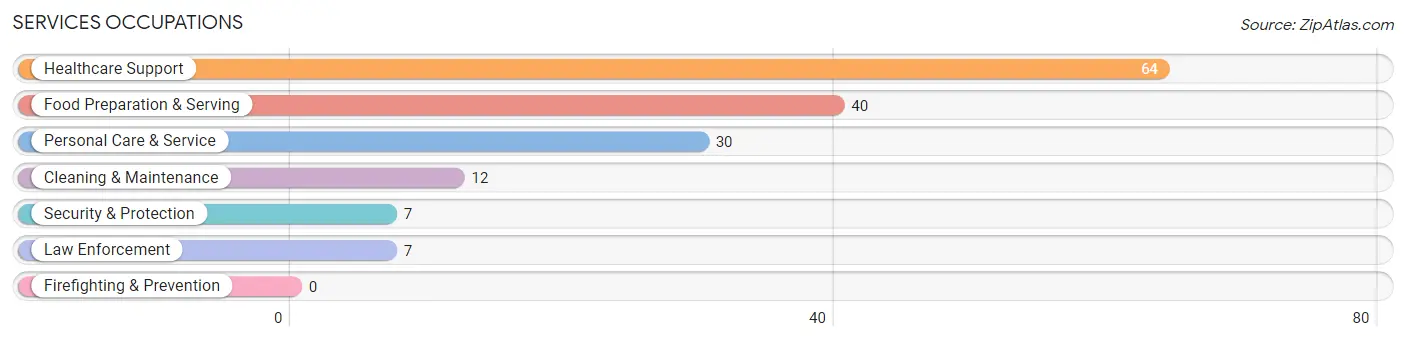
The most common Services occupations in Shamokin Dam borough are Healthcare Support (64 | 6.8%), Food Preparation & Serving (40 | 4.3%), Personal Care & Service (30 | 3.2%), Cleaning & Maintenance (12 | 1.3%), and Security & Protection (7 | 0.7%).
Services Occupations by Sex
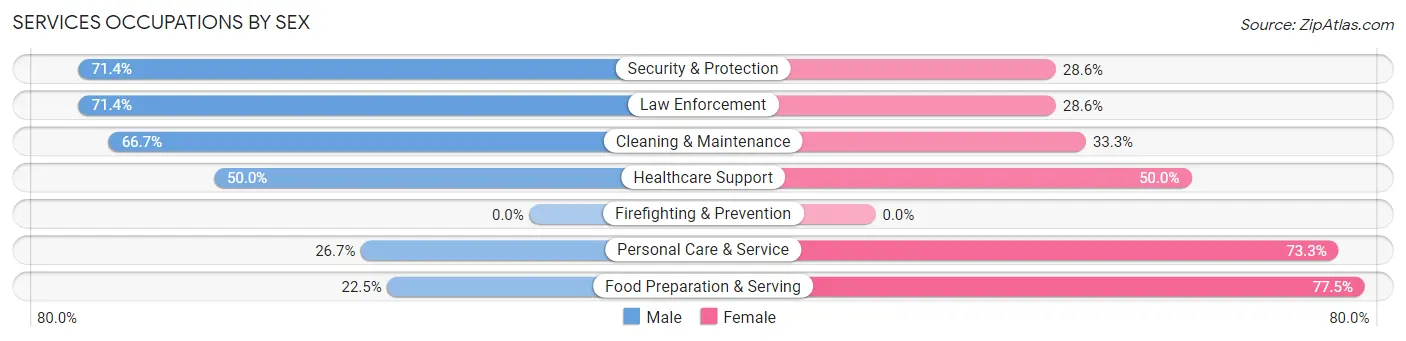
Within the Services occupations in Shamokin Dam borough, the most male-oriented occupations are Security & Protection (71.4%), Law Enforcement (71.4%), and Cleaning & Maintenance (66.7%), while the most female-oriented occupations are Food Preparation & Serving (77.5%), Personal Care & Service (73.3%), and Healthcare Support (50.0%).
| Occupation | Male | Female |
| Healthcare Support | 32 (50.0%) | 32 (50.0%) |
| Security & Protection | 5 (71.4%) | 2 (28.6%) |
| Firefighting & Prevention | 0 (0.0%) | 0 (0.0%) |
| Law Enforcement | 5 (71.4%) | 2 (28.6%) |
| Food Preparation & Serving | 9 (22.5%) | 31 (77.5%) |
| Cleaning & Maintenance | 8 (66.7%) | 4 (33.3%) |
| Personal Care & Service | 8 (26.7%) | 22 (73.3%) |
| Total (Category) | 62 (40.5%) | 91 (59.5%) |
| Total (Overall) | 453 (48.3%) | 485 (51.7%) |
Sales and Office Occupations
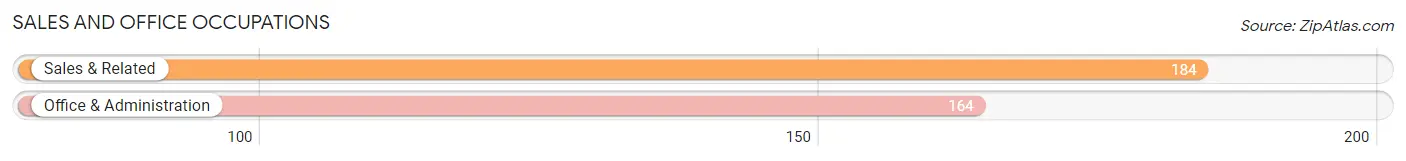
The most common Sales and Office occupations in Shamokin Dam borough are Sales & Related (184 | 19.6%), and Office & Administration (164 | 17.5%).
Sales and Office Occupations by Sex
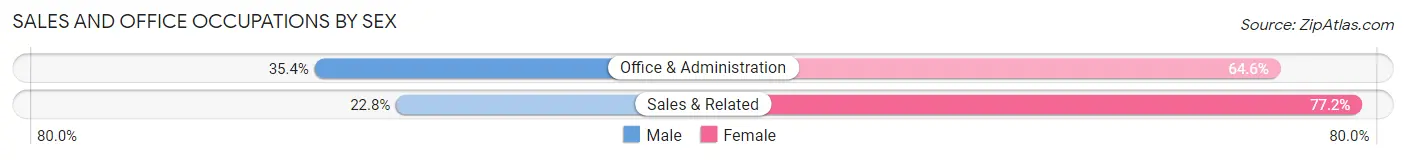
| Occupation | Male | Female |
| Sales & Related | 42 (22.8%) | 142 (77.2%) |
| Office & Administration | 58 (35.4%) | 106 (64.6%) |
| Total (Category) | 100 (28.7%) | 248 (71.3%) |
| Total (Overall) | 453 (48.3%) | 485 (51.7%) |
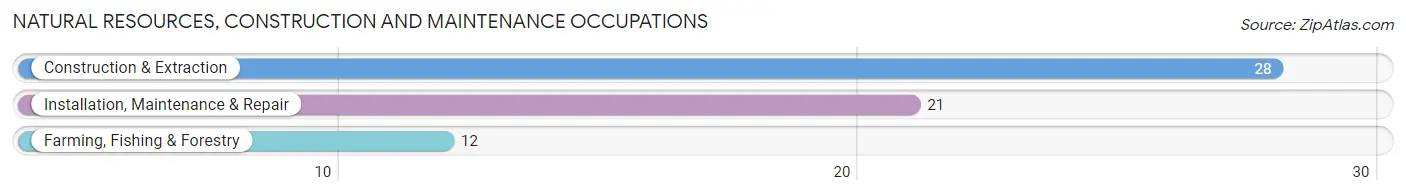
Natural Resources, Construction and Maintenance Occupations
The most common Natural Resources, Construction and Maintenance occupations in Shamokin Dam borough are Construction & Extraction (28 | 3.0%), Installation, Maintenance & Repair (21 | 2.2%), and Farming, Fishing & Forestry (12 | 1.3%).
Natural Resources, Construction and Maintenance Occupations by Sex
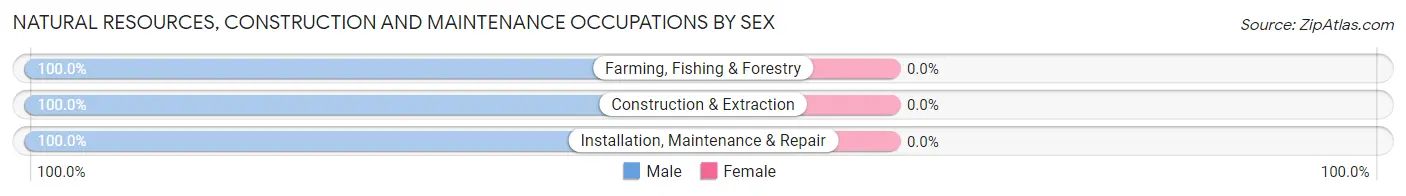
| Occupation | Male | Female |
| Farming, Fishing & Forestry | 12 (100.0%) | 0 (0.0%) |
| Construction & Extraction | 28 (100.0%) | 0 (0.0%) |
| Installation, Maintenance & Repair | 21 (100.0%) | 0 (0.0%) |
| Total (Category) | 61 (100.0%) | 0 (0.0%) |
| Total (Overall) | 453 (48.3%) | 485 (51.7%) |
Production, Transportation and Moving Occupations
The most common Production, Transportation and Moving occupations in Shamokin Dam borough are Material Moving (88 | 9.4%), Transportation (29 | 3.1%), and Production (25 | 2.7%).
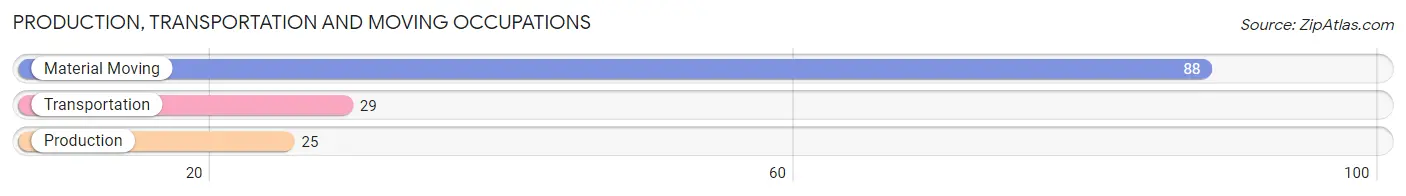
Production, Transportation and Moving Occupations by Sex
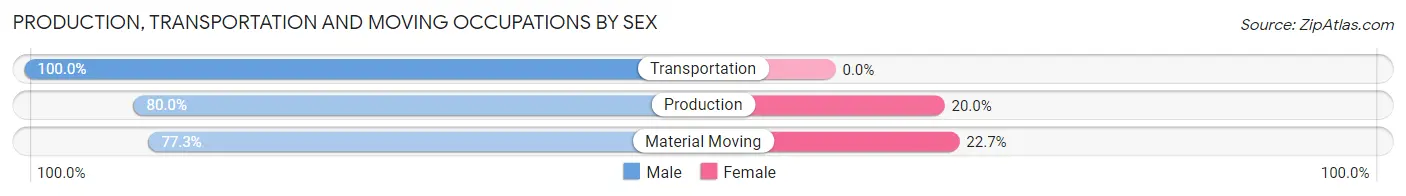
| Occupation | Male | Female |
| Production | 20 (80.0%) | 5 (20.0%) |
| Transportation | 29 (100.0%) | 0 (0.0%) |
| Material Moving | 68 (77.3%) | 20 (22.7%) |
| Total (Category) | 117 (82.4%) | 25 (17.6%) |
| Total (Overall) | 453 (48.3%) | 485 (51.7%) |
Employment Industries by Sex in Shamokin Dam borough
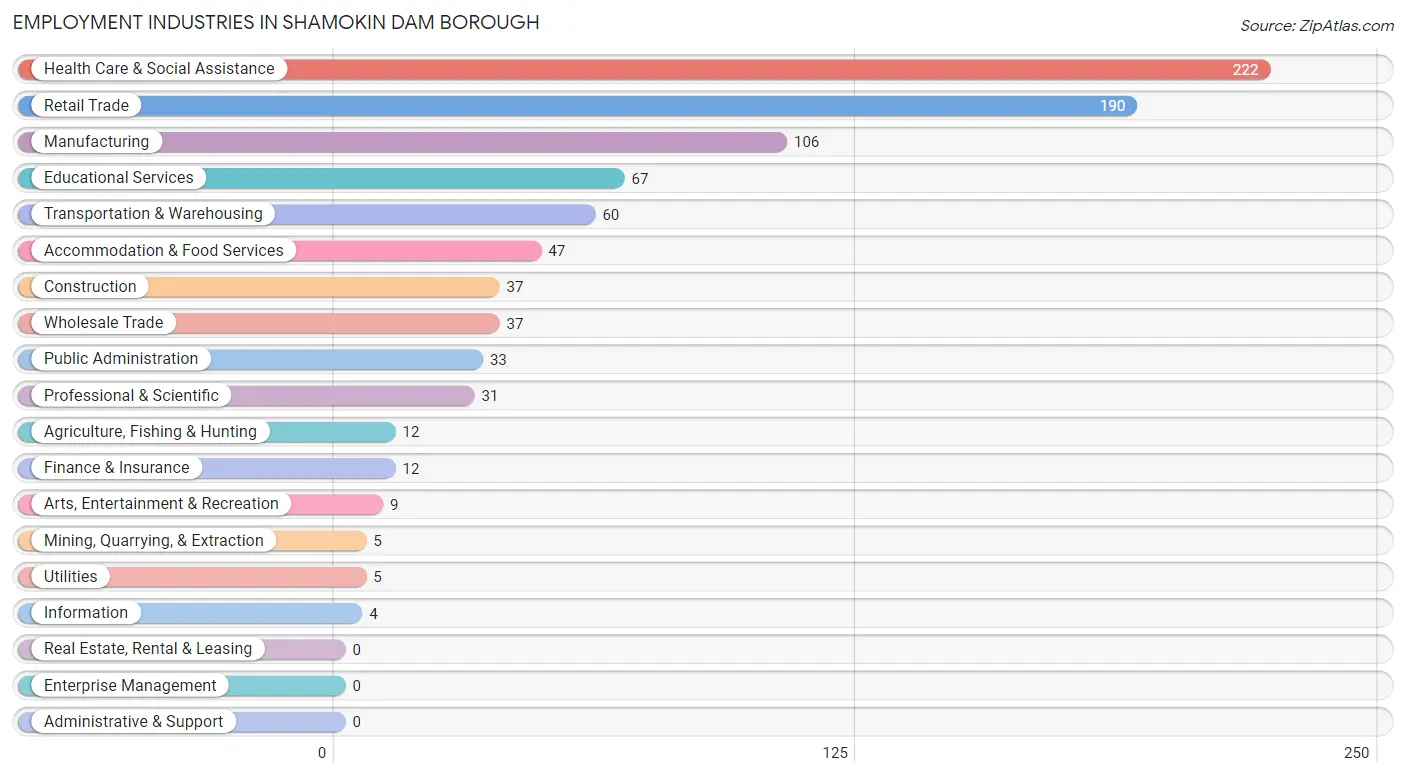
Employment Industries in Shamokin Dam borough
The major employment industries in Shamokin Dam borough include Health Care & Social Assistance (222 | 23.7%), Retail Trade (190 | 20.3%), Manufacturing (106 | 11.3%), Educational Services (67 | 7.1%), and Transportation & Warehousing (60 | 6.4%).
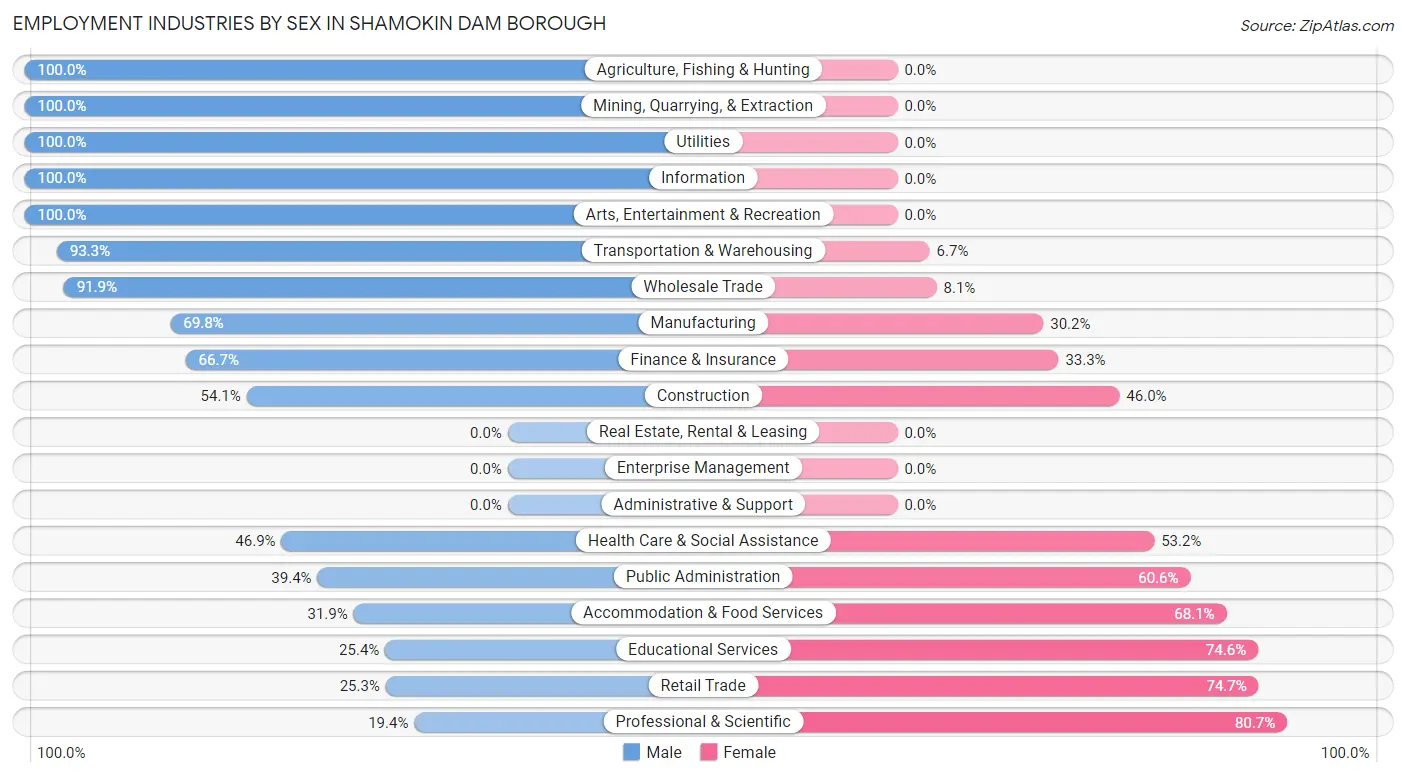
Employment Industries by Sex in Shamokin Dam borough
The Shamokin Dam borough industries that see more men than women are Agriculture, Fishing & Hunting (100.0%), Mining, Quarrying, & Extraction (100.0%), and Utilities (100.0%), whereas the industries that tend to have a higher number of women are Professional & Scientific (80.6%), Retail Trade (74.7%), and Educational Services (74.6%).
| Industry | Male | Female |
| Agriculture, Fishing & Hunting | 12 (100.0%) | 0 (0.0%) |
| Mining, Quarrying, & Extraction | 5 (100.0%) | 0 (0.0%) |
| Construction | 20 (54.0%) | 17 (46.0%) |
| Manufacturing | 74 (69.8%) | 32 (30.2%) |
| Wholesale Trade | 34 (91.9%) | 3 (8.1%) |
| Retail Trade | 48 (25.3%) | 142 (74.7%) |
| Transportation & Warehousing | 56 (93.3%) | 4 (6.7%) |
| Utilities | 5 (100.0%) | 0 (0.0%) |
| Information | 4 (100.0%) | 0 (0.0%) |
| Finance & Insurance | 8 (66.7%) | 4 (33.3%) |
| Real Estate, Rental & Leasing | 0 (0.0%) | 0 (0.0%) |
| Professional & Scientific | 6 (19.4%) | 25 (80.6%) |
| Enterprise Management | 0 (0.0%) | 0 (0.0%) |
| Administrative & Support | 0 (0.0%) | 0 (0.0%) |
| Educational Services | 17 (25.4%) | 50 (74.6%) |
| Health Care & Social Assistance | 104 (46.9%) | 118 (53.1%) |
| Arts, Entertainment & Recreation | 9 (100.0%) | 0 (0.0%) |
| Accommodation & Food Services | 15 (31.9%) | 32 (68.1%) |
| Public Administration | 13 (39.4%) | 20 (60.6%) |
| Total | 453 (48.3%) | 485 (51.7%) |
Education in Shamokin Dam borough
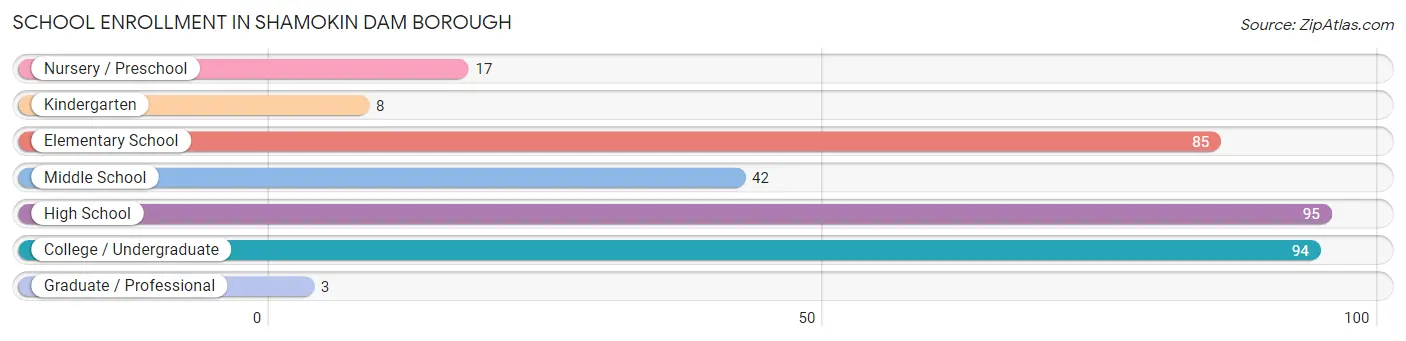
School Enrollment in Shamokin Dam borough
The most common levels of schooling among the 344 students in Shamokin Dam borough are high school (95 | 27.6%), college / undergraduate (94 | 27.3%), and elementary school (85 | 24.7%).
| School Level | # Students | % Students |
| Nursery / Preschool | 17 | 4.9% |
| Kindergarten | 8 | 2.3% |
| Elementary School | 85 | 24.7% |
| Middle School | 42 | 12.2% |
| High School | 95 | 27.6% |
| College / Undergraduate | 94 | 27.3% |
| Graduate / Professional | 3 | 0.9% |
| Total | 344 | 100.0% |
School Enrollment by Age by Funding Source in Shamokin Dam borough
Out of a total of 344 students who are enrolled in schools in Shamokin Dam borough, 25 (7.3%) attend a private institution, while the remaining 319 (92.7%) are enrolled in public schools. The age group of 35 years and over has the highest likelihood of being enrolled in private schools, with 3 (60.0% in the age bracket) enrolled. Conversely, the age group of 10 to 14 year olds has the lowest likelihood of being enrolled in a private school, with 60 (100.0% in the age bracket) attending a public institution.
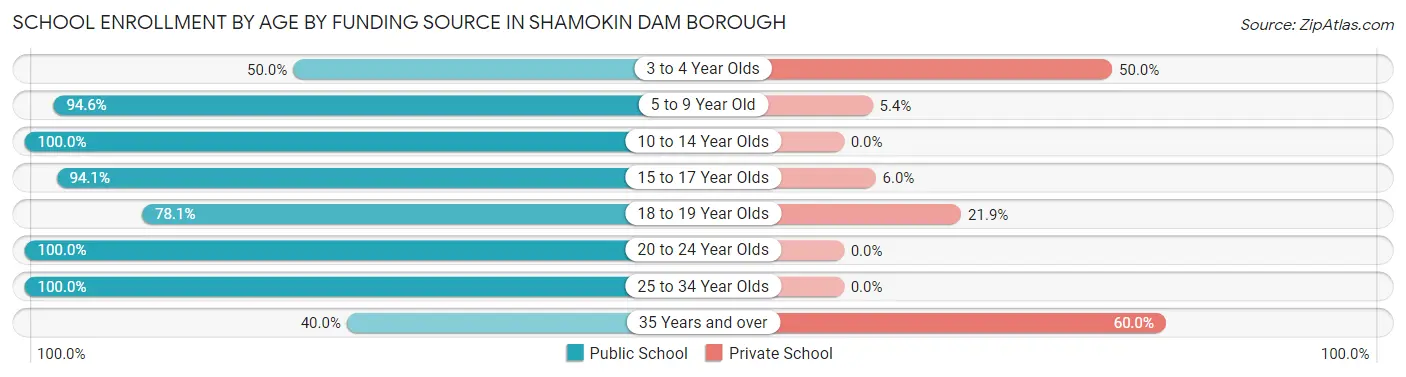
| Age Bracket | Public School | Private School |
| 3 to 4 Year Olds | 5 (50.0%) | 5 (50.0%) |
| 5 to 9 Year Old | 88 (94.6%) | 5 (5.4%) |
| 10 to 14 Year Olds | 60 (100.0%) | 0 (0.0%) |
| 15 to 17 Year Olds | 79 (94.1%) | 5 (5.9%) |
| 18 to 19 Year Olds | 25 (78.1%) | 7 (21.9%) |
| 20 to 24 Year Olds | 54 (100.0%) | 0 (0.0%) |
| 25 to 34 Year Olds | 6 (100.0%) | 0 (0.0%) |
| 35 Years and over | 2 (40.0%) | 3 (60.0%) |
| Total | 319 (92.7%) | 25 (7.3%) |
Educational Attainment by Field of Study in Shamokin Dam borough
Education (133 | 36.7%), science & technology (57 | 15.8%), computers & mathematics (36 | 9.9%), bio, nature & agricultural (29 | 8.0%), and arts & humanities (20 | 5.5%) are the most common fields of study among 362 individuals in Shamokin Dam borough who have obtained a bachelor's degree or higher.
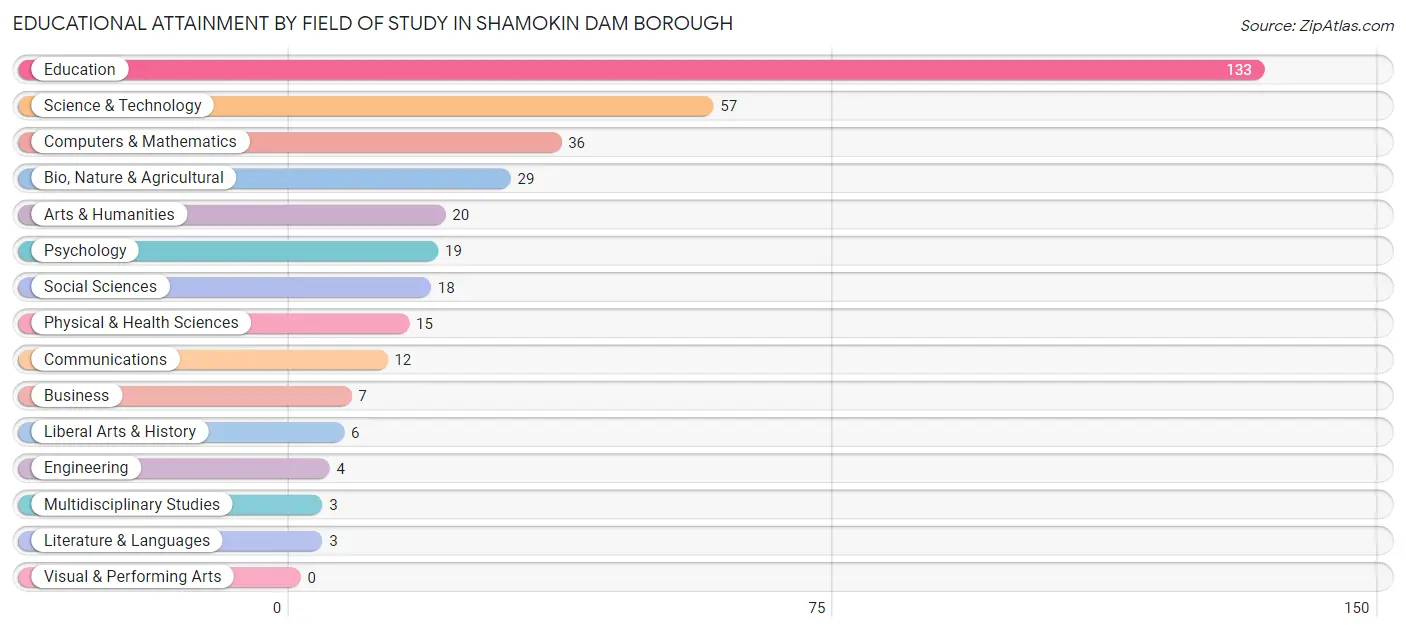
| Field of Study | # Graduates | % Graduates |
| Computers & Mathematics | 36 | 9.9% |
| Bio, Nature & Agricultural | 29 | 8.0% |
| Physical & Health Sciences | 15 | 4.1% |
| Psychology | 19 | 5.2% |
| Social Sciences | 18 | 5.0% |
| Engineering | 4 | 1.1% |
| Multidisciplinary Studies | 3 | 0.8% |
| Science & Technology | 57 | 15.8% |
| Business | 7 | 1.9% |
| Education | 133 | 36.7% |
| Literature & Languages | 3 | 0.8% |
| Liberal Arts & History | 6 | 1.7% |
| Visual & Performing Arts | 0 | 0.0% |
| Communications | 12 | 3.3% |
| Arts & Humanities | 20 | 5.5% |
| Total | 362 | 100.0% |
Transportation & Commute in Shamokin Dam borough
Vehicle Availability by Sex in Shamokin Dam borough
The most prevalent vehicle ownership categories in Shamokin Dam borough are males with 2 vehicles (164, accounting for 36.2%) and females with 2 vehicles (211, making up 33.8%).
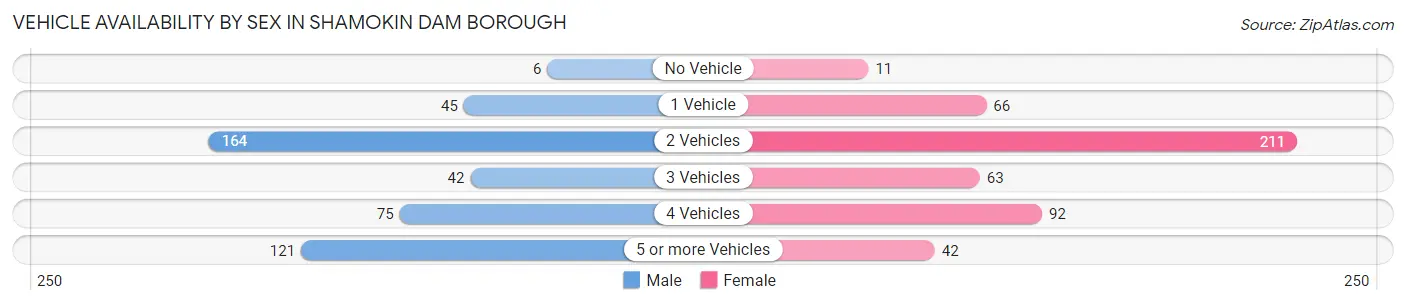
| Vehicles Available | Male | Female |
| No Vehicle | 6 (1.3%) | 11 (2.3%) |
| 1 Vehicle | 45 (9.9%) | 66 (13.6%) |
| 2 Vehicles | 164 (36.2%) | 211 (43.5%) |
| 3 Vehicles | 42 (9.3%) | 63 (13.0%) |
| 4 Vehicles | 75 (16.6%) | 92 (19.0%) |
| 5 or more Vehicles | 121 (26.7%) | 42 (8.7%) |
| Total | 453 (100.0%) | 485 (100.0%) |
Commute Time in Shamokin Dam borough
The most frequently occuring commute durations in Shamokin Dam borough are 10 to 14 minutes (223 commuters, 24.6%), 15 to 19 minutes (155 commuters, 17.1%), and 5 to 9 minutes (142 commuters, 15.7%).
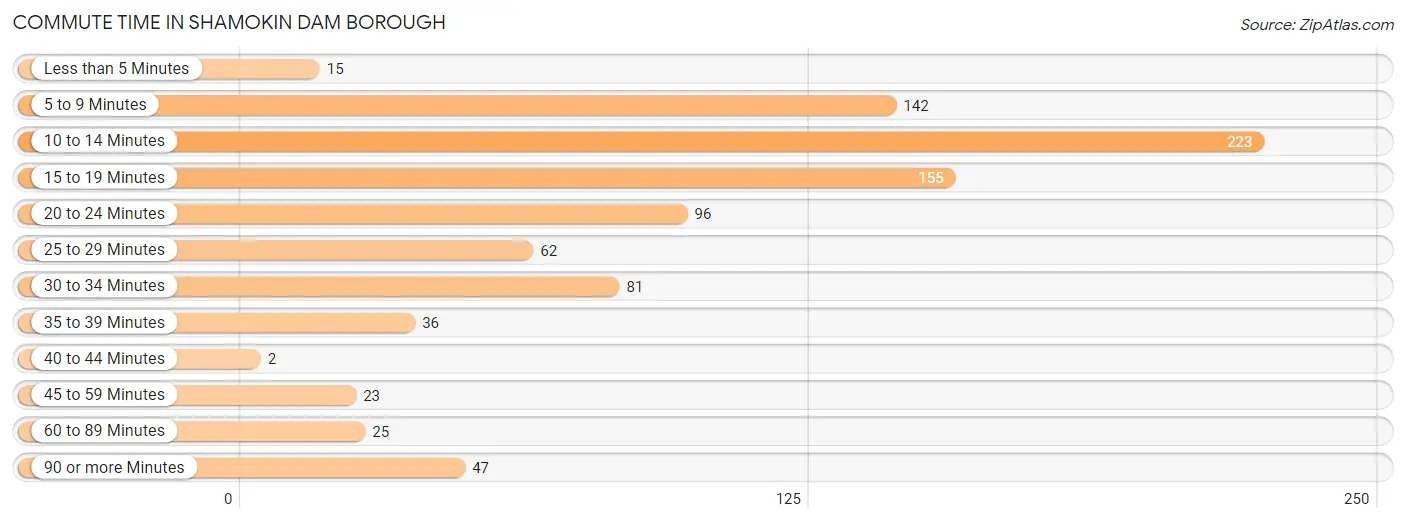
| Commute Time | # Commuters | % Commuters |
| Less than 5 Minutes | 15 | 1.7% |
| 5 to 9 Minutes | 142 | 15.7% |
| 10 to 14 Minutes | 223 | 24.6% |
| 15 to 19 Minutes | 155 | 17.1% |
| 20 to 24 Minutes | 96 | 10.6% |
| 25 to 29 Minutes | 62 | 6.8% |
| 30 to 34 Minutes | 81 | 8.9% |
| 35 to 39 Minutes | 36 | 4.0% |
| 40 to 44 Minutes | 2 | 0.2% |
| 45 to 59 Minutes | 23 | 2.5% |
| 60 to 89 Minutes | 25 | 2.8% |
| 90 or more Minutes | 47 | 5.2% |
Commute Time by Sex in Shamokin Dam borough
The most common commute times in Shamokin Dam borough are 10 to 14 minutes (107 commuters, 24.4%) for males and 10 to 14 minutes (116 commuters, 24.8%) for females.
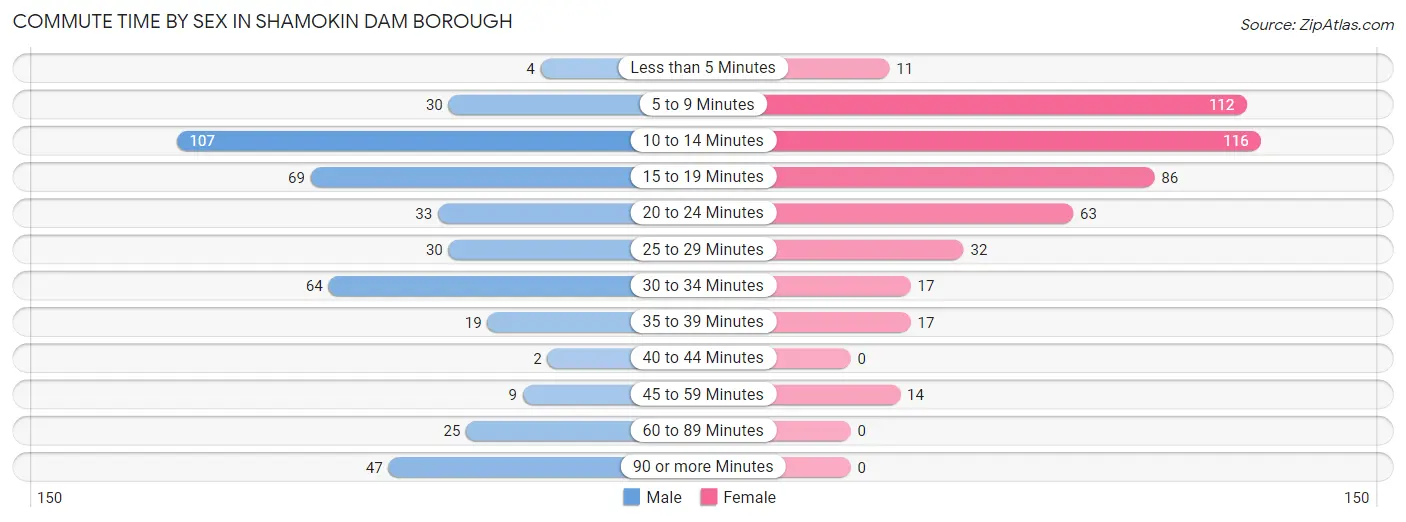
| Commute Time | Male | Female |
| Less than 5 Minutes | 4 (0.9%) | 11 (2.4%) |
| 5 to 9 Minutes | 30 (6.8%) | 112 (23.9%) |
| 10 to 14 Minutes | 107 (24.4%) | 116 (24.8%) |
| 15 to 19 Minutes | 69 (15.7%) | 86 (18.4%) |
| 20 to 24 Minutes | 33 (7.5%) | 63 (13.5%) |
| 25 to 29 Minutes | 30 (6.8%) | 32 (6.8%) |
| 30 to 34 Minutes | 64 (14.6%) | 17 (3.6%) |
| 35 to 39 Minutes | 19 (4.3%) | 17 (3.6%) |
| 40 to 44 Minutes | 2 (0.5%) | 0 (0.0%) |
| 45 to 59 Minutes | 9 (2.1%) | 14 (3.0%) |
| 60 to 89 Minutes | 25 (5.7%) | 0 (0.0%) |
| 90 or more Minutes | 47 (10.7%) | 0 (0.0%) |
Time of Departure to Work by Sex in Shamokin Dam borough
The most frequent times of departure to work in Shamokin Dam borough are 12:00 PM to 3:59 PM (141, 32.1%) for males and 7:00 AM to 7:29 AM (93, 19.9%) for females.
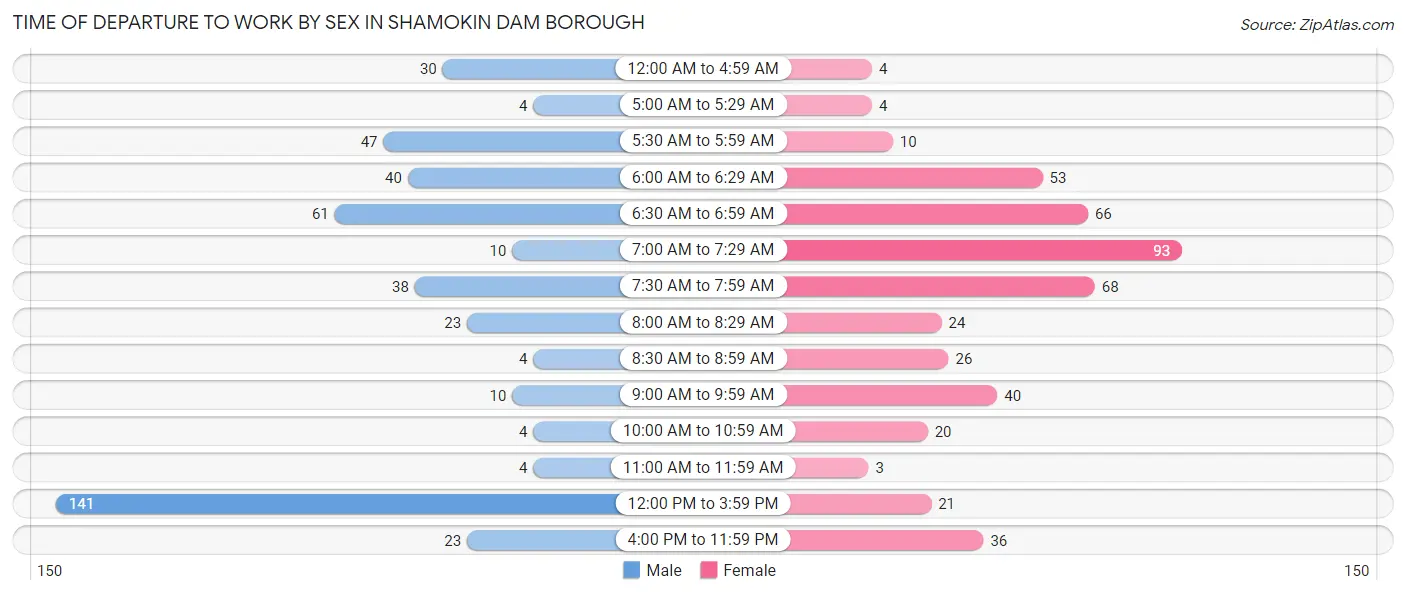
| Time of Departure | Male | Female |
| 12:00 AM to 4:59 AM | 30 (6.8%) | 4 (0.9%) |
| 5:00 AM to 5:29 AM | 4 (0.9%) | 4 (0.9%) |
| 5:30 AM to 5:59 AM | 47 (10.7%) | 10 (2.1%) |
| 6:00 AM to 6:29 AM | 40 (9.1%) | 53 (11.3%) |
| 6:30 AM to 6:59 AM | 61 (13.9%) | 66 (14.1%) |
| 7:00 AM to 7:29 AM | 10 (2.3%) | 93 (19.9%) |
| 7:30 AM to 7:59 AM | 38 (8.7%) | 68 (14.5%) |
| 8:00 AM to 8:29 AM | 23 (5.2%) | 24 (5.1%) |
| 8:30 AM to 8:59 AM | 4 (0.9%) | 26 (5.6%) |
| 9:00 AM to 9:59 AM | 10 (2.3%) | 40 (8.6%) |
| 10:00 AM to 10:59 AM | 4 (0.9%) | 20 (4.3%) |
| 11:00 AM to 11:59 AM | 4 (0.9%) | 3 (0.6%) |
| 12:00 PM to 3:59 PM | 141 (32.1%) | 21 (4.5%) |
| 4:00 PM to 11:59 PM | 23 (5.2%) | 36 (7.7%) |
| Total | 439 (100.0%) | 468 (100.0%) |
Housing Occupancy in Shamokin Dam borough
Occupancy by Ownership in Shamokin Dam borough
Of the total 772 dwellings in Shamokin Dam borough, owner-occupied units account for 543 (70.3%), while renter-occupied units make up 229 (29.7%).
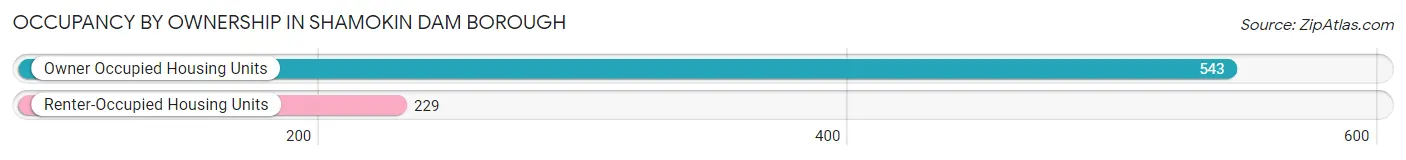
| Occupancy | # Housing Units | % Housing Units |
| Owner Occupied Housing Units | 543 | 70.3% |
| Renter-Occupied Housing Units | 229 | 29.7% |
| Total Occupied Housing Units | 772 | 100.0% |
Occupancy by Household Size in Shamokin Dam borough
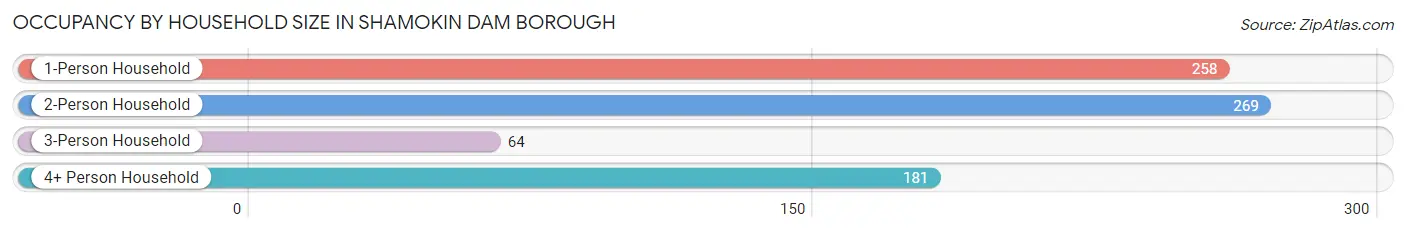
| Household Size | # Housing Units | % Housing Units |
| 1-Person Household | 258 | 33.4% |
| 2-Person Household | 269 | 34.8% |
| 3-Person Household | 64 | 8.3% |
| 4+ Person Household | 181 | 23.4% |
| Total Housing Units | 772 | 100.0% |
Occupancy by Ownership by Household Size in Shamokin Dam borough
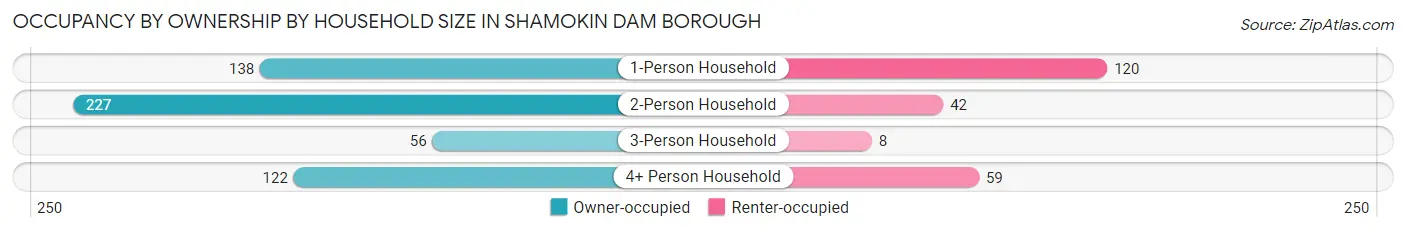
| Household Size | Owner-occupied | Renter-occupied |
| 1-Person Household | 138 (53.5%) | 120 (46.5%) |
| 2-Person Household | 227 (84.4%) | 42 (15.6%) |
| 3-Person Household | 56 (87.5%) | 8 (12.5%) |
| 4+ Person Household | 122 (67.4%) | 59 (32.6%) |
| Total Housing Units | 543 (70.3%) | 229 (29.7%) |
Occupancy by Educational Attainment in Shamokin Dam borough
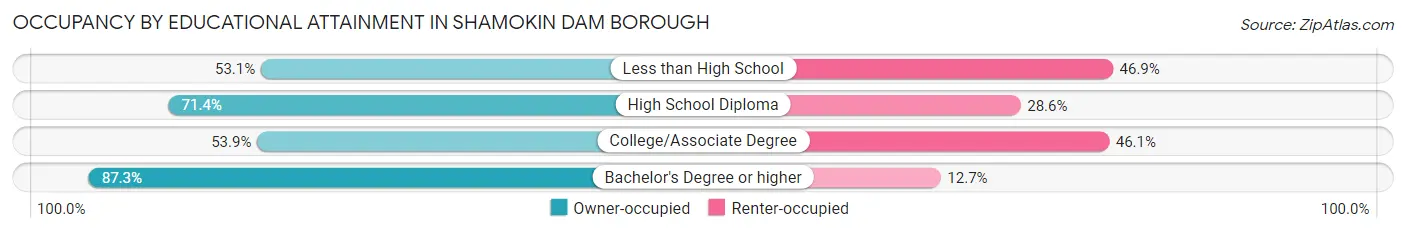
| Household Size | Owner-occupied | Renter-occupied |
| Less than High School | 17 (53.1%) | 15 (46.9%) |
| High School Diploma | 230 (71.4%) | 92 (28.6%) |
| College/Associate Degree | 111 (53.9%) | 95 (46.1%) |
| Bachelor's Degree or higher | 185 (87.3%) | 27 (12.7%) |
Occupancy by Age of Householder in Shamokin Dam borough
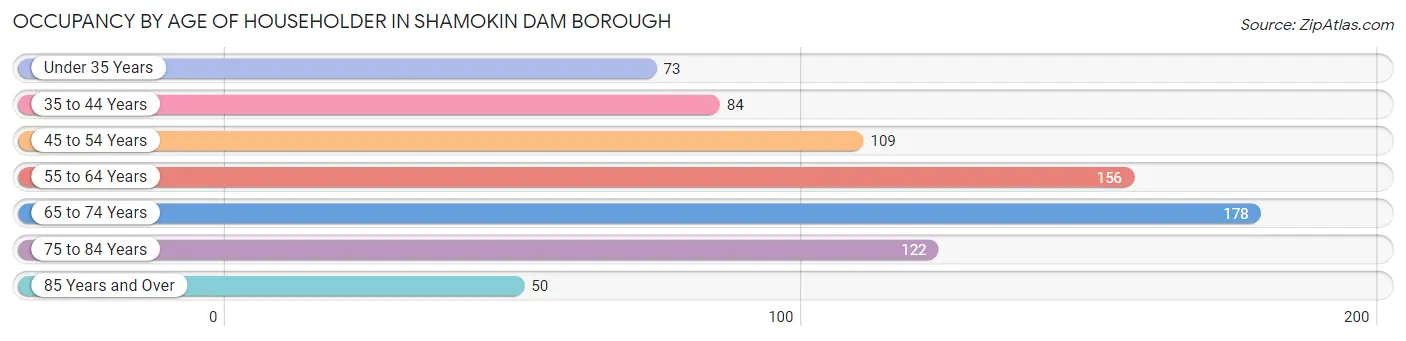
| Age Bracket | # Households | % Households |
| Under 35 Years | 73 | 9.5% |
| 35 to 44 Years | 84 | 10.9% |
| 45 to 54 Years | 109 | 14.1% |
| 55 to 64 Years | 156 | 20.2% |
| 65 to 74 Years | 178 | 23.1% |
| 75 to 84 Years | 122 | 15.8% |
| 85 Years and Over | 50 | 6.5% |
| Total | 772 | 100.0% |
Housing Finances in Shamokin Dam borough
Median Income by Occupancy in Shamokin Dam borough
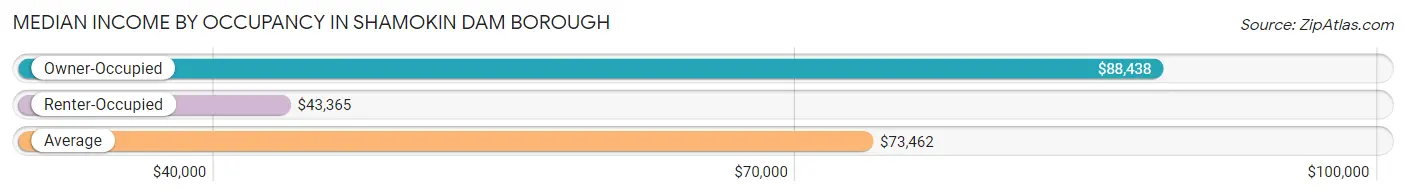
| Occupancy Type | # Households | Median Income |
| Owner-Occupied | 543 (70.3%) | $88,438 |
| Renter-Occupied | 229 (29.7%) | $43,365 |
| Average | 772 (100.0%) | $73,462 |
Occupancy by Householder Income Bracket in Shamokin Dam borough
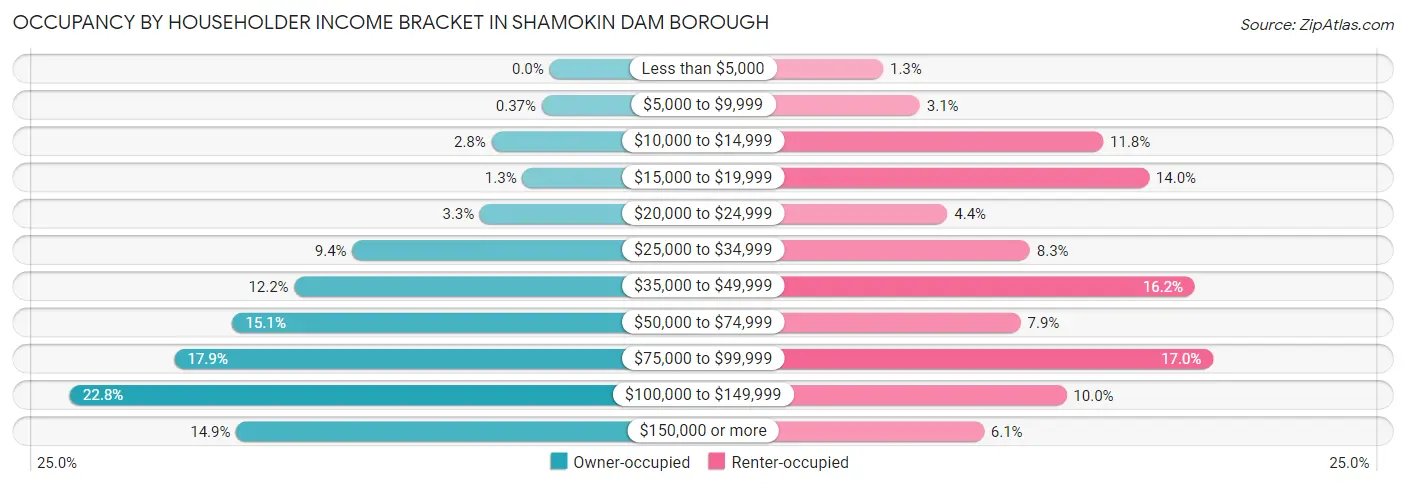
| Income Bracket | Owner-occupied | Renter-occupied |
| Less than $5,000 | 0 (0.0%) | 3 (1.3%) |
| $5,000 to $9,999 | 2 (0.4%) | 7 (3.1%) |
| $10,000 to $14,999 | 15 (2.8%) | 27 (11.8%) |
| $15,000 to $19,999 | 7 (1.3%) | 32 (14.0%) |
| $20,000 to $24,999 | 18 (3.3%) | 10 (4.4%) |
| $25,000 to $34,999 | 51 (9.4%) | 19 (8.3%) |
| $35,000 to $49,999 | 66 (12.1%) | 37 (16.2%) |
| $50,000 to $74,999 | 82 (15.1%) | 18 (7.9%) |
| $75,000 to $99,999 | 97 (17.9%) | 39 (17.0%) |
| $100,000 to $149,999 | 124 (22.8%) | 23 (10.0%) |
| $150,000 or more | 81 (14.9%) | 14 (6.1%) |
| Total | 543 (100.0%) | 229 (100.0%) |
Monthly Housing Cost Tiers in Shamokin Dam borough
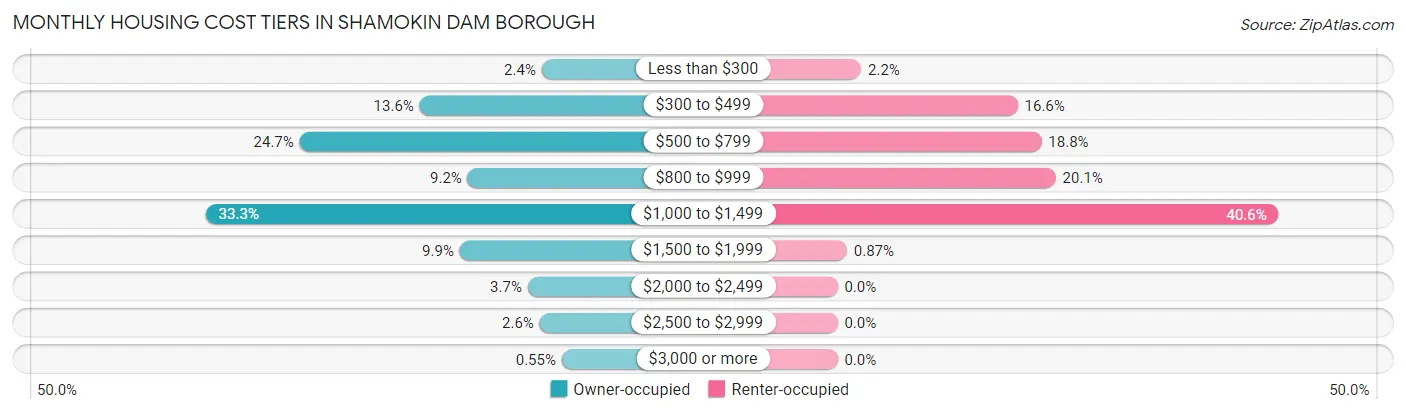
| Monthly Cost | Owner-occupied | Renter-occupied |
| Less than $300 | 13 (2.4%) | 5 (2.2%) |
| $300 to $499 | 74 (13.6%) | 38 (16.6%) |
| $500 to $799 | 134 (24.7%) | 43 (18.8%) |
| $800 to $999 | 50 (9.2%) | 46 (20.1%) |
| $1,000 to $1,499 | 181 (33.3%) | 93 (40.6%) |
| $1,500 to $1,999 | 54 (9.9%) | 2 (0.9%) |
| $2,000 to $2,499 | 20 (3.7%) | 0 (0.0%) |
| $2,500 to $2,999 | 14 (2.6%) | 0 (0.0%) |
| $3,000 or more | 3 (0.5%) | 0 (0.0%) |
| Total | 543 (100.0%) | 229 (100.0%) |
Physical Housing Characteristics in Shamokin Dam borough
Housing Structures in Shamokin Dam borough
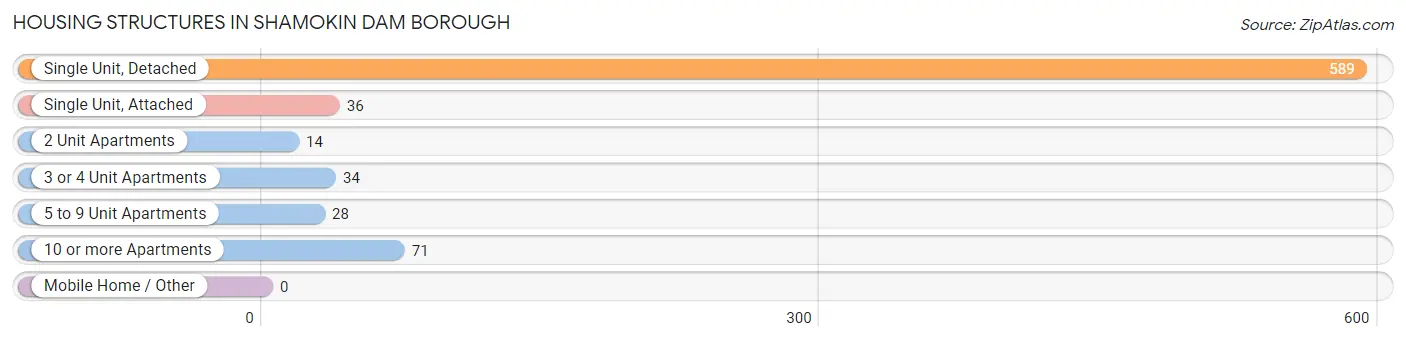
| Structure Type | # Housing Units | % Housing Units |
| Single Unit, Detached | 589 | 76.3% |
| Single Unit, Attached | 36 | 4.7% |
| 2 Unit Apartments | 14 | 1.8% |
| 3 or 4 Unit Apartments | 34 | 4.4% |
| 5 to 9 Unit Apartments | 28 | 3.6% |
| 10 or more Apartments | 71 | 9.2% |
| Mobile Home / Other | 0 | 0.0% |
| Total | 772 | 100.0% |
Housing Structures by Occupancy in Shamokin Dam borough
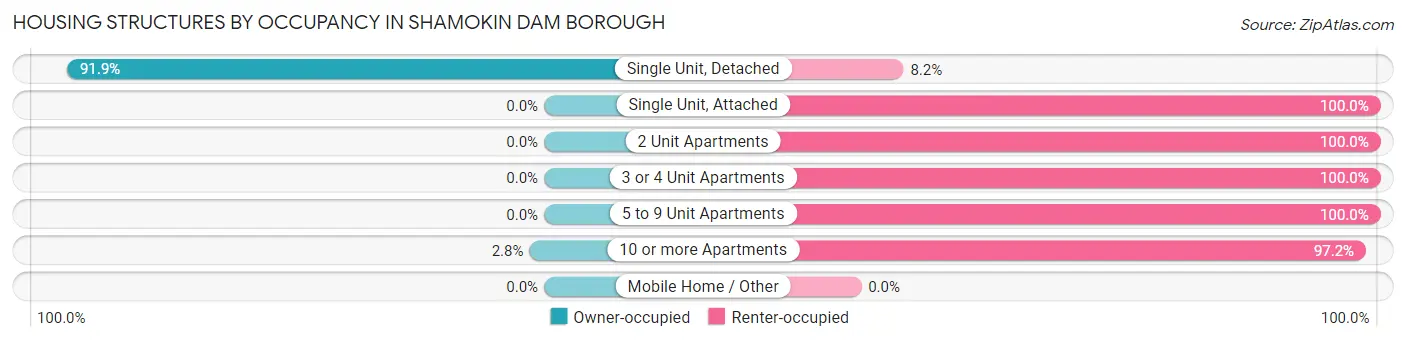
| Structure Type | Owner-occupied | Renter-occupied |
| Single Unit, Detached | 541 (91.8%) | 48 (8.2%) |
| Single Unit, Attached | 0 (0.0%) | 36 (100.0%) |
| 2 Unit Apartments | 0 (0.0%) | 14 (100.0%) |
| 3 or 4 Unit Apartments | 0 (0.0%) | 34 (100.0%) |
| 5 to 9 Unit Apartments | 0 (0.0%) | 28 (100.0%) |
| 10 or more Apartments | 2 (2.8%) | 69 (97.2%) |
| Mobile Home / Other | 0 (0.0%) | 0 (0.0%) |
| Total | 543 (70.3%) | 229 (29.7%) |
Housing Structures by Number of Rooms in Shamokin Dam borough
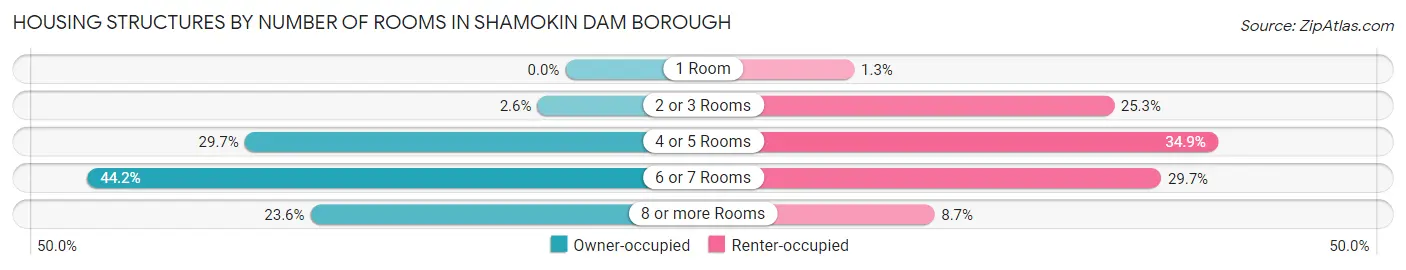
| Number of Rooms | Owner-occupied | Renter-occupied |
| 1 Room | 0 (0.0%) | 3 (1.3%) |
| 2 or 3 Rooms | 14 (2.6%) | 58 (25.3%) |
| 4 or 5 Rooms | 161 (29.6%) | 80 (34.9%) |
| 6 or 7 Rooms | 240 (44.2%) | 68 (29.7%) |
| 8 or more Rooms | 128 (23.6%) | 20 (8.7%) |
| Total | 543 (100.0%) | 229 (100.0%) |
Housing Structure by Heating Type in Shamokin Dam borough
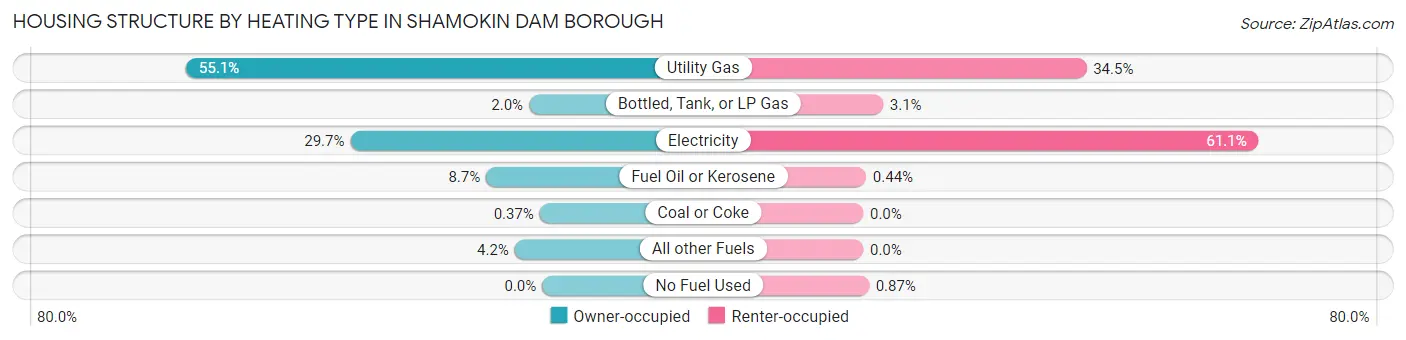
| Heating Type | Owner-occupied | Renter-occupied |
| Utility Gas | 299 (55.1%) | 79 (34.5%) |
| Bottled, Tank, or LP Gas | 11 (2.0%) | 7 (3.1%) |
| Electricity | 161 (29.6%) | 140 (61.1%) |
| Fuel Oil or Kerosene | 47 (8.7%) | 1 (0.4%) |
| Coal or Coke | 2 (0.4%) | 0 (0.0%) |
| All other Fuels | 23 (4.2%) | 0 (0.0%) |
| No Fuel Used | 0 (0.0%) | 2 (0.9%) |
| Total | 543 (100.0%) | 229 (100.0%) |
Household Vehicle Usage in Shamokin Dam borough
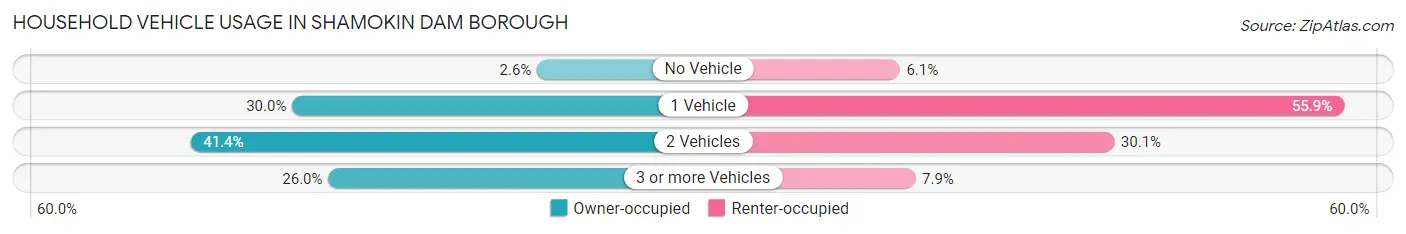
| Vehicles per Household | Owner-occupied | Renter-occupied |
| No Vehicle | 14 (2.6%) | 14 (6.1%) |
| 1 Vehicle | 163 (30.0%) | 128 (55.9%) |
| 2 Vehicles | 225 (41.4%) | 69 (30.1%) |
| 3 or more Vehicles | 141 (26.0%) | 18 (7.9%) |
| Total | 543 (100.0%) | 229 (100.0%) |
Real Estate & Mortgages in Shamokin Dam borough
Real Estate and Mortgage Overview in Shamokin Dam borough
| Characteristic | Without Mortgage | With Mortgage |
| Housing Units | 222 | 321 |
| Median Property Value | $209,200 | $179,800 |
| Median Household Income | $60,000 | $73 |
| Monthly Housing Costs | $542 | $3 |
| Real Estate Taxes | $2,587 | $3 |
Property Value by Mortgage Status in Shamokin Dam borough
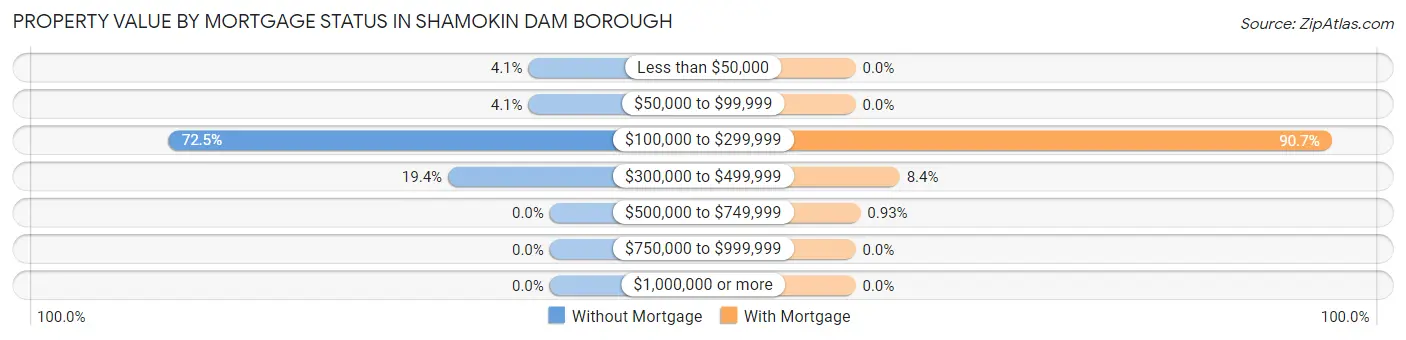
| Property Value | Without Mortgage | With Mortgage |
| Less than $50,000 | 9 (4.1%) | 0 (0.0%) |
| $50,000 to $99,999 | 9 (4.1%) | 0 (0.0%) |
| $100,000 to $299,999 | 161 (72.5%) | 291 (90.6%) |
| $300,000 to $499,999 | 43 (19.4%) | 27 (8.4%) |
| $500,000 to $749,999 | 0 (0.0%) | 3 (0.9%) |
| $750,000 to $999,999 | 0 (0.0%) | 0 (0.0%) |
| $1,000,000 or more | 0 (0.0%) | 0 (0.0%) |
| Total | 222 (100.0%) | 321 (100.0%) |
Household Income by Mortgage Status in Shamokin Dam borough
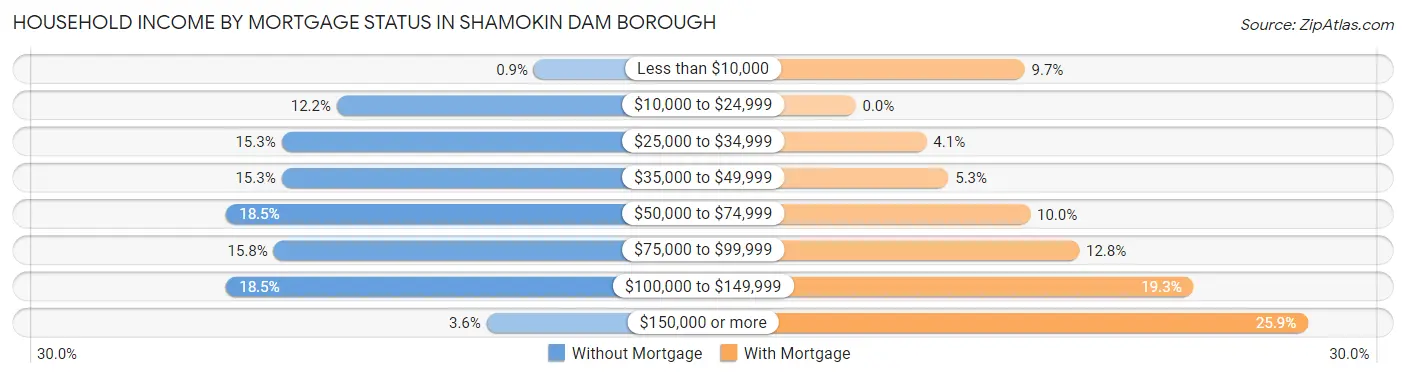
| Household Income | Without Mortgage | With Mortgage |
| Less than $10,000 | 2 (0.9%) | 31 (9.7%) |
| $10,000 to $24,999 | 27 (12.2%) | 0 (0.0%) |
| $25,000 to $34,999 | 34 (15.3%) | 13 (4.1%) |
| $35,000 to $49,999 | 34 (15.3%) | 17 (5.3%) |
| $50,000 to $74,999 | 41 (18.5%) | 32 (10.0%) |
| $75,000 to $99,999 | 35 (15.8%) | 41 (12.8%) |
| $100,000 to $149,999 | 41 (18.5%) | 62 (19.3%) |
| $150,000 or more | 8 (3.6%) | 83 (25.9%) |
| Total | 222 (100.0%) | 321 (100.0%) |
Property Value to Household Income Ratio in Shamokin Dam borough
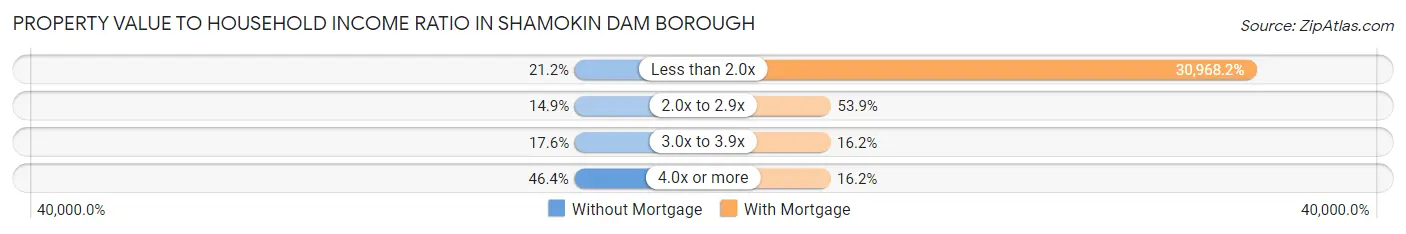
| Value-to-Income Ratio | Without Mortgage | With Mortgage |
| Less than 2.0x | 47 (21.2%) | 99,408 (30,968.2%) |
| 2.0x to 2.9x | 33 (14.9%) | 173 (53.9%) |
| 3.0x to 3.9x | 39 (17.6%) | 52 (16.2%) |
| 4.0x or more | 103 (46.4%) | 52 (16.2%) |
| Total | 222 (100.0%) | 321 (100.0%) |
Real Estate Taxes by Mortgage Status in Shamokin Dam borough
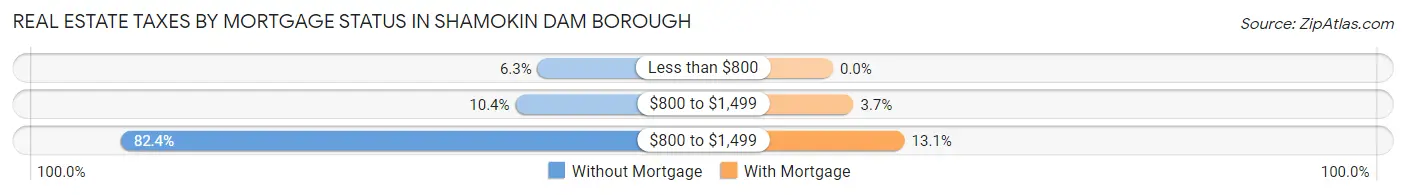
| Property Taxes | Without Mortgage | With Mortgage |
| Less than $800 | 14 (6.3%) | 0 (0.0%) |
| $800 to $1,499 | 23 (10.4%) | 12 (3.7%) |
| $800 to $1,499 | 183 (82.4%) | 42 (13.1%) |
| Total | 222 (100.0%) | 321 (100.0%) |
Health & Disability in Shamokin Dam borough
Health Insurance Coverage by Age in Shamokin Dam borough
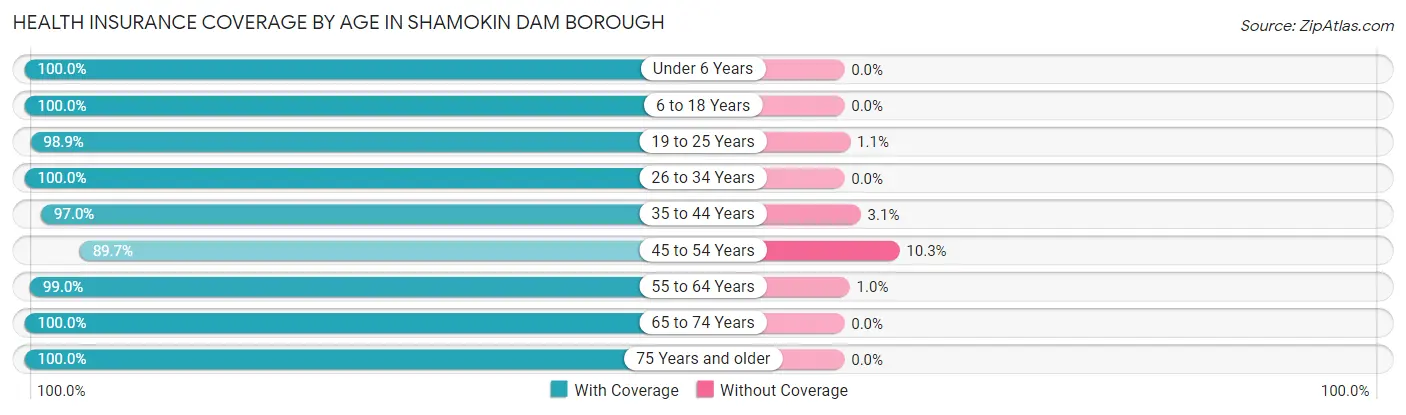
| Age Bracket | With Coverage | Without Coverage |
| Under 6 Years | 75 (100.0%) | 0 (0.0%) |
| 6 to 18 Years | 238 (100.0%) | 0 (0.0%) |
| 19 to 25 Years | 181 (98.9%) | 2 (1.1%) |
| 26 to 34 Years | 169 (100.0%) | 0 (0.0%) |
| 35 to 44 Years | 159 (97.0%) | 5 (3.0%) |
| 45 to 54 Years | 192 (89.7%) | 22 (10.3%) |
| 55 to 64 Years | 297 (99.0%) | 3 (1.0%) |
| 65 to 74 Years | 269 (100.0%) | 0 (0.0%) |
| 75 Years and older | 217 (100.0%) | 0 (0.0%) |
| Total | 1,797 (98.3%) | 32 (1.8%) |
Health Insurance Coverage by Citizenship Status in Shamokin Dam borough
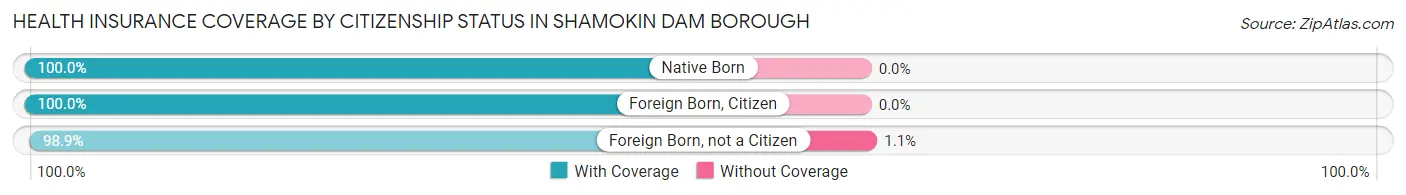
| Citizenship Status | With Coverage | Without Coverage |
| Native Born | 75 (100.0%) | 0 (0.0%) |
| Foreign Born, Citizen | 238 (100.0%) | 0 (0.0%) |
| Foreign Born, not a Citizen | 181 (98.9%) | 2 (1.1%) |
Health Insurance Coverage by Household Income in Shamokin Dam borough
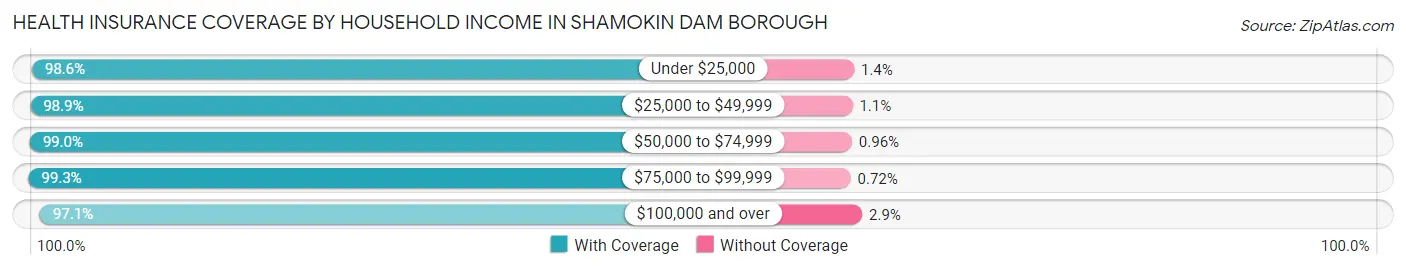
| Household Income | With Coverage | Without Coverage |
| Under $25,000 | 145 (98.6%) | 2 (1.4%) |
| $25,000 to $49,999 | 281 (98.9%) | 3 (1.1%) |
| $50,000 to $74,999 | 206 (99.0%) | 2 (1.0%) |
| $75,000 to $99,999 | 414 (99.3%) | 3 (0.7%) |
| $100,000 and over | 744 (97.1%) | 22 (2.9%) |
Public vs Private Health Insurance Coverage by Age in Shamokin Dam borough
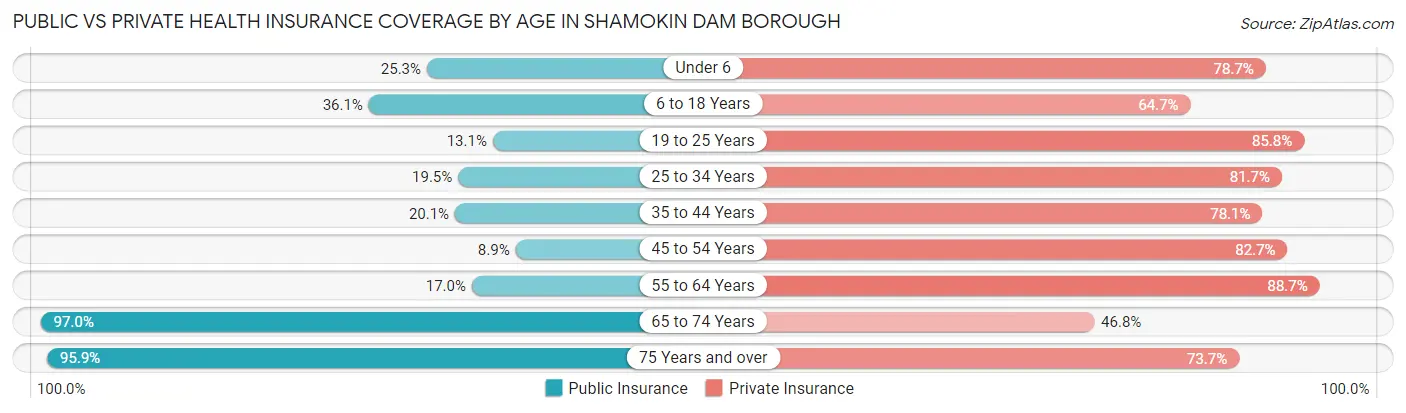
| Age Bracket | Public Insurance | Private Insurance |
| Under 6 | 19 (25.3%) | 59 (78.7%) |
| 6 to 18 Years | 86 (36.1%) | 154 (64.7%) |
| 19 to 25 Years | 24 (13.1%) | 157 (85.8%) |
| 25 to 34 Years | 33 (19.5%) | 138 (81.7%) |
| 35 to 44 Years | 33 (20.1%) | 128 (78.0%) |
| 45 to 54 Years | 19 (8.9%) | 177 (82.7%) |
| 55 to 64 Years | 51 (17.0%) | 266 (88.7%) |
| 65 to 74 Years | 261 (97.0%) | 126 (46.8%) |
| 75 Years and over | 208 (95.9%) | 160 (73.7%) |
| Total | 734 (40.1%) | 1,365 (74.6%) |
Disability Status by Sex by Age in Shamokin Dam borough
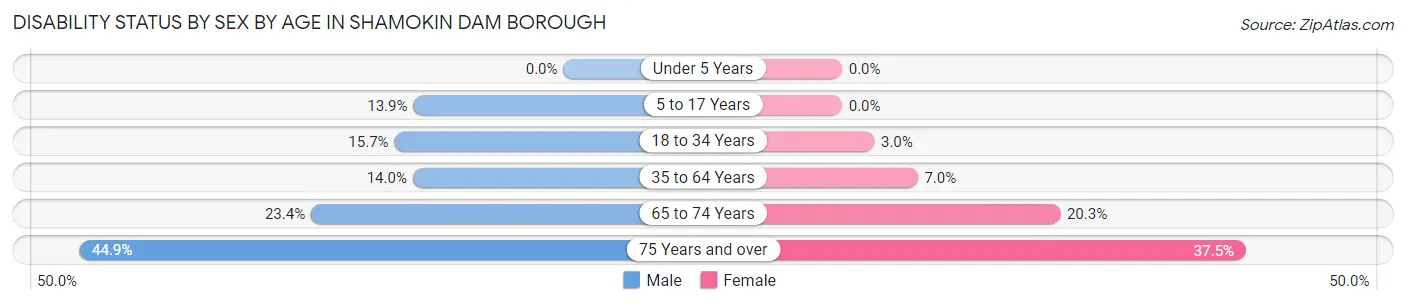
| Age Bracket | Male | Female |
| Under 5 Years | 0 (0.0%) | 0 (0.0%) |
| 5 to 17 Years | 17 (13.9%) | 0 (0.0%) |
| 18 to 34 Years | 29 (15.7%) | 5 (3.0%) |
| 35 to 64 Years | 45 (14.0%) | 25 (7.0%) |
| 65 to 74 Years | 26 (23.4%) | 32 (20.3%) |
| 75 Years and over | 40 (44.9%) | 48 (37.5%) |
Disability Class by Sex by Age in Shamokin Dam borough
Disability Class: Hearing Difficulty
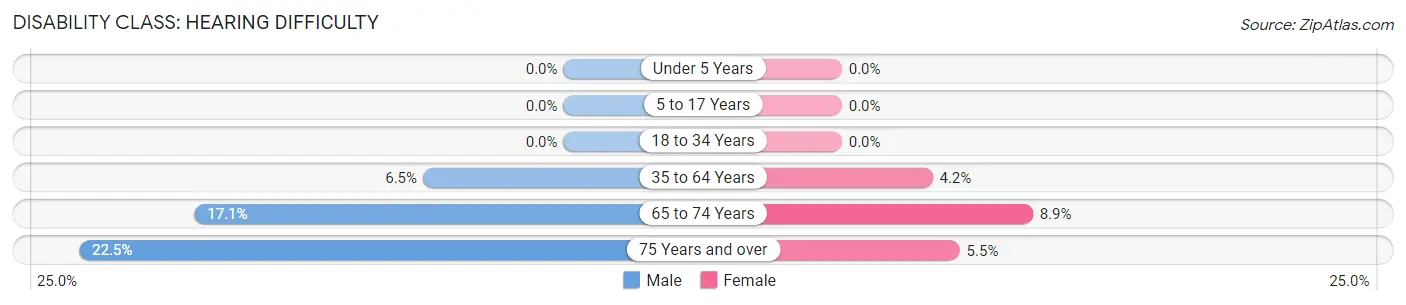
| Age Bracket | Male | Female |
| Under 5 Years | 0 (0.0%) | 0 (0.0%) |
| 5 to 17 Years | 0 (0.0%) | 0 (0.0%) |
| 18 to 34 Years | 0 (0.0%) | 0 (0.0%) |
| 35 to 64 Years | 21 (6.5%) | 15 (4.2%) |
| 65 to 74 Years | 19 (17.1%) | 14 (8.9%) |
| 75 Years and over | 20 (22.5%) | 7 (5.5%) |
Disability Class: Vision Difficulty
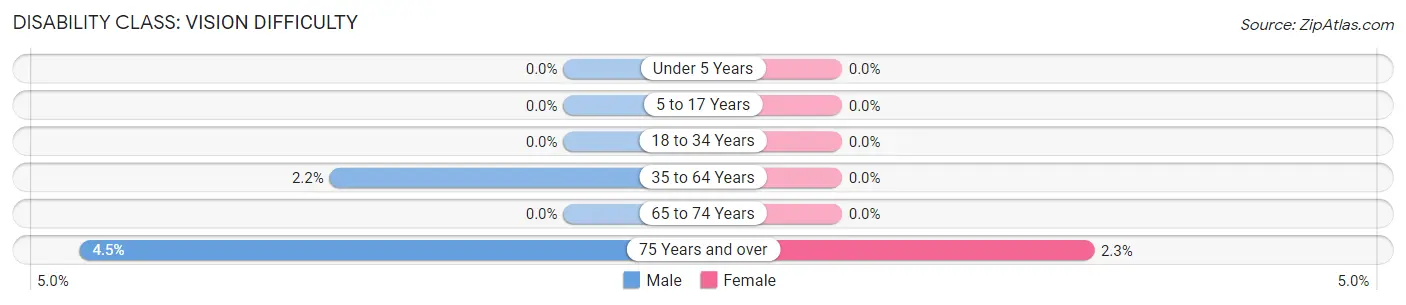
| Age Bracket | Male | Female |
| Under 5 Years | 0 (0.0%) | 0 (0.0%) |
| 5 to 17 Years | 0 (0.0%) | 0 (0.0%) |
| 18 to 34 Years | 0 (0.0%) | 0 (0.0%) |
| 35 to 64 Years | 7 (2.2%) | 0 (0.0%) |
| 65 to 74 Years | 0 (0.0%) | 0 (0.0%) |
| 75 Years and over | 4 (4.5%) | 3 (2.3%) |
Disability Class: Cognitive Difficulty
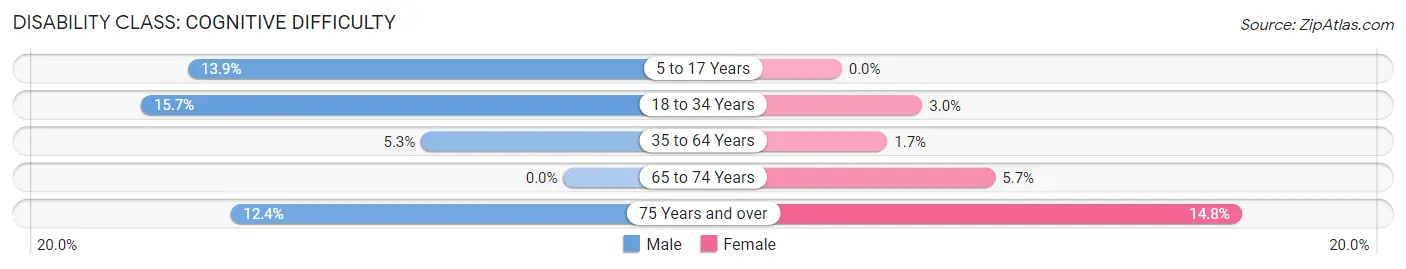
| Age Bracket | Male | Female |
| 5 to 17 Years | 17 (13.9%) | 0 (0.0%) |
| 18 to 34 Years | 29 (15.7%) | 5 (3.0%) |
| 35 to 64 Years | 17 (5.3%) | 6 (1.7%) |
| 65 to 74 Years | 0 (0.0%) | 9 (5.7%) |
| 75 Years and over | 11 (12.4%) | 19 (14.8%) |
Disability Class: Ambulatory Difficulty
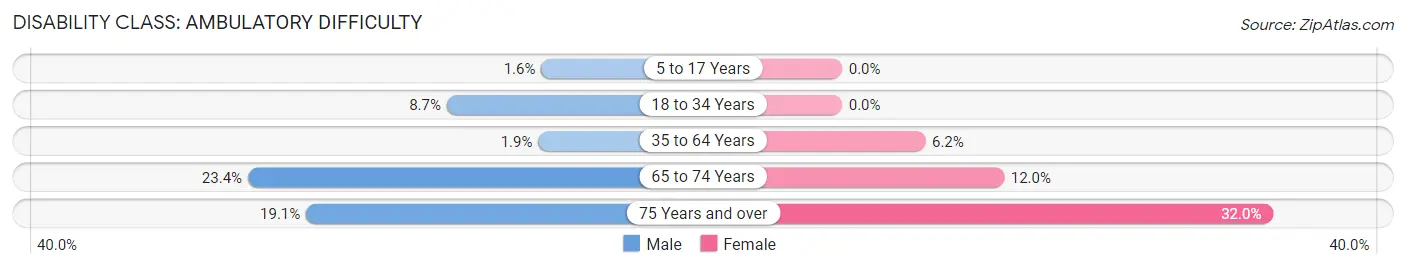
| Age Bracket | Male | Female |
| 5 to 17 Years | 2 (1.6%) | 0 (0.0%) |
| 18 to 34 Years | 16 (8.6%) | 0 (0.0%) |
| 35 to 64 Years | 6 (1.9%) | 22 (6.2%) |
| 65 to 74 Years | 26 (23.4%) | 19 (12.0%) |
| 75 Years and over | 17 (19.1%) | 41 (32.0%) |
Disability Class: Self-Care Difficulty
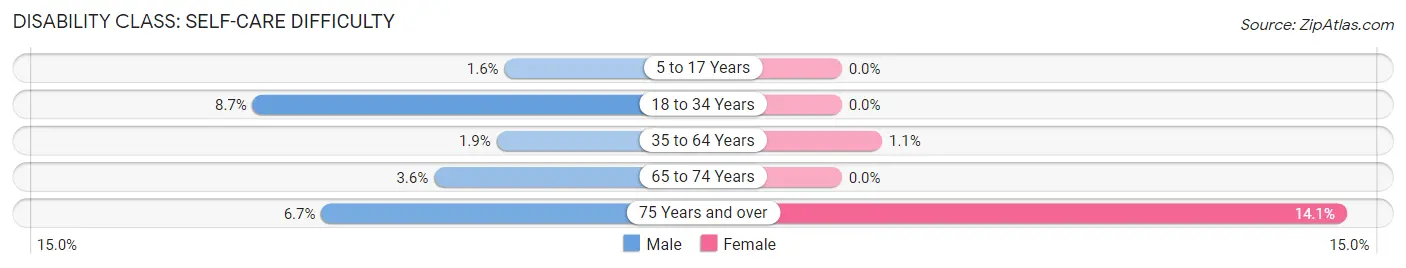
| Age Bracket | Male | Female |
| 5 to 17 Years | 2 (1.6%) | 0 (0.0%) |
| 18 to 34 Years | 16 (8.6%) | 0 (0.0%) |
| 35 to 64 Years | 6 (1.9%) | 4 (1.1%) |
| 65 to 74 Years | 4 (3.6%) | 0 (0.0%) |
| 75 Years and over | 6 (6.7%) | 18 (14.1%) |
Technology Access in Shamokin Dam borough
Computing Device Access in Shamokin Dam borough
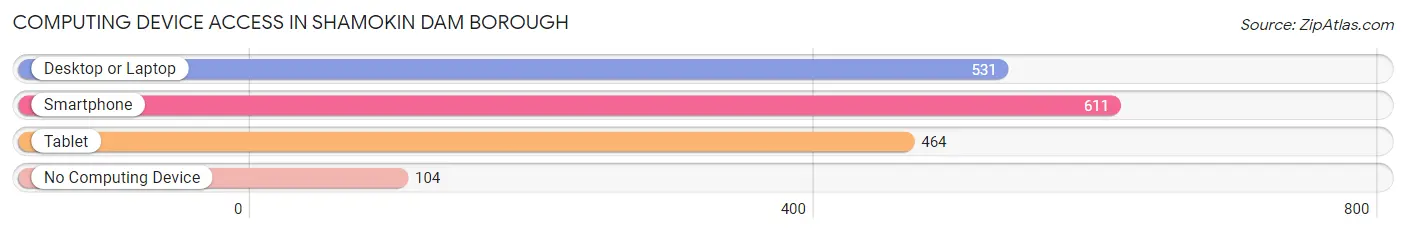
| Device Type | # Households | % Households |
| Desktop or Laptop | 531 | 68.8% |
| Smartphone | 611 | 79.1% |
| Tablet | 464 | 60.1% |
| No Computing Device | 104 | 13.5% |
| Total | 772 | 100.0% |
Internet Access in Shamokin Dam borough
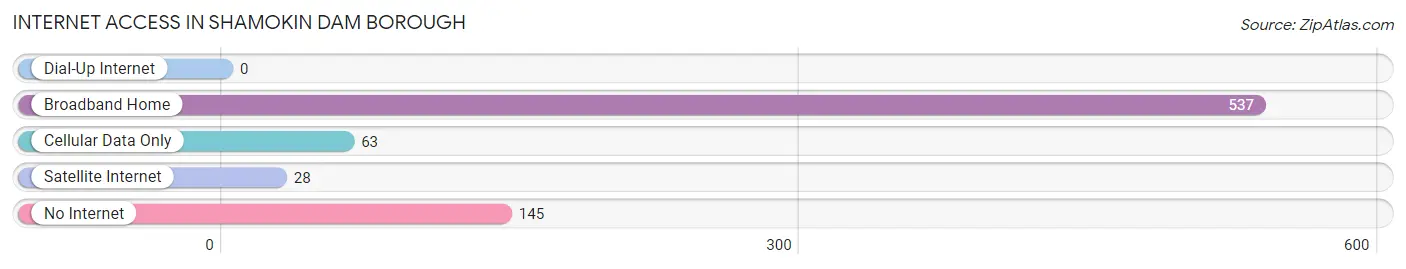
| Internet Type | # Households | % Households |
| Dial-Up Internet | 0 | 0.0% |
| Broadband Home | 537 | 69.6% |
| Cellular Data Only | 63 | 8.2% |
| Satellite Internet | 28 | 3.6% |
| No Internet | 145 | 18.8% |
| Total | 772 | 100.0% |
Shamokin Dam borough Summary
Introduction
Situated in the heart of Central Pennsylvania, Shamokin Dam Borough is a small community of approximately 2,000 people. It is located in Snyder County, about 10 miles north of Selinsgrove and 15 miles south of Sunbury. The borough is situated along the Susquehanna River and is home to a variety of businesses, including a paper mill, a power plant, and a variety of other industries.
History
The area that is now Shamokin Dam Borough was originally inhabited by the Iroquois and Susquehannock Native American tribes. The first European settlers arrived in the area in the late 1700s, and the town was officially established in 1845. The town was named after the nearby dam, which was built in 1848 to provide power for the local paper mill.
The paper mill was the main industry in the area for many years, and it provided employment for many of the town’s residents. In the early 1900s, the town also became home to a power plant, which provided electricity to the surrounding area.
In the 1950s, the town began to experience a population decline as many of the local industries began to close. However, the town has since experienced a resurgence in population and economic activity.
Geography
Shamokin Dam Borough is located in the Susquehanna Valley region of Central Pennsylvania. The borough is situated along the Susquehanna River and is bordered by the towns of Selinsgrove, Sunbury, and Hummels Wharf. The borough is located at an elevation of approximately 500 feet above sea level.
The borough has a total area of 1.2 square miles, all of which is land. The borough is located in a humid continental climate zone, with hot summers and cold winters. The average annual temperature is approximately 50 degrees Fahrenheit.
Economy
The economy of Shamokin Dam Borough is largely based on the paper mill and power plant that are located in the town. The paper mill is the largest employer in the borough, providing jobs for many of the town’s residents. The power plant is also a major employer, providing electricity to the surrounding area.
In addition to these two industries, the borough is also home to a variety of other businesses, including restaurants, retail stores, and professional services. The borough also has a small tourism industry, with visitors coming to the area to enjoy the Susquehanna River and the nearby state parks.
Demographics
As of the 2010 census, the population of Shamokin Dam Borough was 1,945. The population is predominantly white, with approximately 95% of the population identifying as white. The median household income in the borough is $41,000, and the median age is 43.
Conclusion
Shamokin Dam Borough is a small community located in Central Pennsylvania. The borough is situated along the Susquehanna River and is home to a variety of businesses, including a paper mill, a power plant, and a variety of other industries. The borough has a population of approximately 1,945 people, and the median household income is $41,000. The borough is a great place to live and work, and it offers a variety of amenities and attractions for its residents.
Common Questions
What is Per Capita Income in Shamokin Dam borough?
Per Capita income in Shamokin Dam borough is $34,793.
What is the Median Family Income in Shamokin Dam borough?
Median Family Income in Shamokin Dam borough is $91,375.
What is the Median Household income in Shamokin Dam borough?
Median Household Income in Shamokin Dam borough is $73,462.
What is Income or Wage Gap in Shamokin Dam borough?
Income or Wage Gap in Shamokin Dam borough is 32.7%.
Women in Shamokin Dam borough earn 67.3 cents for every dollar earned by a man.
What is Inequality or Gini Index in Shamokin Dam borough?
Inequality or Gini Index in Shamokin Dam borough is 0.37.
What is the Total Population of Shamokin Dam borough?
Total Population of Shamokin Dam borough is 1,829.
What is the Total Male Population of Shamokin Dam borough?
Total Male Population of Shamokin Dam borough is 865.
What is the Total Female Population of Shamokin Dam borough?
Total Female Population of Shamokin Dam borough is 964.
What is the Ratio of Males per 100 Females in Shamokin Dam borough?
There are 89.73 Males per 100 Females in Shamokin Dam borough.
What is the Ratio of Females per 100 Males in Shamokin Dam borough?
There are 111.45 Females per 100 Males in Shamokin Dam borough.
What is the Median Population Age in Shamokin Dam borough?
Median Population Age in Shamokin Dam borough is 49.1 Years.
What is the Average Family Size in Shamokin Dam borough
Average Family Size in Shamokin Dam borough is 2.9 People.
What is the Average Household Size in Shamokin Dam borough
Average Household Size in Shamokin Dam borough is 2.4 People.
How Large is the Labor Force in Shamokin Dam borough?
There are 970 People in the Labor Forcein in Shamokin Dam borough.
What is the Percentage of People in the Labor Force in Shamokin Dam borough?
61.5% of People are in the Labor Force in Shamokin Dam borough.
What is the Unemployment Rate in Shamokin Dam borough?
Unemployment Rate in Shamokin Dam borough is 3.3%.