South Lyon, MI Map & Demographics
South Lyon Map
South Lyon Overview
$50,512
PER CAPITA INCOME
$117,130
AVG FAMILY INCOME
$82,753
AVG HOUSEHOLD INCOME
31.3%
WAGE / INCOME GAP [ % ]
68.7¢/ $1
WAGE / INCOME GAP [ $ ]
0.43
INEQUALITY / GINI INDEX
11,788
TOTAL POPULATION
5,673
MALE POPULATION
6,115
FEMALE POPULATION
92.77
MALES / 100 FEMALES
107.79
FEMALES / 100 MALES
46.7
MEDIAN AGE
2.9
AVG FAMILY SIZE
2.3
AVG HOUSEHOLD SIZE
6,755
LABOR FORCE [ PEOPLE ]
68.5%
PERCENT IN LABOR FORCE
3.6%
UNEMPLOYMENT RATE
South Lyon Zip Codes
South Lyon Area Codes
Income in South Lyon
Income Overview in South Lyon
Per Capita Income in South Lyon is $50,512, while median incomes of families and households are $117,130 and $82,753 respectively.
| Characteristic | Number | Measure |
| Per Capita Income | 11,788 | $50,512 |
| Median Family Income | 3,330 | $117,130 |
| Mean Family Income | 3,330 | $141,365 |
| Median Household Income | 5,121 | $82,753 |
| Mean Household Income | 5,121 | $111,255 |
| Income Deficit | 3,330 | $0 |
| Wage / Income Gap (%) | 11,788 | 31.29% |
| Wage / Income Gap ($) | 11,788 | 68.71¢ per $1 |
| Gini / Inequality Index | 11,788 | 0.43 |
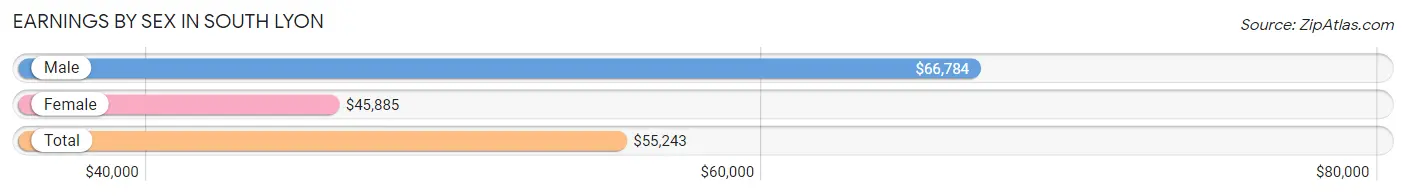
Earnings by Sex in South Lyon
Average Earnings in South Lyon are $55,243, $66,784 for men and $45,885 for women, a difference of 31.3%.
| Sex | Number | Average Earnings |
| Male | 3,731 (52.9%) | $66,784 |
| Female | 3,324 (47.1%) | $45,885 |
| Total | 7,055 (100.0%) | $55,243 |
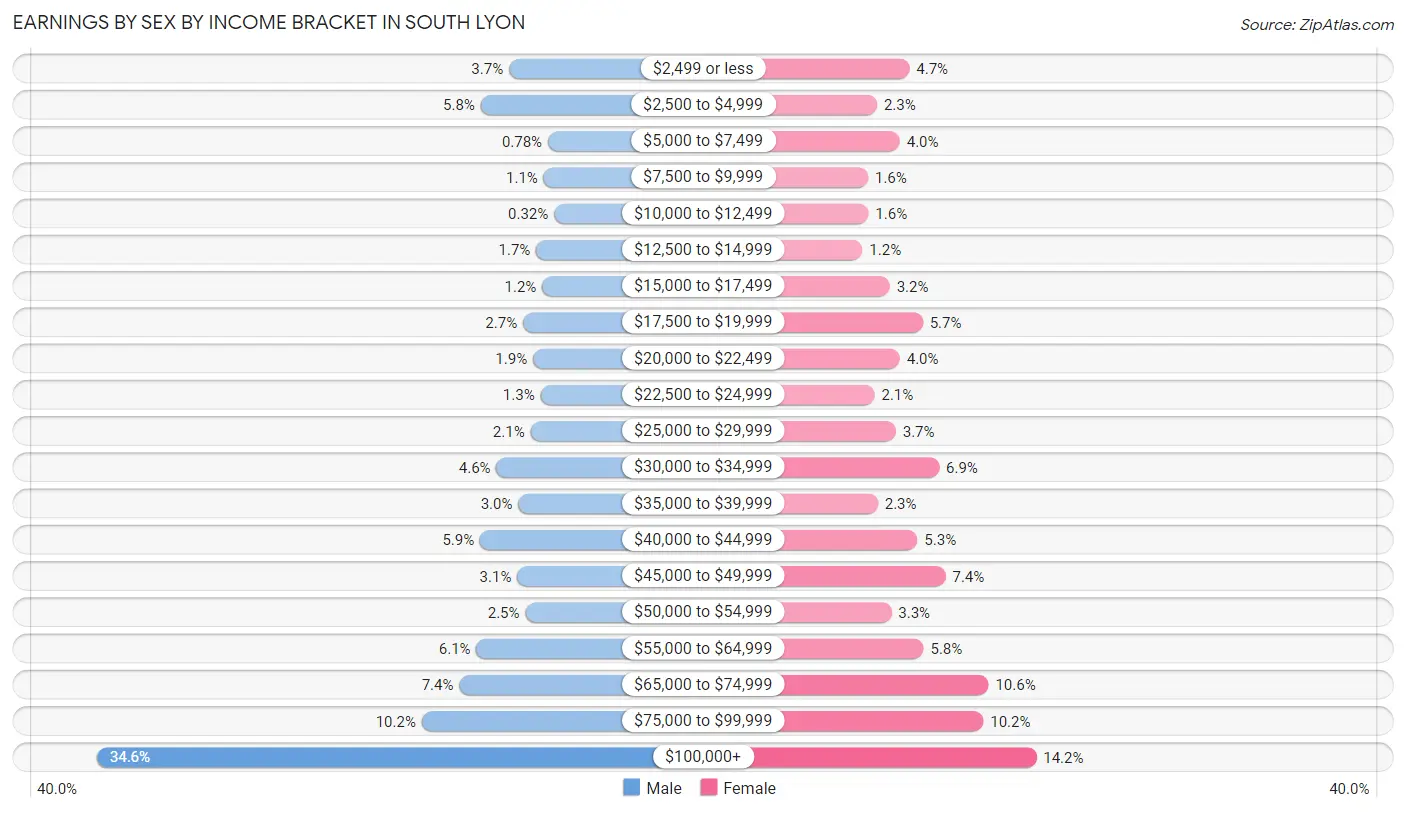
Earnings by Sex by Income Bracket in South Lyon
The most common earnings brackets in South Lyon are $100,000+ for men (1,290 | 34.6%) and $100,000+ for women (472 | 14.2%).
| Income | Male | Female |
| $2,499 or less | 138 (3.7%) | 156 (4.7%) |
| $2,500 to $4,999 | 217 (5.8%) | 75 (2.3%) |
| $5,000 to $7,499 | 29 (0.8%) | 132 (4.0%) |
| $7,500 to $9,999 | 41 (1.1%) | 53 (1.6%) |
| $10,000 to $12,499 | 12 (0.3%) | 54 (1.6%) |
| $12,500 to $14,999 | 62 (1.7%) | 39 (1.2%) |
| $15,000 to $17,499 | 45 (1.2%) | 107 (3.2%) |
| $17,500 to $19,999 | 99 (2.6%) | 189 (5.7%) |
| $20,000 to $22,499 | 71 (1.9%) | 132 (4.0%) |
| $22,500 to $24,999 | 50 (1.3%) | 69 (2.1%) |
| $25,000 to $29,999 | 78 (2.1%) | 122 (3.7%) |
| $30,000 to $34,999 | 173 (4.6%) | 230 (6.9%) |
| $35,000 to $39,999 | 112 (3.0%) | 77 (2.3%) |
| $40,000 to $44,999 | 219 (5.9%) | 176 (5.3%) |
| $45,000 to $49,999 | 115 (3.1%) | 246 (7.4%) |
| $50,000 to $54,999 | 92 (2.5%) | 111 (3.3%) |
| $55,000 to $64,999 | 229 (6.1%) | 191 (5.8%) |
| $65,000 to $74,999 | 277 (7.4%) | 353 (10.6%) |
| $75,000 to $99,999 | 382 (10.2%) | 340 (10.2%) |
| $100,000+ | 1,290 (34.6%) | 472 (14.2%) |
| Total | 3,731 (100.0%) | 3,324 (100.0%) |
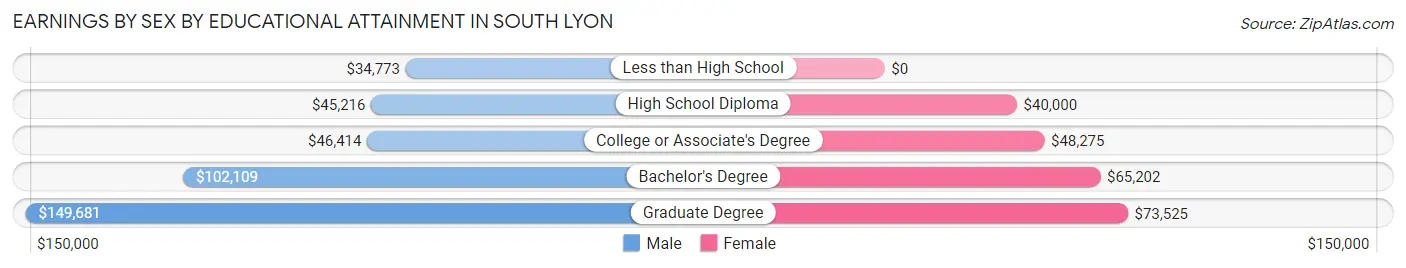
Earnings by Sex by Educational Attainment in South Lyon
Average earnings in South Lyon are $79,659 for men and $55,735 for women, a difference of 30.0%. Men with an educational attainment of graduate degree enjoy the highest average annual earnings of $149,681, while those with less than high school education earn the least with $34,773. Women with an educational attainment of graduate degree earn the most with the average annual earnings of $73,525, while those with high school diploma education have the smallest earnings of $40,000.
| Educational Attainment | Male Income | Female Income |
| Less than High School | $34,773 | $0 |
| High School Diploma | $45,216 | $40,000 |
| College or Associate's Degree | $46,414 | $48,275 |
| Bachelor's Degree | $102,109 | $65,202 |
| Graduate Degree | $149,681 | $73,525 |
| Total | $79,659 | $55,735 |
Family Income in South Lyon
Family Income Brackets in South Lyon
According to the South Lyon family income data, there are 746 families falling into the $200,000+ income range, which is the most common income bracket and makes up 22.4% of all families. Conversely, the less than $10,000 income bracket is the least frequent group with only 20 families (0.6%) belonging to this category.
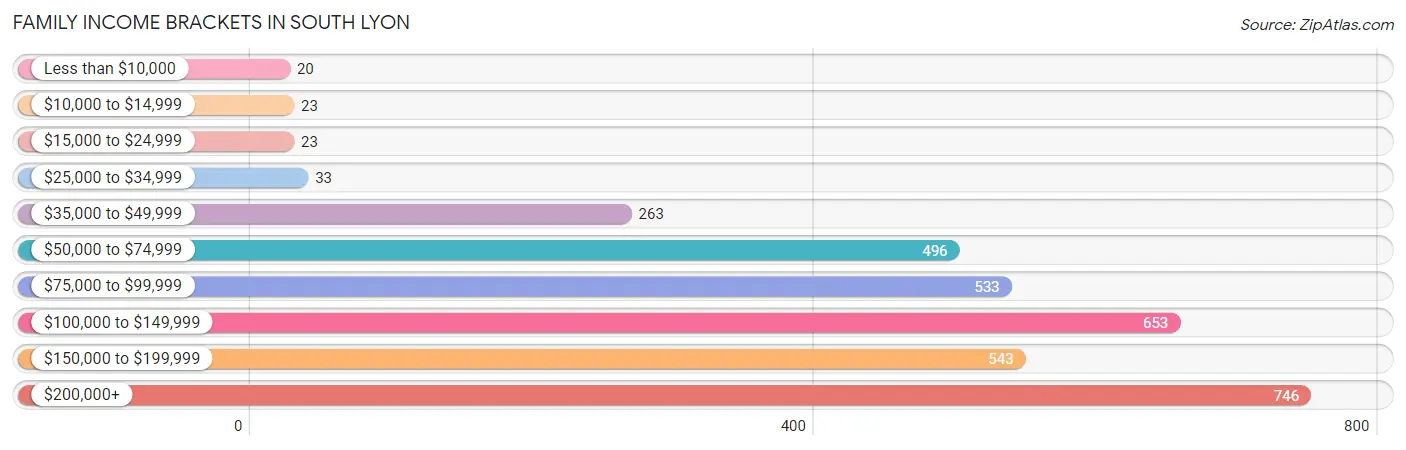
| Income Bracket | # Families | % Families |
| Less than $10,000 | 20 | 0.6% |
| $10,000 to $14,999 | 23 | 0.7% |
| $15,000 to $24,999 | 23 | 0.7% |
| $25,000 to $34,999 | 33 | 1.0% |
| $35,000 to $49,999 | 263 | 7.9% |
| $50,000 to $74,999 | 496 | 14.9% |
| $75,000 to $99,999 | 533 | 16.0% |
| $100,000 to $149,999 | 653 | 19.6% |
| $150,000 to $199,999 | 543 | 16.3% |
| $200,000+ | 746 | 22.4% |
Family Income by Famaliy Size in South Lyon
4-person families (428 | 12.9%) account for the highest median family income in South Lyon with $191,944 per family, while 4-person families (428 | 12.9%) have the highest median income of $47,986 per family member.
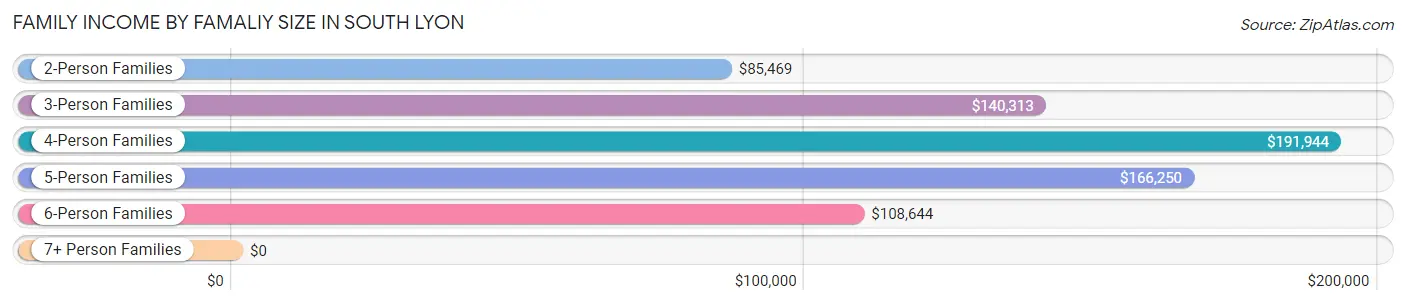
| Income Bracket | # Families | Median Income |
| 2-Person Families | 1,719 (51.6%) | $85,469 |
| 3-Person Families | 920 (27.6%) | $140,313 |
| 4-Person Families | 428 (12.9%) | $191,944 |
| 5-Person Families | 160 (4.8%) | $166,250 |
| 6-Person Families | 93 (2.8%) | $108,644 |
| 7+ Person Families | 10 (0.3%) | $0 |
| Total | 3,330 (100.0%) | $117,130 |
Family Income by Number of Earners in South Lyon
The median family income in South Lyon is $117,130, with families comprising 3+ earners (484) having the highest median family income of $224,444, while families with no earners (452) have the lowest median family income of $65,976, accounting for 14.5% and 13.6% of families, respectively.
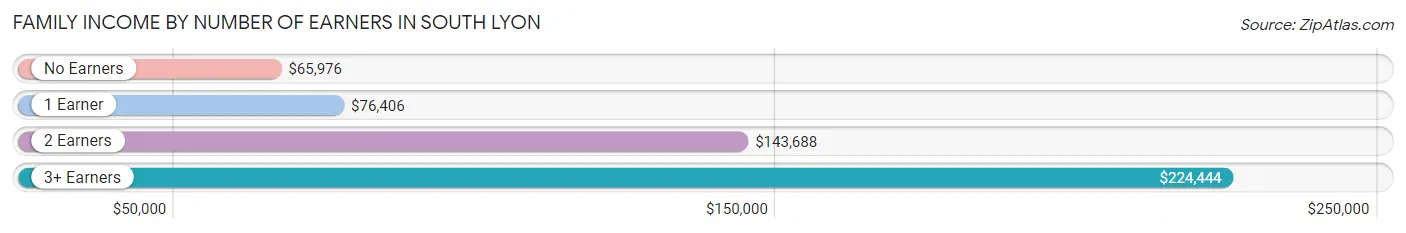
| Number of Earners | # Families | Median Income |
| No Earners | 452 (13.6%) | $65,976 |
| 1 Earner | 969 (29.1%) | $76,406 |
| 2 Earners | 1,425 (42.8%) | $143,688 |
| 3+ Earners | 484 (14.5%) | $224,444 |
| Total | 3,330 (100.0%) | $117,130 |
Household Income in South Lyon
Household Income Brackets in South Lyon
With 881 households falling in the category, the $50,000 to $74,999 income range is the most frequent in South Lyon, accounting for 17.2% of all households. In contrast, only 113 households (2.2%) fall into the $10,000 to $14,999 income bracket, making it the least populous group.
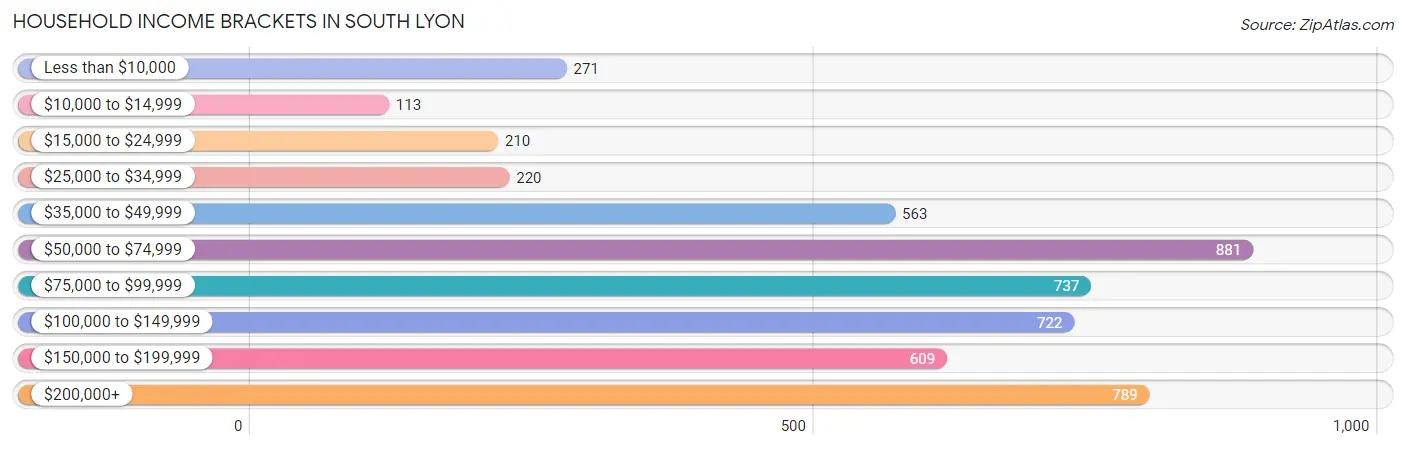
| Income Bracket | # Households | % Households |
| Less than $10,000 | 271 | 5.3% |
| $10,000 to $14,999 | 113 | 2.2% |
| $15,000 to $24,999 | 210 | 4.1% |
| $25,000 to $34,999 | 220 | 4.3% |
| $35,000 to $49,999 | 563 | 11.0% |
| $50,000 to $74,999 | 881 | 17.2% |
| $75,000 to $99,999 | 737 | 14.4% |
| $100,000 to $149,999 | 722 | 14.1% |
| $150,000 to $199,999 | 609 | 11.9% |
| $200,000+ | 789 | 15.4% |
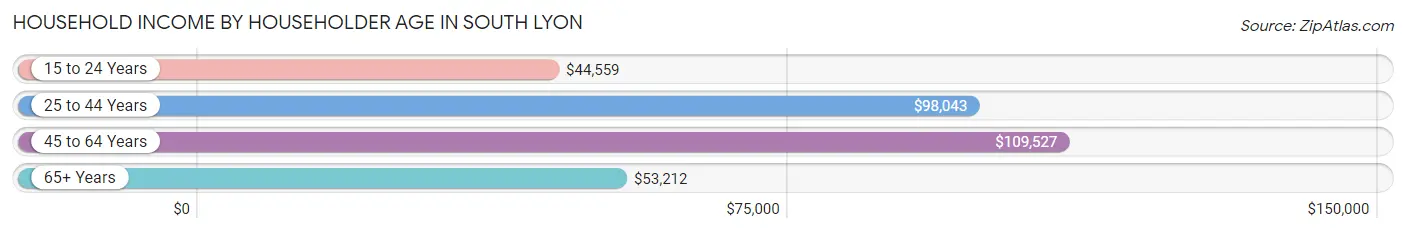
Household Income by Householder Age in South Lyon
The median household income in South Lyon is $82,753, with the highest median household income of $109,527 found in the 45 to 64 years age bracket for the primary householder. A total of 2,380 households (46.5%) fall into this category. Meanwhile, the 15 to 24 years age bracket for the primary householder has the lowest median household income of $44,559, with 284 households (5.6%) in this group.
| Income Bracket | # Households | Median Income |
| 15 to 24 Years | 284 (5.6%) | $44,559 |
| 25 to 44 Years | 1,186 (23.2%) | $98,043 |
| 45 to 64 Years | 2,380 (46.5%) | $109,527 |
| 65+ Years | 1,271 (24.8%) | $53,212 |
| Total | 5,121 (100.0%) | $82,753 |
Poverty in South Lyon
Income Below Poverty by Sex and Age in South Lyon
With 2.8% poverty level for males and 7.0% for females among the residents of South Lyon, 18 to 24 year old males and 18 to 24 year old females are the most vulnerable to poverty, with 60 males (9.4%) and 96 females (14.9%) in their respective age groups living below the poverty level.
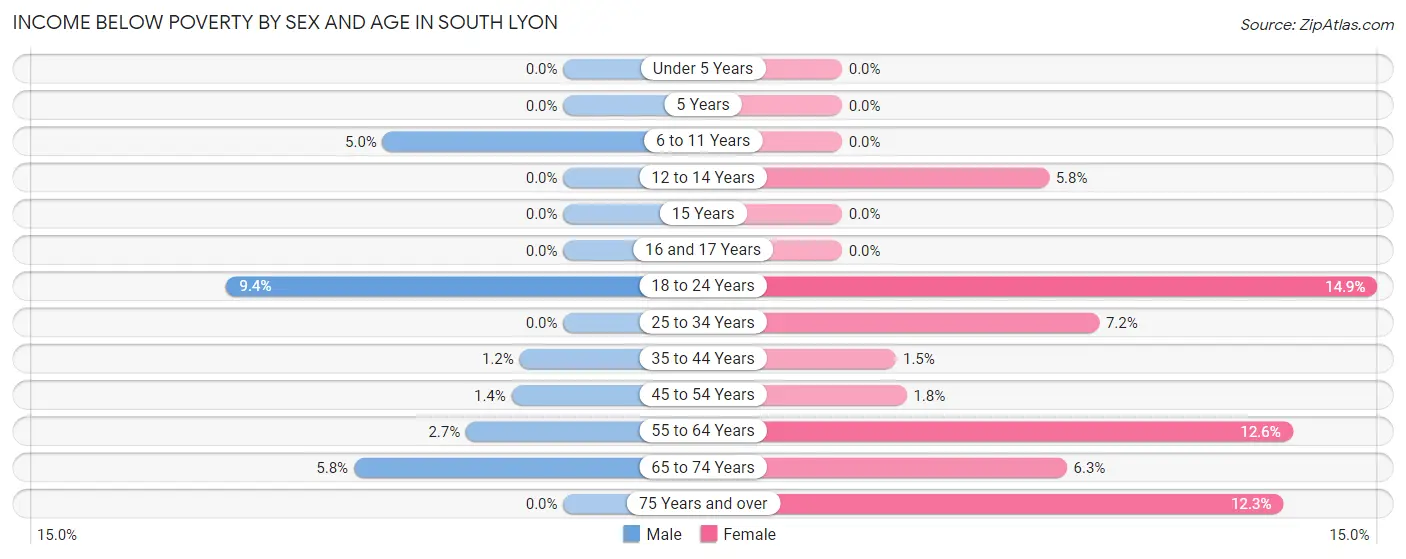
| Age Bracket | Male | Female |
| Under 5 Years | 0 (0.0%) | 0 (0.0%) |
| 5 Years | 0 (0.0%) | 0 (0.0%) |
| 6 to 11 Years | 15 (5.0%) | 0 (0.0%) |
| 12 to 14 Years | 0 (0.0%) | 14 (5.8%) |
| 15 Years | 0 (0.0%) | 0 (0.0%) |
| 16 and 17 Years | 0 (0.0%) | 0 (0.0%) |
| 18 to 24 Years | 60 (9.4%) | 96 (14.9%) |
| 25 to 34 Years | 0 (0.0%) | 41 (7.2%) |
| 35 to 44 Years | 8 (1.2%) | 9 (1.5%) |
| 45 to 54 Years | 13 (1.4%) | 16 (1.8%) |
| 55 to 64 Years | 31 (2.7%) | 139 (12.6%) |
| 65 to 74 Years | 30 (5.8%) | 36 (6.3%) |
| 75 Years and over | 0 (0.0%) | 74 (12.3%) |
| Total | 157 (2.8%) | 425 (7.0%) |
Income Above Poverty by Sex and Age in South Lyon
According to the poverty statistics in South Lyon, males aged under 5 years and females aged under 5 years are the age groups that are most secure financially, with 100.0% of males and 100.0% of females in these age groups living above the poverty line.
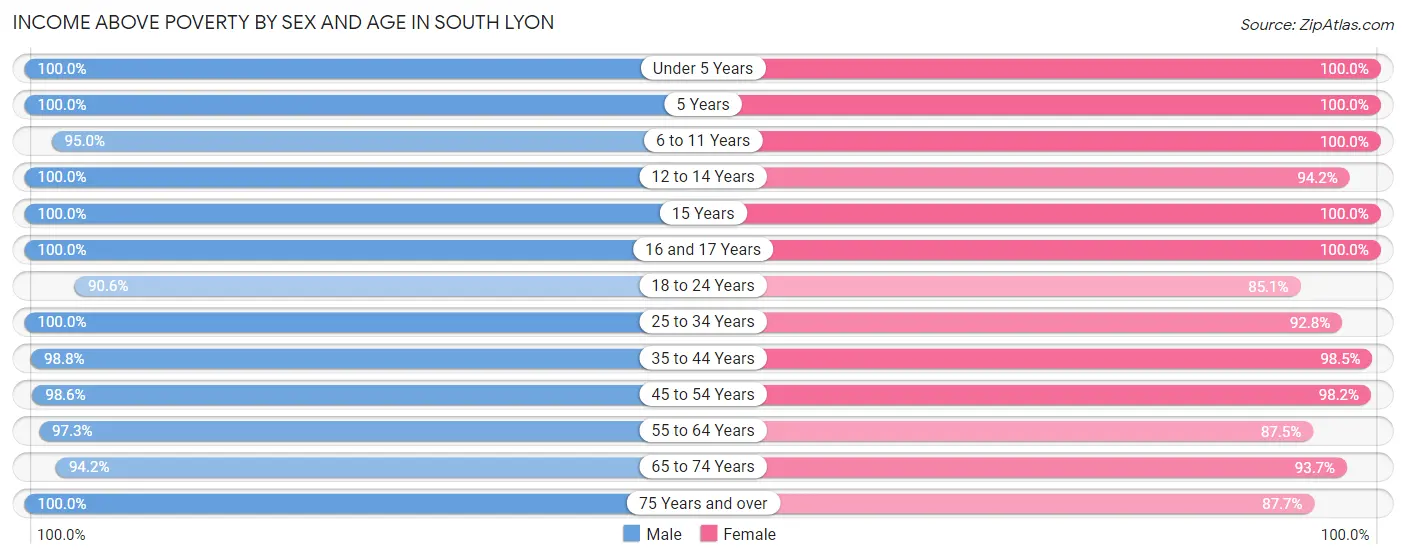
| Age Bracket | Male | Female |
| Under 5 Years | 250 (100.0%) | 227 (100.0%) |
| 5 Years | 66 (100.0%) | 69 (100.0%) |
| 6 to 11 Years | 283 (95.0%) | 383 (100.0%) |
| 12 to 14 Years | 203 (100.0%) | 229 (94.2%) |
| 15 Years | 80 (100.0%) | 108 (100.0%) |
| 16 and 17 Years | 112 (100.0%) | 72 (100.0%) |
| 18 to 24 Years | 580 (90.6%) | 548 (85.1%) |
| 25 to 34 Years | 461 (100.0%) | 532 (92.8%) |
| 35 to 44 Years | 650 (98.8%) | 586 (98.5%) |
| 45 to 54 Years | 892 (98.6%) | 872 (98.2%) |
| 55 to 64 Years | 1,111 (97.3%) | 969 (87.5%) |
| 65 to 74 Years | 485 (94.2%) | 539 (93.7%) |
| 75 Years and over | 304 (100.0%) | 528 (87.7%) |
| Total | 5,477 (97.2%) | 5,662 (93.0%) |
Income Below Poverty Among Married-Couple Families in South Lyon
The poverty statistics for married-couple families in South Lyon show that 0.7% or 19 of the total 2,701 families live below the poverty line. Families with no children have the highest poverty rate of 1.0%, comprising of 19 families. On the other hand, families with 1 or 2 children have the lowest poverty rate of 0.0%, which includes 0 families.
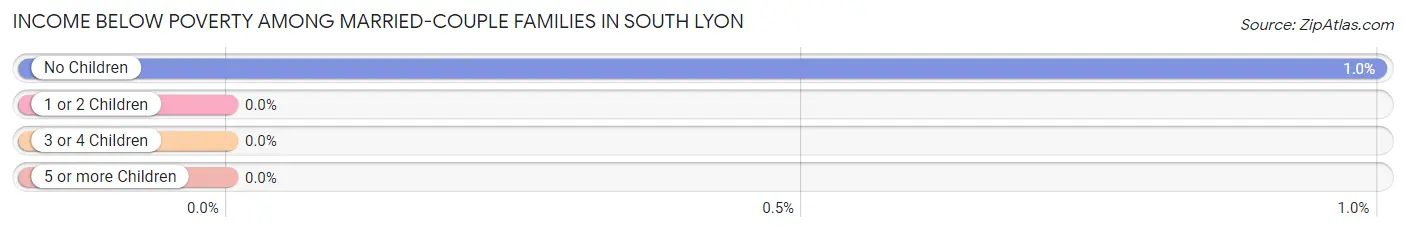
| Children | Above Poverty | Below Poverty |
| No Children | 1,882 (99.0%) | 19 (1.0%) |
| 1 or 2 Children | 568 (100.0%) | 0 (0.0%) |
| 3 or 4 Children | 232 (100.0%) | 0 (0.0%) |
| 5 or more Children | 0 (0.0%) | 0 (0.0%) |
| Total | 2,682 (99.3%) | 19 (0.7%) |
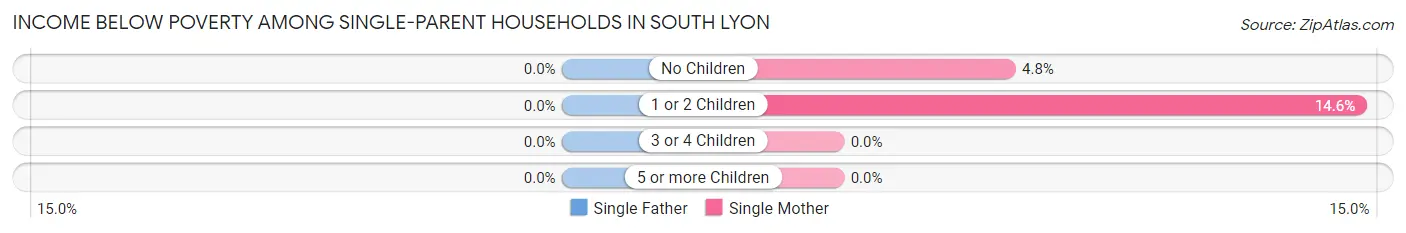
Income Below Poverty Among Single-Parent Households in South Lyon
| Children | Single Father | Single Mother |
| No Children | 0 (0.0%) | 7 (4.8%) |
| 1 or 2 Children | 0 (0.0%) | 31 (14.6%) |
| 3 or 4 Children | 0 (0.0%) | 0 (0.0%) |
| 5 or more Children | 0 (0.0%) | 0 (0.0%) |
| Total | 0 (0.0%) | 38 (10.3%) |
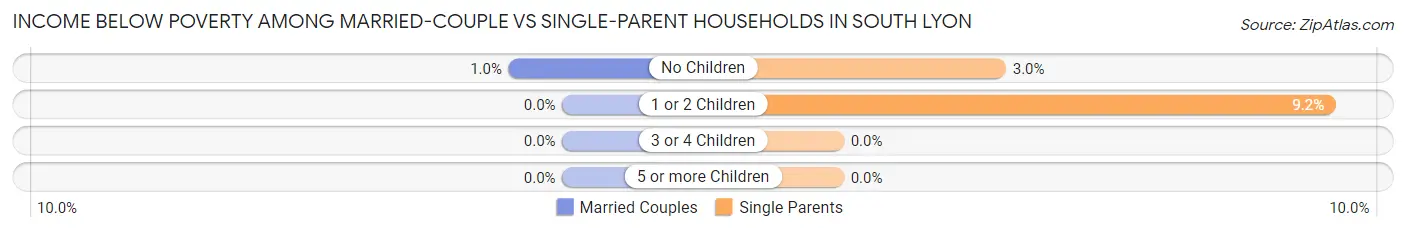
Income Below Poverty Among Married-Couple vs Single-Parent Households in South Lyon
The poverty data for South Lyon shows that 19 of the married-couple family households (0.7%) and 38 of the single-parent households (6.0%) are living below the poverty level. Within the married-couple family households, those with no children have the highest poverty rate, with 19 households (1.0%) falling below the poverty line. Among the single-parent households, those with 1 or 2 children have the highest poverty rate, with 31 household (9.2%) living below poverty.
| Children | Married-Couple Families | Single-Parent Households |
| No Children | 19 (1.0%) | 7 (3.0%) |
| 1 or 2 Children | 0 (0.0%) | 31 (9.2%) |
| 3 or 4 Children | 0 (0.0%) | 0 (0.0%) |
| 5 or more Children | 0 (0.0%) | 0 (0.0%) |
| Total | 19 (0.7%) | 38 (6.0%) |
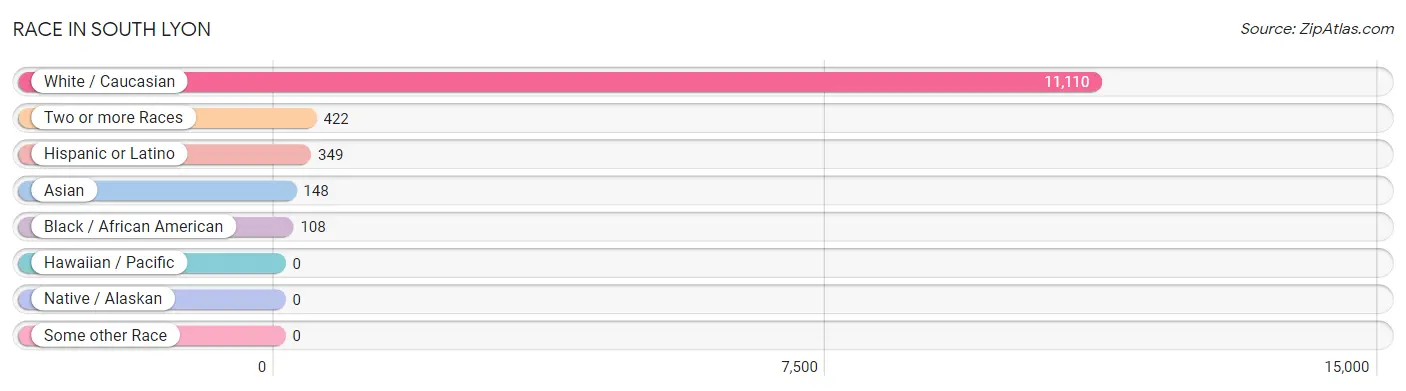
Race in South Lyon
The most populous races in South Lyon are White / Caucasian (11,110 | 94.3%), Two or more Races (422 | 3.6%), and Hispanic or Latino (349 | 3.0%).
| Race | # Population | % Population |
| Asian | 148 | 1.3% |
| Black / African American | 108 | 0.9% |
| Hawaiian / Pacific | 0 | 0.0% |
| Hispanic or Latino | 349 | 3.0% |
| Native / Alaskan | 0 | 0.0% |
| White / Caucasian | 11,110 | 94.3% |
| Two or more Races | 422 | 3.6% |
| Some other Race | 0 | 0.0% |
| Total | 11,788 | 100.0% |
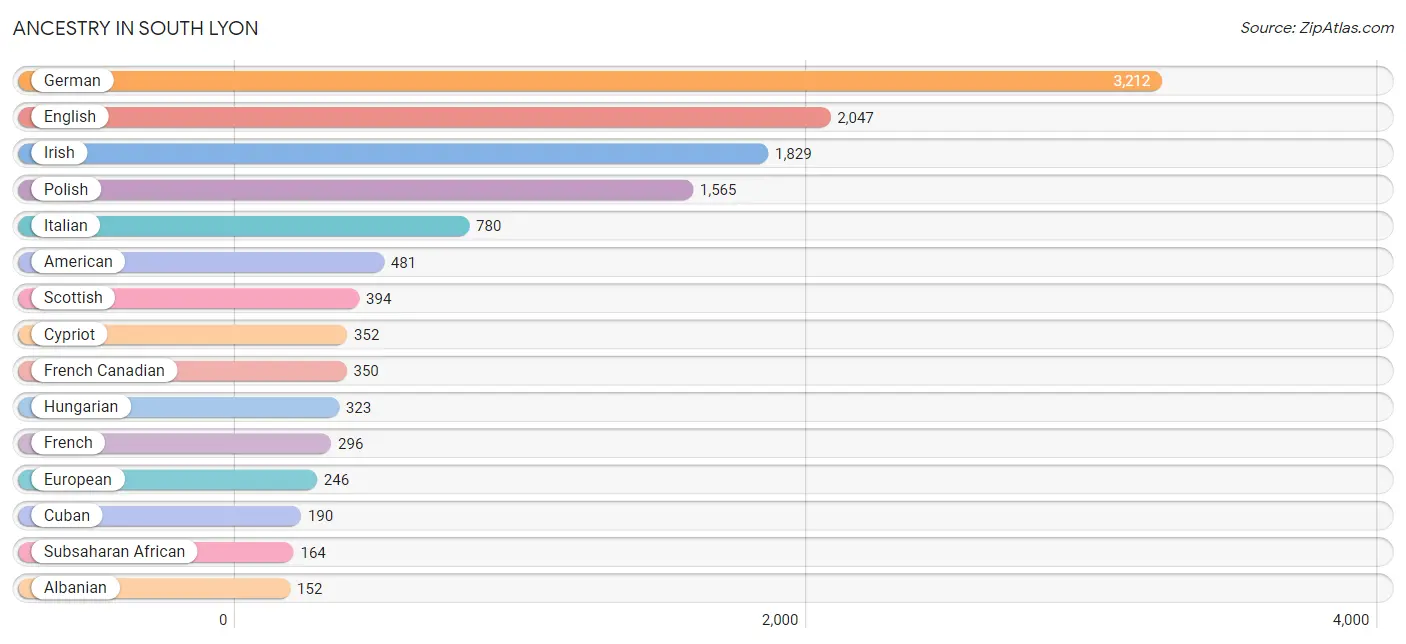
Ancestry in South Lyon
The most populous ancestries reported in South Lyon are German (3,212 | 27.3%), English (2,047 | 17.4%), Irish (1,829 | 15.5%), Polish (1,565 | 13.3%), and Italian (780 | 6.6%), together accounting for 80.0% of all South Lyon residents.
| Ancestry | # Population | % Population |
| African | 9 | 0.1% |
| Albanian | 152 | 1.3% |
| American | 481 | 4.1% |
| Arab | 91 | 0.8% |
| Armenian | 89 | 0.8% |
| Austrian | 27 | 0.2% |
| Belgian | 43 | 0.4% |
| British | 36 | 0.3% |
| Bulgarian | 11 | 0.1% |
| Canadian | 36 | 0.3% |
| Central American | 9 | 0.1% |
| Chippewa | 13 | 0.1% |
| Costa Rican | 9 | 0.1% |
| Cuban | 190 | 1.6% |
| Cypriot | 352 | 3.0% |
| Czech | 13 | 0.1% |
| Danish | 9 | 0.1% |
| Dutch | 128 | 1.1% |
| Eastern European | 17 | 0.1% |
| Egyptian | 14 | 0.1% |
| English | 2,047 | 17.4% |
| European | 246 | 2.1% |
| Finnish | 89 | 0.8% |
| French | 296 | 2.5% |
| French Canadian | 350 | 3.0% |
| German | 3,212 | 27.3% |
| Greek | 18 | 0.2% |
| Hungarian | 323 | 2.7% |
| Indian (Asian) | 12 | 0.1% |
| Irish | 1,829 | 15.5% |
| Italian | 780 | 6.6% |
| Korean | 62 | 0.5% |
| Lebanese | 18 | 0.2% |
| Lithuanian | 42 | 0.4% |
| Macedonian | 17 | 0.1% |
| Maltese | 76 | 0.6% |
| Mexican | 113 | 1.0% |
| Norwegian | 61 | 0.5% |
| Polish | 1,565 | 13.3% |
| Portuguese | 14 | 0.1% |
| Puerto Rican | 19 | 0.2% |
| Romanian | 19 | 0.2% |
| Russian | 69 | 0.6% |
| Scandinavian | 5 | 0.0% |
| Scotch-Irish | 69 | 0.6% |
| Scottish | 394 | 3.3% |
| Serbian | 9 | 0.1% |
| Slavic | 10 | 0.1% |
| Slovak | 16 | 0.1% |
| South American | 18 | 0.2% |
| Sri Lankan | 100 | 0.9% |
| Subsaharan African | 164 | 1.4% |
| Swedish | 75 | 0.6% |
| Swiss | 43 | 0.4% |
| Syrian | 11 | 0.1% |
| Thai | 18 | 0.2% |
| Ukrainian | 111 | 0.9% |
| Venezuelan | 18 | 0.2% |
| Welsh | 82 | 0.7% |
| Yugoslavian | 9 | 0.1% | View All 60 Rows |
Immigrants in South Lyon
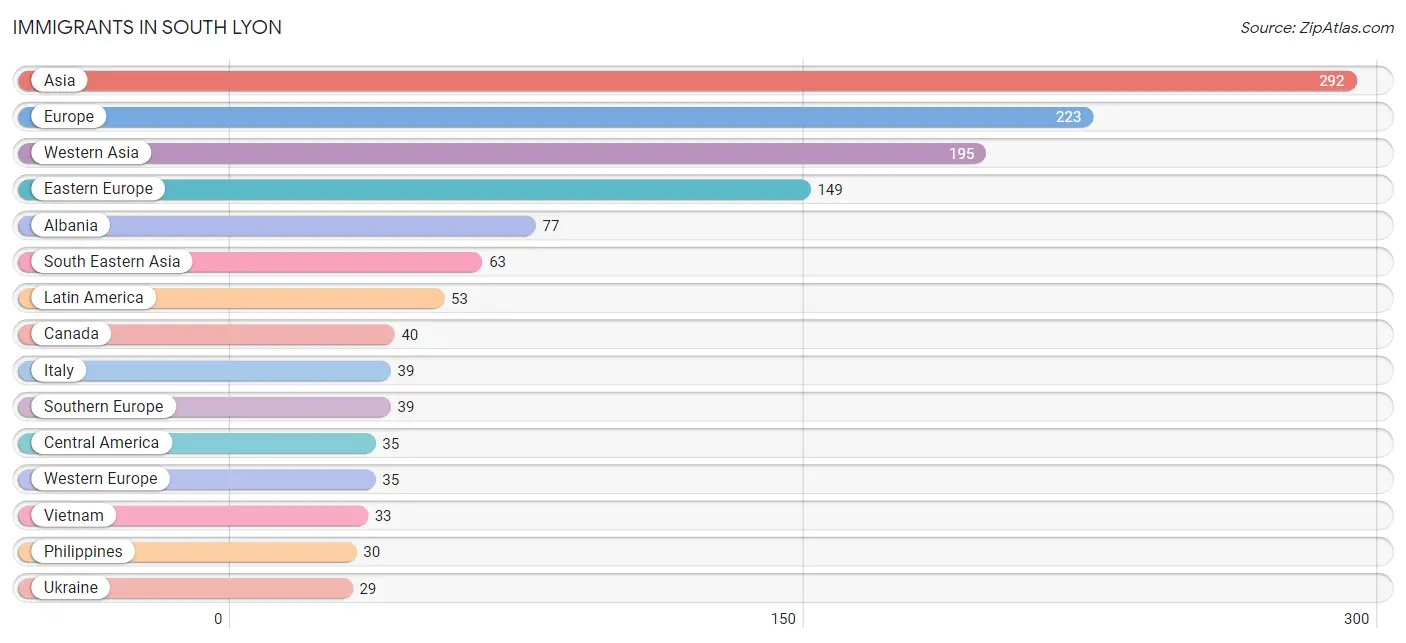
The most numerous immigrant groups reported in South Lyon came from Asia (292 | 2.5%), Europe (223 | 1.9%), Western Asia (195 | 1.7%), Eastern Europe (149 | 1.3%), and Albania (77 | 0.6%), together accounting for 7.9% of all South Lyon residents.
| Immigration Origin | # Population | % Population |
| Albania | 77 | 0.6% |
| Asia | 292 | 2.5% |
| Bulgaria | 11 | 0.1% |
| Canada | 40 | 0.3% |
| Central America | 35 | 0.3% |
| Costa Rica | 9 | 0.1% |
| Eastern Asia | 16 | 0.1% |
| Eastern Europe | 149 | 1.3% |
| Europe | 223 | 1.9% |
| Germany | 15 | 0.1% |
| India | 18 | 0.2% |
| Italy | 39 | 0.3% |
| Japan | 16 | 0.1% |
| Latin America | 53 | 0.4% |
| Mexico | 26 | 0.2% |
| Netherlands | 20 | 0.2% |
| Philippines | 30 | 0.3% |
| Romania | 19 | 0.2% |
| Russia | 13 | 0.1% |
| South America | 18 | 0.2% |
| South Central Asia | 18 | 0.2% |
| South Eastern Asia | 63 | 0.5% |
| Southern Europe | 39 | 0.3% |
| Ukraine | 29 | 0.3% |
| Venezuela | 18 | 0.2% |
| Vietnam | 33 | 0.3% |
| Western Asia | 195 | 1.7% |
| Western Europe | 35 | 0.3% | View All 28 Rows |
Sex and Age in South Lyon
Sex and Age in South Lyon
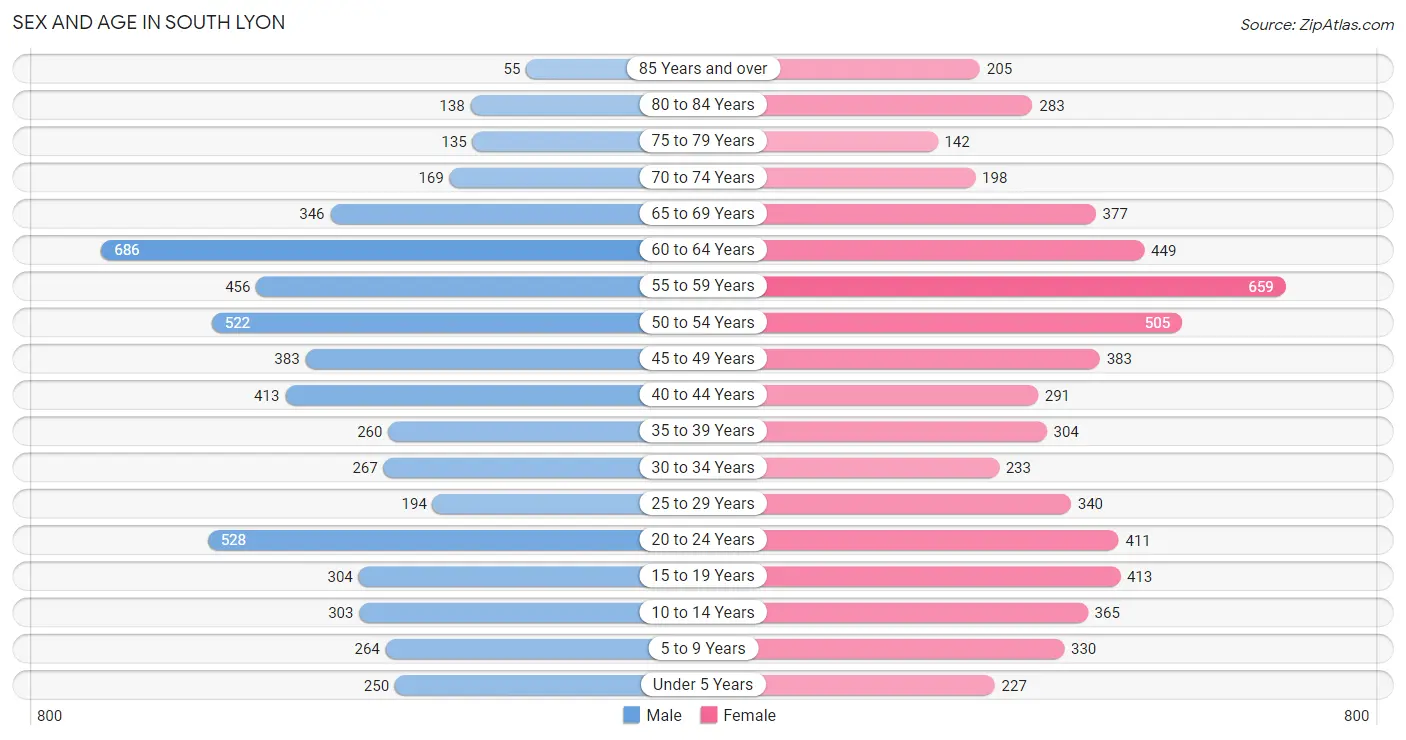
The most populous age groups in South Lyon are 60 to 64 Years (686 | 12.1%) for men and 55 to 59 Years (659 | 10.8%) for women.
| Age Bracket | Male | Female |
| Under 5 Years | 250 (4.4%) | 227 (3.7%) |
| 5 to 9 Years | 264 (4.6%) | 330 (5.4%) |
| 10 to 14 Years | 303 (5.3%) | 365 (6.0%) |
| 15 to 19 Years | 304 (5.4%) | 413 (6.8%) |
| 20 to 24 Years | 528 (9.3%) | 411 (6.7%) |
| 25 to 29 Years | 194 (3.4%) | 340 (5.6%) |
| 30 to 34 Years | 267 (4.7%) | 233 (3.8%) |
| 35 to 39 Years | 260 (4.6%) | 304 (5.0%) |
| 40 to 44 Years | 413 (7.3%) | 291 (4.8%) |
| 45 to 49 Years | 383 (6.8%) | 383 (6.3%) |
| 50 to 54 Years | 522 (9.2%) | 505 (8.3%) |
| 55 to 59 Years | 456 (8.0%) | 659 (10.8%) |
| 60 to 64 Years | 686 (12.1%) | 449 (7.3%) |
| 65 to 69 Years | 346 (6.1%) | 377 (6.2%) |
| 70 to 74 Years | 169 (3.0%) | 198 (3.2%) |
| 75 to 79 Years | 135 (2.4%) | 142 (2.3%) |
| 80 to 84 Years | 138 (2.4%) | 283 (4.6%) |
| 85 Years and over | 55 (1.0%) | 205 (3.4%) |
| Total | 5,673 (100.0%) | 6,115 (100.0%) |
Families and Households in South Lyon
Median Family Size in South Lyon
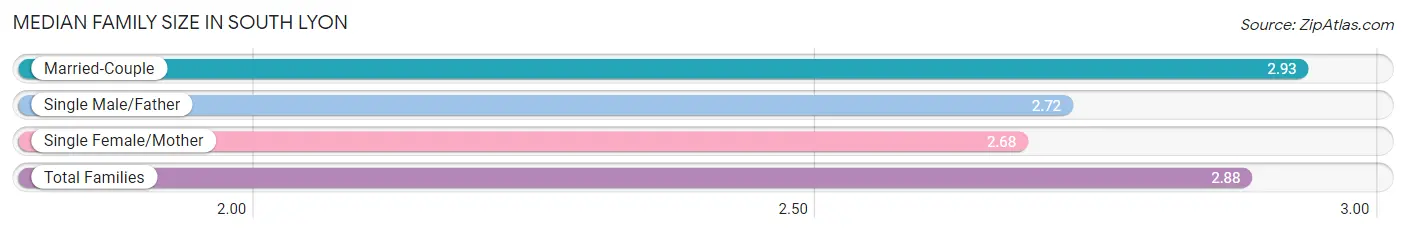
The median family size in South Lyon is 2.88 persons per family, with married-couple families (2,701 | 81.1%) accounting for the largest median family size of 2.93 persons per family. On the other hand, single female/mother families (368 | 11.1%) represent the smallest median family size with 2.68 persons per family.
| Family Type | # Families | Family Size |
| Married-Couple | 2,701 (81.1%) | 2.93 |
| Single Male/Father | 261 (7.8%) | 2.72 |
| Single Female/Mother | 368 (11.1%) | 2.68 |
| Total Families | 3,330 (100.0%) | 2.88 |
Median Household Size in South Lyon
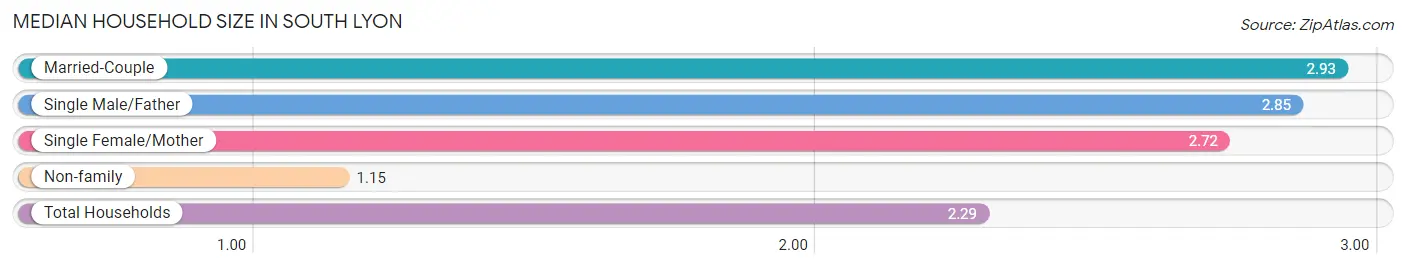
The median household size in South Lyon is 2.29 persons per household, with married-couple households (2,701 | 52.7%) accounting for the largest median household size of 2.93 persons per household. non-family households (1,791 | 35.0%) represent the smallest median household size with 1.15 persons per household.
| Household Type | # Households | Household Size |
| Married-Couple | 2,701 (52.7%) | 2.93 |
| Single Male/Father | 261 (5.1%) | 2.85 |
| Single Female/Mother | 368 (7.2%) | 2.72 |
| Non-family | 1,791 (35.0%) | 1.15 |
| Total Households | 5,121 (100.0%) | 2.29 |
Household Size by Marriage Status in South Lyon
Out of a total of 5,121 households in South Lyon, 3,330 (65.0%) are family households, while 1,791 (35.0%) are nonfamily households. The most numerous type of family households are 2-person households, comprising 1,701, and the most common type of nonfamily households are 1-person households, comprising 1,555.
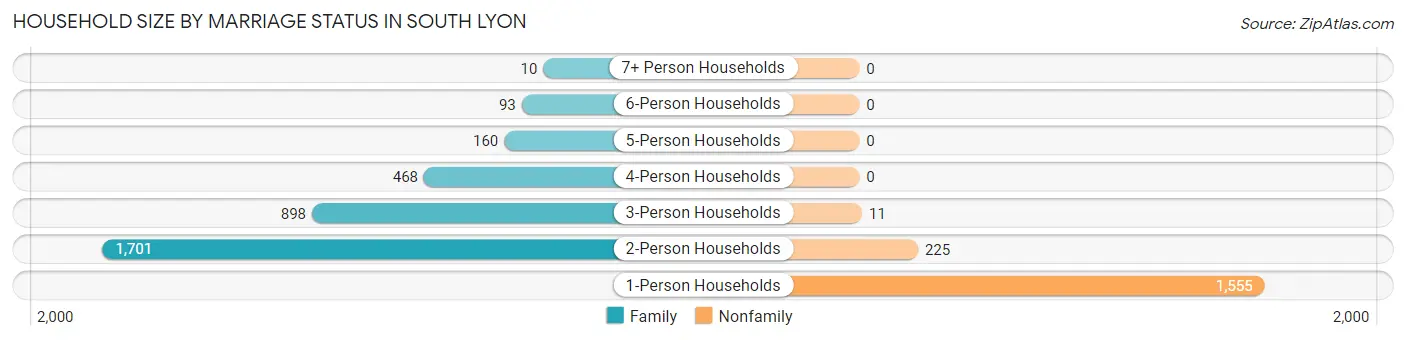
| Household Size | Family Households | Nonfamily Households |
| 1-Person Households | - | 1,555 (30.4%) |
| 2-Person Households | 1,701 (33.2%) | 225 (4.4%) |
| 3-Person Households | 898 (17.5%) | 11 (0.2%) |
| 4-Person Households | 468 (9.1%) | 0 (0.0%) |
| 5-Person Households | 160 (3.1%) | 0 (0.0%) |
| 6-Person Households | 93 (1.8%) | 0 (0.0%) |
| 7+ Person Households | 10 (0.2%) | 0 (0.0%) |
| Total | 3,330 (65.0%) | 1,791 (35.0%) |
Female Fertility in South Lyon
Fertility by Age in South Lyon
Average fertility rate in South Lyon is 21.0 births per 1,000 women. Women in the age bracket of 20 to 34 years have the highest fertility rate with 45.0 births per 1,000 women. Women in the age bracket of 20 to 34 years acount for 84.6% of all women with births.
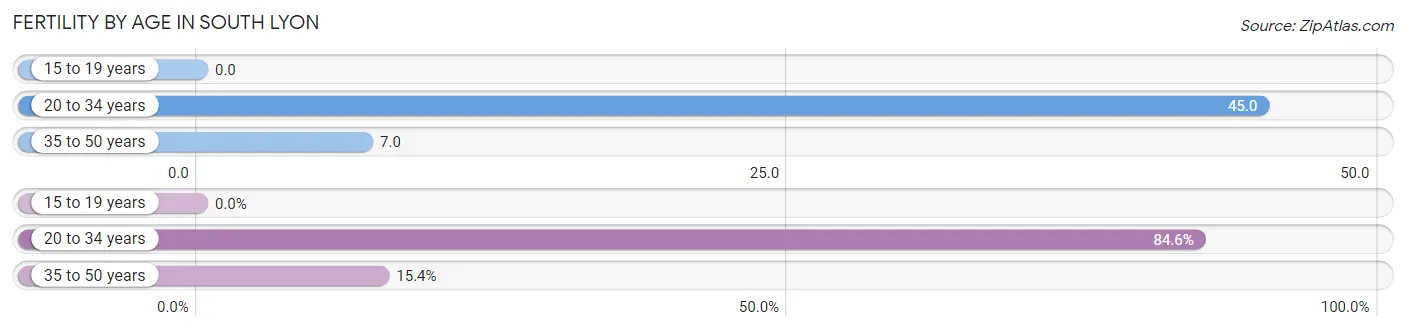
| Age Bracket | Women with Births | Births / 1,000 Women |
| 15 to 19 years | 0 (0.0%) | 0.0 |
| 20 to 34 years | 44 (84.6%) | 45.0 |
| 35 to 50 years | 8 (15.4%) | 7.0 |
| Total | 52 (100.0%) | 21.0 |
Fertility by Age by Marriage Status in South Lyon
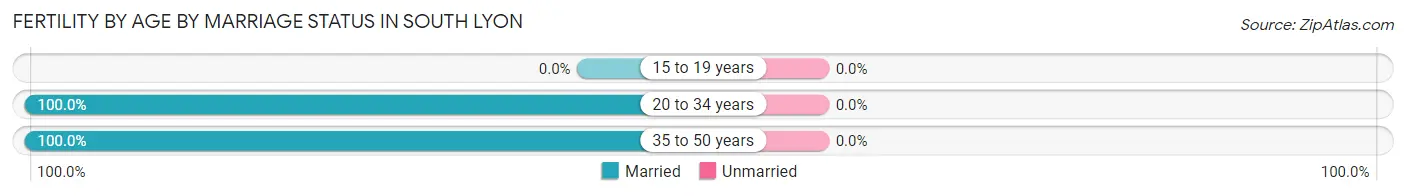
| Age Bracket | Married | Unmarried |
| 15 to 19 years | 0 (0.0%) | 0 (0.0%) |
| 20 to 34 years | 44 (100.0%) | 0 (0.0%) |
| 35 to 50 years | 8 (100.0%) | 0 (0.0%) |
| Total | 52 (100.0%) | 0 (0.0%) |
Fertility by Education in South Lyon
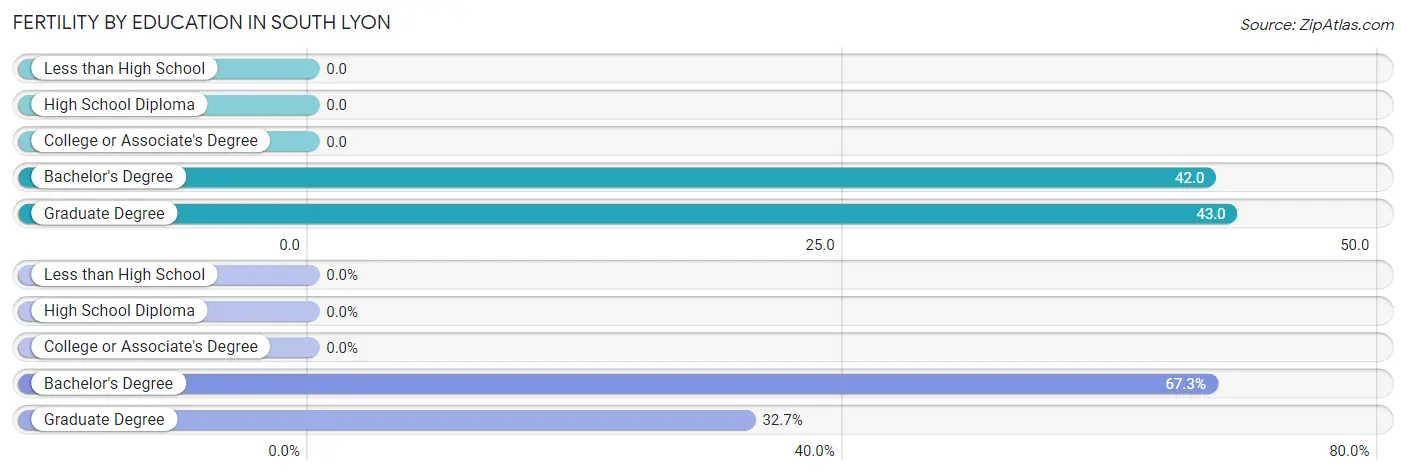
| Educational Attainment | Women with Births | Births / 1,000 Women |
| Less than High School | 0 (0.0%) | 0.0 |
| High School Diploma | 0 (0.0%) | 0.0 |
| College or Associate's Degree | 0 (0.0%) | 0.0 |
| Bachelor's Degree | 35 (67.3%) | 42.0 |
| Graduate Degree | 17 (32.7%) | 43.0 |
| Total | 52 (100.0%) | 21.0 |
Fertility by Education by Marriage Status in South Lyon
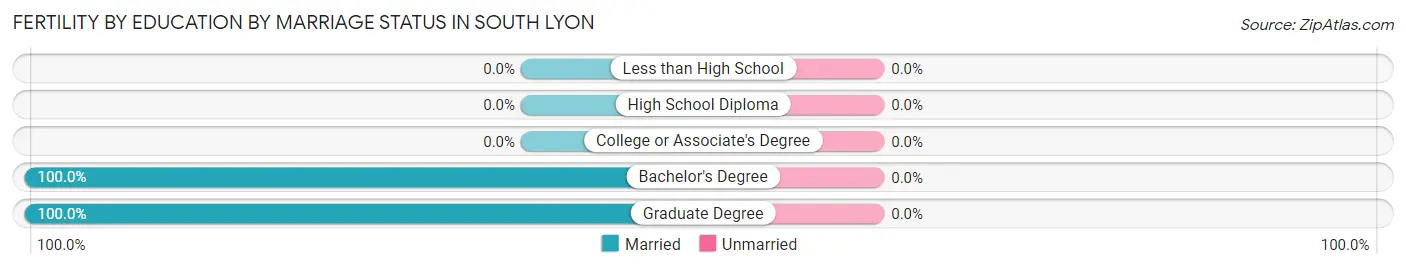
| Educational Attainment | Married | Unmarried |
| Less than High School | 0 (0.0%) | 0 (0.0%) |
| High School Diploma | 0 (0.0%) | 0 (0.0%) |
| College or Associate's Degree | 0 (0.0%) | 0 (0.0%) |
| Bachelor's Degree | 35 (100.0%) | 0 (0.0%) |
| Graduate Degree | 17 (100.0%) | 0 (0.0%) |
| Total | 52 (100.0%) | 0 (0.0%) |
Employment Characteristics in South Lyon
Employment by Class of Employer in South Lyon
Among the 6,448 employed individuals in South Lyon, private company employees (5,084 | 78.8%), local government employees (467 | 7.2%), and not-for-profit organizations (335 | 5.2%) make up the most common classes of employment.
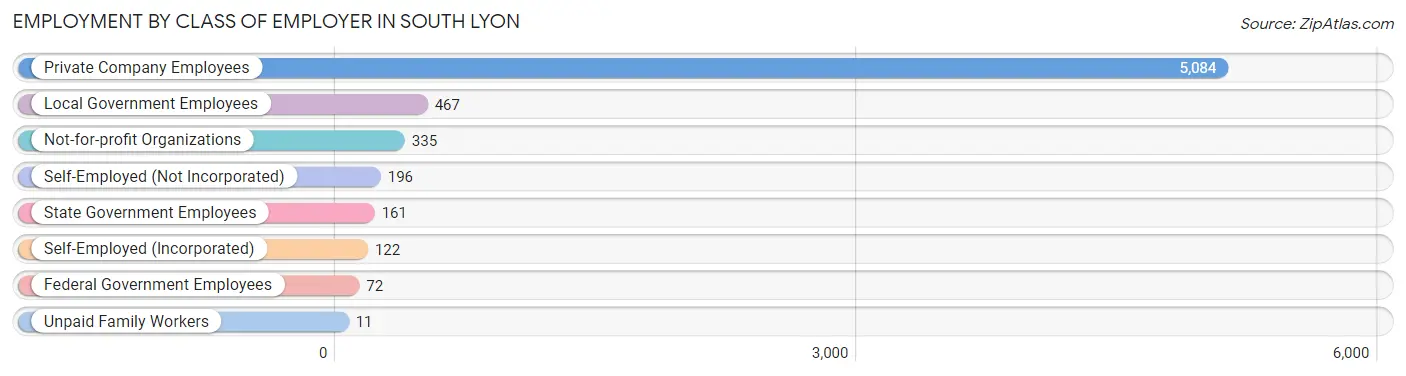
| Employer Class | # Employees | % Employees |
| Private Company Employees | 5,084 | 78.8% |
| Self-Employed (Incorporated) | 122 | 1.9% |
| Self-Employed (Not Incorporated) | 196 | 3.0% |
| Not-for-profit Organizations | 335 | 5.2% |
| Local Government Employees | 467 | 7.2% |
| State Government Employees | 161 | 2.5% |
| Federal Government Employees | 72 | 1.1% |
| Unpaid Family Workers | 11 | 0.2% |
| Total | 6,448 | 100.0% |
Employment Status by Age in South Lyon
According to the labor force statistics for South Lyon, out of the total population over 16 years of age (9,861), 68.5% or 6,755 individuals are in the labor force, with 3.6% or 243 of them unemployed. The age group with the highest labor force participation rate is 25 to 29 years, with 95.7% or 511 individuals in the labor force. Within the labor force, the 60 to 64 years age range has the highest percentage of unemployed individuals, with 16.3% or 125 of them being unemployed.
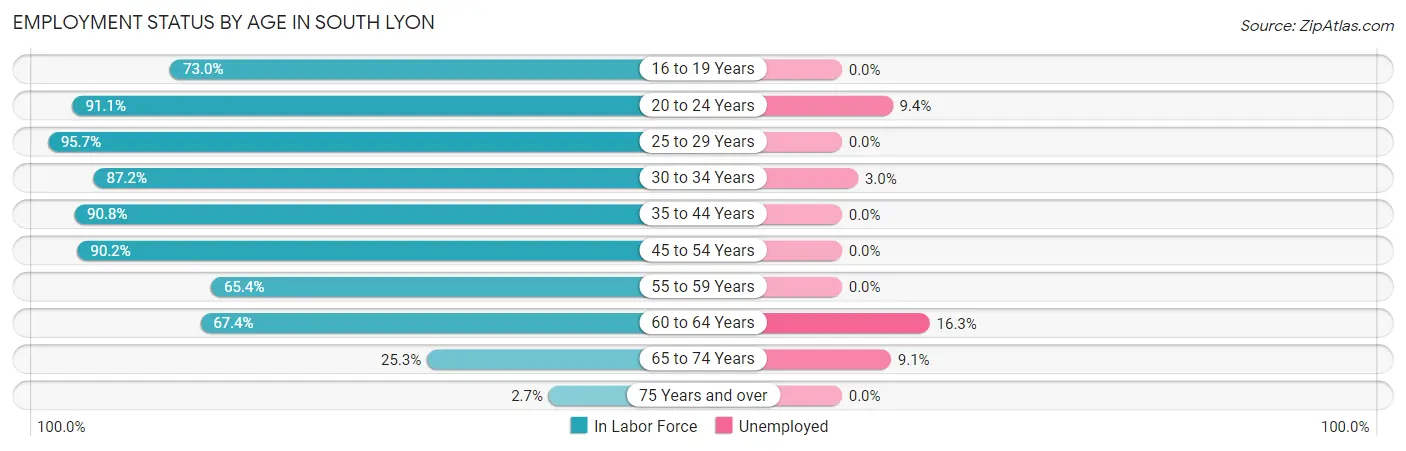
| Age Bracket | In Labor Force | Unemployed |
| 16 to 19 Years | 386 (73.0%) | 0 (0.0%) |
| 20 to 24 Years | 855 (91.1%) | 80 (9.4%) |
| 25 to 29 Years | 511 (95.7%) | 0 (0.0%) |
| 30 to 34 Years | 436 (87.2%) | 13 (3.0%) |
| 35 to 44 Years | 1,151 (90.8%) | 0 (0.0%) |
| 45 to 54 Years | 1,617 (90.2%) | 0 (0.0%) |
| 55 to 59 Years | 729 (65.4%) | 0 (0.0%) |
| 60 to 64 Years | 765 (67.4%) | 125 (16.3%) |
| 65 to 74 Years | 276 (25.3%) | 25 (9.1%) |
| 75 Years and over | 26 (2.7%) | 0 (0.0%) |
| Total | 6,755 (68.5%) | 243 (3.6%) |
Employment Status by Educational Attainment in South Lyon
According to labor force statistics for South Lyon, 82.1% of individuals (5,209) out of the total population between 25 and 64 years of age (6,345) are in the labor force, with 2.6% or 135 of them being unemployed. The group with the highest labor force participation rate are those with the educational attainment of college / associate degree, with 84.4% or 1,794 individuals in the labor force. Within the labor force, individuals with high school diploma education have the highest percentage of unemployment, with 15.6% or 110 of them being unemployed.
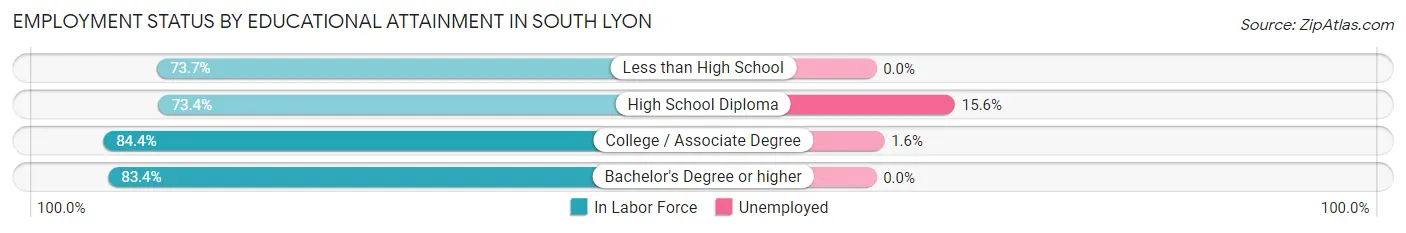
| Educational Attainment | In Labor Force | Unemployed |
| Less than High School | 73 (73.7%) | 0 (0.0%) |
| High School Diploma | 704 (73.4%) | 150 (15.6%) |
| College / Associate Degree | 1,794 (84.4%) | 34 (1.6%) |
| Bachelor's Degree or higher | 2,637 (83.4%) | 0 (0.0%) |
| Total | 5,209 (82.1%) | 165 (2.6%) |
Employment Occupations by Sex in South Lyon
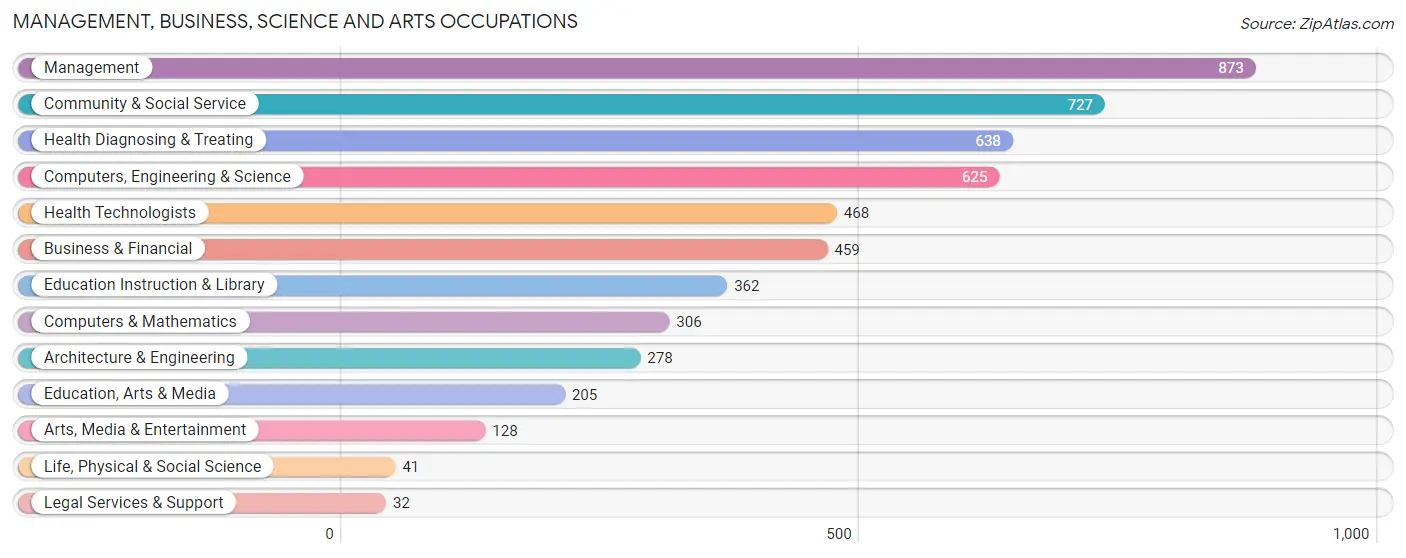
Management, Business, Science and Arts Occupations
The most common Management, Business, Science and Arts occupations in South Lyon are Management (873 | 13.4%), Community & Social Service (727 | 11.2%), Health Diagnosing & Treating (638 | 9.8%), Computers, Engineering & Science (625 | 9.6%), and Health Technologists (468 | 7.2%).
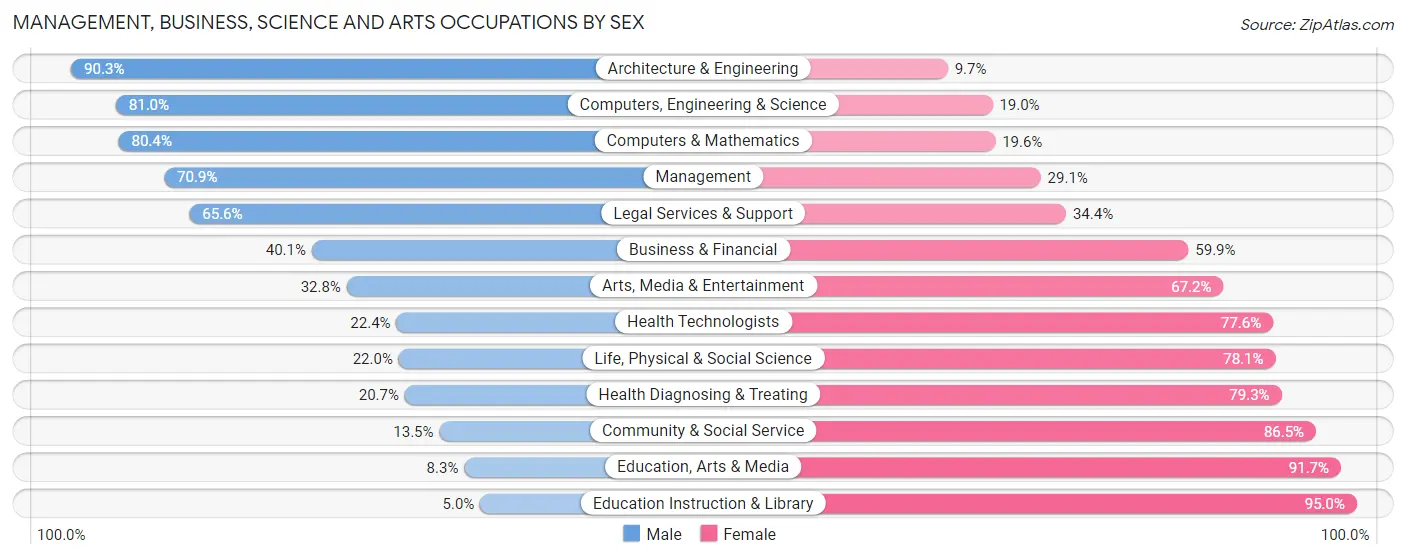
Management, Business, Science and Arts Occupations by Sex
Within the Management, Business, Science and Arts occupations in South Lyon, the most male-oriented occupations are Architecture & Engineering (90.3%), Computers, Engineering & Science (81.0%), and Computers & Mathematics (80.4%), while the most female-oriented occupations are Education Instruction & Library (95.0%), Education, Arts & Media (91.7%), and Community & Social Service (86.5%).
| Occupation | Male | Female |
| Management | 619 (70.9%) | 254 (29.1%) |
| Business & Financial | 184 (40.1%) | 275 (59.9%) |
| Computers, Engineering & Science | 506 (81.0%) | 119 (19.0%) |
| Computers & Mathematics | 246 (80.4%) | 60 (19.6%) |
| Architecture & Engineering | 251 (90.3%) | 27 (9.7%) |
| Life, Physical & Social Science | 9 (22.0%) | 32 (78.0%) |
| Community & Social Service | 98 (13.5%) | 629 (86.5%) |
| Education, Arts & Media | 17 (8.3%) | 188 (91.7%) |
| Legal Services & Support | 21 (65.6%) | 11 (34.4%) |
| Education Instruction & Library | 18 (5.0%) | 344 (95.0%) |
| Arts, Media & Entertainment | 42 (32.8%) | 86 (67.2%) |
| Health Diagnosing & Treating | 132 (20.7%) | 506 (79.3%) |
| Health Technologists | 105 (22.4%) | 363 (77.6%) |
| Total (Category) | 1,539 (46.3%) | 1,783 (53.7%) |
| Total (Overall) | 3,419 (52.5%) | 3,090 (47.5%) |
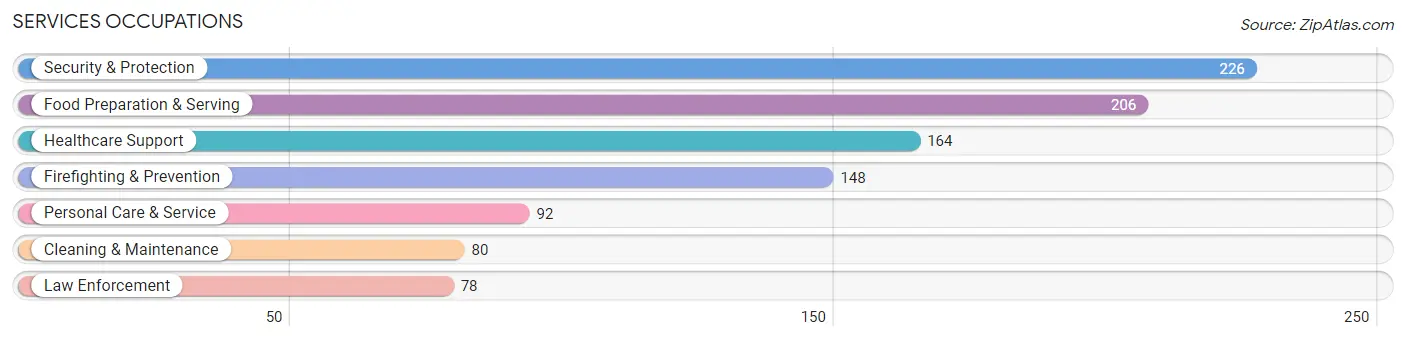
Services Occupations
The most common Services occupations in South Lyon are Security & Protection (226 | 3.5%), Food Preparation & Serving (206 | 3.2%), Healthcare Support (164 | 2.5%), Firefighting & Prevention (148 | 2.3%), and Personal Care & Service (92 | 1.4%).
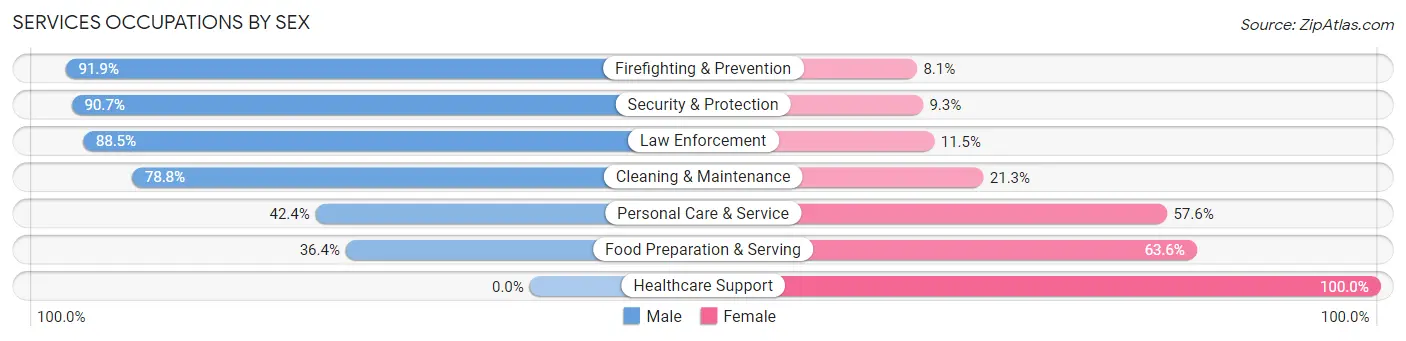
Services Occupations by Sex
Within the Services occupations in South Lyon, the most male-oriented occupations are Firefighting & Prevention (91.9%), Security & Protection (90.7%), and Law Enforcement (88.5%), while the most female-oriented occupations are Healthcare Support (100.0%), Food Preparation & Serving (63.6%), and Personal Care & Service (57.6%).
| Occupation | Male | Female |
| Healthcare Support | 0 (0.0%) | 164 (100.0%) |
| Security & Protection | 205 (90.7%) | 21 (9.3%) |
| Firefighting & Prevention | 136 (91.9%) | 12 (8.1%) |
| Law Enforcement | 69 (88.5%) | 9 (11.5%) |
| Food Preparation & Serving | 75 (36.4%) | 131 (63.6%) |
| Cleaning & Maintenance | 63 (78.7%) | 17 (21.2%) |
| Personal Care & Service | 39 (42.4%) | 53 (57.6%) |
| Total (Category) | 382 (49.7%) | 386 (50.3%) |
| Total (Overall) | 3,419 (52.5%) | 3,090 (47.5%) |
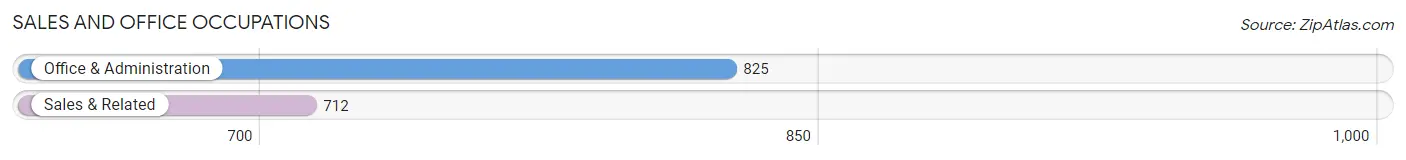
Sales and Office Occupations
The most common Sales and Office occupations in South Lyon are Office & Administration (825 | 12.7%), and Sales & Related (712 | 10.9%).
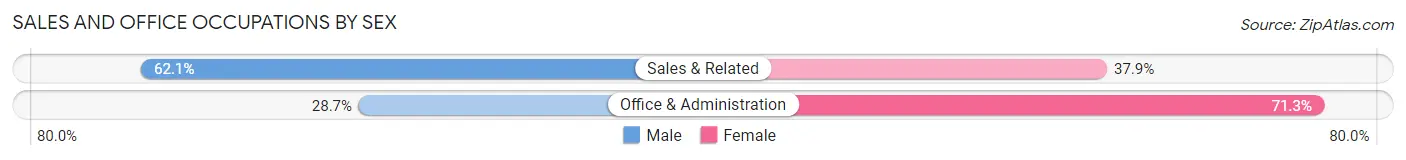
Sales and Office Occupations by Sex
| Occupation | Male | Female |
| Sales & Related | 442 (62.1%) | 270 (37.9%) |
| Office & Administration | 237 (28.7%) | 588 (71.3%) |
| Total (Category) | 679 (44.2%) | 858 (55.8%) |
| Total (Overall) | 3,419 (52.5%) | 3,090 (47.5%) |
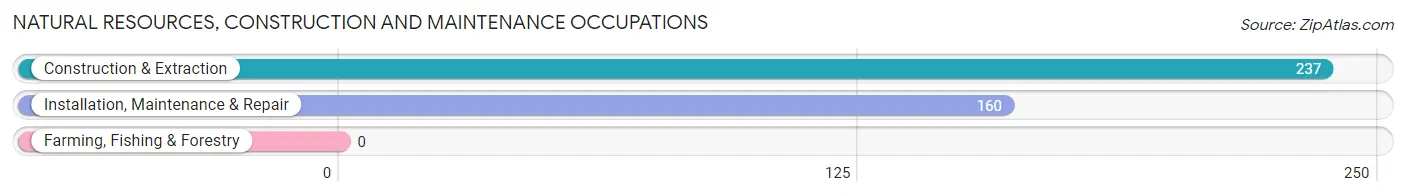
Natural Resources, Construction and Maintenance Occupations
The most common Natural Resources, Construction and Maintenance occupations in South Lyon are Construction & Extraction (237 | 3.6%), and Installation, Maintenance & Repair (160 | 2.5%).
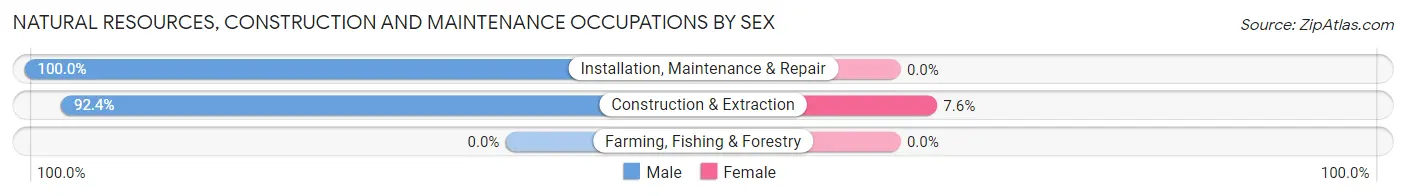
Natural Resources, Construction and Maintenance Occupations by Sex
| Occupation | Male | Female |
| Farming, Fishing & Forestry | 0 (0.0%) | 0 (0.0%) |
| Construction & Extraction | 219 (92.4%) | 18 (7.6%) |
| Installation, Maintenance & Repair | 160 (100.0%) | 0 (0.0%) |
| Total (Category) | 379 (95.5%) | 18 (4.5%) |
| Total (Overall) | 3,419 (52.5%) | 3,090 (47.5%) |
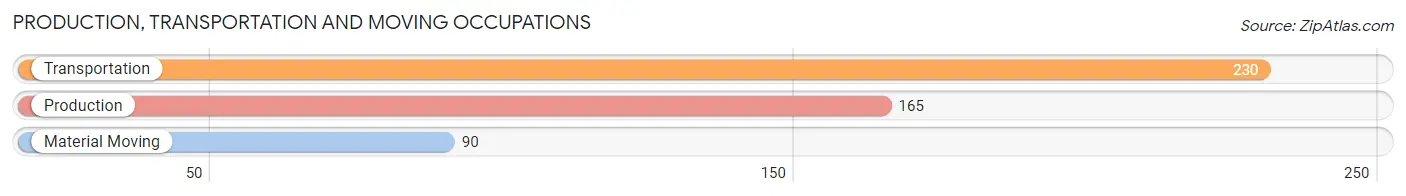
Production, Transportation and Moving Occupations
The most common Production, Transportation and Moving occupations in South Lyon are Transportation (230 | 3.5%), Production (165 | 2.5%), and Material Moving (90 | 1.4%).
Production, Transportation and Moving Occupations by Sex
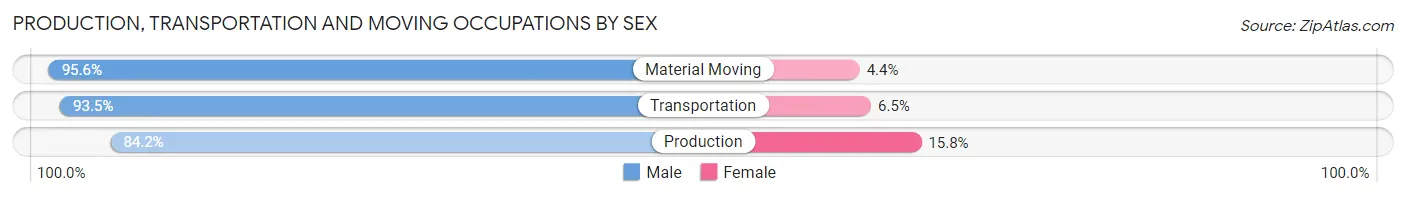
| Occupation | Male | Female |
| Production | 139 (84.2%) | 26 (15.8%) |
| Transportation | 215 (93.5%) | 15 (6.5%) |
| Material Moving | 86 (95.6%) | 4 (4.4%) |
| Total (Category) | 440 (90.7%) | 45 (9.3%) |
| Total (Overall) | 3,419 (52.5%) | 3,090 (47.5%) |
Employment Industries by Sex in South Lyon
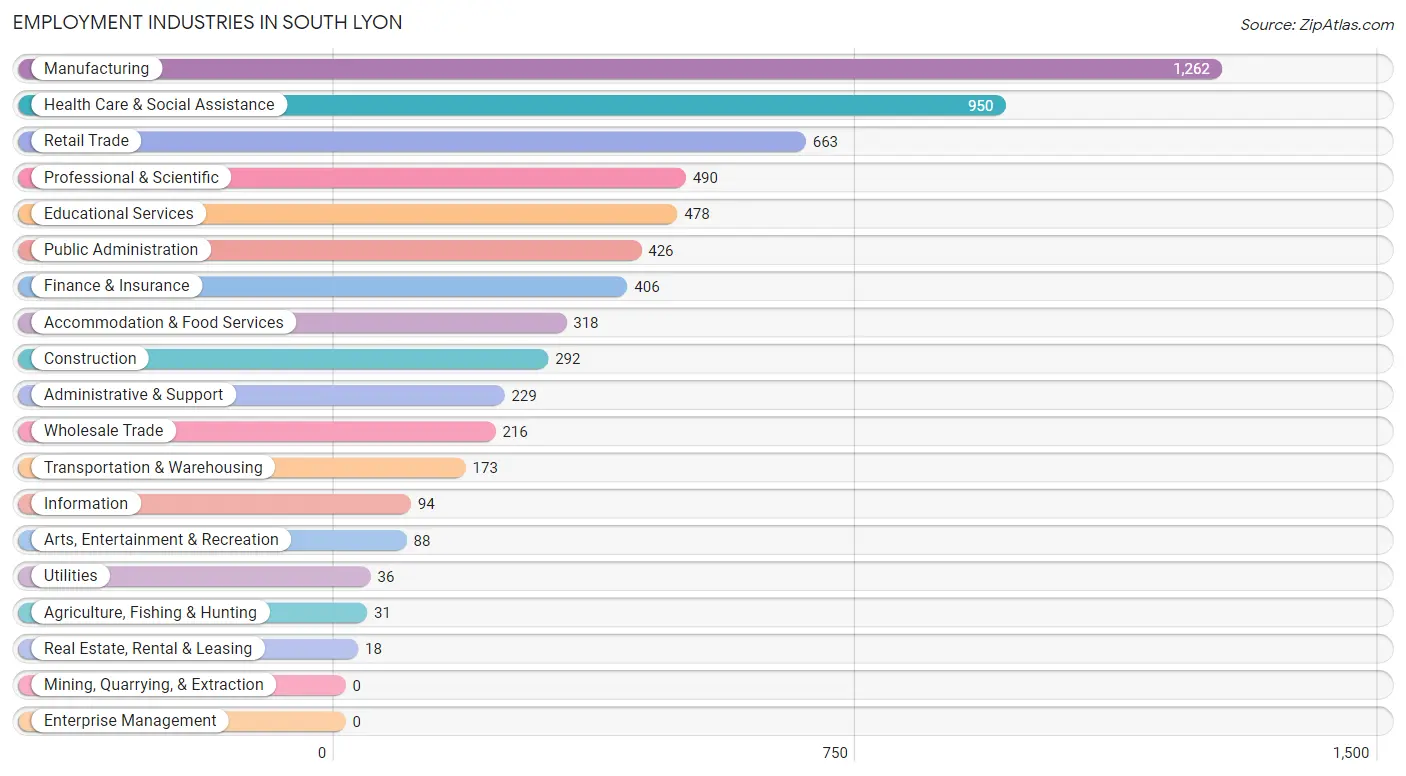
Employment Industries in South Lyon
The major employment industries in South Lyon include Manufacturing (1,262 | 19.4%), Health Care & Social Assistance (950 | 14.6%), Retail Trade (663 | 10.2%), Professional & Scientific (490 | 7.5%), and Educational Services (478 | 7.3%).
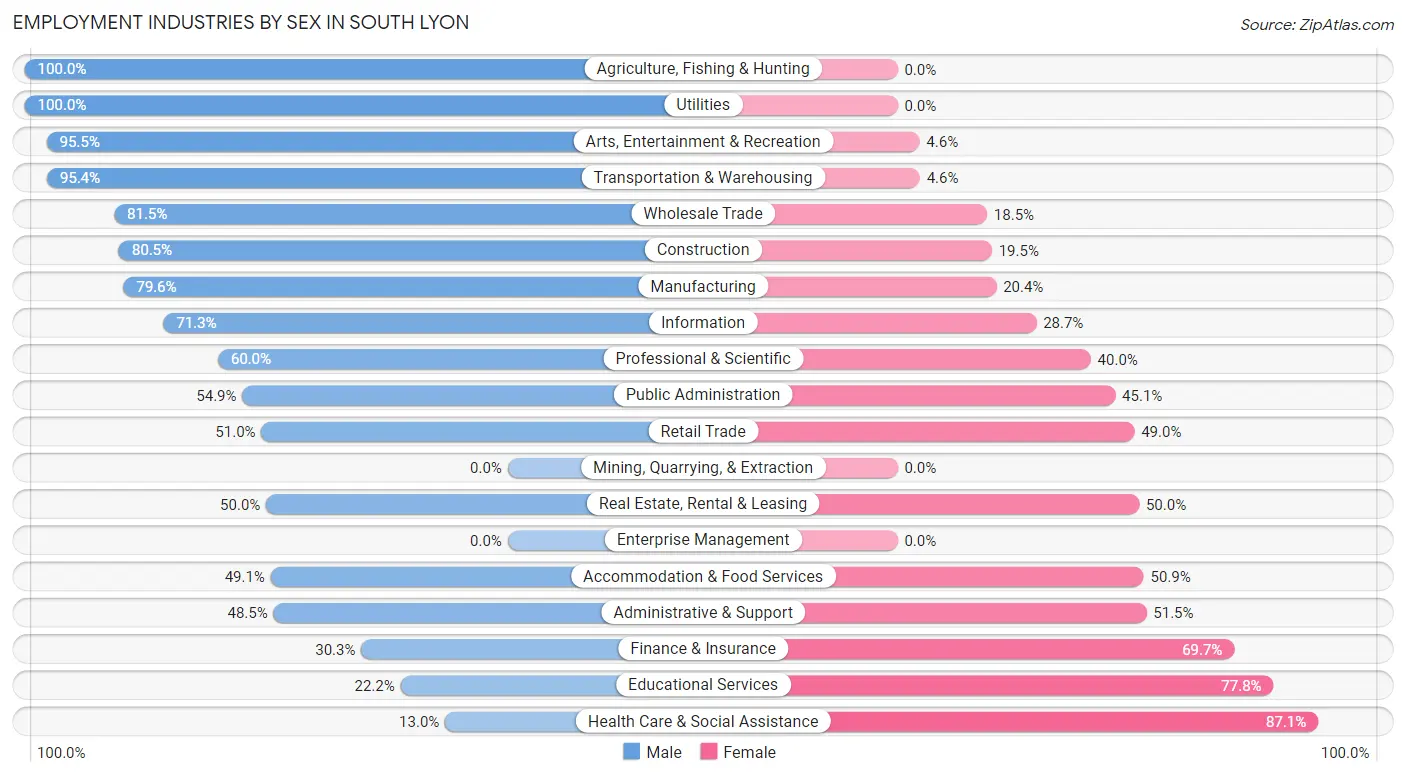
Employment Industries by Sex in South Lyon
The South Lyon industries that see more men than women are Agriculture, Fishing & Hunting (100.0%), Utilities (100.0%), and Arts, Entertainment & Recreation (95.5%), whereas the industries that tend to have a higher number of women are Health Care & Social Assistance (87.1%), Educational Services (77.8%), and Finance & Insurance (69.7%).
| Industry | Male | Female |
| Agriculture, Fishing & Hunting | 31 (100.0%) | 0 (0.0%) |
| Mining, Quarrying, & Extraction | 0 (0.0%) | 0 (0.0%) |
| Construction | 235 (80.5%) | 57 (19.5%) |
| Manufacturing | 1,004 (79.6%) | 258 (20.4%) |
| Wholesale Trade | 176 (81.5%) | 40 (18.5%) |
| Retail Trade | 338 (51.0%) | 325 (49.0%) |
| Transportation & Warehousing | 165 (95.4%) | 8 (4.6%) |
| Utilities | 36 (100.0%) | 0 (0.0%) |
| Information | 67 (71.3%) | 27 (28.7%) |
| Finance & Insurance | 123 (30.3%) | 283 (69.7%) |
| Real Estate, Rental & Leasing | 9 (50.0%) | 9 (50.0%) |
| Professional & Scientific | 294 (60.0%) | 196 (40.0%) |
| Enterprise Management | 0 (0.0%) | 0 (0.0%) |
| Administrative & Support | 111 (48.5%) | 118 (51.5%) |
| Educational Services | 106 (22.2%) | 372 (77.8%) |
| Health Care & Social Assistance | 123 (13.0%) | 827 (87.1%) |
| Arts, Entertainment & Recreation | 84 (95.5%) | 4 (4.5%) |
| Accommodation & Food Services | 156 (49.1%) | 162 (50.9%) |
| Public Administration | 234 (54.9%) | 192 (45.1%) |
| Total | 3,419 (52.5%) | 3,090 (47.5%) |
Education in South Lyon
School Enrollment in South Lyon
The most common levels of schooling among the 2,605 students in South Lyon are high school (580 | 22.3%), college / undergraduate (524 | 20.1%), and middle school (507 | 19.5%).
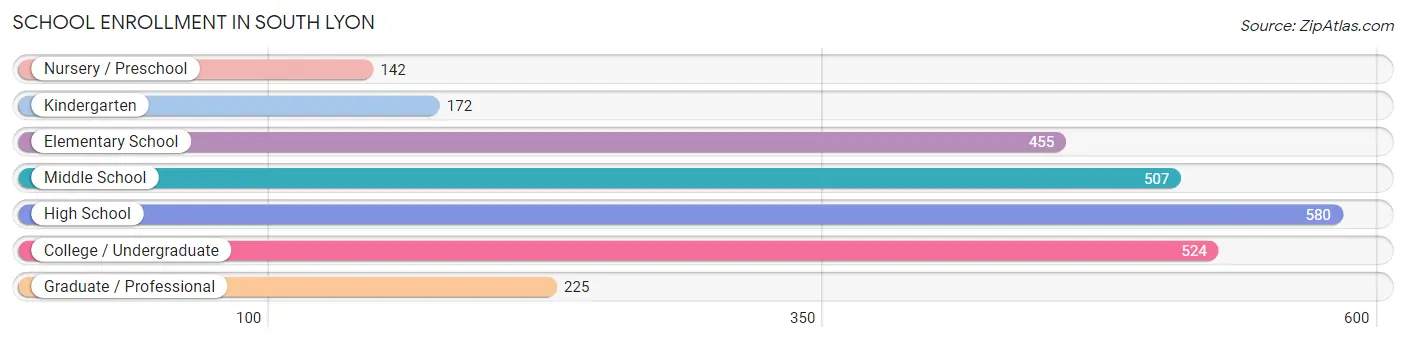
| School Level | # Students | % Students |
| Nursery / Preschool | 142 | 5.4% |
| Kindergarten | 172 | 6.6% |
| Elementary School | 455 | 17.5% |
| Middle School | 507 | 19.5% |
| High School | 580 | 22.3% |
| College / Undergraduate | 524 | 20.1% |
| Graduate / Professional | 225 | 8.6% |
| Total | 2,605 | 100.0% |
School Enrollment by Age by Funding Source in South Lyon
Out of a total of 2,605 students who are enrolled in schools in South Lyon, 302 (11.6%) attend a private institution, while the remaining 2,303 (88.4%) are enrolled in public schools. The age group of 3 to 4 year olds has the highest likelihood of being enrolled in private schools, with 32 (31.4% in the age bracket) enrolled. Conversely, the age group of 5 to 9 year old has the lowest likelihood of being enrolled in a private school, with 550 (95.0% in the age bracket) attending a public institution.
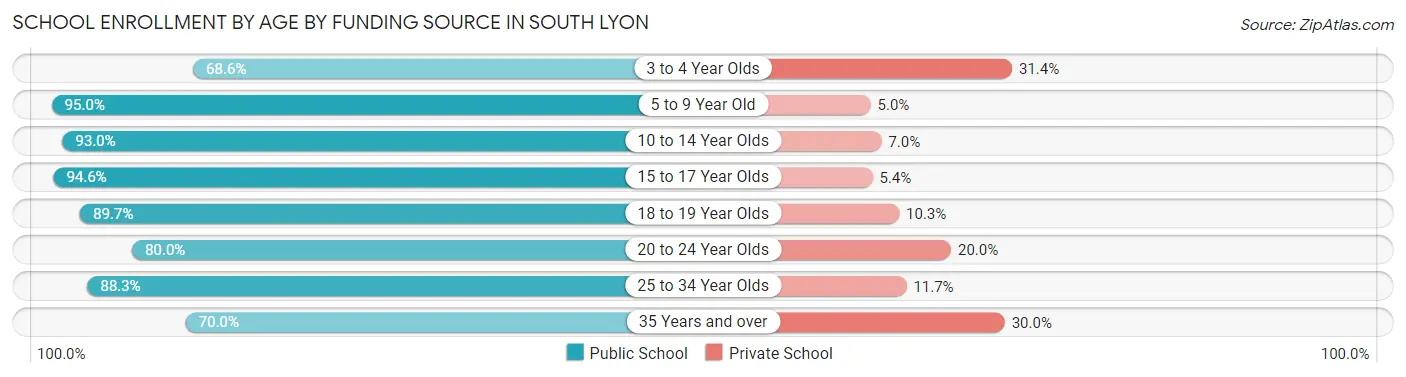
| Age Bracket | Public School | Private School |
| 3 to 4 Year Olds | 70 (68.6%) | 32 (31.4%) |
| 5 to 9 Year Old | 550 (95.0%) | 29 (5.0%) |
| 10 to 14 Year Olds | 621 (93.0%) | 47 (7.0%) |
| 15 to 17 Year Olds | 352 (94.6%) | 20 (5.4%) |
| 18 to 19 Year Olds | 217 (89.7%) | 25 (10.3%) |
| 20 to 24 Year Olds | 236 (80.0%) | 59 (20.0%) |
| 25 to 34 Year Olds | 68 (88.3%) | 9 (11.7%) |
| 35 Years and over | 189 (70.0%) | 81 (30.0%) |
| Total | 2,303 (88.4%) | 302 (11.6%) |
Educational Attainment by Field of Study in South Lyon
Business (841 | 20.7%), engineering (650 | 16.0%), science & technology (404 | 9.9%), social sciences (383 | 9.4%), and arts & humanities (271 | 6.7%) are the most common fields of study among 4,065 individuals in South Lyon who have obtained a bachelor's degree or higher.
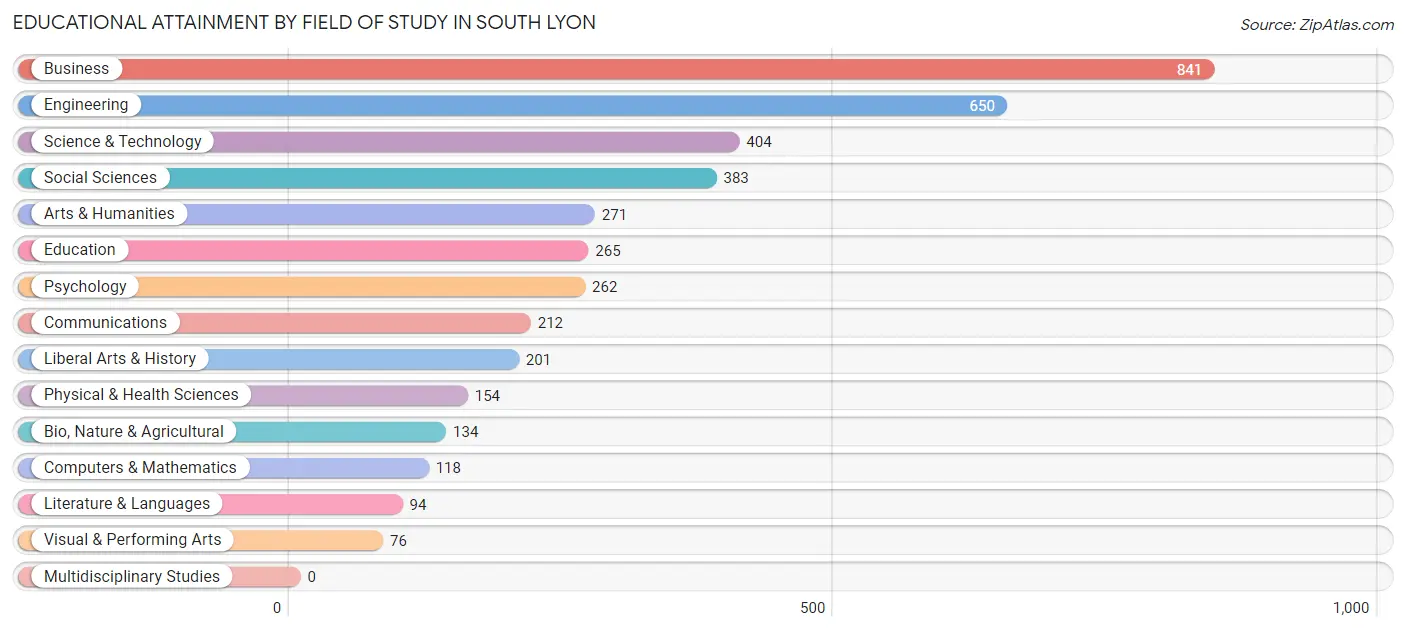
| Field of Study | # Graduates | % Graduates |
| Computers & Mathematics | 118 | 2.9% |
| Bio, Nature & Agricultural | 134 | 3.3% |
| Physical & Health Sciences | 154 | 3.8% |
| Psychology | 262 | 6.5% |
| Social Sciences | 383 | 9.4% |
| Engineering | 650 | 16.0% |
| Multidisciplinary Studies | 0 | 0.0% |
| Science & Technology | 404 | 9.9% |
| Business | 841 | 20.7% |
| Education | 265 | 6.5% |
| Literature & Languages | 94 | 2.3% |
| Liberal Arts & History | 201 | 4.9% |
| Visual & Performing Arts | 76 | 1.9% |
| Communications | 212 | 5.2% |
| Arts & Humanities | 271 | 6.7% |
| Total | 4,065 | 100.0% |
Transportation & Commute in South Lyon
Vehicle Availability by Sex in South Lyon
The most prevalent vehicle ownership categories in South Lyon are males with 2 vehicles (1,393, accounting for 41.0%) and females with 2 vehicles (1,488, making up 45.7%).
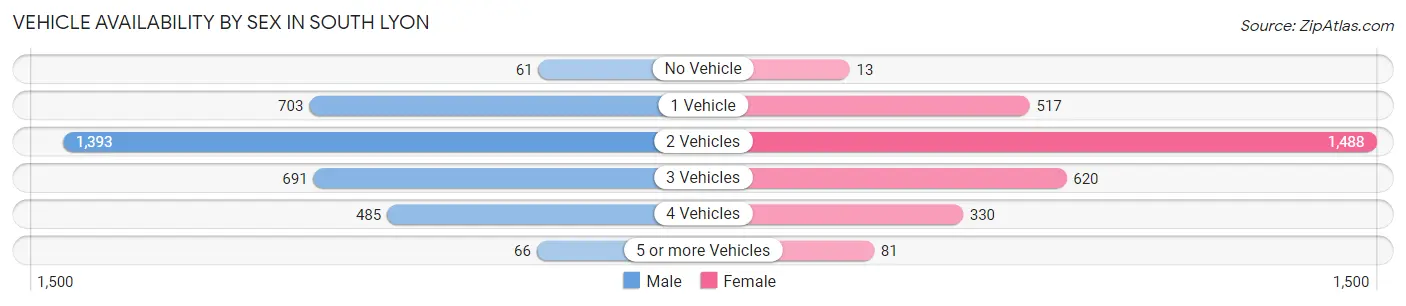
| Vehicles Available | Male | Female |
| No Vehicle | 61 (1.8%) | 13 (0.4%) |
| 1 Vehicle | 703 (20.7%) | 517 (17.0%) |
| 2 Vehicles | 1,393 (41.0%) | 1,488 (48.8%) |
| 3 Vehicles | 691 (20.3%) | 620 (20.3%) |
| 4 Vehicles | 485 (14.3%) | 330 (10.8%) |
| 5 or more Vehicles | 66 (1.9%) | 81 (2.7%) |
| Total | 3,399 (100.0%) | 3,049 (100.0%) |
Commute Time in South Lyon
The most frequently occuring commute durations in South Lyon are 30 to 34 minutes (1,150 commuters, 19.8%), 45 to 59 minutes (783 commuters, 13.5%), and 15 to 19 minutes (569 commuters, 9.8%).
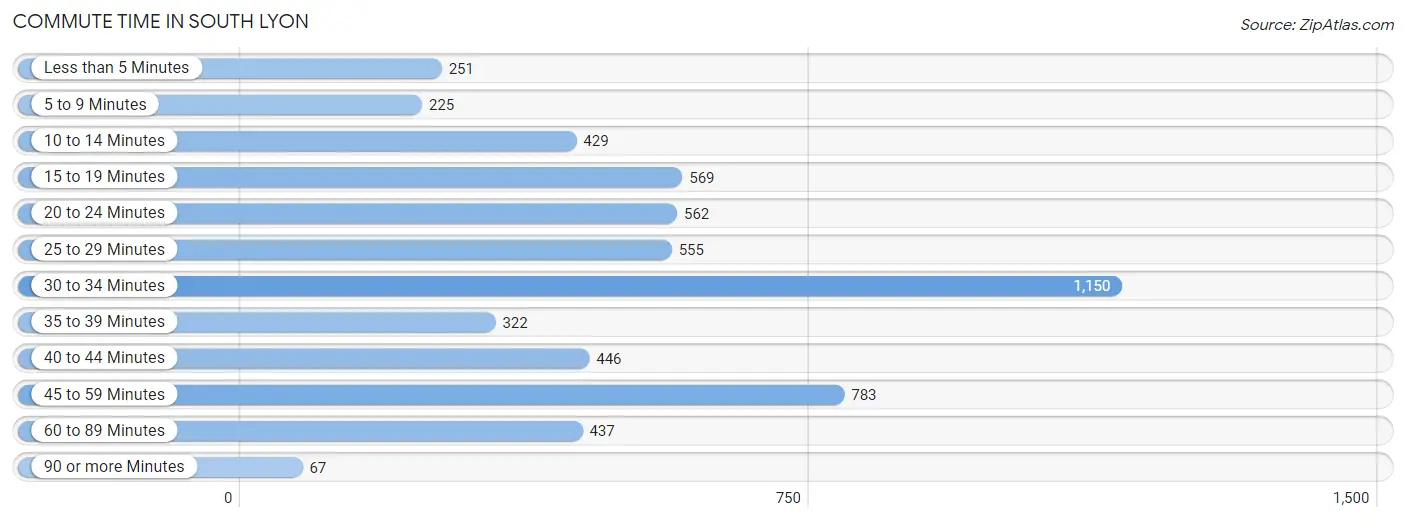
| Commute Time | # Commuters | % Commuters |
| Less than 5 Minutes | 251 | 4.3% |
| 5 to 9 Minutes | 225 | 3.9% |
| 10 to 14 Minutes | 429 | 7.4% |
| 15 to 19 Minutes | 569 | 9.8% |
| 20 to 24 Minutes | 562 | 9.7% |
| 25 to 29 Minutes | 555 | 9.6% |
| 30 to 34 Minutes | 1,150 | 19.8% |
| 35 to 39 Minutes | 322 | 5.6% |
| 40 to 44 Minutes | 446 | 7.7% |
| 45 to 59 Minutes | 783 | 13.5% |
| 60 to 89 Minutes | 437 | 7.5% |
| 90 or more Minutes | 67 | 1.2% |
Commute Time by Sex in South Lyon
The most common commute times in South Lyon are 45 to 59 minutes (624 commuters, 20.1%) for males and 30 to 34 minutes (624 commuters, 23.2%) for females.
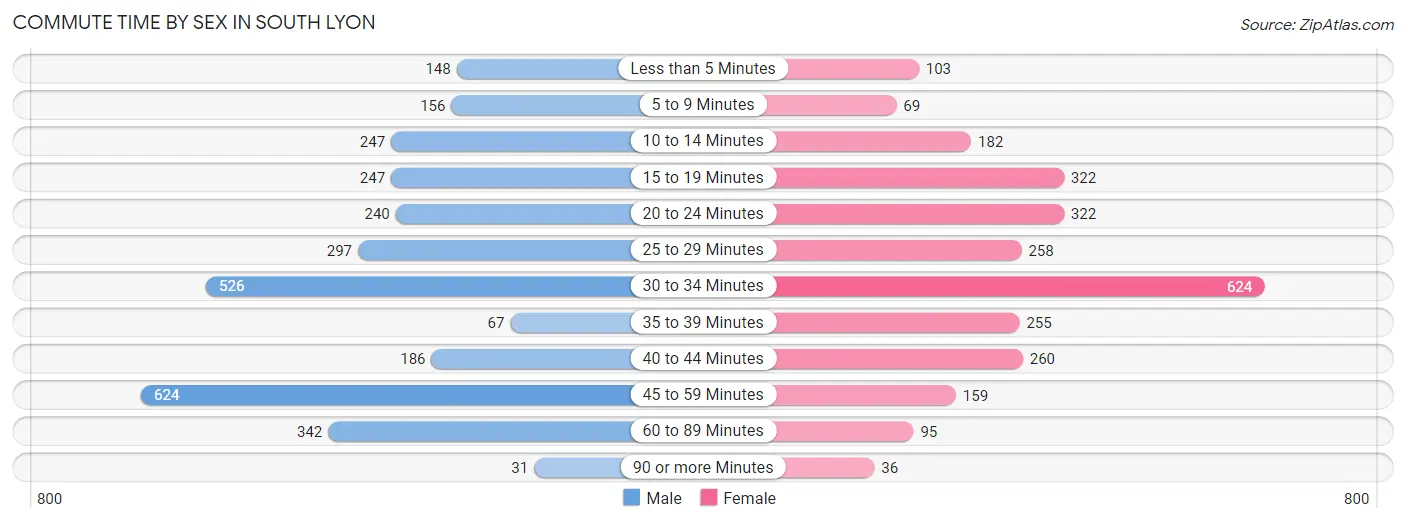
| Commute Time | Male | Female |
| Less than 5 Minutes | 148 (4.8%) | 103 (3.8%) |
| 5 to 9 Minutes | 156 (5.0%) | 69 (2.6%) |
| 10 to 14 Minutes | 247 (7.9%) | 182 (6.8%) |
| 15 to 19 Minutes | 247 (7.9%) | 322 (12.0%) |
| 20 to 24 Minutes | 240 (7.7%) | 322 (12.0%) |
| 25 to 29 Minutes | 297 (9.6%) | 258 (9.6%) |
| 30 to 34 Minutes | 526 (16.9%) | 624 (23.2%) |
| 35 to 39 Minutes | 67 (2.1%) | 255 (9.5%) |
| 40 to 44 Minutes | 186 (6.0%) | 260 (9.7%) |
| 45 to 59 Minutes | 624 (20.1%) | 159 (5.9%) |
| 60 to 89 Minutes | 342 (11.0%) | 95 (3.5%) |
| 90 or more Minutes | 31 (1.0%) | 36 (1.3%) |
Time of Departure to Work by Sex in South Lyon
The most frequent times of departure to work in South Lyon are 6:00 AM to 6:29 AM (667, 21.4%) for males and 7:00 AM to 7:29 AM (496, 18.5%) for females.
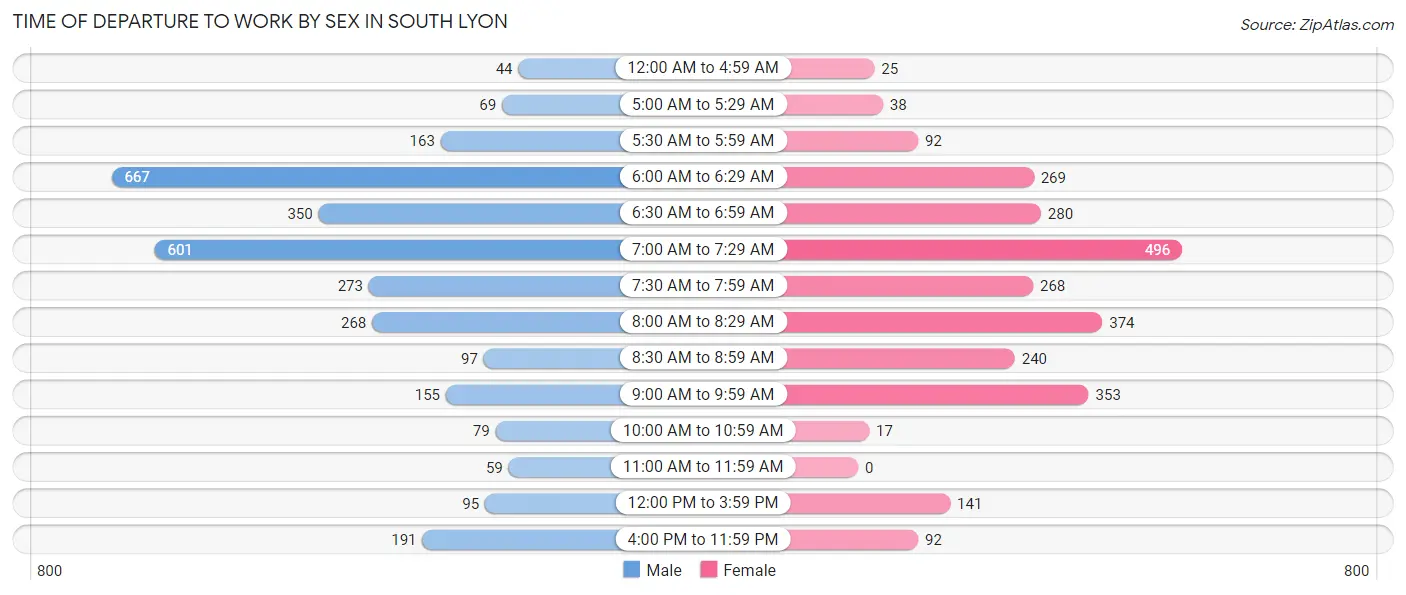
| Time of Departure | Male | Female |
| 12:00 AM to 4:59 AM | 44 (1.4%) | 25 (0.9%) |
| 5:00 AM to 5:29 AM | 69 (2.2%) | 38 (1.4%) |
| 5:30 AM to 5:59 AM | 163 (5.2%) | 92 (3.4%) |
| 6:00 AM to 6:29 AM | 667 (21.4%) | 269 (10.0%) |
| 6:30 AM to 6:59 AM | 350 (11.3%) | 280 (10.4%) |
| 7:00 AM to 7:29 AM | 601 (19.3%) | 496 (18.5%) |
| 7:30 AM to 7:59 AM | 273 (8.8%) | 268 (10.0%) |
| 8:00 AM to 8:29 AM | 268 (8.6%) | 374 (13.9%) |
| 8:30 AM to 8:59 AM | 97 (3.1%) | 240 (8.9%) |
| 9:00 AM to 9:59 AM | 155 (5.0%) | 353 (13.2%) |
| 10:00 AM to 10:59 AM | 79 (2.5%) | 17 (0.6%) |
| 11:00 AM to 11:59 AM | 59 (1.9%) | 0 (0.0%) |
| 12:00 PM to 3:59 PM | 95 (3.0%) | 141 (5.2%) |
| 4:00 PM to 11:59 PM | 191 (6.1%) | 92 (3.4%) |
| Total | 3,111 (100.0%) | 2,685 (100.0%) |
Housing Occupancy in South Lyon
Occupancy by Ownership in South Lyon
Of the total 5,121 dwellings in South Lyon, owner-occupied units account for 4,246 (82.9%), while renter-occupied units make up 875 (17.1%).
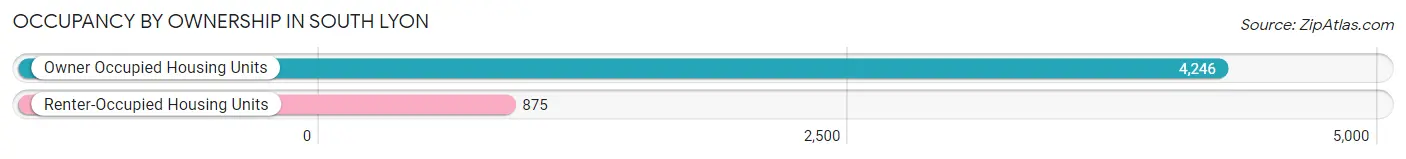
| Occupancy | # Housing Units | % Housing Units |
| Owner Occupied Housing Units | 4,246 | 82.9% |
| Renter-Occupied Housing Units | 875 | 17.1% |
| Total Occupied Housing Units | 5,121 | 100.0% |
Occupancy by Household Size in South Lyon
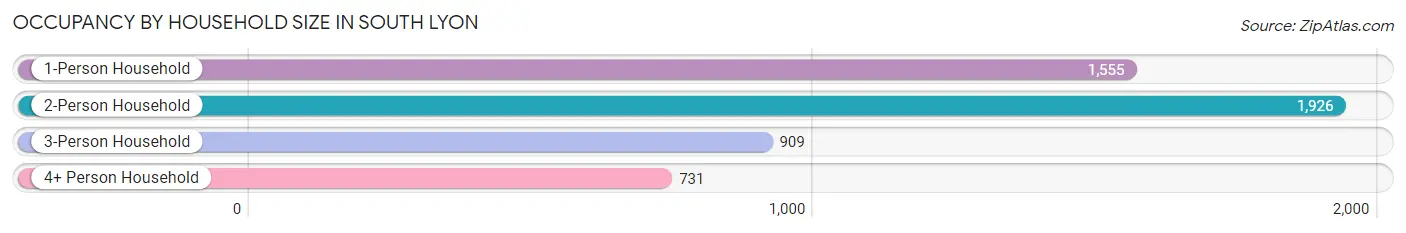
| Household Size | # Housing Units | % Housing Units |
| 1-Person Household | 1,555 | 30.4% |
| 2-Person Household | 1,926 | 37.6% |
| 3-Person Household | 909 | 17.7% |
| 4+ Person Household | 731 | 14.3% |
| Total Housing Units | 5,121 | 100.0% |
Occupancy by Ownership by Household Size in South Lyon
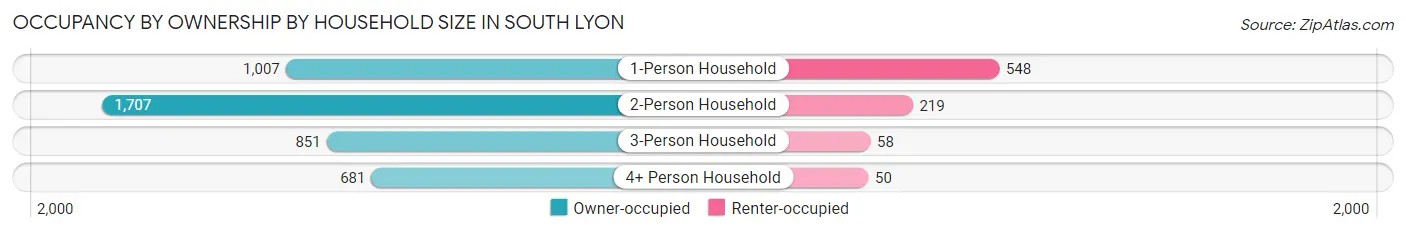
| Household Size | Owner-occupied | Renter-occupied |
| 1-Person Household | 1,007 (64.8%) | 548 (35.2%) |
| 2-Person Household | 1,707 (88.6%) | 219 (11.4%) |
| 3-Person Household | 851 (93.6%) | 58 (6.4%) |
| 4+ Person Household | 681 (93.2%) | 50 (6.8%) |
| Total Housing Units | 4,246 (82.9%) | 875 (17.1%) |
Occupancy by Educational Attainment in South Lyon
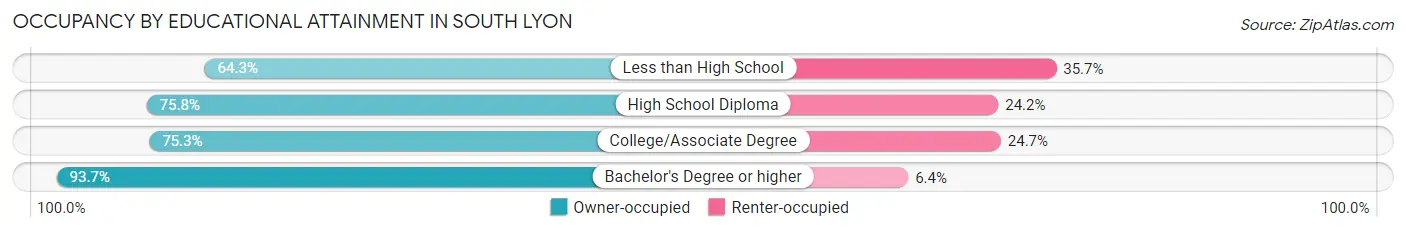
| Household Size | Owner-occupied | Renter-occupied |
| Less than High School | 63 (64.3%) | 35 (35.7%) |
| High School Diploma | 764 (75.8%) | 244 (24.2%) |
| College/Associate Degree | 1,398 (75.3%) | 459 (24.7%) |
| Bachelor's Degree or higher | 2,021 (93.6%) | 137 (6.4%) |
Occupancy by Age of Householder in South Lyon
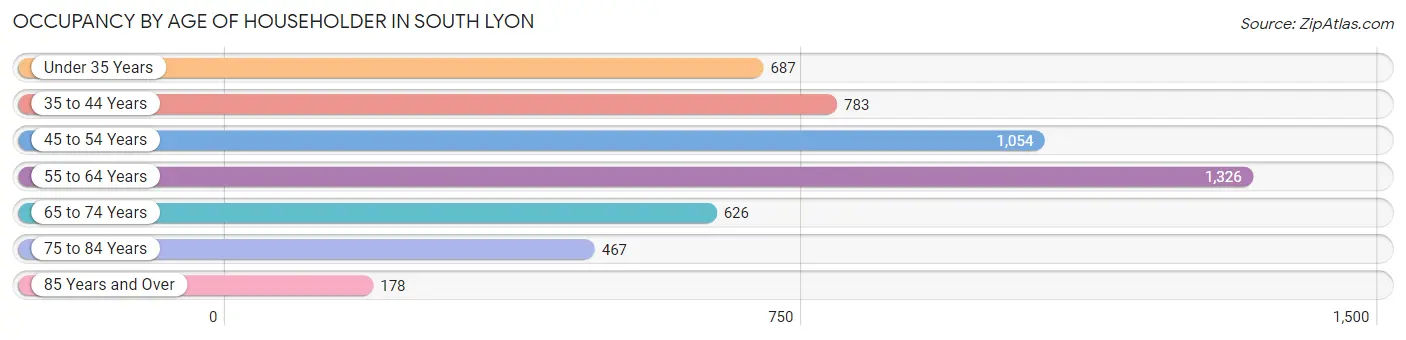
| Age Bracket | # Households | % Households |
| Under 35 Years | 687 | 13.4% |
| 35 to 44 Years | 783 | 15.3% |
| 45 to 54 Years | 1,054 | 20.6% |
| 55 to 64 Years | 1,326 | 25.9% |
| 65 to 74 Years | 626 | 12.2% |
| 75 to 84 Years | 467 | 9.1% |
| 85 Years and Over | 178 | 3.5% |
| Total | 5,121 | 100.0% |
Housing Finances in South Lyon
Median Income by Occupancy in South Lyon
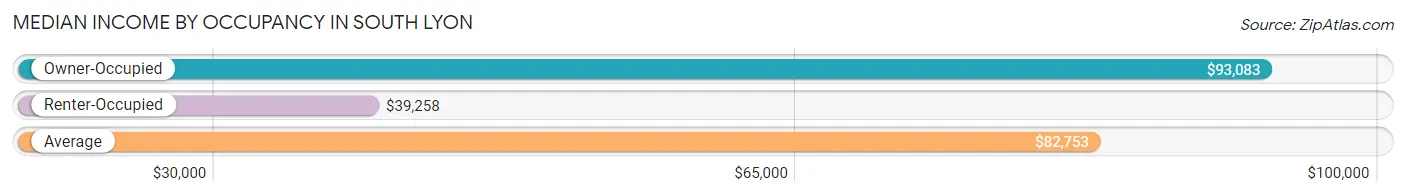
| Occupancy Type | # Households | Median Income |
| Owner-Occupied | 4,246 (82.9%) | $93,083 |
| Renter-Occupied | 875 (17.1%) | $39,258 |
| Average | 5,121 (100.0%) | $82,753 |
Occupancy by Householder Income Bracket in South Lyon
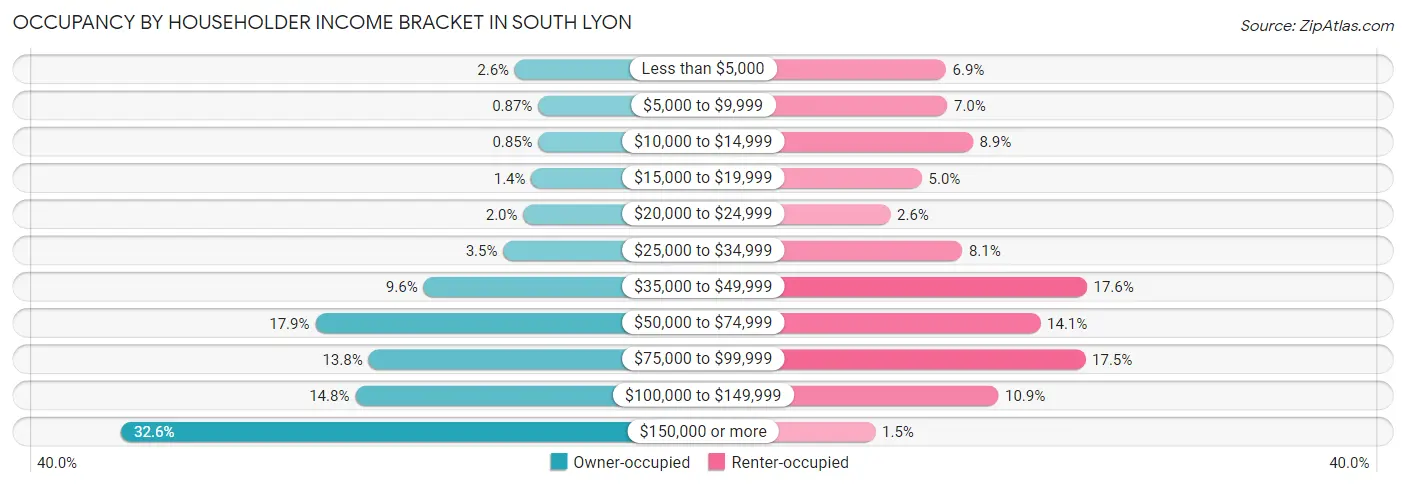
| Income Bracket | Owner-occupied | Renter-occupied |
| Less than $5,000 | 112 (2.6%) | 60 (6.9%) |
| $5,000 to $9,999 | 37 (0.9%) | 61 (7.0%) |
| $10,000 to $14,999 | 36 (0.9%) | 78 (8.9%) |
| $15,000 to $19,999 | 59 (1.4%) | 44 (5.0%) |
| $20,000 to $24,999 | 85 (2.0%) | 23 (2.6%) |
| $25,000 to $34,999 | 150 (3.5%) | 71 (8.1%) |
| $35,000 to $49,999 | 408 (9.6%) | 154 (17.6%) |
| $50,000 to $74,999 | 758 (17.8%) | 123 (14.1%) |
| $75,000 to $99,999 | 586 (13.8%) | 153 (17.5%) |
| $100,000 to $149,999 | 629 (14.8%) | 95 (10.9%) |
| $150,000 or more | 1,386 (32.6%) | 13 (1.5%) |
| Total | 4,246 (100.0%) | 875 (100.0%) |
Monthly Housing Cost Tiers in South Lyon
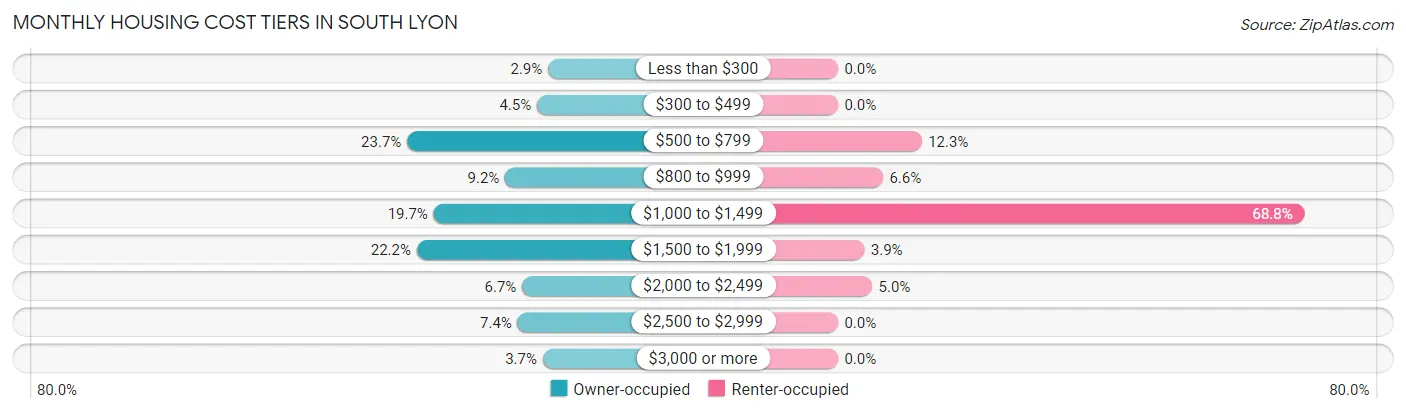
| Monthly Cost | Owner-occupied | Renter-occupied |
| Less than $300 | 123 (2.9%) | 0 (0.0%) |
| $300 to $499 | 192 (4.5%) | 0 (0.0%) |
| $500 to $799 | 1,004 (23.6%) | 108 (12.3%) |
| $800 to $999 | 391 (9.2%) | 58 (6.6%) |
| $1,000 to $1,499 | 838 (19.7%) | 602 (68.8%) |
| $1,500 to $1,999 | 944 (22.2%) | 34 (3.9%) |
| $2,000 to $2,499 | 285 (6.7%) | 44 (5.0%) |
| $2,500 to $2,999 | 313 (7.4%) | 0 (0.0%) |
| $3,000 or more | 156 (3.7%) | 0 (0.0%) |
| Total | 4,246 (100.0%) | 875 (100.0%) |
Physical Housing Characteristics in South Lyon
Housing Structures in South Lyon
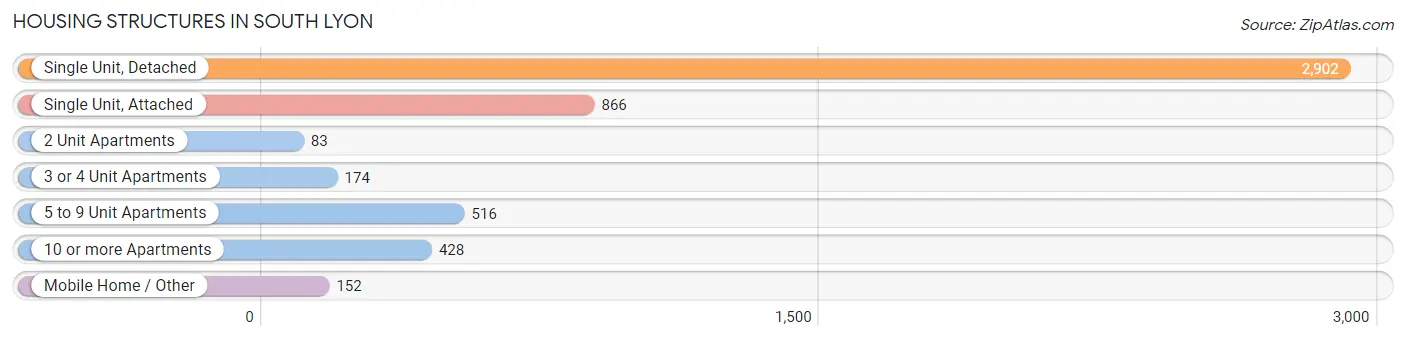
| Structure Type | # Housing Units | % Housing Units |
| Single Unit, Detached | 2,902 | 56.7% |
| Single Unit, Attached | 866 | 16.9% |
| 2 Unit Apartments | 83 | 1.6% |
| 3 or 4 Unit Apartments | 174 | 3.4% |
| 5 to 9 Unit Apartments | 516 | 10.1% |
| 10 or more Apartments | 428 | 8.4% |
| Mobile Home / Other | 152 | 3.0% |
| Total | 5,121 | 100.0% |
Housing Structures by Occupancy in South Lyon
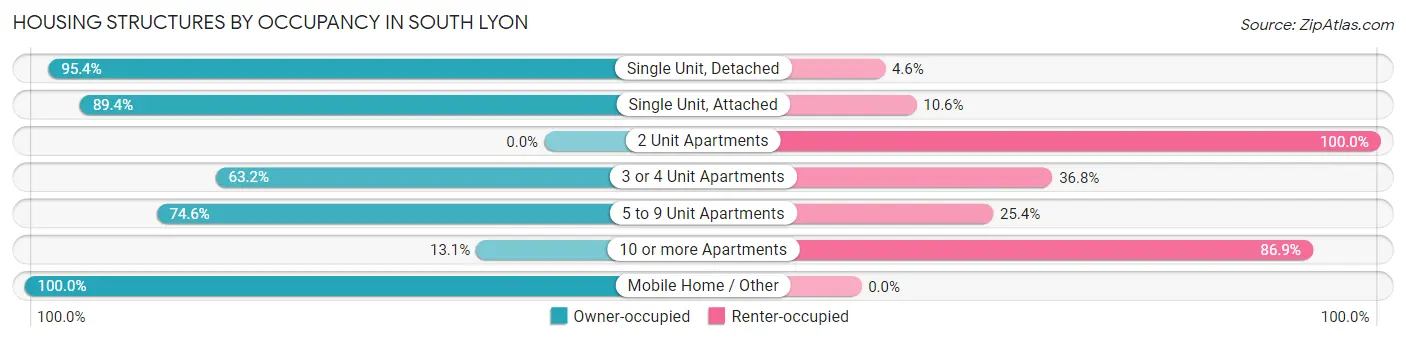
| Structure Type | Owner-occupied | Renter-occupied |
| Single Unit, Detached | 2,769 (95.4%) | 133 (4.6%) |
| Single Unit, Attached | 774 (89.4%) | 92 (10.6%) |
| 2 Unit Apartments | 0 (0.0%) | 83 (100.0%) |
| 3 or 4 Unit Apartments | 110 (63.2%) | 64 (36.8%) |
| 5 to 9 Unit Apartments | 385 (74.6%) | 131 (25.4%) |
| 10 or more Apartments | 56 (13.1%) | 372 (86.9%) |
| Mobile Home / Other | 152 (100.0%) | 0 (0.0%) |
| Total | 4,246 (82.9%) | 875 (17.1%) |
Housing Structures by Number of Rooms in South Lyon
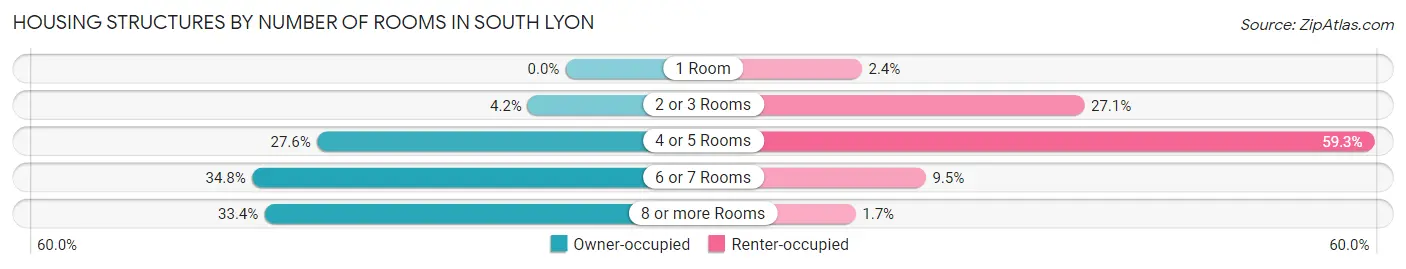
| Number of Rooms | Owner-occupied | Renter-occupied |
| 1 Room | 0 (0.0%) | 21 (2.4%) |
| 2 or 3 Rooms | 177 (4.2%) | 237 (27.1%) |
| 4 or 5 Rooms | 1,172 (27.6%) | 519 (59.3%) |
| 6 or 7 Rooms | 1,478 (34.8%) | 83 (9.5%) |
| 8 or more Rooms | 1,419 (33.4%) | 15 (1.7%) |
| Total | 4,246 (100.0%) | 875 (100.0%) |
Housing Structure by Heating Type in South Lyon
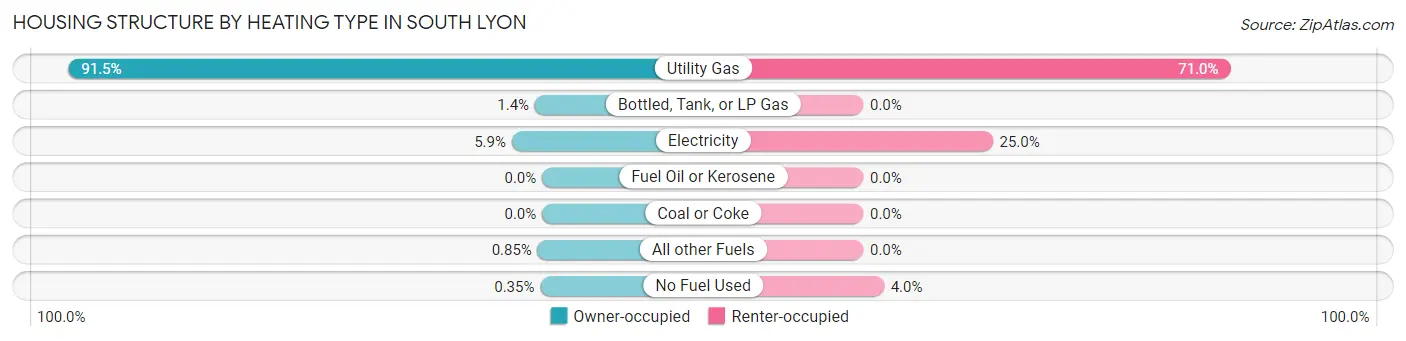
| Heating Type | Owner-occupied | Renter-occupied |
| Utility Gas | 3,887 (91.5%) | 621 (71.0%) |
| Bottled, Tank, or LP Gas | 59 (1.4%) | 0 (0.0%) |
| Electricity | 249 (5.9%) | 219 (25.0%) |
| Fuel Oil or Kerosene | 0 (0.0%) | 0 (0.0%) |
| Coal or Coke | 0 (0.0%) | 0 (0.0%) |
| All other Fuels | 36 (0.9%) | 0 (0.0%) |
| No Fuel Used | 15 (0.4%) | 35 (4.0%) |
| Total | 4,246 (100.0%) | 875 (100.0%) |
Household Vehicle Usage in South Lyon
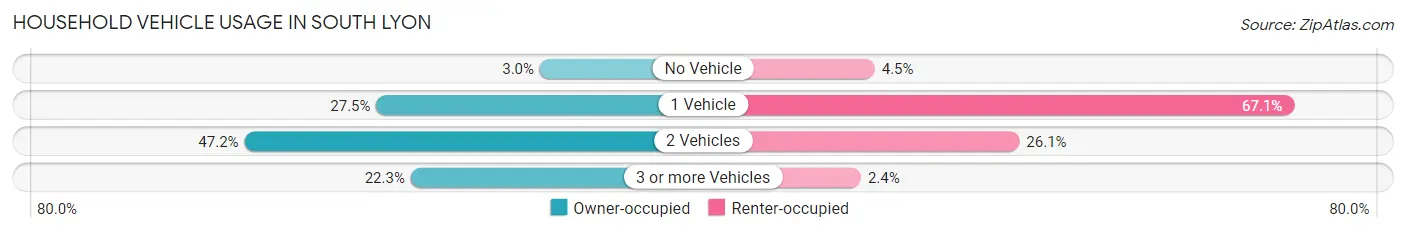
| Vehicles per Household | Owner-occupied | Renter-occupied |
| No Vehicle | 129 (3.0%) | 39 (4.5%) |
| 1 Vehicle | 1,166 (27.5%) | 587 (67.1%) |
| 2 Vehicles | 2,003 (47.2%) | 228 (26.1%) |
| 3 or more Vehicles | 948 (22.3%) | 21 (2.4%) |
| Total | 4,246 (100.0%) | 875 (100.0%) |
Real Estate & Mortgages in South Lyon
Real Estate and Mortgage Overview in South Lyon
| Characteristic | Without Mortgage | With Mortgage |
| Housing Units | 1,652 | 2,594 |
| Median Property Value | $198,700 | $278,800 |
| Median Household Income | $66,134 | $971 |
| Monthly Housing Costs | $648 | $156 |
| Real Estate Taxes | $2,733 | $40 |
Property Value by Mortgage Status in South Lyon
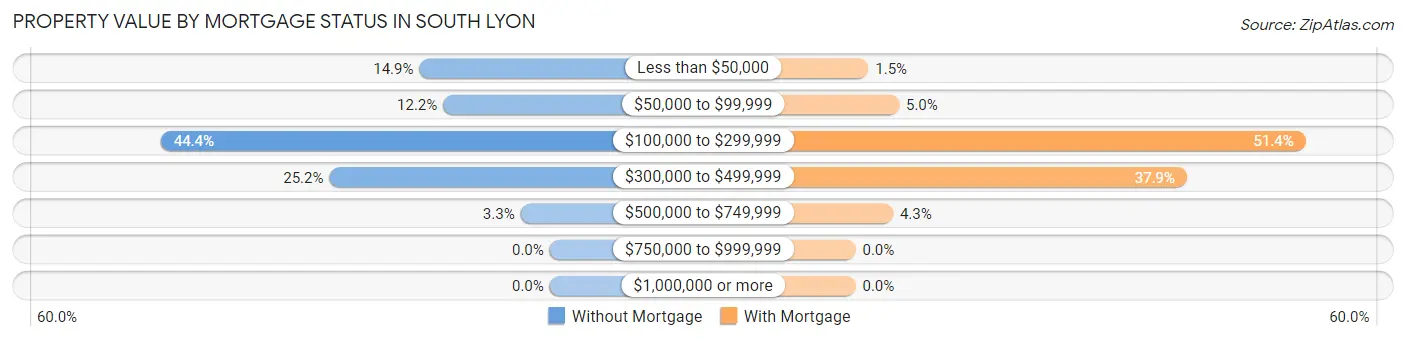
| Property Value | Without Mortgage | With Mortgage |
| Less than $50,000 | 246 (14.9%) | 38 (1.5%) |
| $50,000 to $99,999 | 201 (12.2%) | 129 (5.0%) |
| $100,000 to $299,999 | 734 (44.4%) | 1,334 (51.4%) |
| $300,000 to $499,999 | 416 (25.2%) | 982 (37.9%) |
| $500,000 to $749,999 | 55 (3.3%) | 111 (4.3%) |
| $750,000 to $999,999 | 0 (0.0%) | 0 (0.0%) |
| $1,000,000 or more | 0 (0.0%) | 0 (0.0%) |
| Total | 1,652 (100.0%) | 2,594 (100.0%) |
Household Income by Mortgage Status in South Lyon
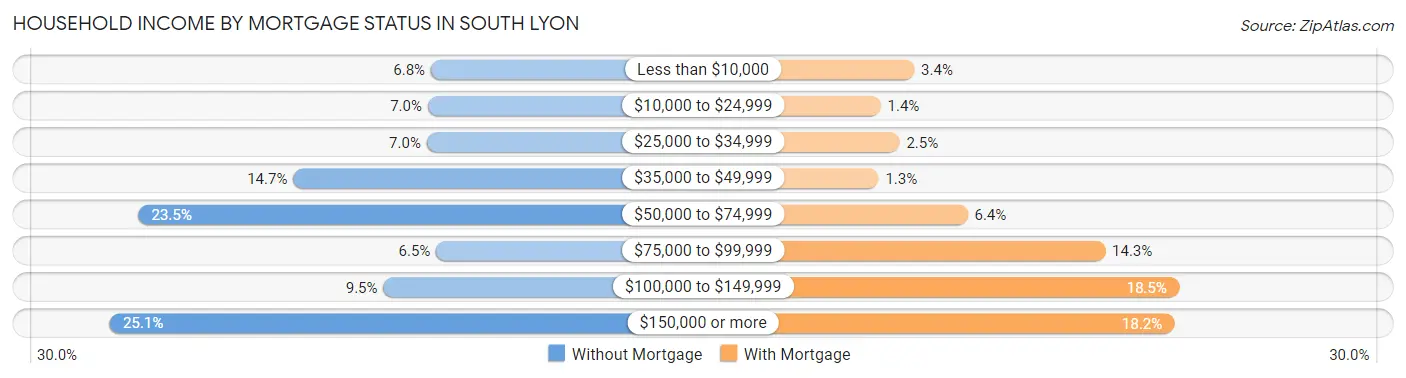
| Household Income | Without Mortgage | With Mortgage |
| Less than $10,000 | 112 (6.8%) | 87 (3.4%) |
| $10,000 to $24,999 | 115 (7.0%) | 37 (1.4%) |
| $25,000 to $34,999 | 116 (7.0%) | 65 (2.5%) |
| $35,000 to $49,999 | 242 (14.6%) | 34 (1.3%) |
| $50,000 to $74,999 | 388 (23.5%) | 166 (6.4%) |
| $75,000 to $99,999 | 107 (6.5%) | 370 (14.3%) |
| $100,000 to $149,999 | 157 (9.5%) | 479 (18.5%) |
| $150,000 or more | 415 (25.1%) | 472 (18.2%) |
| Total | 1,652 (100.0%) | 2,594 (100.0%) |
Property Value to Household Income Ratio in South Lyon
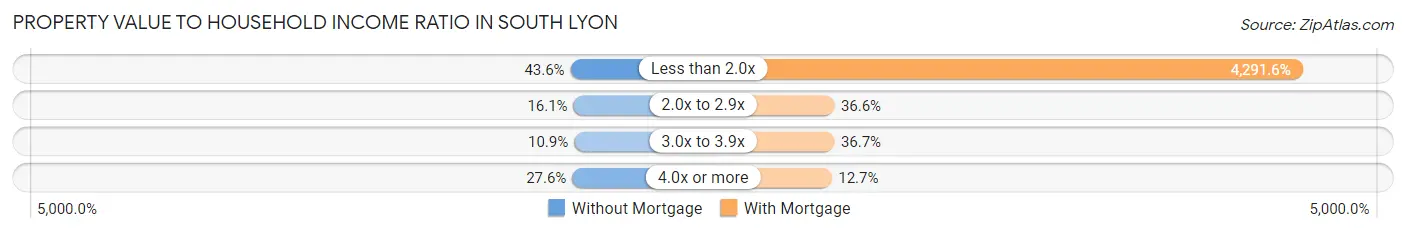
| Value-to-Income Ratio | Without Mortgage | With Mortgage |
| Less than 2.0x | 720 (43.6%) | 111,324 (4,291.6%) |
| 2.0x to 2.9x | 266 (16.1%) | 950 (36.6%) |
| 3.0x to 3.9x | 180 (10.9%) | 952 (36.7%) |
| 4.0x or more | 456 (27.6%) | 329 (12.7%) |
| Total | 1,652 (100.0%) | 2,594 (100.0%) |
Real Estate Taxes by Mortgage Status in South Lyon
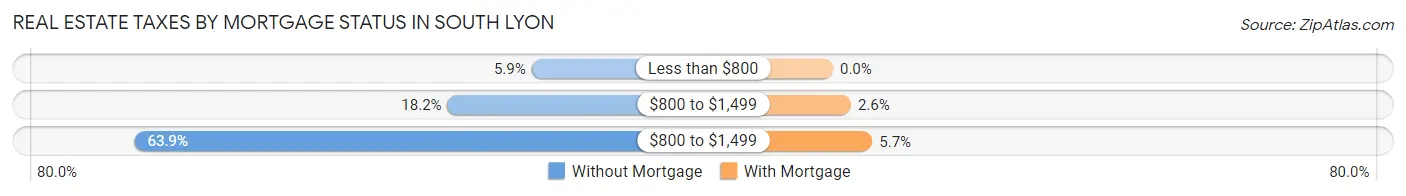
| Property Taxes | Without Mortgage | With Mortgage |
| Less than $800 | 98 (5.9%) | 0 (0.0%) |
| $800 to $1,499 | 301 (18.2%) | 68 (2.6%) |
| $800 to $1,499 | 1,056 (63.9%) | 149 (5.7%) |
| Total | 1,652 (100.0%) | 2,594 (100.0%) |
Health & Disability in South Lyon
Health Insurance Coverage by Age in South Lyon
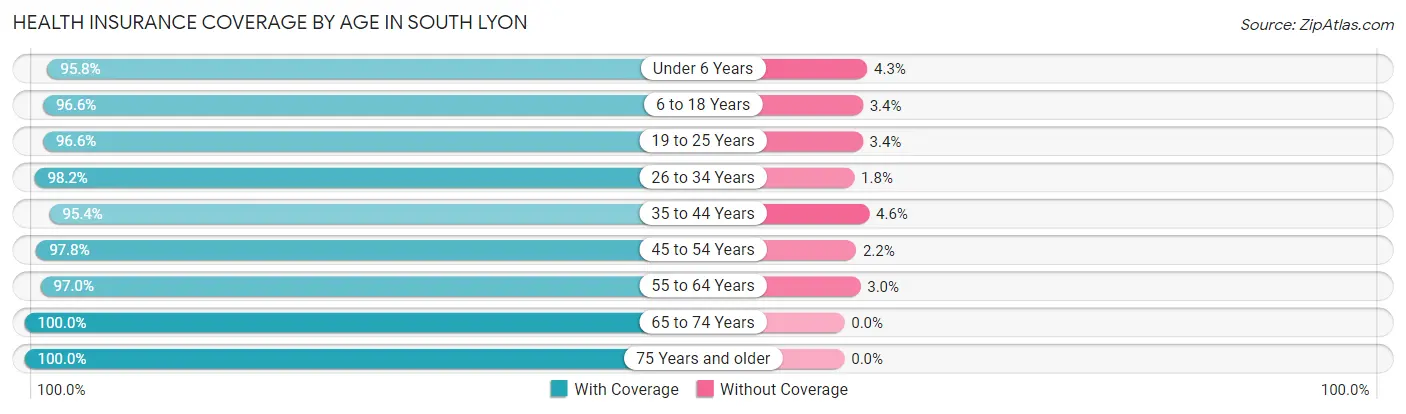
| Age Bracket | With Coverage | Without Coverage |
| Under 6 Years | 586 (95.8%) | 26 (4.3%) |
| 6 to 18 Years | 1,607 (96.6%) | 57 (3.4%) |
| 19 to 25 Years | 1,186 (96.6%) | 42 (3.4%) |
| 26 to 34 Years | 908 (98.2%) | 17 (1.8%) |
| 35 to 44 Years | 1,195 (95.4%) | 58 (4.6%) |
| 45 to 54 Years | 1,754 (97.8%) | 39 (2.2%) |
| 55 to 64 Years | 2,183 (97.0%) | 67 (3.0%) |
| 65 to 74 Years | 1,090 (100.0%) | 0 (0.0%) |
| 75 Years and older | 906 (100.0%) | 0 (0.0%) |
| Total | 11,415 (97.4%) | 306 (2.6%) |
Health Insurance Coverage by Citizenship Status in South Lyon
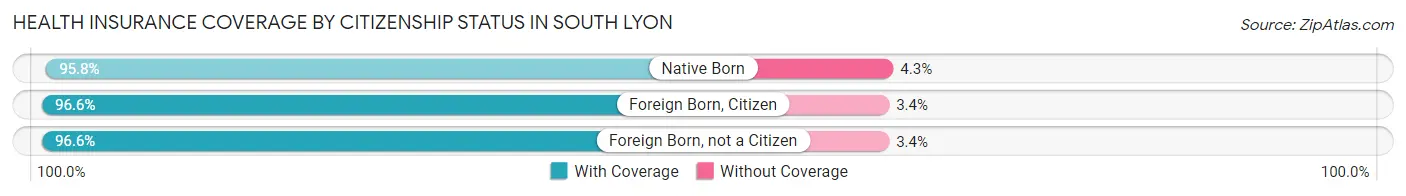
| Citizenship Status | With Coverage | Without Coverage |
| Native Born | 586 (95.8%) | 26 (4.3%) |
| Foreign Born, Citizen | 1,607 (96.6%) | 57 (3.4%) |
| Foreign Born, not a Citizen | 1,186 (96.6%) | 42 (3.4%) |
Health Insurance Coverage by Household Income in South Lyon
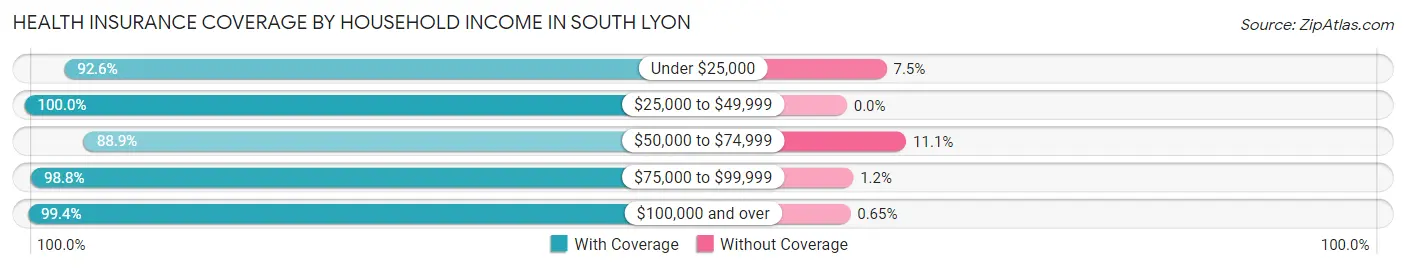
| Household Income | With Coverage | Without Coverage |
| Under $25,000 | 658 (92.5%) | 53 (7.4%) |
| $25,000 to $49,999 | 1,136 (100.0%) | 0 (0.0%) |
| $50,000 to $74,999 | 1,526 (88.9%) | 191 (11.1%) |
| $75,000 to $99,999 | 1,631 (98.8%) | 20 (1.2%) |
| $100,000 and over | 6,463 (99.4%) | 42 (0.6%) |
Public vs Private Health Insurance Coverage by Age in South Lyon
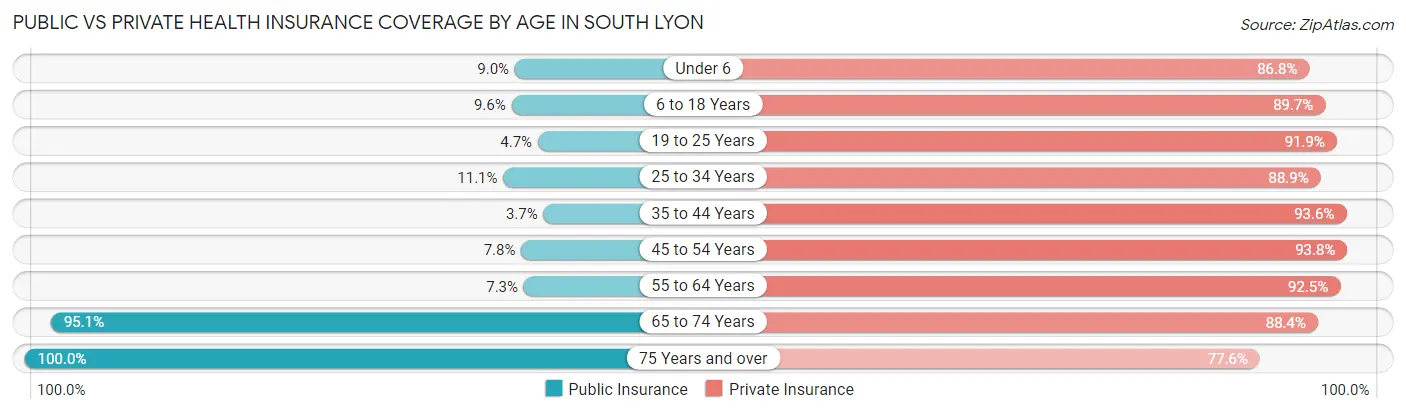
| Age Bracket | Public Insurance | Private Insurance |
| Under 6 | 55 (9.0%) | 531 (86.8%) |
| 6 to 18 Years | 160 (9.6%) | 1,493 (89.7%) |
| 19 to 25 Years | 58 (4.7%) | 1,128 (91.9%) |
| 25 to 34 Years | 103 (11.1%) | 822 (88.9%) |
| 35 to 44 Years | 46 (3.7%) | 1,173 (93.6%) |
| 45 to 54 Years | 140 (7.8%) | 1,682 (93.8%) |
| 55 to 64 Years | 165 (7.3%) | 2,081 (92.5%) |
| 65 to 74 Years | 1,037 (95.1%) | 963 (88.3%) |
| 75 Years and over | 906 (100.0%) | 703 (77.6%) |
| Total | 2,670 (22.8%) | 10,576 (90.2%) |
Disability Status by Sex by Age in South Lyon
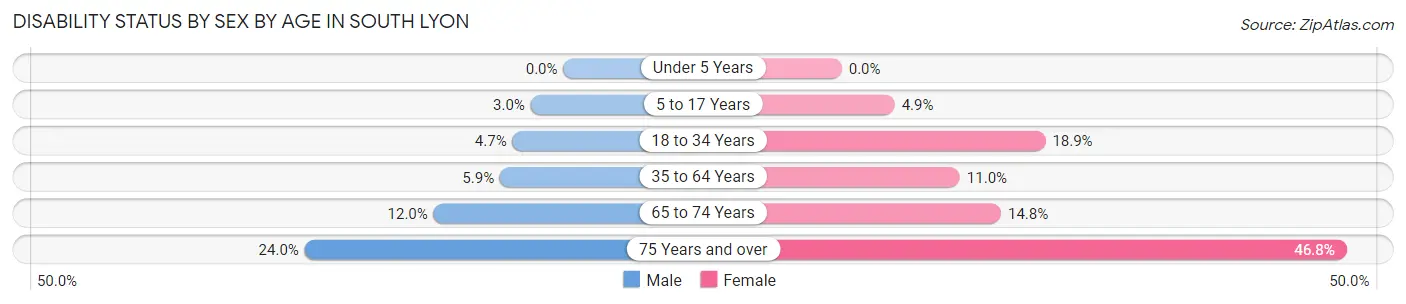
| Age Bracket | Male | Female |
| Under 5 Years | 0 (0.0%) | 0 (0.0%) |
| 5 to 17 Years | 23 (3.0%) | 43 (4.9%) |
| 18 to 34 Years | 52 (4.7%) | 230 (18.9%) |
| 35 to 64 Years | 159 (5.9%) | 284 (11.0%) |
| 65 to 74 Years | 62 (12.0%) | 85 (14.8%) |
| 75 Years and over | 73 (24.0%) | 282 (46.8%) |
Disability Class by Sex by Age in South Lyon
Disability Class: Hearing Difficulty
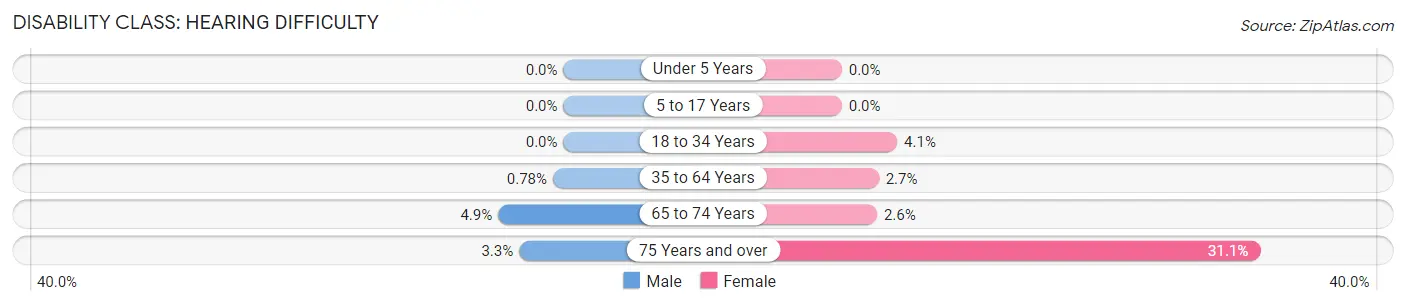
| Age Bracket | Male | Female |
| Under 5 Years | 0 (0.0%) | 0 (0.0%) |
| 5 to 17 Years | 0 (0.0%) | 0 (0.0%) |
| 18 to 34 Years | 0 (0.0%) | 50 (4.1%) |
| 35 to 64 Years | 21 (0.8%) | 71 (2.7%) |
| 65 to 74 Years | 25 (4.9%) | 15 (2.6%) |
| 75 Years and over | 10 (3.3%) | 187 (31.1%) |
Disability Class: Vision Difficulty
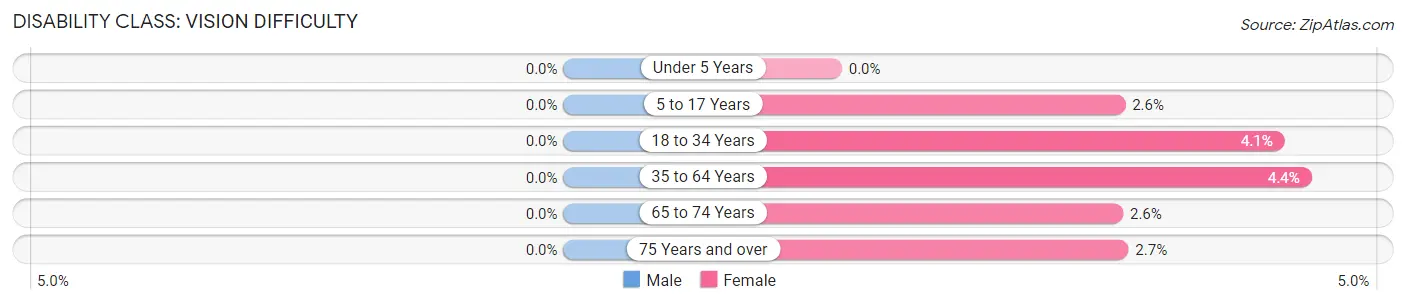
| Age Bracket | Male | Female |
| Under 5 Years | 0 (0.0%) | 0 (0.0%) |
| 5 to 17 Years | 0 (0.0%) | 23 (2.6%) |
| 18 to 34 Years | 0 (0.0%) | 50 (4.1%) |
| 35 to 64 Years | 0 (0.0%) | 113 (4.4%) |
| 65 to 74 Years | 0 (0.0%) | 15 (2.6%) |
| 75 Years and over | 0 (0.0%) | 16 (2.7%) |
Disability Class: Cognitive Difficulty
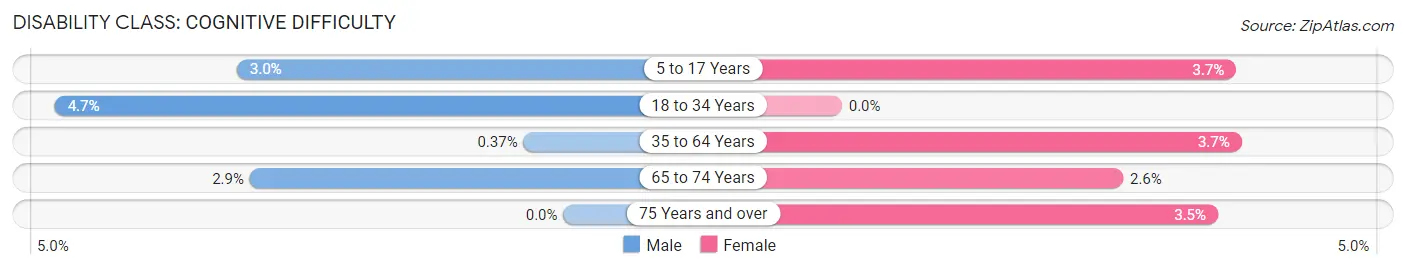
| Age Bracket | Male | Female |
| 5 to 17 Years | 23 (3.0%) | 32 (3.7%) |
| 18 to 34 Years | 52 (4.7%) | 0 (0.0%) |
| 35 to 64 Years | 10 (0.4%) | 96 (3.7%) |
| 65 to 74 Years | 15 (2.9%) | 15 (2.6%) |
| 75 Years and over | 0 (0.0%) | 21 (3.5%) |
Disability Class: Ambulatory Difficulty
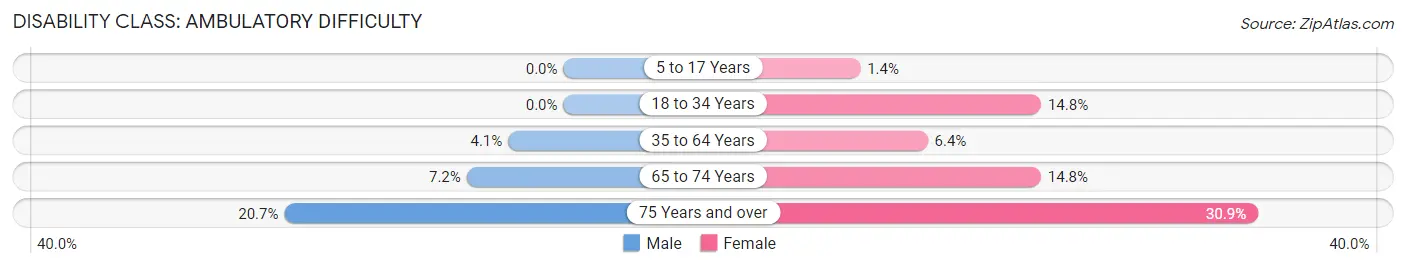
| Age Bracket | Male | Female |
| 5 to 17 Years | 0 (0.0%) | 12 (1.4%) |
| 18 to 34 Years | 0 (0.0%) | 180 (14.8%) |
| 35 to 64 Years | 111 (4.1%) | 165 (6.4%) |
| 65 to 74 Years | 37 (7.2%) | 85 (14.8%) |
| 75 Years and over | 63 (20.7%) | 186 (30.9%) |
Disability Class: Self-Care Difficulty
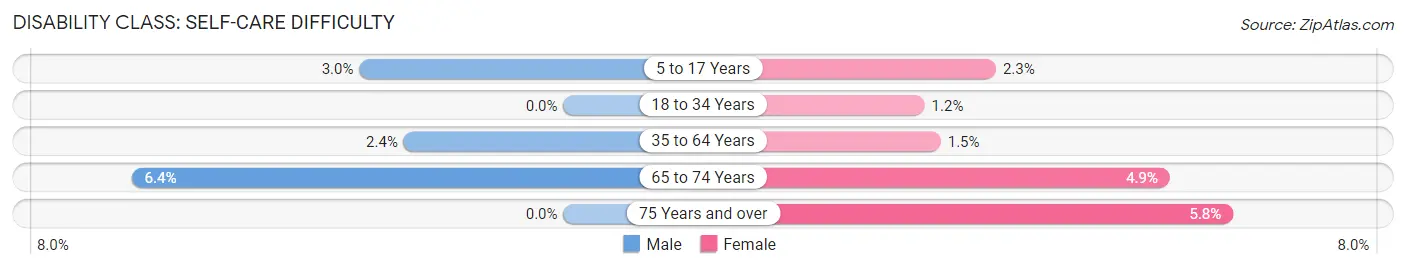
| Age Bracket | Male | Female |
| 5 to 17 Years | 23 (3.0%) | 20 (2.3%) |
| 18 to 34 Years | 0 (0.0%) | 15 (1.2%) |
| 35 to 64 Years | 64 (2.4%) | 38 (1.5%) |
| 65 to 74 Years | 33 (6.4%) | 28 (4.9%) |
| 75 Years and over | 0 (0.0%) | 35 (5.8%) |
Technology Access in South Lyon
Computing Device Access in South Lyon
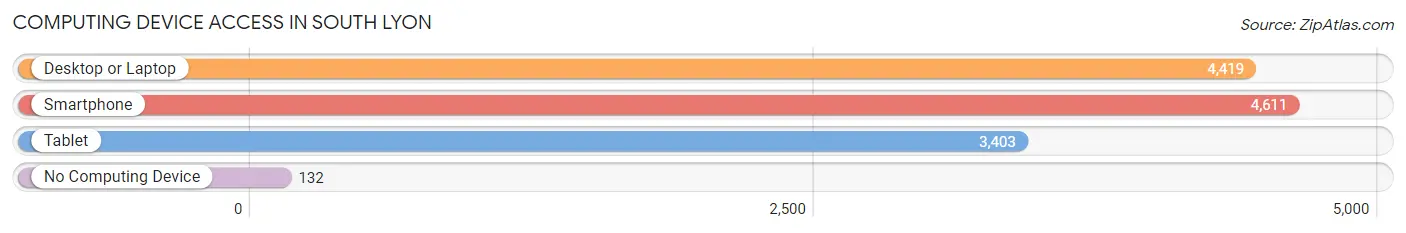
| Device Type | # Households | % Households |
| Desktop or Laptop | 4,419 | 86.3% |
| Smartphone | 4,611 | 90.0% |
| Tablet | 3,403 | 66.4% |
| No Computing Device | 132 | 2.6% |
| Total | 5,121 | 100.0% |
Internet Access in South Lyon
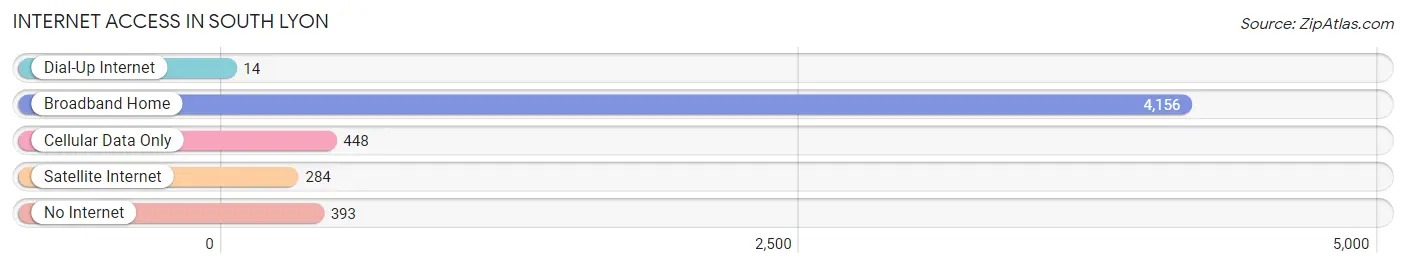
| Internet Type | # Households | % Households |
| Dial-Up Internet | 14 | 0.3% |
| Broadband Home | 4,156 | 81.2% |
| Cellular Data Only | 448 | 8.7% |
| Satellite Internet | 284 | 5.6% |
| No Internet | 393 | 7.7% |
| Total | 5,121 | 100.0% |
South Lyon Summary
History
South Lyon, Michigan is a small city located in Oakland County, about 25 miles northwest of Detroit. The city was founded in 1832 by Elijah Willets, who purchased the land from the federal government. Willets named the city after his hometown of South Lyon, England. The city was incorporated in 1867 and has since grown to a population of over 11,000 people.
South Lyon has a rich history of industry and agriculture. In the late 1800s, the city was home to several mills, including a grist mill, a saw mill, and a woolen mill. The city also had a thriving agricultural industry, with farmers growing wheat, corn, and other crops.
In the early 1900s, the city began to experience a period of growth and development. The city was home to several factories, including a brickyard, a canning factory, and a furniture factory. The city also had a thriving downtown area, with several stores and businesses.
In the 1950s, the city experienced a period of decline as many of the factories and businesses closed. However, the city has since experienced a resurgence, with new businesses and industries moving into the area.
Geography
South Lyon is located in Oakland County, Michigan, about 25 miles northwest of Detroit. The city is situated on the Huron River, which flows through the city and provides a source of recreation for residents. The city is also located near several lakes, including Kent Lake, Lake Fenton, and Lake Orion.
The city has a total area of 4.2 square miles, with 0.2 square miles of water. The city is located at an elevation of 890 feet above sea level. The city has a humid continental climate, with cold winters and warm summers.
Economy
South Lyon has a diverse economy, with a variety of businesses and industries. The city is home to several manufacturing companies, including automotive parts manufacturers, food processing companies, and metalworking companies. The city also has a thriving retail sector, with several stores and restaurants located in the downtown area.
The city is also home to several healthcare facilities, including a hospital and several medical offices. The city is also home to several educational institutions, including a community college and several public and private schools.
Demographics
As of the 2010 census, South Lyon had a population of 11,327 people. The city has a population density of 2,717 people per square mile. The median age of the population is 39.7 years, with 51.2% of the population being female and 48.8% being male.
The racial makeup of the city is 87.2% White, 5.3% African American, 0.5% Native American, 2.2% Asian, 0.1% Pacific Islander, 1.7% from other races, and 3.0% from two or more races. The median household income is $63,945, and the median family income is $76,945. The per capita income is $30,945.
Common Questions
What is Per Capita Income in South Lyon?
Per Capita income in South Lyon is $50,512.
What is the Median Family Income in South Lyon?
Median Family Income in South Lyon is $117,130.
What is the Median Household income in South Lyon?
Median Household Income in South Lyon is $82,753.
What is Income or Wage Gap in South Lyon?
Income or Wage Gap in South Lyon is 31.3%.
Women in South Lyon earn 68.7 cents for every dollar earned by a man.
What is Inequality or Gini Index in South Lyon?
Inequality or Gini Index in South Lyon is 0.43.
What is the Total Population of South Lyon?
Total Population of South Lyon is 11,788.
What is the Total Male Population of South Lyon?
Total Male Population of South Lyon is 5,673.
What is the Total Female Population of South Lyon?
Total Female Population of South Lyon is 6,115.
What is the Ratio of Males per 100 Females in South Lyon?
There are 92.77 Males per 100 Females in South Lyon.
What is the Ratio of Females per 100 Males in South Lyon?
There are 107.79 Females per 100 Males in South Lyon.
What is the Median Population Age in South Lyon?
Median Population Age in South Lyon is 46.7 Years.
What is the Average Family Size in South Lyon
Average Family Size in South Lyon is 2.9 People.
What is the Average Household Size in South Lyon
Average Household Size in South Lyon is 2.3 People.
How Large is the Labor Force in South Lyon?
There are 6,755 People in the Labor Forcein in South Lyon.
What is the Percentage of People in the Labor Force in South Lyon?
68.5% of People are in the Labor Force in South Lyon.
What is the Unemployment Rate in South Lyon?
Unemployment Rate in South Lyon is 3.6%.