University Heights, OH Map & Demographics
University Heights Map
University Heights Overview
$41,872
PER CAPITA INCOME
$114,884
AVG FAMILY INCOME
$91,960
AVG HOUSEHOLD INCOME
23.3%
WAGE / INCOME GAP [ % ]
76.7¢/ $1
WAGE / INCOME GAP [ $ ]
0.45
INEQUALITY / GINI INDEX
13,649
TOTAL POPULATION
6,787
MALE POPULATION
6,862
FEMALE POPULATION
98.91
MALES / 100 FEMALES
101.11
FEMALES / 100 MALES
30.5
MEDIAN AGE
3.1
AVG FAMILY SIZE
2.5
AVG HOUSEHOLD SIZE
7,640
LABOR FORCE [ PEOPLE ]
69.1%
PERCENT IN LABOR FORCE
5.5%
UNEMPLOYMENT RATE
University Heights Area Codes
Income in University Heights
Income Overview in University Heights
Per Capita Income in University Heights is $41,872, while median incomes of families and households are $114,884 and $91,960 respectively.
| Characteristic | Number | Measure |
| Per Capita Income | 13,649 | $41,872 |
| Median Family Income | 3,066 | $114,884 |
| Mean Family Income | 3,066 | $140,132 |
| Median Household Income | 4,851 | $91,960 |
| Mean Household Income | 4,851 | $114,973 |
| Income Deficit | 3,066 | $0 |
| Wage / Income Gap (%) | 13,649 | 23.34% |
| Wage / Income Gap ($) | 13,649 | 76.66¢ per $1 |
| Gini / Inequality Index | 13,649 | 0.45 |
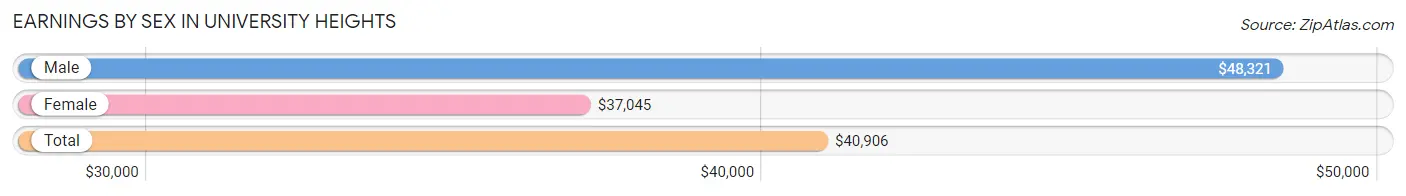
Earnings by Sex in University Heights
Average Earnings in University Heights are $40,906, $48,321 for men and $37,045 for women, a difference of 23.3%.
| Sex | Number | Average Earnings |
| Male | 4,259 (50.6%) | $48,321 |
| Female | 4,154 (49.4%) | $37,045 |
| Total | 8,413 (100.0%) | $40,906 |
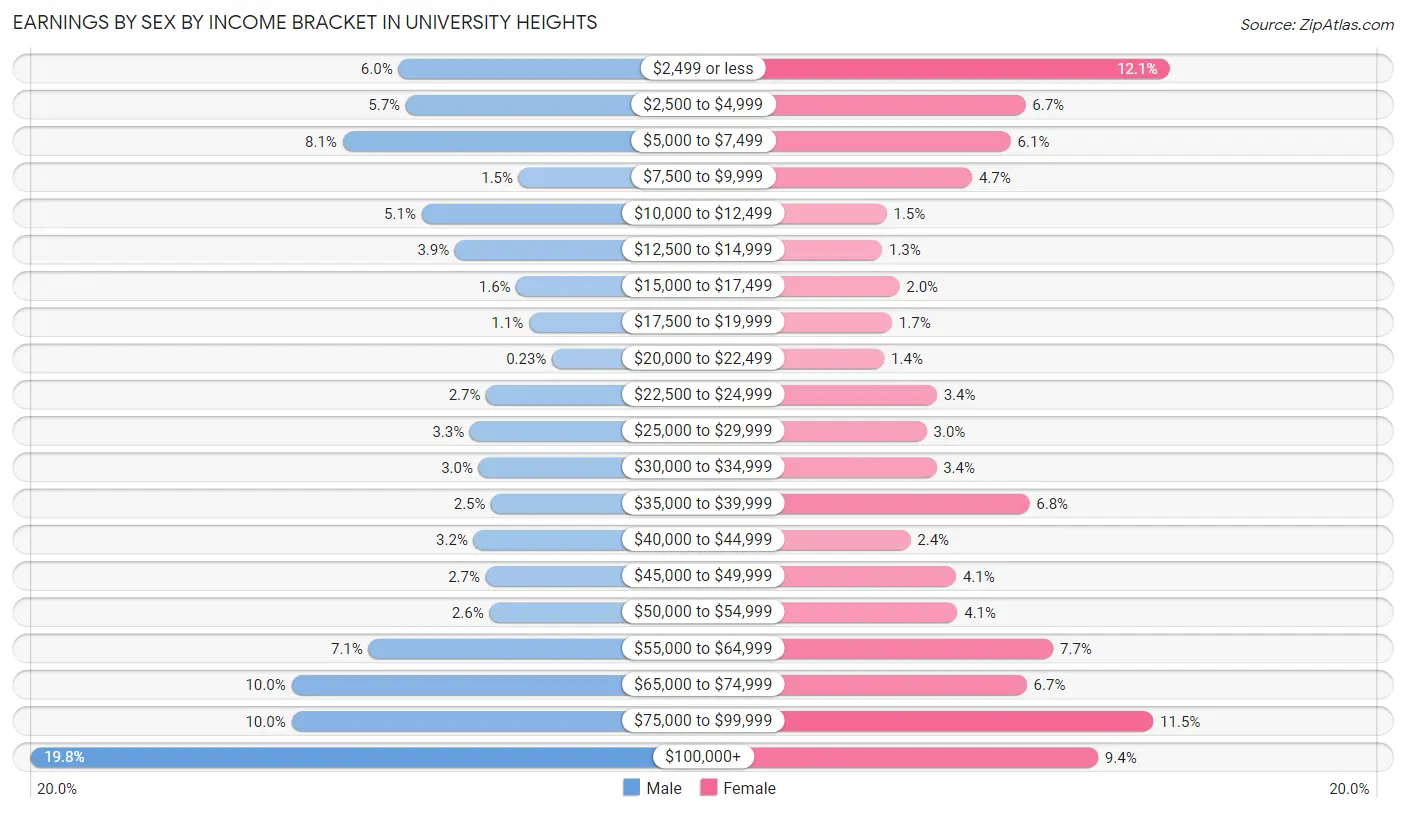
Earnings by Sex by Income Bracket in University Heights
The most common earnings brackets in University Heights are $100,000+ for men (841 | 19.8%) and $2,499 or less for women (502 | 12.1%).
| Income | Male | Female |
| $2,499 or less | 255 (6.0%) | 502 (12.1%) |
| $2,500 to $4,999 | 243 (5.7%) | 278 (6.7%) |
| $5,000 to $7,499 | 344 (8.1%) | 255 (6.1%) |
| $7,500 to $9,999 | 63 (1.5%) | 195 (4.7%) |
| $10,000 to $12,499 | 218 (5.1%) | 62 (1.5%) |
| $12,500 to $14,999 | 165 (3.9%) | 55 (1.3%) |
| $15,000 to $17,499 | 67 (1.6%) | 82 (2.0%) |
| $17,500 to $19,999 | 47 (1.1%) | 70 (1.7%) |
| $20,000 to $22,499 | 10 (0.2%) | 58 (1.4%) |
| $22,500 to $24,999 | 115 (2.7%) | 140 (3.4%) |
| $25,000 to $29,999 | 141 (3.3%) | 124 (3.0%) |
| $30,000 to $34,999 | 127 (3.0%) | 139 (3.4%) |
| $35,000 to $39,999 | 107 (2.5%) | 284 (6.8%) |
| $40,000 to $44,999 | 135 (3.2%) | 99 (2.4%) |
| $45,000 to $49,999 | 116 (2.7%) | 170 (4.1%) |
| $50,000 to $54,999 | 110 (2.6%) | 172 (4.1%) |
| $55,000 to $64,999 | 303 (7.1%) | 321 (7.7%) |
| $65,000 to $74,999 | 426 (10.0%) | 280 (6.7%) |
| $75,000 to $99,999 | 426 (10.0%) | 477 (11.5%) |
| $100,000+ | 841 (19.8%) | 391 (9.4%) |
| Total | 4,259 (100.0%) | 4,154 (100.0%) |
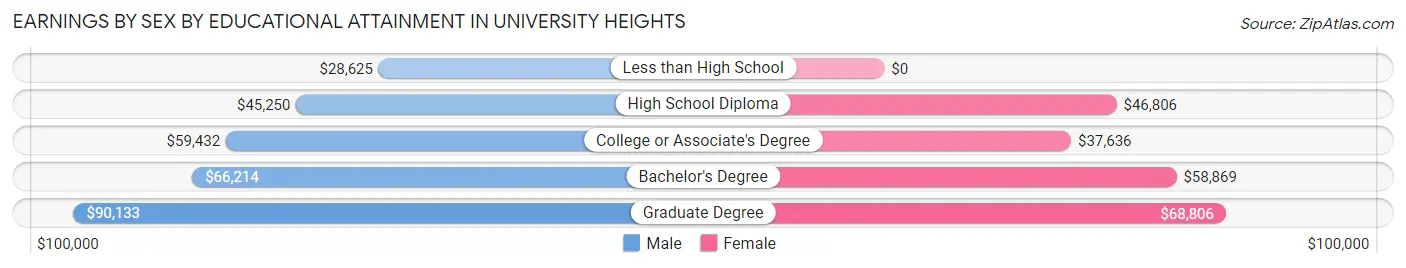
Earnings by Sex by Educational Attainment in University Heights
Average earnings in University Heights are $67,667 for men and $55,334 for women, a difference of 18.2%. Men with an educational attainment of graduate degree enjoy the highest average annual earnings of $90,133, while those with less than high school education earn the least with $28,625. Women with an educational attainment of graduate degree earn the most with the average annual earnings of $68,806, while those with college or associate's degree education have the smallest earnings of $37,636.
| Educational Attainment | Male Income | Female Income |
| Less than High School | $28,625 | $0 |
| High School Diploma | $45,250 | $46,806 |
| College or Associate's Degree | $59,432 | $37,636 |
| Bachelor's Degree | $66,214 | $58,869 |
| Graduate Degree | $90,133 | $68,806 |
| Total | $67,667 | $55,334 |
Family Income in University Heights
Family Income Brackets in University Heights
According to the University Heights family income data, there are 901 families falling into the $100,000 to $149,999 income range, which is the most common income bracket and makes up 29.4% of all families. Conversely, the $10,000 to $14,999 income bracket is the least frequent group with only 12 families (0.4%) belonging to this category.
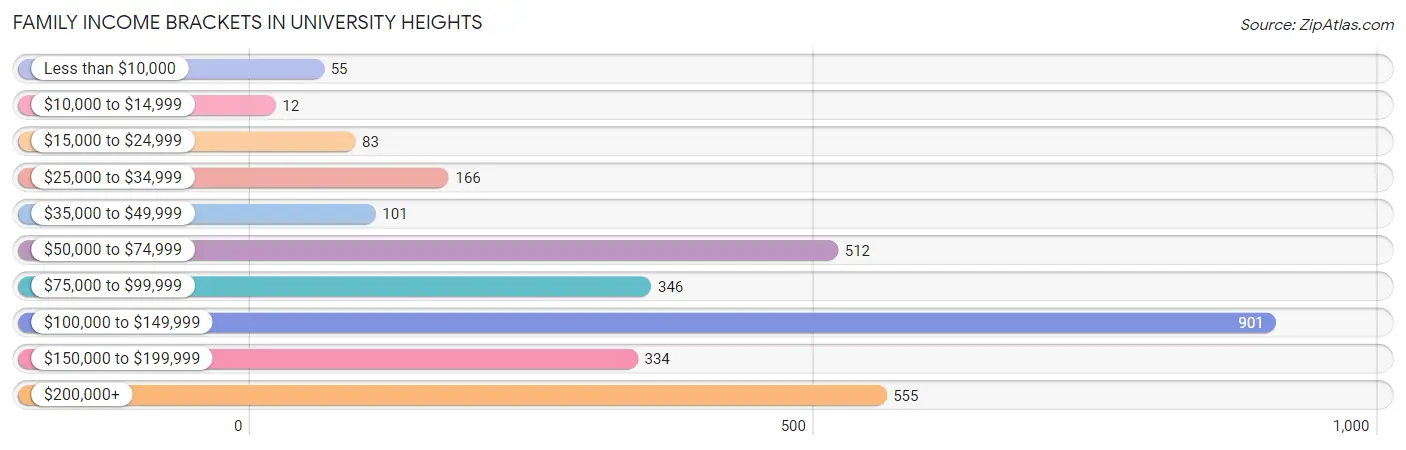
| Income Bracket | # Families | % Families |
| Less than $10,000 | 55 | 1.8% |
| $10,000 to $14,999 | 12 | 0.4% |
| $15,000 to $24,999 | 83 | 2.7% |
| $25,000 to $34,999 | 166 | 5.4% |
| $35,000 to $49,999 | 101 | 3.3% |
| $50,000 to $74,999 | 512 | 16.7% |
| $75,000 to $99,999 | 346 | 11.3% |
| $100,000 to $149,999 | 901 | 29.4% |
| $150,000 to $199,999 | 334 | 10.9% |
| $200,000+ | 555 | 18.1% |
Family Income by Famaliy Size in University Heights
4-person families (438 | 14.3%) account for the highest median family income in University Heights with $147,045 per family, while 2-person families (1,588 | 51.8%) have the highest median income of $51,789 per family member.
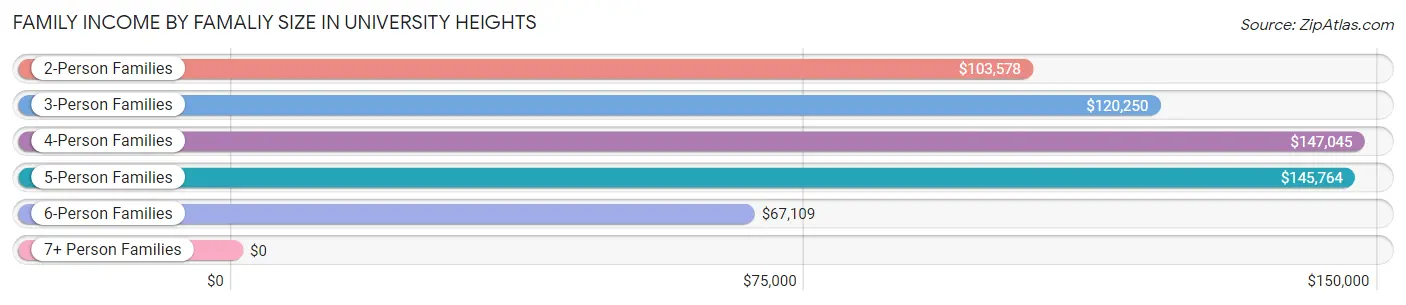
| Income Bracket | # Families | Median Income |
| 2-Person Families | 1,588 (51.8%) | $103,578 |
| 3-Person Families | 675 (22.0%) | $120,250 |
| 4-Person Families | 438 (14.3%) | $147,045 |
| 5-Person Families | 189 (6.2%) | $145,764 |
| 6-Person Families | 117 (3.8%) | $67,109 |
| 7+ Person Families | 59 (1.9%) | $0 |
| Total | 3,066 (100.0%) | $114,884 |
Family Income by Number of Earners in University Heights
The median family income in University Heights is $114,884, with families comprising 3+ earners (216) having the highest median family income of $172,500, while families with no earners (248) have the lowest median family income of $58,125, accounting for 7.0% and 8.1% of families, respectively.
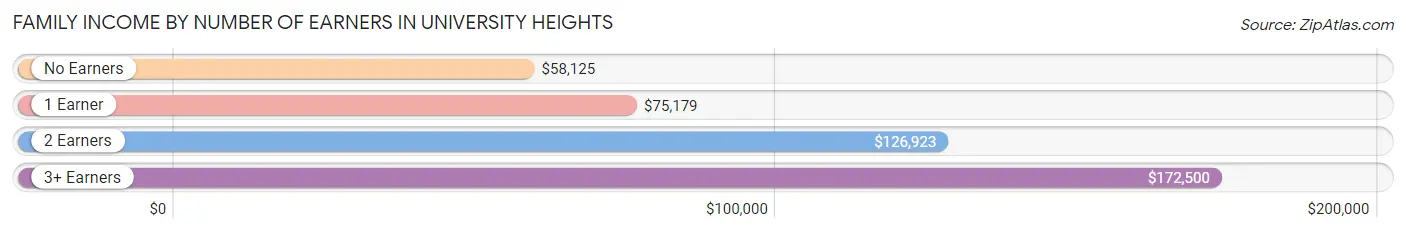
| Number of Earners | # Families | Median Income |
| No Earners | 248 (8.1%) | $58,125 |
| 1 Earner | 938 (30.6%) | $75,179 |
| 2 Earners | 1,664 (54.3%) | $126,923 |
| 3+ Earners | 216 (7.0%) | $172,500 |
| Total | 3,066 (100.0%) | $114,884 |
Household Income in University Heights
Household Income Brackets in University Heights
With 1,169 households falling in the category, the $100,000 to $149,999 income range is the most frequent in University Heights, accounting for 24.1% of all households. In contrast, only 97 households (2.0%) fall into the $10,000 to $14,999 income bracket, making it the least populous group.
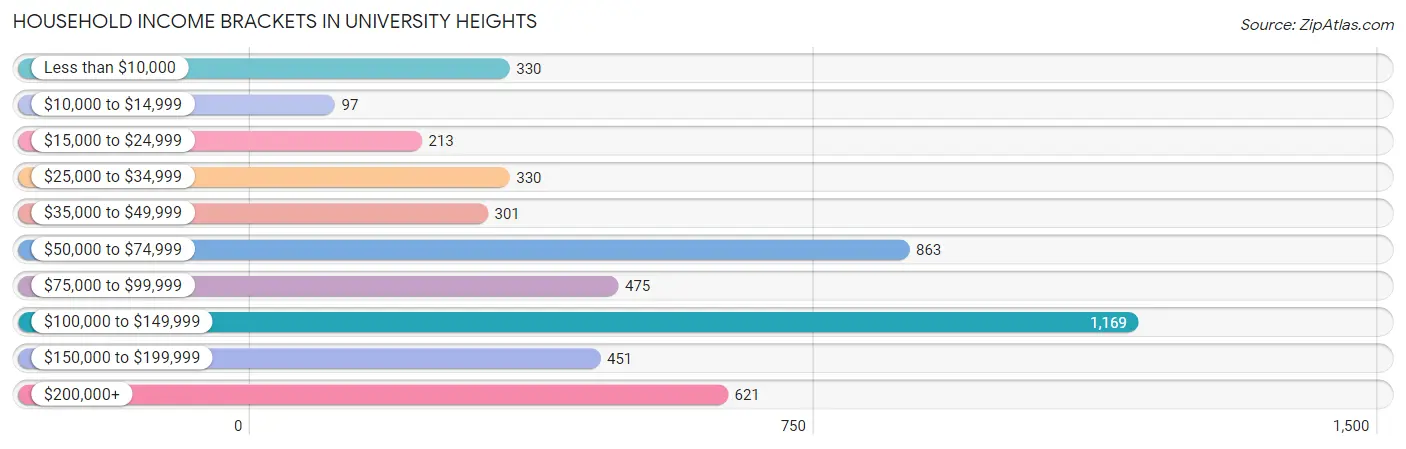
| Income Bracket | # Households | % Households |
| Less than $10,000 | 330 | 6.8% |
| $10,000 to $14,999 | 97 | 2.0% |
| $15,000 to $24,999 | 213 | 4.4% |
| $25,000 to $34,999 | 330 | 6.8% |
| $35,000 to $49,999 | 301 | 6.2% |
| $50,000 to $74,999 | 863 | 17.8% |
| $75,000 to $99,999 | 475 | 9.8% |
| $100,000 to $149,999 | 1,169 | 24.1% |
| $150,000 to $199,999 | 451 | 9.3% |
| $200,000+ | 621 | 12.8% |
Household Income by Householder Age in University Heights
The median household income in University Heights is $91,960, with the highest median household income of $120,271 found in the 45 to 64 years age bracket for the primary householder. A total of 1,503 households (31.0%) fall into this category. Meanwhile, the 15 to 24 years age bracket for the primary householder has the lowest median household income of $29,837, with 375 households (7.7%) in this group.
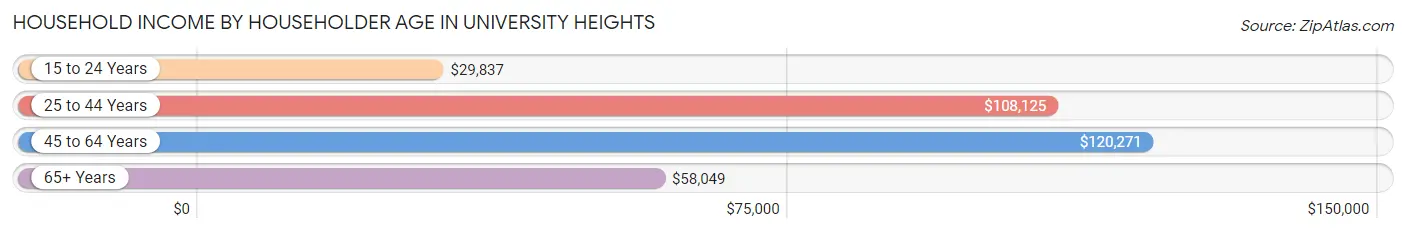
| Income Bracket | # Households | Median Income |
| 15 to 24 Years | 375 (7.7%) | $29,837 |
| 25 to 44 Years | 1,819 (37.5%) | $108,125 |
| 45 to 64 Years | 1,503 (31.0%) | $120,271 |
| 65+ Years | 1,154 (23.8%) | $58,049 |
| Total | 4,851 (100.0%) | $91,960 |
Poverty in University Heights
Income Below Poverty by Sex and Age in University Heights
With 10.9% poverty level for males and 11.6% for females among the residents of University Heights, 18 to 24 year old males and 18 to 24 year old females are the most vulnerable to poverty, with 234 males (34.2%) and 313 females (43.8%) in their respective age groups living below the poverty level.
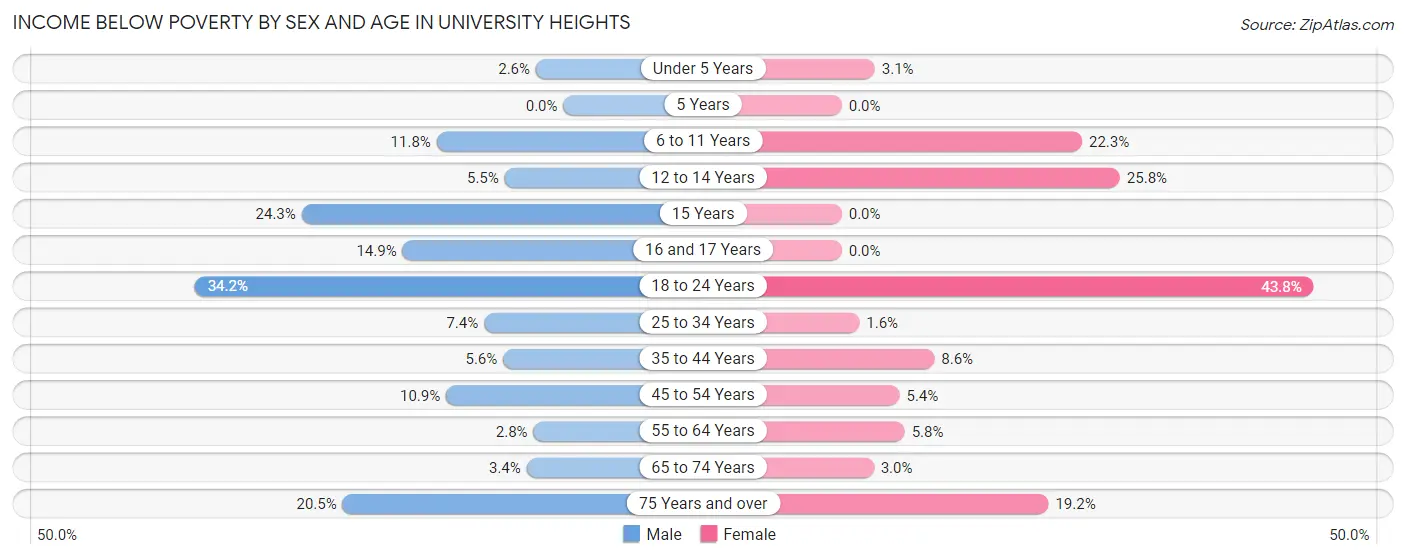
| Age Bracket | Male | Female |
| Under 5 Years | 13 (2.5%) | 17 (3.1%) |
| 5 Years | 0 (0.0%) | 0 (0.0%) |
| 6 to 11 Years | 52 (11.8%) | 101 (22.3%) |
| 12 to 14 Years | 9 (5.4%) | 24 (25.8%) |
| 15 Years | 34 (24.3%) | 0 (0.0%) |
| 16 and 17 Years | 40 (14.9%) | 0 (0.0%) |
| 18 to 24 Years | 234 (34.2%) | 313 (43.8%) |
| 25 to 34 Years | 75 (7.4%) | 18 (1.6%) |
| 35 to 44 Years | 48 (5.6%) | 61 (8.6%) |
| 45 to 54 Years | 78 (10.9%) | 32 (5.4%) |
| 55 to 64 Years | 14 (2.8%) | 39 (5.8%) |
| 65 to 74 Years | 17 (3.4%) | 13 (3.0%) |
| 75 Years and over | 50 (20.5%) | 93 (19.2%) |
| Total | 664 (10.9%) | 711 (11.6%) |
Income Above Poverty by Sex and Age in University Heights
According to the poverty statistics in University Heights, males aged 5 years and females aged 5 years are the age groups that are most secure financially, with 100.0% of males and 100.0% of females in these age groups living above the poverty line.
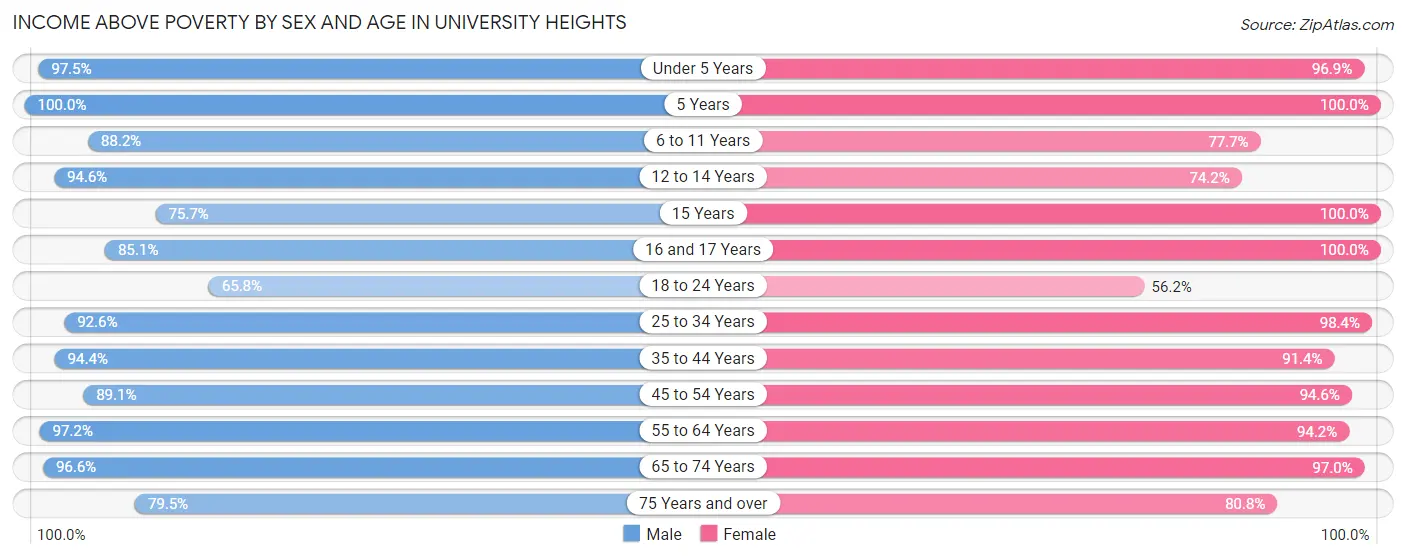
| Age Bracket | Male | Female |
| Under 5 Years | 497 (97.5%) | 537 (96.9%) |
| 5 Years | 62 (100.0%) | 48 (100.0%) |
| 6 to 11 Years | 390 (88.2%) | 352 (77.7%) |
| 12 to 14 Years | 156 (94.6%) | 69 (74.2%) |
| 15 Years | 106 (75.7%) | 125 (100.0%) |
| 16 and 17 Years | 228 (85.1%) | 155 (100.0%) |
| 18 to 24 Years | 450 (65.8%) | 402 (56.2%) |
| 25 to 34 Years | 944 (92.6%) | 1,084 (98.4%) |
| 35 to 44 Years | 811 (94.4%) | 649 (91.4%) |
| 45 to 54 Years | 638 (89.1%) | 565 (94.6%) |
| 55 to 64 Years | 490 (97.2%) | 629 (94.2%) |
| 65 to 74 Years | 481 (96.6%) | 426 (97.0%) |
| 75 Years and over | 194 (79.5%) | 392 (80.8%) |
| Total | 5,447 (89.1%) | 5,433 (88.4%) |
Income Below Poverty Among Married-Couple Families in University Heights
The poverty statistics for married-couple families in University Heights show that 4.0% or 92 of the total 2,292 families live below the poverty line. Families with 3 or 4 children have the highest poverty rate of 10.3%, comprising of 30 families. On the other hand, families with 5 or more children have the lowest poverty rate of 0.0%, which includes 0 families.
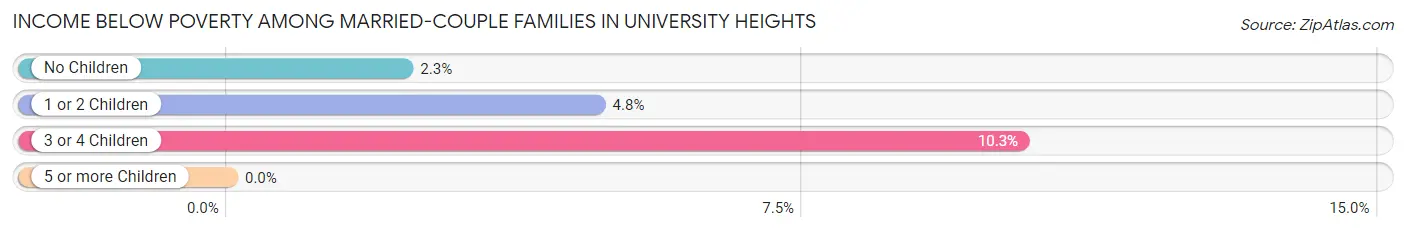
| Children | Above Poverty | Below Poverty |
| No Children | 1,238 (97.7%) | 29 (2.3%) |
| 1 or 2 Children | 654 (95.2%) | 33 (4.8%) |
| 3 or 4 Children | 260 (89.7%) | 30 (10.3%) |
| 5 or more Children | 48 (100.0%) | 0 (0.0%) |
| Total | 2,200 (96.0%) | 92 (4.0%) |
Income Below Poverty Among Single-Parent Households in University Heights
According to the poverty data in University Heights, 20.4% or 37 single-father households and 4.5% or 27 single-mother households are living below the poverty line. Among single-father households, those with 3 or 4 children have the highest poverty rate, with 25 households (100.0%) experiencing poverty. Likewise, among single-mother households, those with 1 or 2 children have the highest poverty rate, with 27 households (11.1%) falling below the poverty line.
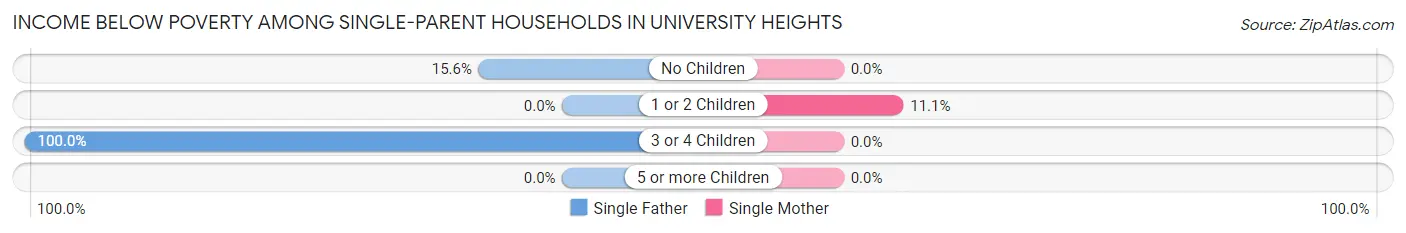
| Children | Single Father | Single Mother |
| No Children | 12 (15.6%) | 0 (0.0%) |
| 1 or 2 Children | 0 (0.0%) | 27 (11.1%) |
| 3 or 4 Children | 25 (100.0%) | 0 (0.0%) |
| 5 or more Children | 0 (0.0%) | 0 (0.0%) |
| Total | 37 (20.4%) | 27 (4.5%) |
Income Below Poverty Among Married-Couple vs Single-Parent Households in University Heights
The poverty data for University Heights shows that 92 of the married-couple family households (4.0%) and 64 of the single-parent households (8.3%) are living below the poverty level. Within the married-couple family households, those with 3 or 4 children have the highest poverty rate, with 30 households (10.3%) falling below the poverty line. Among the single-parent households, those with 3 or 4 children have the highest poverty rate, with 25 household (67.6%) living below poverty.
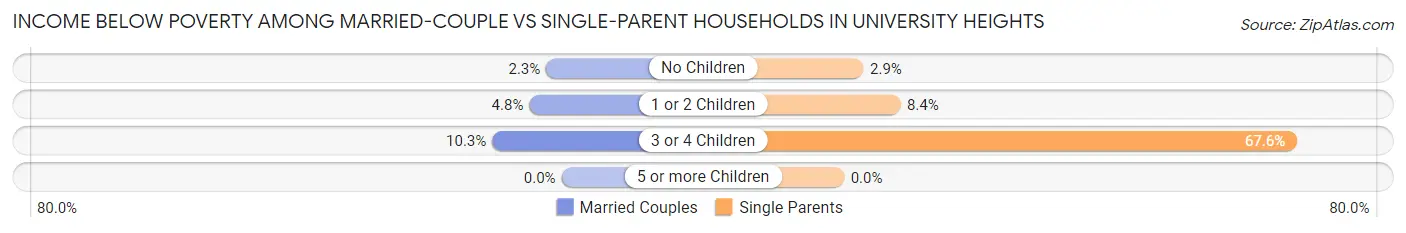
| Children | Married-Couple Families | Single-Parent Households |
| No Children | 29 (2.3%) | 12 (2.9%) |
| 1 or 2 Children | 33 (4.8%) | 27 (8.4%) |
| 3 or 4 Children | 30 (10.3%) | 25 (67.6%) |
| 5 or more Children | 0 (0.0%) | 0 (0.0%) |
| Total | 92 (4.0%) | 64 (8.3%) |
Race in University Heights
The most populous races in University Heights are White / Caucasian (9,836 | 72.1%), Black / African American (3,167 | 23.2%), and Two or more Races (319 | 2.3%).
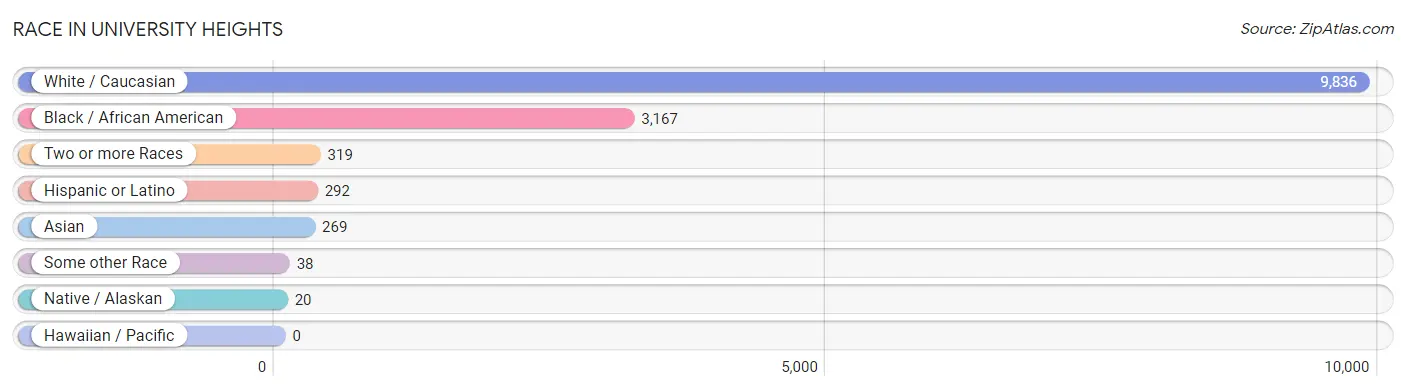
| Race | # Population | % Population |
| Asian | 269 | 2.0% |
| Black / African American | 3,167 | 23.2% |
| Hawaiian / Pacific | 0 | 0.0% |
| Hispanic or Latino | 292 | 2.1% |
| Native / Alaskan | 20 | 0.2% |
| White / Caucasian | 9,836 | 72.1% |
| Two or more Races | 319 | 2.3% |
| Some other Race | 38 | 0.3% |
| Total | 13,649 | 100.0% |
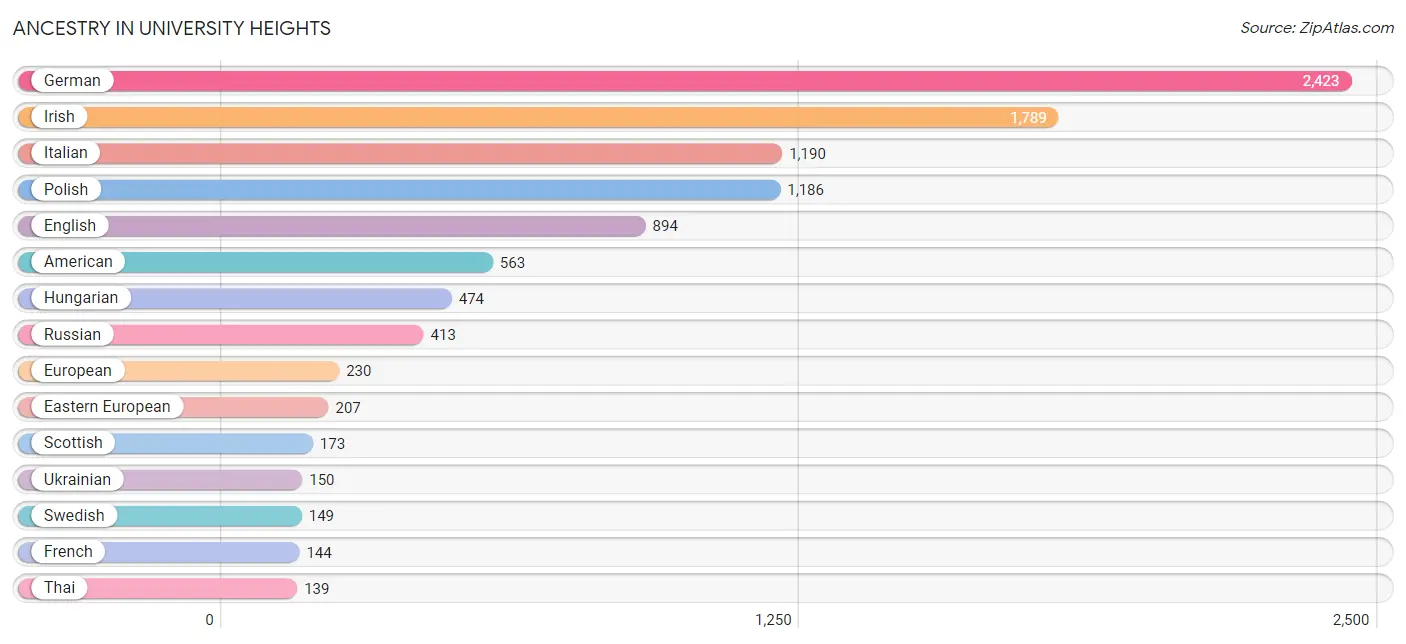
Ancestry in University Heights
The most populous ancestries reported in University Heights are German (2,423 | 17.7%), Irish (1,789 | 13.1%), Italian (1,190 | 8.7%), Polish (1,186 | 8.7%), and English (894 | 6.6%), together accounting for 54.8% of all University Heights residents.
| Ancestry | # Population | % Population |
| African | 77 | 0.6% |
| American | 563 | 4.1% |
| Arab | 53 | 0.4% |
| Argentinean | 43 | 0.3% |
| Armenian | 35 | 0.3% |
| Austrian | 59 | 0.4% |
| Belgian | 5 | 0.0% |
| Belizean | 6 | 0.0% |
| Bermudan | 11 | 0.1% |
| Bhutanese | 67 | 0.5% |
| Brazilian | 26 | 0.2% |
| British | 42 | 0.3% |
| British West Indian | 5 | 0.0% |
| Burmese | 28 | 0.2% |
| Cambodian | 6 | 0.0% |
| Canadian | 9 | 0.1% |
| Central American | 18 | 0.1% |
| Cherokee | 12 | 0.1% |
| Chickasaw | 5 | 0.0% |
| Chippewa | 3 | 0.0% |
| Croatian | 62 | 0.4% |
| Cuban | 9 | 0.1% |
| Cypriot | 16 | 0.1% |
| Czech | 99 | 0.7% |
| Czechoslovakian | 39 | 0.3% |
| Danish | 19 | 0.1% |
| Dutch | 71 | 0.5% |
| Eastern European | 207 | 1.5% |
| English | 894 | 6.6% |
| Ethiopian | 8 | 0.1% |
| European | 230 | 1.7% |
| Filipino | 4 | 0.0% |
| Finnish | 27 | 0.2% |
| French | 144 | 1.1% |
| French Canadian | 20 | 0.2% |
| German | 2,423 | 17.7% |
| Greek | 126 | 0.9% |
| Honduran | 5 | 0.0% |
| Hungarian | 474 | 3.5% |
| Indian (Asian) | 60 | 0.4% |
| Iranian | 16 | 0.1% |
| Irish | 1,789 | 13.1% |
| Israeli | 60 | 0.4% |
| Italian | 1,190 | 8.7% |
| Jamaican | 44 | 0.3% |
| Korean | 21 | 0.2% |
| Lebanese | 41 | 0.3% |
| Liberian | 5 | 0.0% |
| Lithuanian | 31 | 0.2% |
| Mexican | 79 | 0.6% |
| Mexican American Indian | 17 | 0.1% |
| Native Hawaiian | 31 | 0.2% |
| Northern European | 6 | 0.0% |
| Norwegian | 124 | 0.9% |
| Palestinian | 5 | 0.0% |
| Panamanian | 13 | 0.1% |
| Peruvian | 14 | 0.1% |
| Polish | 1,186 | 8.7% |
| Portuguese | 5 | 0.0% |
| Puerto Rican | 110 | 0.8% |
| Romanian | 69 | 0.5% |
| Russian | 413 | 3.0% |
| Scandinavian | 15 | 0.1% |
| Scotch-Irish | 85 | 0.6% |
| Scottish | 173 | 1.3% |
| Serbian | 9 | 0.1% |
| Sierra Leonean | 29 | 0.2% |
| Slavic | 5 | 0.0% |
| Slovak | 115 | 0.8% |
| Slovene | 73 | 0.5% |
| South American | 57 | 0.4% |
| South American Indian | 6 | 0.0% |
| Spaniard | 3 | 0.0% |
| Sri Lankan | 43 | 0.3% |
| Subsaharan African | 118 | 0.9% |
| Swedish | 149 | 1.1% |
| Swiss | 36 | 0.3% |
| Thai | 139 | 1.0% |
| Turkish | 18 | 0.1% |
| Ukrainian | 150 | 1.1% |
| Welsh | 46 | 0.3% |
| Yugoslavian | 8 | 0.1% | View All 82 Rows |
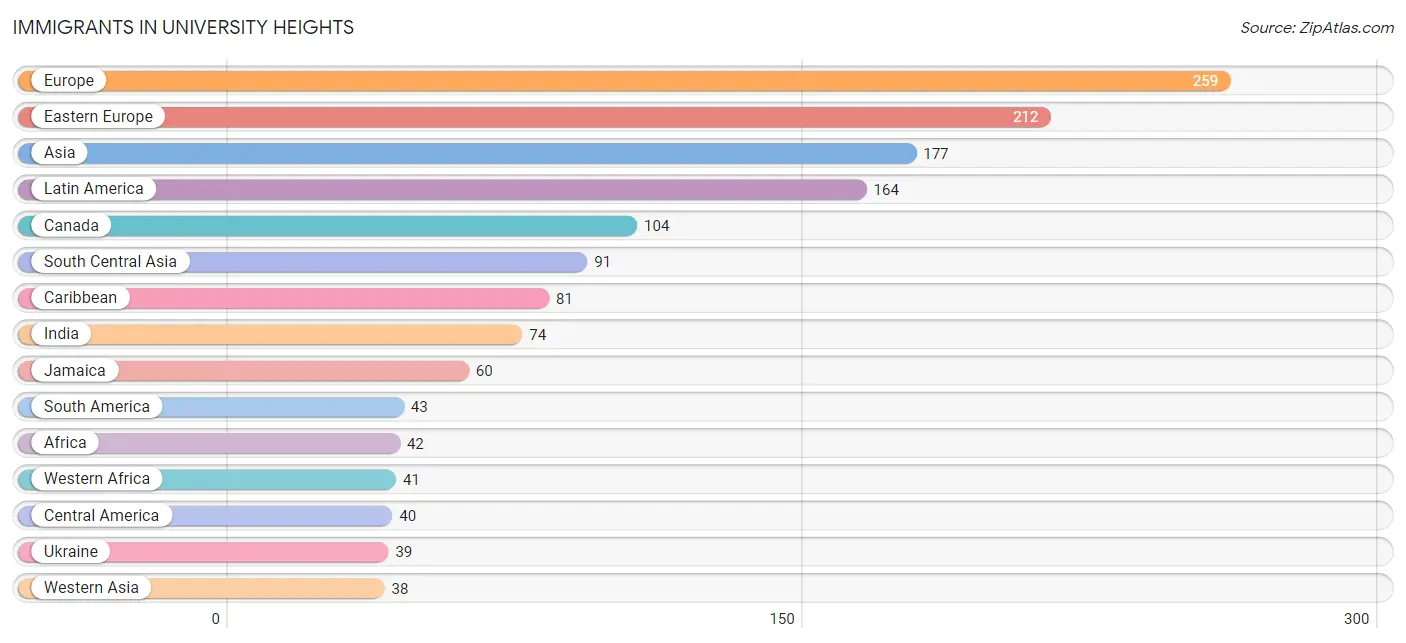
Immigrants in University Heights
The most numerous immigrant groups reported in University Heights came from Europe (259 | 1.9%), Eastern Europe (212 | 1.5%), Asia (177 | 1.3%), Latin America (164 | 1.2%), and Canada (104 | 0.8%), together accounting for 6.7% of all University Heights residents.
| Immigration Origin | # Population | % Population |
| Africa | 42 | 0.3% |
| Albania | 7 | 0.1% |
| Asia | 177 | 1.3% |
| Austria | 9 | 0.1% |
| Belarus | 11 | 0.1% |
| Belize | 10 | 0.1% |
| Brazil | 25 | 0.2% |
| Canada | 104 | 0.8% |
| Caribbean | 81 | 0.6% |
| Central America | 40 | 0.3% |
| China | 21 | 0.2% |
| Cuba | 21 | 0.2% |
| Czechoslovakia | 15 | 0.1% |
| Eastern Africa | 1 | 0.0% |
| Eastern Asia | 35 | 0.3% |
| Eastern Europe | 212 | 1.5% |
| England | 8 | 0.1% |
| Ethiopia | 1 | 0.0% |
| Europe | 259 | 1.9% |
| Germany | 4 | 0.0% |
| Hungary | 11 | 0.1% |
| India | 74 | 0.5% |
| Israel | 9 | 0.1% |
| Italy | 23 | 0.2% |
| Jamaica | 60 | 0.4% |
| Japan | 7 | 0.1% |
| Korea | 7 | 0.1% |
| Latin America | 164 | 1.2% |
| Lebanon | 29 | 0.2% |
| Liberia | 3 | 0.0% |
| Mexico | 17 | 0.1% |
| Nepal | 7 | 0.1% |
| Netherlands | 3 | 0.0% |
| Northern Europe | 8 | 0.1% |
| Pakistan | 10 | 0.1% |
| Panama | 13 | 0.1% |
| Peru | 18 | 0.1% |
| Philippines | 5 | 0.0% |
| Poland | 3 | 0.0% |
| Romania | 20 | 0.2% |
| Russia | 30 | 0.2% |
| Senegal | 17 | 0.1% |
| South America | 43 | 0.3% |
| South Central Asia | 91 | 0.7% |
| South Eastern Asia | 13 | 0.1% |
| Southern Europe | 23 | 0.2% |
| Ukraine | 39 | 0.3% |
| Vietnam | 8 | 0.1% |
| Western Africa | 41 | 0.3% |
| Western Asia | 38 | 0.3% |
| Western Europe | 16 | 0.1% | View All 51 Rows |
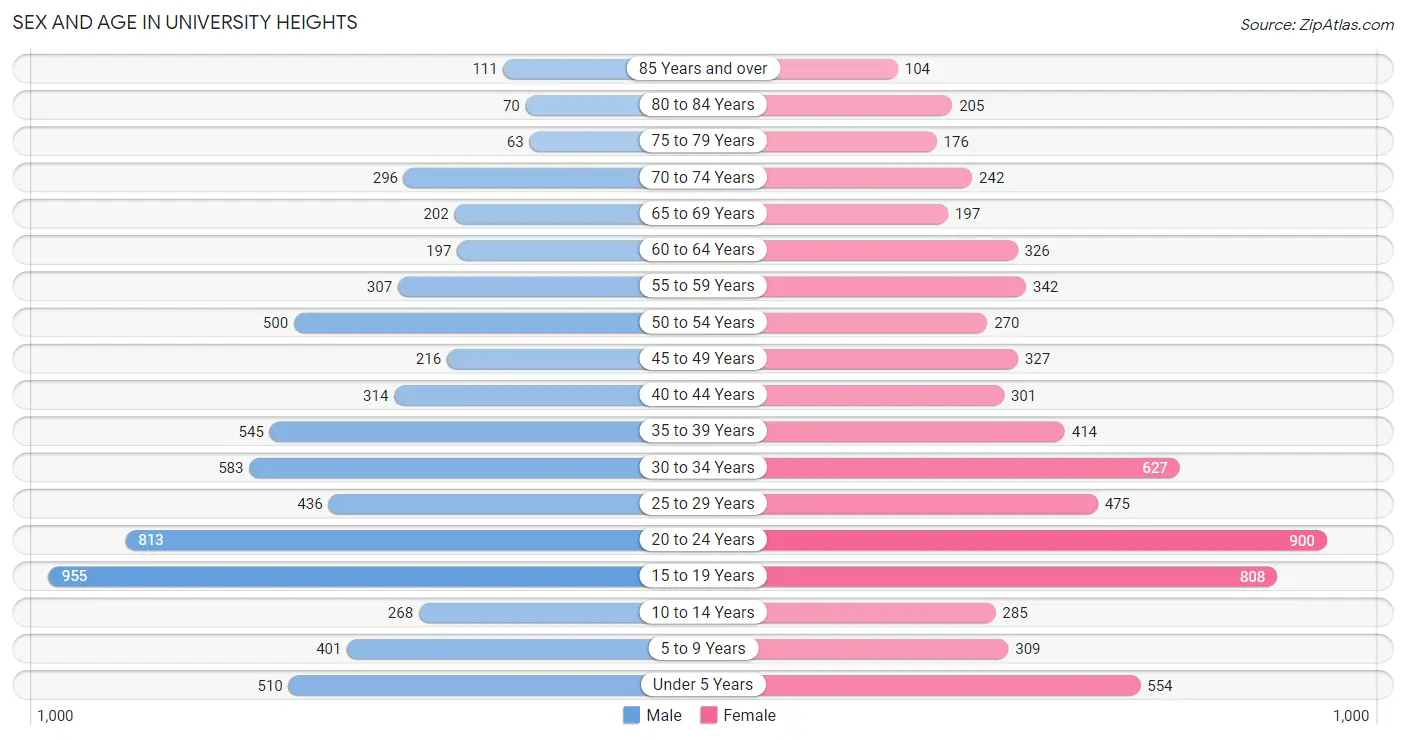
Sex and Age in University Heights
Sex and Age in University Heights
The most populous age groups in University Heights are 15 to 19 Years (955 | 14.1%) for men and 20 to 24 Years (900 | 13.1%) for women.
| Age Bracket | Male | Female |
| Under 5 Years | 510 (7.5%) | 554 (8.1%) |
| 5 to 9 Years | 401 (5.9%) | 309 (4.5%) |
| 10 to 14 Years | 268 (4.0%) | 285 (4.2%) |
| 15 to 19 Years | 955 (14.1%) | 808 (11.8%) |
| 20 to 24 Years | 813 (12.0%) | 900 (13.1%) |
| 25 to 29 Years | 436 (6.4%) | 475 (6.9%) |
| 30 to 34 Years | 583 (8.6%) | 627 (9.1%) |
| 35 to 39 Years | 545 (8.0%) | 414 (6.0%) |
| 40 to 44 Years | 314 (4.6%) | 301 (4.4%) |
| 45 to 49 Years | 216 (3.2%) | 327 (4.8%) |
| 50 to 54 Years | 500 (7.4%) | 270 (3.9%) |
| 55 to 59 Years | 307 (4.5%) | 342 (5.0%) |
| 60 to 64 Years | 197 (2.9%) | 326 (4.8%) |
| 65 to 69 Years | 202 (3.0%) | 197 (2.9%) |
| 70 to 74 Years | 296 (4.4%) | 242 (3.5%) |
| 75 to 79 Years | 63 (0.9%) | 176 (2.6%) |
| 80 to 84 Years | 70 (1.0%) | 205 (3.0%) |
| 85 Years and over | 111 (1.6%) | 104 (1.5%) |
| Total | 6,787 (100.0%) | 6,862 (100.0%) |
Families and Households in University Heights
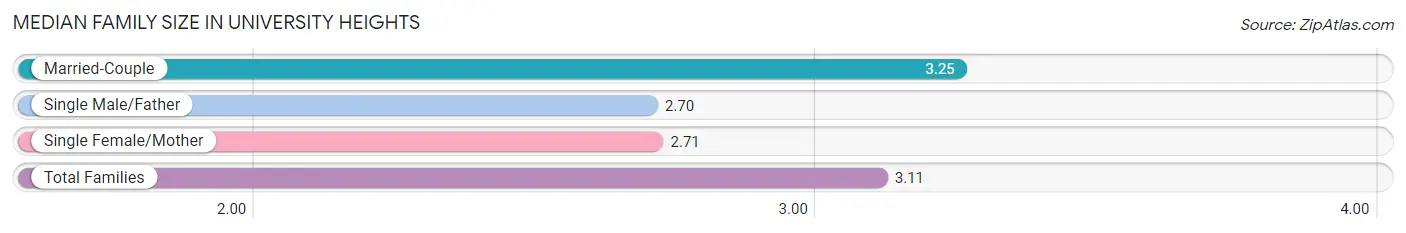
Median Family Size in University Heights
The median family size in University Heights is 3.11 persons per family, with married-couple families (2,292 | 74.8%) accounting for the largest median family size of 3.25 persons per family. On the other hand, single male/father families (181 | 5.9%) represent the smallest median family size with 2.70 persons per family.
| Family Type | # Families | Family Size |
| Married-Couple | 2,292 (74.8%) | 3.25 |
| Single Male/Father | 181 (5.9%) | 2.70 |
| Single Female/Mother | 593 (19.3%) | 2.71 |
| Total Families | 3,066 (100.0%) | 3.11 |
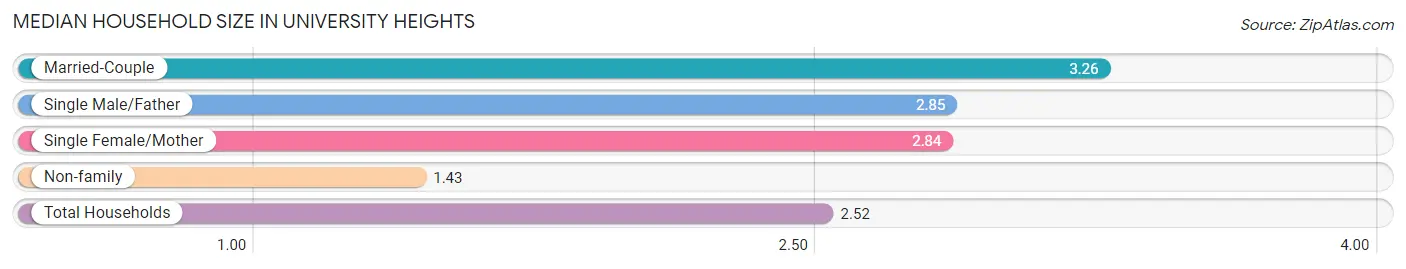
Median Household Size in University Heights
The median household size in University Heights is 2.52 persons per household, with married-couple households (2,292 | 47.2%) accounting for the largest median household size of 3.26 persons per household. non-family households (1,785 | 36.8%) represent the smallest median household size with 1.43 persons per household.
| Household Type | # Households | Household Size |
| Married-Couple | 2,292 (47.2%) | 3.26 |
| Single Male/Father | 181 (3.7%) | 2.85 |
| Single Female/Mother | 593 (12.2%) | 2.84 |
| Non-family | 1,785 (36.8%) | 1.43 |
| Total Households | 4,851 (100.0%) | 2.52 |
Household Size by Marriage Status in University Heights
Out of a total of 4,851 households in University Heights, 3,066 (63.2%) are family households, while 1,785 (36.8%) are nonfamily households. The most numerous type of family households are 2-person households, comprising 1,512, and the most common type of nonfamily households are 1-person households, comprising 1,337.
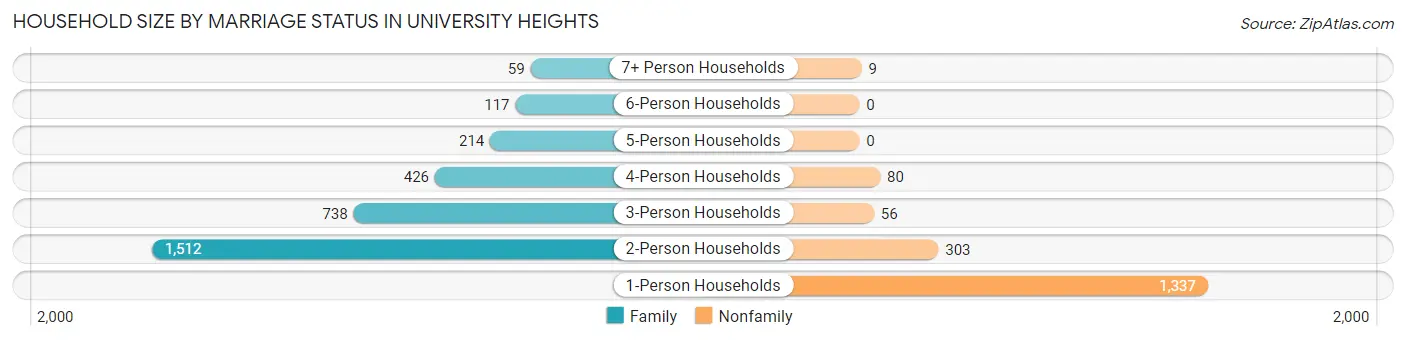
| Household Size | Family Households | Nonfamily Households |
| 1-Person Households | - | 1,337 (27.6%) |
| 2-Person Households | 1,512 (31.2%) | 303 (6.2%) |
| 3-Person Households | 738 (15.2%) | 56 (1.1%) |
| 4-Person Households | 426 (8.8%) | 80 (1.7%) |
| 5-Person Households | 214 (4.4%) | 0 (0.0%) |
| 6-Person Households | 117 (2.4%) | 0 (0.0%) |
| 7+ Person Households | 59 (1.2%) | 9 (0.2%) |
| Total | 3,066 (63.2%) | 1,785 (36.8%) |
Female Fertility in University Heights
Fertility by Age in University Heights
Average fertility rate in University Heights is 53.0 births per 1,000 women. Women in the age bracket of 20 to 34 years have the highest fertility rate with 74.0 births per 1,000 women. Women in the age bracket of 20 to 34 years acount for 72.3% of all women with births.
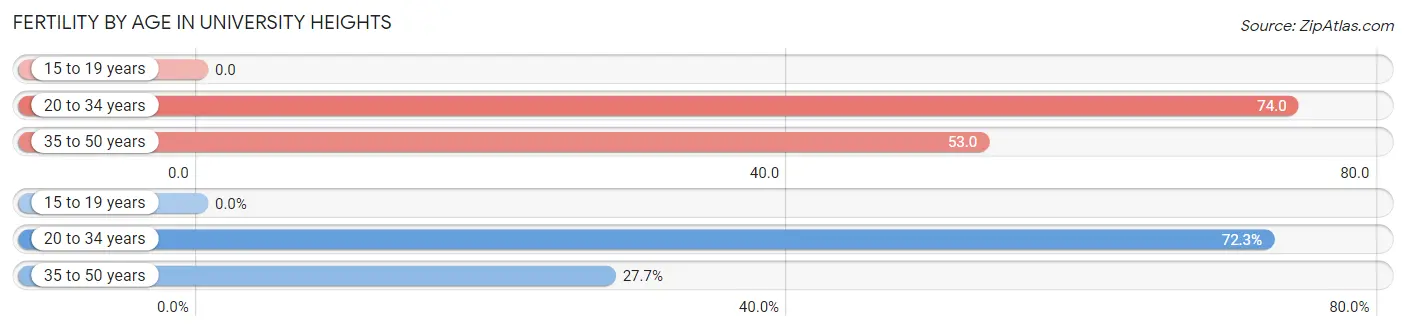
| Age Bracket | Women with Births | Births / 1,000 Women |
| 15 to 19 years | 0 (0.0%) | 0.0 |
| 20 to 34 years | 149 (72.3%) | 74.0 |
| 35 to 50 years | 57 (27.7%) | 53.0 |
| Total | 206 (100.0%) | 53.0 |
Fertility by Age by Marriage Status in University Heights
90.8% of women with births (206) in University Heights are married. The highest percentage of unmarried women with births falls into 20 to 34 years age bracket with 12.8% of them unmarried at the time of birth, while the lowest percentage of unmarried women with births belong to 35 to 50 years age bracket with 0.0% of them unmarried.
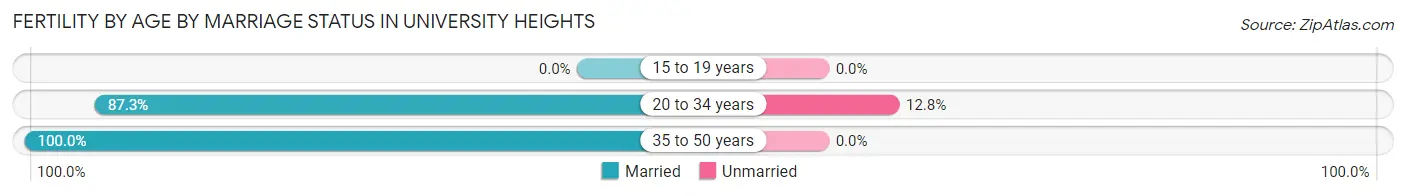
| Age Bracket | Married | Unmarried |
| 15 to 19 years | 0 (0.0%) | 0 (0.0%) |
| 20 to 34 years | 130 (87.3%) | 19 (12.8%) |
| 35 to 50 years | 57 (100.0%) | 0 (0.0%) |
| Total | 187 (90.8%) | 19 (9.2%) |
Fertility by Education in University Heights
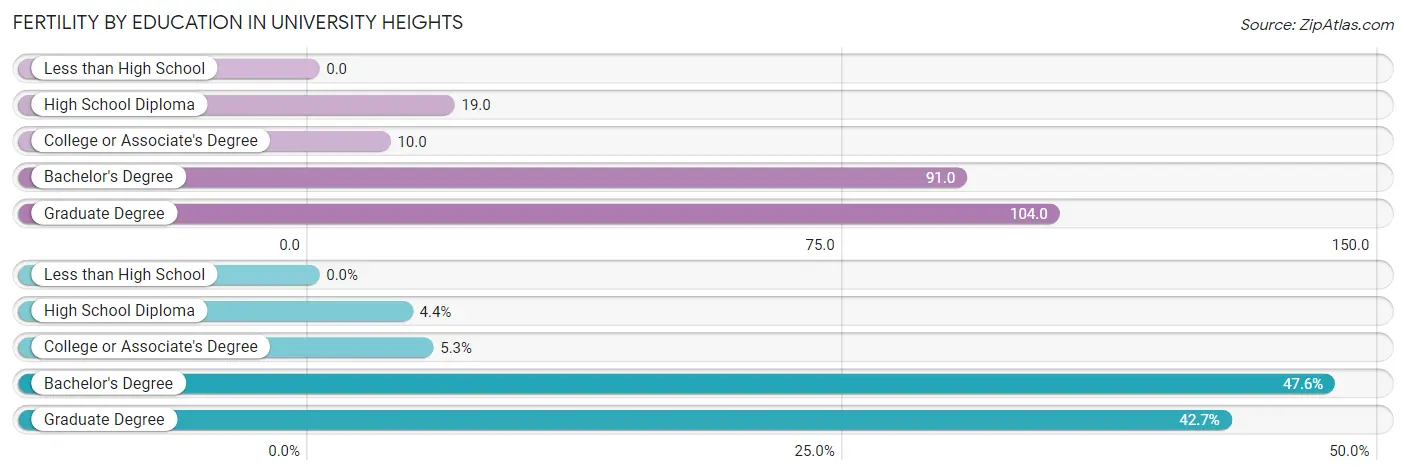
| Educational Attainment | Women with Births | Births / 1,000 Women |
| Less than High School | 0 (0.0%) | 0.0 |
| High School Diploma | 9 (4.4%) | 19.0 |
| College or Associate's Degree | 11 (5.3%) | 10.0 |
| Bachelor's Degree | 98 (47.6%) | 91.0 |
| Graduate Degree | 88 (42.7%) | 104.0 |
| Total | 206 (100.0%) | 53.0 |
Fertility by Education by Marriage Status in University Heights
9.2% of women with births in University Heights are unmarried. Women with the educational attainment of high school diploma are most likely to be married with 100.0% of them married at childbirth, while women with the educational attainment of college or associate's degree are least likely to be married with 100.0% of them unmarried at childbirth.
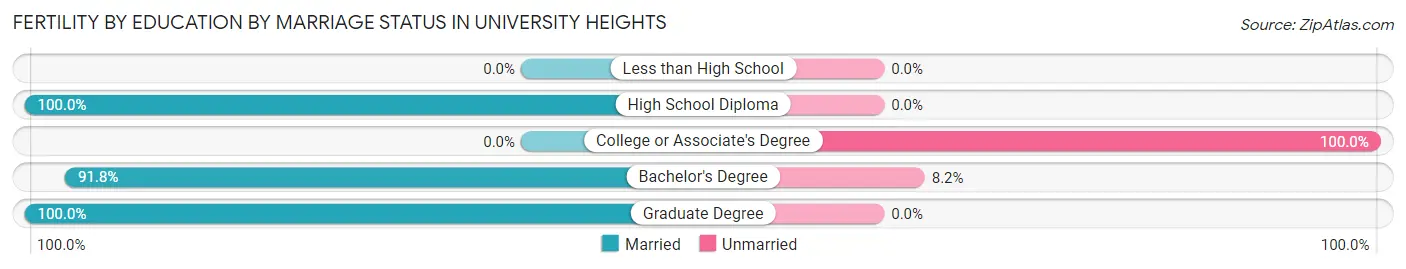
| Educational Attainment | Married | Unmarried |
| Less than High School | 0 (0.0%) | 0 (0.0%) |
| High School Diploma | 9 (100.0%) | 0 (0.0%) |
| College or Associate's Degree | 0 (0.0%) | 11 (100.0%) |
| Bachelor's Degree | 90 (91.8%) | 8 (8.2%) |
| Graduate Degree | 88 (100.0%) | 0 (0.0%) |
| Total | 187 (90.8%) | 19 (9.2%) |
Employment Characteristics in University Heights
Employment by Class of Employer in University Heights
Among the 6,984 employed individuals in University Heights, private company employees (4,064 | 58.2%), not-for-profit organizations (1,771 | 25.4%), and local government employees (376 | 5.4%) make up the most common classes of employment.
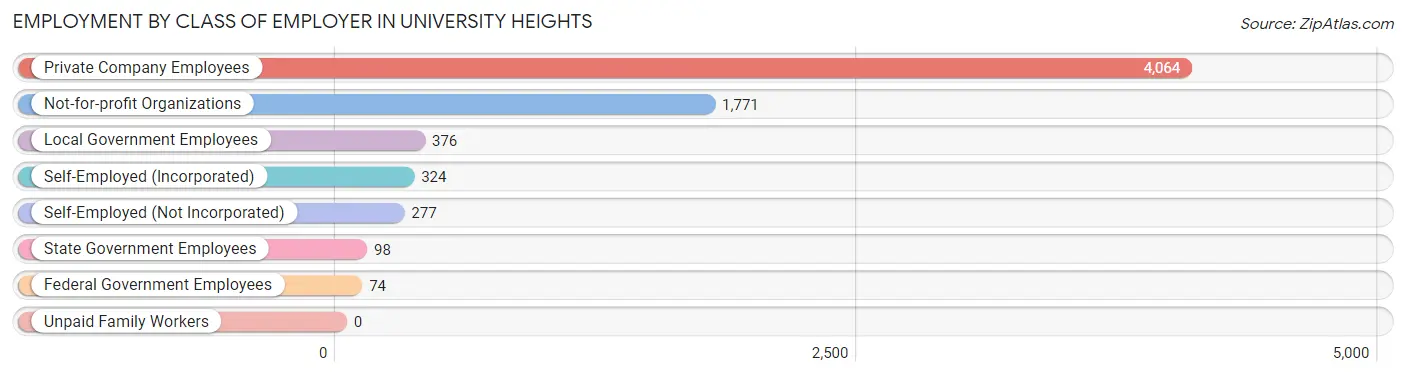
| Employer Class | # Employees | % Employees |
| Private Company Employees | 4,064 | 58.2% |
| Self-Employed (Incorporated) | 324 | 4.6% |
| Self-Employed (Not Incorporated) | 277 | 4.0% |
| Not-for-profit Organizations | 1,771 | 25.4% |
| Local Government Employees | 376 | 5.4% |
| State Government Employees | 98 | 1.4% |
| Federal Government Employees | 74 | 1.1% |
| Unpaid Family Workers | 0 | 0.0% |
| Total | 6,984 | 100.0% |
Employment Status by Age in University Heights
According to the labor force statistics for University Heights, out of the total population over 16 years of age (11,057), 69.1% or 7,640 individuals are in the labor force, with 5.5% or 420 of them unemployed. The age group with the highest labor force participation rate is 25 to 29 years, with 89.6% or 816 individuals in the labor force. Within the labor force, the 16 to 19 years age range has the highest percentage of unemployed individuals, with 23.4% or 146 of them being unemployed.
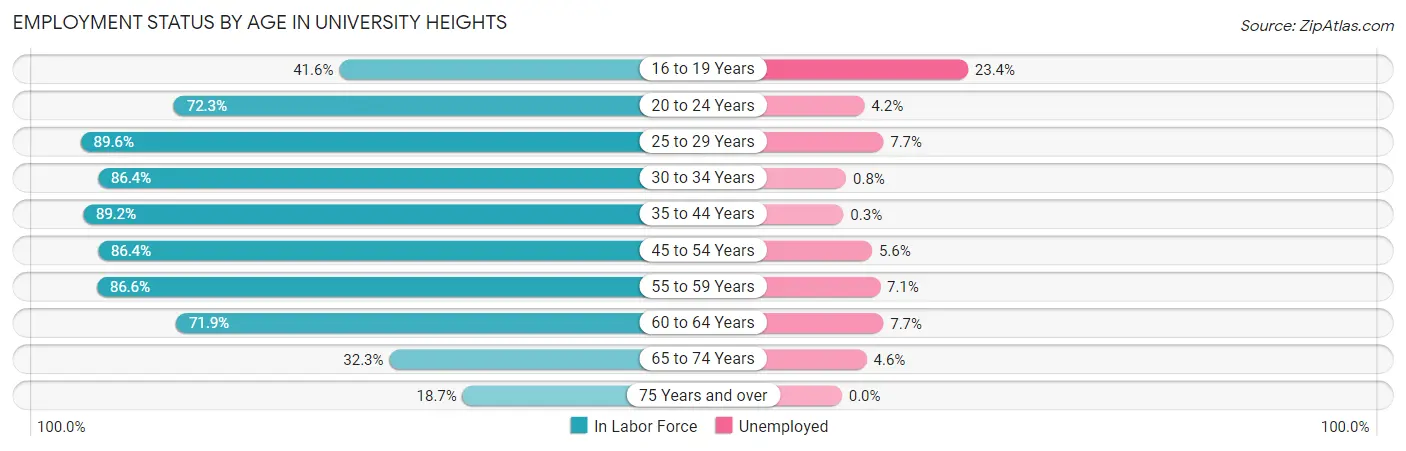
| Age Bracket | In Labor Force | Unemployed |
| 16 to 19 Years | 623 (41.6%) | 146 (23.4%) |
| 20 to 24 Years | 1,238 (72.3%) | 52 (4.2%) |
| 25 to 29 Years | 816 (89.6%) | 63 (7.7%) |
| 30 to 34 Years | 1,045 (86.4%) | 8 (0.8%) |
| 35 to 44 Years | 1,404 (89.2%) | 4 (0.3%) |
| 45 to 54 Years | 1,134 (86.4%) | 64 (5.6%) |
| 55 to 59 Years | 562 (86.6%) | 40 (7.1%) |
| 60 to 64 Years | 376 (71.9%) | 29 (7.7%) |
| 65 to 74 Years | 303 (32.3%) | 14 (4.6%) |
| 75 Years and over | 136 (18.7%) | 0 (0.0%) |
| Total | 7,640 (69.1%) | 420 (5.5%) |
Employment Status by Educational Attainment in University Heights
According to labor force statistics for University Heights, 86.4% of individuals (5,340) out of the total population between 25 and 64 years of age (6,180) are in the labor force, with 3.9% or 208 of them being unemployed. The group with the highest labor force participation rate are those with the educational attainment of bachelor's degree or higher, with 90.4% or 3,693 individuals in the labor force. Within the labor force, individuals with high school diploma education have the highest percentage of unemployment, with 6.5% or 30 of them being unemployed.
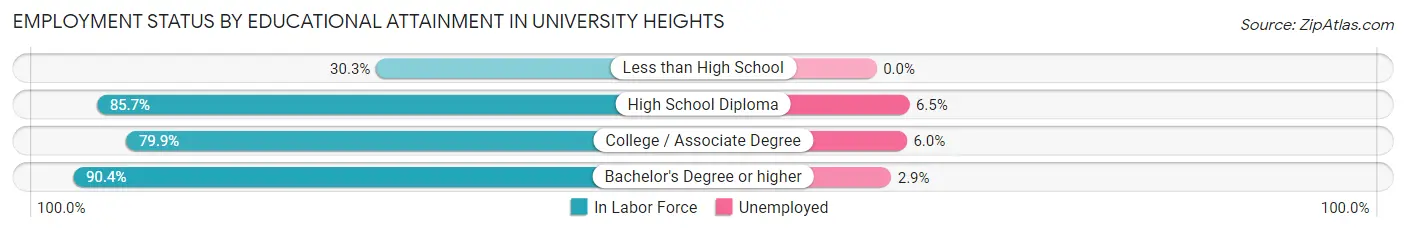
| Educational Attainment | In Labor Force | Unemployed |
| Less than High School | 37 (30.3%) | 0 (0.0%) |
| High School Diploma | 460 (85.7%) | 35 (6.5%) |
| College / Associate Degree | 1,147 (79.9%) | 86 (6.0%) |
| Bachelor's Degree or higher | 3,693 (90.4%) | 118 (2.9%) |
| Total | 5,340 (86.4%) | 241 (3.9%) |
Employment Occupations by Sex in University Heights
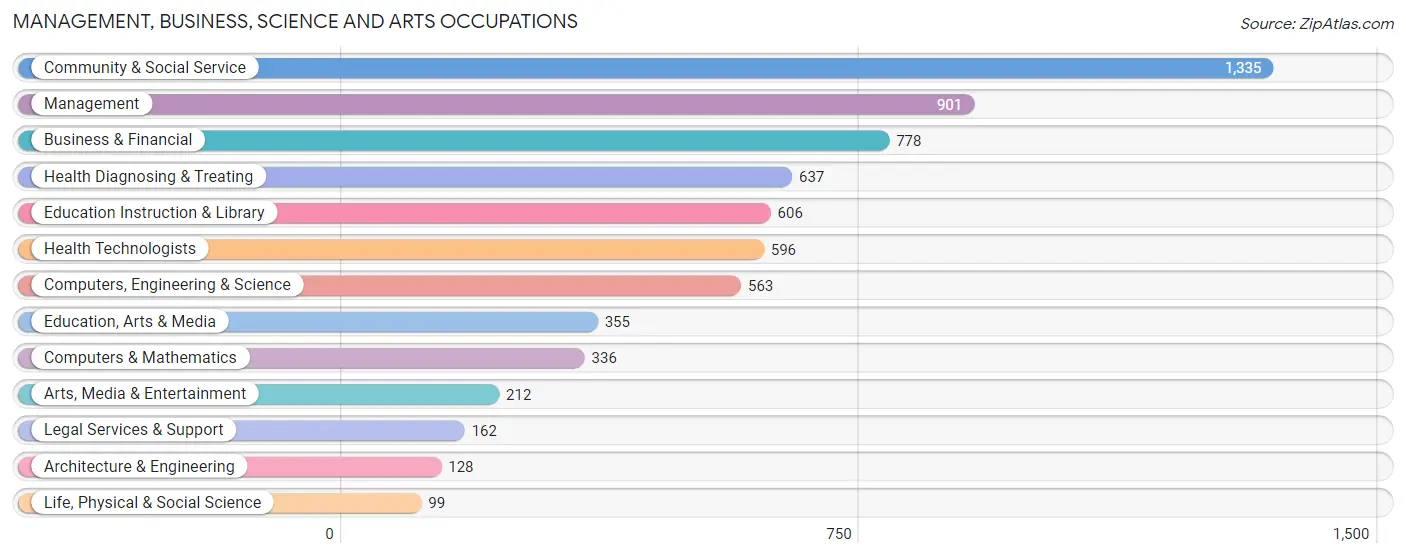
Management, Business, Science and Arts Occupations
The most common Management, Business, Science and Arts occupations in University Heights are Community & Social Service (1,335 | 18.5%), Management (901 | 12.5%), Business & Financial (778 | 10.8%), Health Diagnosing & Treating (637 | 8.8%), and Education Instruction & Library (606 | 8.4%).
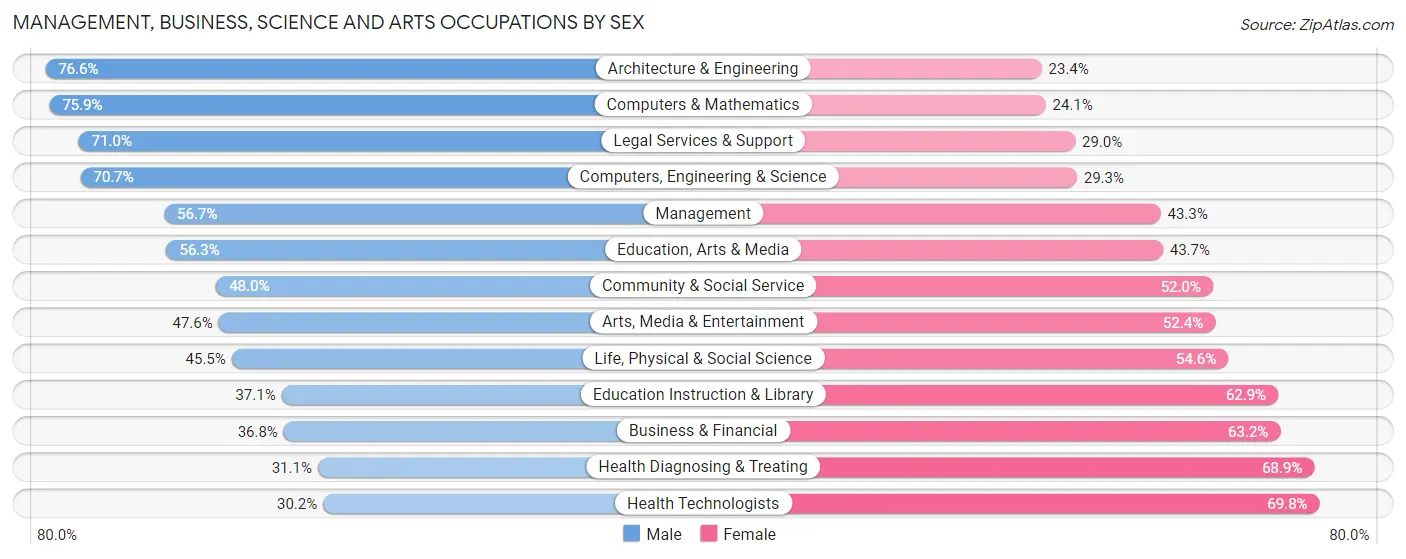
Management, Business, Science and Arts Occupations by Sex
Within the Management, Business, Science and Arts occupations in University Heights, the most male-oriented occupations are Architecture & Engineering (76.6%), Computers & Mathematics (75.9%), and Legal Services & Support (71.0%), while the most female-oriented occupations are Health Technologists (69.8%), Health Diagnosing & Treating (68.9%), and Business & Financial (63.2%).
| Occupation | Male | Female |
| Management | 511 (56.7%) | 390 (43.3%) |
| Business & Financial | 286 (36.8%) | 492 (63.2%) |
| Computers, Engineering & Science | 398 (70.7%) | 165 (29.3%) |
| Computers & Mathematics | 255 (75.9%) | 81 (24.1%) |
| Architecture & Engineering | 98 (76.6%) | 30 (23.4%) |
| Life, Physical & Social Science | 45 (45.5%) | 54 (54.5%) |
| Community & Social Service | 641 (48.0%) | 694 (52.0%) |
| Education, Arts & Media | 200 (56.3%) | 155 (43.7%) |
| Legal Services & Support | 115 (71.0%) | 47 (29.0%) |
| Education Instruction & Library | 225 (37.1%) | 381 (62.9%) |
| Arts, Media & Entertainment | 101 (47.6%) | 111 (52.4%) |
| Health Diagnosing & Treating | 198 (31.1%) | 439 (68.9%) |
| Health Technologists | 180 (30.2%) | 416 (69.8%) |
| Total (Category) | 2,034 (48.3%) | 2,180 (51.7%) |
| Total (Overall) | 3,690 (51.1%) | 3,530 (48.9%) |
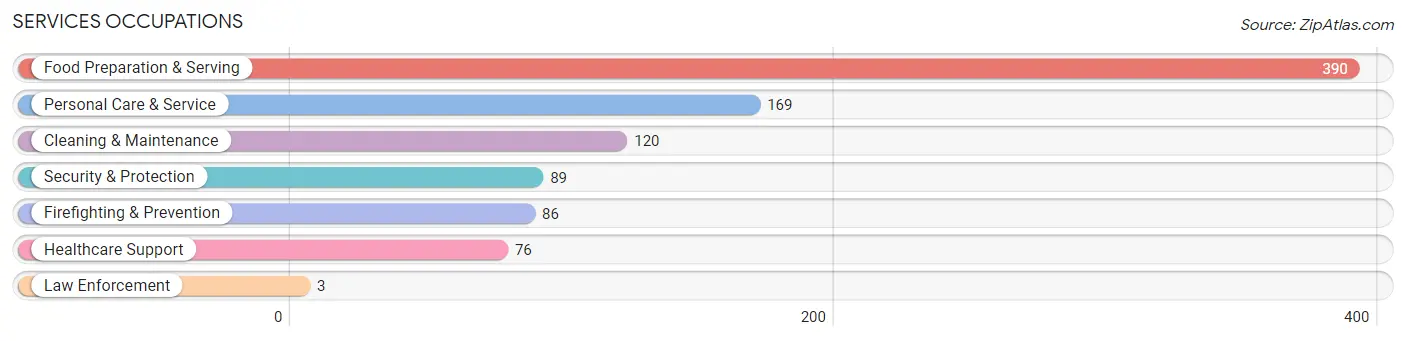
Services Occupations
The most common Services occupations in University Heights are Food Preparation & Serving (390 | 5.4%), Personal Care & Service (169 | 2.3%), Cleaning & Maintenance (120 | 1.7%), Security & Protection (89 | 1.2%), and Firefighting & Prevention (86 | 1.2%).
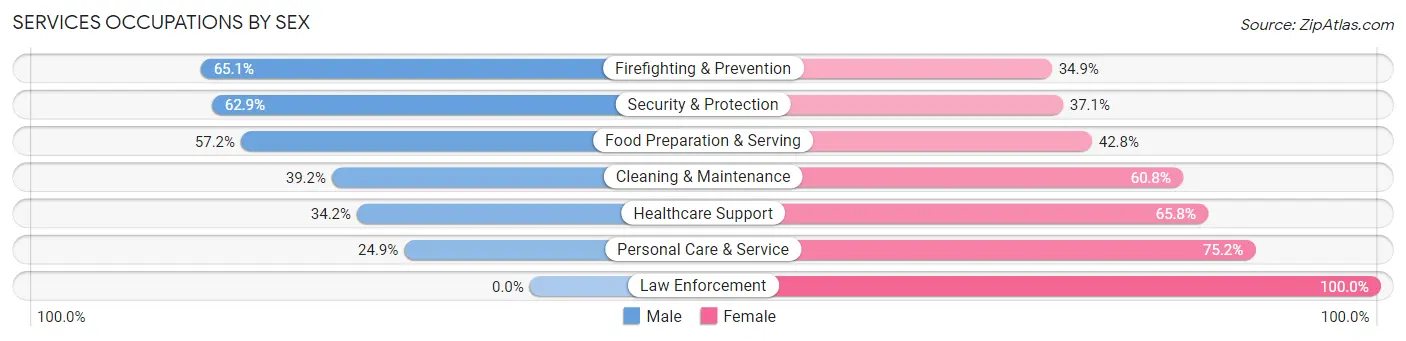
Services Occupations by Sex
Within the Services occupations in University Heights, the most male-oriented occupations are Firefighting & Prevention (65.1%), Security & Protection (62.9%), and Food Preparation & Serving (57.2%), while the most female-oriented occupations are Law Enforcement (100.0%), Personal Care & Service (75.1%), and Healthcare Support (65.8%).
| Occupation | Male | Female |
| Healthcare Support | 26 (34.2%) | 50 (65.8%) |
| Security & Protection | 56 (62.9%) | 33 (37.1%) |
| Firefighting & Prevention | 56 (65.1%) | 30 (34.9%) |
| Law Enforcement | 0 (0.0%) | 3 (100.0%) |
| Food Preparation & Serving | 223 (57.2%) | 167 (42.8%) |
| Cleaning & Maintenance | 47 (39.2%) | 73 (60.8%) |
| Personal Care & Service | 42 (24.8%) | 127 (75.1%) |
| Total (Category) | 394 (46.7%) | 450 (53.3%) |
| Total (Overall) | 3,690 (51.1%) | 3,530 (48.9%) |
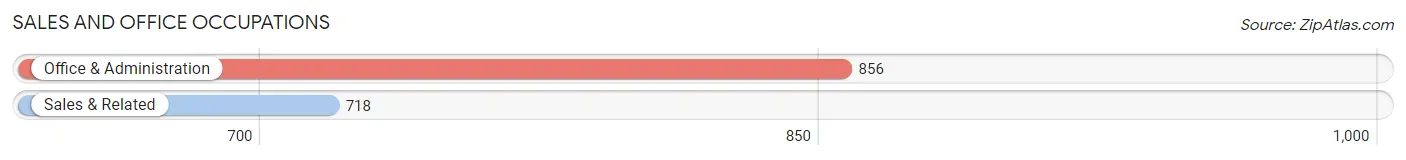
Sales and Office Occupations
The most common Sales and Office occupations in University Heights are Office & Administration (856 | 11.9%), and Sales & Related (718 | 9.9%).
Sales and Office Occupations by Sex
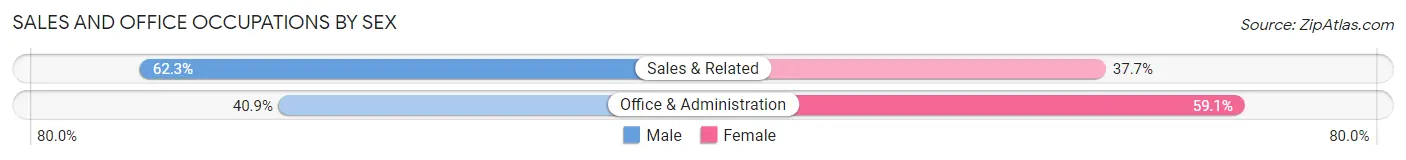
| Occupation | Male | Female |
| Sales & Related | 447 (62.3%) | 271 (37.7%) |
| Office & Administration | 350 (40.9%) | 506 (59.1%) |
| Total (Category) | 797 (50.6%) | 777 (49.4%) |
| Total (Overall) | 3,690 (51.1%) | 3,530 (48.9%) |
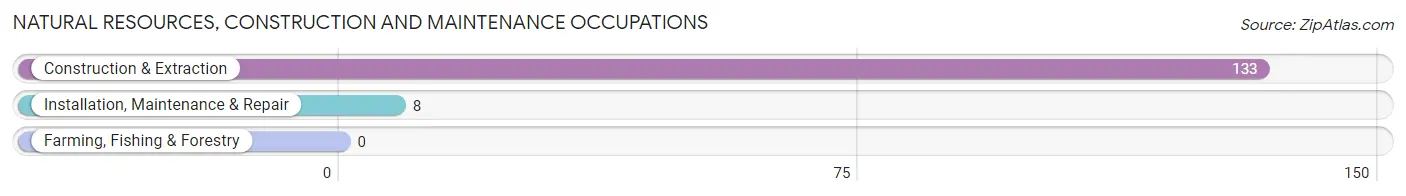
Natural Resources, Construction and Maintenance Occupations
The most common Natural Resources, Construction and Maintenance occupations in University Heights are Construction & Extraction (133 | 1.8%), and Installation, Maintenance & Repair (8 | 0.1%).
Natural Resources, Construction and Maintenance Occupations by Sex
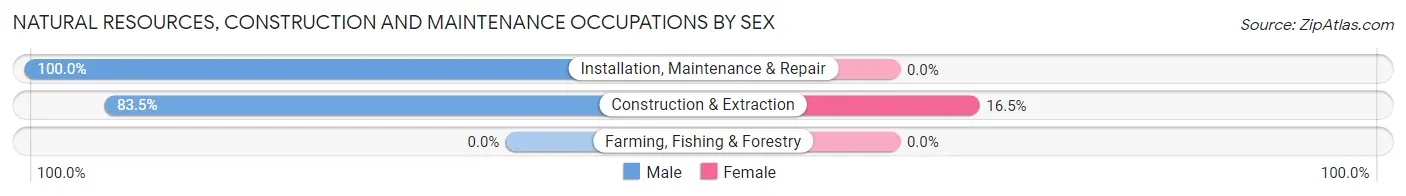
| Occupation | Male | Female |
| Farming, Fishing & Forestry | 0 (0.0%) | 0 (0.0%) |
| Construction & Extraction | 111 (83.5%) | 22 (16.5%) |
| Installation, Maintenance & Repair | 8 (100.0%) | 0 (0.0%) |
| Total (Category) | 119 (84.4%) | 22 (15.6%) |
| Total (Overall) | 3,690 (51.1%) | 3,530 (48.9%) |
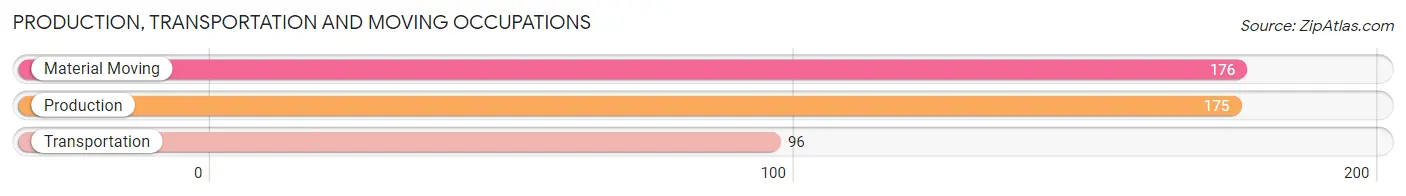
Production, Transportation and Moving Occupations
The most common Production, Transportation and Moving occupations in University Heights are Material Moving (176 | 2.4%), Production (175 | 2.4%), and Transportation (96 | 1.3%).
Production, Transportation and Moving Occupations by Sex
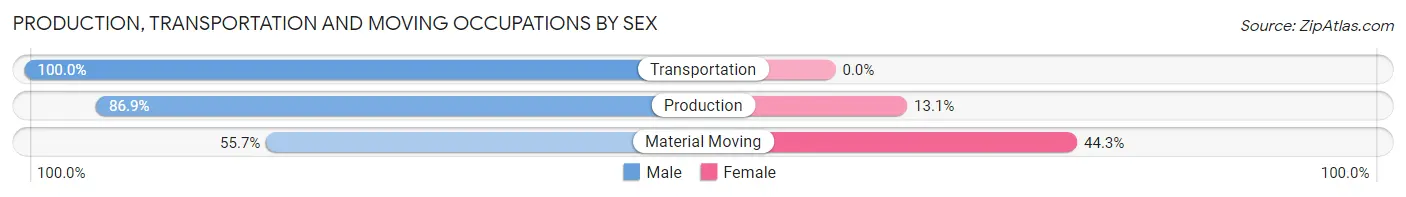
| Occupation | Male | Female |
| Production | 152 (86.9%) | 23 (13.1%) |
| Transportation | 96 (100.0%) | 0 (0.0%) |
| Material Moving | 98 (55.7%) | 78 (44.3%) |
| Total (Category) | 346 (77.4%) | 101 (22.6%) |
| Total (Overall) | 3,690 (51.1%) | 3,530 (48.9%) |
Employment Industries by Sex in University Heights
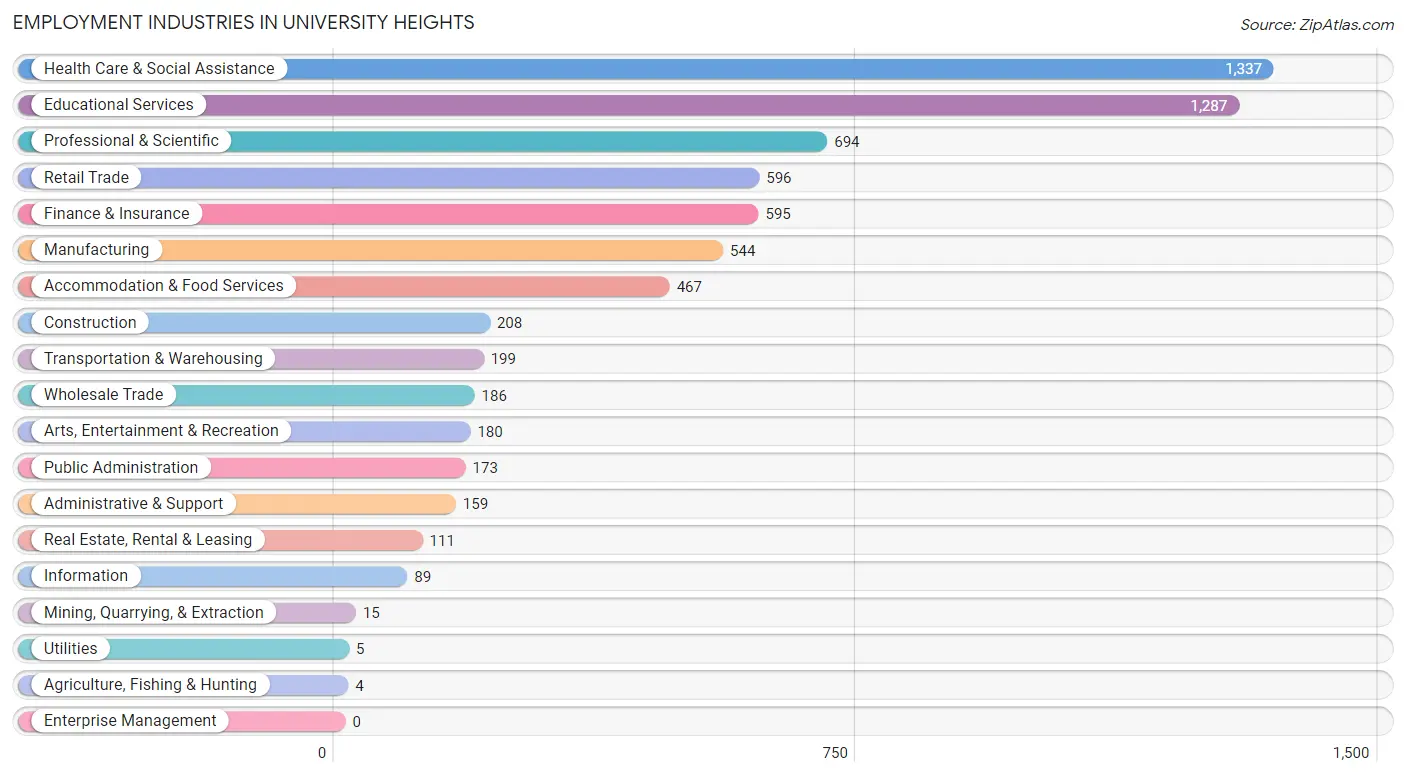
Employment Industries in University Heights
The major employment industries in University Heights include Health Care & Social Assistance (1,337 | 18.5%), Educational Services (1,287 | 17.8%), Professional & Scientific (694 | 9.6%), Retail Trade (596 | 8.3%), and Finance & Insurance (595 | 8.2%).
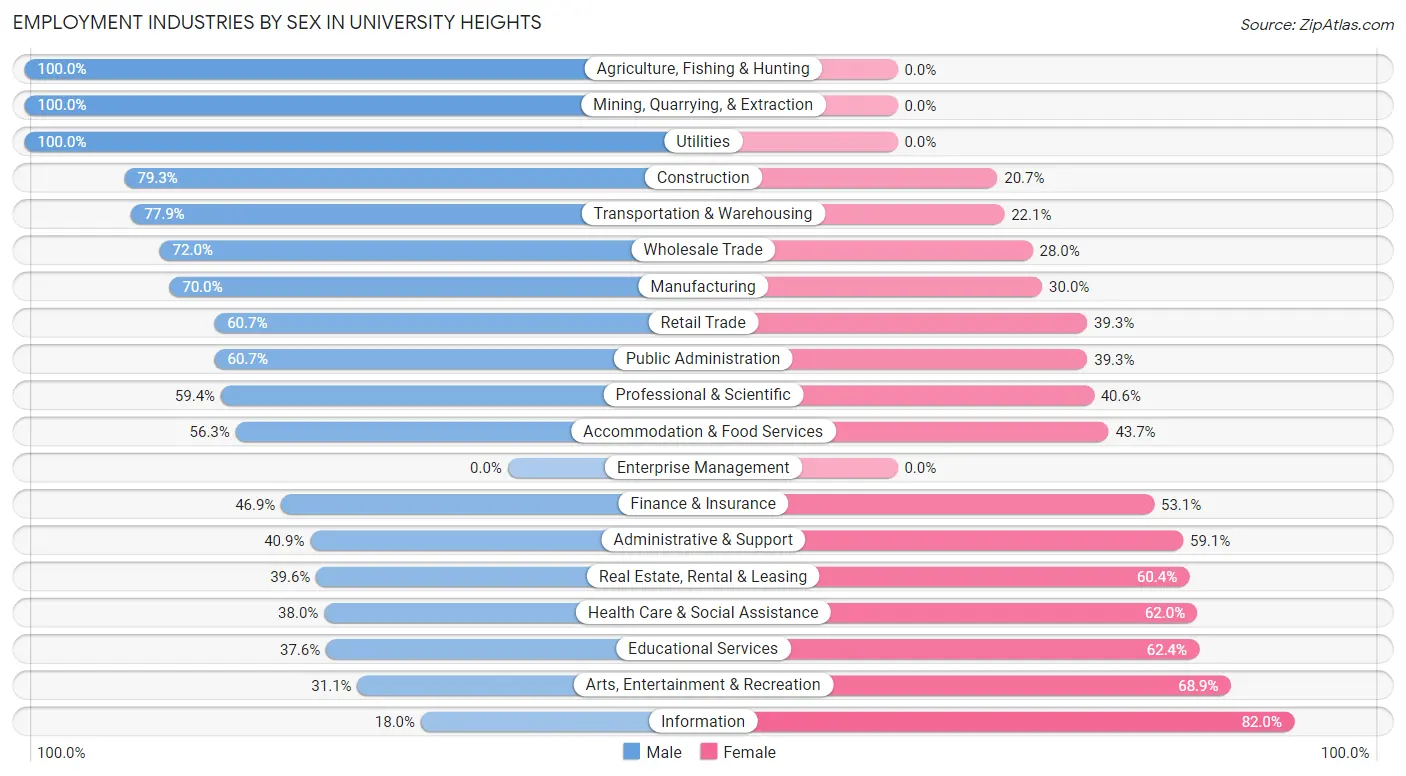
Employment Industries by Sex in University Heights
The University Heights industries that see more men than women are Agriculture, Fishing & Hunting (100.0%), Mining, Quarrying, & Extraction (100.0%), and Utilities (100.0%), whereas the industries that tend to have a higher number of women are Information (82.0%), Arts, Entertainment & Recreation (68.9%), and Educational Services (62.4%).
| Industry | Male | Female |
| Agriculture, Fishing & Hunting | 4 (100.0%) | 0 (0.0%) |
| Mining, Quarrying, & Extraction | 15 (100.0%) | 0 (0.0%) |
| Construction | 165 (79.3%) | 43 (20.7%) |
| Manufacturing | 381 (70.0%) | 163 (30.0%) |
| Wholesale Trade | 134 (72.0%) | 52 (28.0%) |
| Retail Trade | 362 (60.7%) | 234 (39.3%) |
| Transportation & Warehousing | 155 (77.9%) | 44 (22.1%) |
| Utilities | 5 (100.0%) | 0 (0.0%) |
| Information | 16 (18.0%) | 73 (82.0%) |
| Finance & Insurance | 279 (46.9%) | 316 (53.1%) |
| Real Estate, Rental & Leasing | 44 (39.6%) | 67 (60.4%) |
| Professional & Scientific | 412 (59.4%) | 282 (40.6%) |
| Enterprise Management | 0 (0.0%) | 0 (0.0%) |
| Administrative & Support | 65 (40.9%) | 94 (59.1%) |
| Educational Services | 484 (37.6%) | 803 (62.4%) |
| Health Care & Social Assistance | 508 (38.0%) | 829 (62.0%) |
| Arts, Entertainment & Recreation | 56 (31.1%) | 124 (68.9%) |
| Accommodation & Food Services | 263 (56.3%) | 204 (43.7%) |
| Public Administration | 105 (60.7%) | 68 (39.3%) |
| Total | 3,690 (51.1%) | 3,530 (48.9%) |
Education in University Heights
School Enrollment in University Heights
The most common levels of schooling among the 4,966 students in University Heights are college / undergraduate (2,163 | 43.6%), high school (870 | 17.5%), and elementary school (604 | 12.2%).
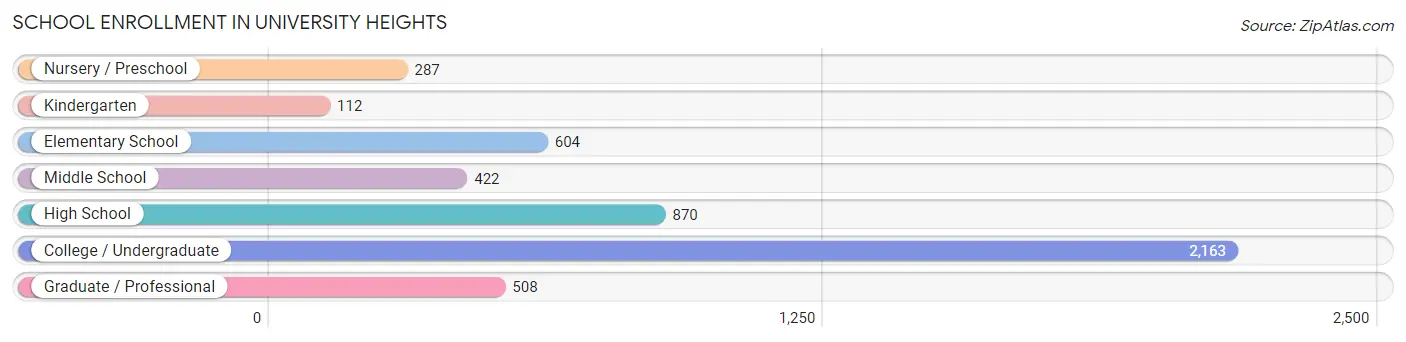
| School Level | # Students | % Students |
| Nursery / Preschool | 287 | 5.8% |
| Kindergarten | 112 | 2.3% |
| Elementary School | 604 | 12.2% |
| Middle School | 422 | 8.5% |
| High School | 870 | 17.5% |
| College / Undergraduate | 2,163 | 43.6% |
| Graduate / Professional | 508 | 10.2% |
| Total | 4,966 | 100.0% |
School Enrollment by Age by Funding Source in University Heights
Out of a total of 4,966 students who are enrolled in schools in University Heights, 3,466 (69.8%) attend a private institution, while the remaining 1,500 (30.2%) are enrolled in public schools. The age group of 3 to 4 year olds has the highest likelihood of being enrolled in private schools, with 223 (87.8% in the age bracket) enrolled. Conversely, the age group of 35 years and over has the lowest likelihood of being enrolled in a private school, with 46 (62.2% in the age bracket) attending a public institution.
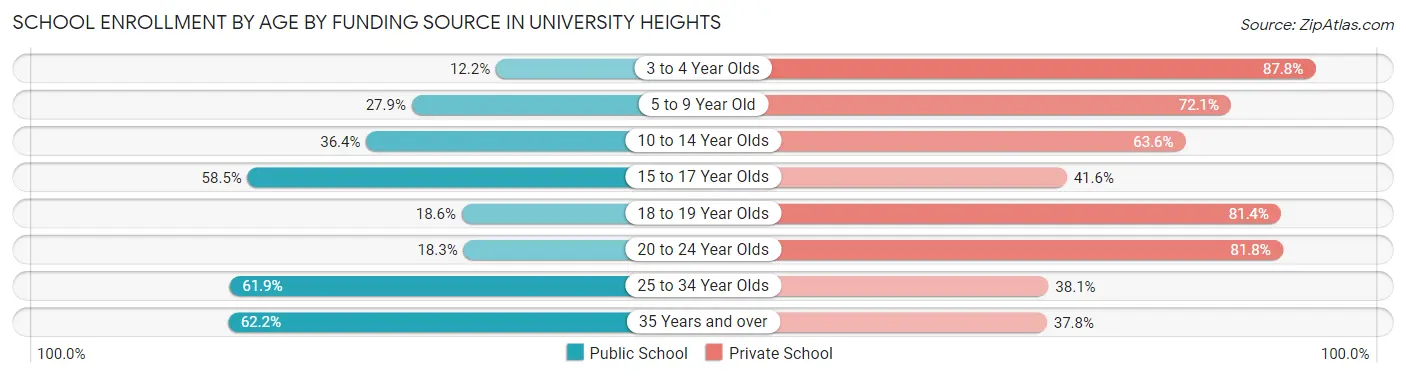
| Age Bracket | Public School | Private School |
| 3 to 4 Year Olds | 31 (12.2%) | 223 (87.8%) |
| 5 to 9 Year Old | 193 (27.9%) | 499 (72.1%) |
| 10 to 14 Year Olds | 188 (36.4%) | 329 (63.6%) |
| 15 to 17 Year Olds | 401 (58.5%) | 285 (41.5%) |
| 18 to 19 Year Olds | 197 (18.6%) | 864 (81.4%) |
| 20 to 24 Year Olds | 250 (18.2%) | 1,120 (81.8%) |
| 25 to 34 Year Olds | 193 (61.9%) | 119 (38.1%) |
| 35 Years and over | 46 (62.2%) | 28 (37.8%) |
| Total | 1,500 (30.2%) | 3,466 (69.8%) |
Educational Attainment by Field of Study in University Heights
Business (936 | 16.9%), liberal arts & history (578 | 10.4%), social sciences (543 | 9.8%), education (504 | 9.1%), and science & technology (412 | 7.4%) are the most common fields of study among 5,546 individuals in University Heights who have obtained a bachelor's degree or higher.
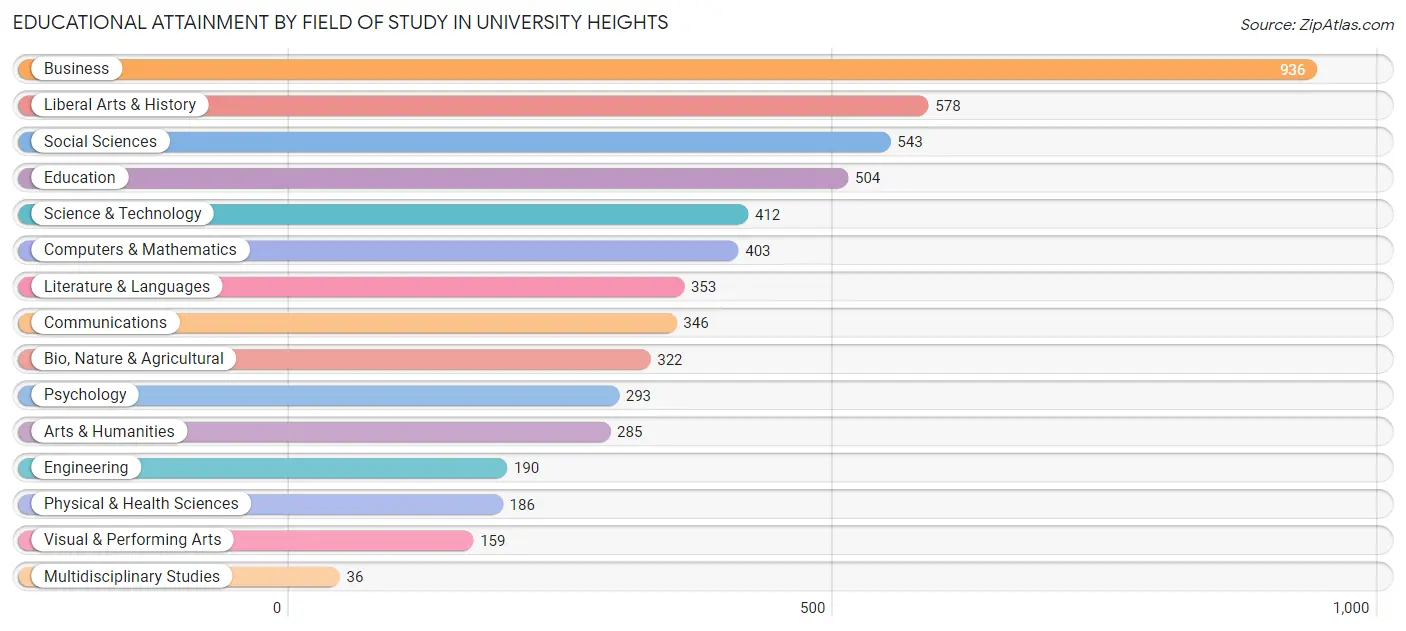
| Field of Study | # Graduates | % Graduates |
| Computers & Mathematics | 403 | 7.3% |
| Bio, Nature & Agricultural | 322 | 5.8% |
| Physical & Health Sciences | 186 | 3.4% |
| Psychology | 293 | 5.3% |
| Social Sciences | 543 | 9.8% |
| Engineering | 190 | 3.4% |
| Multidisciplinary Studies | 36 | 0.6% |
| Science & Technology | 412 | 7.4% |
| Business | 936 | 16.9% |
| Education | 504 | 9.1% |
| Literature & Languages | 353 | 6.4% |
| Liberal Arts & History | 578 | 10.4% |
| Visual & Performing Arts | 159 | 2.9% |
| Communications | 346 | 6.2% |
| Arts & Humanities | 285 | 5.1% |
| Total | 5,546 | 100.0% |
Transportation & Commute in University Heights
Vehicle Availability by Sex in University Heights
The most prevalent vehicle ownership categories in University Heights are males with 2 vehicles (1,788, accounting for 53.0%) and females with 2 vehicles (1,591, making up 59.3%).
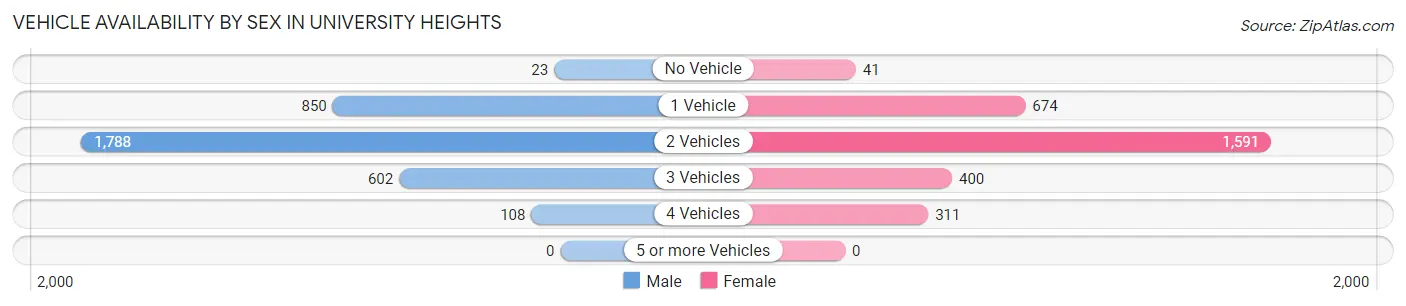
| Vehicles Available | Male | Female |
| No Vehicle | 23 (0.7%) | 41 (1.4%) |
| 1 Vehicle | 850 (25.2%) | 674 (22.3%) |
| 2 Vehicles | 1,788 (53.0%) | 1,591 (52.7%) |
| 3 Vehicles | 602 (17.9%) | 400 (13.3%) |
| 4 Vehicles | 108 (3.2%) | 311 (10.3%) |
| 5 or more Vehicles | 0 (0.0%) | 0 (0.0%) |
| Total | 3,371 (100.0%) | 3,017 (100.0%) |
Commute Time in University Heights
The most frequently occuring commute durations in University Heights are 15 to 19 minutes (1,137 commuters, 19.9%), 10 to 14 minutes (899 commuters, 15.8%), and 20 to 24 minutes (886 commuters, 15.5%).
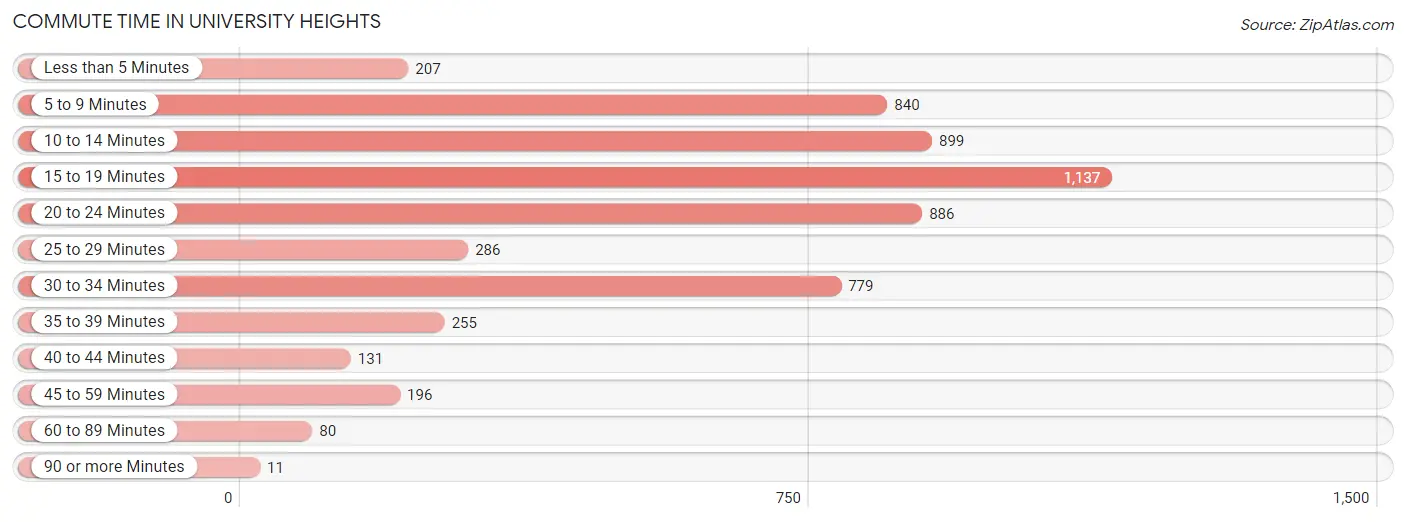
| Commute Time | # Commuters | % Commuters |
| Less than 5 Minutes | 207 | 3.6% |
| 5 to 9 Minutes | 840 | 14.7% |
| 10 to 14 Minutes | 899 | 15.8% |
| 15 to 19 Minutes | 1,137 | 19.9% |
| 20 to 24 Minutes | 886 | 15.5% |
| 25 to 29 Minutes | 286 | 5.0% |
| 30 to 34 Minutes | 779 | 13.7% |
| 35 to 39 Minutes | 255 | 4.5% |
| 40 to 44 Minutes | 131 | 2.3% |
| 45 to 59 Minutes | 196 | 3.4% |
| 60 to 89 Minutes | 80 | 1.4% |
| 90 or more Minutes | 11 | 0.2% |
Commute Time by Sex in University Heights
The most common commute times in University Heights are 15 to 19 minutes (529 commuters, 18.0%) for males and 15 to 19 minutes (608 commuters, 22.0%) for females.
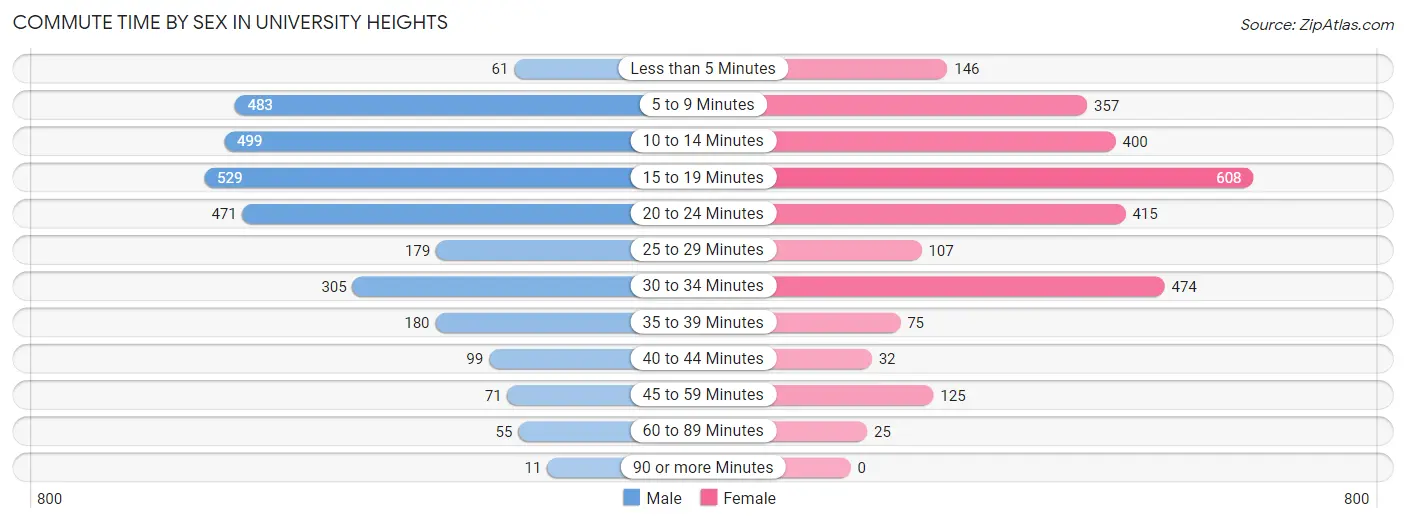
| Commute Time | Male | Female |
| Less than 5 Minutes | 61 (2.1%) | 146 (5.3%) |
| 5 to 9 Minutes | 483 (16.4%) | 357 (12.9%) |
| 10 to 14 Minutes | 499 (17.0%) | 400 (14.5%) |
| 15 to 19 Minutes | 529 (18.0%) | 608 (22.0%) |
| 20 to 24 Minutes | 471 (16.0%) | 415 (15.0%) |
| 25 to 29 Minutes | 179 (6.1%) | 107 (3.9%) |
| 30 to 34 Minutes | 305 (10.4%) | 474 (17.2%) |
| 35 to 39 Minutes | 180 (6.1%) | 75 (2.7%) |
| 40 to 44 Minutes | 99 (3.4%) | 32 (1.2%) |
| 45 to 59 Minutes | 71 (2.4%) | 125 (4.5%) |
| 60 to 89 Minutes | 55 (1.9%) | 25 (0.9%) |
| 90 or more Minutes | 11 (0.4%) | 0 (0.0%) |
Time of Departure to Work by Sex in University Heights
The most frequent times of departure to work in University Heights are 7:30 AM to 7:59 AM (533, 18.1%) for males and 7:30 AM to 7:59 AM (567, 20.5%) for females.
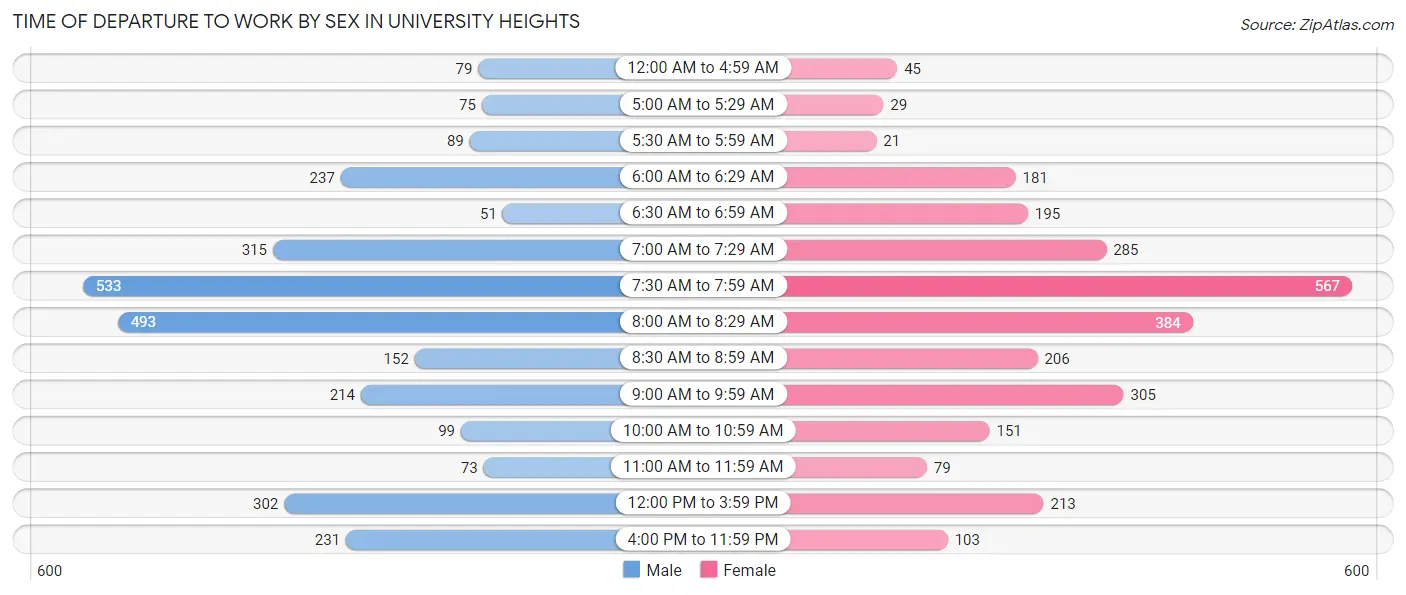
| Time of Departure | Male | Female |
| 12:00 AM to 4:59 AM | 79 (2.7%) | 45 (1.6%) |
| 5:00 AM to 5:29 AM | 75 (2.5%) | 29 (1.1%) |
| 5:30 AM to 5:59 AM | 89 (3.0%) | 21 (0.8%) |
| 6:00 AM to 6:29 AM | 237 (8.1%) | 181 (6.6%) |
| 6:30 AM to 6:59 AM | 51 (1.7%) | 195 (7.0%) |
| 7:00 AM to 7:29 AM | 315 (10.7%) | 285 (10.3%) |
| 7:30 AM to 7:59 AM | 533 (18.1%) | 567 (20.5%) |
| 8:00 AM to 8:29 AM | 493 (16.8%) | 384 (13.9%) |
| 8:30 AM to 8:59 AM | 152 (5.2%) | 206 (7.4%) |
| 9:00 AM to 9:59 AM | 214 (7.3%) | 305 (11.0%) |
| 10:00 AM to 10:59 AM | 99 (3.4%) | 151 (5.5%) |
| 11:00 AM to 11:59 AM | 73 (2.5%) | 79 (2.9%) |
| 12:00 PM to 3:59 PM | 302 (10.3%) | 213 (7.7%) |
| 4:00 PM to 11:59 PM | 231 (7.9%) | 103 (3.7%) |
| Total | 2,943 (100.0%) | 2,764 (100.0%) |
Housing Occupancy in University Heights
Occupancy by Ownership in University Heights
Of the total 4,851 dwellings in University Heights, owner-occupied units account for 3,163 (65.2%), while renter-occupied units make up 1,688 (34.8%).
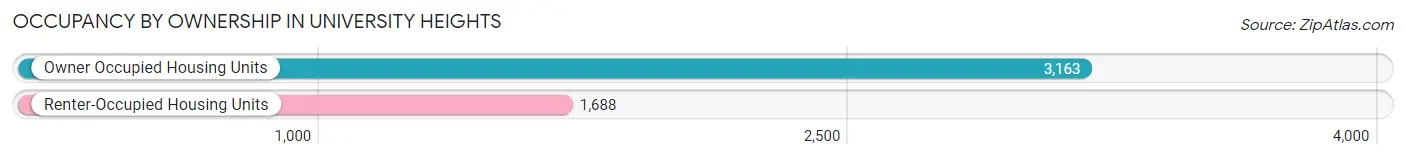
| Occupancy | # Housing Units | % Housing Units |
| Owner Occupied Housing Units | 3,163 | 65.2% |
| Renter-Occupied Housing Units | 1,688 | 34.8% |
| Total Occupied Housing Units | 4,851 | 100.0% |
Occupancy by Household Size in University Heights
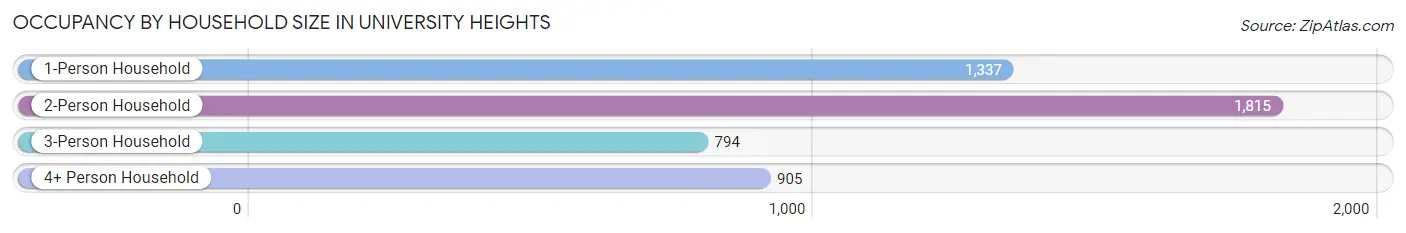
| Household Size | # Housing Units | % Housing Units |
| 1-Person Household | 1,337 | 27.6% |
| 2-Person Household | 1,815 | 37.4% |
| 3-Person Household | 794 | 16.4% |
| 4+ Person Household | 905 | 18.7% |
| Total Housing Units | 4,851 | 100.0% |
Occupancy by Ownership by Household Size in University Heights
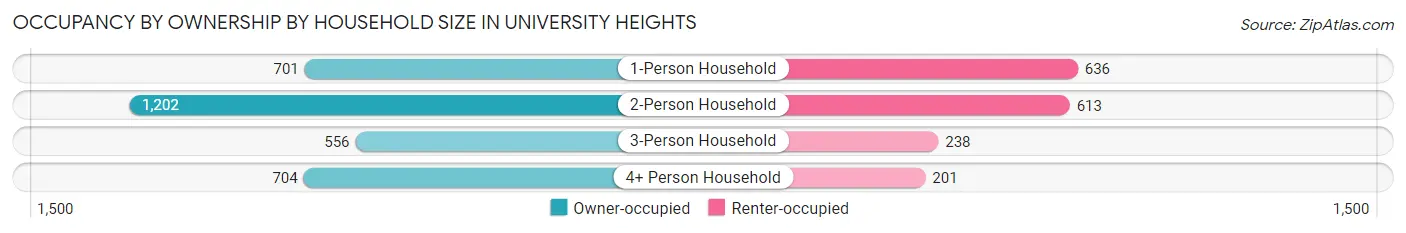
| Household Size | Owner-occupied | Renter-occupied |
| 1-Person Household | 701 (52.4%) | 636 (47.6%) |
| 2-Person Household | 1,202 (66.2%) | 613 (33.8%) |
| 3-Person Household | 556 (70.0%) | 238 (30.0%) |
| 4+ Person Household | 704 (77.8%) | 201 (22.2%) |
| Total Housing Units | 3,163 (65.2%) | 1,688 (34.8%) |
Occupancy by Educational Attainment in University Heights
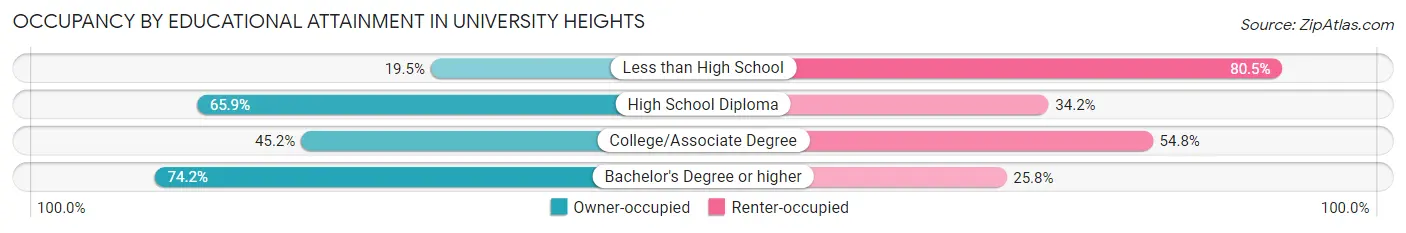
| Household Size | Owner-occupied | Renter-occupied |
| Less than High School | 30 (19.5%) | 124 (80.5%) |
| High School Diploma | 216 (65.8%) | 112 (34.2%) |
| College/Associate Degree | 506 (45.2%) | 614 (54.8%) |
| Bachelor's Degree or higher | 2,411 (74.2%) | 838 (25.8%) |
Occupancy by Age of Householder in University Heights
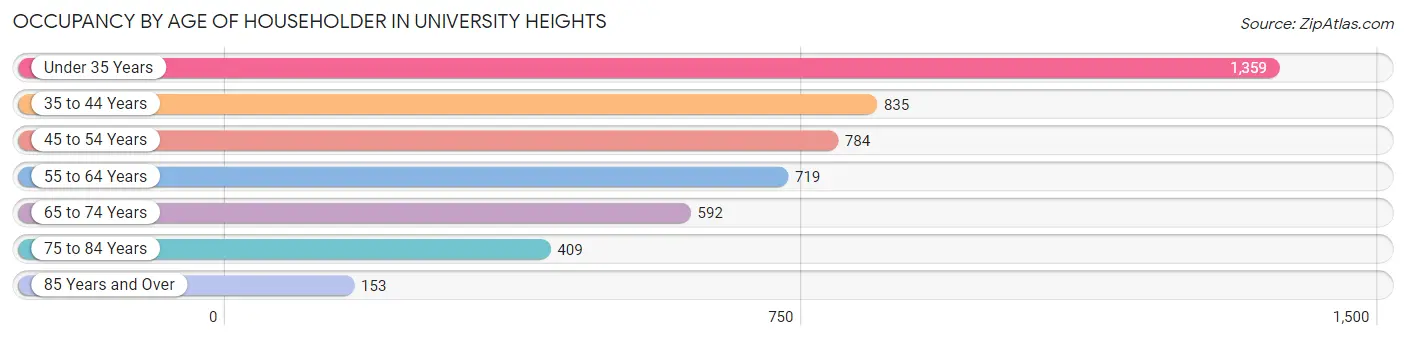
| Age Bracket | # Households | % Households |
| Under 35 Years | 1,359 | 28.0% |
| 35 to 44 Years | 835 | 17.2% |
| 45 to 54 Years | 784 | 16.2% |
| 55 to 64 Years | 719 | 14.8% |
| 65 to 74 Years | 592 | 12.2% |
| 75 to 84 Years | 409 | 8.4% |
| 85 Years and Over | 153 | 3.2% |
| Total | 4,851 | 100.0% |
Housing Finances in University Heights
Median Income by Occupancy in University Heights
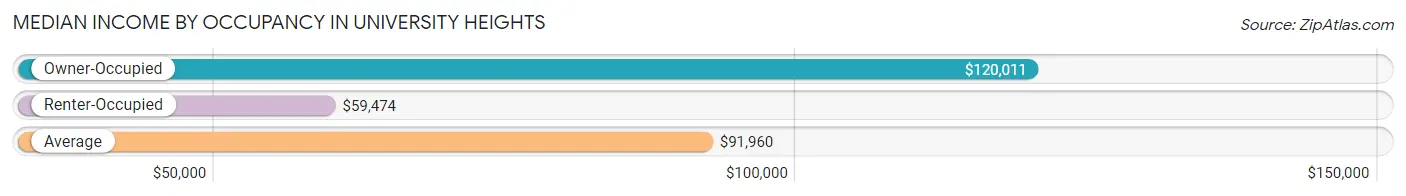
| Occupancy Type | # Households | Median Income |
| Owner-Occupied | 3,163 (65.2%) | $120,011 |
| Renter-Occupied | 1,688 (34.8%) | $59,474 |
| Average | 4,851 (100.0%) | $91,960 |
Occupancy by Householder Income Bracket in University Heights
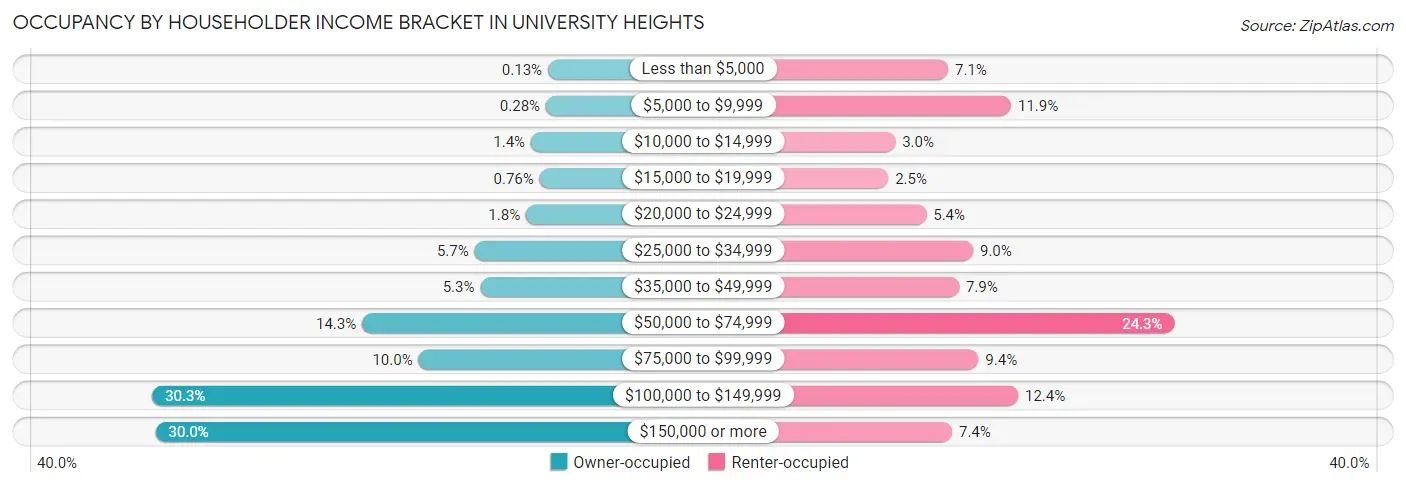
| Income Bracket | Owner-occupied | Renter-occupied |
| Less than $5,000 | 4 (0.1%) | 119 (7.0%) |
| $5,000 to $9,999 | 9 (0.3%) | 200 (11.8%) |
| $10,000 to $14,999 | 45 (1.4%) | 51 (3.0%) |
| $15,000 to $19,999 | 24 (0.8%) | 42 (2.5%) |
| $20,000 to $24,999 | 57 (1.8%) | 91 (5.4%) |
| $25,000 to $34,999 | 181 (5.7%) | 151 (8.9%) |
| $35,000 to $49,999 | 167 (5.3%) | 133 (7.9%) |
| $50,000 to $74,999 | 452 (14.3%) | 410 (24.3%) |
| $75,000 to $99,999 | 316 (10.0%) | 158 (9.4%) |
| $100,000 to $149,999 | 958 (30.3%) | 209 (12.4%) |
| $150,000 or more | 950 (30.0%) | 124 (7.3%) |
| Total | 3,163 (100.0%) | 1,688 (100.0%) |
Monthly Housing Cost Tiers in University Heights
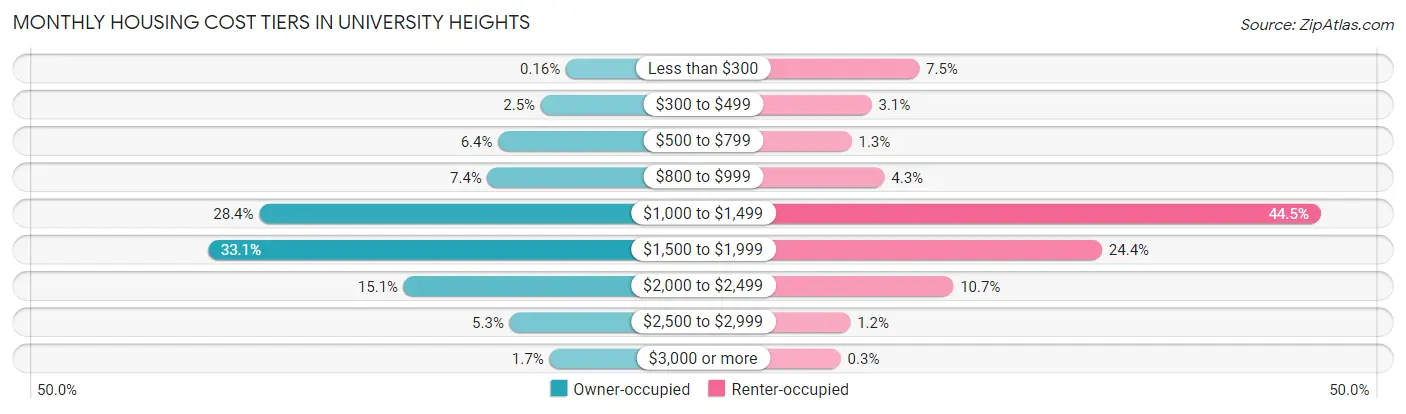
| Monthly Cost | Owner-occupied | Renter-occupied |
| Less than $300 | 5 (0.2%) | 127 (7.5%) |
| $300 to $499 | 78 (2.5%) | 53 (3.1%) |
| $500 to $799 | 202 (6.4%) | 22 (1.3%) |
| $800 to $999 | 233 (7.4%) | 73 (4.3%) |
| $1,000 to $1,499 | 898 (28.4%) | 751 (44.5%) |
| $1,500 to $1,999 | 1,048 (33.1%) | 411 (24.3%) |
| $2,000 to $2,499 | 477 (15.1%) | 180 (10.7%) |
| $2,500 to $2,999 | 169 (5.3%) | 20 (1.2%) |
| $3,000 or more | 53 (1.7%) | 5 (0.3%) |
| Total | 3,163 (100.0%) | 1,688 (100.0%) |
Physical Housing Characteristics in University Heights
Housing Structures in University Heights
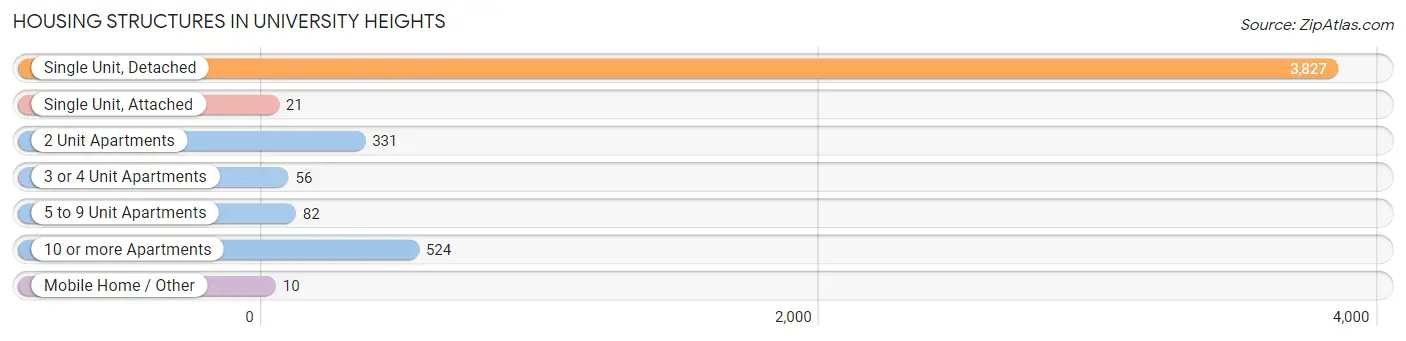
| Structure Type | # Housing Units | % Housing Units |
| Single Unit, Detached | 3,827 | 78.9% |
| Single Unit, Attached | 21 | 0.4% |
| 2 Unit Apartments | 331 | 6.8% |
| 3 or 4 Unit Apartments | 56 | 1.1% |
| 5 to 9 Unit Apartments | 82 | 1.7% |
| 10 or more Apartments | 524 | 10.8% |
| Mobile Home / Other | 10 | 0.2% |
| Total | 4,851 | 100.0% |
Housing Structures by Occupancy in University Heights
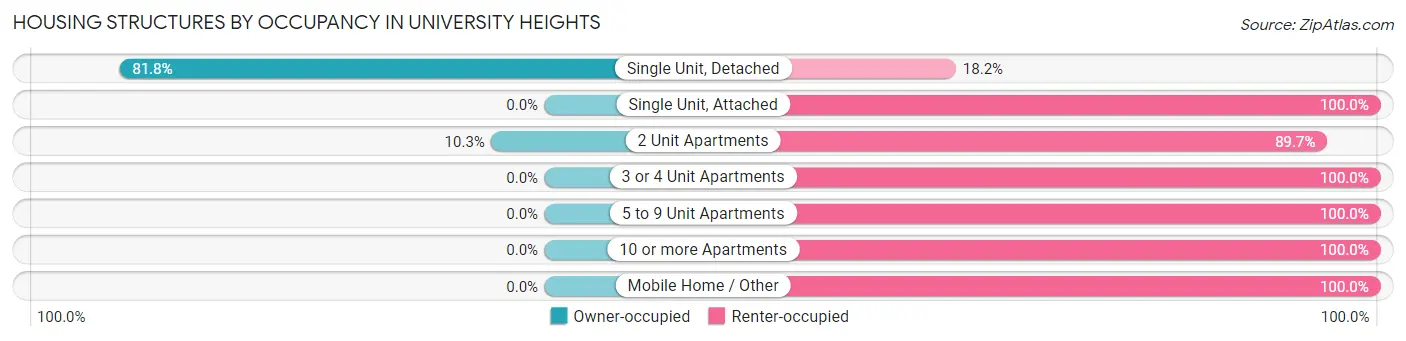
| Structure Type | Owner-occupied | Renter-occupied |
| Single Unit, Detached | 3,129 (81.8%) | 698 (18.2%) |
| Single Unit, Attached | 0 (0.0%) | 21 (100.0%) |
| 2 Unit Apartments | 34 (10.3%) | 297 (89.7%) |
| 3 or 4 Unit Apartments | 0 (0.0%) | 56 (100.0%) |
| 5 to 9 Unit Apartments | 0 (0.0%) | 82 (100.0%) |
| 10 or more Apartments | 0 (0.0%) | 524 (100.0%) |
| Mobile Home / Other | 0 (0.0%) | 10 (100.0%) |
| Total | 3,163 (65.2%) | 1,688 (34.8%) |
Housing Structures by Number of Rooms in University Heights
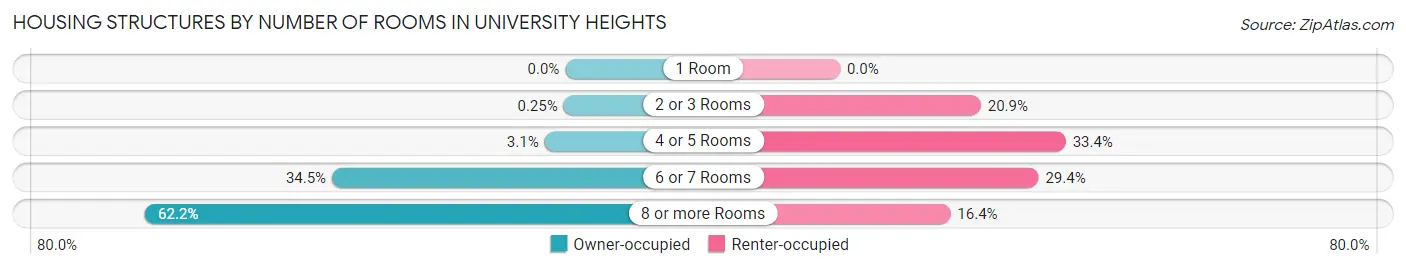
| Number of Rooms | Owner-occupied | Renter-occupied |
| 1 Room | 0 (0.0%) | 0 (0.0%) |
| 2 or 3 Rooms | 8 (0.3%) | 352 (20.8%) |
| 4 or 5 Rooms | 97 (3.1%) | 564 (33.4%) |
| 6 or 7 Rooms | 1,092 (34.5%) | 496 (29.4%) |
| 8 or more Rooms | 1,966 (62.2%) | 276 (16.4%) |
| Total | 3,163 (100.0%) | 1,688 (100.0%) |
Housing Structure by Heating Type in University Heights
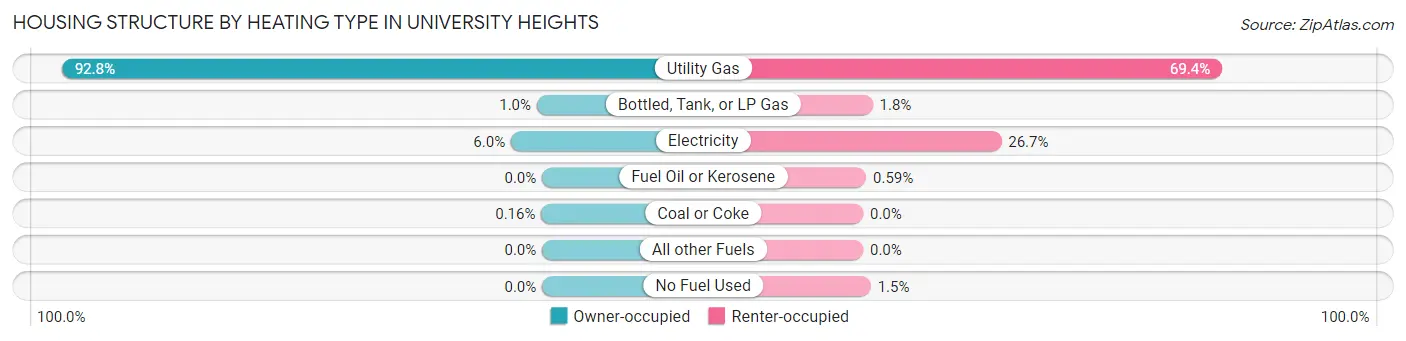
| Heating Type | Owner-occupied | Renter-occupied |
| Utility Gas | 2,936 (92.8%) | 1,171 (69.4%) |
| Bottled, Tank, or LP Gas | 32 (1.0%) | 31 (1.8%) |
| Electricity | 190 (6.0%) | 451 (26.7%) |
| Fuel Oil or Kerosene | 0 (0.0%) | 10 (0.6%) |
| Coal or Coke | 5 (0.2%) | 0 (0.0%) |
| All other Fuels | 0 (0.0%) | 0 (0.0%) |
| No Fuel Used | 0 (0.0%) | 25 (1.5%) |
| Total | 3,163 (100.0%) | 1,688 (100.0%) |
Household Vehicle Usage in University Heights
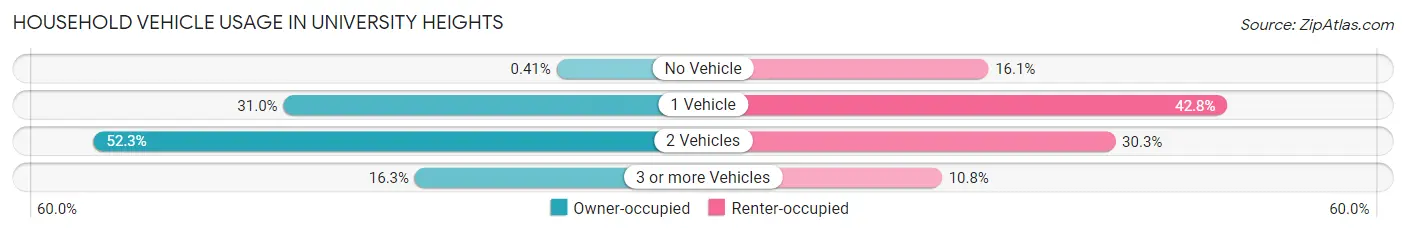
| Vehicles per Household | Owner-occupied | Renter-occupied |
| No Vehicle | 13 (0.4%) | 271 (16.1%) |
| 1 Vehicle | 981 (31.0%) | 723 (42.8%) |
| 2 Vehicles | 1,654 (52.3%) | 511 (30.3%) |
| 3 or more Vehicles | 515 (16.3%) | 183 (10.8%) |
| Total | 3,163 (100.0%) | 1,688 (100.0%) |
Real Estate & Mortgages in University Heights
Real Estate and Mortgage Overview in University Heights
| Characteristic | Without Mortgage | With Mortgage |
| Housing Units | 931 | 2,232 |
| Median Property Value | $206,600 | $210,600 |
| Median Household Income | $93,631 | $652 |
| Monthly Housing Costs | $1,000 | $53 |
| Real Estate Taxes | $6,901 | $7 |
Property Value by Mortgage Status in University Heights
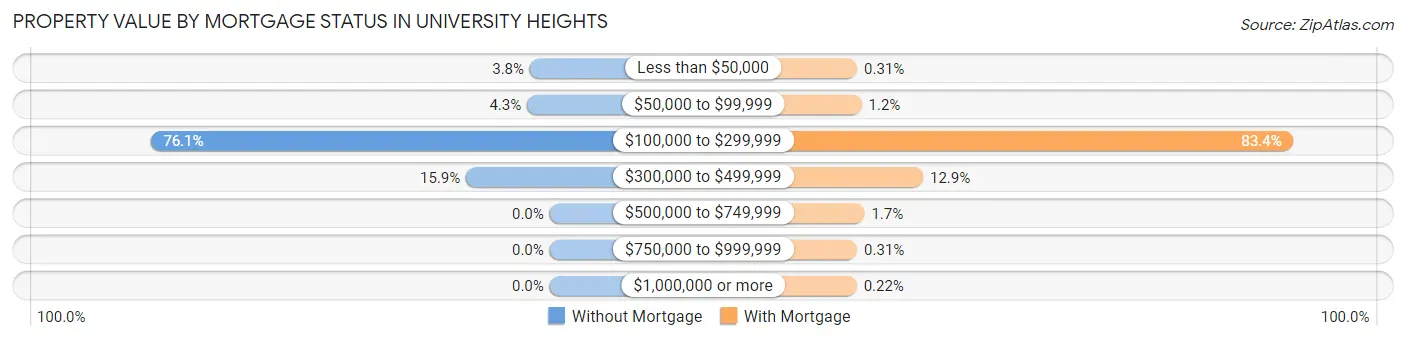
| Property Value | Without Mortgage | With Mortgage |
| Less than $50,000 | 35 (3.8%) | 7 (0.3%) |
| $50,000 to $99,999 | 40 (4.3%) | 26 (1.2%) |
| $100,000 to $299,999 | 708 (76.0%) | 1,862 (83.4%) |
| $300,000 to $499,999 | 148 (15.9%) | 287 (12.9%) |
| $500,000 to $749,999 | 0 (0.0%) | 38 (1.7%) |
| $750,000 to $999,999 | 0 (0.0%) | 7 (0.3%) |
| $1,000,000 or more | 0 (0.0%) | 5 (0.2%) |
| Total | 931 (100.0%) | 2,232 (100.0%) |
Household Income by Mortgage Status in University Heights
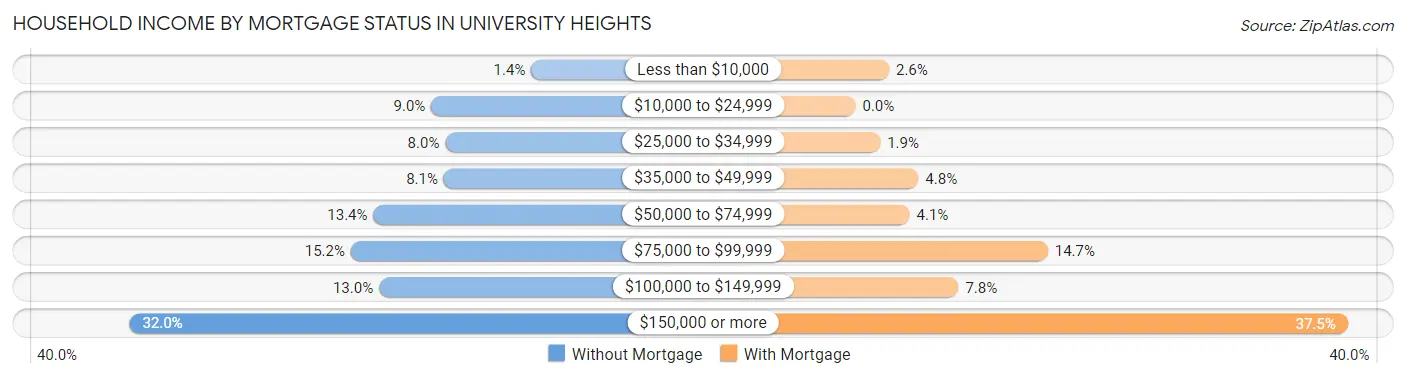
| Household Income | Without Mortgage | With Mortgage |
| Less than $10,000 | 13 (1.4%) | 57 (2.5%) |
| $10,000 to $24,999 | 84 (9.0%) | 0 (0.0%) |
| $25,000 to $34,999 | 74 (8.0%) | 42 (1.9%) |
| $35,000 to $49,999 | 75 (8.1%) | 107 (4.8%) |
| $50,000 to $74,999 | 125 (13.4%) | 92 (4.1%) |
| $75,000 to $99,999 | 141 (15.1%) | 327 (14.6%) |
| $100,000 to $149,999 | 121 (13.0%) | 175 (7.8%) |
| $150,000 or more | 298 (32.0%) | 837 (37.5%) |
| Total | 931 (100.0%) | 2,232 (100.0%) |
Property Value to Household Income Ratio in University Heights
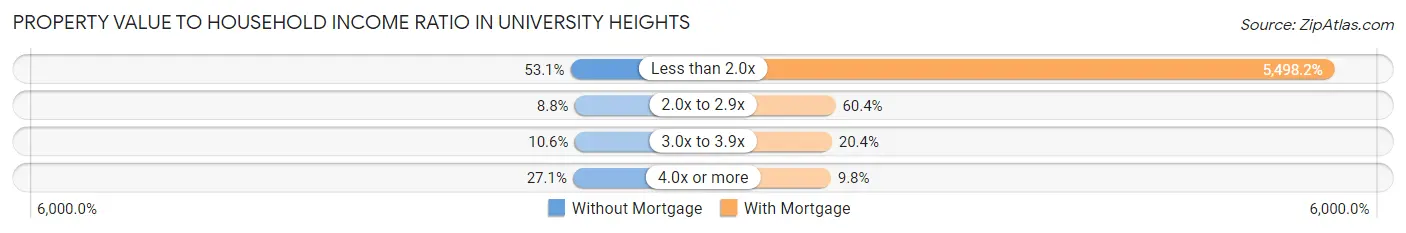
| Value-to-Income Ratio | Without Mortgage | With Mortgage |
| Less than 2.0x | 494 (53.1%) | 122,719 (5,498.2%) |
| 2.0x to 2.9x | 82 (8.8%) | 1,347 (60.4%) |
| 3.0x to 3.9x | 99 (10.6%) | 455 (20.4%) |
| 4.0x or more | 252 (27.1%) | 218 (9.8%) |
| Total | 931 (100.0%) | 2,232 (100.0%) |
Real Estate Taxes by Mortgage Status in University Heights
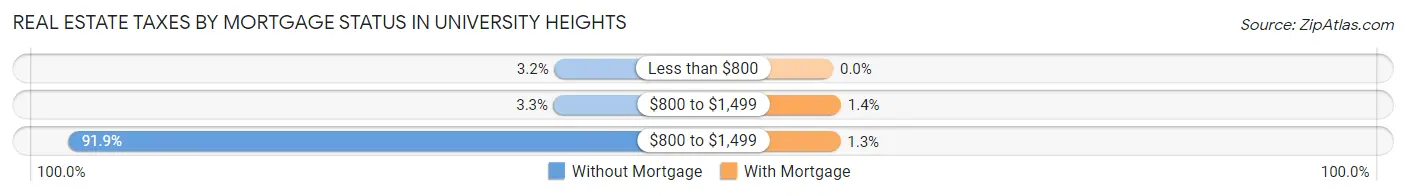
| Property Taxes | Without Mortgage | With Mortgage |
| Less than $800 | 30 (3.2%) | 0 (0.0%) |
| $800 to $1,499 | 31 (3.3%) | 32 (1.4%) |
| $800 to $1,499 | 856 (91.9%) | 30 (1.3%) |
| Total | 931 (100.0%) | 2,232 (100.0%) |
Health & Disability in University Heights
Health Insurance Coverage by Age in University Heights
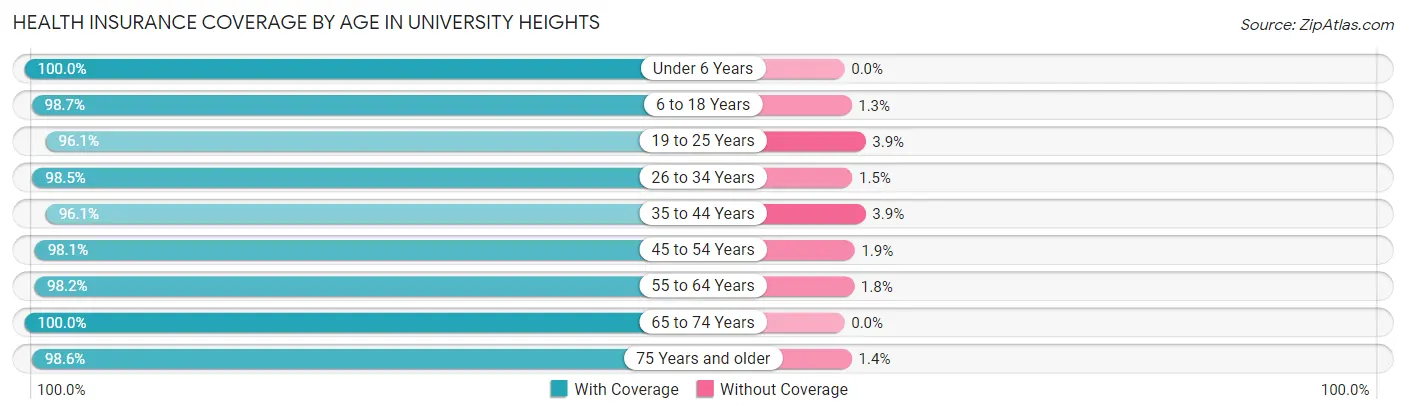
| Age Bracket | With Coverage | Without Coverage |
| Under 6 Years | 1,174 (100.0%) | 0 (0.0%) |
| 6 to 18 Years | 2,355 (98.7%) | 31 (1.3%) |
| 19 to 25 Years | 2,282 (96.1%) | 93 (3.9%) |
| 26 to 34 Years | 1,960 (98.5%) | 29 (1.5%) |
| 35 to 44 Years | 1,512 (96.1%) | 62 (3.9%) |
| 45 to 54 Years | 1,288 (98.1%) | 25 (1.9%) |
| 55 to 64 Years | 1,151 (98.2%) | 21 (1.8%) |
| 65 to 74 Years | 937 (100.0%) | 0 (0.0%) |
| 75 Years and older | 719 (98.6%) | 10 (1.4%) |
| Total | 13,378 (98.0%) | 271 (2.0%) |
Health Insurance Coverage by Citizenship Status in University Heights
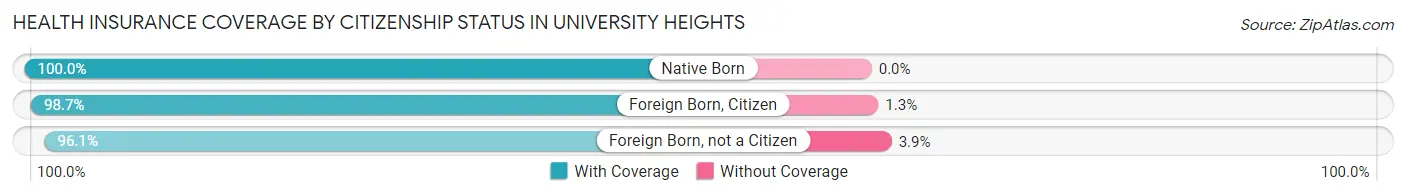
| Citizenship Status | With Coverage | Without Coverage |
| Native Born | 1,174 (100.0%) | 0 (0.0%) |
| Foreign Born, Citizen | 2,355 (98.7%) | 31 (1.3%) |
| Foreign Born, not a Citizen | 2,282 (96.1%) | 93 (3.9%) |
Health Insurance Coverage by Household Income in University Heights
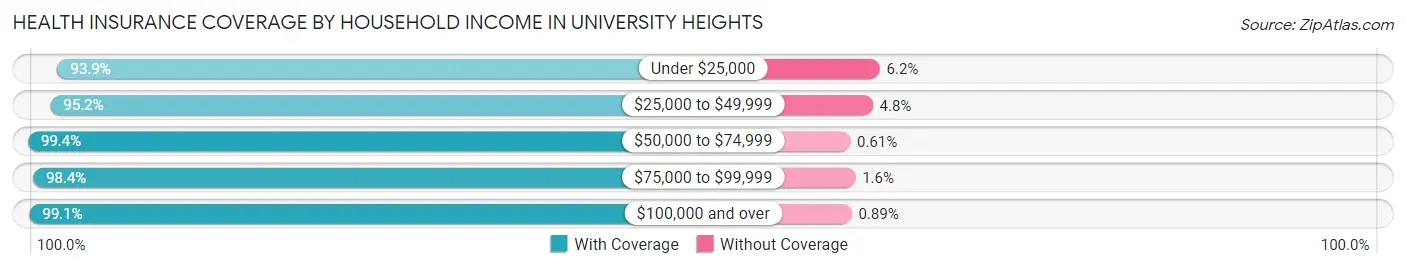
| Household Income | With Coverage | Without Coverage |
| Under $25,000 | 915 (93.9%) | 60 (6.1%) |
| $25,000 to $49,999 | 1,437 (95.2%) | 73 (4.8%) |
| $50,000 to $74,999 | 1,783 (99.4%) | 11 (0.6%) |
| $75,000 to $99,999 | 1,065 (98.4%) | 17 (1.6%) |
| $100,000 and over | 6,785 (99.1%) | 61 (0.9%) |
Public vs Private Health Insurance Coverage by Age in University Heights
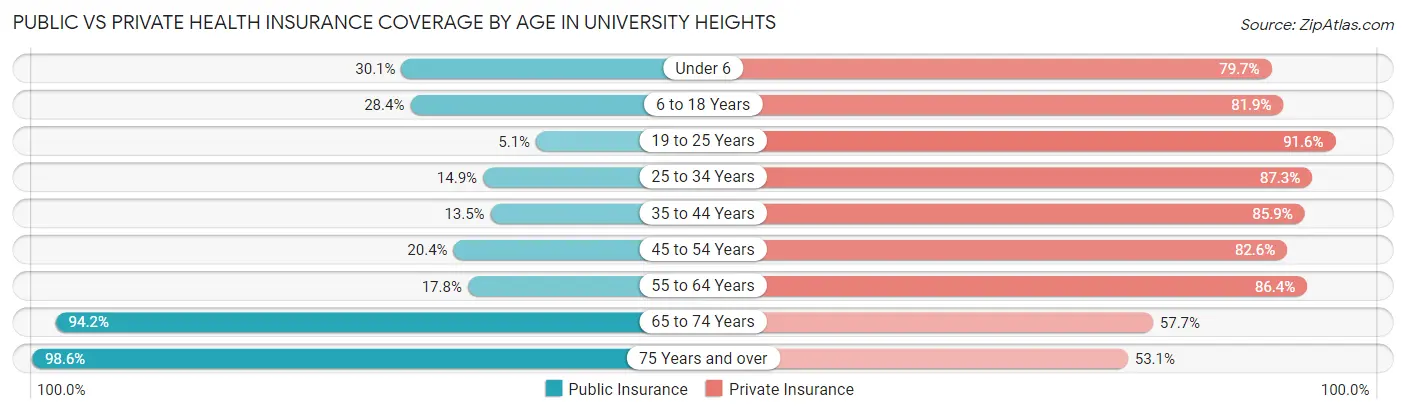
| Age Bracket | Public Insurance | Private Insurance |
| Under 6 | 353 (30.1%) | 936 (79.7%) |
| 6 to 18 Years | 678 (28.4%) | 1,955 (81.9%) |
| 19 to 25 Years | 121 (5.1%) | 2,175 (91.6%) |
| 25 to 34 Years | 297 (14.9%) | 1,736 (87.3%) |
| 35 to 44 Years | 213 (13.5%) | 1,352 (85.9%) |
| 45 to 54 Years | 268 (20.4%) | 1,085 (82.6%) |
| 55 to 64 Years | 208 (17.7%) | 1,012 (86.4%) |
| 65 to 74 Years | 883 (94.2%) | 541 (57.7%) |
| 75 Years and over | 719 (98.6%) | 387 (53.1%) |
| Total | 3,740 (27.4%) | 11,179 (81.9%) |
Disability Status by Sex by Age in University Heights
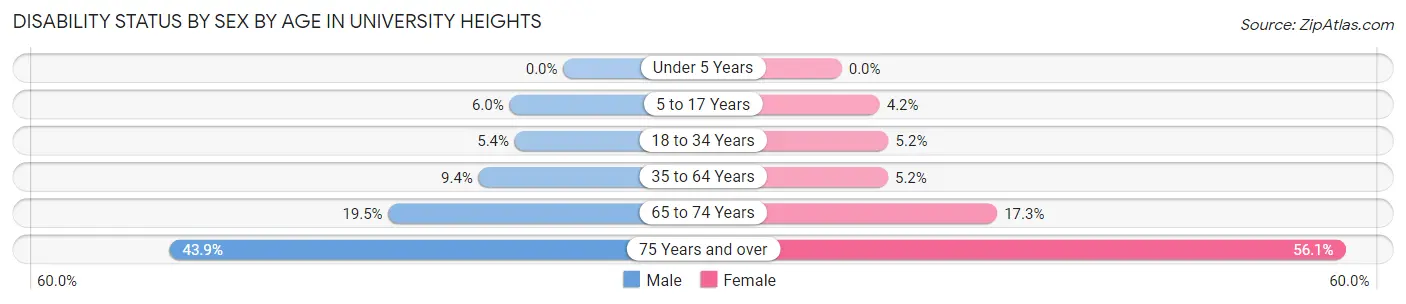
| Age Bracket | Male | Female |
| Under 5 Years | 0 (0.0%) | 0 (0.0%) |
| 5 to 17 Years | 65 (6.0%) | 37 (4.2%) |
| 18 to 34 Years | 128 (5.4%) | 132 (5.2%) |
| 35 to 64 Years | 196 (9.4%) | 102 (5.1%) |
| 65 to 74 Years | 97 (19.5%) | 76 (17.3%) |
| 75 Years and over | 107 (43.9%) | 272 (56.1%) |
Disability Class by Sex by Age in University Heights
Disability Class: Hearing Difficulty
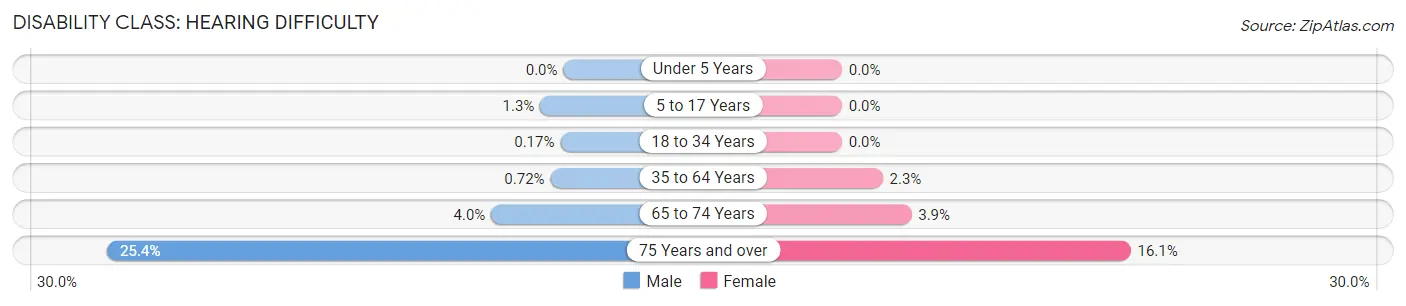
| Age Bracket | Male | Female |
| Under 5 Years | 0 (0.0%) | 0 (0.0%) |
| 5 to 17 Years | 14 (1.3%) | 0 (0.0%) |
| 18 to 34 Years | 4 (0.2%) | 0 (0.0%) |
| 35 to 64 Years | 15 (0.7%) | 45 (2.3%) |
| 65 to 74 Years | 20 (4.0%) | 17 (3.9%) |
| 75 Years and over | 62 (25.4%) | 78 (16.1%) |
Disability Class: Vision Difficulty
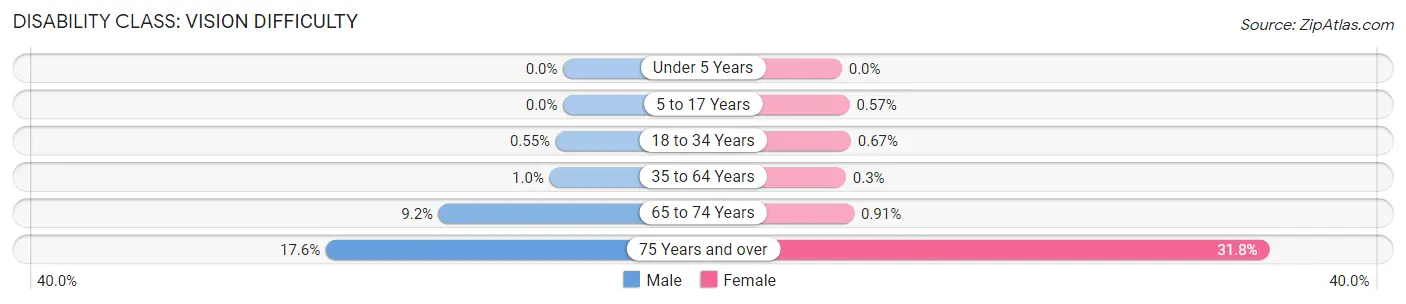
| Age Bracket | Male | Female |
| Under 5 Years | 0 (0.0%) | 0 (0.0%) |
| 5 to 17 Years | 0 (0.0%) | 5 (0.6%) |
| 18 to 34 Years | 13 (0.5%) | 17 (0.7%) |
| 35 to 64 Years | 21 (1.0%) | 6 (0.3%) |
| 65 to 74 Years | 46 (9.2%) | 4 (0.9%) |
| 75 Years and over | 43 (17.6%) | 154 (31.8%) |
Disability Class: Cognitive Difficulty
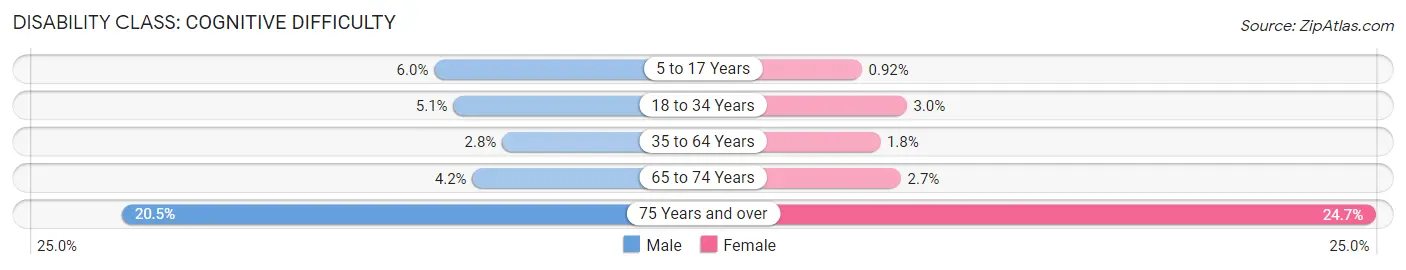
| Age Bracket | Male | Female |
| 5 to 17 Years | 65 (6.0%) | 8 (0.9%) |
| 18 to 34 Years | 121 (5.1%) | 76 (3.0%) |
| 35 to 64 Years | 59 (2.8%) | 35 (1.8%) |
| 65 to 74 Years | 21 (4.2%) | 12 (2.7%) |
| 75 Years and over | 50 (20.5%) | 120 (24.7%) |
Disability Class: Ambulatory Difficulty
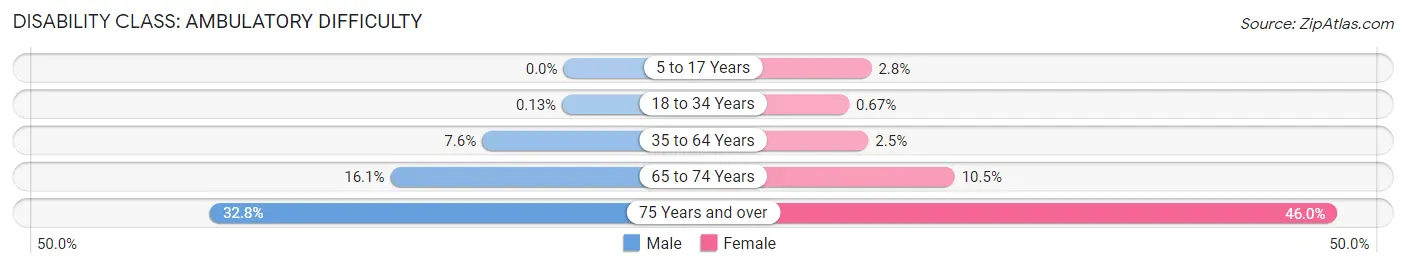
| Age Bracket | Male | Female |
| 5 to 17 Years | 0 (0.0%) | 24 (2.8%) |
| 18 to 34 Years | 3 (0.1%) | 17 (0.7%) |
| 35 to 64 Years | 157 (7.5%) | 49 (2.5%) |
| 65 to 74 Years | 80 (16.1%) | 46 (10.5%) |
| 75 Years and over | 80 (32.8%) | 223 (46.0%) |
Disability Class: Self-Care Difficulty
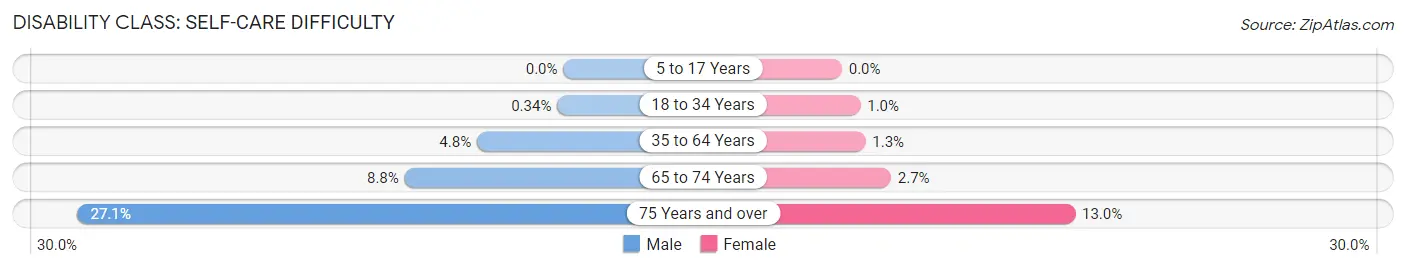
| Age Bracket | Male | Female |
| 5 to 17 Years | 0 (0.0%) | 0 (0.0%) |
| 18 to 34 Years | 8 (0.3%) | 26 (1.0%) |
| 35 to 64 Years | 100 (4.8%) | 26 (1.3%) |
| 65 to 74 Years | 44 (8.8%) | 12 (2.7%) |
| 75 Years and over | 66 (27.1%) | 63 (13.0%) |
Technology Access in University Heights
Computing Device Access in University Heights
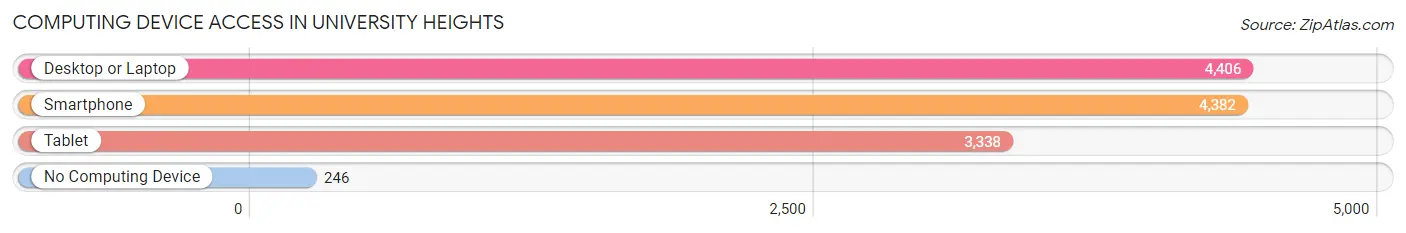
| Device Type | # Households | % Households |
| Desktop or Laptop | 4,406 | 90.8% |
| Smartphone | 4,382 | 90.3% |
| Tablet | 3,338 | 68.8% |
| No Computing Device | 246 | 5.1% |
| Total | 4,851 | 100.0% |
Internet Access in University Heights
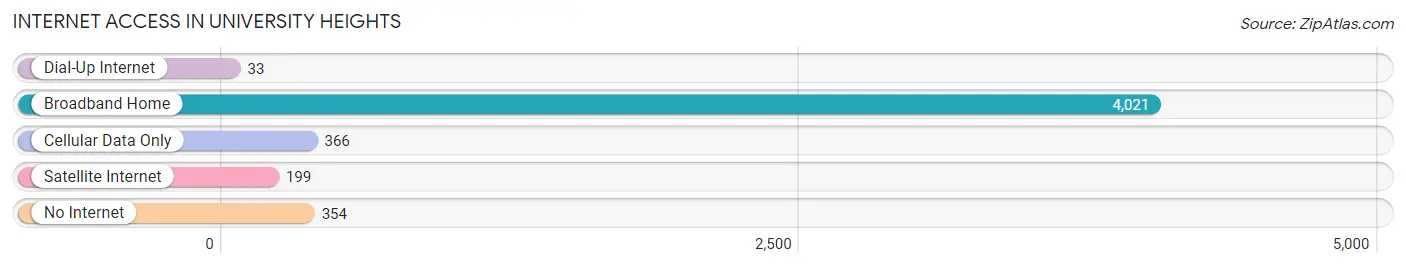
| Internet Type | # Households | % Households |
| Dial-Up Internet | 33 | 0.7% |
| Broadband Home | 4,021 | 82.9% |
| Cellular Data Only | 366 | 7.5% |
| Satellite Internet | 199 | 4.1% |
| No Internet | 354 | 7.3% |
| Total | 4,851 | 100.0% |
University Heights Summary
History
University Heights is a city located in Cuyahoga County, Ohio. It is a suburb of Cleveland and is located just east of the city. The city was founded in 1921 and was originally known as Cedar Center. The city was renamed University Heights in 1929 when John Carroll University moved to the area. The city was incorporated in 1951 and has since grown to a population of 13,500.
University Heights is home to John Carroll University, a private Jesuit university. The university was founded in 1886 and moved to University Heights in 1925. The university is the oldest Catholic university in Ohio and is known for its strong academic programs.
Geography
University Heights is located in Cuyahoga County, Ohio. It is a suburb of Cleveland and is located just east of the city. The city is bordered by Cleveland Heights to the north, South Euclid to the east, and Warrensville Heights to the south. The city has a total area of 4.2 square miles, all of which is land.
The city is located in the Western Reserve region of Ohio and is part of the Cleveland metropolitan area. The city is located on the edge of the Cuyahoga Valley National Park and is home to several parks and recreational areas. The city is also home to the University Circle area, which is home to several cultural and educational institutions.
Economy
University Heights is a primarily residential city and does not have a large industrial base. The city’s economy is largely driven by the presence of John Carroll University. The university is the largest employer in the city and provides jobs for faculty, staff, and students.
The city also has a number of small businesses, including restaurants, retail stores, and professional services. The city is also home to a number of medical facilities, including University Hospitals and the Cleveland Clinic.
Demographics
University Heights is a diverse city with a population of 13,500. The city has a median household income of $50,000 and a median home value of $150,000. The city is predominantly white, with a population that is 77.3% white, 11.2% African American, 5.2% Asian, and 4.3% Hispanic or Latino.
The city is home to a large number of college students, with nearly 20% of the population being enrolled in college. The city also has a large number of families, with nearly 40% of households having children under the age of 18.
Conclusion
University Heights is a city located in Cuyahoga County, Ohio. It is a suburb of Cleveland and is located just east of the city. The city was founded in 1921 and was originally known as Cedar Center. The city was renamed University Heights in 1929 when John Carroll University moved to the area. The city has a population of 13,500 and is predominantly white. The city’s economy is largely driven by the presence of John Carroll University and the city is home to a number of small businesses, medical facilities, and recreational areas.
Common Questions
What is Per Capita Income in University Heights?
Per Capita income in University Heights is $41,872.
What is the Median Family Income in University Heights?
Median Family Income in University Heights is $114,884.
What is the Median Household income in University Heights?
Median Household Income in University Heights is $91,960.
What is Income or Wage Gap in University Heights?
Income or Wage Gap in University Heights is 23.3%.
Women in University Heights earn 76.7 cents for every dollar earned by a man.
What is Inequality or Gini Index in University Heights?
Inequality or Gini Index in University Heights is 0.45.
What is the Total Population of University Heights?
Total Population of University Heights is 13,649.
What is the Total Male Population of University Heights?
Total Male Population of University Heights is 6,787.
What is the Total Female Population of University Heights?
Total Female Population of University Heights is 6,862.
What is the Ratio of Males per 100 Females in University Heights?
There are 98.91 Males per 100 Females in University Heights.
What is the Ratio of Females per 100 Males in University Heights?
There are 101.11 Females per 100 Males in University Heights.
What is the Median Population Age in University Heights?
Median Population Age in University Heights is 30.5 Years.
What is the Average Family Size in University Heights
Average Family Size in University Heights is 3.1 People.
What is the Average Household Size in University Heights
Average Household Size in University Heights is 2.5 People.
How Large is the Labor Force in University Heights?
There are 7,640 People in the Labor Forcein in University Heights.
What is the Percentage of People in the Labor Force in University Heights?
69.1% of People are in the Labor Force in University Heights.
What is the Unemployment Rate in University Heights?
Unemployment Rate in University Heights is 5.5%.