Elyria, OH Map & Demographics
Elyria Map
Elyria Overview
$28,820
PER CAPITA INCOME
$63,476
AVG FAMILY INCOME
$49,569
AVG HOUSEHOLD INCOME
27.4%
WAGE / INCOME GAP [ % ]
72.6¢/ $1
WAGE / INCOME GAP [ $ ]
$12,191
FAMILY INCOME DEFICIT
0.44
INEQUALITY / GINI INDEX
52,780
TOTAL POPULATION
25,521
MALE POPULATION
27,259
FEMALE POPULATION
93.62
MALES / 100 FEMALES
106.81
FEMALES / 100 MALES
40.2
MEDIAN AGE
3.0
AVG FAMILY SIZE
2.2
AVG HOUSEHOLD SIZE
26,565
LABOR FORCE [ PEOPLE ]
61.4%
PERCENT IN LABOR FORCE
4.9%
UNEMPLOYMENT RATE
Elyria Zip Codes
Elyria Area Codes
Income in Elyria
Income Overview in Elyria
Per Capita Income in Elyria is $28,820, while median incomes of families and households are $63,476 and $49,569 respectively.
| Characteristic | Number | Measure |
| Per Capita Income | 52,780 | $28,820 |
| Median Family Income | 12,658 | $63,476 |
| Mean Family Income | 12,658 | $74,425 |
| Median Household Income | 23,119 | $49,569 |
| Mean Household Income | 23,119 | $63,079 |
| Income Deficit | 12,658 | $12,191 |
| Wage / Income Gap (%) | 52,780 | 27.40% |
| Wage / Income Gap ($) | 52,780 | 72.60¢ per $1 |
| Gini / Inequality Index | 52,780 | 0.44 |
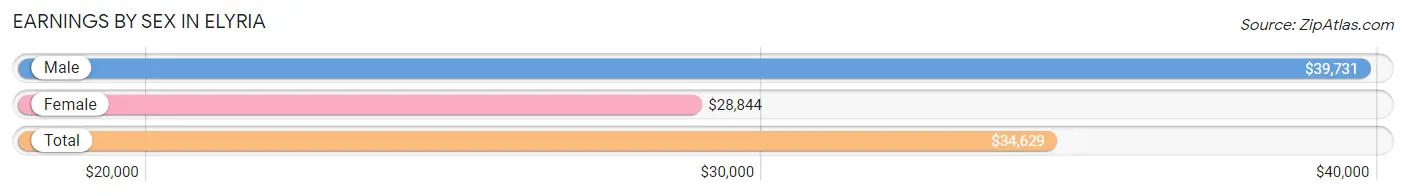
Earnings by Sex in Elyria
Average Earnings in Elyria are $34,629, $39,731 for men and $28,844 for women, a difference of 27.4%.
| Sex | Number | Average Earnings |
| Male | 14,101 (51.2%) | $39,731 |
| Female | 13,421 (48.8%) | $28,844 |
| Total | 27,522 (100.0%) | $34,629 |
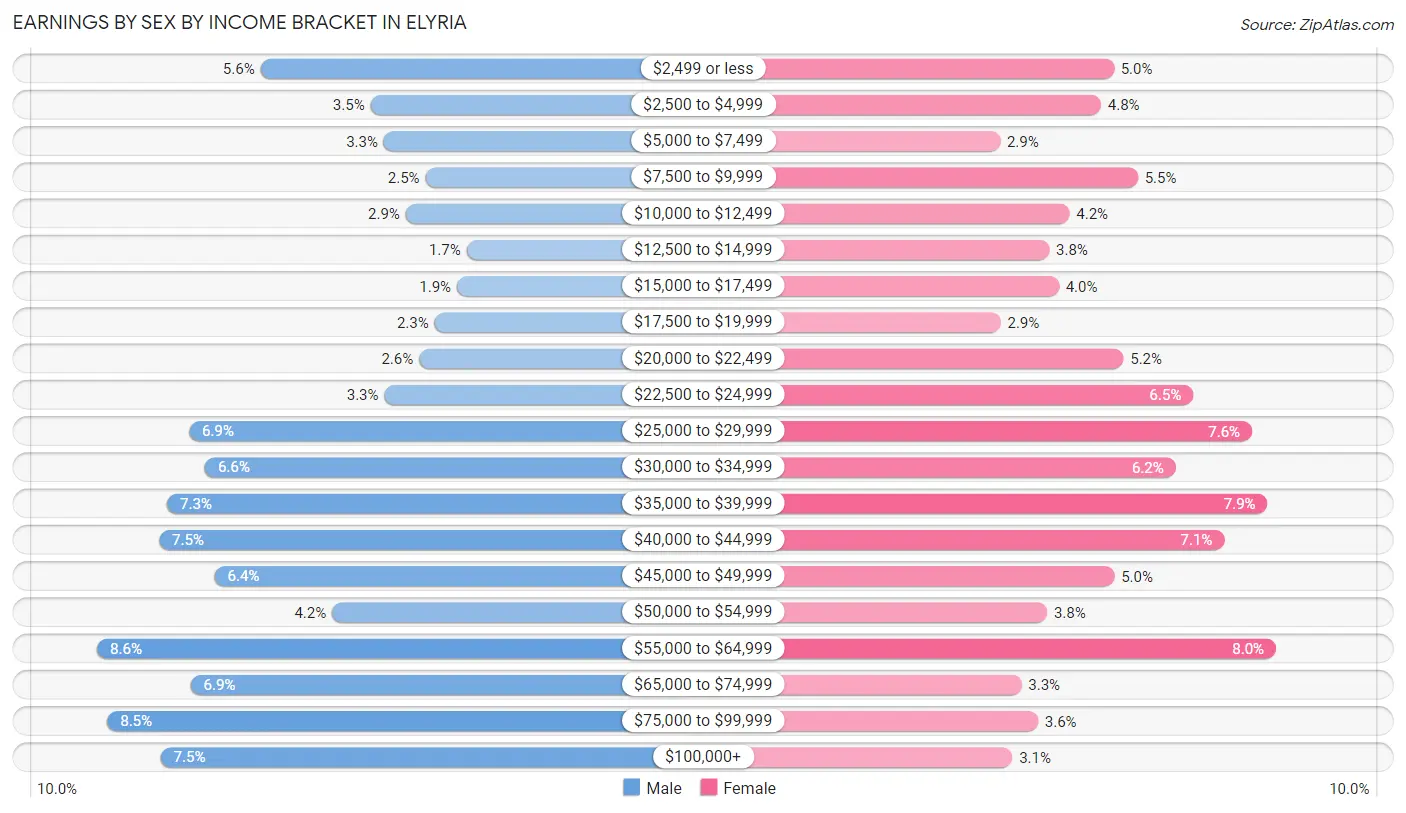
Earnings by Sex by Income Bracket in Elyria
The most common earnings brackets in Elyria are $55,000 to $64,999 for men (1,218 | 8.6%) and $55,000 to $64,999 for women (1,079 | 8.0%).
| Income | Male | Female |
| $2,499 or less | 787 (5.6%) | 671 (5.0%) |
| $2,500 to $4,999 | 497 (3.5%) | 639 (4.8%) |
| $5,000 to $7,499 | 461 (3.3%) | 385 (2.9%) |
| $7,500 to $9,999 | 351 (2.5%) | 731 (5.4%) |
| $10,000 to $12,499 | 403 (2.9%) | 560 (4.2%) |
| $12,500 to $14,999 | 242 (1.7%) | 508 (3.8%) |
| $15,000 to $17,499 | 268 (1.9%) | 533 (4.0%) |
| $17,500 to $19,999 | 327 (2.3%) | 387 (2.9%) |
| $20,000 to $22,499 | 368 (2.6%) | 695 (5.2%) |
| $22,500 to $24,999 | 460 (3.3%) | 871 (6.5%) |
| $25,000 to $29,999 | 976 (6.9%) | 1,018 (7.6%) |
| $30,000 to $34,999 | 934 (6.6%) | 827 (6.2%) |
| $35,000 to $39,999 | 1,034 (7.3%) | 1,057 (7.9%) |
| $40,000 to $44,999 | 1,055 (7.5%) | 949 (7.1%) |
| $45,000 to $49,999 | 908 (6.4%) | 673 (5.0%) |
| $50,000 to $54,999 | 598 (4.2%) | 503 (3.7%) |
| $55,000 to $64,999 | 1,218 (8.6%) | 1,079 (8.0%) |
| $65,000 to $74,999 | 972 (6.9%) | 439 (3.3%) |
| $75,000 to $99,999 | 1,191 (8.5%) | 480 (3.6%) |
| $100,000+ | 1,051 (7.4%) | 416 (3.1%) |
| Total | 14,101 (100.0%) | 13,421 (100.0%) |
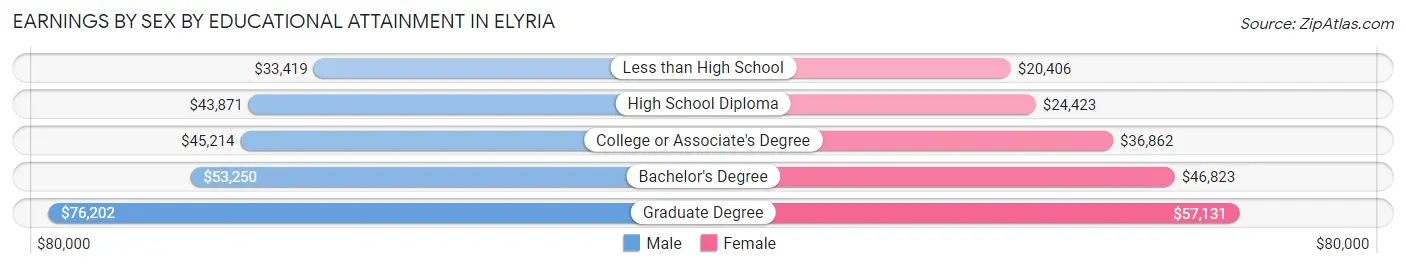
Earnings by Sex by Educational Attainment in Elyria
Average earnings in Elyria are $44,784 for men and $32,967 for women, a difference of 26.4%. Men with an educational attainment of graduate degree enjoy the highest average annual earnings of $76,202, while those with less than high school education earn the least with $33,419. Women with an educational attainment of graduate degree earn the most with the average annual earnings of $57,131, while those with less than high school education have the smallest earnings of $20,406.
| Educational Attainment | Male Income | Female Income |
| Less than High School | $33,419 | $20,406 |
| High School Diploma | $43,871 | $24,423 |
| College or Associate's Degree | $45,214 | $36,862 |
| Bachelor's Degree | $53,250 | $46,823 |
| Graduate Degree | $76,202 | $57,131 |
| Total | $44,784 | $32,967 |
Family Income in Elyria
Family Income Brackets in Elyria
According to the Elyria family income data, there are 2,671 families falling into the $50,000 to $74,999 income range, which is the most common income bracket and makes up 21.1% of all families. Conversely, the $10,000 to $14,999 income bracket is the least frequent group with only 291 families (2.3%) belonging to this category.
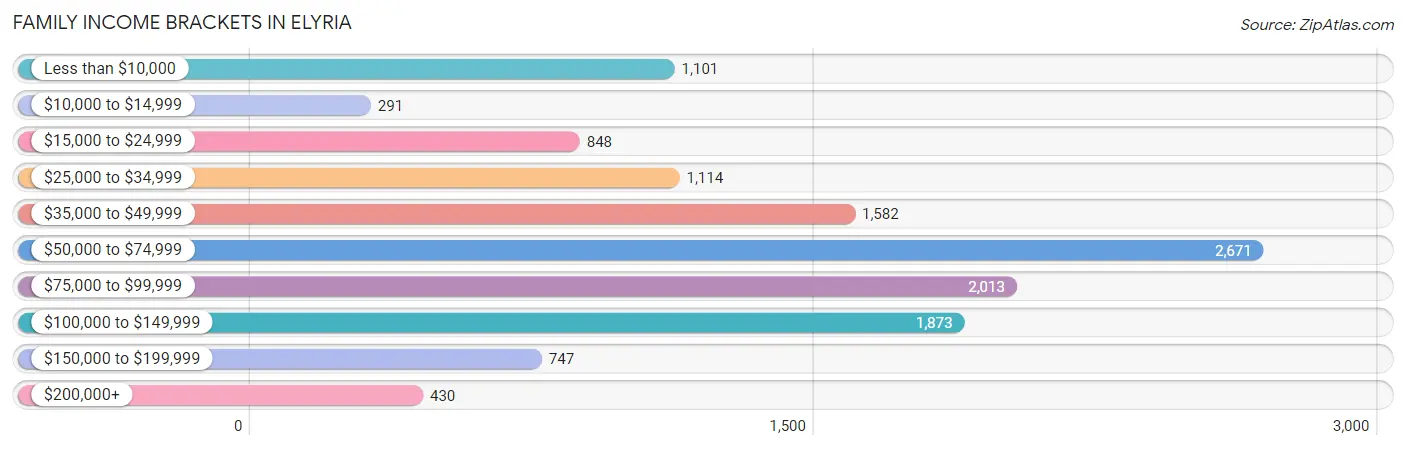
| Income Bracket | # Families | % Families |
| Less than $10,000 | 1,101 | 8.7% |
| $10,000 to $14,999 | 291 | 2.3% |
| $15,000 to $24,999 | 848 | 6.7% |
| $25,000 to $34,999 | 1,114 | 8.8% |
| $35,000 to $49,999 | 1,582 | 12.5% |
| $50,000 to $74,999 | 2,671 | 21.1% |
| $75,000 to $99,999 | 2,013 | 15.9% |
| $100,000 to $149,999 | 1,873 | 14.8% |
| $150,000 to $199,999 | 747 | 5.9% |
| $200,000+ | 430 | 3.4% |
Family Income by Famaliy Size in Elyria
4-person families (1,837 | 14.5%) account for the highest median family income in Elyria with $76,982 per family, while 2-person families (6,641 | 52.5%) have the highest median income of $28,646 per family member.
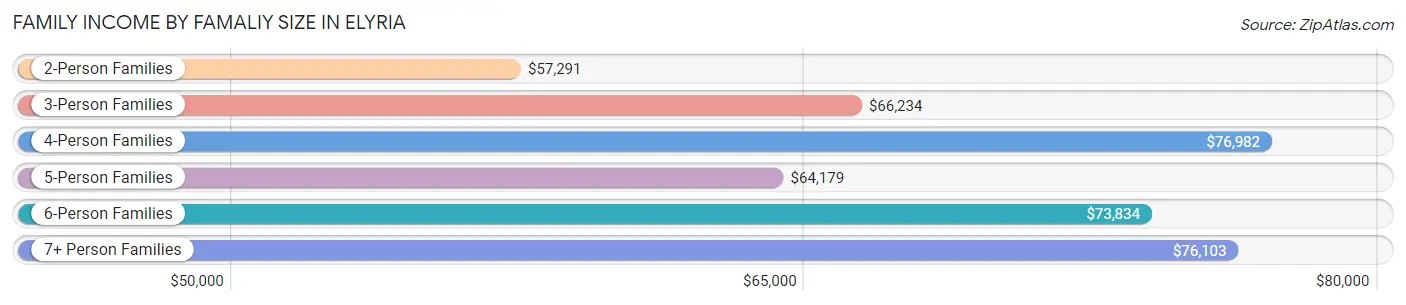
| Income Bracket | # Families | Median Income |
| 2-Person Families | 6,641 (52.5%) | $57,291 |
| 3-Person Families | 2,968 (23.4%) | $66,234 |
| 4-Person Families | 1,837 (14.5%) | $76,982 |
| 5-Person Families | 627 (5.0%) | $64,179 |
| 6-Person Families | 481 (3.8%) | $73,834 |
| 7+ Person Families | 104 (0.8%) | $76,103 |
| Total | 12,658 (100.0%) | $63,476 |
Family Income by Number of Earners in Elyria
The median family income in Elyria is $63,476, with families comprising 3+ earners (1,505) having the highest median family income of $111,362, while families with no earners (2,612) have the lowest median family income of $30,655, accounting for 11.9% and 20.6% of families, respectively.
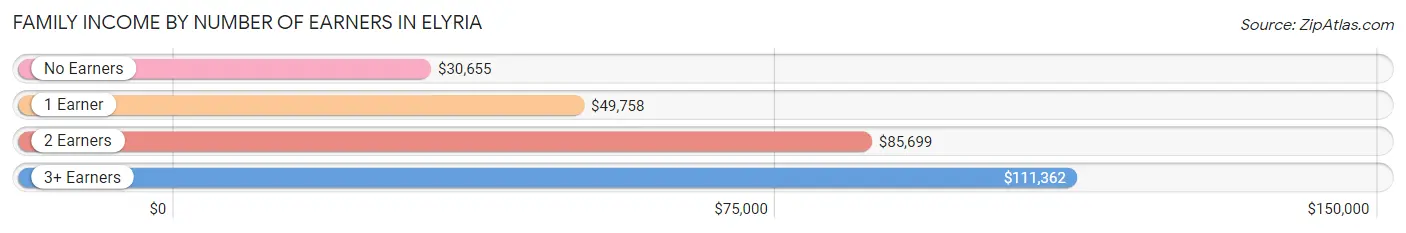
| Number of Earners | # Families | Median Income |
| No Earners | 2,612 (20.6%) | $30,655 |
| 1 Earner | 4,680 (37.0%) | $49,758 |
| 2 Earners | 3,861 (30.5%) | $85,699 |
| 3+ Earners | 1,505 (11.9%) | $111,362 |
| Total | 12,658 (100.0%) | $63,476 |
Household Income in Elyria
Household Income Brackets in Elyria
With 4,693 households falling in the category, the $50,000 to $74,999 income range is the most frequent in Elyria, accounting for 20.3% of all households. In contrast, only 485 households (2.1%) fall into the $200,000+ income bracket, making it the least populous group.
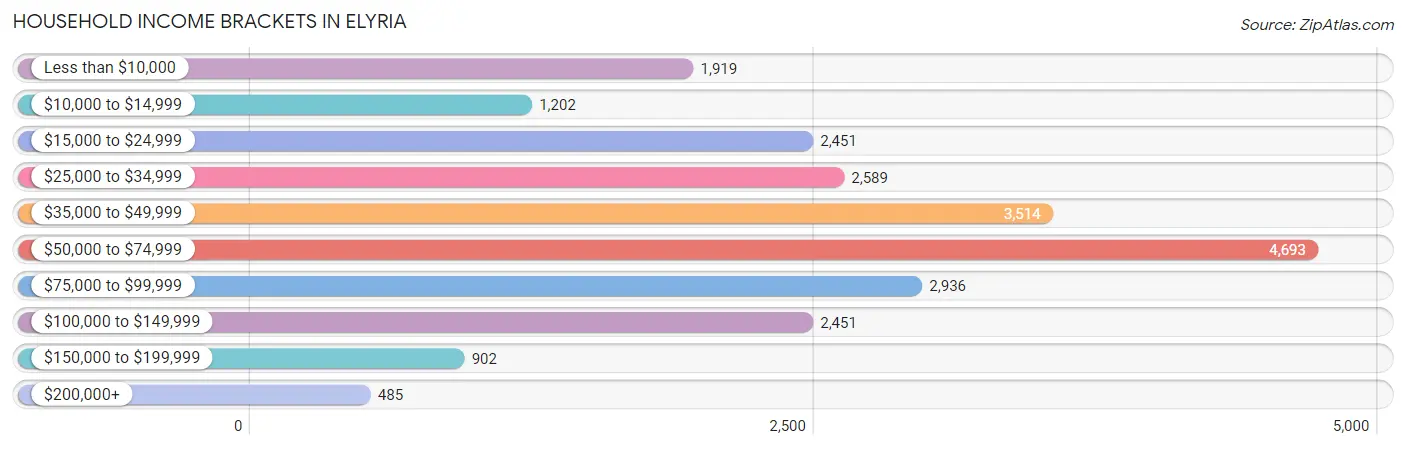
| Income Bracket | # Households | % Households |
| Less than $10,000 | 1,919 | 8.3% |
| $10,000 to $14,999 | 1,202 | 5.2% |
| $15,000 to $24,999 | 2,451 | 10.6% |
| $25,000 to $34,999 | 2,589 | 11.2% |
| $35,000 to $49,999 | 3,514 | 15.2% |
| $50,000 to $74,999 | 4,693 | 20.3% |
| $75,000 to $99,999 | 2,936 | 12.7% |
| $100,000 to $149,999 | 2,451 | 10.6% |
| $150,000 to $199,999 | 902 | 3.9% |
| $200,000+ | 485 | 2.1% |
Household Income by Householder Age in Elyria
The median household income in Elyria is $49,569, with the highest median household income of $61,901 found in the 45 to 64 years age bracket for the primary householder. A total of 8,346 households (36.1%) fall into this category. Meanwhile, the 15 to 24 years age bracket for the primary householder has the lowest median household income of $34,175, with 1,146 households (5.0%) in this group.
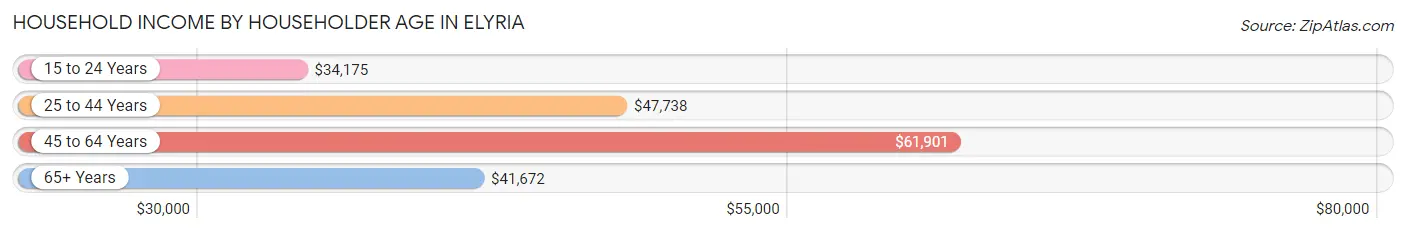
| Income Bracket | # Households | Median Income |
| 15 to 24 Years | 1,146 (5.0%) | $34,175 |
| 25 to 44 Years | 7,359 (31.8%) | $47,738 |
| 45 to 64 Years | 8,346 (36.1%) | $61,901 |
| 65+ Years | 6,268 (27.1%) | $41,672 |
| Total | 23,119 (100.0%) | $49,569 |
Poverty in Elyria
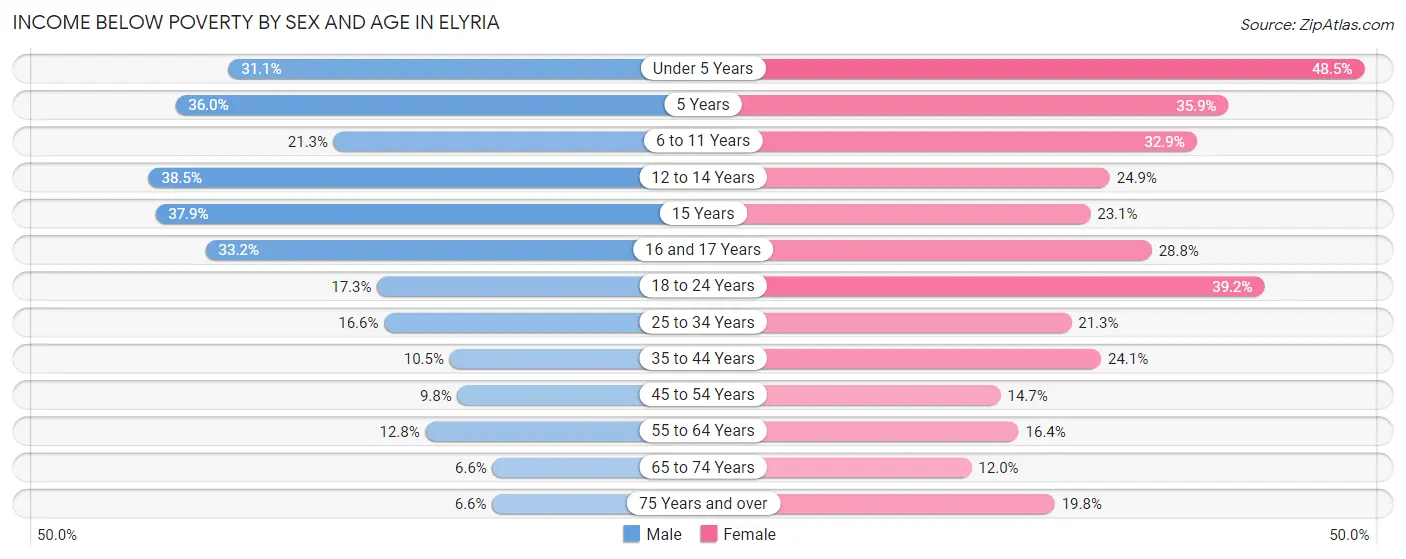
Income Below Poverty by Sex and Age in Elyria
With 16.0% poverty level for males and 23.5% for females among the residents of Elyria, 12 to 14 year old males and under 5 year old females are the most vulnerable to poverty, with 341 males (38.5%) and 704 females (48.5%) in their respective age groups living below the poverty level.
| Age Bracket | Male | Female |
| Under 5 Years | 486 (31.1%) | 704 (48.5%) |
| 5 Years | 121 (36.0%) | 141 (35.9%) |
| 6 to 11 Years | 315 (21.3%) | 634 (32.9%) |
| 12 to 14 Years | 341 (38.5%) | 150 (24.9%) |
| 15 Years | 139 (37.9%) | 86 (23.1%) |
| 16 and 17 Years | 250 (33.2%) | 235 (28.8%) |
| 18 to 24 Years | 474 (17.3%) | 990 (39.2%) |
| 25 to 34 Years | 526 (16.6%) | 722 (21.3%) |
| 35 to 44 Years | 343 (10.5%) | 817 (24.1%) |
| 45 to 54 Years | 287 (9.8%) | 505 (14.7%) |
| 55 to 64 Years | 459 (12.8%) | 613 (16.4%) |
| 65 to 74 Years | 163 (6.6%) | 356 (12.0%) |
| 75 Years and over | 100 (6.6%) | 409 (19.8%) |
| Total | 4,004 (16.0%) | 6,362 (23.5%) |
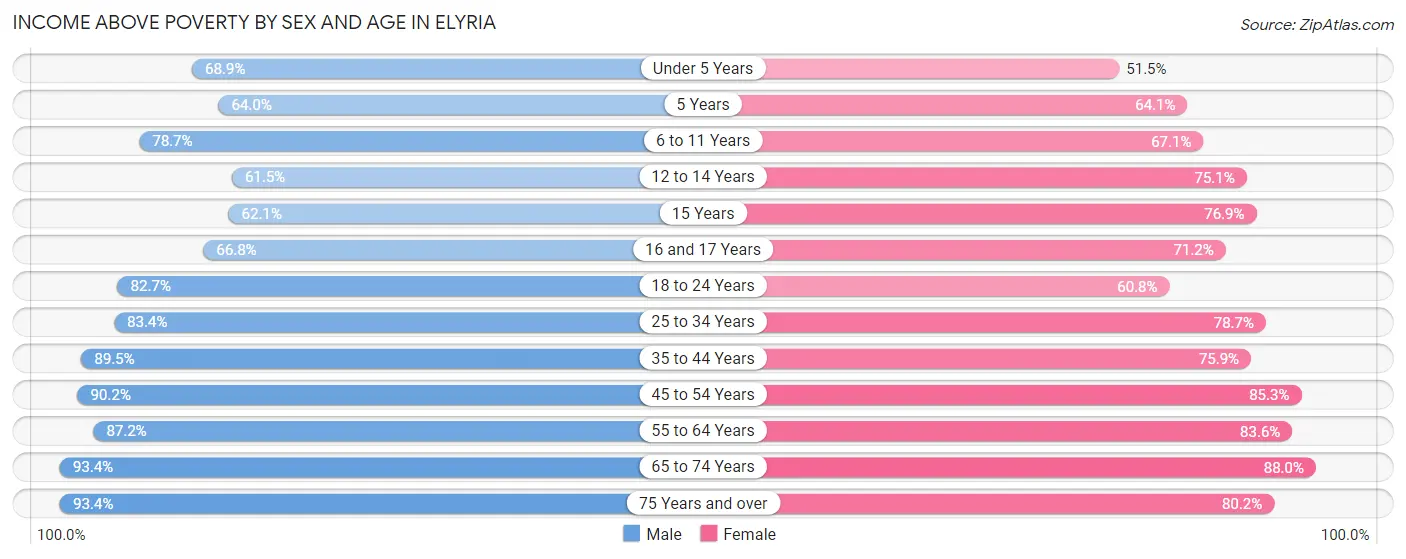
Income Above Poverty by Sex and Age in Elyria
According to the poverty statistics in Elyria, males aged 65 to 74 years and females aged 65 to 74 years are the age groups that are most secure financially, with 93.4% of males and 88.0% of females in these age groups living above the poverty line.
| Age Bracket | Male | Female |
| Under 5 Years | 1,077 (68.9%) | 748 (51.5%) |
| 5 Years | 215 (64.0%) | 252 (64.1%) |
| 6 to 11 Years | 1,164 (78.7%) | 1,292 (67.1%) |
| 12 to 14 Years | 545 (61.5%) | 453 (75.1%) |
| 15 Years | 228 (62.1%) | 287 (76.9%) |
| 16 and 17 Years | 503 (66.8%) | 582 (71.2%) |
| 18 to 24 Years | 2,271 (82.7%) | 1,535 (60.8%) |
| 25 to 34 Years | 2,639 (83.4%) | 2,668 (78.7%) |
| 35 to 44 Years | 2,910 (89.5%) | 2,579 (75.9%) |
| 45 to 54 Years | 2,635 (90.2%) | 2,924 (85.3%) |
| 55 to 64 Years | 3,130 (87.2%) | 3,123 (83.6%) |
| 65 to 74 Years | 2,321 (93.4%) | 2,603 (88.0%) |
| 75 Years and over | 1,418 (93.4%) | 1,661 (80.2%) |
| Total | 21,056 (84.0%) | 20,707 (76.5%) |
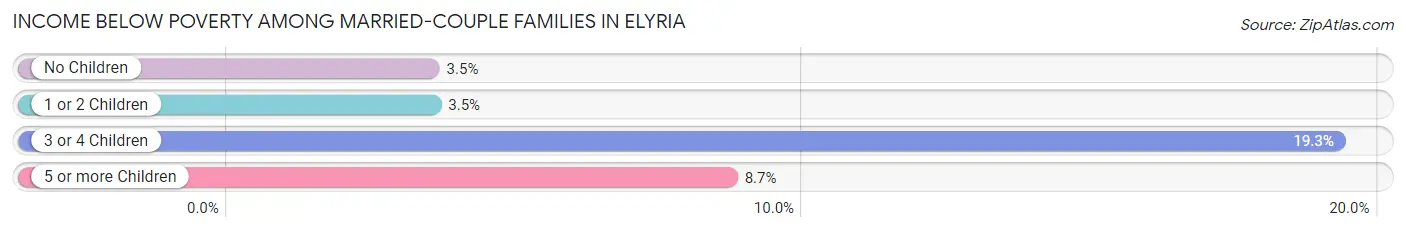
Income Below Poverty Among Married-Couple Families in Elyria
The poverty statistics for married-couple families in Elyria show that 4.3% or 340 of the total 7,967 families live below the poverty line. Families with 3 or 4 children have the highest poverty rate of 19.3%, comprising of 70 families. On the other hand, families with no children have the lowest poverty rate of 3.5%, which includes 183 families.
| Children | Above Poverty | Below Poverty |
| No Children | 5,029 (96.5%) | 183 (3.5%) |
| 1 or 2 Children | 2,263 (96.5%) | 83 (3.5%) |
| 3 or 4 Children | 293 (80.7%) | 70 (19.3%) |
| 5 or more Children | 42 (91.3%) | 4 (8.7%) |
| Total | 7,627 (95.7%) | 340 (4.3%) |
Income Below Poverty Among Single-Parent Households in Elyria
According to the poverty data in Elyria, 28.0% or 411 single-father households and 45.0% or 1,451 single-mother households are living below the poverty line. Among single-father households, those with 3 or 4 children have the highest poverty rate, with 37 households (100.0%) experiencing poverty. Likewise, among single-mother households, those with 3 or 4 children have the highest poverty rate, with 311 households (78.3%) falling below the poverty line.
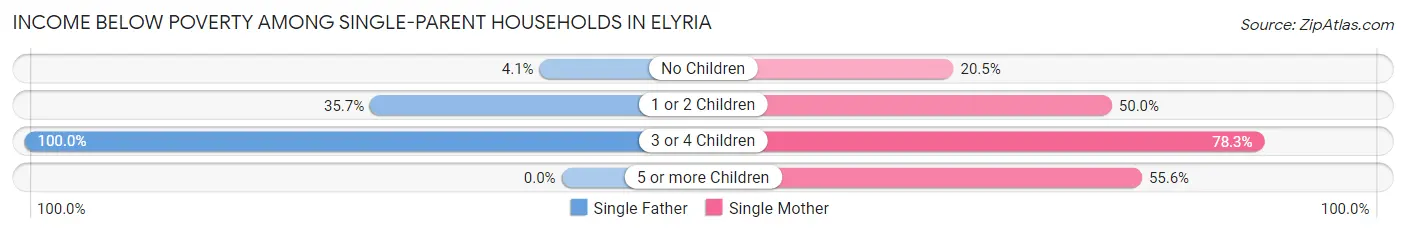
| Children | Single Father | Single Mother |
| No Children | 17 (4.1%) | 190 (20.5%) |
| 1 or 2 Children | 357 (35.7%) | 925 (49.9%) |
| 3 or 4 Children | 37 (100.0%) | 311 (78.3%) |
| 5 or more Children | 0 (0.0%) | 25 (55.6%) |
| Total | 411 (28.0%) | 1,451 (45.0%) |
Income Below Poverty Among Married-Couple vs Single-Parent Households in Elyria
The poverty data for Elyria shows that 340 of the married-couple family households (4.3%) and 1,862 of the single-parent households (39.7%) are living below the poverty level. Within the married-couple family households, those with 3 or 4 children have the highest poverty rate, with 70 households (19.3%) falling below the poverty line. Among the single-parent households, those with 3 or 4 children have the highest poverty rate, with 348 household (80.2%) living below poverty.
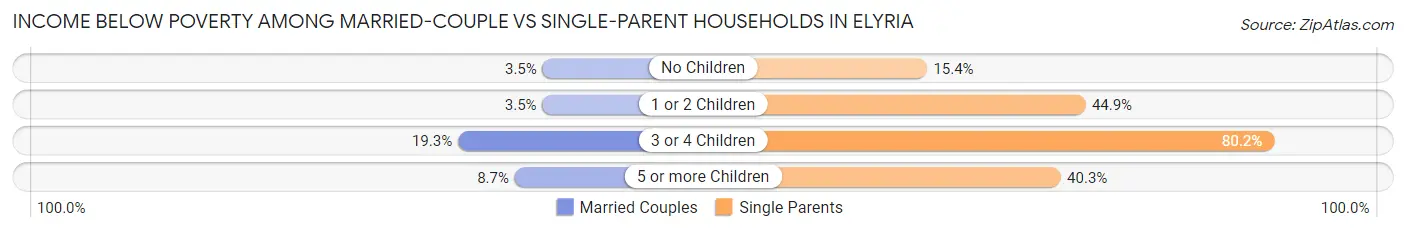
| Children | Married-Couple Families | Single-Parent Households |
| No Children | 183 (3.5%) | 207 (15.4%) |
| 1 or 2 Children | 83 (3.5%) | 1,282 (44.9%) |
| 3 or 4 Children | 70 (19.3%) | 348 (80.2%) |
| 5 or more Children | 4 (8.7%) | 25 (40.3%) |
| Total | 340 (4.3%) | 1,862 (39.7%) |
Race in Elyria
The most populous races in Elyria are White / Caucasian (39,329 | 74.5%), Black / African American (6,616 | 12.5%), and Two or more Races (5,726 | 10.8%).
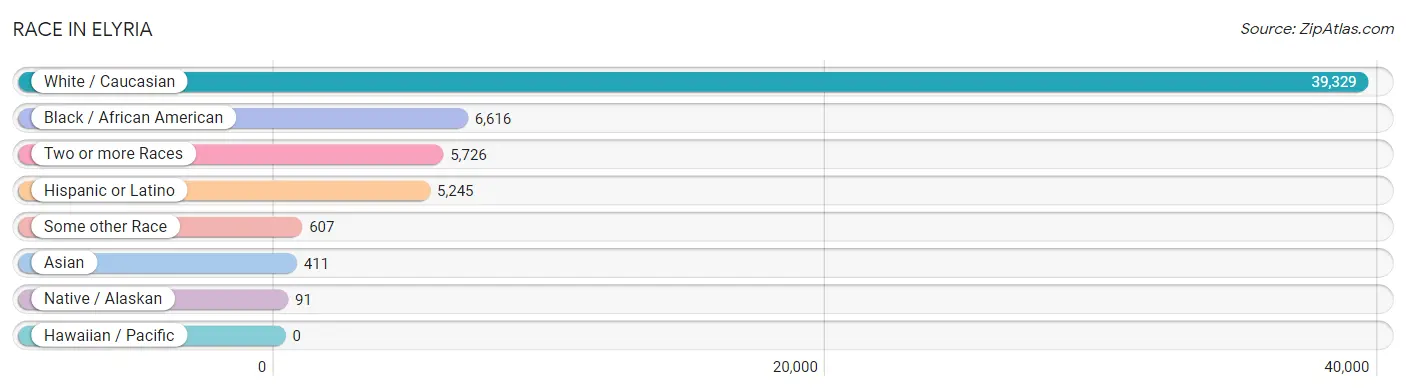
| Race | # Population | % Population |
| Asian | 411 | 0.8% |
| Black / African American | 6,616 | 12.5% |
| Hawaiian / Pacific | 0 | 0.0% |
| Hispanic or Latino | 5,245 | 9.9% |
| Native / Alaskan | 91 | 0.2% |
| White / Caucasian | 39,329 | 74.5% |
| Two or more Races | 5,726 | 10.8% |
| Some other Race | 607 | 1.1% |
| Total | 52,780 | 100.0% |
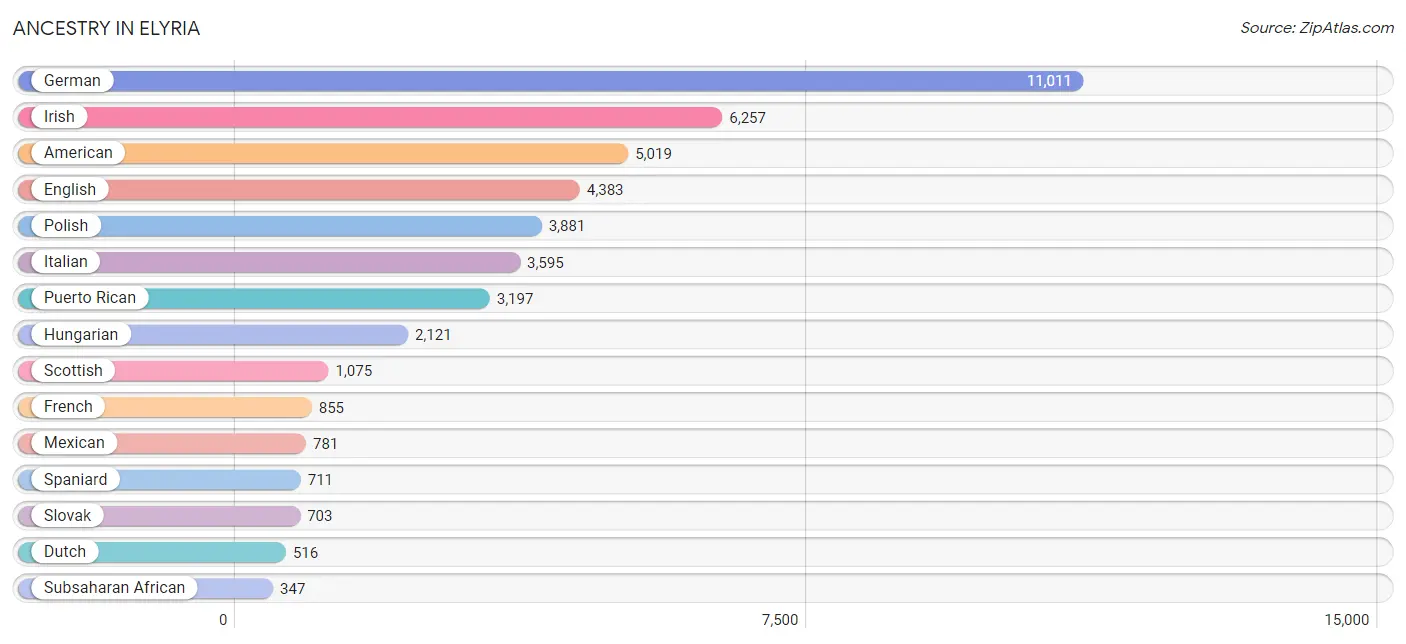
Ancestry in Elyria
The most populous ancestries reported in Elyria are German (11,011 | 20.9%), Irish (6,257 | 11.8%), American (5,019 | 9.5%), English (4,383 | 8.3%), and Polish (3,881 | 7.3%), together accounting for 57.9% of all Elyria residents.
| Ancestry | # Population | % Population |
| African | 341 | 0.6% |
| American | 5,019 | 9.5% |
| Arab | 126 | 0.2% |
| Argentinean | 37 | 0.1% |
| Armenian | 5 | 0.0% |
| Austrian | 66 | 0.1% |
| Bhutanese | 74 | 0.1% |
| Blackfeet | 300 | 0.6% |
| British | 155 | 0.3% |
| Bulgarian | 36 | 0.1% |
| Burmese | 79 | 0.2% |
| Canadian | 70 | 0.1% |
| Central American | 212 | 0.4% |
| Central American Indian | 184 | 0.4% |
| Cherokee | 223 | 0.4% |
| Choctaw | 7 | 0.0% |
| Colombian | 57 | 0.1% |
| Costa Rican | 82 | 0.2% |
| Croatian | 171 | 0.3% |
| Cuban | 71 | 0.1% |
| Cypriot | 56 | 0.1% |
| Czech | 246 | 0.5% |
| Czechoslovakian | 276 | 0.5% |
| Danish | 26 | 0.1% |
| Dominican | 28 | 0.1% |
| Dutch | 516 | 1.0% |
| Eastern European | 338 | 0.6% |
| English | 4,383 | 8.3% |
| European | 345 | 0.6% |
| Filipino | 18 | 0.0% |
| Finnish | 76 | 0.1% |
| French | 855 | 1.6% |
| French Canadian | 179 | 0.3% |
| German | 11,011 | 20.9% |
| Greek | 121 | 0.2% |
| Guatemalan | 14 | 0.0% |
| Honduran | 41 | 0.1% |
| Hungarian | 2,121 | 4.0% |
| Indian (Asian) | 160 | 0.3% |
| Iranian | 1 | 0.0% |
| Irish | 6,257 | 11.8% |
| Iroquois | 32 | 0.1% |
| Italian | 3,595 | 6.8% |
| Jamaican | 26 | 0.1% |
| Jordanian | 20 | 0.0% |
| Korean | 168 | 0.3% |
| Latvian | 15 | 0.0% |
| Lebanese | 59 | 0.1% |
| Lithuanian | 67 | 0.1% |
| Macedonian | 95 | 0.2% |
| Mexican | 781 | 1.5% |
| Navajo | 17 | 0.0% |
| Nigerian | 6 | 0.0% |
| Northern European | 9 | 0.0% |
| Norwegian | 126 | 0.2% |
| Osage | 38 | 0.1% |
| Pakistani | 90 | 0.2% |
| Palestinian | 10 | 0.0% |
| Pennsylvania German | 42 | 0.1% |
| Polish | 3,881 | 7.3% |
| Portuguese | 71 | 0.1% |
| Puerto Rican | 3,197 | 6.1% |
| Romanian | 120 | 0.2% |
| Russian | 301 | 0.6% |
| Salvadoran | 75 | 0.1% |
| Samoan | 77 | 0.2% |
| Scandinavian | 21 | 0.0% |
| Scotch-Irish | 282 | 0.5% |
| Scottish | 1,075 | 2.0% |
| Serbian | 47 | 0.1% |
| Slavic | 34 | 0.1% |
| Slovak | 703 | 1.3% |
| Slovene | 219 | 0.4% |
| South American | 129 | 0.2% |
| Spaniard | 711 | 1.3% |
| Spanish | 15 | 0.0% |
| Sri Lankan | 24 | 0.1% |
| Subsaharan African | 347 | 0.7% |
| Swedish | 294 | 0.6% |
| Swiss | 168 | 0.3% |
| Thai | 21 | 0.0% |
| Ukrainian | 213 | 0.4% |
| Venezuelan | 35 | 0.1% |
| Welsh | 320 | 0.6% |
| West Indian | 20 | 0.0% |
| Yugoslavian | 41 | 0.1% | View All 86 Rows |
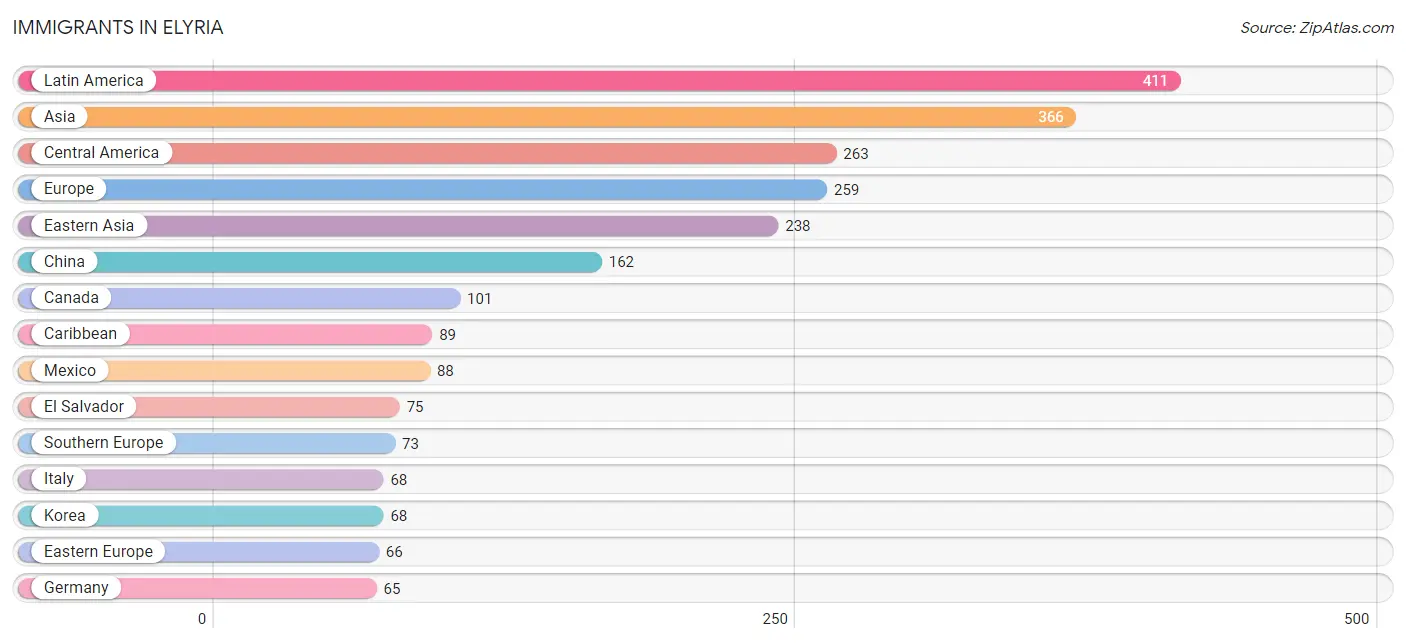
Immigrants in Elyria
The most numerous immigrant groups reported in Elyria came from Latin America (411 | 0.8%), Asia (366 | 0.7%), Central America (263 | 0.5%), Europe (259 | 0.5%), and Eastern Asia (238 | 0.4%), together accounting for 2.9% of all Elyria residents.
| Immigration Origin | # Population | % Population |
| Africa | 42 | 0.1% |
| Argentina | 24 | 0.1% |
| Asia | 366 | 0.7% |
| Bosnia and Herzegovina | 8 | 0.0% |
| Canada | 101 | 0.2% |
| Caribbean | 89 | 0.2% |
| Central America | 263 | 0.5% |
| China | 162 | 0.3% |
| Congo | 28 | 0.1% |
| Cuba | 39 | 0.1% |
| Denmark | 12 | 0.0% |
| Dominican Republic | 28 | 0.1% |
| Eastern Africa | 7 | 0.0% |
| Eastern Asia | 238 | 0.4% |
| Eastern Europe | 66 | 0.1% |
| El Salvador | 75 | 0.1% |
| England | 43 | 0.1% |
| Europe | 259 | 0.5% |
| Germany | 65 | 0.1% |
| Honduras | 41 | 0.1% |
| Hong Kong | 20 | 0.0% |
| Hungary | 13 | 0.0% |
| India | 14 | 0.0% |
| Iran | 1 | 0.0% |
| Israel | 10 | 0.0% |
| Italy | 68 | 0.1% |
| Jamaica | 22 | 0.0% |
| Japan | 8 | 0.0% |
| Jordan | 10 | 0.0% |
| Kazakhstan | 15 | 0.0% |
| Kenya | 7 | 0.0% |
| Korea | 68 | 0.1% |
| Latin America | 411 | 0.8% |
| Mexico | 88 | 0.2% |
| Middle Africa | 28 | 0.1% |
| Nicaragua | 59 | 0.1% |
| Northern Europe | 55 | 0.1% |
| Pakistan | 15 | 0.0% |
| Philippines | 14 | 0.0% |
| Poland | 20 | 0.0% |
| Portugal | 5 | 0.0% |
| Romania | 19 | 0.0% |
| Saudi Arabia | 13 | 0.0% |
| South America | 59 | 0.1% |
| South Central Asia | 45 | 0.1% |
| South Eastern Asia | 50 | 0.1% |
| Southern Europe | 73 | 0.1% |
| Taiwan | 14 | 0.0% |
| Thailand | 12 | 0.0% |
| Venezuela | 35 | 0.1% |
| Vietnam | 24 | 0.1% |
| Western Africa | 7 | 0.0% |
| Western Asia | 33 | 0.1% |
| Western Europe | 65 | 0.1% | View All 54 Rows |
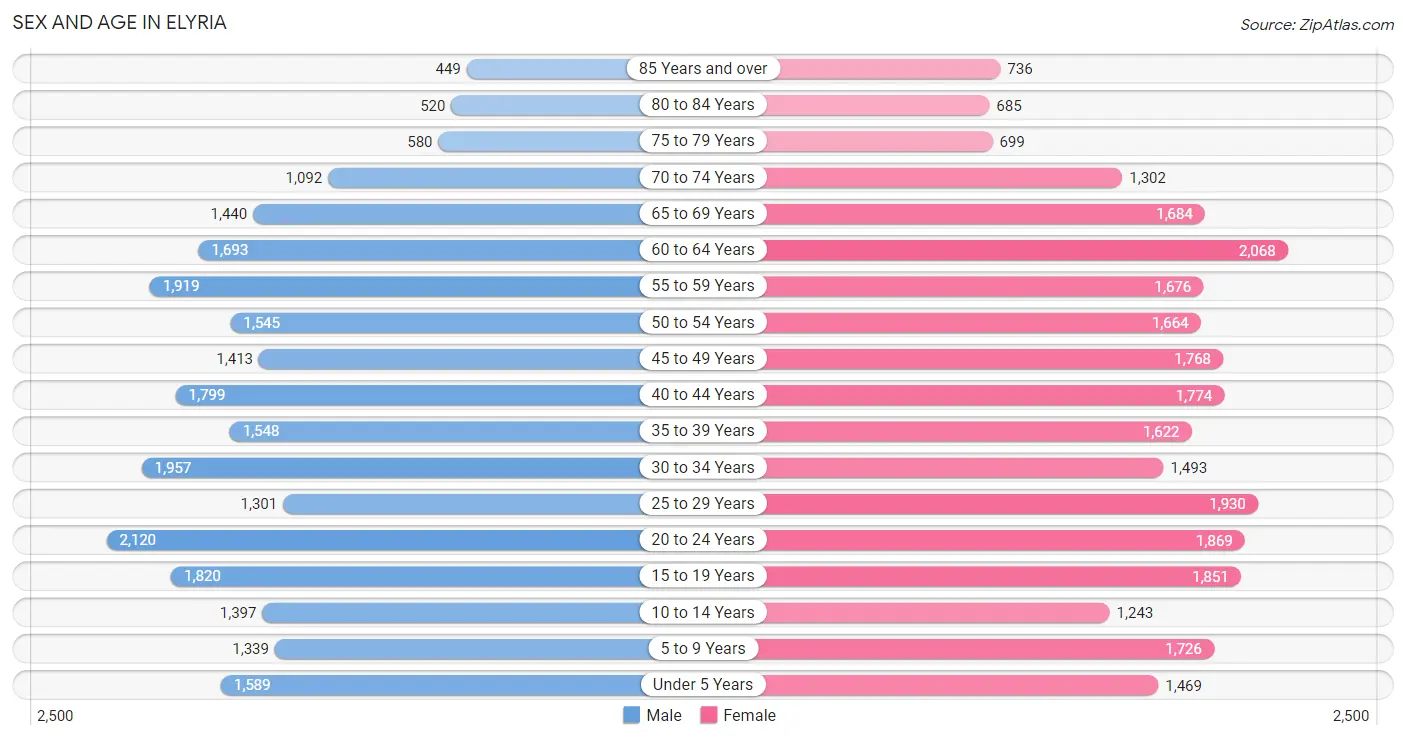
Sex and Age in Elyria
Sex and Age in Elyria
The most populous age groups in Elyria are 20 to 24 Years (2,120 | 8.3%) for men and 60 to 64 Years (2,068 | 7.6%) for women.
| Age Bracket | Male | Female |
| Under 5 Years | 1,589 (6.2%) | 1,469 (5.4%) |
| 5 to 9 Years | 1,339 (5.2%) | 1,726 (6.3%) |
| 10 to 14 Years | 1,397 (5.5%) | 1,243 (4.6%) |
| 15 to 19 Years | 1,820 (7.1%) | 1,851 (6.8%) |
| 20 to 24 Years | 2,120 (8.3%) | 1,869 (6.9%) |
| 25 to 29 Years | 1,301 (5.1%) | 1,930 (7.1%) |
| 30 to 34 Years | 1,957 (7.7%) | 1,493 (5.5%) |
| 35 to 39 Years | 1,548 (6.1%) | 1,622 (5.9%) |
| 40 to 44 Years | 1,799 (7.0%) | 1,774 (6.5%) |
| 45 to 49 Years | 1,413 (5.5%) | 1,768 (6.5%) |
| 50 to 54 Years | 1,545 (6.0%) | 1,664 (6.1%) |
| 55 to 59 Years | 1,919 (7.5%) | 1,676 (6.1%) |
| 60 to 64 Years | 1,693 (6.6%) | 2,068 (7.6%) |
| 65 to 69 Years | 1,440 (5.6%) | 1,684 (6.2%) |
| 70 to 74 Years | 1,092 (4.3%) | 1,302 (4.8%) |
| 75 to 79 Years | 580 (2.3%) | 699 (2.6%) |
| 80 to 84 Years | 520 (2.0%) | 685 (2.5%) |
| 85 Years and over | 449 (1.8%) | 736 (2.7%) |
| Total | 25,521 (100.0%) | 27,259 (100.0%) |
Families and Households in Elyria
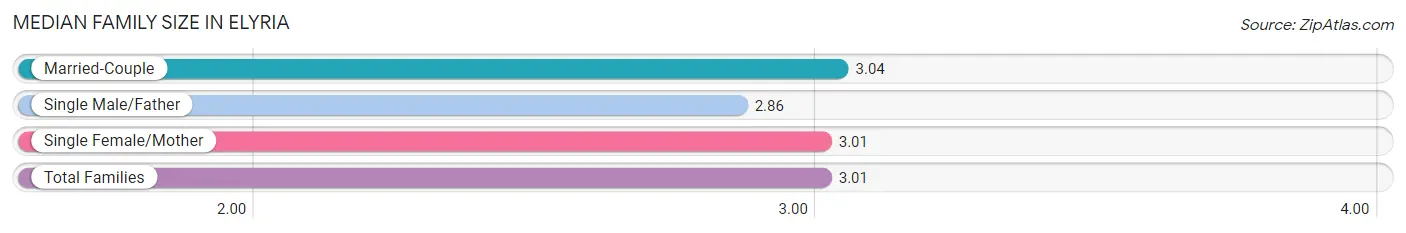
Median Family Size in Elyria
The median family size in Elyria is 3.01 persons per family, with married-couple families (7,967 | 62.9%) accounting for the largest median family size of 3.04 persons per family. On the other hand, single male/father families (1,469 | 11.6%) represent the smallest median family size with 2.86 persons per family.
| Family Type | # Families | Family Size |
| Married-Couple | 7,967 (62.9%) | 3.04 |
| Single Male/Father | 1,469 (11.6%) | 2.86 |
| Single Female/Mother | 3,222 (25.5%) | 3.01 |
| Total Families | 12,658 (100.0%) | 3.01 |
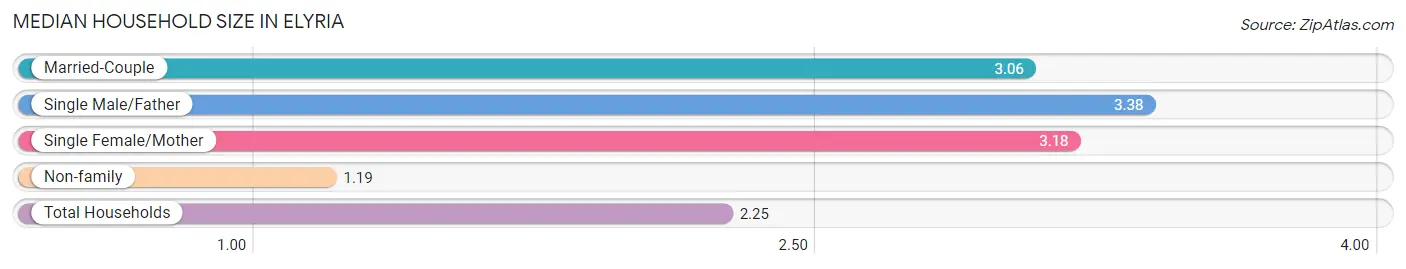
Median Household Size in Elyria
The median household size in Elyria is 2.25 persons per household, with single male/father households (1,469 | 6.4%) accounting for the largest median household size of 3.38 persons per household. non-family households (10,461 | 45.3%) represent the smallest median household size with 1.19 persons per household.
| Household Type | # Households | Household Size |
| Married-Couple | 7,967 (34.5%) | 3.06 |
| Single Male/Father | 1,469 (6.4%) | 3.38 |
| Single Female/Mother | 3,222 (13.9%) | 3.18 |
| Non-family | 10,461 (45.3%) | 1.19 |
| Total Households | 23,119 (100.0%) | 2.25 |
Household Size by Marriage Status in Elyria
Out of a total of 23,119 households in Elyria, 12,658 (54.7%) are family households, while 10,461 (45.3%) are nonfamily households. The most numerous type of family households are 2-person households, comprising 6,102, and the most common type of nonfamily households are 1-person households, comprising 8,810.
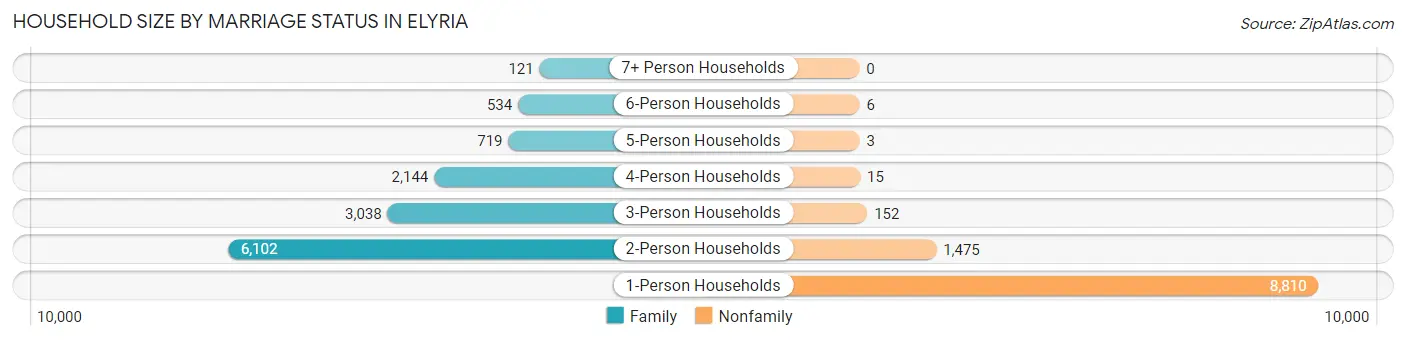
| Household Size | Family Households | Nonfamily Households |
| 1-Person Households | - | 8,810 (38.1%) |
| 2-Person Households | 6,102 (26.4%) | 1,475 (6.4%) |
| 3-Person Households | 3,038 (13.1%) | 152 (0.7%) |
| 4-Person Households | 2,144 (9.3%) | 15 (0.1%) |
| 5-Person Households | 719 (3.1%) | 3 (0.0%) |
| 6-Person Households | 534 (2.3%) | 6 (0.0%) |
| 7+ Person Households | 121 (0.5%) | 0 (0.0%) |
| Total | 12,658 (54.7%) | 10,461 (45.3%) |
Female Fertility in Elyria
Fertility by Age in Elyria
Average fertility rate in Elyria is 97.0 births per 1,000 women. Women in the age bracket of 20 to 34 years have the highest fertility rate with 151.0 births per 1,000 women. Women in the age bracket of 20 to 34 years acount for 65.3% of all women with births.
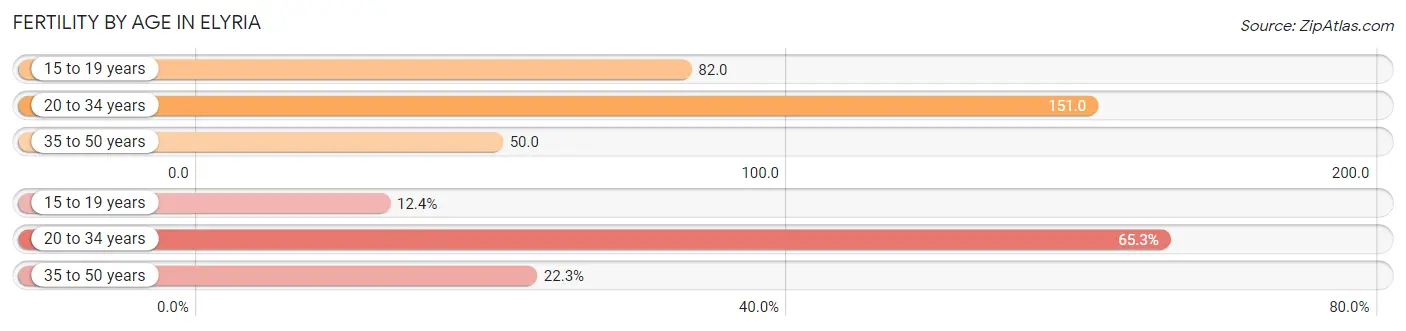
| Age Bracket | Women with Births | Births / 1,000 Women |
| 15 to 19 years | 151 (12.3%) | 82.0 |
| 20 to 34 years | 799 (65.3%) | 151.0 |
| 35 to 50 years | 273 (22.3%) | 50.0 |
| Total | 1,223 (100.0%) | 97.0 |
Fertility by Age by Marriage Status in Elyria
34.6% of women with births (1,223) in Elyria are married. The highest percentage of unmarried women with births falls into 15 to 19 years age bracket with 100.0% of them unmarried at the time of birth, while the lowest percentage of unmarried women with births belong to 20 to 34 years age bracket with 60.2% of them unmarried.
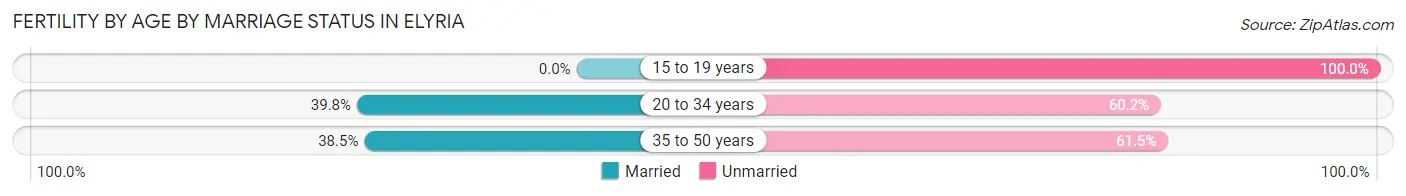
| Age Bracket | Married | Unmarried |
| 15 to 19 years | 0 (0.0%) | 151 (100.0%) |
| 20 to 34 years | 318 (39.8%) | 481 (60.2%) |
| 35 to 50 years | 105 (38.5%) | 168 (61.5%) |
| Total | 423 (34.6%) | 800 (65.4%) |
Fertility by Education in Elyria
Average fertility rate in Elyria is 97.0 births per 1,000 women. Women with the education attainment of less than high school have the highest fertility rate of 153.0 births per 1,000 women, while women with the education attainment of graduate degree have the lowest fertility at 14.0 births per 1,000 women. Women with the education attainment of college or associate's degree represent 35.8% of all women with births.
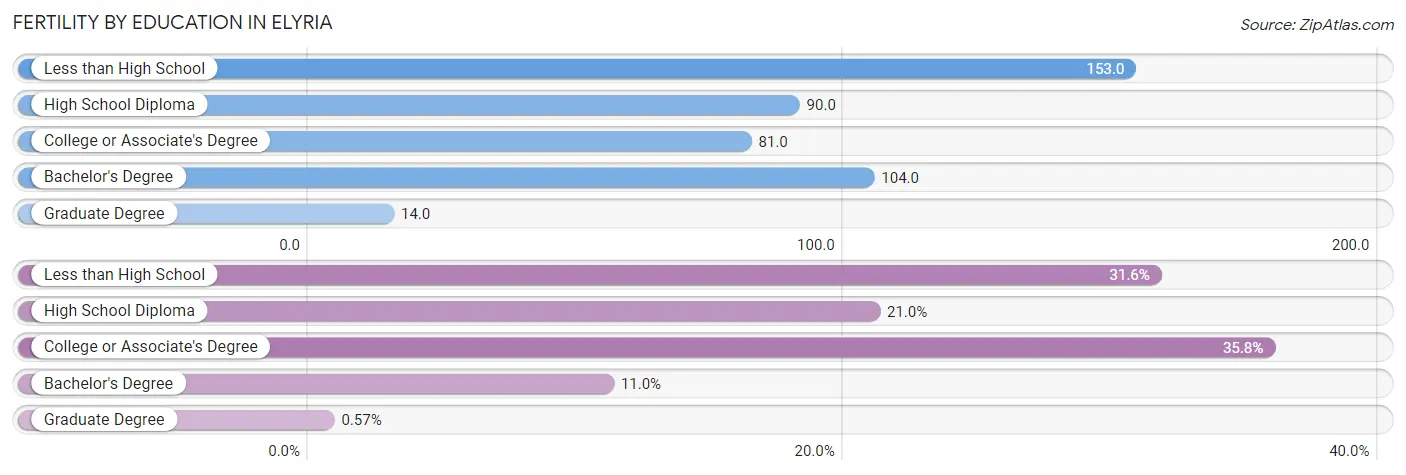
| Educational Attainment | Women with Births | Births / 1,000 Women |
| Less than High School | 386 (31.6%) | 153.0 |
| High School Diploma | 257 (21.0%) | 90.0 |
| College or Associate's Degree | 438 (35.8%) | 81.0 |
| Bachelor's Degree | 135 (11.0%) | 104.0 |
| Graduate Degree | 7 (0.6%) | 14.0 |
| Total | 1,223 (100.0%) | 97.0 |
Fertility by Education by Marriage Status in Elyria
65.4% of women with births in Elyria are unmarried. Women with the educational attainment of graduate degree are most likely to be married with 100.0% of them married at childbirth, while women with the educational attainment of less than high school are least likely to be married with 100.0% of them unmarried at childbirth.
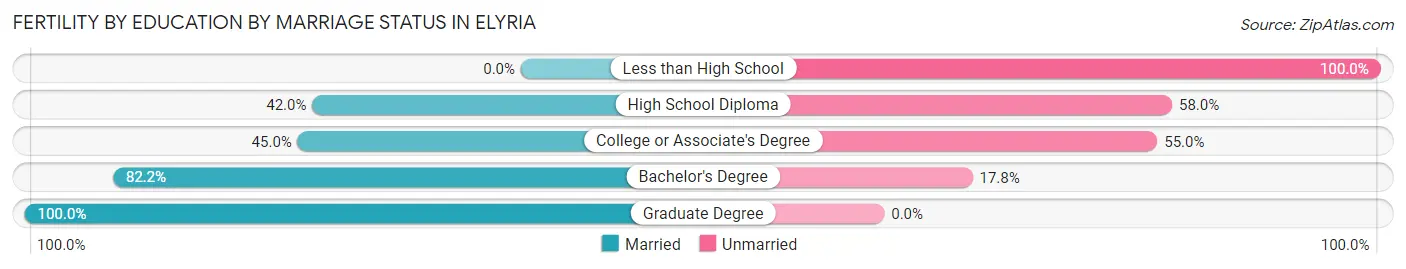
| Educational Attainment | Married | Unmarried |
| Less than High School | 0 (0.0%) | 386 (100.0%) |
| High School Diploma | 108 (42.0%) | 149 (58.0%) |
| College or Associate's Degree | 197 (45.0%) | 241 (55.0%) |
| Bachelor's Degree | 111 (82.2%) | 24 (17.8%) |
| Graduate Degree | 7 (100.0%) | 0 (0.0%) |
| Total | 423 (34.6%) | 800 (65.4%) |
Employment Characteristics in Elyria
Employment by Class of Employer in Elyria
Among the 24,874 employed individuals in Elyria, private company employees (18,941 | 76.1%), not-for-profit organizations (2,096 | 8.4%), and local government employees (1,555 | 6.2%) make up the most common classes of employment.
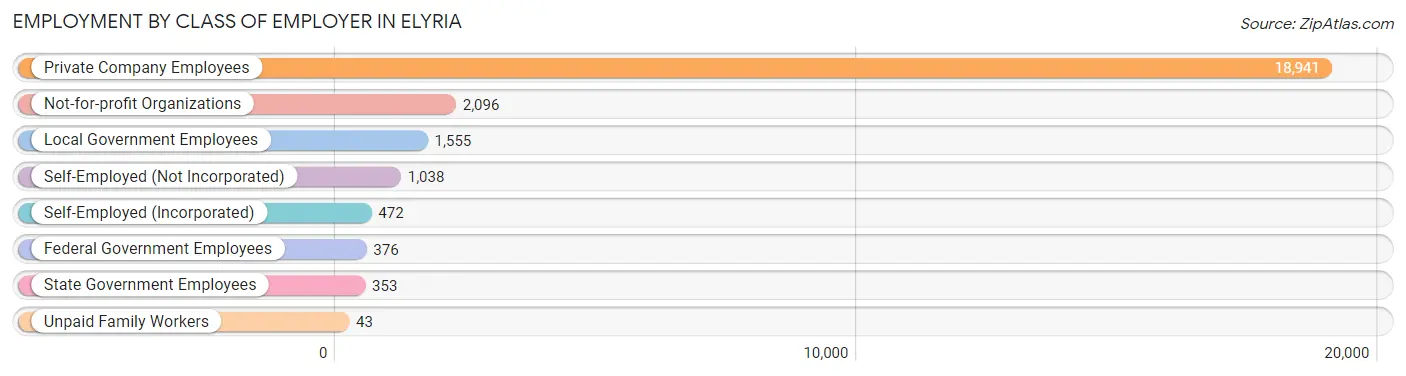
| Employer Class | # Employees | % Employees |
| Private Company Employees | 18,941 | 76.1% |
| Self-Employed (Incorporated) | 472 | 1.9% |
| Self-Employed (Not Incorporated) | 1,038 | 4.2% |
| Not-for-profit Organizations | 2,096 | 8.4% |
| Local Government Employees | 1,555 | 6.2% |
| State Government Employees | 353 | 1.4% |
| Federal Government Employees | 376 | 1.5% |
| Unpaid Family Workers | 43 | 0.2% |
| Total | 24,874 | 100.0% |
Employment Status by Age in Elyria
According to the labor force statistics for Elyria, out of the total population over 16 years of age (43,266), 61.4% or 26,565 individuals are in the labor force, with 4.9% or 1,302 of them unemployed. The age group with the highest labor force participation rate is 45 to 54 years, with 85.2% or 5,444 individuals in the labor force. Within the labor force, the 16 to 19 years age range has the highest percentage of unemployed individuals, with 11.9% or 175 of them being unemployed.
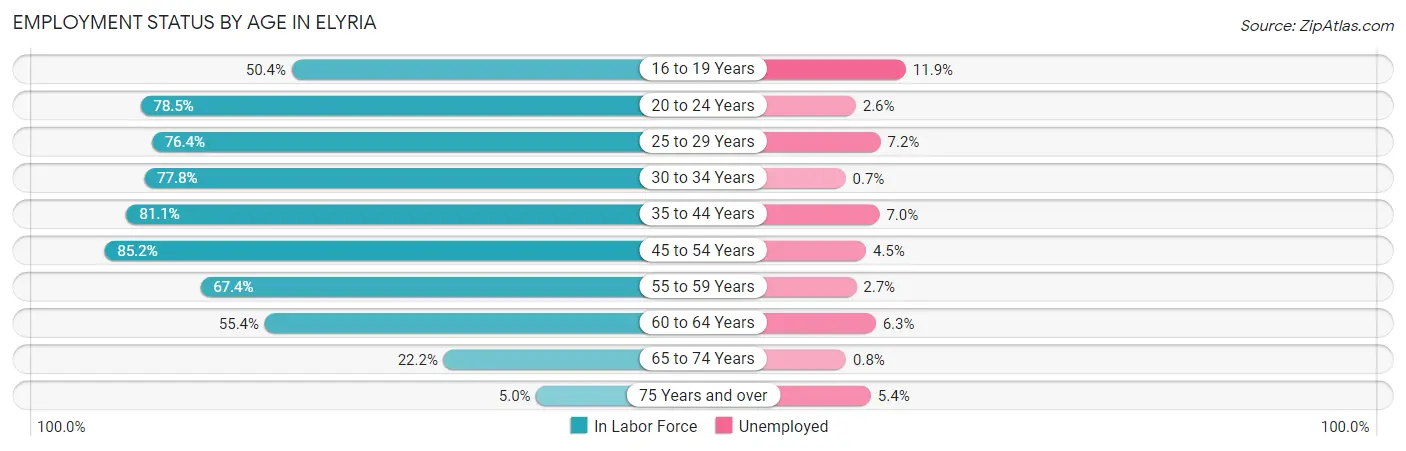
| Age Bracket | In Labor Force | Unemployed |
| 16 to 19 Years | 1,472 (50.4%) | 175 (11.9%) |
| 20 to 24 Years | 3,131 (78.5%) | 81 (2.6%) |
| 25 to 29 Years | 2,468 (76.4%) | 178 (7.2%) |
| 30 to 34 Years | 2,684 (77.8%) | 19 (0.7%) |
| 35 to 44 Years | 5,469 (81.1%) | 383 (7.0%) |
| 45 to 54 Years | 5,444 (85.2%) | 245 (4.5%) |
| 55 to 59 Years | 2,423 (67.4%) | 65 (2.7%) |
| 60 to 64 Years | 2,084 (55.4%) | 131 (6.3%) |
| 65 to 74 Years | 1,225 (22.2%) | 10 (0.8%) |
| 75 Years and over | 183 (5.0%) | 10 (5.4%) |
| Total | 26,565 (61.4%) | 1,302 (4.9%) |
Employment Status by Educational Attainment in Elyria
According to labor force statistics for Elyria, 75.7% of individuals (20,568) out of the total population between 25 and 64 years of age (27,170) are in the labor force, with 5.0% or 1,028 of them being unemployed. The group with the highest labor force participation rate are those with the educational attainment of bachelor's degree or higher, with 84.6% or 3,479 individuals in the labor force. Within the labor force, individuals with less than high school education have the highest percentage of unemployment, with 12.4% or 217 of them being unemployed.
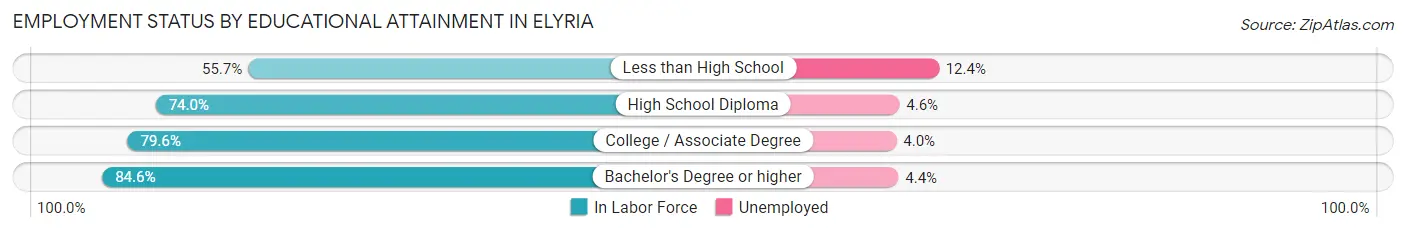
| Educational Attainment | In Labor Force | Unemployed |
| Less than High School | 1,747 (55.7%) | 389 (12.4%) |
| High School Diploma | 6,755 (74.0%) | 420 (4.6%) |
| College / Associate Degree | 8,591 (79.6%) | 432 (4.0%) |
| Bachelor's Degree or higher | 3,479 (84.6%) | 181 (4.4%) |
| Total | 20,568 (75.7%) | 1,358 (5.0%) |
Employment Occupations by Sex in Elyria
Management, Business, Science and Arts Occupations
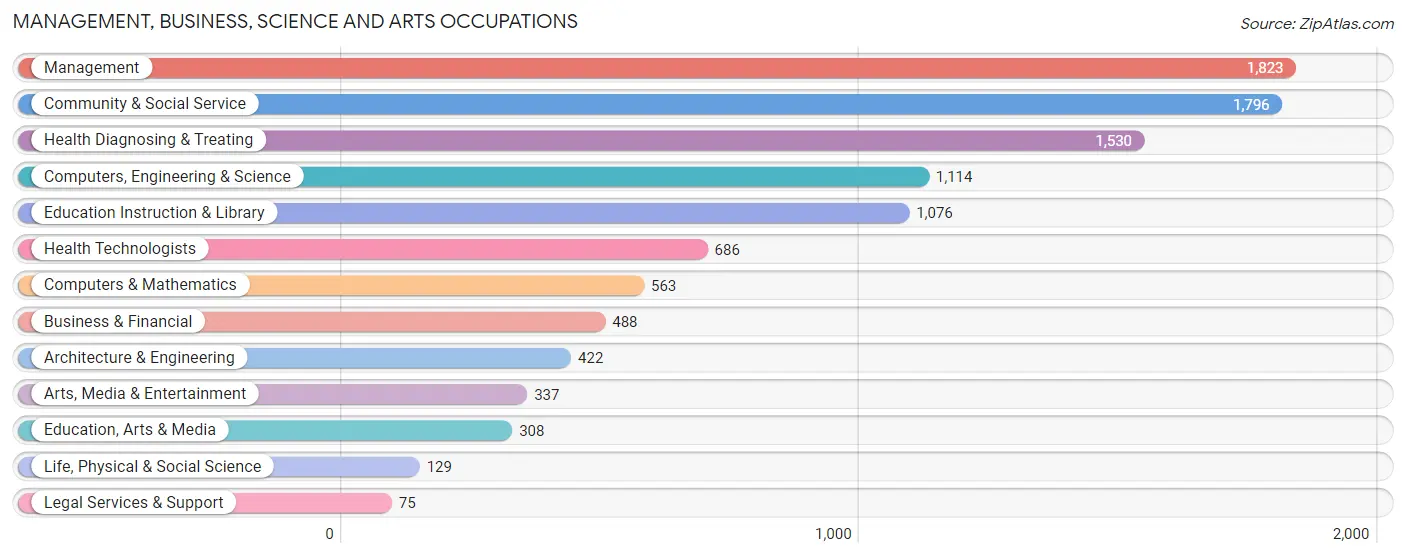
The most common Management, Business, Science and Arts occupations in Elyria are Management (1,823 | 7.2%), Community & Social Service (1,796 | 7.1%), Health Diagnosing & Treating (1,530 | 6.0%), Computers, Engineering & Science (1,114 | 4.4%), and Education Instruction & Library (1,076 | 4.3%).
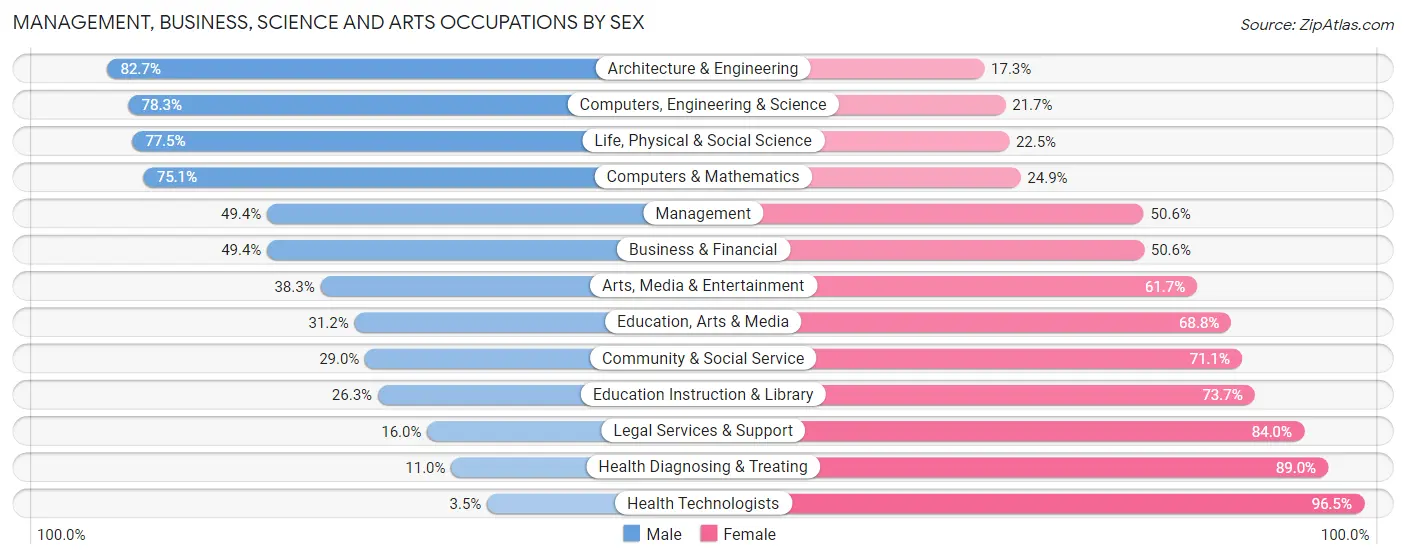
Management, Business, Science and Arts Occupations by Sex
Within the Management, Business, Science and Arts occupations in Elyria, the most male-oriented occupations are Architecture & Engineering (82.7%), Computers, Engineering & Science (78.3%), and Life, Physical & Social Science (77.5%), while the most female-oriented occupations are Health Technologists (96.5%), Health Diagnosing & Treating (89.0%), and Legal Services & Support (84.0%).
| Occupation | Male | Female |
| Management | 901 (49.4%) | 922 (50.6%) |
| Business & Financial | 241 (49.4%) | 247 (50.6%) |
| Computers, Engineering & Science | 872 (78.3%) | 242 (21.7%) |
| Computers & Mathematics | 423 (75.1%) | 140 (24.9%) |
| Architecture & Engineering | 349 (82.7%) | 73 (17.3%) |
| Life, Physical & Social Science | 100 (77.5%) | 29 (22.5%) |
| Community & Social Service | 520 (28.9%) | 1,276 (71.1%) |
| Education, Arts & Media | 96 (31.2%) | 212 (68.8%) |
| Legal Services & Support | 12 (16.0%) | 63 (84.0%) |
| Education Instruction & Library | 283 (26.3%) | 793 (73.7%) |
| Arts, Media & Entertainment | 129 (38.3%) | 208 (61.7%) |
| Health Diagnosing & Treating | 168 (11.0%) | 1,362 (89.0%) |
| Health Technologists | 24 (3.5%) | 662 (96.5%) |
| Total (Category) | 2,702 (40.0%) | 4,049 (60.0%) |
| Total (Overall) | 12,763 (50.5%) | 12,513 (49.5%) |
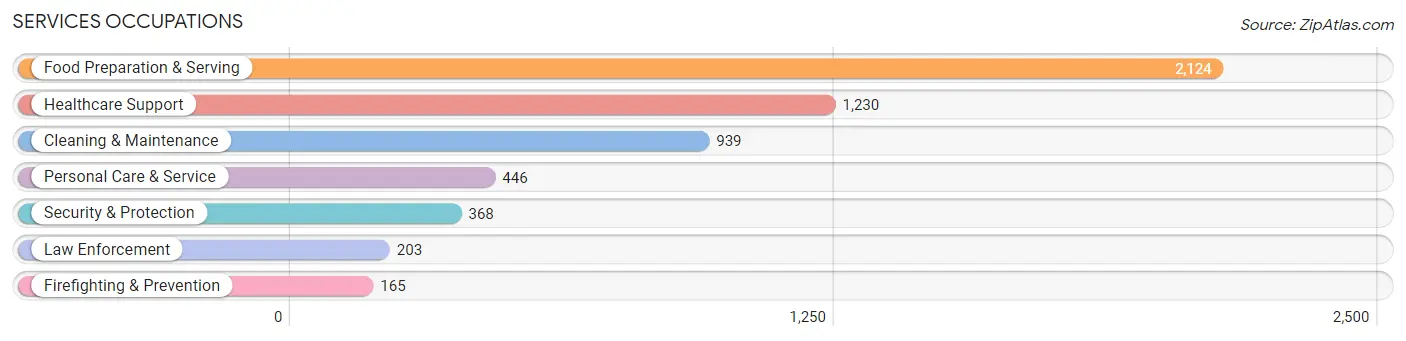
Services Occupations
The most common Services occupations in Elyria are Food Preparation & Serving (2,124 | 8.4%), Healthcare Support (1,230 | 4.9%), Cleaning & Maintenance (939 | 3.7%), Personal Care & Service (446 | 1.8%), and Security & Protection (368 | 1.5%).
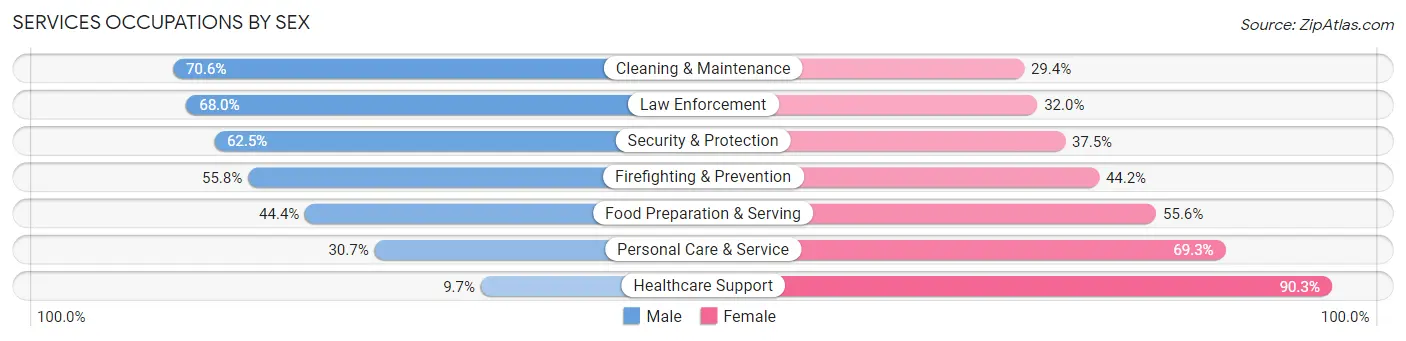
Services Occupations by Sex
Within the Services occupations in Elyria, the most male-oriented occupations are Cleaning & Maintenance (70.6%), Law Enforcement (68.0%), and Security & Protection (62.5%), while the most female-oriented occupations are Healthcare Support (90.3%), Personal Care & Service (69.3%), and Food Preparation & Serving (55.6%).
| Occupation | Male | Female |
| Healthcare Support | 119 (9.7%) | 1,111 (90.3%) |
| Security & Protection | 230 (62.5%) | 138 (37.5%) |
| Firefighting & Prevention | 92 (55.8%) | 73 (44.2%) |
| Law Enforcement | 138 (68.0%) | 65 (32.0%) |
| Food Preparation & Serving | 944 (44.4%) | 1,180 (55.6%) |
| Cleaning & Maintenance | 663 (70.6%) | 276 (29.4%) |
| Personal Care & Service | 137 (30.7%) | 309 (69.3%) |
| Total (Category) | 2,093 (41.0%) | 3,014 (59.0%) |
| Total (Overall) | 12,763 (50.5%) | 12,513 (49.5%) |
Sales and Office Occupations
The most common Sales and Office occupations in Elyria are Office & Administration (3,121 | 12.3%), and Sales & Related (2,627 | 10.4%).

Sales and Office Occupations by Sex

| Occupation | Male | Female |
| Sales & Related | 1,135 (43.2%) | 1,492 (56.8%) |
| Office & Administration | 708 (22.7%) | 2,413 (77.3%) |
| Total (Category) | 1,843 (32.1%) | 3,905 (67.9%) |
| Total (Overall) | 12,763 (50.5%) | 12,513 (49.5%) |
Natural Resources, Construction and Maintenance Occupations
The most common Natural Resources, Construction and Maintenance occupations in Elyria are Construction & Extraction (1,154 | 4.6%), Installation, Maintenance & Repair (949 | 3.7%), and Farming, Fishing & Forestry (49 | 0.2%).

Natural Resources, Construction and Maintenance Occupations by Sex
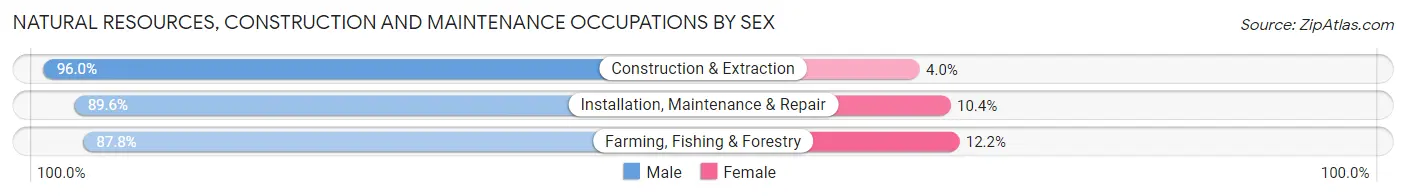
| Occupation | Male | Female |
| Farming, Fishing & Forestry | 43 (87.8%) | 6 (12.2%) |
| Construction & Extraction | 1,108 (96.0%) | 46 (4.0%) |
| Installation, Maintenance & Repair | 850 (89.6%) | 99 (10.4%) |
| Total (Category) | 2,001 (93.0%) | 151 (7.0%) |
| Total (Overall) | 12,763 (50.5%) | 12,513 (49.5%) |
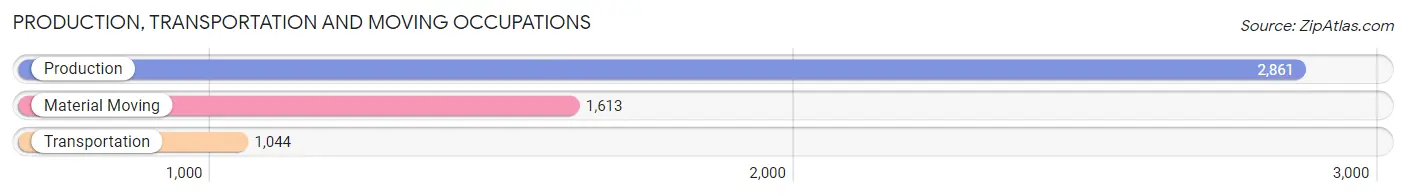
Production, Transportation and Moving Occupations
The most common Production, Transportation and Moving occupations in Elyria are Production (2,861 | 11.3%), Material Moving (1,613 | 6.4%), and Transportation (1,044 | 4.1%).
Production, Transportation and Moving Occupations by Sex
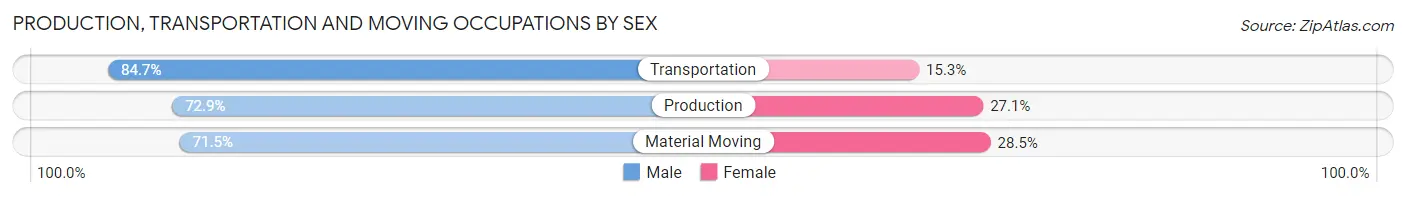
| Occupation | Male | Female |
| Production | 2,086 (72.9%) | 775 (27.1%) |
| Transportation | 884 (84.7%) | 160 (15.3%) |
| Material Moving | 1,154 (71.5%) | 459 (28.5%) |
| Total (Category) | 4,124 (74.7%) | 1,394 (25.3%) |
| Total (Overall) | 12,763 (50.5%) | 12,513 (49.5%) |
Employment Industries by Sex in Elyria
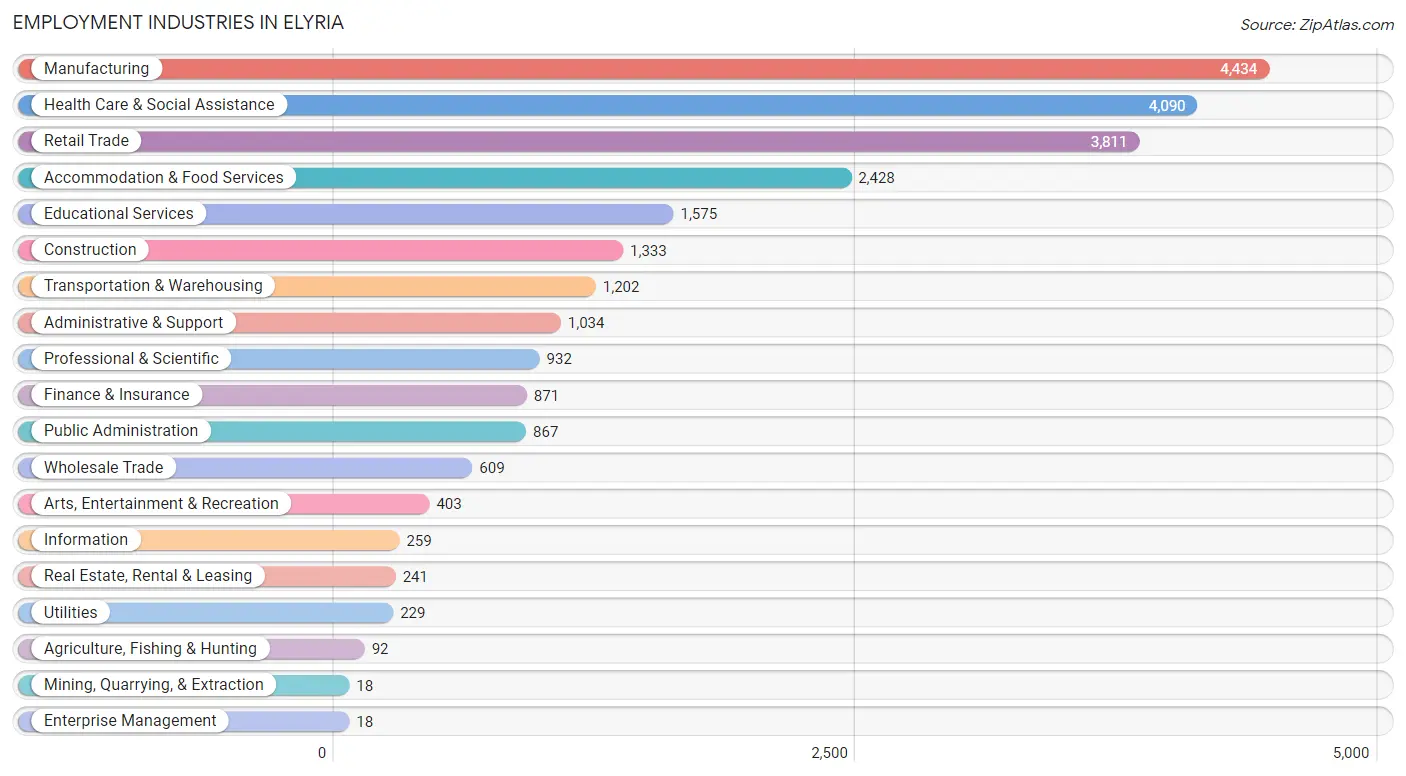
Employment Industries in Elyria
The major employment industries in Elyria include Manufacturing (4,434 | 17.5%), Health Care & Social Assistance (4,090 | 16.2%), Retail Trade (3,811 | 15.1%), Accommodation & Food Services (2,428 | 9.6%), and Educational Services (1,575 | 6.2%).
Employment Industries by Sex in Elyria
The Elyria industries that see more men than women are Mining, Quarrying, & Extraction (100.0%), Construction (94.8%), and Utilities (86.0%), whereas the industries that tend to have a higher number of women are Health Care & Social Assistance (85.7%), Finance & Insurance (69.9%), and Real Estate, Rental & Leasing (68.0%).
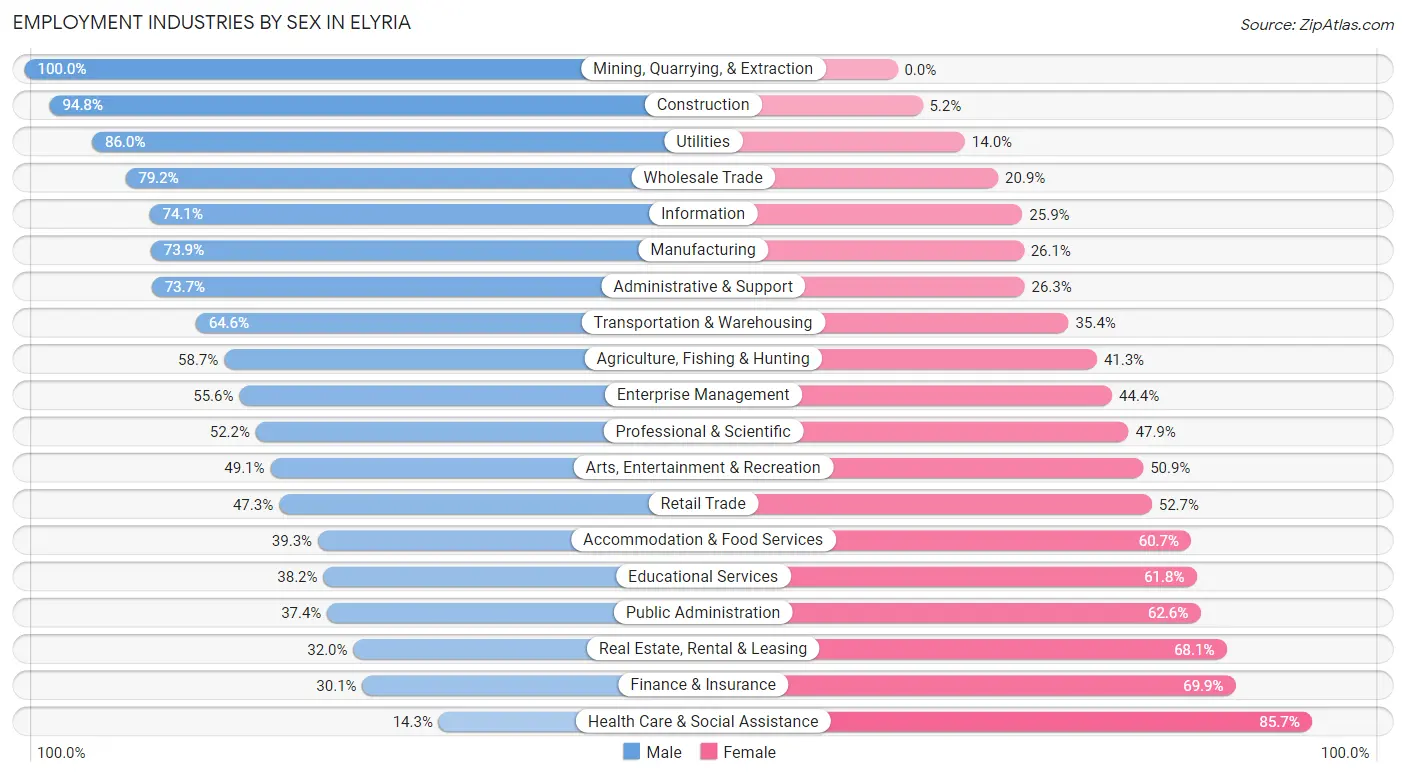
| Industry | Male | Female |
| Agriculture, Fishing & Hunting | 54 (58.7%) | 38 (41.3%) |
| Mining, Quarrying, & Extraction | 18 (100.0%) | 0 (0.0%) |
| Construction | 1,264 (94.8%) | 69 (5.2%) |
| Manufacturing | 3,275 (73.9%) | 1,159 (26.1%) |
| Wholesale Trade | 482 (79.1%) | 127 (20.8%) |
| Retail Trade | 1,804 (47.3%) | 2,007 (52.7%) |
| Transportation & Warehousing | 776 (64.6%) | 426 (35.4%) |
| Utilities | 197 (86.0%) | 32 (14.0%) |
| Information | 192 (74.1%) | 67 (25.9%) |
| Finance & Insurance | 262 (30.1%) | 609 (69.9%) |
| Real Estate, Rental & Leasing | 77 (32.0%) | 164 (68.0%) |
| Professional & Scientific | 486 (52.1%) | 446 (47.8%) |
| Enterprise Management | 10 (55.6%) | 8 (44.4%) |
| Administrative & Support | 762 (73.7%) | 272 (26.3%) |
| Educational Services | 601 (38.2%) | 974 (61.8%) |
| Health Care & Social Assistance | 584 (14.3%) | 3,506 (85.7%) |
| Arts, Entertainment & Recreation | 198 (49.1%) | 205 (50.9%) |
| Accommodation & Food Services | 954 (39.3%) | 1,474 (60.7%) |
| Public Administration | 324 (37.4%) | 543 (62.6%) |
| Total | 12,763 (50.5%) | 12,513 (49.5%) |
Education in Elyria
School Enrollment in Elyria
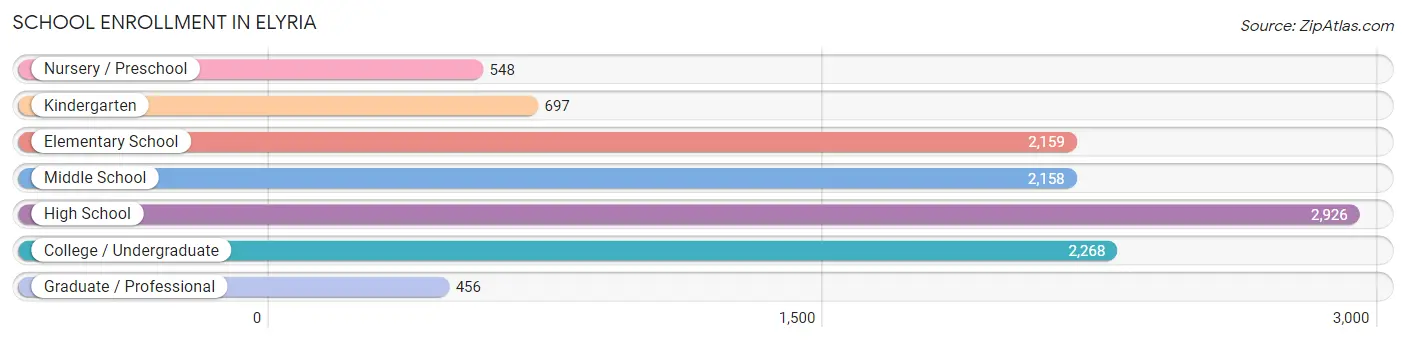
The most common levels of schooling among the 11,212 students in Elyria are high school (2,926 | 26.1%), college / undergraduate (2,268 | 20.2%), and elementary school (2,159 | 19.3%).
| School Level | # Students | % Students |
| Nursery / Preschool | 548 | 4.9% |
| Kindergarten | 697 | 6.2% |
| Elementary School | 2,159 | 19.3% |
| Middle School | 2,158 | 19.3% |
| High School | 2,926 | 26.1% |
| College / Undergraduate | 2,268 | 20.2% |
| Graduate / Professional | 456 | 4.1% |
| Total | 11,212 | 100.0% |
School Enrollment by Age by Funding Source in Elyria
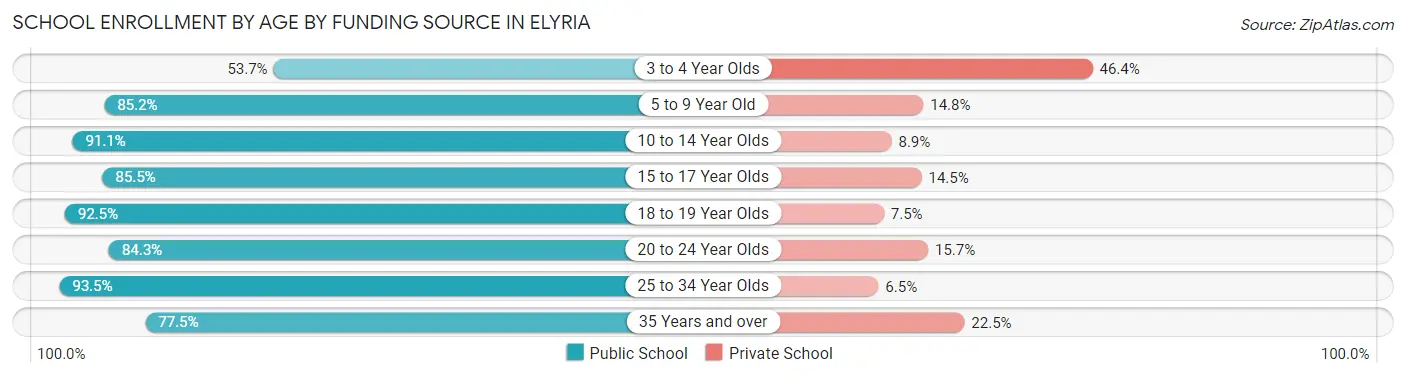
Out of a total of 11,212 students who are enrolled in schools in Elyria, 1,626 (14.5%) attend a private institution, while the remaining 9,586 (85.5%) are enrolled in public schools. The age group of 3 to 4 year olds has the highest likelihood of being enrolled in private schools, with 197 (46.4% in the age bracket) enrolled. Conversely, the age group of 25 to 34 year olds has the lowest likelihood of being enrolled in a private school, with 434 (93.5% in the age bracket) attending a public institution.
| Age Bracket | Public School | Private School |
| 3 to 4 Year Olds | 228 (53.6%) | 197 (46.4%) |
| 5 to 9 Year Old | 2,275 (85.2%) | 396 (14.8%) |
| 10 to 14 Year Olds | 2,370 (91.1%) | 232 (8.9%) |
| 15 to 17 Year Olds | 1,840 (85.5%) | 312 (14.5%) |
| 18 to 19 Year Olds | 778 (92.5%) | 63 (7.5%) |
| 20 to 24 Year Olds | 853 (84.3%) | 159 (15.7%) |
| 25 to 34 Year Olds | 434 (93.5%) | 30 (6.5%) |
| 35 Years and over | 810 (77.5%) | 235 (22.5%) |
| Total | 9,586 (85.5%) | 1,626 (14.5%) |
Educational Attainment by Field of Study in Elyria
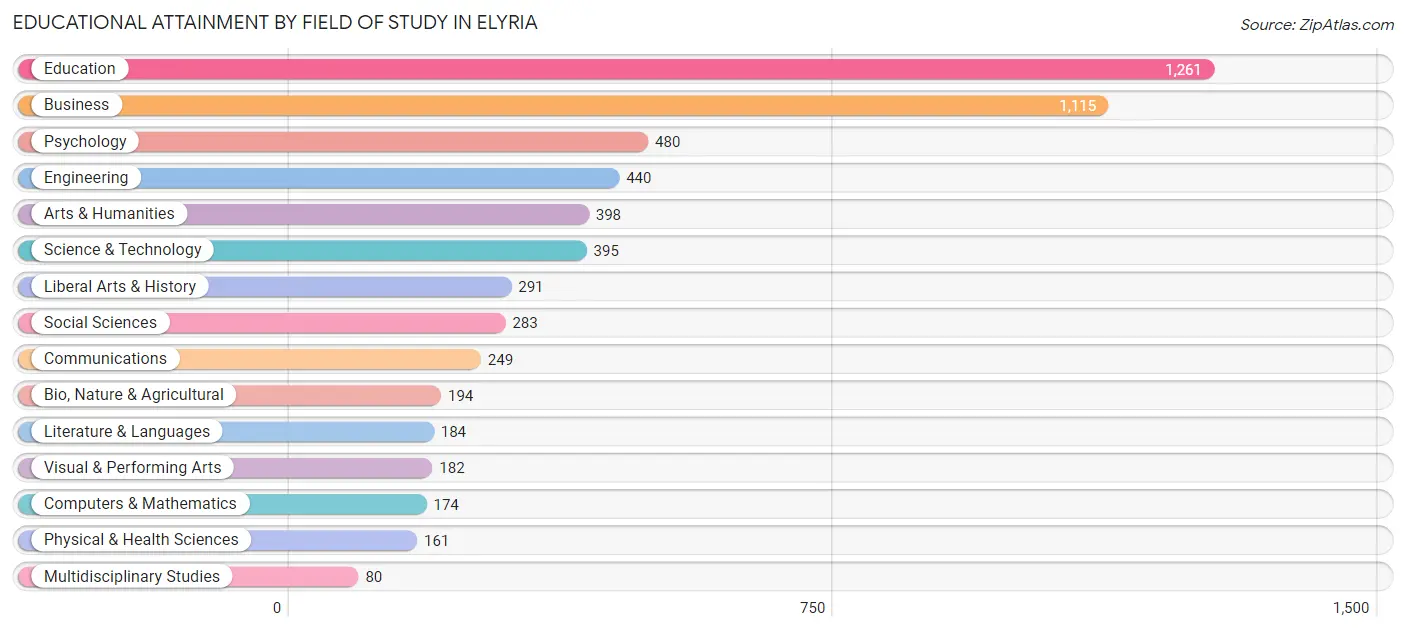
Education (1,261 | 21.4%), business (1,115 | 18.9%), psychology (480 | 8.2%), engineering (440 | 7.5%), and arts & humanities (398 | 6.8%) are the most common fields of study among 5,887 individuals in Elyria who have obtained a bachelor's degree or higher.
| Field of Study | # Graduates | % Graduates |
| Computers & Mathematics | 174 | 3.0% |
| Bio, Nature & Agricultural | 194 | 3.3% |
| Physical & Health Sciences | 161 | 2.7% |
| Psychology | 480 | 8.2% |
| Social Sciences | 283 | 4.8% |
| Engineering | 440 | 7.5% |
| Multidisciplinary Studies | 80 | 1.4% |
| Science & Technology | 395 | 6.7% |
| Business | 1,115 | 18.9% |
| Education | 1,261 | 21.4% |
| Literature & Languages | 184 | 3.1% |
| Liberal Arts & History | 291 | 4.9% |
| Visual & Performing Arts | 182 | 3.1% |
| Communications | 249 | 4.2% |
| Arts & Humanities | 398 | 6.8% |
| Total | 5,887 | 100.0% |
Transportation & Commute in Elyria
Vehicle Availability by Sex in Elyria
The most prevalent vehicle ownership categories in Elyria are males with 2 vehicles (5,645, accounting for 45.1%) and females with 2 vehicles (4,885, making up 45.8%).
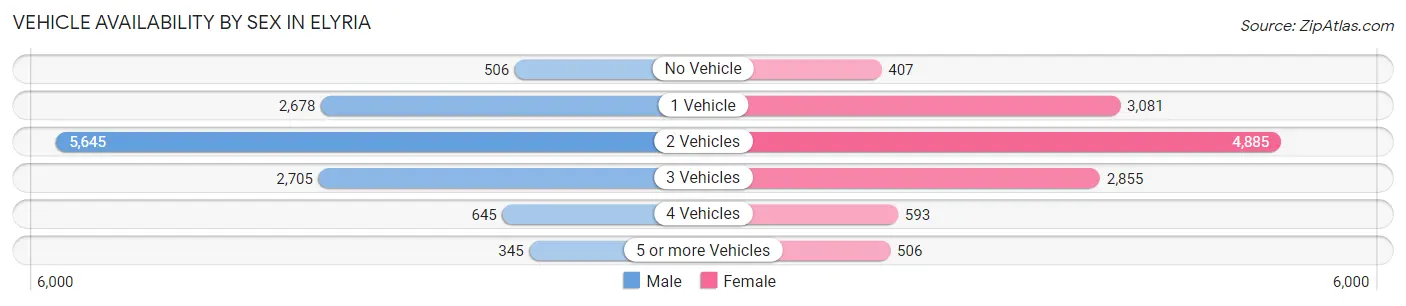
| Vehicles Available | Male | Female |
| No Vehicle | 506 (4.0%) | 407 (3.3%) |
| 1 Vehicle | 2,678 (21.4%) | 3,081 (25.0%) |
| 2 Vehicles | 5,645 (45.1%) | 4,885 (39.6%) |
| 3 Vehicles | 2,705 (21.6%) | 2,855 (23.2%) |
| 4 Vehicles | 645 (5.1%) | 593 (4.8%) |
| 5 or more Vehicles | 345 (2.8%) | 506 (4.1%) |
| Total | 12,524 (100.0%) | 12,327 (100.0%) |
Commute Time in Elyria
The most frequently occuring commute durations in Elyria are 15 to 19 minutes (3,850 commuters, 16.1%), 20 to 24 minutes (3,774 commuters, 15.8%), and 10 to 14 minutes (3,230 commuters, 13.5%).
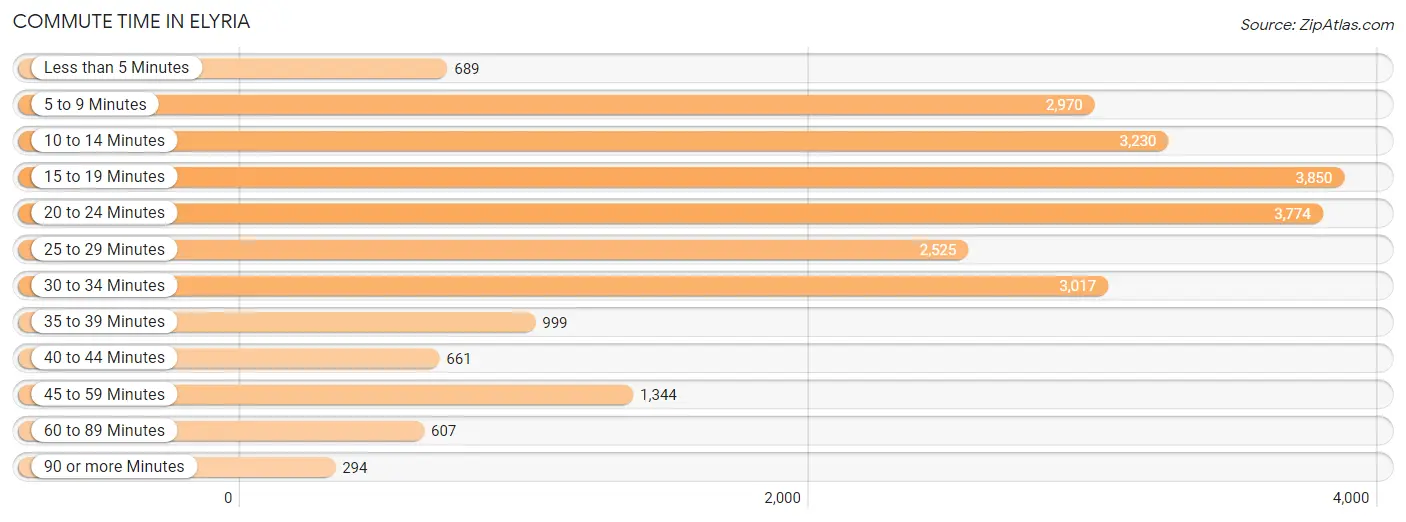
| Commute Time | # Commuters | % Commuters |
| Less than 5 Minutes | 689 | 2.9% |
| 5 to 9 Minutes | 2,970 | 12.4% |
| 10 to 14 Minutes | 3,230 | 13.5% |
| 15 to 19 Minutes | 3,850 | 16.1% |
| 20 to 24 Minutes | 3,774 | 15.8% |
| 25 to 29 Minutes | 2,525 | 10.5% |
| 30 to 34 Minutes | 3,017 | 12.6% |
| 35 to 39 Minutes | 999 | 4.2% |
| 40 to 44 Minutes | 661 | 2.8% |
| 45 to 59 Minutes | 1,344 | 5.6% |
| 60 to 89 Minutes | 607 | 2.5% |
| 90 or more Minutes | 294 | 1.2% |
Commute Time by Sex in Elyria
The most common commute times in Elyria are 15 to 19 minutes (1,863 commuters, 15.3%) for males and 20 to 24 minutes (2,067 commuters, 17.6%) for females.
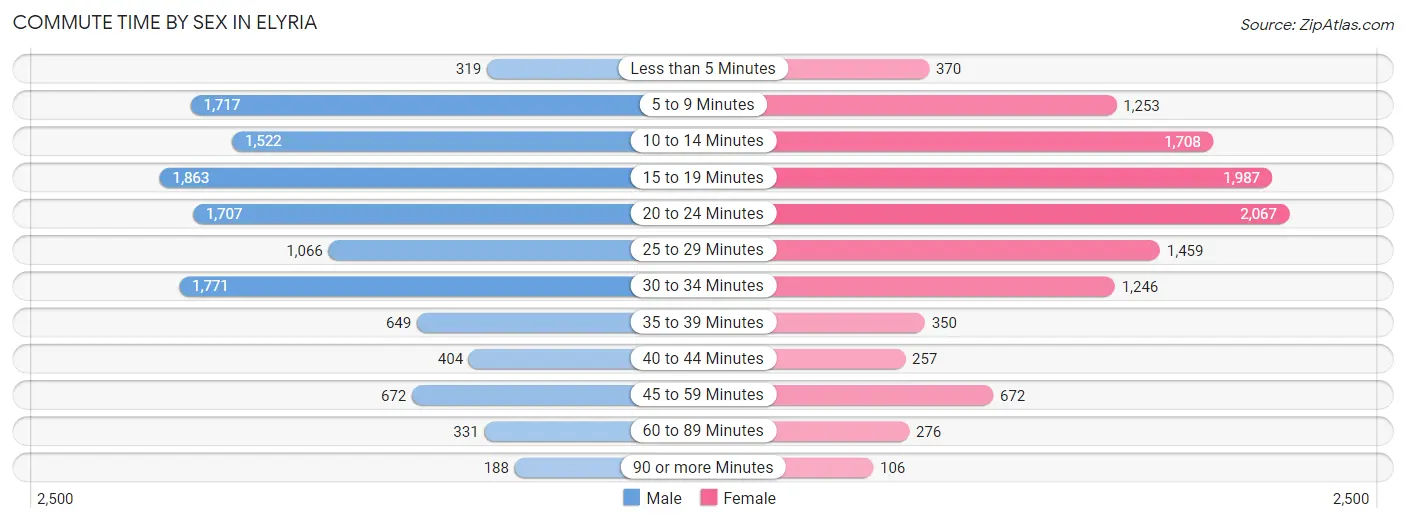
| Commute Time | Male | Female |
| Less than 5 Minutes | 319 (2.6%) | 370 (3.2%) |
| 5 to 9 Minutes | 1,717 (14.1%) | 1,253 (10.7%) |
| 10 to 14 Minutes | 1,522 (12.5%) | 1,708 (14.5%) |
| 15 to 19 Minutes | 1,863 (15.3%) | 1,987 (16.9%) |
| 20 to 24 Minutes | 1,707 (14.0%) | 2,067 (17.6%) |
| 25 to 29 Minutes | 1,066 (8.7%) | 1,459 (12.4%) |
| 30 to 34 Minutes | 1,771 (14.5%) | 1,246 (10.6%) |
| 35 to 39 Minutes | 649 (5.3%) | 350 (3.0%) |
| 40 to 44 Minutes | 404 (3.3%) | 257 (2.2%) |
| 45 to 59 Minutes | 672 (5.5%) | 672 (5.7%) |
| 60 to 89 Minutes | 331 (2.7%) | 276 (2.4%) |
| 90 or more Minutes | 188 (1.5%) | 106 (0.9%) |
Time of Departure to Work by Sex in Elyria
The most frequent times of departure to work in Elyria are 7:00 AM to 7:29 AM (1,800, 14.7%) for males and 7:00 AM to 7:29 AM (1,517, 12.9%) for females.
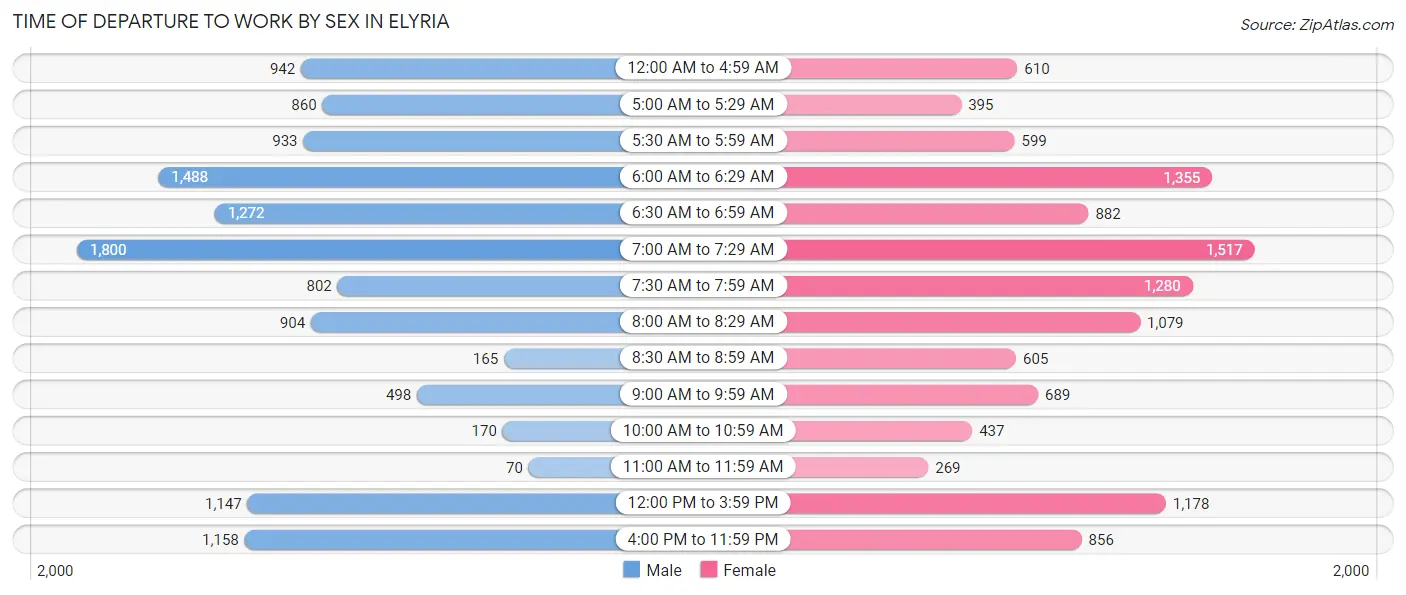
| Time of Departure | Male | Female |
| 12:00 AM to 4:59 AM | 942 (7.7%) | 610 (5.2%) |
| 5:00 AM to 5:29 AM | 860 (7.0%) | 395 (3.4%) |
| 5:30 AM to 5:59 AM | 933 (7.6%) | 599 (5.1%) |
| 6:00 AM to 6:29 AM | 1,488 (12.2%) | 1,355 (11.5%) |
| 6:30 AM to 6:59 AM | 1,272 (10.4%) | 882 (7.5%) |
| 7:00 AM to 7:29 AM | 1,800 (14.7%) | 1,517 (12.9%) |
| 7:30 AM to 7:59 AM | 802 (6.6%) | 1,280 (10.9%) |
| 8:00 AM to 8:29 AM | 904 (7.4%) | 1,079 (9.2%) |
| 8:30 AM to 8:59 AM | 165 (1.3%) | 605 (5.1%) |
| 9:00 AM to 9:59 AM | 498 (4.1%) | 689 (5.9%) |
| 10:00 AM to 10:59 AM | 170 (1.4%) | 437 (3.7%) |
| 11:00 AM to 11:59 AM | 70 (0.6%) | 269 (2.3%) |
| 12:00 PM to 3:59 PM | 1,147 (9.4%) | 1,178 (10.0%) |
| 4:00 PM to 11:59 PM | 1,158 (9.5%) | 856 (7.3%) |
| Total | 12,209 (100.0%) | 11,751 (100.0%) |
Housing Occupancy in Elyria
Occupancy by Ownership in Elyria
Of the total 23,119 dwellings in Elyria, owner-occupied units account for 13,509 (58.4%), while renter-occupied units make up 9,610 (41.6%).
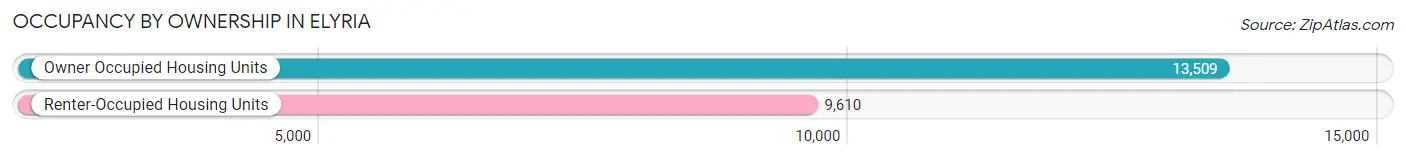
| Occupancy | # Housing Units | % Housing Units |
| Owner Occupied Housing Units | 13,509 | 58.4% |
| Renter-Occupied Housing Units | 9,610 | 41.6% |
| Total Occupied Housing Units | 23,119 | 100.0% |
Occupancy by Household Size in Elyria
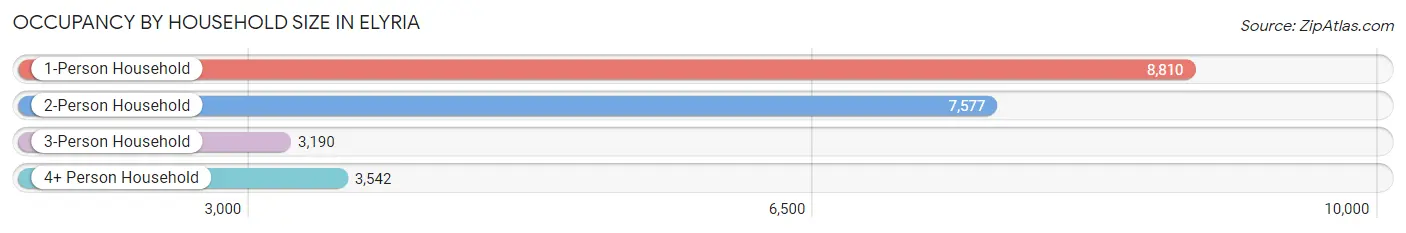
| Household Size | # Housing Units | % Housing Units |
| 1-Person Household | 8,810 | 38.1% |
| 2-Person Household | 7,577 | 32.8% |
| 3-Person Household | 3,190 | 13.8% |
| 4+ Person Household | 3,542 | 15.3% |
| Total Housing Units | 23,119 | 100.0% |
Occupancy by Ownership by Household Size in Elyria
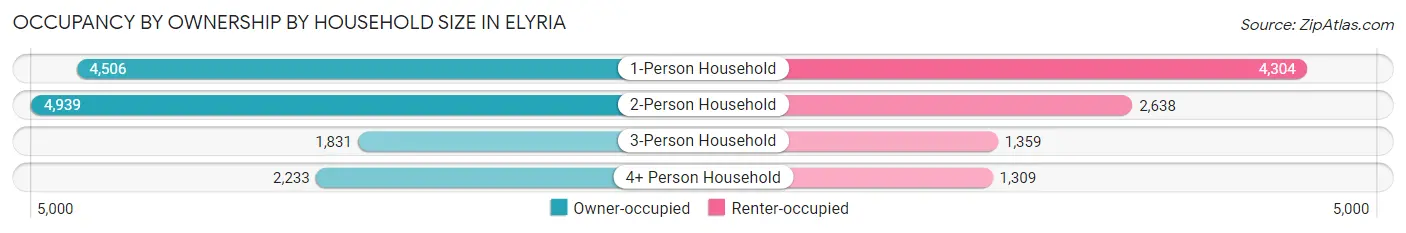
| Household Size | Owner-occupied | Renter-occupied |
| 1-Person Household | 4,506 (51.1%) | 4,304 (48.8%) |
| 2-Person Household | 4,939 (65.2%) | 2,638 (34.8%) |
| 3-Person Household | 1,831 (57.4%) | 1,359 (42.6%) |
| 4+ Person Household | 2,233 (63.0%) | 1,309 (37.0%) |
| Total Housing Units | 13,509 (58.4%) | 9,610 (41.6%) |
Occupancy by Educational Attainment in Elyria
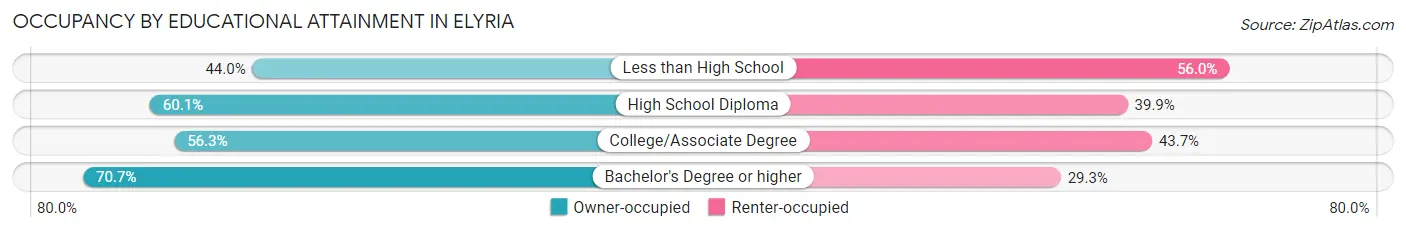
| Household Size | Owner-occupied | Renter-occupied |
| Less than High School | 1,149 (44.0%) | 1,462 (56.0%) |
| High School Diploma | 4,575 (60.1%) | 3,035 (39.9%) |
| College/Associate Degree | 5,202 (56.3%) | 4,044 (43.7%) |
| Bachelor's Degree or higher | 2,583 (70.7%) | 1,069 (29.3%) |
Occupancy by Age of Householder in Elyria
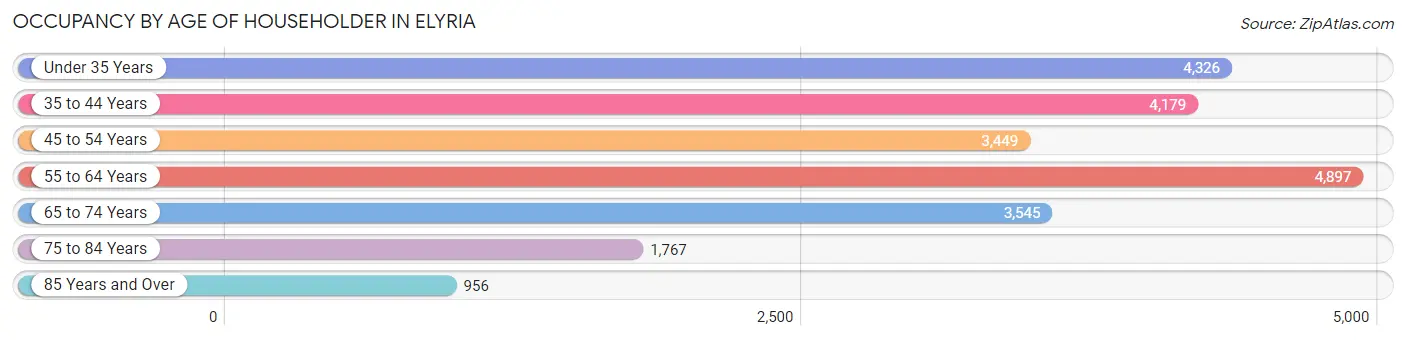
| Age Bracket | # Households | % Households |
| Under 35 Years | 4,326 | 18.7% |
| 35 to 44 Years | 4,179 | 18.1% |
| 45 to 54 Years | 3,449 | 14.9% |
| 55 to 64 Years | 4,897 | 21.2% |
| 65 to 74 Years | 3,545 | 15.3% |
| 75 to 84 Years | 1,767 | 7.6% |
| 85 Years and Over | 956 | 4.1% |
| Total | 23,119 | 100.0% |
Housing Finances in Elyria
Median Income by Occupancy in Elyria
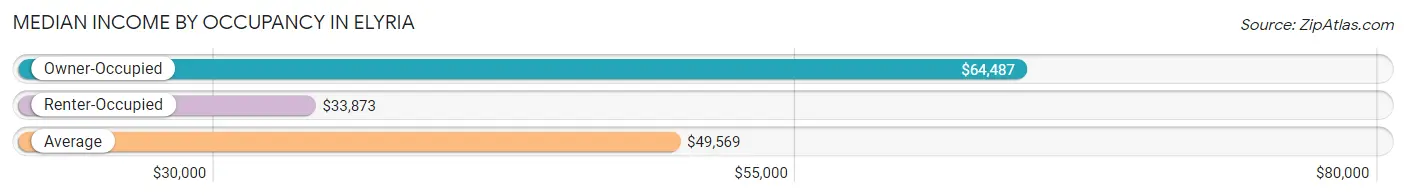
| Occupancy Type | # Households | Median Income |
| Owner-Occupied | 13,509 (58.4%) | $64,487 |
| Renter-Occupied | 9,610 (41.6%) | $33,873 |
| Average | 23,119 (100.0%) | $49,569 |
Occupancy by Householder Income Bracket in Elyria
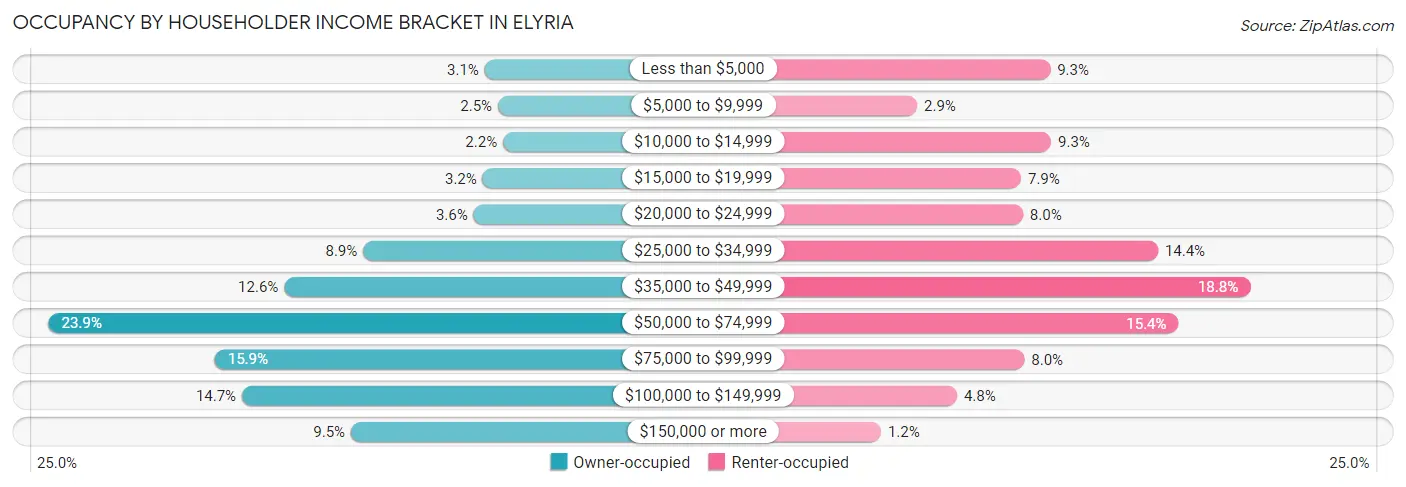
| Income Bracket | Owner-occupied | Renter-occupied |
| Less than $5,000 | 417 (3.1%) | 891 (9.3%) |
| $5,000 to $9,999 | 332 (2.5%) | 282 (2.9%) |
| $10,000 to $14,999 | 300 (2.2%) | 895 (9.3%) |
| $15,000 to $19,999 | 431 (3.2%) | 757 (7.9%) |
| $20,000 to $24,999 | 489 (3.6%) | 766 (8.0%) |
| $25,000 to $34,999 | 1,199 (8.9%) | 1,384 (14.4%) |
| $35,000 to $49,999 | 1,707 (12.6%) | 1,805 (18.8%) |
| $50,000 to $74,999 | 3,223 (23.9%) | 1,477 (15.4%) |
| $75,000 to $99,999 | 2,154 (15.9%) | 773 (8.0%) |
| $100,000 to $149,999 | 1,979 (14.6%) | 464 (4.8%) |
| $150,000 or more | 1,278 (9.5%) | 116 (1.2%) |
| Total | 13,509 (100.0%) | 9,610 (100.0%) |
Monthly Housing Cost Tiers in Elyria
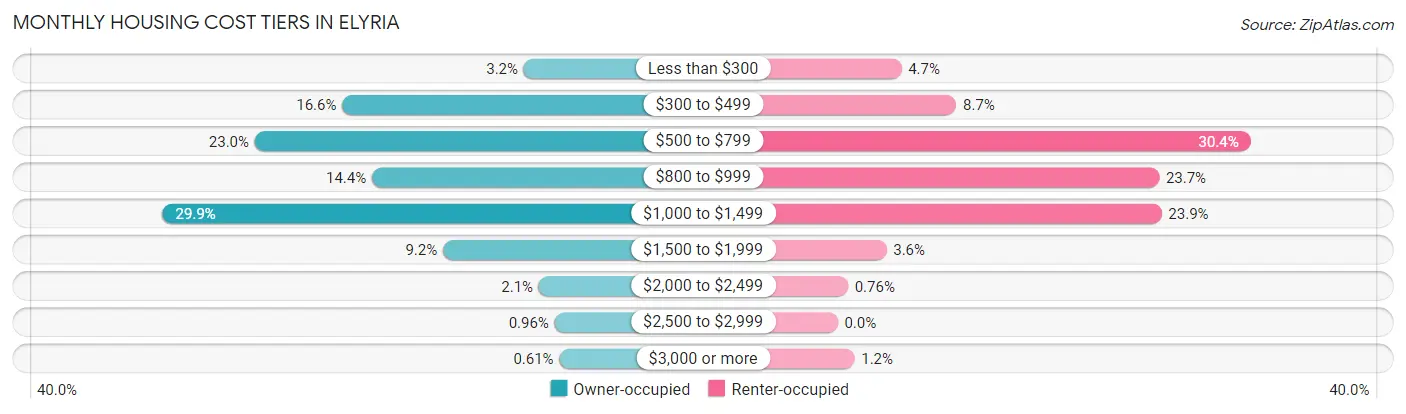
| Monthly Cost | Owner-occupied | Renter-occupied |
| Less than $300 | 437 (3.2%) | 452 (4.7%) |
| $300 to $499 | 2,242 (16.6%) | 840 (8.7%) |
| $500 to $799 | 3,112 (23.0%) | 2,924 (30.4%) |
| $800 to $999 | 1,946 (14.4%) | 2,276 (23.7%) |
| $1,000 to $1,499 | 4,033 (29.8%) | 2,293 (23.9%) |
| $1,500 to $1,999 | 1,240 (9.2%) | 346 (3.6%) |
| $2,000 to $2,499 | 286 (2.1%) | 73 (0.8%) |
| $2,500 to $2,999 | 130 (1.0%) | 0 (0.0%) |
| $3,000 or more | 83 (0.6%) | 119 (1.2%) |
| Total | 13,509 (100.0%) | 9,610 (100.0%) |
Physical Housing Characteristics in Elyria
Housing Structures in Elyria
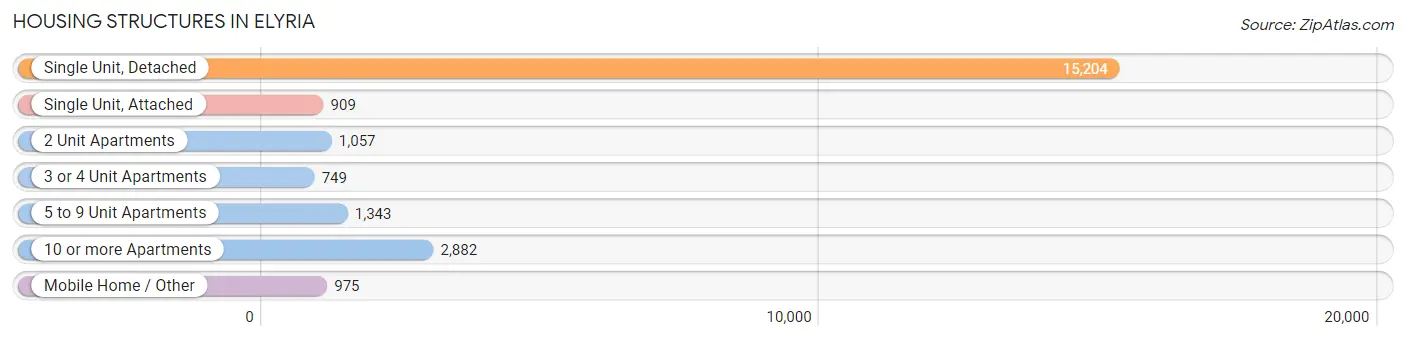
| Structure Type | # Housing Units | % Housing Units |
| Single Unit, Detached | 15,204 | 65.8% |
| Single Unit, Attached | 909 | 3.9% |
| 2 Unit Apartments | 1,057 | 4.6% |
| 3 or 4 Unit Apartments | 749 | 3.2% |
| 5 to 9 Unit Apartments | 1,343 | 5.8% |
| 10 or more Apartments | 2,882 | 12.5% |
| Mobile Home / Other | 975 | 4.2% |
| Total | 23,119 | 100.0% |
Housing Structures by Occupancy in Elyria
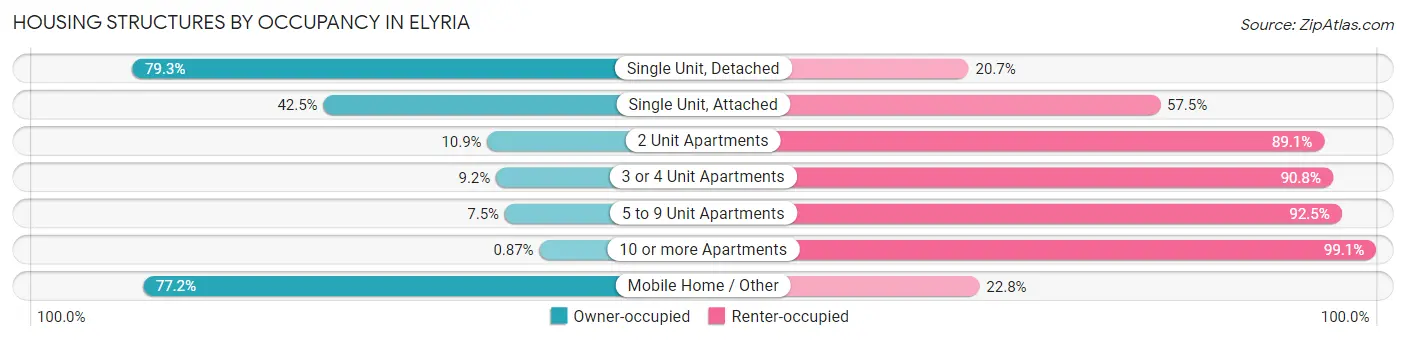
| Structure Type | Owner-occupied | Renter-occupied |
| Single Unit, Detached | 12,060 (79.3%) | 3,144 (20.7%) |
| Single Unit, Attached | 386 (42.5%) | 523 (57.5%) |
| 2 Unit Apartments | 115 (10.9%) | 942 (89.1%) |
| 3 or 4 Unit Apartments | 69 (9.2%) | 680 (90.8%) |
| 5 to 9 Unit Apartments | 101 (7.5%) | 1,242 (92.5%) |
| 10 or more Apartments | 25 (0.9%) | 2,857 (99.1%) |
| Mobile Home / Other | 753 (77.2%) | 222 (22.8%) |
| Total | 13,509 (58.4%) | 9,610 (41.6%) |
Housing Structures by Number of Rooms in Elyria
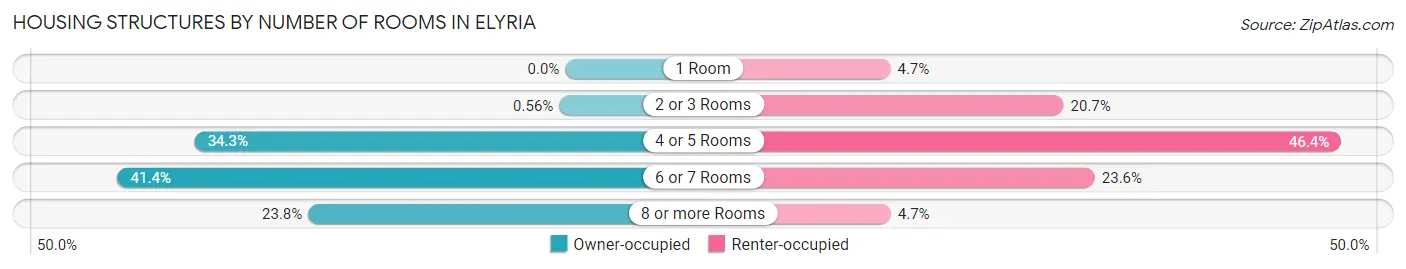
| Number of Rooms | Owner-occupied | Renter-occupied |
| 1 Room | 0 (0.0%) | 450 (4.7%) |
| 2 or 3 Rooms | 76 (0.6%) | 1,987 (20.7%) |
| 4 or 5 Rooms | 4,628 (34.3%) | 4,454 (46.4%) |
| 6 or 7 Rooms | 5,592 (41.4%) | 2,266 (23.6%) |
| 8 or more Rooms | 3,213 (23.8%) | 453 (4.7%) |
| Total | 13,509 (100.0%) | 9,610 (100.0%) |
Housing Structure by Heating Type in Elyria
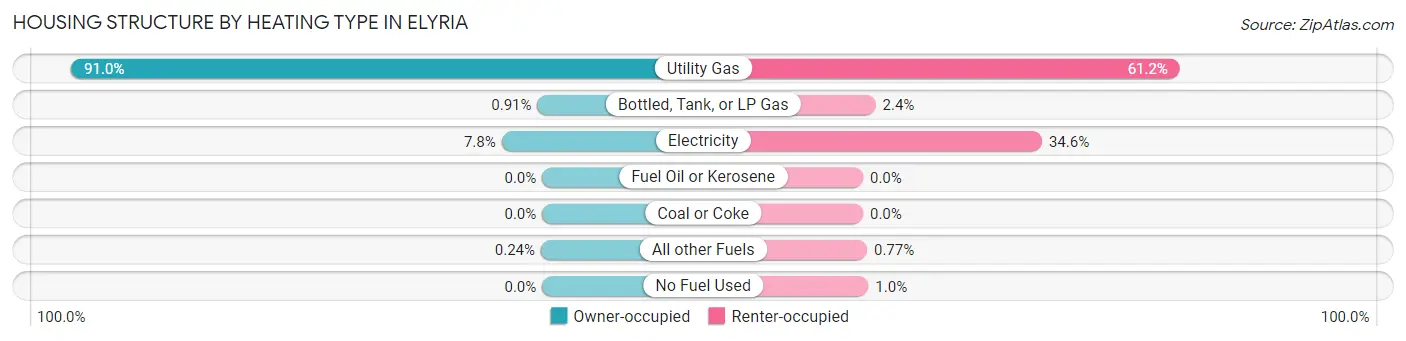
| Heating Type | Owner-occupied | Renter-occupied |
| Utility Gas | 12,296 (91.0%) | 5,879 (61.2%) |
| Bottled, Tank, or LP Gas | 123 (0.9%) | 234 (2.4%) |
| Electricity | 1,058 (7.8%) | 3,323 (34.6%) |
| Fuel Oil or Kerosene | 0 (0.0%) | 0 (0.0%) |
| Coal or Coke | 0 (0.0%) | 0 (0.0%) |
| All other Fuels | 32 (0.2%) | 74 (0.8%) |
| No Fuel Used | 0 (0.0%) | 100 (1.0%) |
| Total | 13,509 (100.0%) | 9,610 (100.0%) |
Household Vehicle Usage in Elyria
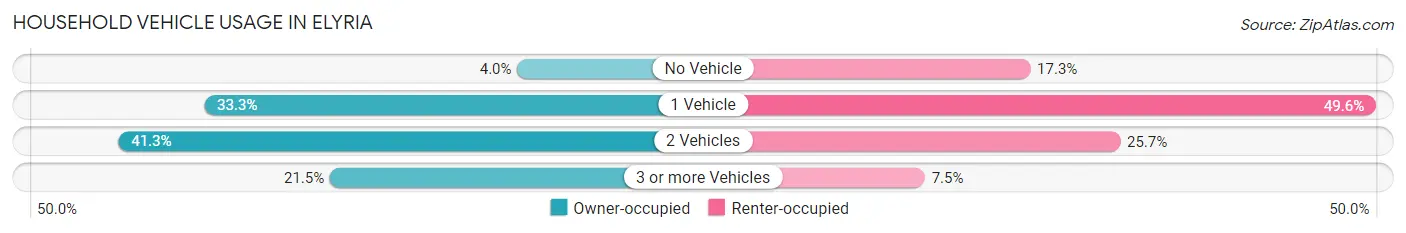
| Vehicles per Household | Owner-occupied | Renter-occupied |
| No Vehicle | 541 (4.0%) | 1,662 (17.3%) |
| 1 Vehicle | 4,492 (33.3%) | 4,764 (49.6%) |
| 2 Vehicles | 5,573 (41.2%) | 2,468 (25.7%) |
| 3 or more Vehicles | 2,903 (21.5%) | 716 (7.4%) |
| Total | 13,509 (100.0%) | 9,610 (100.0%) |
Real Estate & Mortgages in Elyria
Real Estate and Mortgage Overview in Elyria
| Characteristic | Without Mortgage | With Mortgage |
| Housing Units | 5,389 | 8,120 |
| Median Property Value | $119,500 | $136,000 |
| Median Household Income | $51,288 | $1,025 |
| Monthly Housing Costs | $517 | $64 |
| Real Estate Taxes | $1,910 | $134 |
Property Value by Mortgage Status in Elyria
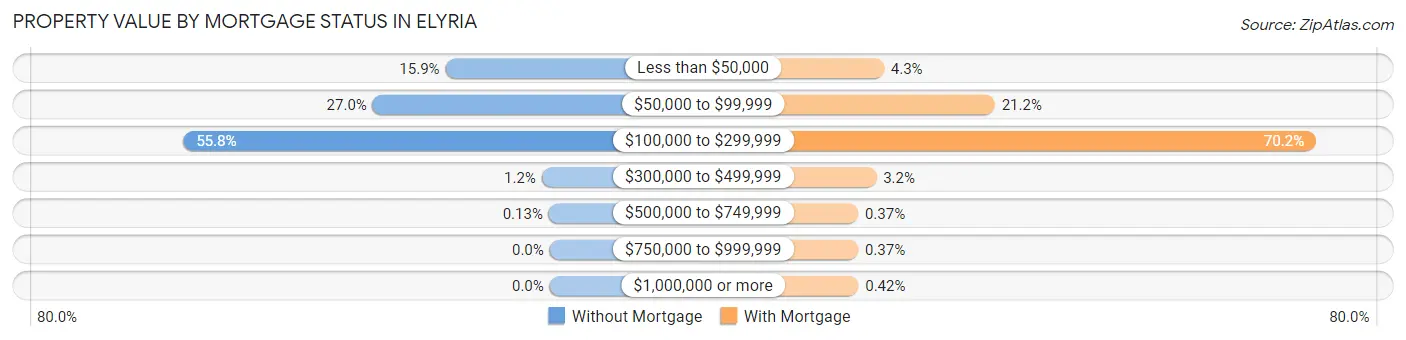
| Property Value | Without Mortgage | With Mortgage |
| Less than $50,000 | 856 (15.9%) | 350 (4.3%) |
| $50,000 to $99,999 | 1,453 (27.0%) | 1,722 (21.2%) |
| $100,000 to $299,999 | 3,008 (55.8%) | 5,698 (70.2%) |
| $300,000 to $499,999 | 65 (1.2%) | 256 (3.2%) |
| $500,000 to $749,999 | 7 (0.1%) | 30 (0.4%) |
| $750,000 to $999,999 | 0 (0.0%) | 30 (0.4%) |
| $1,000,000 or more | 0 (0.0%) | 34 (0.4%) |
| Total | 5,389 (100.0%) | 8,120 (100.0%) |
Household Income by Mortgage Status in Elyria
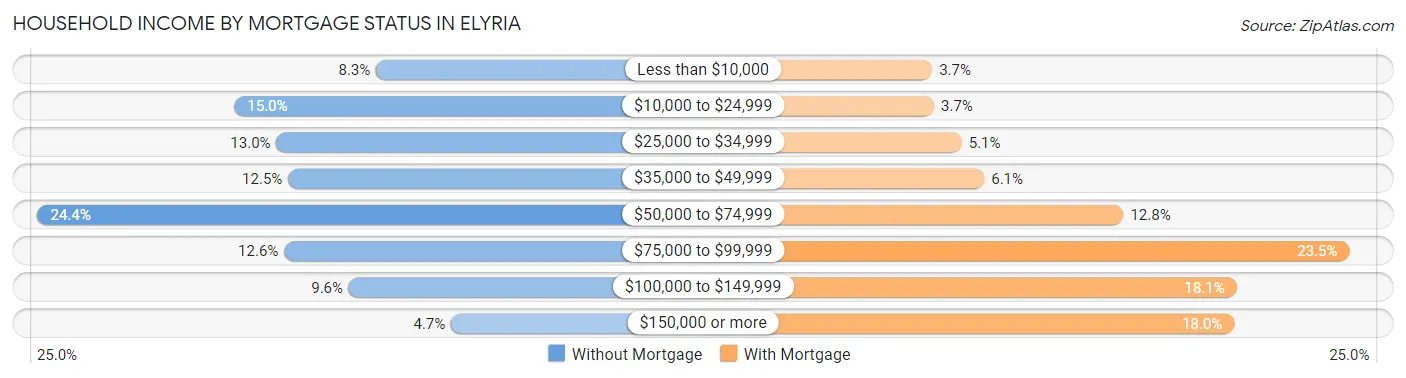
| Household Income | Without Mortgage | With Mortgage |
| Less than $10,000 | 445 (8.3%) | 296 (3.6%) |
| $10,000 to $24,999 | 809 (15.0%) | 304 (3.7%) |
| $25,000 to $34,999 | 701 (13.0%) | 411 (5.1%) |
| $35,000 to $49,999 | 671 (12.4%) | 498 (6.1%) |
| $50,000 to $74,999 | 1,314 (24.4%) | 1,036 (12.8%) |
| $75,000 to $99,999 | 681 (12.6%) | 1,909 (23.5%) |
| $100,000 to $149,999 | 515 (9.6%) | 1,473 (18.1%) |
| $150,000 or more | 253 (4.7%) | 1,464 (18.0%) |
| Total | 5,389 (100.0%) | 8,120 (100.0%) |
Property Value to Household Income Ratio in Elyria
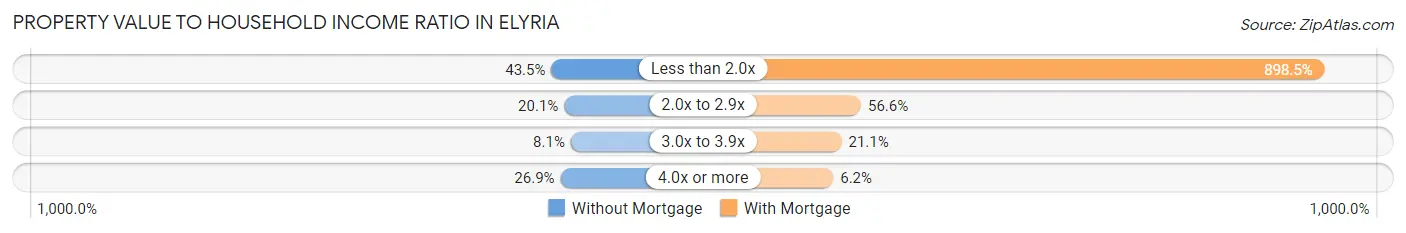
| Value-to-Income Ratio | Without Mortgage | With Mortgage |
| Less than 2.0x | 2,342 (43.5%) | 72,958 (898.5%) |
| 2.0x to 2.9x | 1,085 (20.1%) | 4,596 (56.6%) |
| 3.0x to 3.9x | 438 (8.1%) | 1,714 (21.1%) |
| 4.0x or more | 1,452 (26.9%) | 500 (6.2%) |
| Total | 5,389 (100.0%) | 8,120 (100.0%) |
Real Estate Taxes by Mortgage Status in Elyria
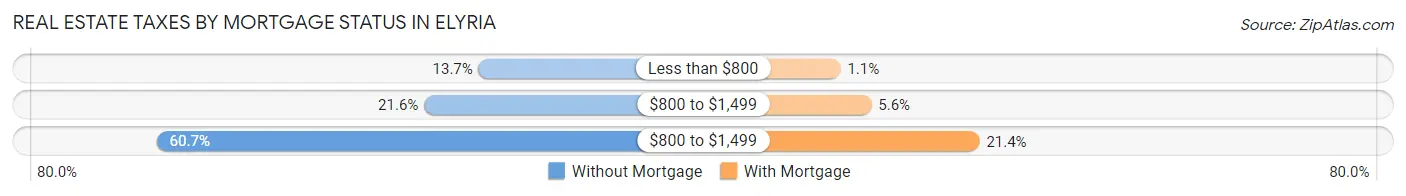
| Property Taxes | Without Mortgage | With Mortgage |
| Less than $800 | 736 (13.7%) | 88 (1.1%) |
| $800 to $1,499 | 1,165 (21.6%) | 455 (5.6%) |
| $800 to $1,499 | 3,271 (60.7%) | 1,737 (21.4%) |
| Total | 5,389 (100.0%) | 8,120 (100.0%) |
Health & Disability in Elyria
Health Insurance Coverage by Age in Elyria
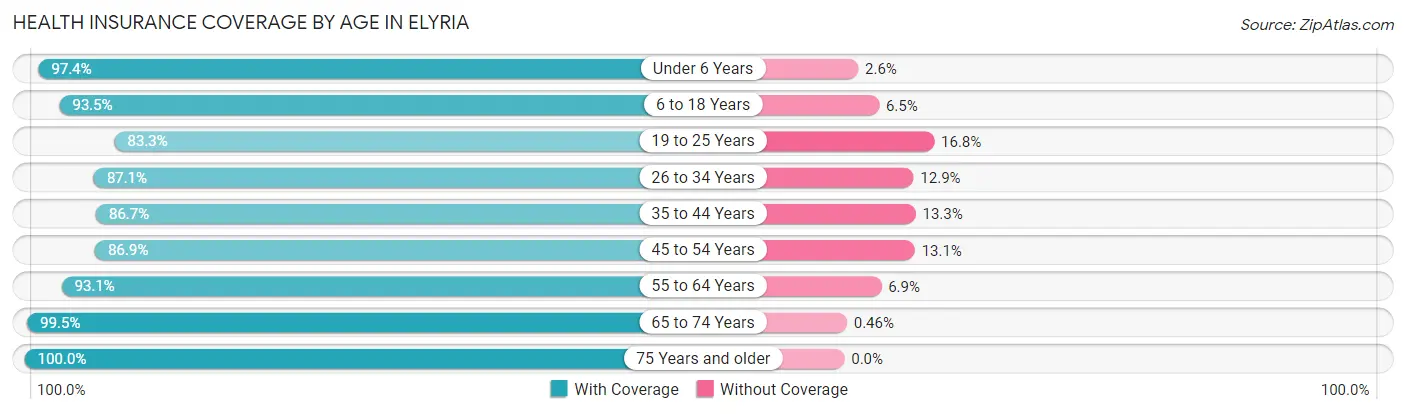
| Age Bracket | With Coverage | Without Coverage |
| Under 6 Years | 3,715 (97.4%) | 98 (2.6%) |
| 6 to 18 Years | 7,570 (93.5%) | 524 (6.5%) |
| 19 to 25 Years | 4,190 (83.3%) | 843 (16.8%) |
| 26 to 34 Years | 5,182 (87.1%) | 767 (12.9%) |
| 35 to 44 Years | 5,760 (86.7%) | 882 (13.3%) |
| 45 to 54 Years | 5,517 (86.9%) | 834 (13.1%) |
| 55 to 64 Years | 6,821 (93.1%) | 504 (6.9%) |
| 65 to 74 Years | 5,418 (99.5%) | 25 (0.5%) |
| 75 Years and older | 3,588 (100.0%) | 0 (0.0%) |
| Total | 47,761 (91.4%) | 4,477 (8.6%) |
Health Insurance Coverage by Citizenship Status in Elyria
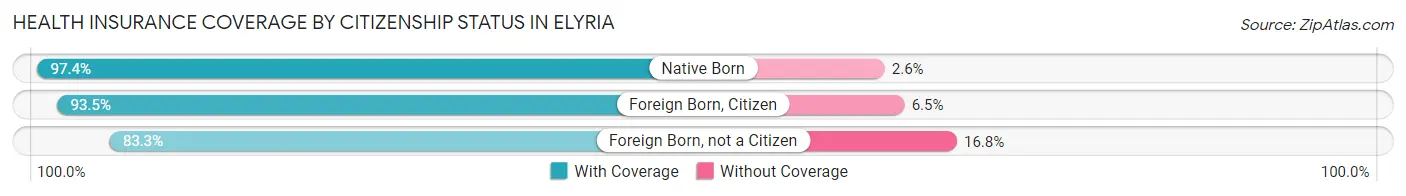
| Citizenship Status | With Coverage | Without Coverage |
| Native Born | 3,715 (97.4%) | 98 (2.6%) |
| Foreign Born, Citizen | 7,570 (93.5%) | 524 (6.5%) |
| Foreign Born, not a Citizen | 4,190 (83.3%) | 843 (16.8%) |
Health Insurance Coverage by Household Income in Elyria
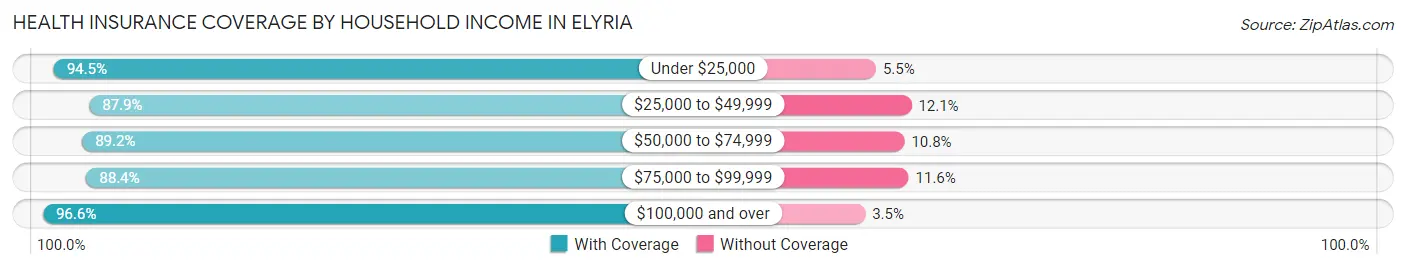
| Household Income | With Coverage | Without Coverage |
| Under $25,000 | 9,090 (94.5%) | 525 (5.5%) |
| $25,000 to $49,999 | 10,896 (87.9%) | 1,502 (12.1%) |
| $50,000 to $74,999 | 9,221 (89.2%) | 1,117 (10.8%) |
| $75,000 to $99,999 | 7,086 (88.4%) | 928 (11.6%) |
| $100,000 and over | 11,318 (96.6%) | 405 (3.5%) |
Public vs Private Health Insurance Coverage by Age in Elyria
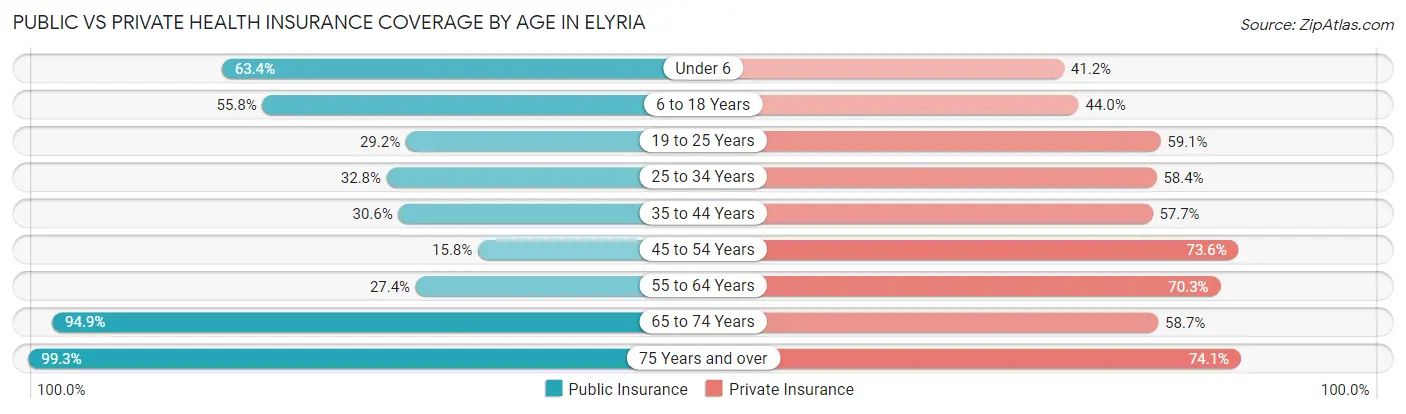
| Age Bracket | Public Insurance | Private Insurance |
| Under 6 | 2,417 (63.4%) | 1,572 (41.2%) |
| 6 to 18 Years | 4,520 (55.8%) | 3,557 (44.0%) |
| 19 to 25 Years | 1,470 (29.2%) | 2,976 (59.1%) |
| 25 to 34 Years | 1,949 (32.8%) | 3,474 (58.4%) |
| 35 to 44 Years | 2,032 (30.6%) | 3,830 (57.7%) |
| 45 to 54 Years | 1,005 (15.8%) | 4,676 (73.6%) |
| 55 to 64 Years | 2,004 (27.4%) | 5,147 (70.3%) |
| 65 to 74 Years | 5,165 (94.9%) | 3,196 (58.7%) |
| 75 Years and over | 3,563 (99.3%) | 2,658 (74.1%) |
| Total | 24,125 (46.2%) | 31,086 (59.5%) |
Disability Status by Sex by Age in Elyria
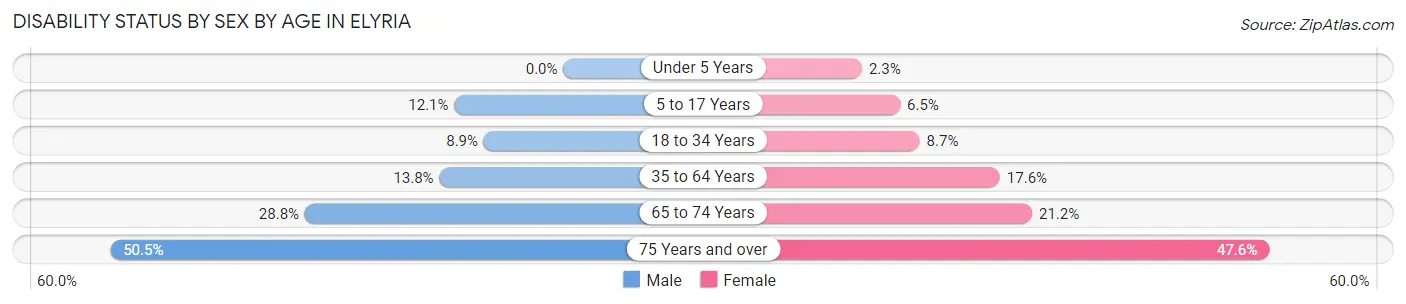
| Age Bracket | Male | Female |
| Under 5 Years | 0 (0.0%) | 33 (2.2%) |
| 5 to 17 Years | 467 (12.1%) | 270 (6.5%) |
| 18 to 34 Years | 523 (8.8%) | 513 (8.7%) |
| 35 to 64 Years | 1,346 (13.8%) | 1,860 (17.6%) |
| 65 to 74 Years | 715 (28.8%) | 627 (21.2%) |
| 75 Years and over | 766 (50.5%) | 985 (47.6%) |
Disability Class by Sex by Age in Elyria
Disability Class: Hearing Difficulty
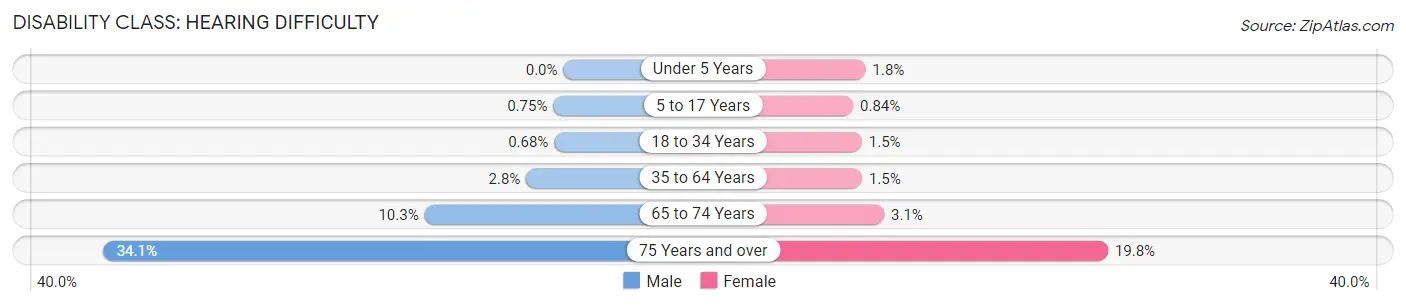
| Age Bracket | Male | Female |
| Under 5 Years | 0 (0.0%) | 26 (1.8%) |
| 5 to 17 Years | 29 (0.7%) | 35 (0.8%) |
| 18 to 34 Years | 40 (0.7%) | 88 (1.5%) |
| 35 to 64 Years | 269 (2.8%) | 158 (1.5%) |
| 65 to 74 Years | 256 (10.3%) | 93 (3.1%) |
| 75 Years and over | 518 (34.1%) | 409 (19.8%) |
Disability Class: Vision Difficulty
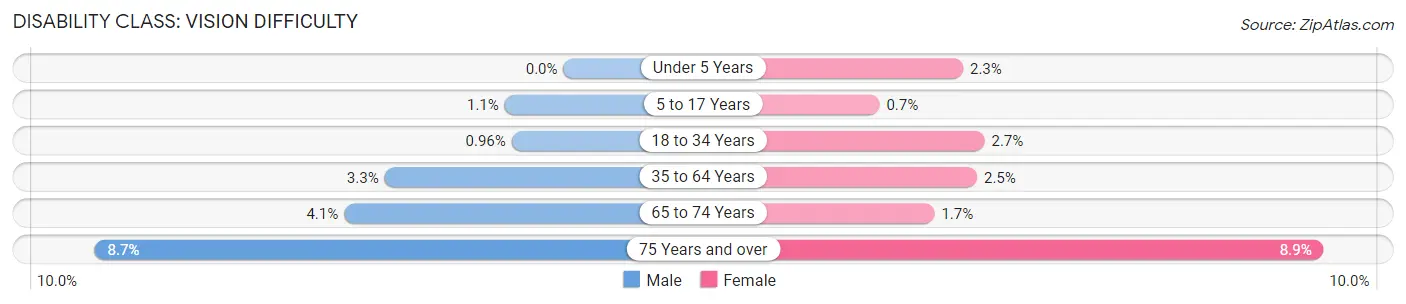
| Age Bracket | Male | Female |
| Under 5 Years | 0 (0.0%) | 33 (2.2%) |
| 5 to 17 Years | 42 (1.1%) | 29 (0.7%) |
| 18 to 34 Years | 57 (1.0%) | 157 (2.6%) |
| 35 to 64 Years | 324 (3.3%) | 265 (2.5%) |
| 65 to 74 Years | 101 (4.1%) | 51 (1.7%) |
| 75 Years and over | 132 (8.7%) | 185 (8.9%) |
Disability Class: Cognitive Difficulty
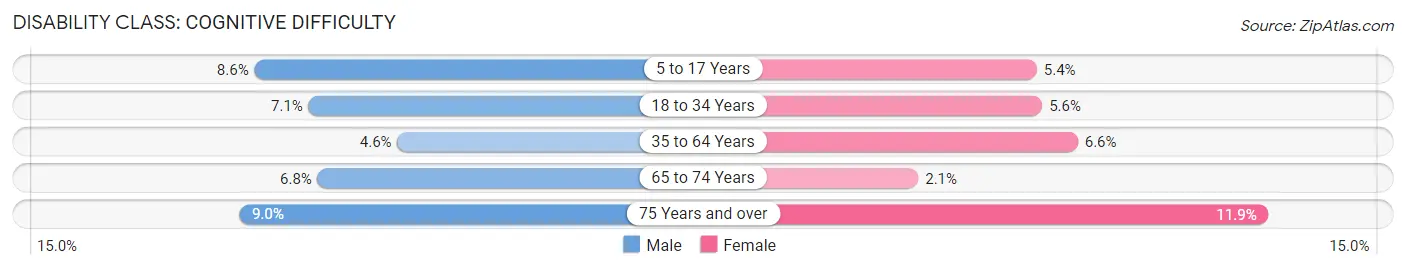
| Age Bracket | Male | Female |
| 5 to 17 Years | 331 (8.6%) | 226 (5.4%) |
| 18 to 34 Years | 419 (7.1%) | 330 (5.6%) |
| 35 to 64 Years | 451 (4.6%) | 694 (6.6%) |
| 65 to 74 Years | 170 (6.8%) | 63 (2.1%) |
| 75 Years and over | 137 (9.0%) | 246 (11.9%) |
Disability Class: Ambulatory Difficulty
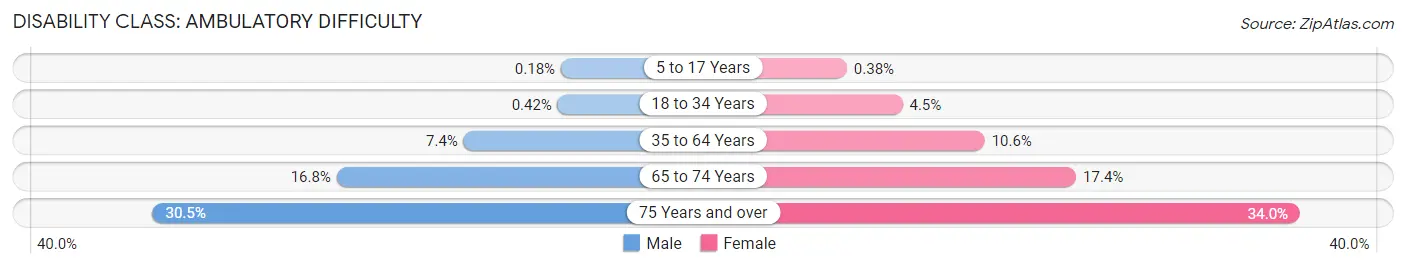
| Age Bracket | Male | Female |
| 5 to 17 Years | 7 (0.2%) | 16 (0.4%) |
| 18 to 34 Years | 25 (0.4%) | 267 (4.5%) |
| 35 to 64 Years | 722 (7.4%) | 1,120 (10.6%) |
| 65 to 74 Years | 418 (16.8%) | 515 (17.4%) |
| 75 Years and over | 463 (30.5%) | 704 (34.0%) |
Disability Class: Self-Care Difficulty
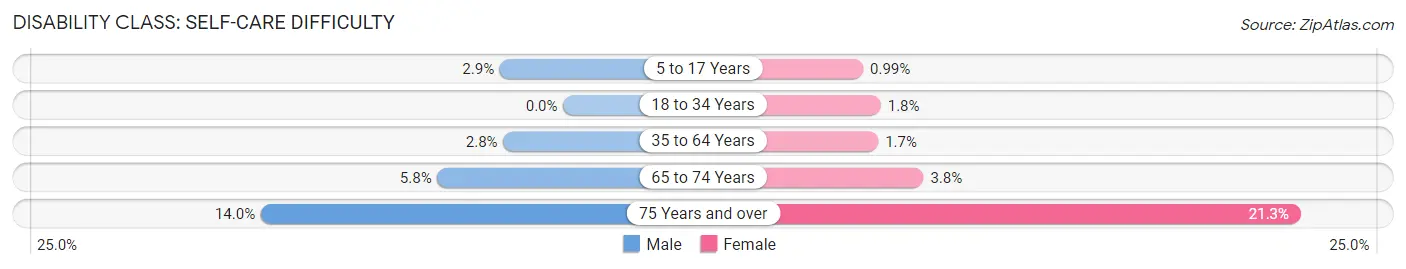
| Age Bracket | Male | Female |
| 5 to 17 Years | 113 (2.9%) | 41 (1.0%) |
| 18 to 34 Years | 0 (0.0%) | 107 (1.8%) |
| 35 to 64 Years | 271 (2.8%) | 178 (1.7%) |
| 65 to 74 Years | 145 (5.8%) | 112 (3.8%) |
| 75 Years and over | 213 (14.0%) | 441 (21.3%) |
Technology Access in Elyria
Computing Device Access in Elyria
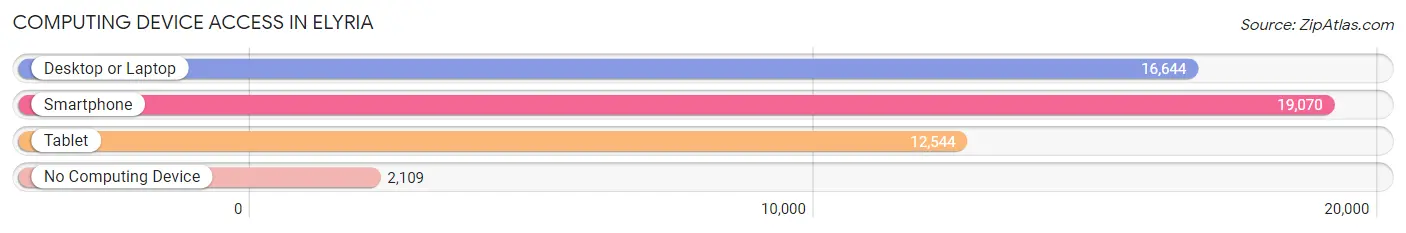
| Device Type | # Households | % Households |
| Desktop or Laptop | 16,644 | 72.0% |
| Smartphone | 19,070 | 82.5% |
| Tablet | 12,544 | 54.3% |
| No Computing Device | 2,109 | 9.1% |
| Total | 23,119 | 100.0% |
Internet Access in Elyria
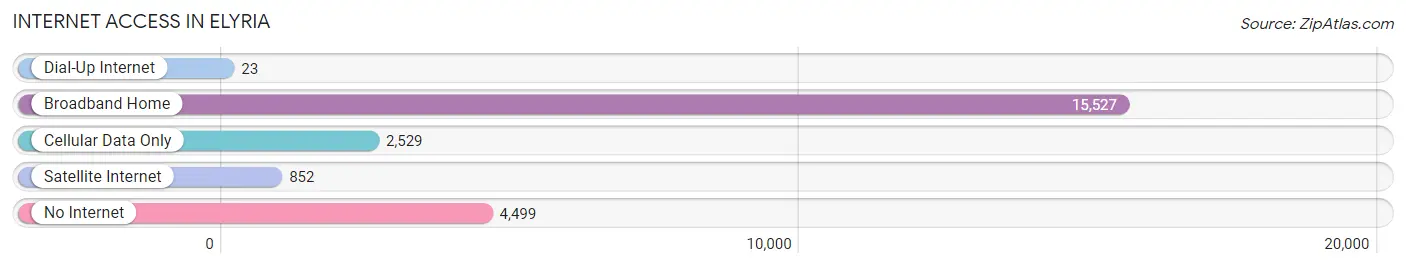
| Internet Type | # Households | % Households |
| Dial-Up Internet | 23 | 0.1% |
| Broadband Home | 15,527 | 67.2% |
| Cellular Data Only | 2,529 | 10.9% |
| Satellite Internet | 852 | 3.7% |
| No Internet | 4,499 | 19.5% |
| Total | 23,119 | 100.0% |
Elyria Summary
Elyria, Ohio is a city located in Lorain County in the northeastern part of the state. It is situated on the Black River, about 30 miles southwest of Cleveland. The city has a population of 54,533, according to the 2010 census, making it the ninth largest city in Ohio.
History
The area that is now Elyria was first settled in 1817 by Heman Ely, who had purchased the land from the Connecticut Land Company. He named the settlement after himself and it was incorporated as a village in 1834. The city was officially incorporated in 1867.
In the late 19th century, Elyria was a major center for the manufacture of stoves and other metal products. The city was also home to several large factories, including the Elyria Iron and Steel Company, which was founded in 1872.
The city experienced a period of growth in the early 20th century, with the population increasing from 8,000 in 1900 to over 20,000 by 1930. During this time, the city was home to several large industries, including the Elyria Foundry and Machine Company, the Elyria Malleable Iron Company, and the Elyria Steel Company.
Geography
Elyria is located in northeastern Ohio, about 30 miles southwest of Cleveland. The city is situated on the Black River, which flows through the city from east to west. The city is located in the Western Reserve region of Ohio, which was originally part of the Connecticut Western Reserve.
The city has a total area of 16.3 square miles, of which 16.2 square miles is land and 0.1 square miles is water. The city is located in a humid continental climate zone, with hot summers and cold winters.
Economy
Elyria’s economy is largely based on manufacturing and healthcare. The city is home to several large manufacturing companies, including Invacare Corporation, which manufactures medical equipment, and the Elyria Foundry and Machine Company, which produces metal products.
The city is also home to several healthcare facilities, including University Hospitals Elyria Medical Center, which is a major employer in the city. Other major employers in the city include the Elyria City Schools, the Elyria Public Library, and the Lorain County Community College.
Demographics
According to the 2010 census, the population of Elyria was 54,533. The racial makeup of the city was 79.2% White, 14.3% African American, 0.5% Native American, 1.2% Asian, 0.1% Pacific Islander, and 4.7% from other races. Hispanic or Latino of any race were 5.2% of the population.
The median household income in the city was $37,945, and the median family income was $45,945. The per capita income in the city was $19,945. About 16.2% of the population was below the poverty line.
Elyria is a diverse city, with a variety of cultures and backgrounds represented. The city is home to a large Hispanic population, as well as a large African American population. The city also has a large population of immigrants from various countries, including India, China, and the Philippines.
Common Questions
What is Per Capita Income in Elyria?
Per Capita income in Elyria is $28,820.
What is the Median Family Income in Elyria?
Median Family Income in Elyria is $63,476.
What is the Median Household income in Elyria?
Median Household Income in Elyria is $49,569.
What is Income or Wage Gap in Elyria?
Income or Wage Gap in Elyria is 27.4%.
Women in Elyria earn 72.6 cents for every dollar earned by a man.
What is Family Income Deficit in Elyria?
Family Income Deficit in Elyria is $12,191.
Families that are below poverty line in Elyria earn $12,191 less on average than the poverty threshold level.
What is Inequality or Gini Index in Elyria?
Inequality or Gini Index in Elyria is 0.44.
What is the Total Population of Elyria?
Total Population of Elyria is 52,780.
What is the Total Male Population of Elyria?
Total Male Population of Elyria is 25,521.
What is the Total Female Population of Elyria?
Total Female Population of Elyria is 27,259.
What is the Ratio of Males per 100 Females in Elyria?
There are 93.62 Males per 100 Females in Elyria.
What is the Ratio of Females per 100 Males in Elyria?
There are 106.81 Females per 100 Males in Elyria.
What is the Median Population Age in Elyria?
Median Population Age in Elyria is 40.2 Years.
What is the Average Family Size in Elyria
Average Family Size in Elyria is 3.0 People.
What is the Average Household Size in Elyria
Average Household Size in Elyria is 2.2 People.
How Large is the Labor Force in Elyria?
There are 26,565 People in the Labor Forcein in Elyria.
What is the Percentage of People in the Labor Force in Elyria?
61.4% of People are in the Labor Force in Elyria.
What is the Unemployment Rate in Elyria?
Unemployment Rate in Elyria is 4.9%.