Willow Grove, PA Map & Demographics
Willow Grove Map
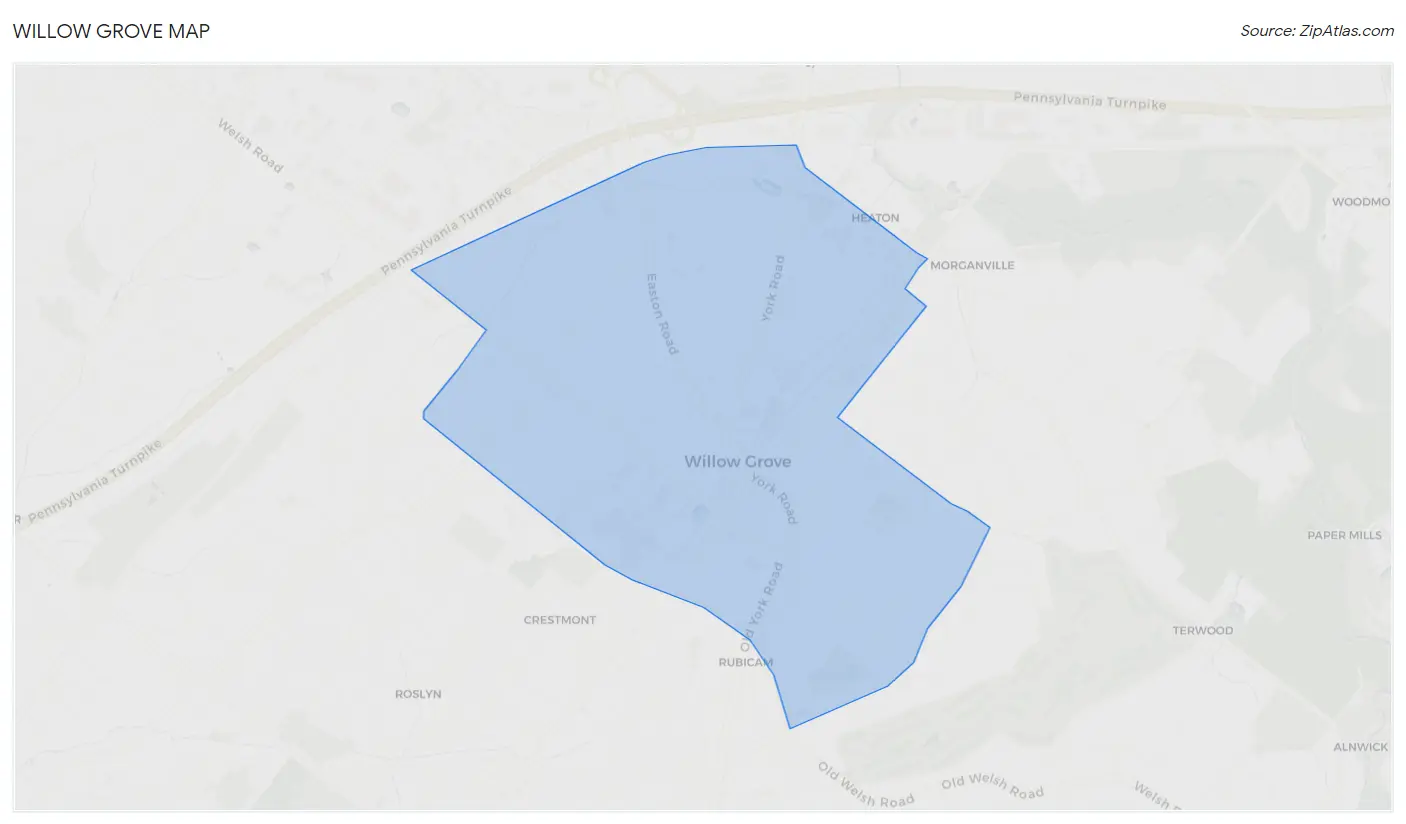
Willow Grove Overview
$46,578
PER CAPITA INCOME
$117,289
AVG FAMILY INCOME
$96,842
AVG HOUSEHOLD INCOME
10.6%
WAGE / INCOME GAP [ % ]
89.4¢/ $1
WAGE / INCOME GAP [ $ ]
$5,752
FAMILY INCOME DEFICIT
0.40
INEQUALITY / GINI INDEX
13,759
TOTAL POPULATION
6,834
MALE POPULATION
6,925
FEMALE POPULATION
98.69
MALES / 100 FEMALES
101.33
FEMALES / 100 MALES
37.7
MEDIAN AGE
3.1
AVG FAMILY SIZE
2.5
AVG HOUSEHOLD SIZE
7,707
LABOR FORCE [ PEOPLE ]
69.7%
PERCENT IN LABOR FORCE
2.6%
UNEMPLOYMENT RATE
Willow Grove Zip Codes
Income in Willow Grove
Income Overview in Willow Grove
Per Capita Income in Willow Grove is $46,578, while median incomes of families and households are $117,289 and $96,842 respectively.
| Characteristic | Number | Measure |
| Per Capita Income | 13,759 | $46,578 |
| Median Family Income | 3,582 | $117,289 |
| Mean Family Income | 3,582 | $140,790 |
| Median Household Income | 5,361 | $96,842 |
| Mean Household Income | 5,361 | $117,174 |
| Income Deficit | 3,582 | $5,752 |
| Wage / Income Gap (%) | 13,759 | 10.64% |
| Wage / Income Gap ($) | 13,759 | 89.36¢ per $1 |
| Gini / Inequality Index | 13,759 | 0.40 |
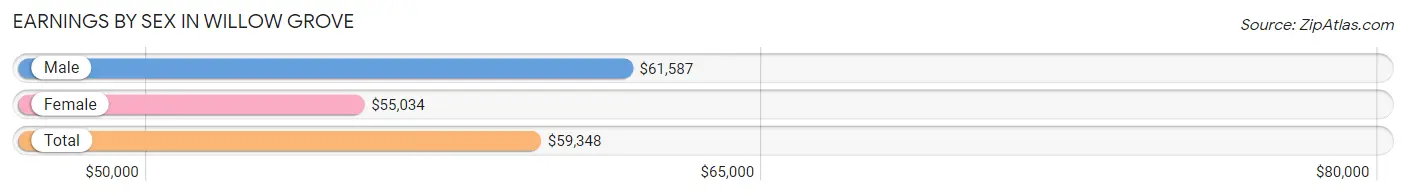
Earnings by Sex in Willow Grove
Average Earnings in Willow Grove are $59,348, $61,587 for men and $55,034 for women, a difference of 10.6%.
| Sex | Number | Average Earnings |
| Male | 4,060 (51.1%) | $61,587 |
| Female | 3,888 (48.9%) | $55,034 |
| Total | 7,948 (100.0%) | $59,348 |
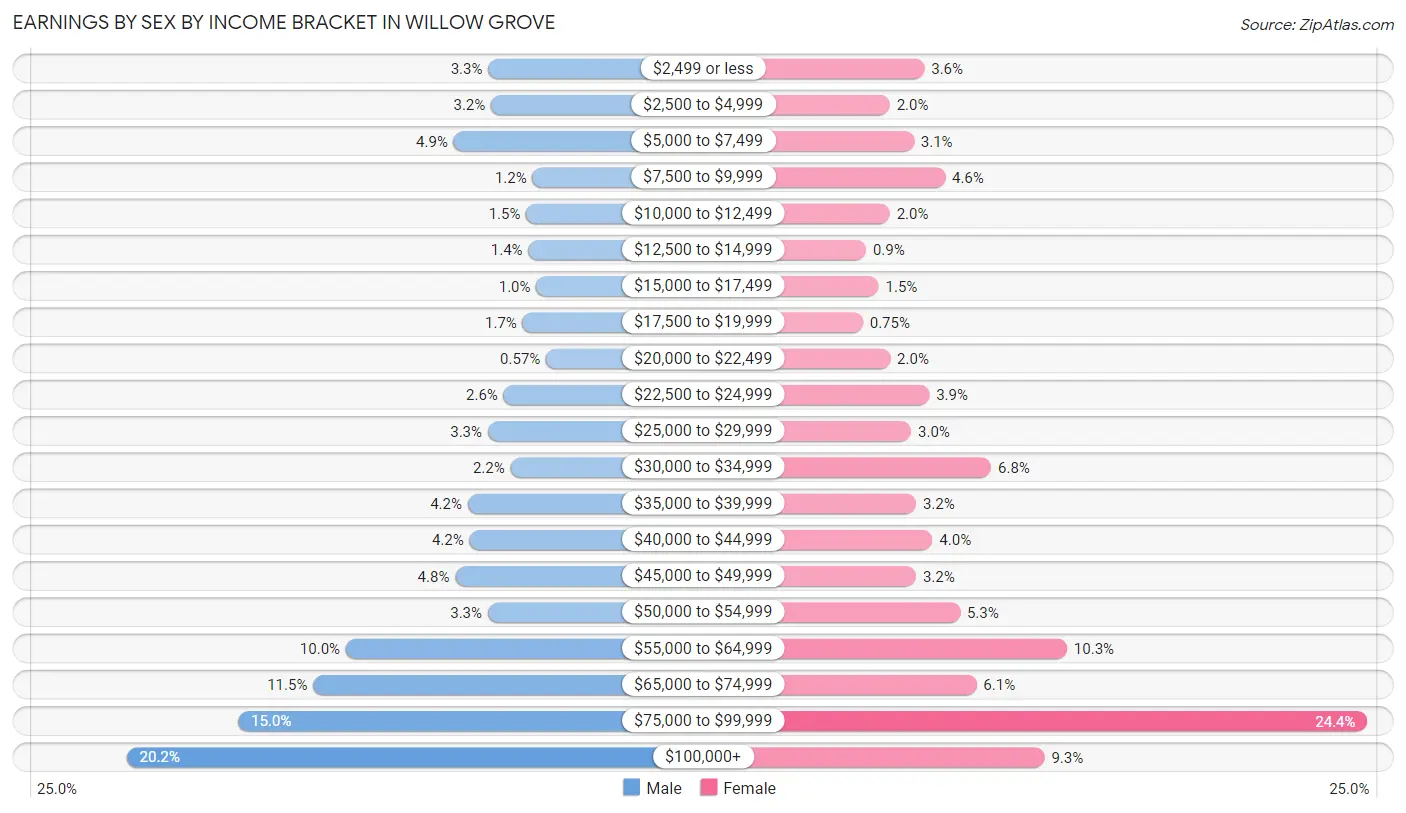
Earnings by Sex by Income Bracket in Willow Grove
The most common earnings brackets in Willow Grove are $100,000+ for men (821 | 20.2%) and $75,000 to $99,999 for women (948 | 24.4%).
| Income | Male | Female |
| $2,499 or less | 133 (3.3%) | 141 (3.6%) |
| $2,500 to $4,999 | 128 (3.2%) | 78 (2.0%) |
| $5,000 to $7,499 | 199 (4.9%) | 122 (3.1%) |
| $7,500 to $9,999 | 49 (1.2%) | 179 (4.6%) |
| $10,000 to $12,499 | 61 (1.5%) | 78 (2.0%) |
| $12,500 to $14,999 | 57 (1.4%) | 35 (0.9%) |
| $15,000 to $17,499 | 42 (1.0%) | 58 (1.5%) |
| $17,500 to $19,999 | 68 (1.7%) | 29 (0.7%) |
| $20,000 to $22,499 | 23 (0.6%) | 79 (2.0%) |
| $22,500 to $24,999 | 104 (2.6%) | 150 (3.9%) |
| $25,000 to $29,999 | 134 (3.3%) | 117 (3.0%) |
| $30,000 to $34,999 | 91 (2.2%) | 263 (6.8%) |
| $35,000 to $39,999 | 172 (4.2%) | 126 (3.2%) |
| $40,000 to $44,999 | 169 (4.2%) | 156 (4.0%) |
| $45,000 to $49,999 | 196 (4.8%) | 126 (3.2%) |
| $50,000 to $54,999 | 134 (3.3%) | 206 (5.3%) |
| $55,000 to $64,999 | 404 (10.0%) | 401 (10.3%) |
| $65,000 to $74,999 | 466 (11.5%) | 236 (6.1%) |
| $75,000 to $99,999 | 609 (15.0%) | 948 (24.4%) |
| $100,000+ | 821 (20.2%) | 360 (9.3%) |
| Total | 4,060 (100.0%) | 3,888 (100.0%) |
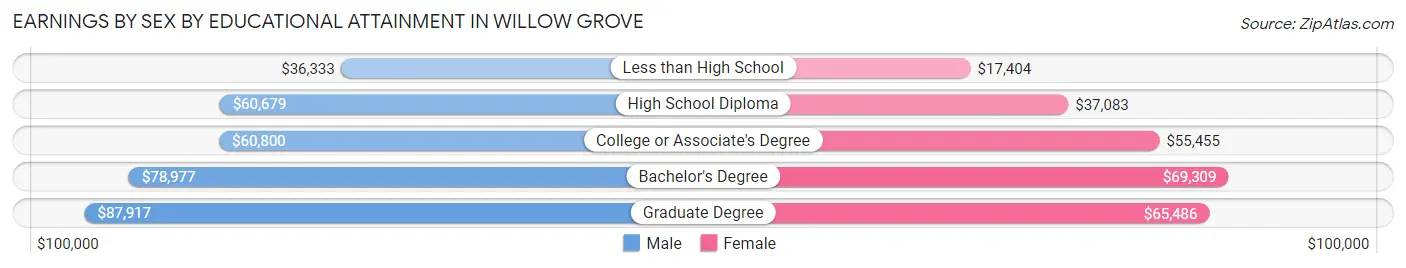
Earnings by Sex by Educational Attainment in Willow Grove
Average earnings in Willow Grove are $69,001 for men and $61,493 for women, a difference of 10.9%. Men with an educational attainment of graduate degree enjoy the highest average annual earnings of $87,917, while those with less than high school education earn the least with $36,333. Women with an educational attainment of bachelor's degree earn the most with the average annual earnings of $69,309, while those with less than high school education have the smallest earnings of $17,404.
| Educational Attainment | Male Income | Female Income |
| Less than High School | $36,333 | $17,404 |
| High School Diploma | $60,679 | $37,083 |
| College or Associate's Degree | $60,800 | $55,455 |
| Bachelor's Degree | $78,977 | $69,309 |
| Graduate Degree | $87,917 | $65,486 |
| Total | $69,001 | $61,493 |
Family Income in Willow Grove
Family Income Brackets in Willow Grove
According to the Willow Grove family income data, there are 971 families falling into the $100,000 to $149,999 income range, which is the most common income bracket and makes up 27.1% of all families. Conversely, the $10,000 to $14,999 income bracket is the least frequent group with only 14 families (0.4%) belonging to this category.
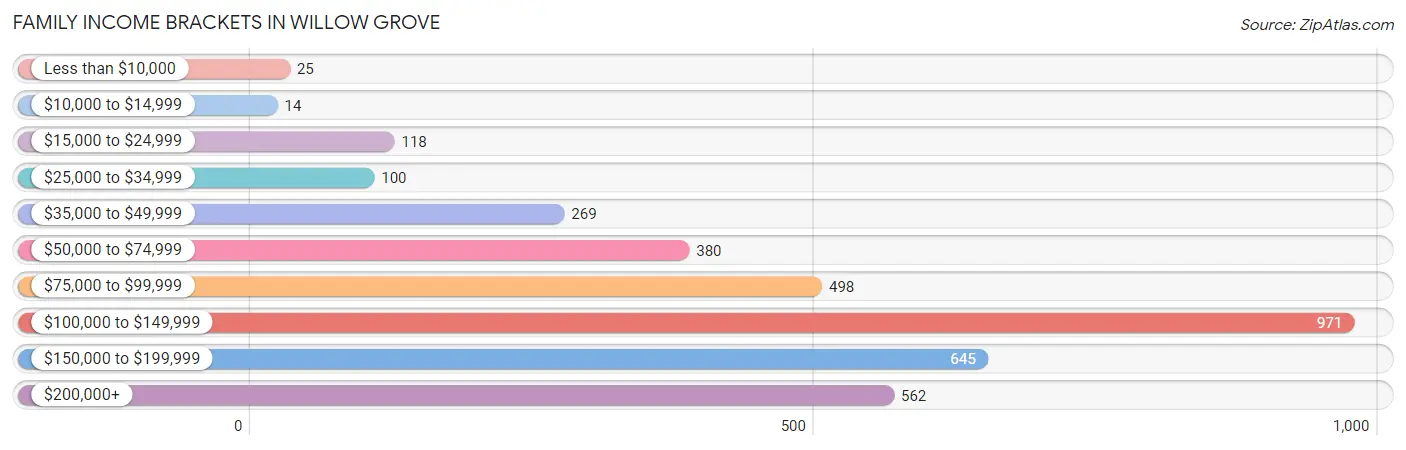
| Income Bracket | # Families | % Families |
| Less than $10,000 | 25 | 0.7% |
| $10,000 to $14,999 | 14 | 0.4% |
| $15,000 to $24,999 | 118 | 3.3% |
| $25,000 to $34,999 | 100 | 2.8% |
| $35,000 to $49,999 | 269 | 7.5% |
| $50,000 to $74,999 | 380 | 10.6% |
| $75,000 to $99,999 | 498 | 13.9% |
| $100,000 to $149,999 | 971 | 27.1% |
| $150,000 to $199,999 | 645 | 18.0% |
| $200,000+ | 562 | 15.7% |
Family Income by Famaliy Size in Willow Grove
5-person families (378 | 10.5%) account for the highest median family income in Willow Grove with $165,750 per family, while 2-person families (1,423 | 39.7%) have the highest median income of $46,783 per family member.
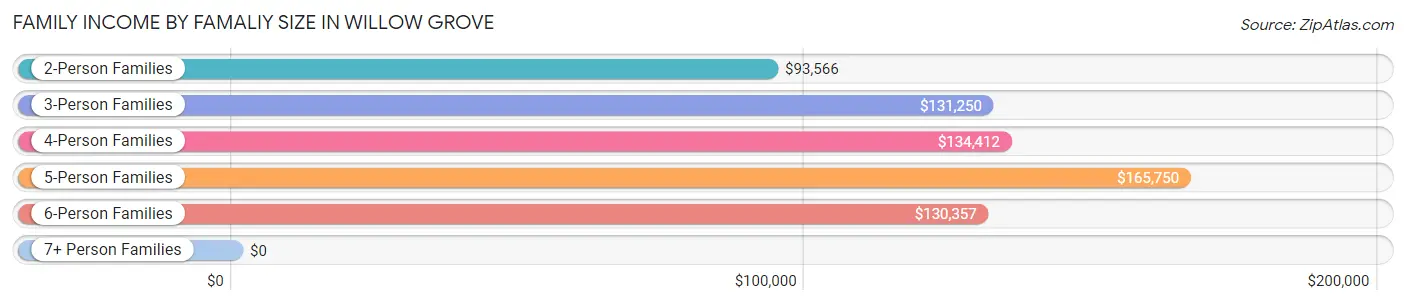
| Income Bracket | # Families | Median Income |
| 2-Person Families | 1,423 (39.7%) | $93,566 |
| 3-Person Families | 947 (26.4%) | $131,250 |
| 4-Person Families | 756 (21.1%) | $134,412 |
| 5-Person Families | 378 (10.5%) | $165,750 |
| 6-Person Families | 72 (2.0%) | $130,357 |
| 7+ Person Families | 6 (0.2%) | $0 |
| Total | 3,582 (100.0%) | $117,289 |
Family Income by Number of Earners in Willow Grove
The median family income in Willow Grove is $117,289, with families comprising 3+ earners (456) having the highest median family income of $181,304, while families with no earners (291) have the lowest median family income of $58,614, accounting for 12.7% and 8.1% of families, respectively.
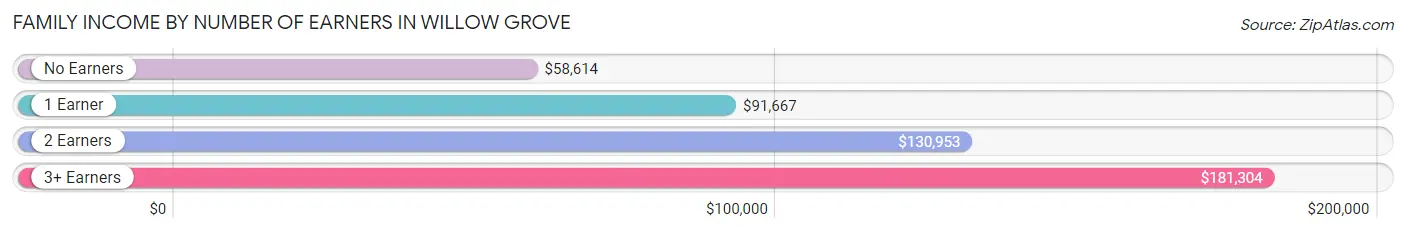
| Number of Earners | # Families | Median Income |
| No Earners | 291 (8.1%) | $58,614 |
| 1 Earner | 954 (26.6%) | $91,667 |
| 2 Earners | 1,881 (52.5%) | $130,953 |
| 3+ Earners | 456 (12.7%) | $181,304 |
| Total | 3,582 (100.0%) | $117,289 |
Household Income in Willow Grove
Household Income Brackets in Willow Grove
With 1,324 households falling in the category, the $100,000 to $149,999 income range is the most frequent in Willow Grove, accounting for 24.7% of all households. In contrast, only 96 households (1.8%) fall into the $10,000 to $14,999 income bracket, making it the least populous group.
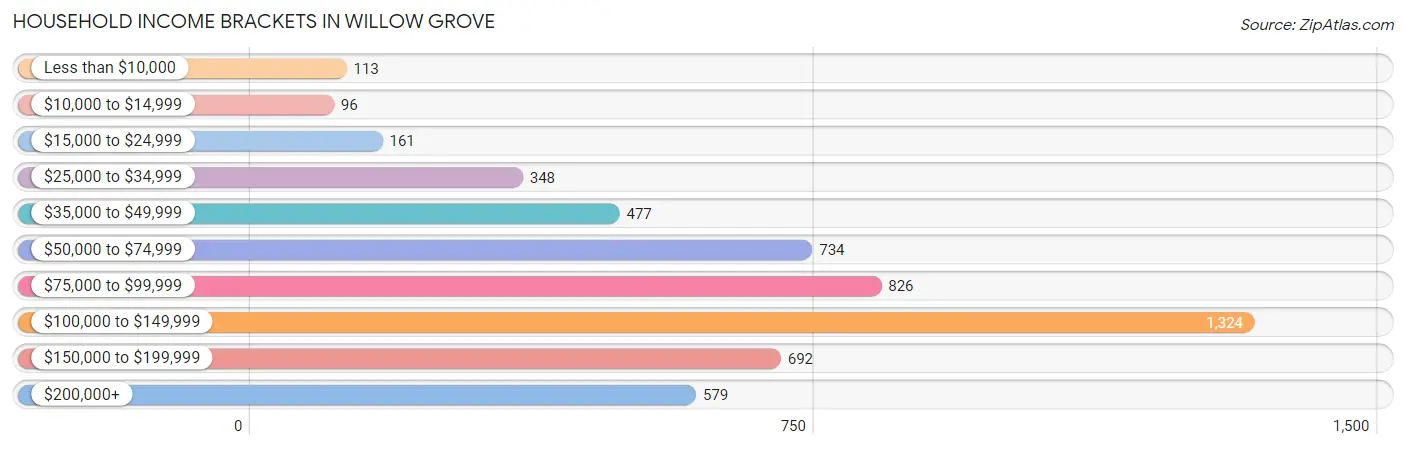
| Income Bracket | # Households | % Households |
| Less than $10,000 | 113 | 2.1% |
| $10,000 to $14,999 | 96 | 1.8% |
| $15,000 to $24,999 | 161 | 3.0% |
| $25,000 to $34,999 | 348 | 6.5% |
| $35,000 to $49,999 | 477 | 8.9% |
| $50,000 to $74,999 | 734 | 13.7% |
| $75,000 to $99,999 | 826 | 15.4% |
| $100,000 to $149,999 | 1,324 | 24.7% |
| $150,000 to $199,999 | 692 | 12.9% |
| $200,000+ | 579 | 10.8% |
Household Income by Householder Age in Willow Grove
The median household income in Willow Grove is $96,842, with the highest median household income of $109,531 found in the 25 to 44 years age bracket for the primary householder. A total of 1,628 households (30.4%) fall into this category. Meanwhile, the 15 to 24 years age bracket for the primary householder has the lowest median household income of $48,566, with 182 households (3.4%) in this group.
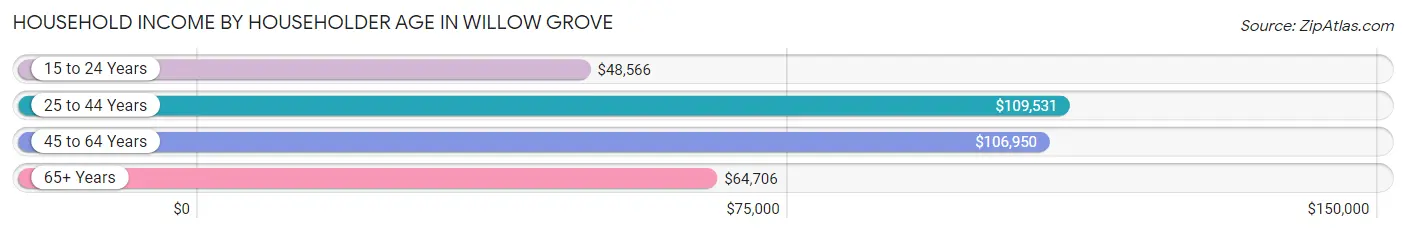
| Income Bracket | # Households | Median Income |
| 15 to 24 Years | 182 (3.4%) | $48,566 |
| 25 to 44 Years | 1,628 (30.4%) | $109,531 |
| 45 to 64 Years | 2,177 (40.6%) | $106,950 |
| 65+ Years | 1,374 (25.6%) | $64,706 |
| Total | 5,361 (100.0%) | $96,842 |
Poverty in Willow Grove
Income Below Poverty by Sex and Age in Willow Grove
With 5.6% poverty level for males and 6.0% for females among the residents of Willow Grove, 18 to 24 year old males and 75 year old and over females are the most vulnerable to poverty, with 97 males (16.8%) and 94 females (17.7%) in their respective age groups living below the poverty level.
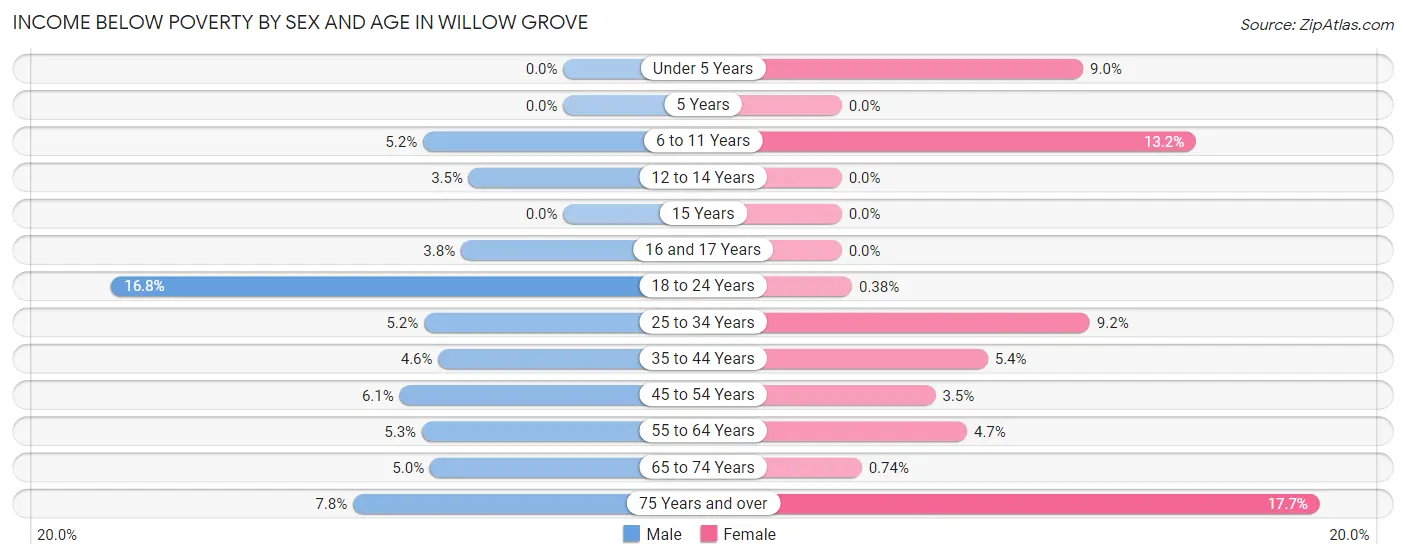
| Age Bracket | Male | Female |
| Under 5 Years | 0 (0.0%) | 31 (9.0%) |
| 5 Years | 0 (0.0%) | 0 (0.0%) |
| 6 to 11 Years | 19 (5.2%) | 61 (13.2%) |
| 12 to 14 Years | 14 (3.5%) | 0 (0.0%) |
| 15 Years | 0 (0.0%) | 0 (0.0%) |
| 16 and 17 Years | 9 (3.8%) | 0 (0.0%) |
| 18 to 24 Years | 97 (16.8%) | 2 (0.4%) |
| 25 to 34 Years | 53 (5.2%) | 100 (9.2%) |
| 35 to 44 Years | 39 (4.6%) | 43 (5.4%) |
| 45 to 54 Years | 61 (6.1%) | 33 (3.5%) |
| 55 to 64 Years | 46 (5.2%) | 40 (4.6%) |
| 65 to 74 Years | 24 (5.0%) | 5 (0.7%) |
| 75 Years and over | 20 (7.8%) | 94 (17.7%) |
| Total | 382 (5.6%) | 409 (6.0%) |
Income Above Poverty by Sex and Age in Willow Grove
According to the poverty statistics in Willow Grove, males aged under 5 years and females aged 5 years are the age groups that are most secure financially, with 100.0% of males and 100.0% of females in these age groups living above the poverty line.
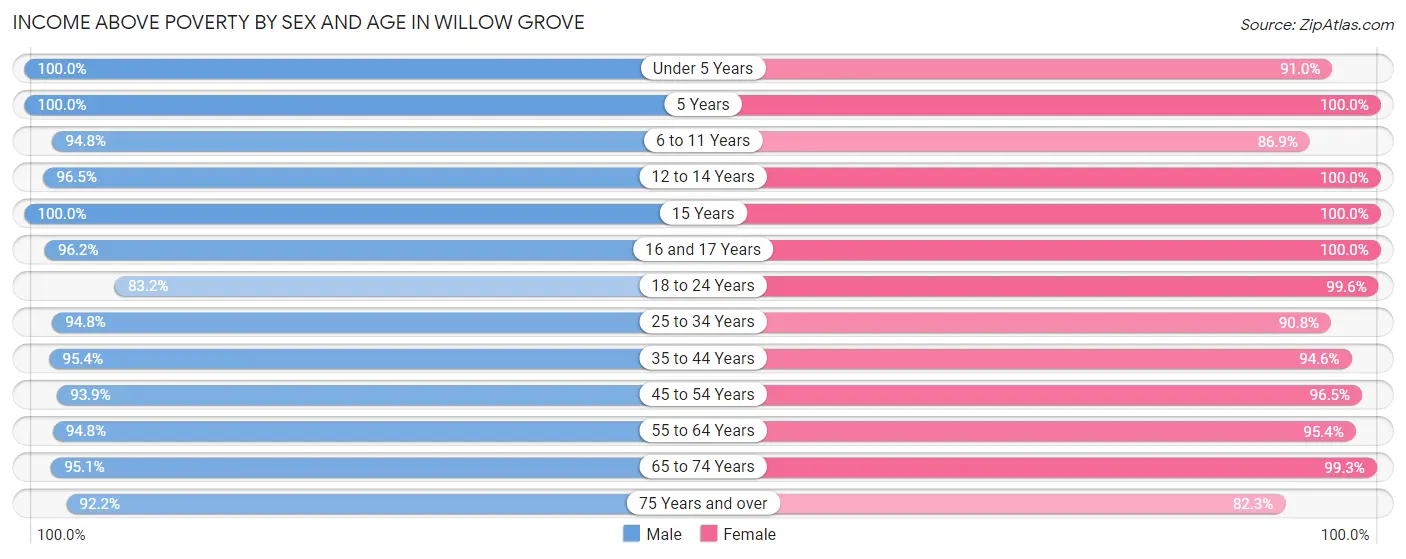
| Age Bracket | Male | Female |
| Under 5 Years | 605 (100.0%) | 315 (91.0%) |
| 5 Years | 15 (100.0%) | 90 (100.0%) |
| 6 to 11 Years | 346 (94.8%) | 403 (86.9%) |
| 12 to 14 Years | 385 (96.5%) | 266 (100.0%) |
| 15 Years | 83 (100.0%) | 69 (100.0%) |
| 16 and 17 Years | 228 (96.2%) | 168 (100.0%) |
| 18 to 24 Years | 481 (83.2%) | 526 (99.6%) |
| 25 to 34 Years | 972 (94.8%) | 986 (90.8%) |
| 35 to 44 Years | 802 (95.4%) | 750 (94.6%) |
| 45 to 54 Years | 942 (93.9%) | 916 (96.5%) |
| 55 to 64 Years | 831 (94.8%) | 820 (95.4%) |
| 65 to 74 Years | 461 (95.1%) | 670 (99.3%) |
| 75 Years and over | 236 (92.2%) | 436 (82.3%) |
| Total | 6,387 (94.4%) | 6,415 (94.0%) |
Income Below Poverty Among Married-Couple Families in Willow Grove
The poverty statistics for married-couple families in Willow Grove show that 0.9% or 25 of the total 2,683 families live below the poverty line. Families with no children have the highest poverty rate of 1.3%, comprising of 16 families. On the other hand, families with 3 or 4 children have the lowest poverty rate of 0.0%, which includes 0 families.
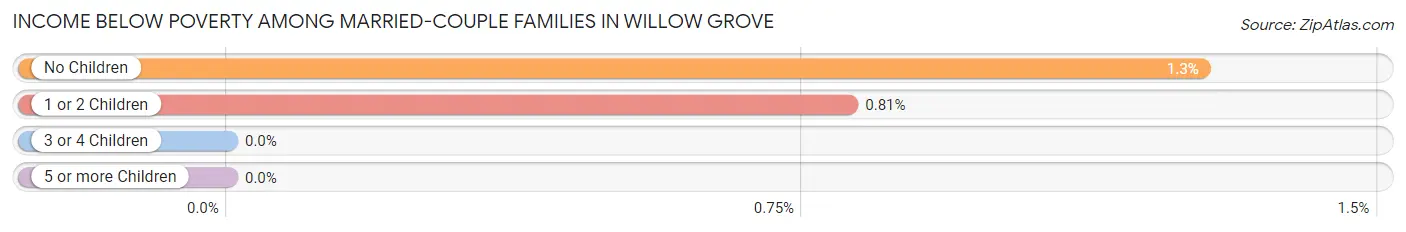
| Children | Above Poverty | Below Poverty |
| No Children | 1,248 (98.7%) | 16 (1.3%) |
| 1 or 2 Children | 1,104 (99.2%) | 9 (0.8%) |
| 3 or 4 Children | 300 (100.0%) | 0 (0.0%) |
| 5 or more Children | 6 (100.0%) | 0 (0.0%) |
| Total | 2,658 (99.1%) | 25 (0.9%) |
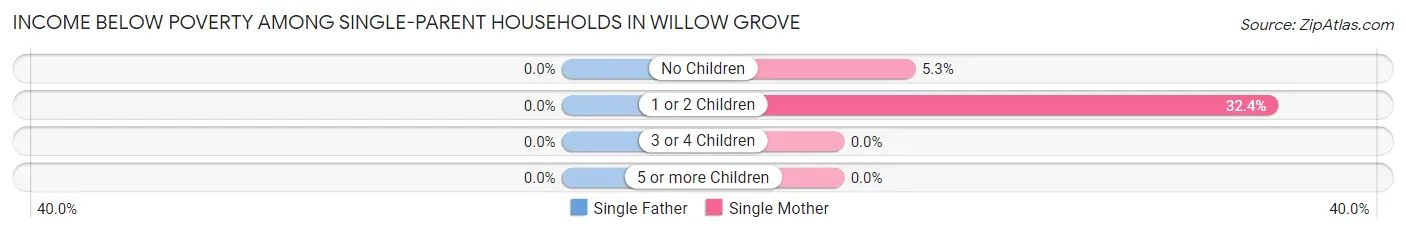
Income Below Poverty Among Single-Parent Households in Willow Grove
| Children | Single Father | Single Mother |
| No Children | 0 (0.0%) | 18 (5.3%) |
| 1 or 2 Children | 0 (0.0%) | 78 (32.4%) |
| 3 or 4 Children | 0 (0.0%) | 0 (0.0%) |
| 5 or more Children | 0 (0.0%) | 0 (0.0%) |
| Total | 0 (0.0%) | 96 (15.0%) |
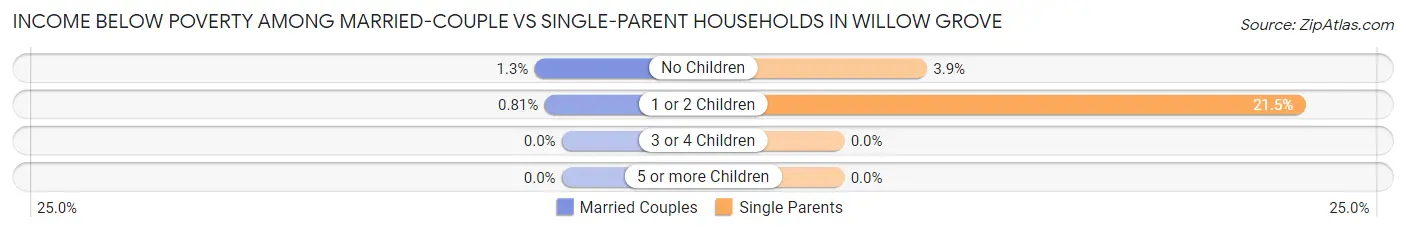
Income Below Poverty Among Married-Couple vs Single-Parent Households in Willow Grove
The poverty data for Willow Grove shows that 25 of the married-couple family households (0.9%) and 96 of the single-parent households (10.7%) are living below the poverty level. Within the married-couple family households, those with no children have the highest poverty rate, with 16 households (1.3%) falling below the poverty line. Among the single-parent households, those with 1 or 2 children have the highest poverty rate, with 78 household (21.5%) living below poverty.
| Children | Married-Couple Families | Single-Parent Households |
| No Children | 16 (1.3%) | 18 (3.8%) |
| 1 or 2 Children | 9 (0.8%) | 78 (21.5%) |
| 3 or 4 Children | 0 (0.0%) | 0 (0.0%) |
| 5 or more Children | 0 (0.0%) | 0 (0.0%) |
| Total | 25 (0.9%) | 96 (10.7%) |
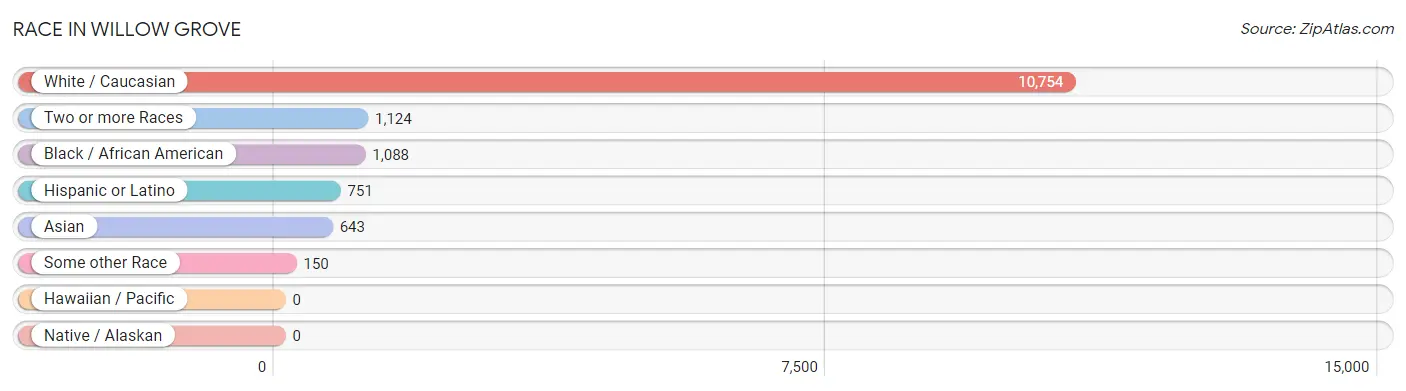
Race in Willow Grove
The most populous races in Willow Grove are White / Caucasian (10,754 | 78.2%), Two or more Races (1,124 | 8.2%), and Black / African American (1,088 | 7.9%).
| Race | # Population | % Population |
| Asian | 643 | 4.7% |
| Black / African American | 1,088 | 7.9% |
| Hawaiian / Pacific | 0 | 0.0% |
| Hispanic or Latino | 751 | 5.5% |
| Native / Alaskan | 0 | 0.0% |
| White / Caucasian | 10,754 | 78.2% |
| Two or more Races | 1,124 | 8.2% |
| Some other Race | 150 | 1.1% |
| Total | 13,759 | 100.0% |
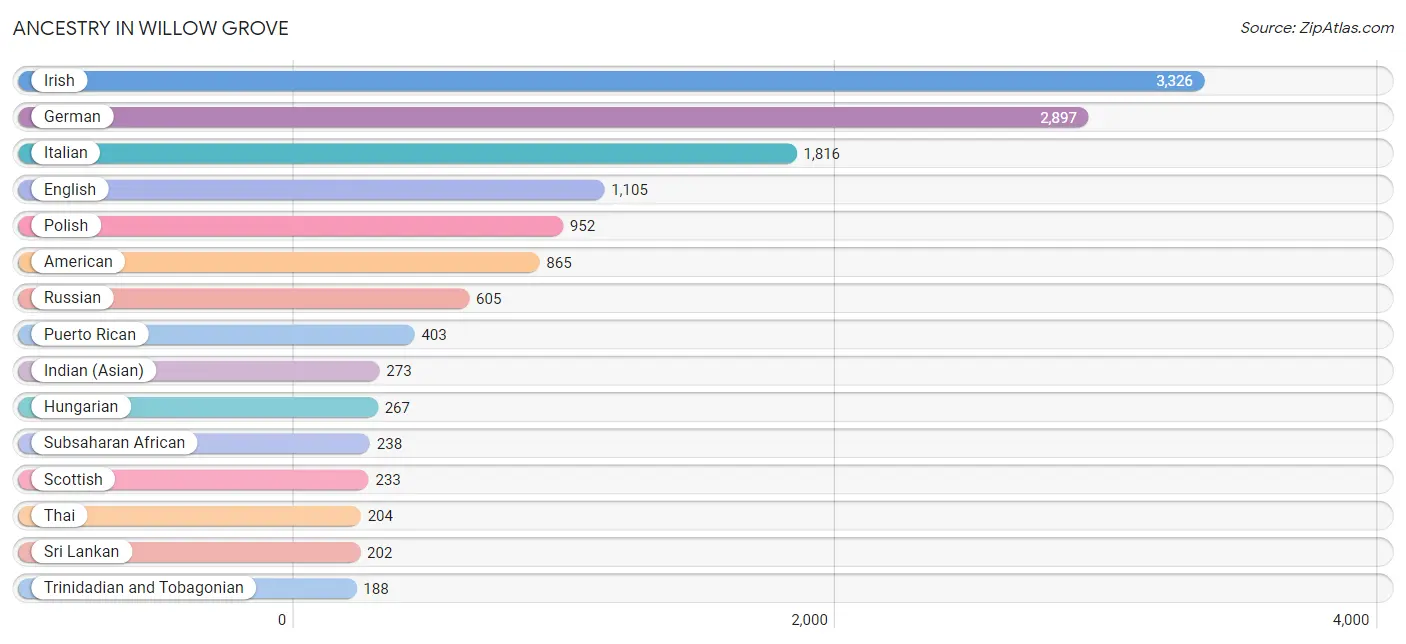
Ancestry in Willow Grove
The most populous ancestries reported in Willow Grove are Irish (3,326 | 24.2%), German (2,897 | 21.1%), Italian (1,816 | 13.2%), English (1,105 | 8.0%), and Polish (952 | 6.9%), together accounting for 73.4% of all Willow Grove residents.
| Ancestry | # Population | % Population |
| African | 178 | 1.3% |
| Albanian | 7 | 0.1% |
| American | 865 | 6.3% |
| Arab | 9 | 0.1% |
| Argentinean | 63 | 0.5% |
| Austrian | 39 | 0.3% |
| Belgian | 91 | 0.7% |
| Bhutanese | 20 | 0.2% |
| British | 61 | 0.4% |
| Burmese | 51 | 0.4% |
| Canadian | 6 | 0.0% |
| Central American | 63 | 0.5% |
| Croatian | 7 | 0.1% |
| Cuban | 73 | 0.5% |
| Cypriot | 41 | 0.3% |
| Czechoslovakian | 15 | 0.1% |
| Danish | 36 | 0.3% |
| Dominican | 22 | 0.2% |
| Dutch | 71 | 0.5% |
| Eastern European | 109 | 0.8% |
| Ecuadorian | 35 | 0.3% |
| English | 1,105 | 8.0% |
| European | 178 | 1.3% |
| Finnish | 14 | 0.1% |
| French | 102 | 0.7% |
| French Canadian | 75 | 0.5% |
| German | 2,897 | 21.1% |
| Greek | 114 | 0.8% |
| Haitian | 92 | 0.7% |
| Honduran | 32 | 0.2% |
| Hungarian | 267 | 1.9% |
| Indian (Asian) | 273 | 2.0% |
| Irish | 3,326 | 24.2% |
| Italian | 1,816 | 13.2% |
| Jamaican | 26 | 0.2% |
| Japanese | 39 | 0.3% |
| Korean | 70 | 0.5% |
| Laotian | 11 | 0.1% |
| Latvian | 13 | 0.1% |
| Lebanese | 9 | 0.1% |
| Lithuanian | 43 | 0.3% |
| Lumbee | 7 | 0.1% |
| Mexican | 16 | 0.1% |
| Native Hawaiian | 14 | 0.1% |
| Navajo | 67 | 0.5% |
| Nigerian | 45 | 0.3% |
| Northern European | 8 | 0.1% |
| Norwegian | 34 | 0.3% |
| Pakistani | 46 | 0.3% |
| Pennsylvania German | 52 | 0.4% |
| Peruvian | 10 | 0.1% |
| Polish | 952 | 6.9% |
| Portuguese | 77 | 0.6% |
| Puerto Rican | 403 | 2.9% |
| Romanian | 56 | 0.4% |
| Russian | 605 | 4.4% |
| Salvadoran | 31 | 0.2% |
| Scandinavian | 13 | 0.1% |
| Scotch-Irish | 62 | 0.4% |
| Scottish | 233 | 1.7% |
| Slovak | 30 | 0.2% |
| South African | 15 | 0.1% |
| South American | 108 | 0.8% |
| Spanish | 21 | 0.2% |
| Sri Lankan | 202 | 1.5% |
| Subsaharan African | 238 | 1.7% |
| Swedish | 85 | 0.6% |
| Swiss | 20 | 0.2% |
| Thai | 204 | 1.5% |
| Trinidadian and Tobagonian | 188 | 1.4% |
| Ukrainian | 138 | 1.0% |
| Welsh | 112 | 0.8% |
| Yugoslavian | 33 | 0.2% | View All 73 Rows |
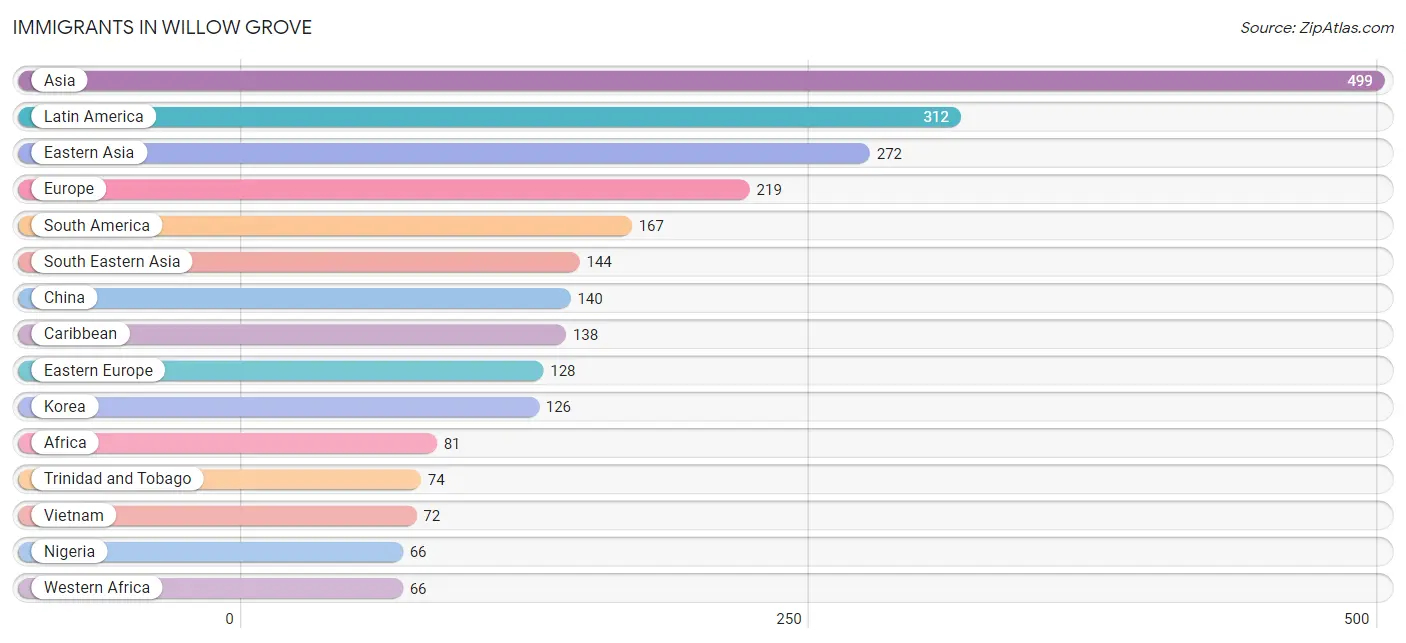
Immigrants in Willow Grove
The most numerous immigrant groups reported in Willow Grove came from Asia (499 | 3.6%), Latin America (312 | 2.3%), Eastern Asia (272 | 2.0%), Europe (219 | 1.6%), and South America (167 | 1.2%), together accounting for 10.7% of all Willow Grove residents.
| Immigration Origin | # Population | % Population |
| Africa | 81 | 0.6% |
| Albania | 7 | 0.1% |
| Argentina | 63 | 0.5% |
| Asia | 499 | 3.6% |
| Bahamas | 7 | 0.1% |
| Belarus | 9 | 0.1% |
| Bolivia | 25 | 0.2% |
| Brazil | 62 | 0.4% |
| Cambodia | 26 | 0.2% |
| Canada | 15 | 0.1% |
| Caribbean | 138 | 1.0% |
| Central America | 7 | 0.1% |
| China | 140 | 1.0% |
| Cuba | 18 | 0.1% |
| Dominican Republic | 22 | 0.2% |
| Eastern Asia | 272 | 2.0% |
| Eastern Europe | 128 | 0.9% |
| Ecuador | 7 | 0.1% |
| Europe | 219 | 1.6% |
| Germany | 13 | 0.1% |
| Greece | 5 | 0.0% |
| Honduras | 7 | 0.1% |
| Hong Kong | 10 | 0.1% |
| India | 24 | 0.2% |
| Italy | 38 | 0.3% |
| Jamaica | 17 | 0.1% |
| Japan | 6 | 0.0% |
| Korea | 126 | 0.9% |
| Latin America | 312 | 2.3% |
| Nepal | 40 | 0.3% |
| Netherlands | 4 | 0.0% |
| Nigeria | 66 | 0.5% |
| Northern Europe | 18 | 0.1% |
| Peru | 10 | 0.1% |
| Philippines | 46 | 0.3% |
| Russia | 56 | 0.4% |
| South America | 167 | 1.2% |
| South Central Asia | 64 | 0.5% |
| South Eastern Asia | 144 | 1.1% |
| Southern Europe | 56 | 0.4% |
| Spain | 13 | 0.1% |
| Trinidad and Tobago | 74 | 0.5% |
| Ukraine | 51 | 0.4% |
| Vietnam | 72 | 0.5% |
| Western Africa | 66 | 0.5% |
| Western Asia | 19 | 0.1% |
| Western Europe | 17 | 0.1% | View All 47 Rows |
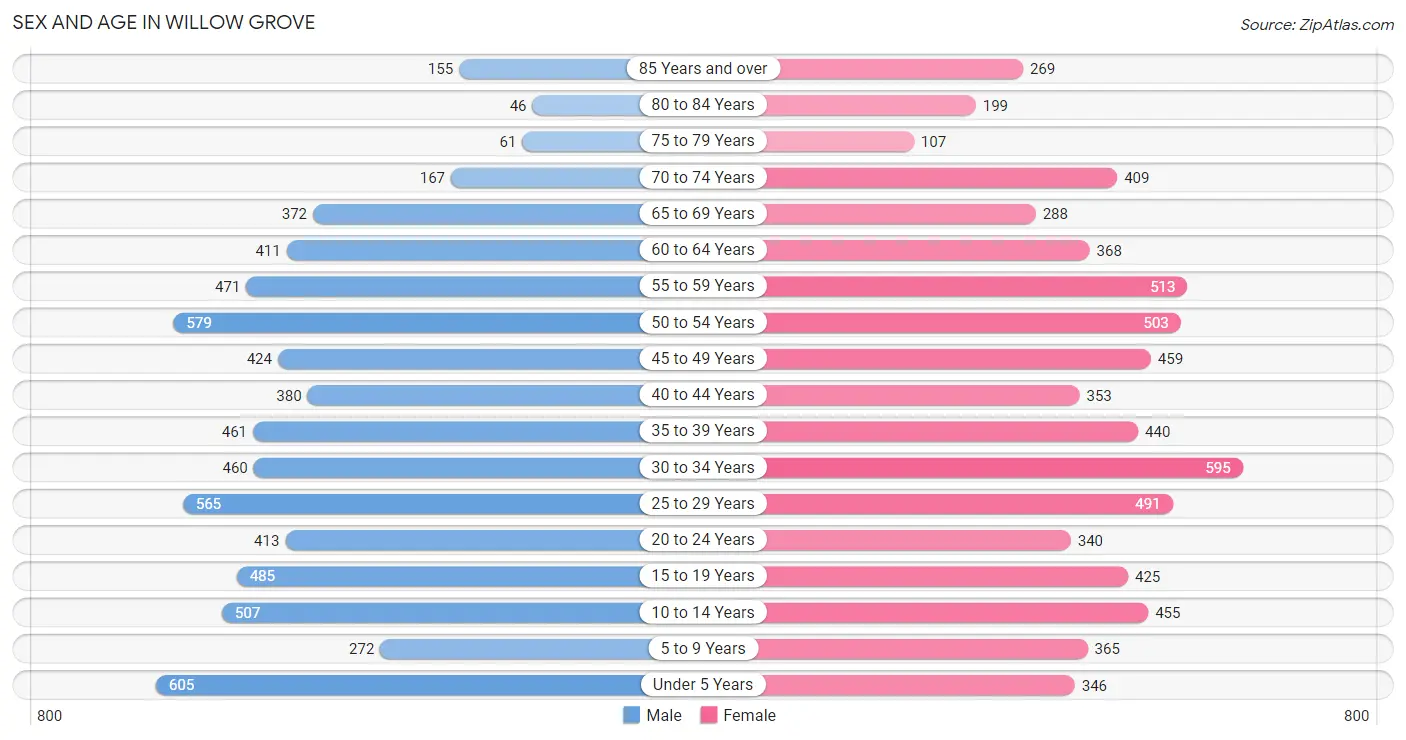
Sex and Age in Willow Grove
Sex and Age in Willow Grove
The most populous age groups in Willow Grove are Under 5 Years (605 | 8.8%) for men and 30 to 34 Years (595 | 8.6%) for women.
| Age Bracket | Male | Female |
| Under 5 Years | 605 (8.8%) | 346 (5.0%) |
| 5 to 9 Years | 272 (4.0%) | 365 (5.3%) |
| 10 to 14 Years | 507 (7.4%) | 455 (6.6%) |
| 15 to 19 Years | 485 (7.1%) | 425 (6.1%) |
| 20 to 24 Years | 413 (6.0%) | 340 (4.9%) |
| 25 to 29 Years | 565 (8.3%) | 491 (7.1%) |
| 30 to 34 Years | 460 (6.7%) | 595 (8.6%) |
| 35 to 39 Years | 461 (6.8%) | 440 (6.4%) |
| 40 to 44 Years | 380 (5.6%) | 353 (5.1%) |
| 45 to 49 Years | 424 (6.2%) | 459 (6.6%) |
| 50 to 54 Years | 579 (8.5%) | 503 (7.3%) |
| 55 to 59 Years | 471 (6.9%) | 513 (7.4%) |
| 60 to 64 Years | 411 (6.0%) | 368 (5.3%) |
| 65 to 69 Years | 372 (5.4%) | 288 (4.2%) |
| 70 to 74 Years | 167 (2.4%) | 409 (5.9%) |
| 75 to 79 Years | 61 (0.9%) | 107 (1.5%) |
| 80 to 84 Years | 46 (0.7%) | 199 (2.9%) |
| 85 Years and over | 155 (2.3%) | 269 (3.9%) |
| Total | 6,834 (100.0%) | 6,925 (100.0%) |
Families and Households in Willow Grove
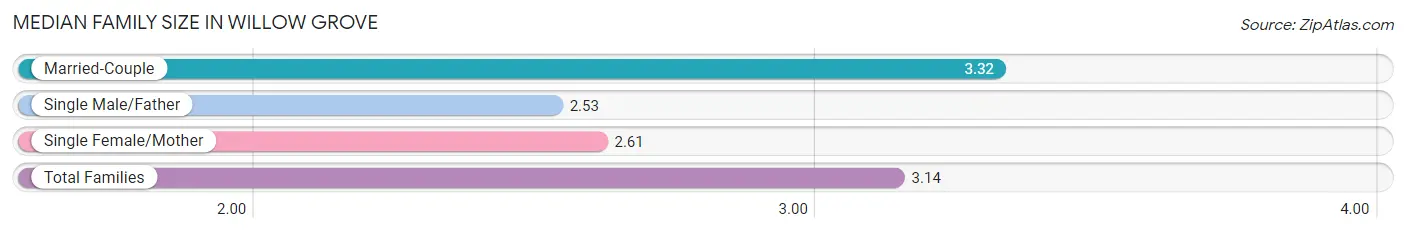
Median Family Size in Willow Grove
The median family size in Willow Grove is 3.14 persons per family, with married-couple families (2,683 | 74.9%) accounting for the largest median family size of 3.32 persons per family. On the other hand, single male/father families (258 | 7.2%) represent the smallest median family size with 2.53 persons per family.
| Family Type | # Families | Family Size |
| Married-Couple | 2,683 (74.9%) | 3.32 |
| Single Male/Father | 258 (7.2%) | 2.53 |
| Single Female/Mother | 641 (17.9%) | 2.61 |
| Total Families | 3,582 (100.0%) | 3.14 |
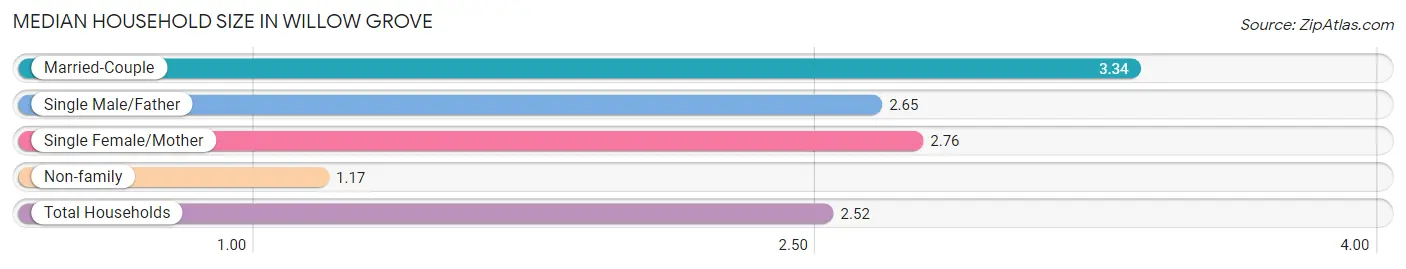
Median Household Size in Willow Grove
The median household size in Willow Grove is 2.52 persons per household, with married-couple households (2,683 | 50.0%) accounting for the largest median household size of 3.34 persons per household. non-family households (1,779 | 33.2%) represent the smallest median household size with 1.17 persons per household.
| Household Type | # Households | Household Size |
| Married-Couple | 2,683 (50.0%) | 3.34 |
| Single Male/Father | 258 (4.8%) | 2.65 |
| Single Female/Mother | 641 (12.0%) | 2.76 |
| Non-family | 1,779 (33.2%) | 1.17 |
| Total Households | 5,361 (100.0%) | 2.52 |
Household Size by Marriage Status in Willow Grove
Out of a total of 5,361 households in Willow Grove, 3,582 (66.8%) are family households, while 1,779 (33.2%) are nonfamily households. The most numerous type of family households are 2-person households, comprising 1,328, and the most common type of nonfamily households are 1-person households, comprising 1,524.
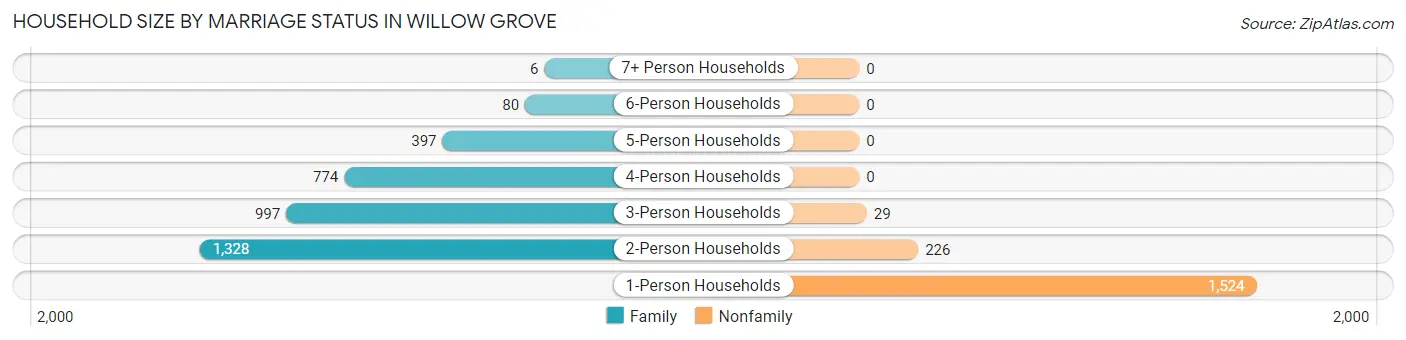
| Household Size | Family Households | Nonfamily Households |
| 1-Person Households | - | 1,524 (28.4%) |
| 2-Person Households | 1,328 (24.8%) | 226 (4.2%) |
| 3-Person Households | 997 (18.6%) | 29 (0.5%) |
| 4-Person Households | 774 (14.4%) | 0 (0.0%) |
| 5-Person Households | 397 (7.4%) | 0 (0.0%) |
| 6-Person Households | 80 (1.5%) | 0 (0.0%) |
| 7+ Person Households | 6 (0.1%) | 0 (0.0%) |
| Total | 3,582 (66.8%) | 1,779 (33.2%) |
Female Fertility in Willow Grove
Fertility by Age in Willow Grove
Average fertility rate in Willow Grove is 36.0 births per 1,000 women. Women in the age bracket of 20 to 34 years have the highest fertility rate with 74.0 births per 1,000 women. Women in the age bracket of 20 to 34 years acount for 92.1% of all women with births.
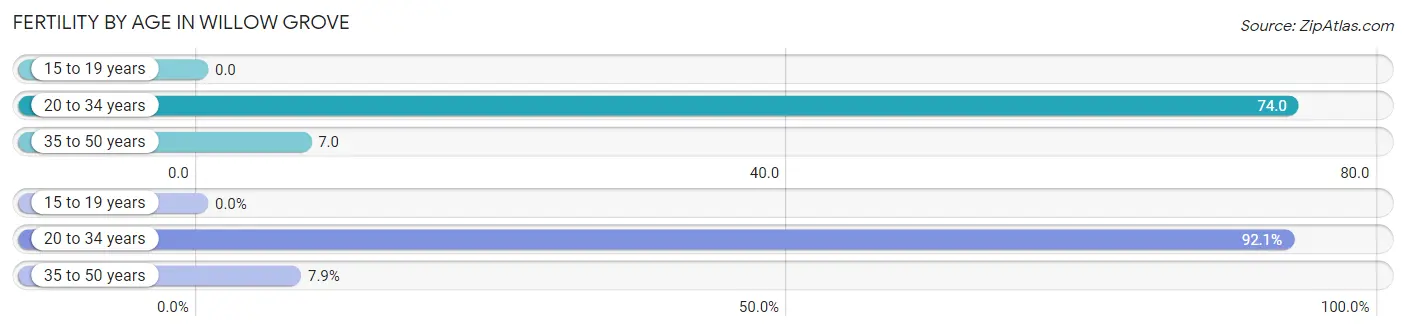
| Age Bracket | Women with Births | Births / 1,000 Women |
| 15 to 19 years | 0 (0.0%) | 0.0 |
| 20 to 34 years | 105 (92.1%) | 74.0 |
| 35 to 50 years | 9 (7.9%) | 7.0 |
| Total | 114 (100.0%) | 36.0 |
Fertility by Age by Marriage Status in Willow Grove
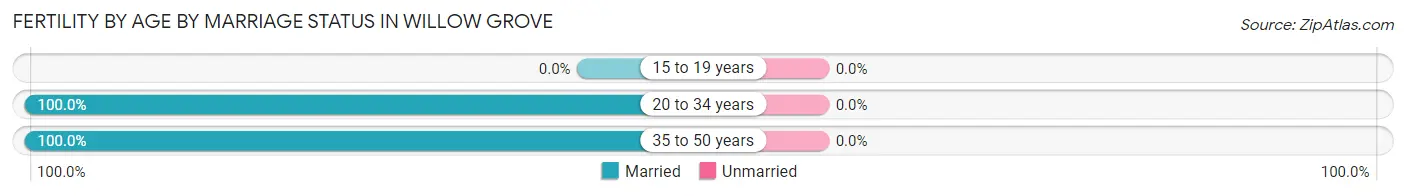
| Age Bracket | Married | Unmarried |
| 15 to 19 years | 0 (0.0%) | 0 (0.0%) |
| 20 to 34 years | 105 (100.0%) | 0 (0.0%) |
| 35 to 50 years | 9 (100.0%) | 0 (0.0%) |
| Total | 114 (100.0%) | 0 (0.0%) |
Fertility by Education in Willow Grove
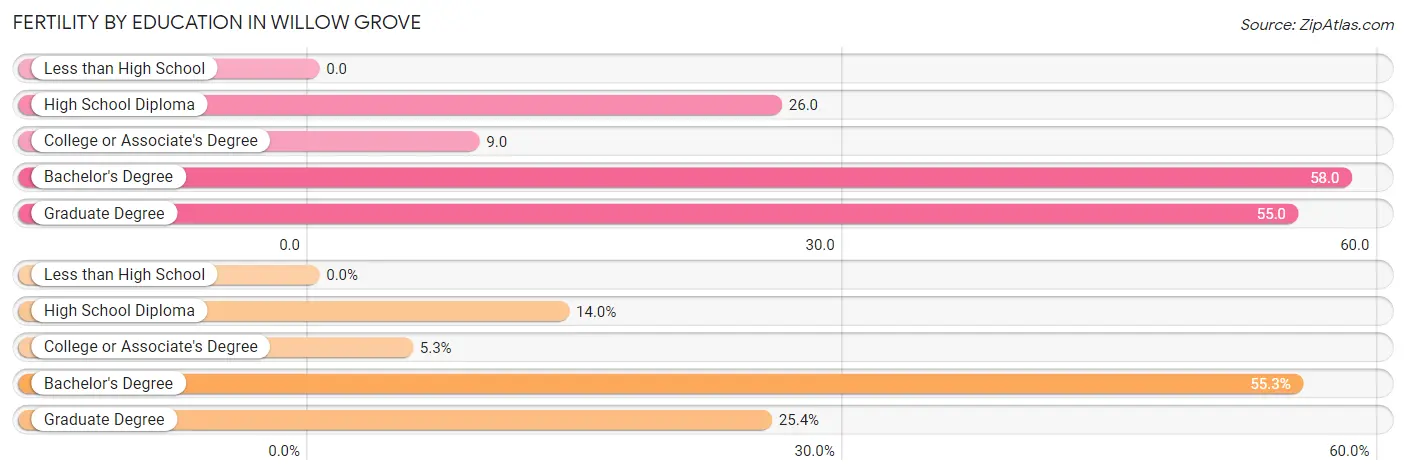
| Educational Attainment | Women with Births | Births / 1,000 Women |
| Less than High School | 0 (0.0%) | 0.0 |
| High School Diploma | 16 (14.0%) | 26.0 |
| College or Associate's Degree | 6 (5.3%) | 9.0 |
| Bachelor's Degree | 63 (55.3%) | 58.0 |
| Graduate Degree | 29 (25.4%) | 55.0 |
| Total | 114 (100.0%) | 36.0 |
Fertility by Education by Marriage Status in Willow Grove
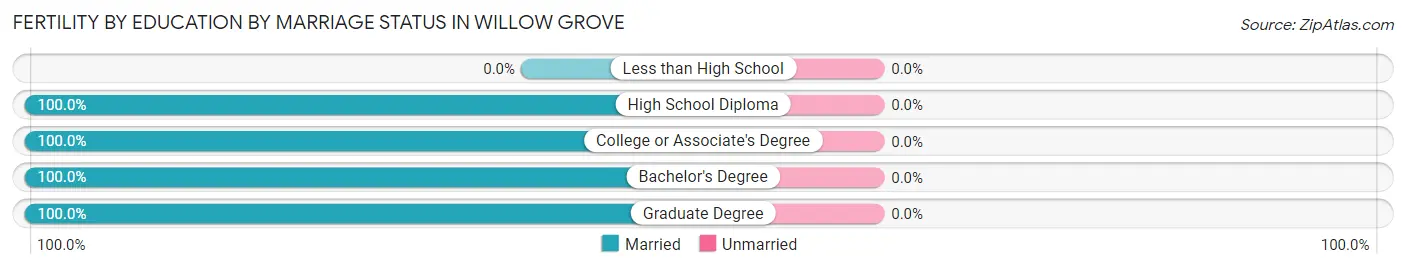
| Educational Attainment | Married | Unmarried |
| Less than High School | 0 (0.0%) | 0 (0.0%) |
| High School Diploma | 16 (100.0%) | 0 (0.0%) |
| College or Associate's Degree | 6 (100.0%) | 0 (0.0%) |
| Bachelor's Degree | 63 (100.0%) | 0 (0.0%) |
| Graduate Degree | 29 (100.0%) | 0 (0.0%) |
| Total | 114 (100.0%) | 0 (0.0%) |
Employment Characteristics in Willow Grove
Employment by Class of Employer in Willow Grove
Among the 7,272 employed individuals in Willow Grove, private company employees (5,128 | 70.5%), not-for-profit organizations (813 | 11.2%), and local government employees (566 | 7.8%) make up the most common classes of employment.
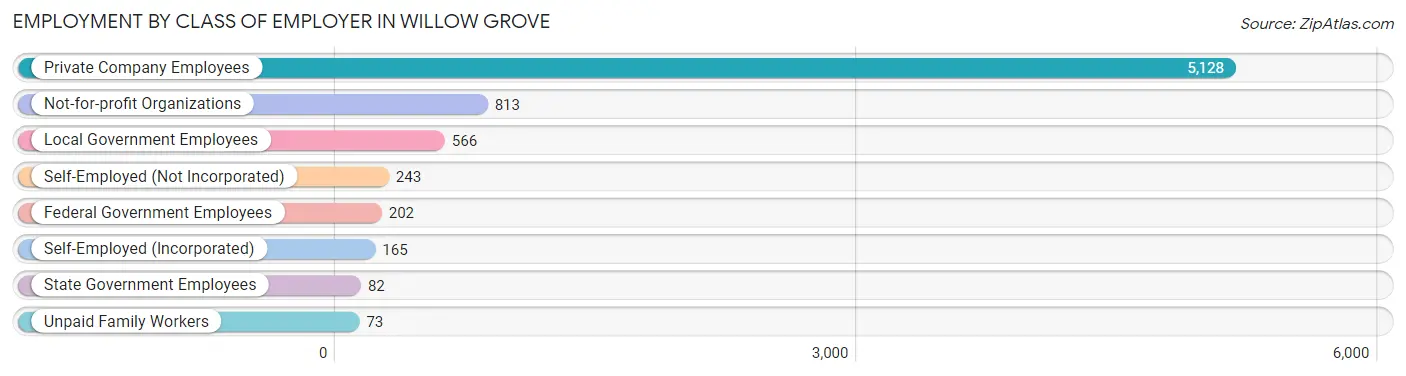
| Employer Class | # Employees | % Employees |
| Private Company Employees | 5,128 | 70.5% |
| Self-Employed (Incorporated) | 165 | 2.3% |
| Self-Employed (Not Incorporated) | 243 | 3.3% |
| Not-for-profit Organizations | 813 | 11.2% |
| Local Government Employees | 566 | 7.8% |
| State Government Employees | 82 | 1.1% |
| Federal Government Employees | 202 | 2.8% |
| Unpaid Family Workers | 73 | 1.0% |
| Total | 7,272 | 100.0% |
Employment Status by Age in Willow Grove
According to the labor force statistics for Willow Grove, out of the total population over 16 years of age (11,057), 69.7% or 7,707 individuals are in the labor force, with 2.6% or 200 of them unemployed. The age group with the highest labor force participation rate is 35 to 44 years, with 92.2% or 1,507 individuals in the labor force. Within the labor force, the 16 to 19 years age range has the highest percentage of unemployed individuals, with 8.1% or 25 of them being unemployed.
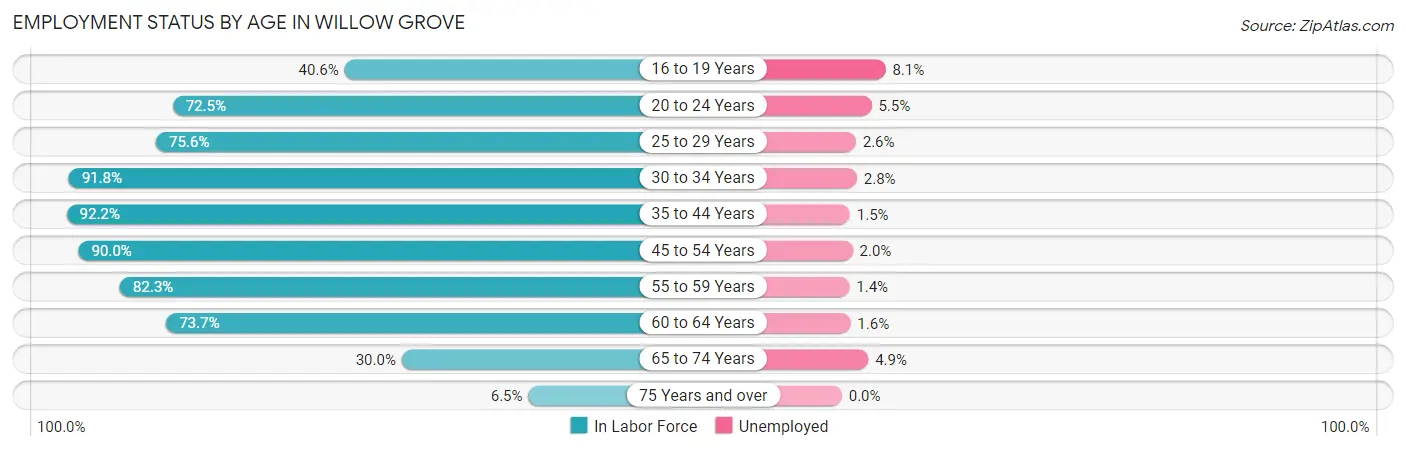
| Age Bracket | In Labor Force | Unemployed |
| 16 to 19 Years | 308 (40.6%) | 25 (8.1%) |
| 20 to 24 Years | 546 (72.5%) | 30 (5.5%) |
| 25 to 29 Years | 798 (75.6%) | 21 (2.6%) |
| 30 to 34 Years | 968 (91.8%) | 27 (2.8%) |
| 35 to 44 Years | 1,507 (92.2%) | 23 (1.5%) |
| 45 to 54 Years | 1,768 (90.0%) | 35 (2.0%) |
| 55 to 59 Years | 810 (82.3%) | 11 (1.4%) |
| 60 to 64 Years | 574 (73.7%) | 9 (1.6%) |
| 65 to 74 Years | 371 (30.0%) | 18 (4.9%) |
| 75 Years and over | 54 (6.5%) | 0 (0.0%) |
| Total | 7,707 (69.7%) | 200 (2.6%) |
Employment Status by Educational Attainment in Willow Grove
According to labor force statistics for Willow Grove, 86.0% of individuals (6,427) out of the total population between 25 and 64 years of age (7,473) are in the labor force, with 2.0% or 129 of them being unemployed. The group with the highest labor force participation rate are those with the educational attainment of bachelor's degree or higher, with 94.2% or 3,225 individuals in the labor force. Within the labor force, individuals with college / associate degree education have the highest percentage of unemployment, with 2.4% or 43 of them being unemployed.
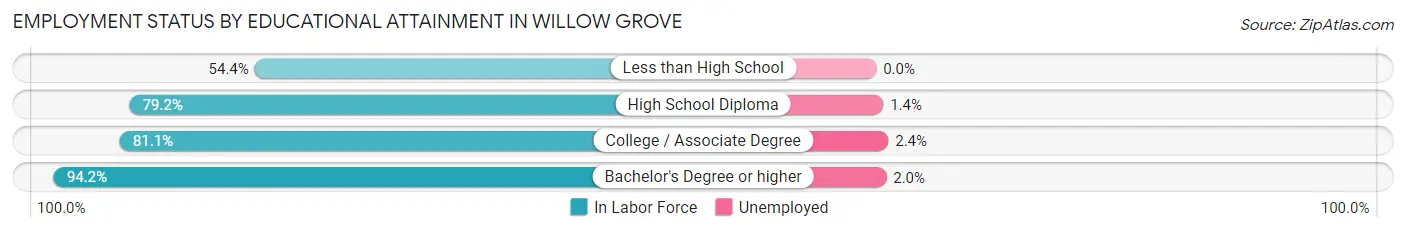
| Educational Attainment | In Labor Force | Unemployed |
| Less than High School | 105 (54.4%) | 0 (0.0%) |
| High School Diploma | 1,296 (79.2%) | 23 (1.4%) |
| College / Associate Degree | 1,800 (81.1%) | 53 (2.4%) |
| Bachelor's Degree or higher | 3,225 (94.2%) | 68 (2.0%) |
| Total | 6,427 (86.0%) | 149 (2.0%) |
Employment Occupations by Sex in Willow Grove
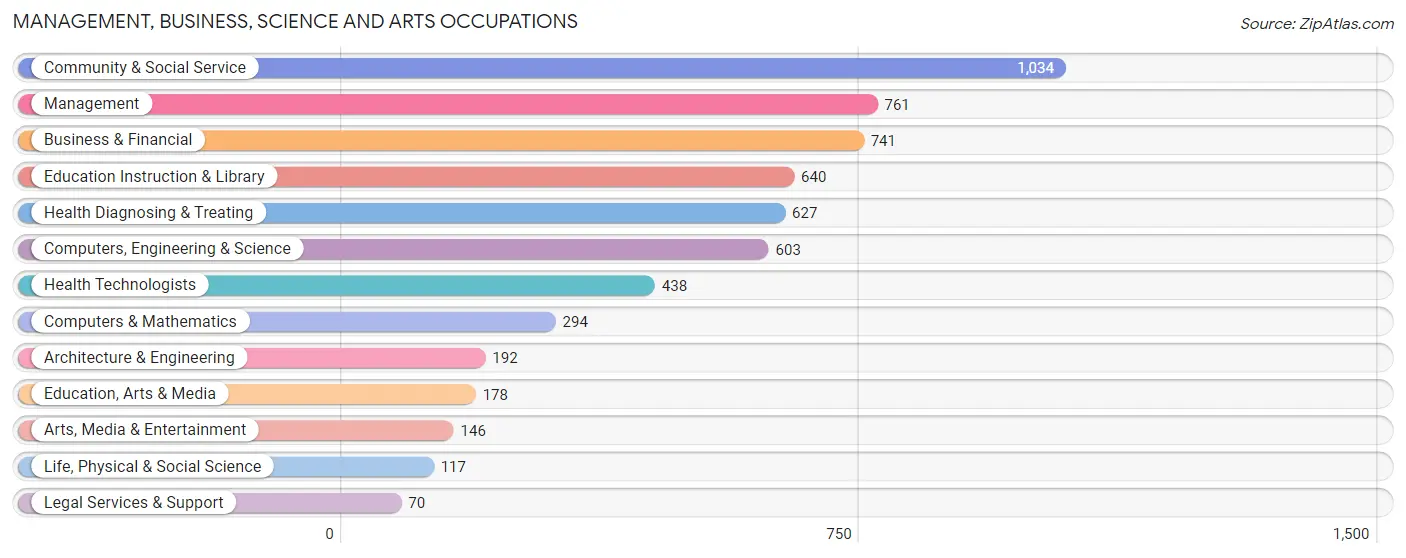
Management, Business, Science and Arts Occupations
The most common Management, Business, Science and Arts occupations in Willow Grove are Community & Social Service (1,034 | 13.8%), Management (761 | 10.2%), Business & Financial (741 | 9.9%), Education Instruction & Library (640 | 8.5%), and Health Diagnosing & Treating (627 | 8.4%).
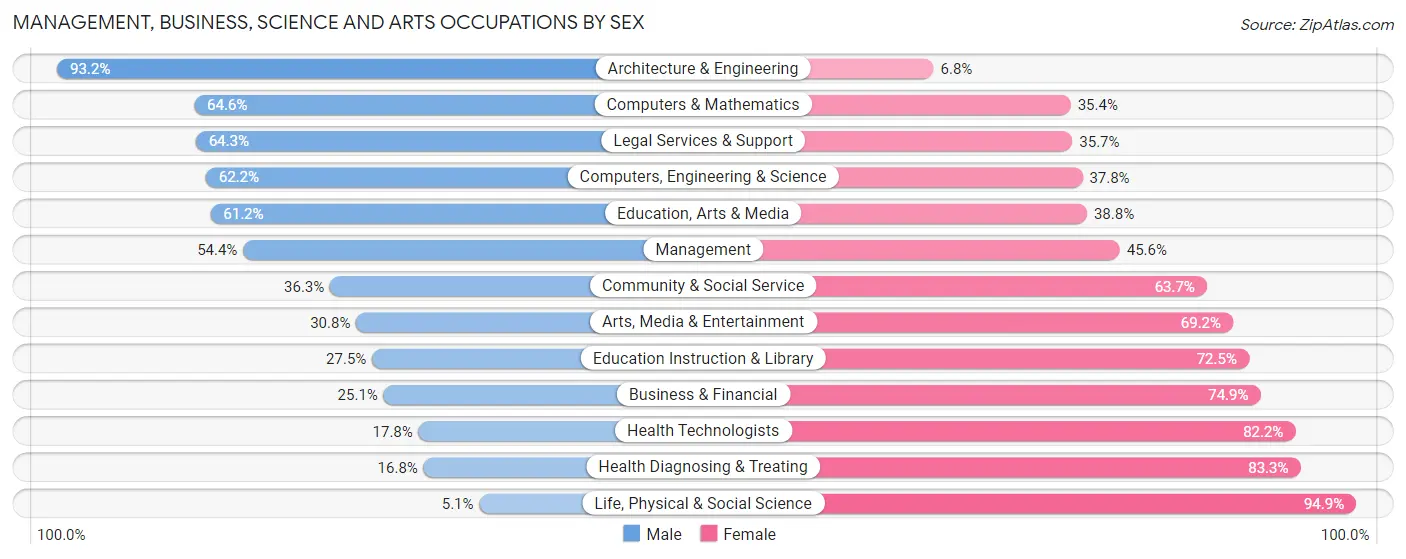
Management, Business, Science and Arts Occupations by Sex
Within the Management, Business, Science and Arts occupations in Willow Grove, the most male-oriented occupations are Architecture & Engineering (93.2%), Computers & Mathematics (64.6%), and Legal Services & Support (64.3%), while the most female-oriented occupations are Life, Physical & Social Science (94.9%), Health Diagnosing & Treating (83.3%), and Health Technologists (82.2%).
| Occupation | Male | Female |
| Management | 414 (54.4%) | 347 (45.6%) |
| Business & Financial | 186 (25.1%) | 555 (74.9%) |
| Computers, Engineering & Science | 375 (62.2%) | 228 (37.8%) |
| Computers & Mathematics | 190 (64.6%) | 104 (35.4%) |
| Architecture & Engineering | 179 (93.2%) | 13 (6.8%) |
| Life, Physical & Social Science | 6 (5.1%) | 111 (94.9%) |
| Community & Social Service | 375 (36.3%) | 659 (63.7%) |
| Education, Arts & Media | 109 (61.2%) | 69 (38.8%) |
| Legal Services & Support | 45 (64.3%) | 25 (35.7%) |
| Education Instruction & Library | 176 (27.5%) | 464 (72.5%) |
| Arts, Media & Entertainment | 45 (30.8%) | 101 (69.2%) |
| Health Diagnosing & Treating | 105 (16.8%) | 522 (83.3%) |
| Health Technologists | 78 (17.8%) | 360 (82.2%) |
| Total (Category) | 1,455 (38.6%) | 2,311 (61.4%) |
| Total (Overall) | 3,771 (50.3%) | 3,727 (49.7%) |
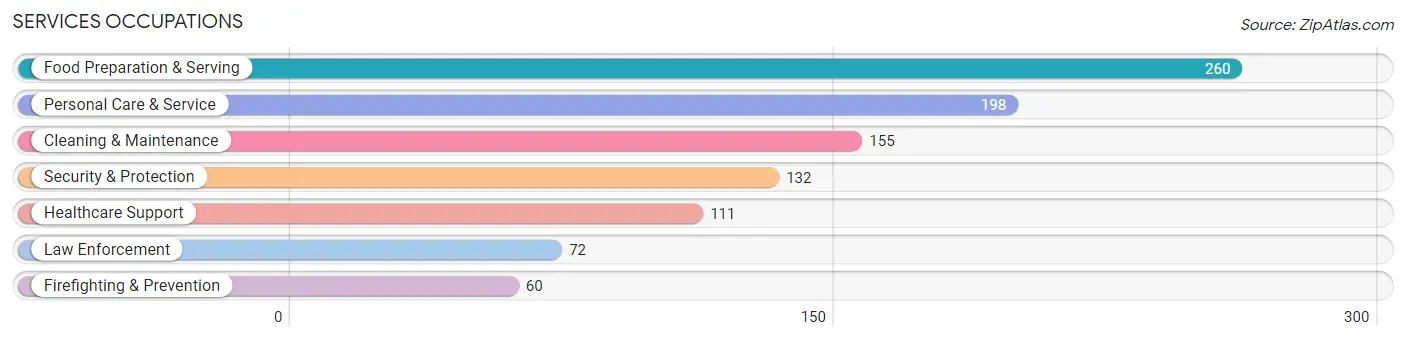
Services Occupations
The most common Services occupations in Willow Grove are Food Preparation & Serving (260 | 3.5%), Personal Care & Service (198 | 2.6%), Cleaning & Maintenance (155 | 2.1%), Security & Protection (132 | 1.8%), and Healthcare Support (111 | 1.5%).
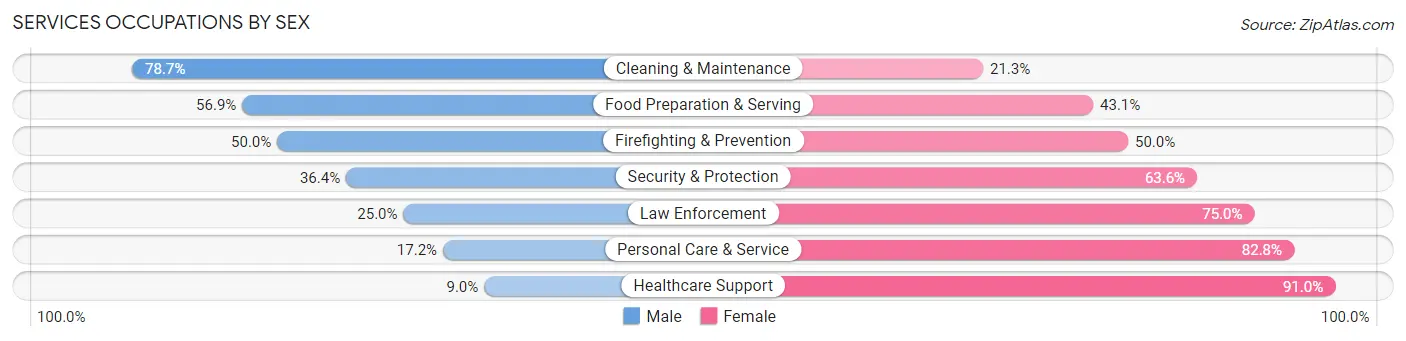
Services Occupations by Sex
Within the Services occupations in Willow Grove, the most male-oriented occupations are Cleaning & Maintenance (78.7%), Food Preparation & Serving (56.9%), and Firefighting & Prevention (50.0%), while the most female-oriented occupations are Healthcare Support (91.0%), Personal Care & Service (82.8%), and Law Enforcement (75.0%).
| Occupation | Male | Female |
| Healthcare Support | 10 (9.0%) | 101 (91.0%) |
| Security & Protection | 48 (36.4%) | 84 (63.6%) |
| Firefighting & Prevention | 30 (50.0%) | 30 (50.0%) |
| Law Enforcement | 18 (25.0%) | 54 (75.0%) |
| Food Preparation & Serving | 148 (56.9%) | 112 (43.1%) |
| Cleaning & Maintenance | 122 (78.7%) | 33 (21.3%) |
| Personal Care & Service | 34 (17.2%) | 164 (82.8%) |
| Total (Category) | 362 (42.3%) | 494 (57.7%) |
| Total (Overall) | 3,771 (50.3%) | 3,727 (49.7%) |
Sales and Office Occupations
The most common Sales and Office occupations in Willow Grove are Sales & Related (773 | 10.3%), and Office & Administration (755 | 10.1%).

Sales and Office Occupations by Sex

| Occupation | Male | Female |
| Sales & Related | 491 (63.5%) | 282 (36.5%) |
| Office & Administration | 284 (37.6%) | 471 (62.4%) |
| Total (Category) | 775 (50.7%) | 753 (49.3%) |
| Total (Overall) | 3,771 (50.3%) | 3,727 (49.7%) |
Natural Resources, Construction and Maintenance Occupations
The most common Natural Resources, Construction and Maintenance occupations in Willow Grove are Construction & Extraction (323 | 4.3%), Installation, Maintenance & Repair (251 | 3.4%), and Farming, Fishing & Forestry (18 | 0.2%).

Natural Resources, Construction and Maintenance Occupations by Sex
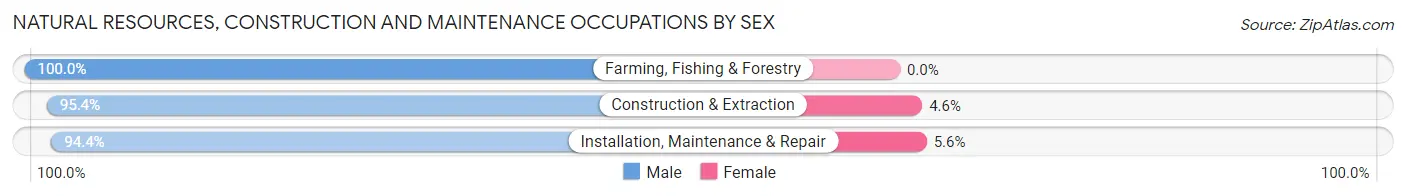
| Occupation | Male | Female |
| Farming, Fishing & Forestry | 18 (100.0%) | 0 (0.0%) |
| Construction & Extraction | 308 (95.4%) | 15 (4.6%) |
| Installation, Maintenance & Repair | 237 (94.4%) | 14 (5.6%) |
| Total (Category) | 563 (95.1%) | 29 (4.9%) |
| Total (Overall) | 3,771 (50.3%) | 3,727 (49.7%) |
Production, Transportation and Moving Occupations
The most common Production, Transportation and Moving occupations in Willow Grove are Production (311 | 4.2%), Transportation (238 | 3.2%), and Material Moving (207 | 2.8%).
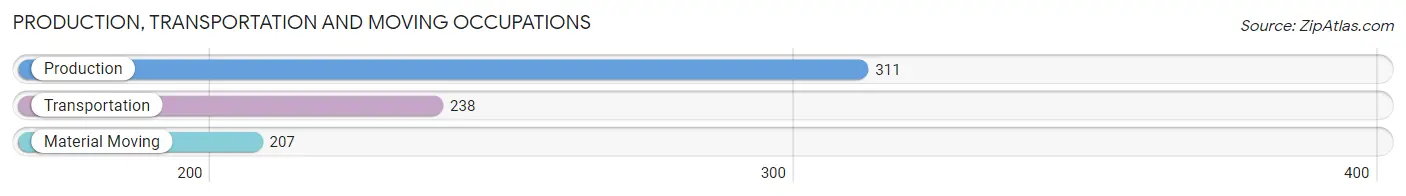
Production, Transportation and Moving Occupations by Sex
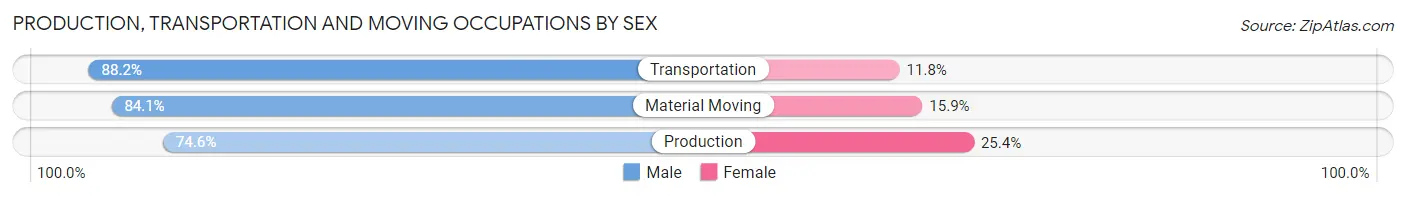
| Occupation | Male | Female |
| Production | 232 (74.6%) | 79 (25.4%) |
| Transportation | 210 (88.2%) | 28 (11.8%) |
| Material Moving | 174 (84.1%) | 33 (15.9%) |
| Total (Category) | 616 (81.5%) | 140 (18.5%) |
| Total (Overall) | 3,771 (50.3%) | 3,727 (49.7%) |
Employment Industries by Sex in Willow Grove
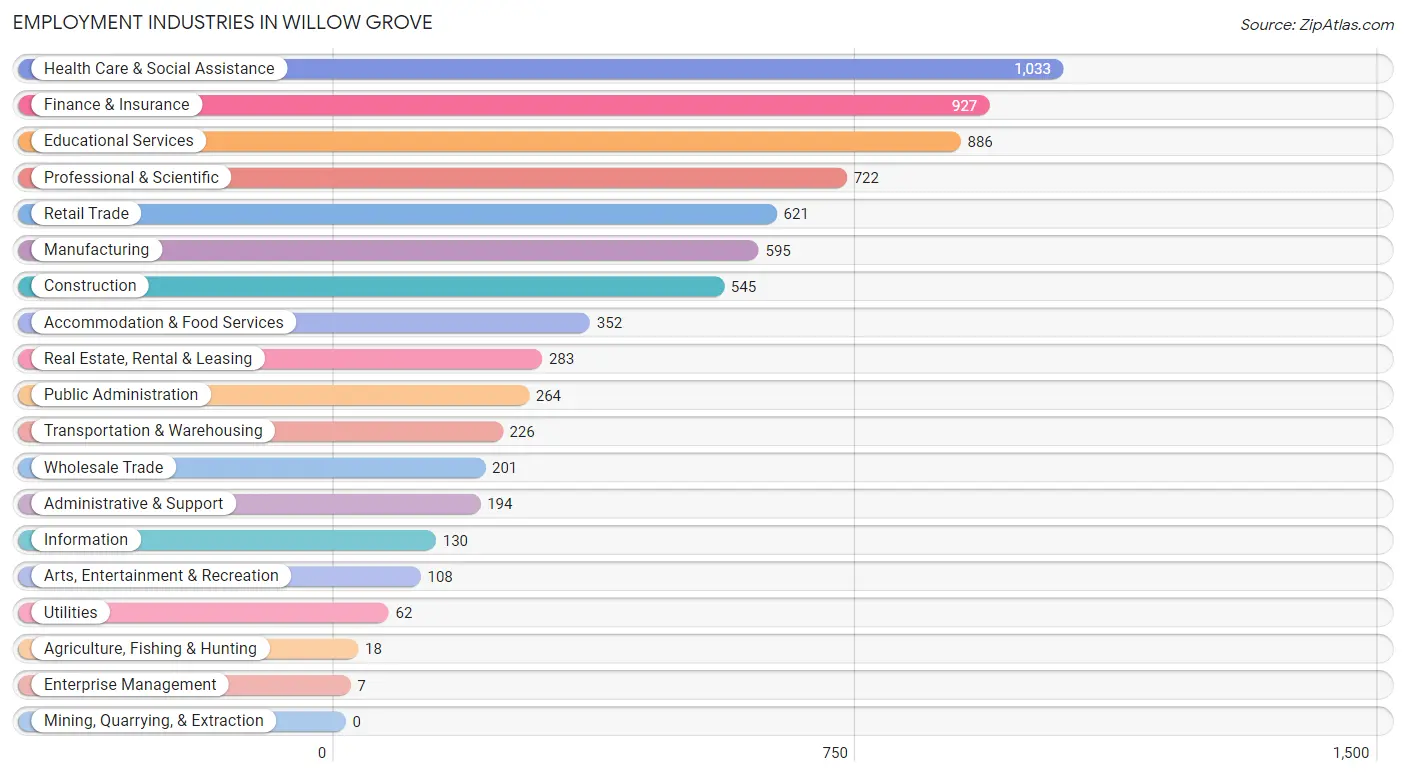
Employment Industries in Willow Grove
The major employment industries in Willow Grove include Health Care & Social Assistance (1,033 | 13.8%), Finance & Insurance (927 | 12.4%), Educational Services (886 | 11.8%), Professional & Scientific (722 | 9.6%), and Retail Trade (621 | 8.3%).
Employment Industries by Sex in Willow Grove
The Willow Grove industries that see more men than women are Agriculture, Fishing & Hunting (100.0%), Utilities (100.0%), and Enterprise Management (100.0%), whereas the industries that tend to have a higher number of women are Educational Services (73.6%), Health Care & Social Assistance (71.7%), and Finance & Insurance (59.8%).
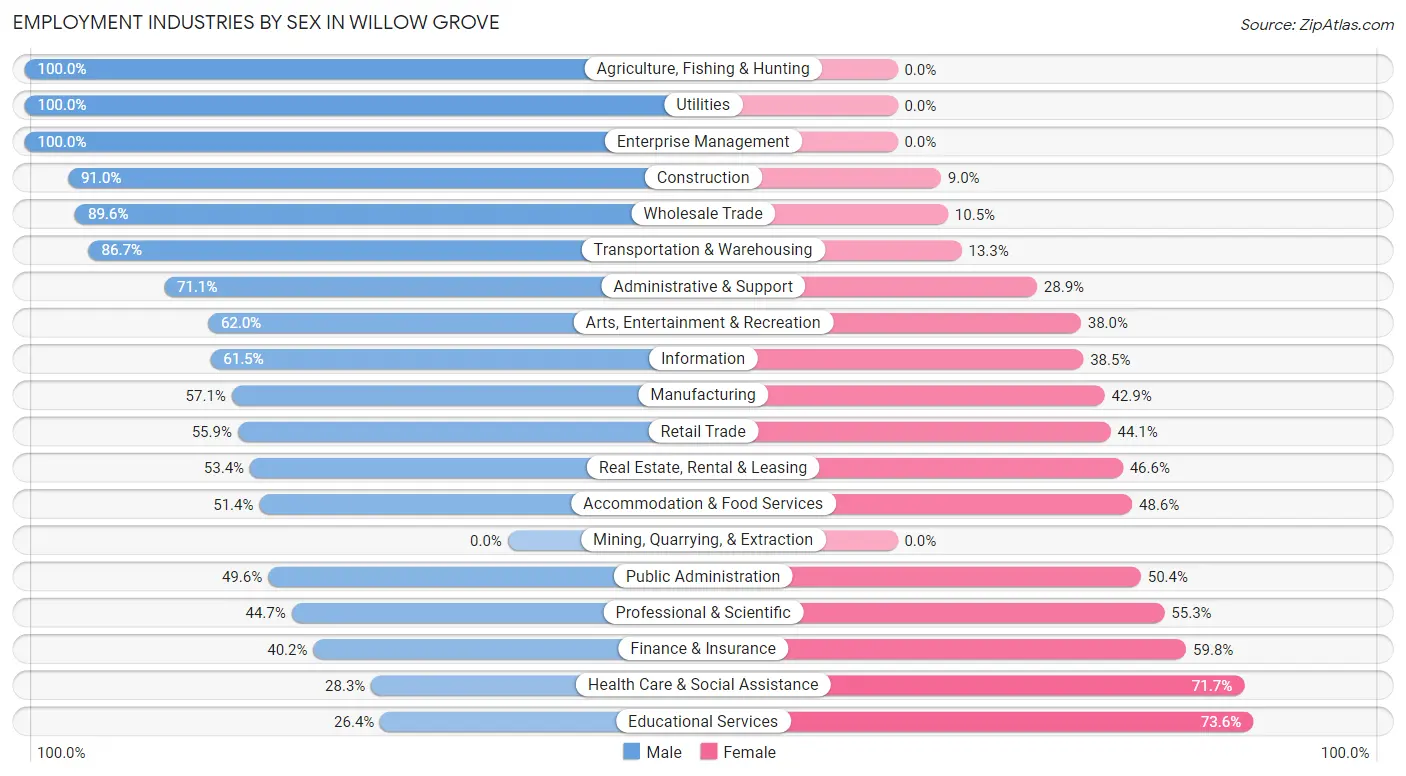
| Industry | Male | Female |
| Agriculture, Fishing & Hunting | 18 (100.0%) | 0 (0.0%) |
| Mining, Quarrying, & Extraction | 0 (0.0%) | 0 (0.0%) |
| Construction | 496 (91.0%) | 49 (9.0%) |
| Manufacturing | 340 (57.1%) | 255 (42.9%) |
| Wholesale Trade | 180 (89.5%) | 21 (10.4%) |
| Retail Trade | 347 (55.9%) | 274 (44.1%) |
| Transportation & Warehousing | 196 (86.7%) | 30 (13.3%) |
| Utilities | 62 (100.0%) | 0 (0.0%) |
| Information | 80 (61.5%) | 50 (38.5%) |
| Finance & Insurance | 373 (40.2%) | 554 (59.8%) |
| Real Estate, Rental & Leasing | 151 (53.4%) | 132 (46.6%) |
| Professional & Scientific | 323 (44.7%) | 399 (55.3%) |
| Enterprise Management | 7 (100.0%) | 0 (0.0%) |
| Administrative & Support | 138 (71.1%) | 56 (28.9%) |
| Educational Services | 234 (26.4%) | 652 (73.6%) |
| Health Care & Social Assistance | 292 (28.3%) | 741 (71.7%) |
| Arts, Entertainment & Recreation | 67 (62.0%) | 41 (38.0%) |
| Accommodation & Food Services | 181 (51.4%) | 171 (48.6%) |
| Public Administration | 131 (49.6%) | 133 (50.4%) |
| Total | 3,771 (50.3%) | 3,727 (49.7%) |
Education in Willow Grove
School Enrollment in Willow Grove
The most common levels of schooling among the 3,290 students in Willow Grove are high school (971 | 29.5%), middle school (724 | 22.0%), and college / undergraduate (514 | 15.6%).
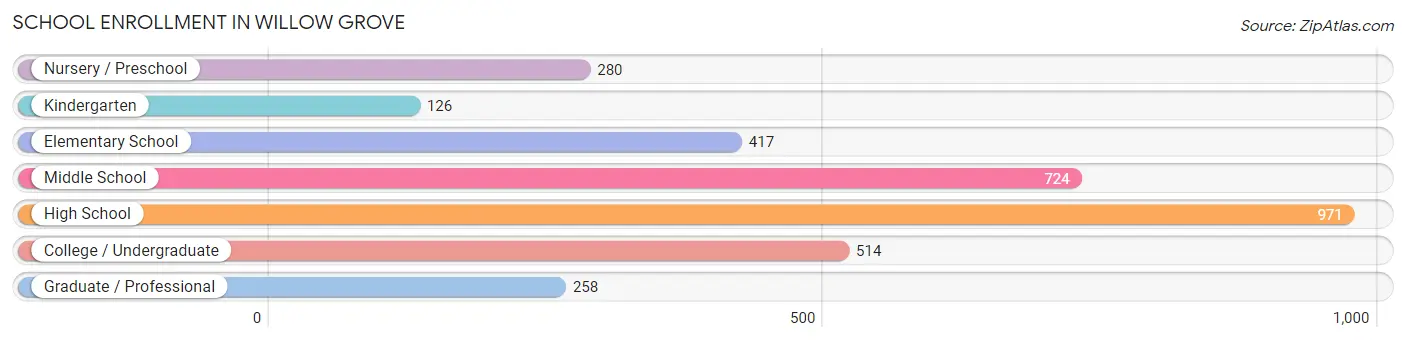
| School Level | # Students | % Students |
| Nursery / Preschool | 280 | 8.5% |
| Kindergarten | 126 | 3.8% |
| Elementary School | 417 | 12.7% |
| Middle School | 724 | 22.0% |
| High School | 971 | 29.5% |
| College / Undergraduate | 514 | 15.6% |
| Graduate / Professional | 258 | 7.8% |
| Total | 3,290 | 100.0% |
School Enrollment by Age by Funding Source in Willow Grove
Out of a total of 3,290 students who are enrolled in schools in Willow Grove, 924 (28.1%) attend a private institution, while the remaining 2,366 (71.9%) are enrolled in public schools. The age group of 3 to 4 year olds has the highest likelihood of being enrolled in private schools, with 194 (74.9% in the age bracket) enrolled. Conversely, the age group of 5 to 9 year old has the lowest likelihood of being enrolled in a private school, with 456 (86.7% in the age bracket) attending a public institution.
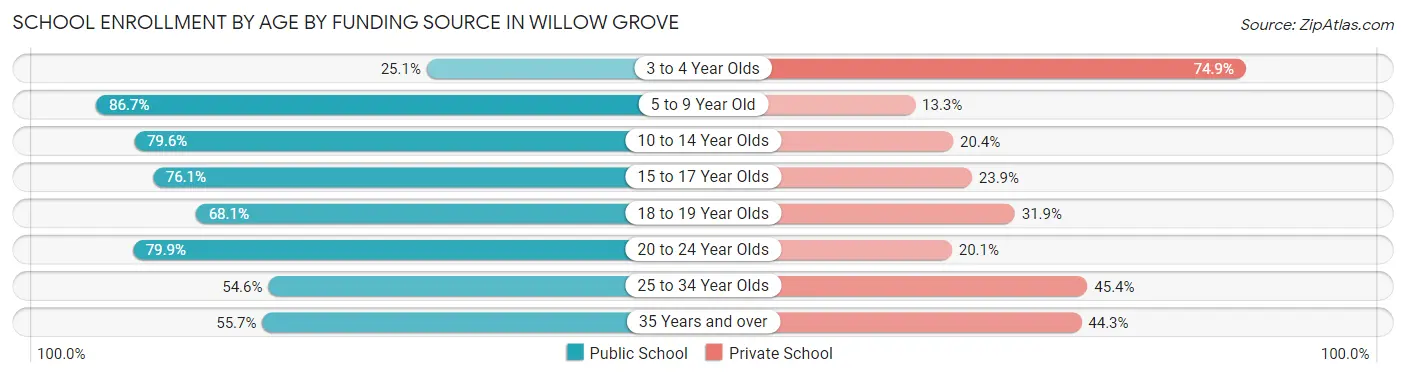
| Age Bracket | Public School | Private School |
| 3 to 4 Year Olds | 65 (25.1%) | 194 (74.9%) |
| 5 to 9 Year Old | 456 (86.7%) | 70 (13.3%) |
| 10 to 14 Year Olds | 766 (79.6%) | 196 (20.4%) |
| 15 to 17 Year Olds | 424 (76.1%) | 133 (23.9%) |
| 18 to 19 Year Olds | 203 (68.1%) | 95 (31.9%) |
| 20 to 24 Year Olds | 226 (79.9%) | 57 (20.1%) |
| 25 to 34 Year Olds | 83 (54.6%) | 69 (45.4%) |
| 35 Years and over | 141 (55.7%) | 112 (44.3%) |
| Total | 2,366 (71.9%) | 924 (28.1%) |
Educational Attainment by Field of Study in Willow Grove
Business (958 | 22.7%), education (578 | 13.7%), science & technology (553 | 13.1%), bio, nature & agricultural (340 | 8.1%), and literature & languages (277 | 6.6%) are the most common fields of study among 4,224 individuals in Willow Grove who have obtained a bachelor's degree or higher.
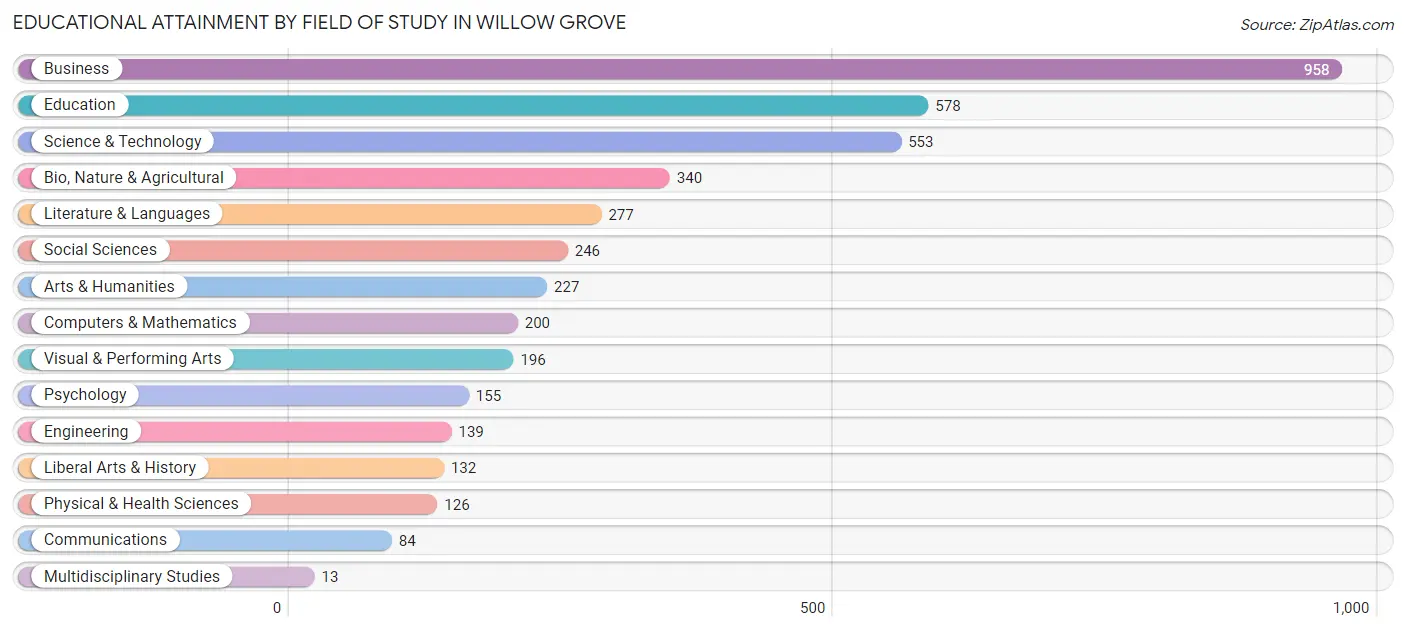
| Field of Study | # Graduates | % Graduates |
| Computers & Mathematics | 200 | 4.7% |
| Bio, Nature & Agricultural | 340 | 8.1% |
| Physical & Health Sciences | 126 | 3.0% |
| Psychology | 155 | 3.7% |
| Social Sciences | 246 | 5.8% |
| Engineering | 139 | 3.3% |
| Multidisciplinary Studies | 13 | 0.3% |
| Science & Technology | 553 | 13.1% |
| Business | 958 | 22.7% |
| Education | 578 | 13.7% |
| Literature & Languages | 277 | 6.6% |
| Liberal Arts & History | 132 | 3.1% |
| Visual & Performing Arts | 196 | 4.6% |
| Communications | 84 | 2.0% |
| Arts & Humanities | 227 | 5.4% |
| Total | 4,224 | 100.0% |
Transportation & Commute in Willow Grove
Vehicle Availability by Sex in Willow Grove
The most prevalent vehicle ownership categories in Willow Grove are males with 2 vehicles (1,819, accounting for 48.6%) and females with 2 vehicles (1,843, making up 51.8%).
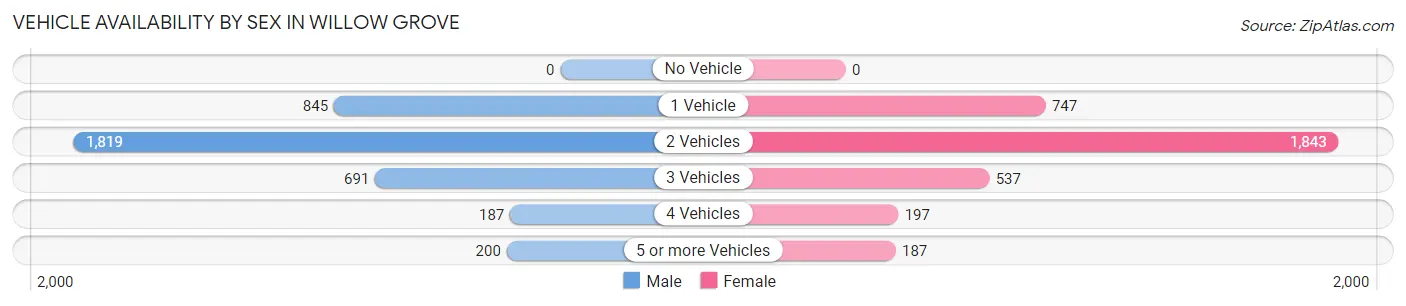
| Vehicles Available | Male | Female |
| No Vehicle | 0 (0.0%) | 0 (0.0%) |
| 1 Vehicle | 845 (22.6%) | 747 (21.3%) |
| 2 Vehicles | 1,819 (48.6%) | 1,843 (52.5%) |
| 3 Vehicles | 691 (18.5%) | 537 (15.3%) |
| 4 Vehicles | 187 (5.0%) | 197 (5.6%) |
| 5 or more Vehicles | 200 (5.3%) | 187 (5.3%) |
| Total | 3,742 (100.0%) | 3,511 (100.0%) |
Commute Time in Willow Grove
The most frequently occuring commute durations in Willow Grove are 15 to 19 minutes (906 commuters, 15.2%), 10 to 14 minutes (852 commuters, 14.3%), and 45 to 59 minutes (740 commuters, 12.4%).
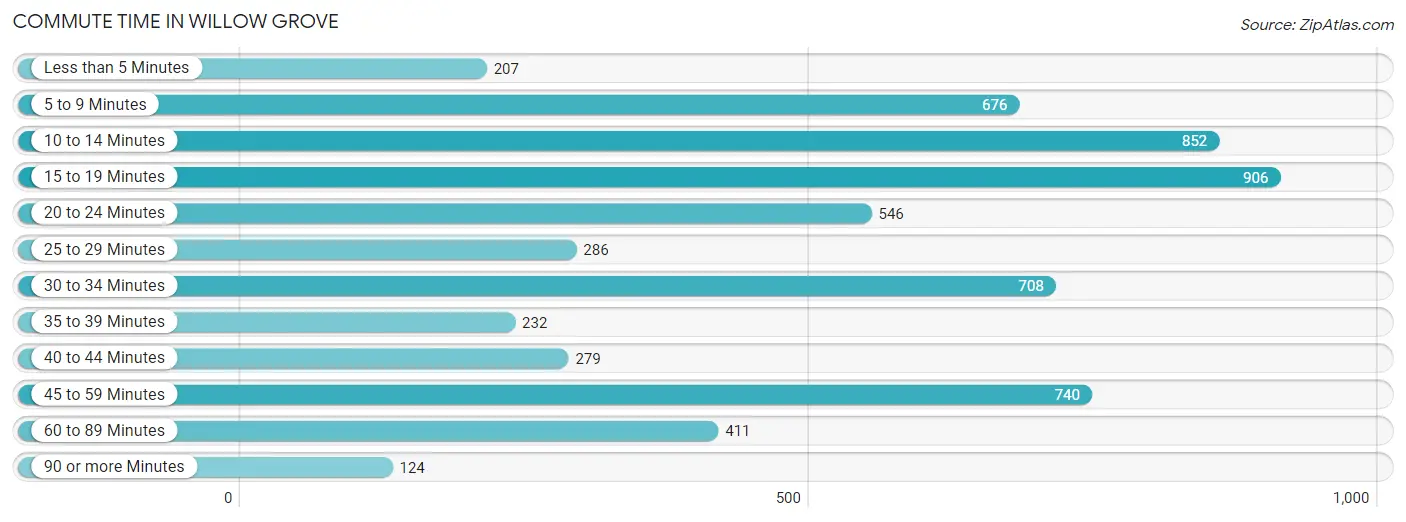
| Commute Time | # Commuters | % Commuters |
| Less than 5 Minutes | 207 | 3.5% |
| 5 to 9 Minutes | 676 | 11.3% |
| 10 to 14 Minutes | 852 | 14.3% |
| 15 to 19 Minutes | 906 | 15.2% |
| 20 to 24 Minutes | 546 | 9.1% |
| 25 to 29 Minutes | 286 | 4.8% |
| 30 to 34 Minutes | 708 | 11.9% |
| 35 to 39 Minutes | 232 | 3.9% |
| 40 to 44 Minutes | 279 | 4.7% |
| 45 to 59 Minutes | 740 | 12.4% |
| 60 to 89 Minutes | 411 | 6.9% |
| 90 or more Minutes | 124 | 2.1% |
Commute Time by Sex in Willow Grove
The most common commute times in Willow Grove are 15 to 19 minutes (523 commuters, 16.6%) for males and 10 to 14 minutes (486 commuters, 17.3%) for females.
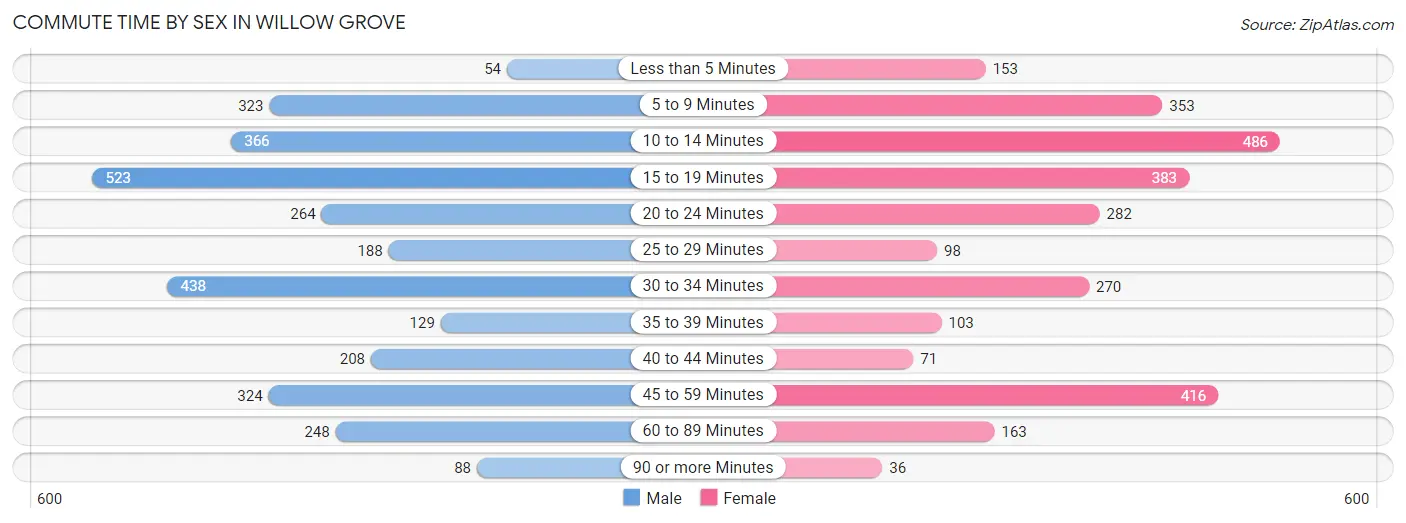
| Commute Time | Male | Female |
| Less than 5 Minutes | 54 (1.7%) | 153 (5.4%) |
| 5 to 9 Minutes | 323 (10.2%) | 353 (12.5%) |
| 10 to 14 Minutes | 366 (11.6%) | 486 (17.3%) |
| 15 to 19 Minutes | 523 (16.6%) | 383 (13.6%) |
| 20 to 24 Minutes | 264 (8.4%) | 282 (10.0%) |
| 25 to 29 Minutes | 188 (6.0%) | 98 (3.5%) |
| 30 to 34 Minutes | 438 (13.9%) | 270 (9.6%) |
| 35 to 39 Minutes | 129 (4.1%) | 103 (3.7%) |
| 40 to 44 Minutes | 208 (6.6%) | 71 (2.5%) |
| 45 to 59 Minutes | 324 (10.3%) | 416 (14.8%) |
| 60 to 89 Minutes | 248 (7.9%) | 163 (5.8%) |
| 90 or more Minutes | 88 (2.8%) | 36 (1.3%) |
Time of Departure to Work by Sex in Willow Grove
The most frequent times of departure to work in Willow Grove are 7:00 AM to 7:29 AM (521, 16.5%) for males and 8:00 AM to 8:29 AM (553, 19.7%) for females.
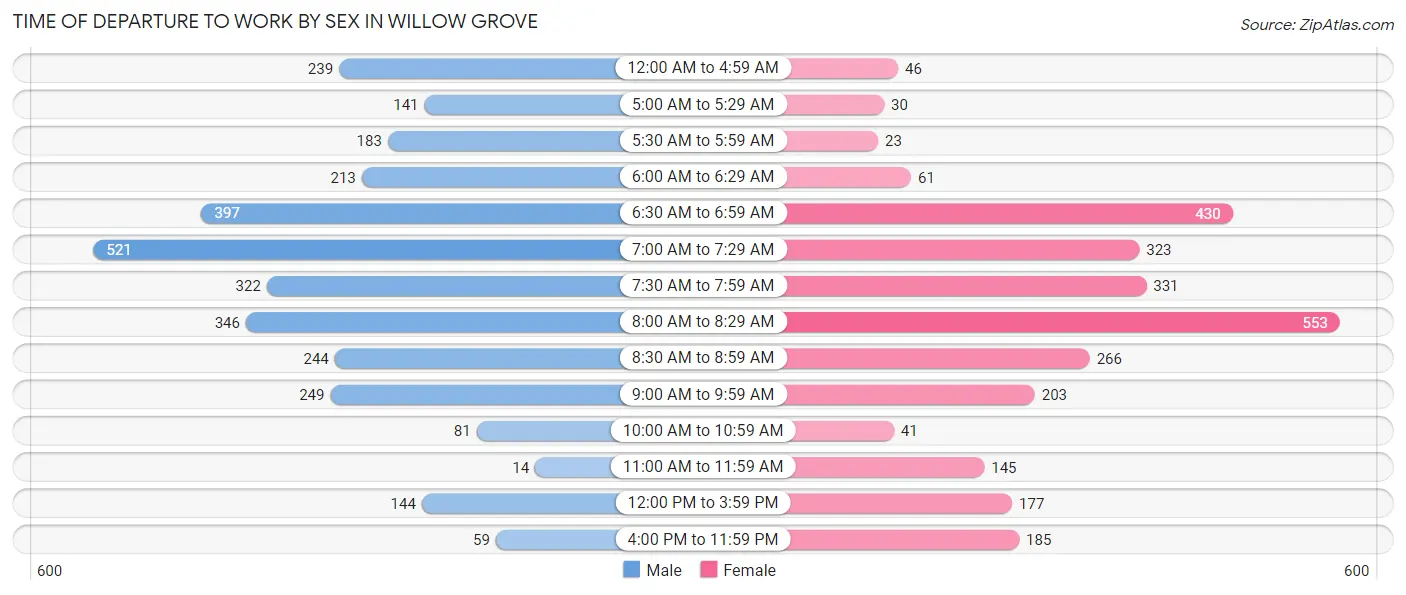
| Time of Departure | Male | Female |
| 12:00 AM to 4:59 AM | 239 (7.6%) | 46 (1.6%) |
| 5:00 AM to 5:29 AM | 141 (4.5%) | 30 (1.1%) |
| 5:30 AM to 5:59 AM | 183 (5.8%) | 23 (0.8%) |
| 6:00 AM to 6:29 AM | 213 (6.8%) | 61 (2.2%) |
| 6:30 AM to 6:59 AM | 397 (12.6%) | 430 (15.3%) |
| 7:00 AM to 7:29 AM | 521 (16.5%) | 323 (11.5%) |
| 7:30 AM to 7:59 AM | 322 (10.2%) | 331 (11.8%) |
| 8:00 AM to 8:29 AM | 346 (11.0%) | 553 (19.7%) |
| 8:30 AM to 8:59 AM | 244 (7.7%) | 266 (9.5%) |
| 9:00 AM to 9:59 AM | 249 (7.9%) | 203 (7.2%) |
| 10:00 AM to 10:59 AM | 81 (2.6%) | 41 (1.5%) |
| 11:00 AM to 11:59 AM | 14 (0.4%) | 145 (5.1%) |
| 12:00 PM to 3:59 PM | 144 (4.6%) | 177 (6.3%) |
| 4:00 PM to 11:59 PM | 59 (1.9%) | 185 (6.6%) |
| Total | 3,153 (100.0%) | 2,814 (100.0%) |
Housing Occupancy in Willow Grove
Occupancy by Ownership in Willow Grove
Of the total 5,361 dwellings in Willow Grove, owner-occupied units account for 3,736 (69.7%), while renter-occupied units make up 1,625 (30.3%).
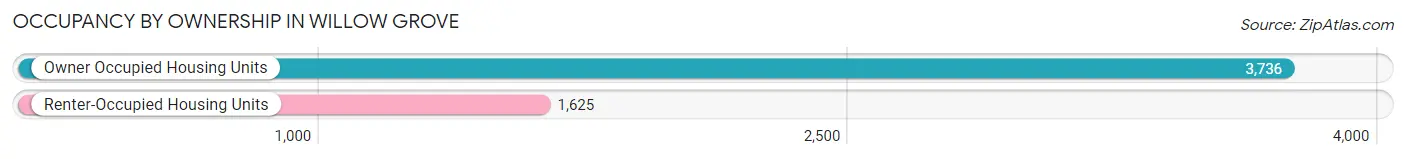
| Occupancy | # Housing Units | % Housing Units |
| Owner Occupied Housing Units | 3,736 | 69.7% |
| Renter-Occupied Housing Units | 1,625 | 30.3% |
| Total Occupied Housing Units | 5,361 | 100.0% |
Occupancy by Household Size in Willow Grove
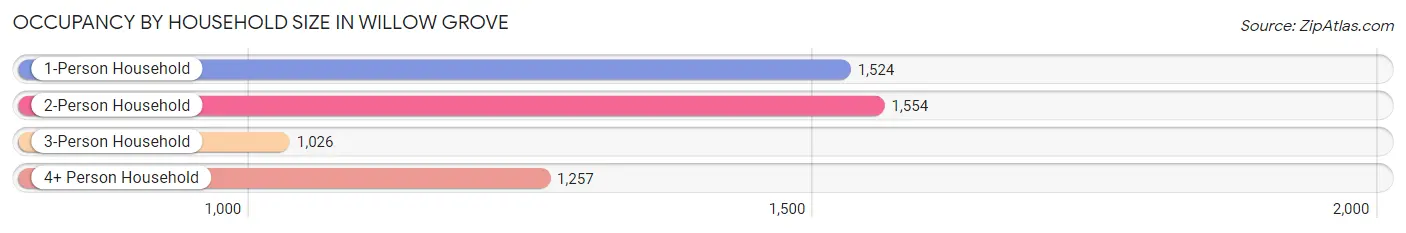
| Household Size | # Housing Units | % Housing Units |
| 1-Person Household | 1,524 | 28.4% |
| 2-Person Household | 1,554 | 29.0% |
| 3-Person Household | 1,026 | 19.1% |
| 4+ Person Household | 1,257 | 23.4% |
| Total Housing Units | 5,361 | 100.0% |
Occupancy by Ownership by Household Size in Willow Grove
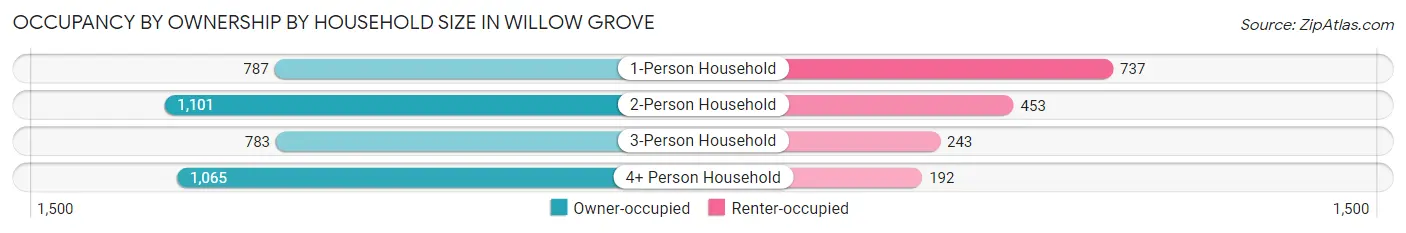
| Household Size | Owner-occupied | Renter-occupied |
| 1-Person Household | 787 (51.6%) | 737 (48.4%) |
| 2-Person Household | 1,101 (70.9%) | 453 (29.1%) |
| 3-Person Household | 783 (76.3%) | 243 (23.7%) |
| 4+ Person Household | 1,065 (84.7%) | 192 (15.3%) |
| Total Housing Units | 3,736 (69.7%) | 1,625 (30.3%) |
Occupancy by Educational Attainment in Willow Grove
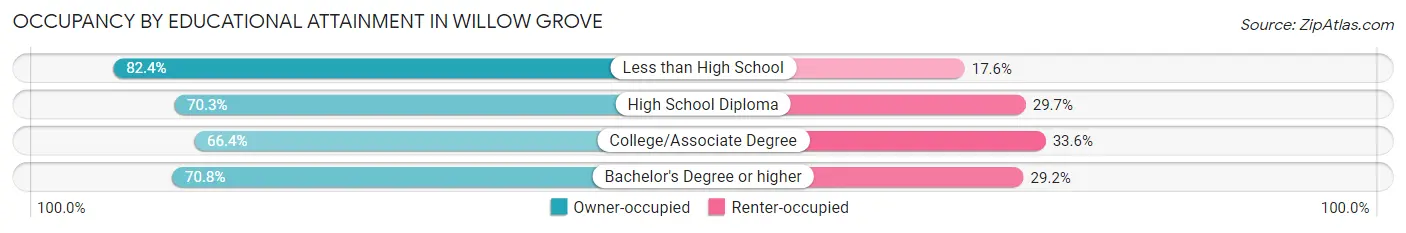
| Household Size | Owner-occupied | Renter-occupied |
| Less than High School | 61 (82.4%) | 13 (17.6%) |
| High School Diploma | 913 (70.3%) | 385 (29.7%) |
| College/Associate Degree | 916 (66.4%) | 464 (33.6%) |
| Bachelor's Degree or higher | 1,846 (70.8%) | 763 (29.2%) |
Occupancy by Age of Householder in Willow Grove
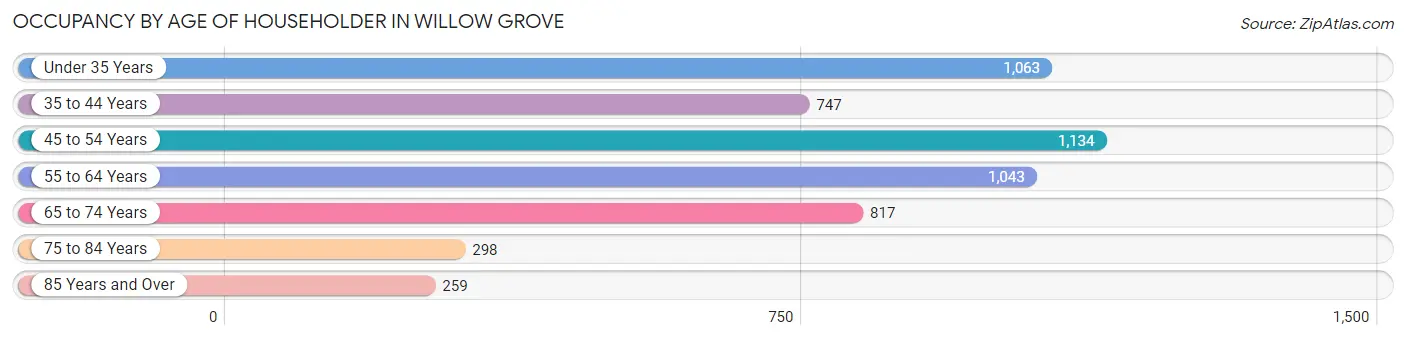
| Age Bracket | # Households | % Households |
| Under 35 Years | 1,063 | 19.8% |
| 35 to 44 Years | 747 | 13.9% |
| 45 to 54 Years | 1,134 | 21.1% |
| 55 to 64 Years | 1,043 | 19.5% |
| 65 to 74 Years | 817 | 15.2% |
| 75 to 84 Years | 298 | 5.6% |
| 85 Years and Over | 259 | 4.8% |
| Total | 5,361 | 100.0% |
Housing Finances in Willow Grove
Median Income by Occupancy in Willow Grove
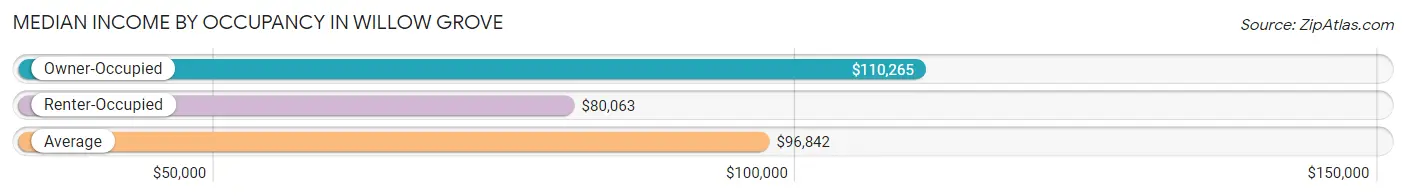
| Occupancy Type | # Households | Median Income |
| Owner-Occupied | 3,736 (69.7%) | $110,265 |
| Renter-Occupied | 1,625 (30.3%) | $80,063 |
| Average | 5,361 (100.0%) | $96,842 |
Occupancy by Householder Income Bracket in Willow Grove
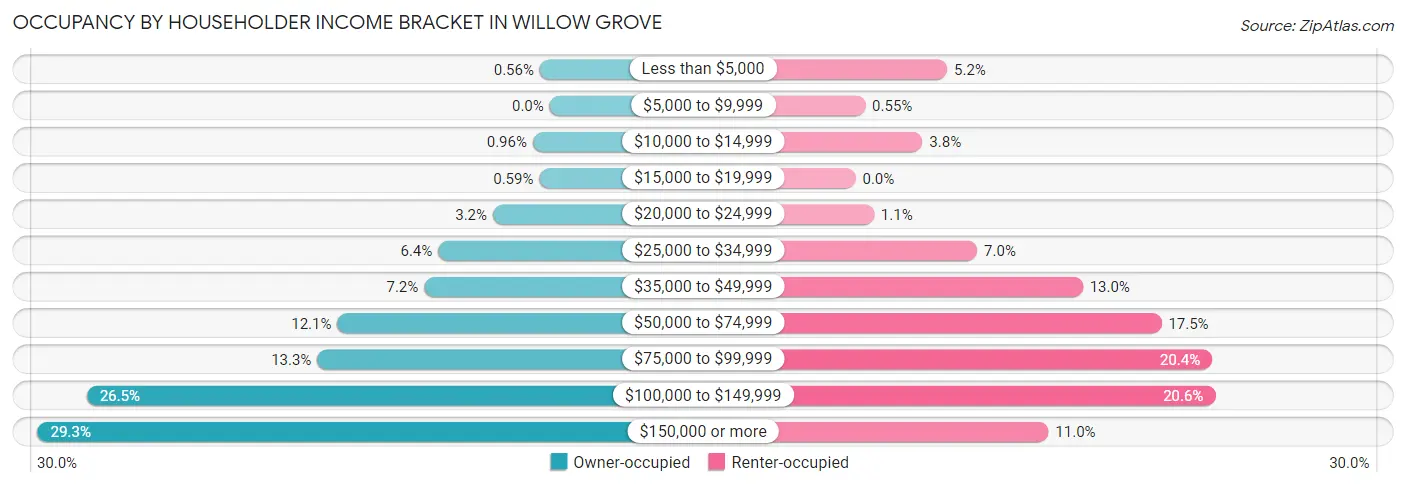
| Income Bracket | Owner-occupied | Renter-occupied |
| Less than $5,000 | 21 (0.6%) | 85 (5.2%) |
| $5,000 to $9,999 | 0 (0.0%) | 9 (0.5%) |
| $10,000 to $14,999 | 36 (1.0%) | 62 (3.8%) |
| $15,000 to $19,999 | 22 (0.6%) | 0 (0.0%) |
| $20,000 to $24,999 | 121 (3.2%) | 17 (1.1%) |
| $25,000 to $34,999 | 238 (6.4%) | 113 (7.0%) |
| $35,000 to $49,999 | 268 (7.2%) | 211 (13.0%) |
| $50,000 to $74,999 | 453 (12.1%) | 284 (17.5%) |
| $75,000 to $99,999 | 496 (13.3%) | 331 (20.4%) |
| $100,000 to $149,999 | 988 (26.5%) | 334 (20.5%) |
| $150,000 or more | 1,093 (29.3%) | 179 (11.0%) |
| Total | 3,736 (100.0%) | 1,625 (100.0%) |
Monthly Housing Cost Tiers in Willow Grove
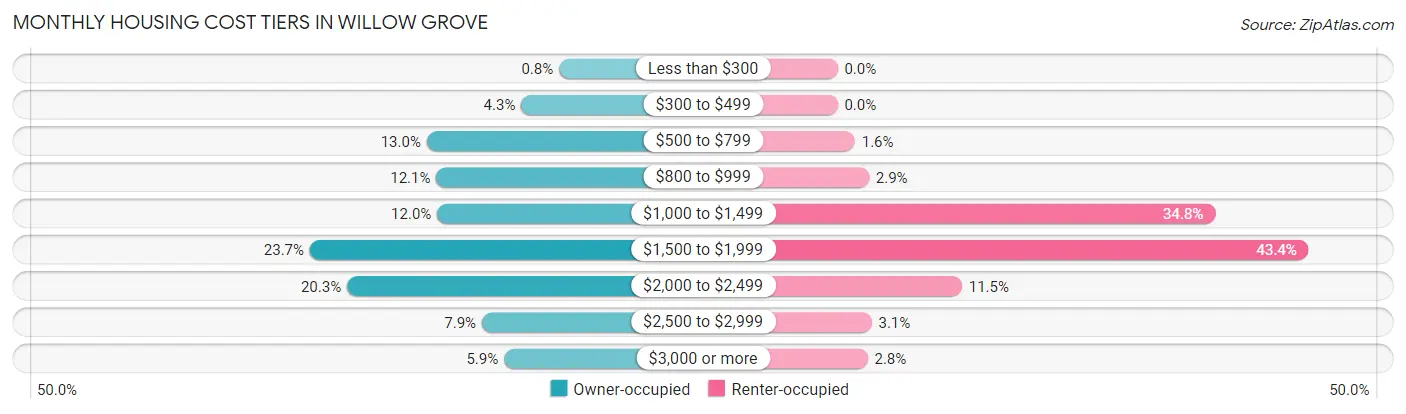
| Monthly Cost | Owner-occupied | Renter-occupied |
| Less than $300 | 30 (0.8%) | 0 (0.0%) |
| $300 to $499 | 160 (4.3%) | 0 (0.0%) |
| $500 to $799 | 485 (13.0%) | 26 (1.6%) |
| $800 to $999 | 452 (12.1%) | 47 (2.9%) |
| $1,000 to $1,499 | 449 (12.0%) | 565 (34.8%) |
| $1,500 to $1,999 | 887 (23.7%) | 705 (43.4%) |
| $2,000 to $2,499 | 759 (20.3%) | 186 (11.5%) |
| $2,500 to $2,999 | 295 (7.9%) | 51 (3.1%) |
| $3,000 or more | 219 (5.9%) | 45 (2.8%) |
| Total | 3,736 (100.0%) | 1,625 (100.0%) |
Physical Housing Characteristics in Willow Grove
Housing Structures in Willow Grove
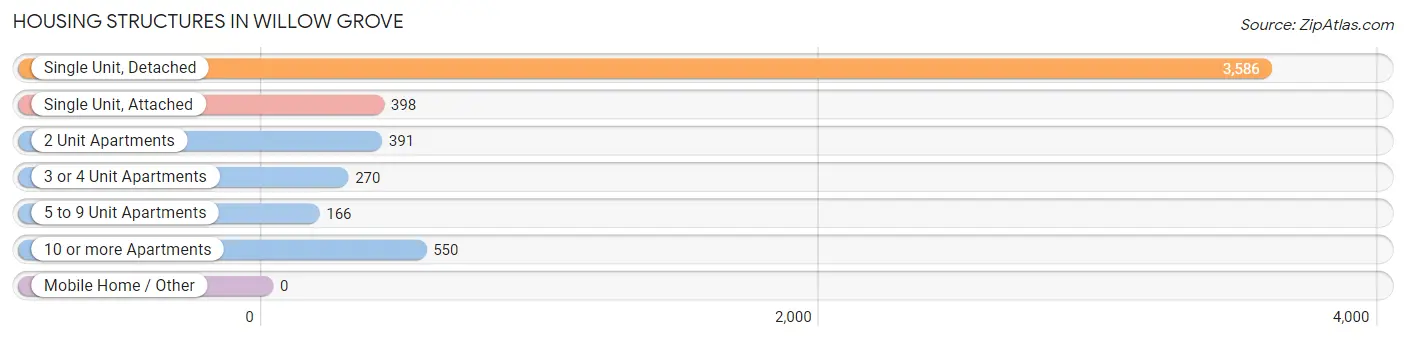
| Structure Type | # Housing Units | % Housing Units |
| Single Unit, Detached | 3,586 | 66.9% |
| Single Unit, Attached | 398 | 7.4% |
| 2 Unit Apartments | 391 | 7.3% |
| 3 or 4 Unit Apartments | 270 | 5.0% |
| 5 to 9 Unit Apartments | 166 | 3.1% |
| 10 or more Apartments | 550 | 10.3% |
| Mobile Home / Other | 0 | 0.0% |
| Total | 5,361 | 100.0% |
Housing Structures by Occupancy in Willow Grove
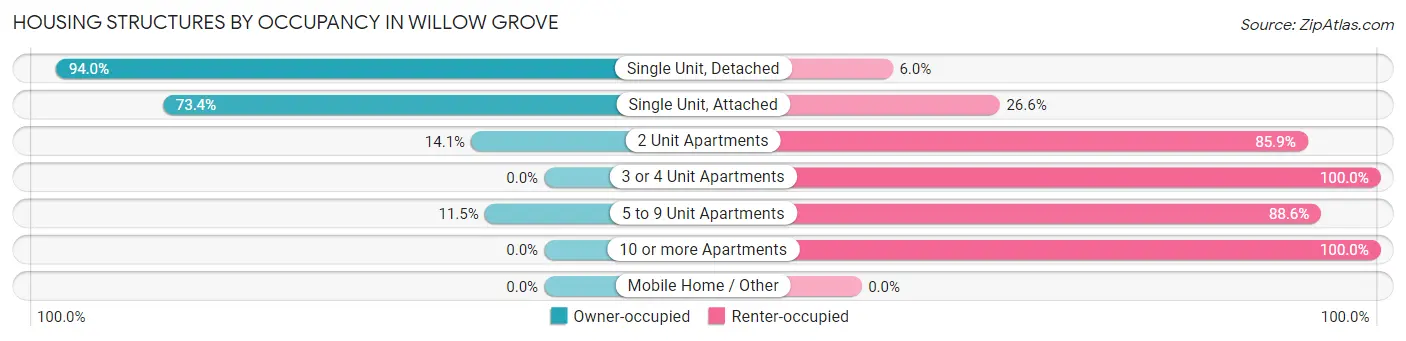
| Structure Type | Owner-occupied | Renter-occupied |
| Single Unit, Detached | 3,370 (94.0%) | 216 (6.0%) |
| Single Unit, Attached | 292 (73.4%) | 106 (26.6%) |
| 2 Unit Apartments | 55 (14.1%) | 336 (85.9%) |
| 3 or 4 Unit Apartments | 0 (0.0%) | 270 (100.0%) |
| 5 to 9 Unit Apartments | 19 (11.5%) | 147 (88.5%) |
| 10 or more Apartments | 0 (0.0%) | 550 (100.0%) |
| Mobile Home / Other | 0 (0.0%) | 0 (0.0%) |
| Total | 3,736 (69.7%) | 1,625 (30.3%) |
Housing Structures by Number of Rooms in Willow Grove
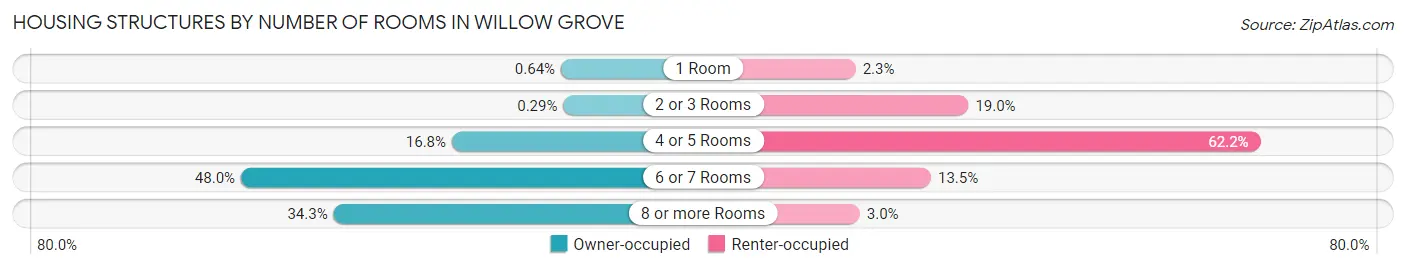
| Number of Rooms | Owner-occupied | Renter-occupied |
| 1 Room | 24 (0.6%) | 38 (2.3%) |
| 2 or 3 Rooms | 11 (0.3%) | 309 (19.0%) |
| 4 or 5 Rooms | 627 (16.8%) | 1,011 (62.2%) |
| 6 or 7 Rooms | 1,793 (48.0%) | 219 (13.5%) |
| 8 or more Rooms | 1,281 (34.3%) | 48 (2.9%) |
| Total | 3,736 (100.0%) | 1,625 (100.0%) |
Housing Structure by Heating Type in Willow Grove
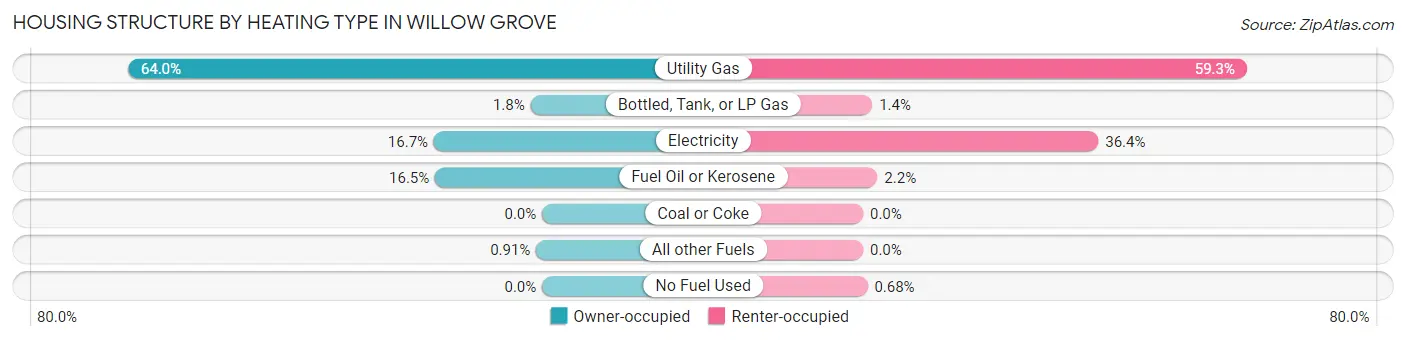
| Heating Type | Owner-occupied | Renter-occupied |
| Utility Gas | 2,392 (64.0%) | 964 (59.3%) |
| Bottled, Tank, or LP Gas | 67 (1.8%) | 23 (1.4%) |
| Electricity | 625 (16.7%) | 591 (36.4%) |
| Fuel Oil or Kerosene | 618 (16.5%) | 36 (2.2%) |
| Coal or Coke | 0 (0.0%) | 0 (0.0%) |
| All other Fuels | 34 (0.9%) | 0 (0.0%) |
| No Fuel Used | 0 (0.0%) | 11 (0.7%) |
| Total | 3,736 (100.0%) | 1,625 (100.0%) |
Household Vehicle Usage in Willow Grove
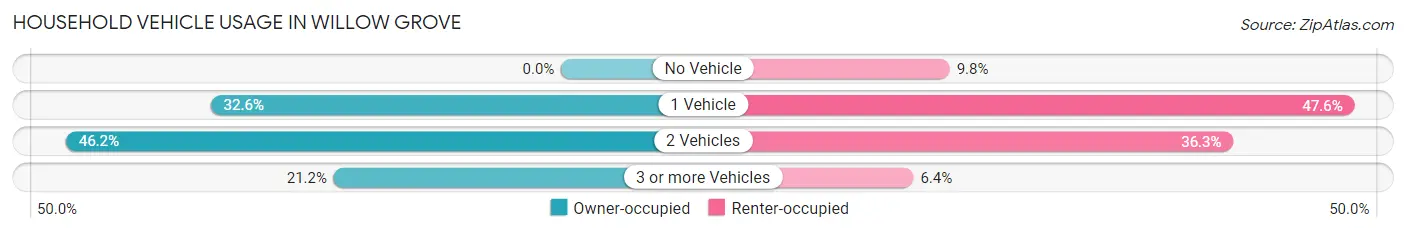
| Vehicles per Household | Owner-occupied | Renter-occupied |
| No Vehicle | 0 (0.0%) | 159 (9.8%) |
| 1 Vehicle | 1,219 (32.6%) | 773 (47.6%) |
| 2 Vehicles | 1,724 (46.2%) | 589 (36.2%) |
| 3 or more Vehicles | 793 (21.2%) | 104 (6.4%) |
| Total | 3,736 (100.0%) | 1,625 (100.0%) |
Real Estate & Mortgages in Willow Grove
Real Estate and Mortgage Overview in Willow Grove
| Characteristic | Without Mortgage | With Mortgage |
| Housing Units | 1,195 | 2,541 |
| Median Property Value | $285,200 | $317,300 |
| Median Household Income | $96,761 | $800 |
| Monthly Housing Costs | $782 | $219 |
| Real Estate Taxes | $4,714 | $26 |
Property Value by Mortgage Status in Willow Grove
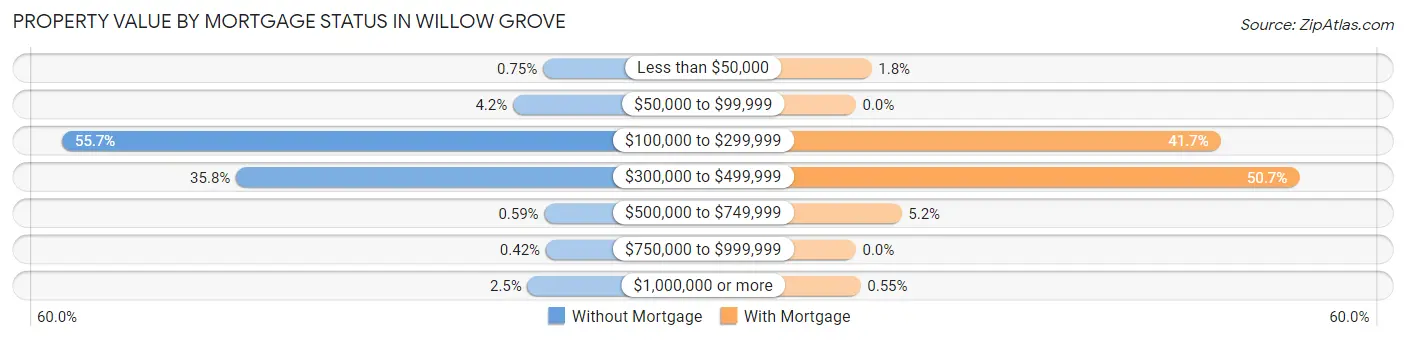
| Property Value | Without Mortgage | With Mortgage |
| Less than $50,000 | 9 (0.7%) | 46 (1.8%) |
| $50,000 to $99,999 | 50 (4.2%) | 0 (0.0%) |
| $100,000 to $299,999 | 666 (55.7%) | 1,060 (41.7%) |
| $300,000 to $499,999 | 428 (35.8%) | 1,288 (50.7%) |
| $500,000 to $749,999 | 7 (0.6%) | 133 (5.2%) |
| $750,000 to $999,999 | 5 (0.4%) | 0 (0.0%) |
| $1,000,000 or more | 30 (2.5%) | 14 (0.5%) |
| Total | 1,195 (100.0%) | 2,541 (100.0%) |
Household Income by Mortgage Status in Willow Grove
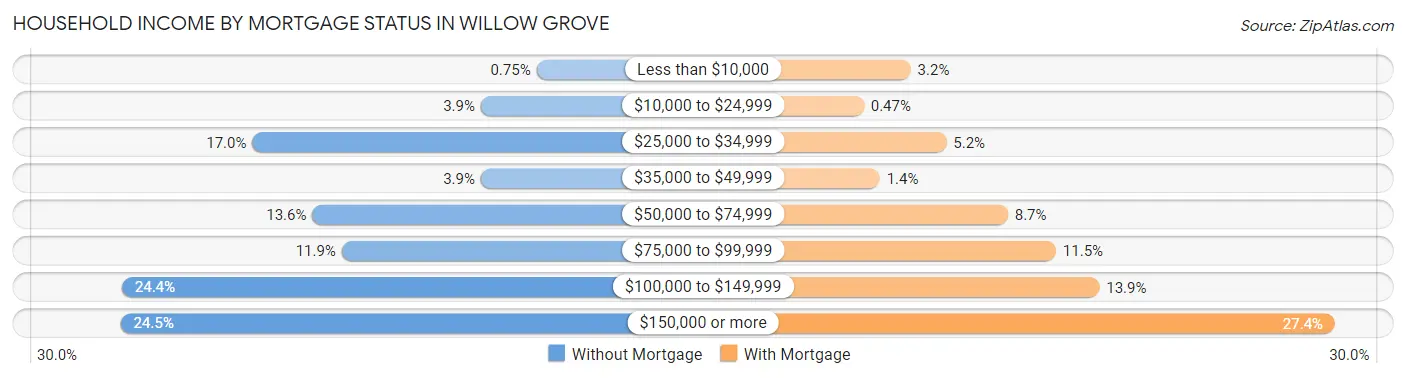
| Household Income | Without Mortgage | With Mortgage |
| Less than $10,000 | 9 (0.7%) | 80 (3.2%) |
| $10,000 to $24,999 | 47 (3.9%) | 12 (0.5%) |
| $25,000 to $34,999 | 203 (17.0%) | 132 (5.2%) |
| $35,000 to $49,999 | 47 (3.9%) | 35 (1.4%) |
| $50,000 to $74,999 | 162 (13.6%) | 221 (8.7%) |
| $75,000 to $99,999 | 142 (11.9%) | 291 (11.5%) |
| $100,000 to $149,999 | 292 (24.4%) | 354 (13.9%) |
| $150,000 or more | 293 (24.5%) | 696 (27.4%) |
| Total | 1,195 (100.0%) | 2,541 (100.0%) |
Property Value to Household Income Ratio in Willow Grove
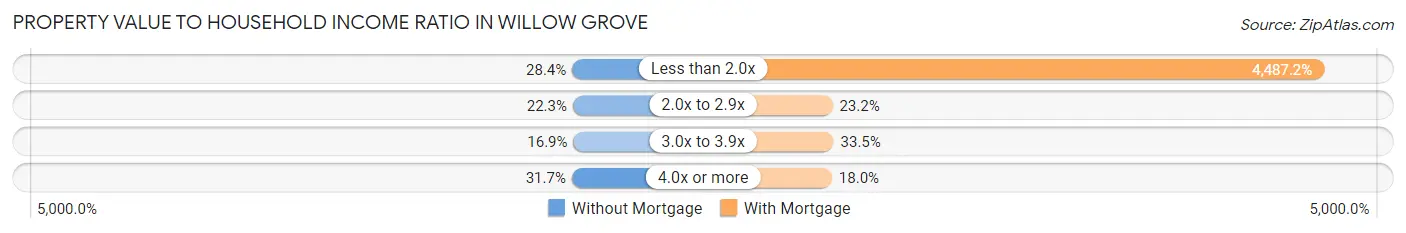
| Value-to-Income Ratio | Without Mortgage | With Mortgage |
| Less than 2.0x | 339 (28.4%) | 114,019 (4,487.2%) |
| 2.0x to 2.9x | 266 (22.3%) | 589 (23.2%) |
| 3.0x to 3.9x | 202 (16.9%) | 851 (33.5%) |
| 4.0x or more | 379 (31.7%) | 456 (17.9%) |
| Total | 1,195 (100.0%) | 2,541 (100.0%) |
Real Estate Taxes by Mortgage Status in Willow Grove

| Property Taxes | Without Mortgage | With Mortgage |
| Less than $800 | 20 (1.7%) | 12 (0.5%) |
| $800 to $1,499 | 83 (7.0%) | 46 (1.8%) |
| $800 to $1,499 | 1,053 (88.1%) | 93 (3.7%) |
| Total | 1,195 (100.0%) | 2,541 (100.0%) |
Health & Disability in Willow Grove
Health Insurance Coverage by Age in Willow Grove
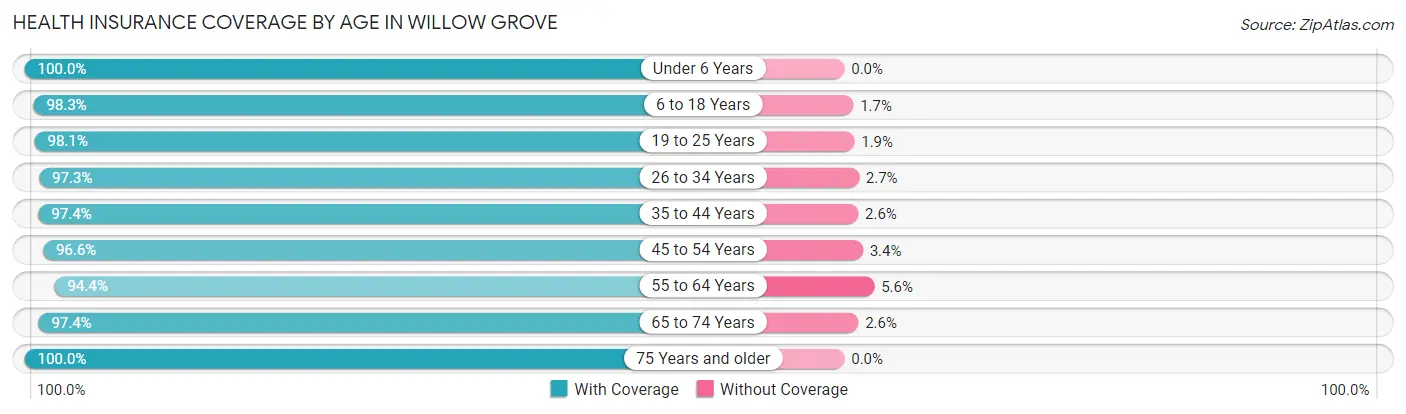
| Age Bracket | With Coverage | Without Coverage |
| Under 6 Years | 1,056 (100.0%) | 0 (0.0%) |
| 6 to 18 Years | 2,255 (98.3%) | 38 (1.7%) |
| 19 to 25 Years | 1,000 (98.1%) | 19 (1.9%) |
| 26 to 34 Years | 1,903 (97.3%) | 53 (2.7%) |
| 35 to 44 Years | 1,584 (97.4%) | 42 (2.6%) |
| 45 to 54 Years | 1,885 (96.6%) | 67 (3.4%) |
| 55 to 64 Years | 1,640 (94.4%) | 97 (5.6%) |
| 65 to 74 Years | 1,130 (97.4%) | 30 (2.6%) |
| 75 Years and older | 786 (100.0%) | 0 (0.0%) |
| Total | 13,239 (97.5%) | 346 (2.5%) |
Health Insurance Coverage by Citizenship Status in Willow Grove

| Citizenship Status | With Coverage | Without Coverage |
| Native Born | 1,056 (100.0%) | 0 (0.0%) |
| Foreign Born, Citizen | 2,255 (98.3%) | 38 (1.7%) |
| Foreign Born, not a Citizen | 1,000 (98.1%) | 19 (1.9%) |
Health Insurance Coverage by Household Income in Willow Grove
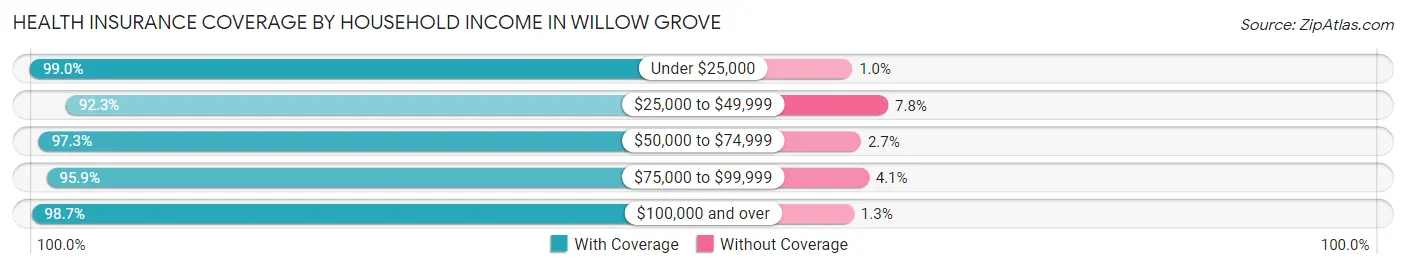
| Household Income | With Coverage | Without Coverage |
| Under $25,000 | 678 (99.0%) | 7 (1.0%) |
| $25,000 to $49,999 | 1,392 (92.2%) | 117 (7.7%) |
| $50,000 to $74,999 | 1,391 (97.3%) | 38 (2.7%) |
| $75,000 to $99,999 | 1,816 (95.9%) | 78 (4.1%) |
| $100,000 and over | 7,861 (98.7%) | 106 (1.3%) |
Public vs Private Health Insurance Coverage by Age in Willow Grove
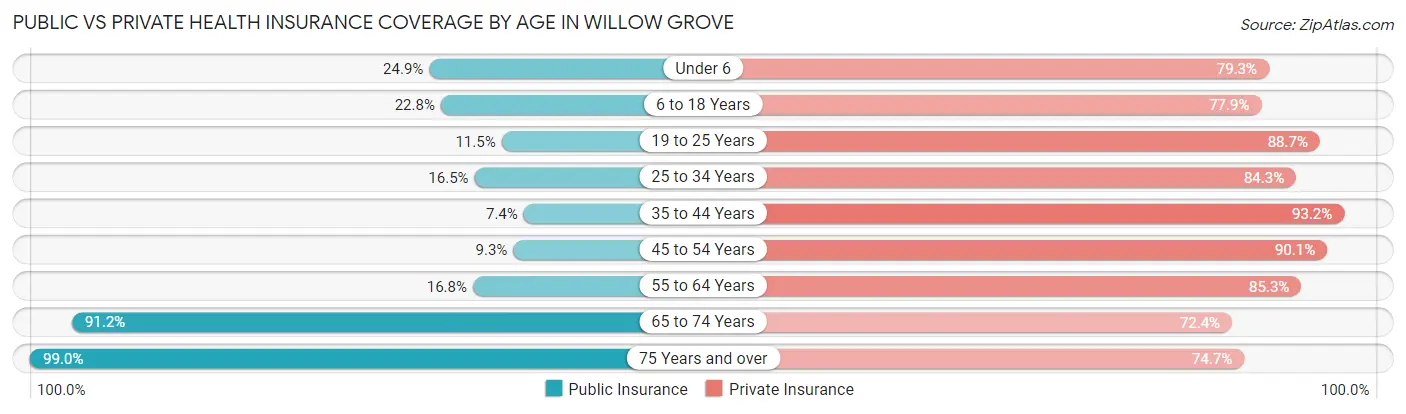
| Age Bracket | Public Insurance | Private Insurance |
| Under 6 | 263 (24.9%) | 837 (79.3%) |
| 6 to 18 Years | 522 (22.8%) | 1,785 (77.8%) |
| 19 to 25 Years | 117 (11.5%) | 904 (88.7%) |
| 25 to 34 Years | 323 (16.5%) | 1,649 (84.3%) |
| 35 to 44 Years | 120 (7.4%) | 1,516 (93.2%) |
| 45 to 54 Years | 182 (9.3%) | 1,758 (90.1%) |
| 55 to 64 Years | 292 (16.8%) | 1,481 (85.3%) |
| 65 to 74 Years | 1,058 (91.2%) | 840 (72.4%) |
| 75 Years and over | 778 (99.0%) | 587 (74.7%) |
| Total | 3,655 (26.9%) | 11,357 (83.6%) |
Disability Status by Sex by Age in Willow Grove
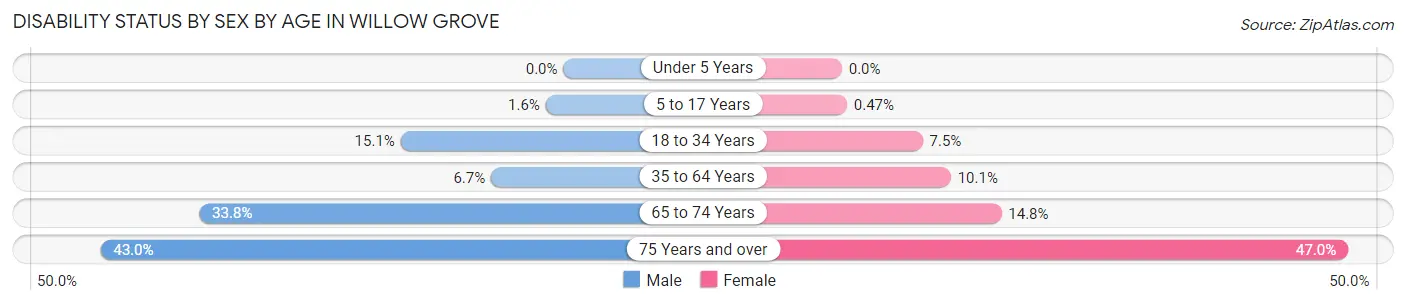
| Age Bracket | Male | Female |
| Under 5 Years | 0 (0.0%) | 0 (0.0%) |
| 5 to 17 Years | 18 (1.6%) | 5 (0.5%) |
| 18 to 34 Years | 242 (15.1%) | 121 (7.5%) |
| 35 to 64 Years | 182 (6.7%) | 263 (10.1%) |
| 65 to 74 Years | 164 (33.8%) | 100 (14.8%) |
| 75 Years and over | 110 (43.0%) | 249 (47.0%) |
Disability Class by Sex by Age in Willow Grove
Disability Class: Hearing Difficulty
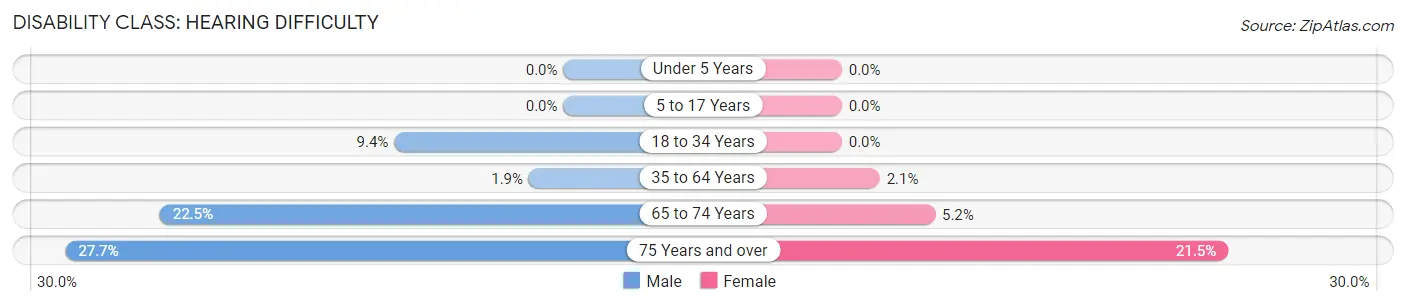
| Age Bracket | Male | Female |
| Under 5 Years | 0 (0.0%) | 0 (0.0%) |
| 5 to 17 Years | 0 (0.0%) | 0 (0.0%) |
| 18 to 34 Years | 151 (9.4%) | 0 (0.0%) |
| 35 to 64 Years | 52 (1.9%) | 55 (2.1%) |
| 65 to 74 Years | 109 (22.5%) | 35 (5.2%) |
| 75 Years and over | 71 (27.7%) | 114 (21.5%) |
Disability Class: Vision Difficulty
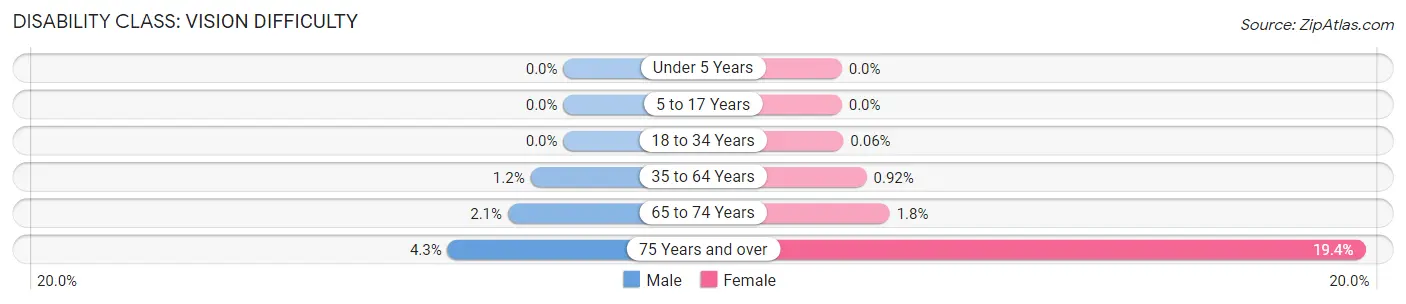
| Age Bracket | Male | Female |
| Under 5 Years | 0 (0.0%) | 0 (0.0%) |
| 5 to 17 Years | 0 (0.0%) | 0 (0.0%) |
| 18 to 34 Years | 0 (0.0%) | 1 (0.1%) |
| 35 to 64 Years | 33 (1.2%) | 24 (0.9%) |
| 65 to 74 Years | 10 (2.1%) | 12 (1.8%) |
| 75 Years and over | 11 (4.3%) | 103 (19.4%) |
Disability Class: Cognitive Difficulty
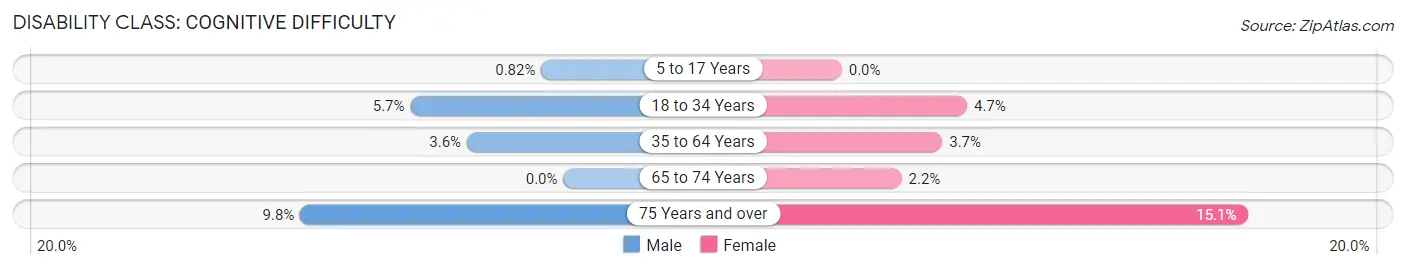
| Age Bracket | Male | Female |
| 5 to 17 Years | 9 (0.8%) | 0 (0.0%) |
| 18 to 34 Years | 91 (5.7%) | 75 (4.6%) |
| 35 to 64 Years | 97 (3.6%) | 97 (3.7%) |
| 65 to 74 Years | 0 (0.0%) | 15 (2.2%) |
| 75 Years and over | 25 (9.8%) | 80 (15.1%) |
Disability Class: Ambulatory Difficulty
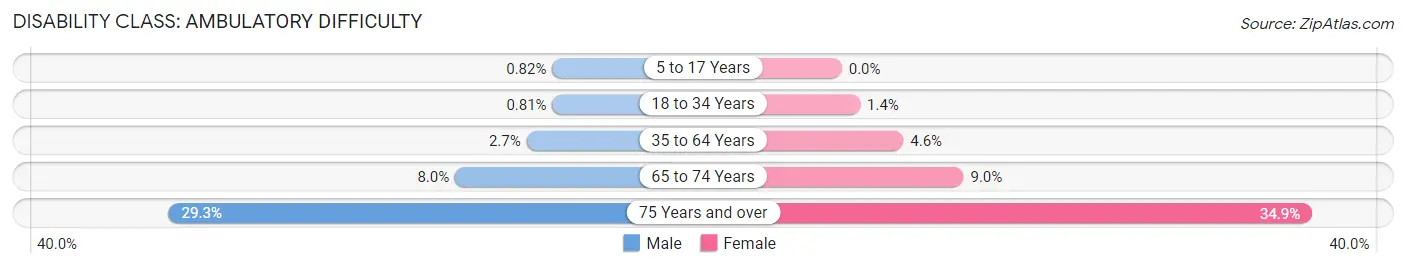
| Age Bracket | Male | Female |
| 5 to 17 Years | 9 (0.8%) | 0 (0.0%) |
| 18 to 34 Years | 13 (0.8%) | 22 (1.4%) |
| 35 to 64 Years | 74 (2.7%) | 119 (4.6%) |
| 65 to 74 Years | 39 (8.0%) | 61 (9.0%) |
| 75 Years and over | 75 (29.3%) | 185 (34.9%) |
Disability Class: Self-Care Difficulty
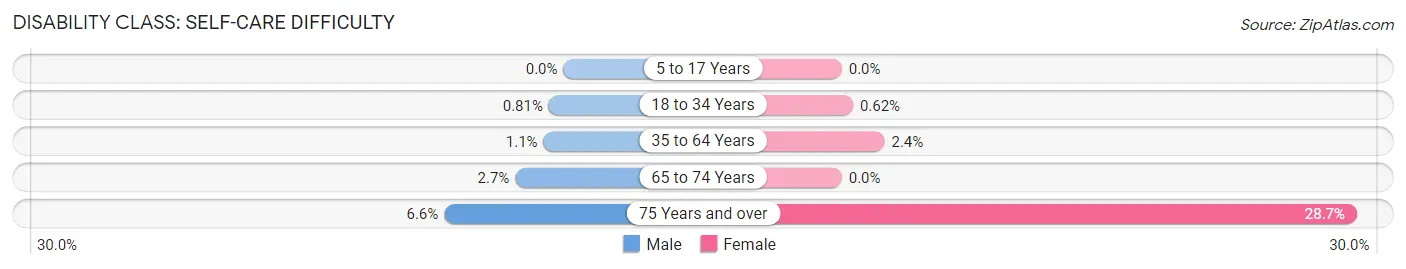
| Age Bracket | Male | Female |
| 5 to 17 Years | 0 (0.0%) | 0 (0.0%) |
| 18 to 34 Years | 13 (0.8%) | 10 (0.6%) |
| 35 to 64 Years | 30 (1.1%) | 62 (2.4%) |
| 65 to 74 Years | 13 (2.7%) | 0 (0.0%) |
| 75 Years and over | 17 (6.6%) | 152 (28.7%) |
Technology Access in Willow Grove
Computing Device Access in Willow Grove
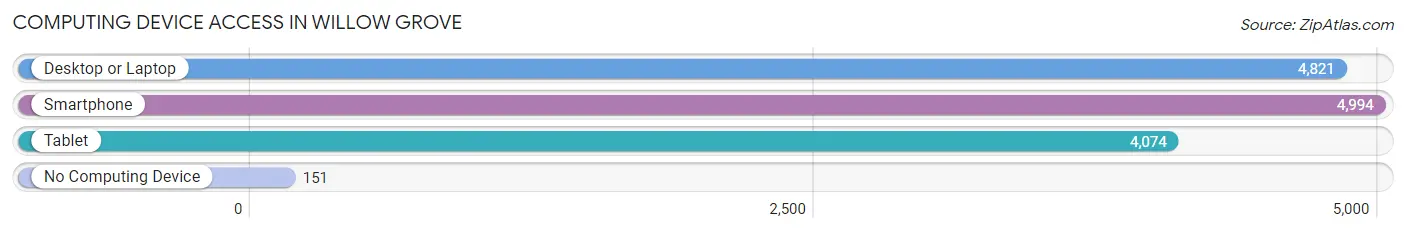
| Device Type | # Households | % Households |
| Desktop or Laptop | 4,821 | 89.9% |
| Smartphone | 4,994 | 93.1% |
| Tablet | 4,074 | 76.0% |
| No Computing Device | 151 | 2.8% |
| Total | 5,361 | 100.0% |
Internet Access in Willow Grove
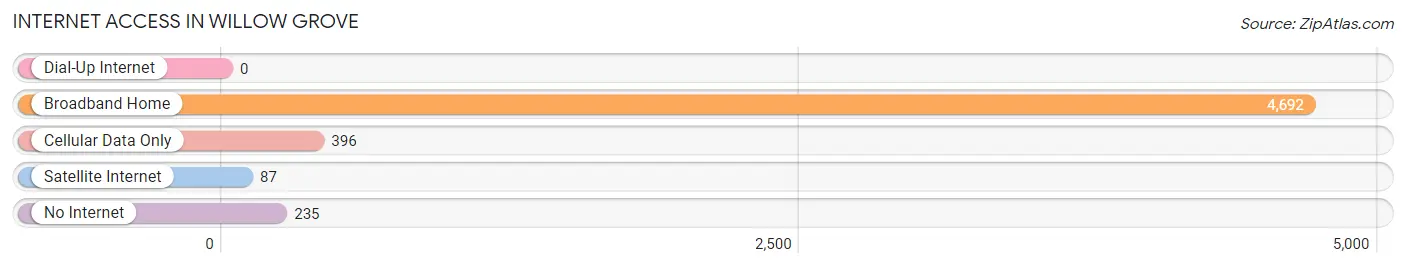
| Internet Type | # Households | % Households |
| Dial-Up Internet | 0 | 0.0% |
| Broadband Home | 4,692 | 87.5% |
| Cellular Data Only | 396 | 7.4% |
| Satellite Internet | 87 | 1.6% |
| No Internet | 235 | 4.4% |
| Total | 5,361 | 100.0% |
Willow Grove Summary
Willow Grove is a census-designated place (CDP) located in Montgomery County, Pennsylvania, United States. It is a suburb of Philadelphia, located approximately 20 miles north of the city. As of the 2010 census, the population of Willow Grove was 15,726.
History
The area now known as Willow Grove was originally inhabited by the Lenape Native Americans. The first European settlers arrived in the area in the late 17th century, and the area was officially established as a township in 1717. The township was named after a grove of willow trees that grew near the original settlement.
In the late 19th century, the area began to develop as a summer resort destination, with the opening of several hotels and resorts. The area also became a popular destination for day trips from Philadelphia.
In the early 20th century, the area began to develop as a residential suburb of Philadelphia. The population of Willow Grove increased significantly after World War II, and the area became a popular destination for shopping and entertainment.
Geography
Willow Grove is located at 40°09'45" North, 75°08'45" West (40.1625, -75.1458). It is situated in the southeastern portion of Montgomery County, approximately 20 miles north of Philadelphia.
The CDP has a total area of 4.2 square miles, all of which is land. It is bordered by Upper Moreland Township to the north, Horsham Township to the east, Abington Township to the south, and Upper Dublin Township to the west.
Economy
Willow Grove is home to several major employers, including the Naval Air Station Joint Reserve Base Willow Grove, which is the largest employer in the area. Other major employers include the Willow Grove Park Mall, the Willow Grove Park Racetrack, and the Willow Grove Industrial Park.
The area is also home to several small businesses, including restaurants, retail stores, and professional services.
Demographics
As of the 2010 census, the population of Willow Grove was 15,726. The racial makeup of the CDP was 81.3% White, 8.2% African American, 0.2% Native American, 5.2% Asian, and 4.9% from other races. Hispanic or Latino of any race were 8.7% of the population.
The median household income in Willow Grove was $68,945, and the median family income was $77,945. The per capita income was $31,945. About 4.2% of families and 5.7% of the population were below the poverty line.
Common Questions
What is Per Capita Income in Willow Grove?
Per Capita income in Willow Grove is $46,578.
What is the Median Family Income in Willow Grove?
Median Family Income in Willow Grove is $117,289.
What is the Median Household income in Willow Grove?
Median Household Income in Willow Grove is $96,842.
What is Income or Wage Gap in Willow Grove?
Income or Wage Gap in Willow Grove is 10.6%.
Women in Willow Grove earn 89.4 cents for every dollar earned by a man.
What is Family Income Deficit in Willow Grove?
Family Income Deficit in Willow Grove is $5,752.
Families that are below poverty line in Willow Grove earn $5,752 less on average than the poverty threshold level.
What is Inequality or Gini Index in Willow Grove?
Inequality or Gini Index in Willow Grove is 0.40.
What is the Total Population of Willow Grove?
Total Population of Willow Grove is 13,759.
What is the Total Male Population of Willow Grove?
Total Male Population of Willow Grove is 6,834.
What is the Total Female Population of Willow Grove?
Total Female Population of Willow Grove is 6,925.
What is the Ratio of Males per 100 Females in Willow Grove?
There are 98.69 Males per 100 Females in Willow Grove.
What is the Ratio of Females per 100 Males in Willow Grove?
There are 101.33 Females per 100 Males in Willow Grove.
What is the Median Population Age in Willow Grove?
Median Population Age in Willow Grove is 37.7 Years.
What is the Average Family Size in Willow Grove
Average Family Size in Willow Grove is 3.1 People.
What is the Average Household Size in Willow Grove
Average Household Size in Willow Grove is 2.5 People.
How Large is the Labor Force in Willow Grove?
There are 7,707 People in the Labor Forcein in Willow Grove.
What is the Percentage of People in the Labor Force in Willow Grove?
69.7% of People are in the Labor Force in Willow Grove.
What is the Unemployment Rate in Willow Grove?
Unemployment Rate in Willow Grove is 2.6%.