Congers, NY Map & Demographics
Congers Map
Congers Overview
$58,296
PER CAPITA INCOME
$151,852
AVG FAMILY INCOME
$136,791
AVG HOUSEHOLD INCOME
36.5%
WAGE / INCOME GAP [ % ]
63.5¢/ $1
WAGE / INCOME GAP [ $ ]
0.41
INEQUALITY / GINI INDEX
7,882
TOTAL POPULATION
3,668
MALE POPULATION
4,214
FEMALE POPULATION
87.04
MALES / 100 FEMALES
114.89
FEMALES / 100 MALES
46.0
MEDIAN AGE
3.4
AVG FAMILY SIZE
3.0
AVG HOUSEHOLD SIZE
4,228
LABOR FORCE [ PEOPLE ]
65.3%
PERCENT IN LABOR FORCE
4.8%
UNEMPLOYMENT RATE
Congers Zip Codes
Congers Area Codes
Income in Congers
Income Overview in Congers
Per Capita Income in Congers is $58,296, while median incomes of families and households are $151,852 and $136,791 respectively.
| Characteristic | Number | Measure |
| Per Capita Income | 7,882 | $58,296 |
| Median Family Income | 2,150 | $151,852 |
| Mean Family Income | 2,150 | $192,416 |
| Median Household Income | 2,571 | $136,791 |
| Mean Household Income | 2,571 | $175,028 |
| Income Deficit | 2,150 | $0 |
| Wage / Income Gap (%) | 7,882 | 36.51% |
| Wage / Income Gap ($) | 7,882 | 63.49¢ per $1 |
| Gini / Inequality Index | 7,882 | 0.41 |
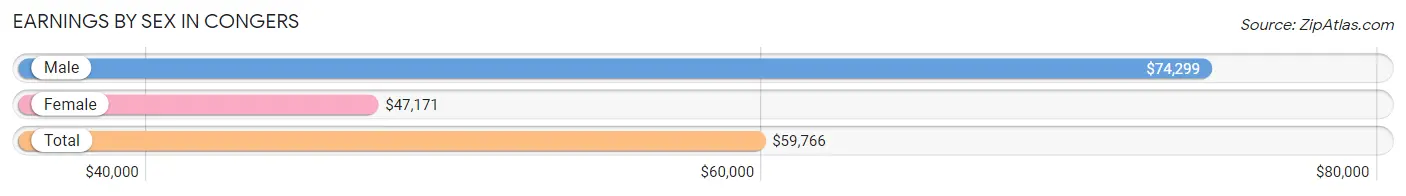
Earnings by Sex in Congers
Average Earnings in Congers are $59,766, $74,299 for men and $47,171 for women, a difference of 36.5%.
| Sex | Number | Average Earnings |
| Male | 2,271 (52.2%) | $74,299 |
| Female | 2,080 (47.8%) | $47,171 |
| Total | 4,351 (100.0%) | $59,766 |
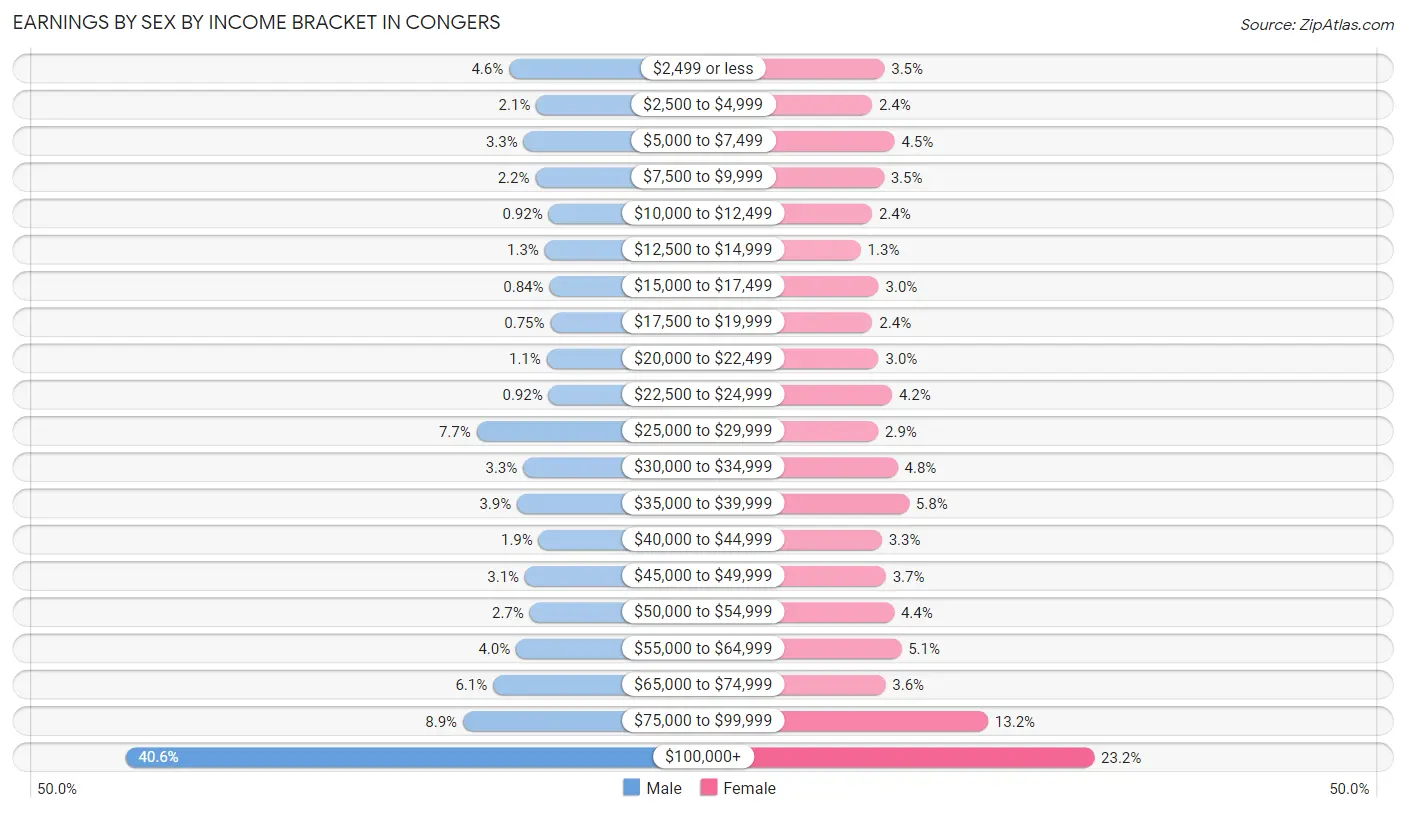
Earnings by Sex by Income Bracket in Congers
The most common earnings brackets in Congers are $100,000+ for men (921 | 40.6%) and $100,000+ for women (482 | 23.2%).
| Income | Male | Female |
| $2,499 or less | 105 (4.6%) | 73 (3.5%) |
| $2,500 to $4,999 | 47 (2.1%) | 49 (2.4%) |
| $5,000 to $7,499 | 74 (3.3%) | 93 (4.5%) |
| $7,500 to $9,999 | 49 (2.2%) | 72 (3.5%) |
| $10,000 to $12,499 | 21 (0.9%) | 49 (2.4%) |
| $12,500 to $14,999 | 29 (1.3%) | 27 (1.3%) |
| $15,000 to $17,499 | 19 (0.8%) | 62 (3.0%) |
| $17,500 to $19,999 | 17 (0.7%) | 50 (2.4%) |
| $20,000 to $22,499 | 25 (1.1%) | 62 (3.0%) |
| $22,500 to $24,999 | 21 (0.9%) | 88 (4.2%) |
| $25,000 to $29,999 | 174 (7.7%) | 61 (2.9%) |
| $30,000 to $34,999 | 75 (3.3%) | 99 (4.8%) |
| $35,000 to $39,999 | 88 (3.9%) | 121 (5.8%) |
| $40,000 to $44,999 | 42 (1.8%) | 68 (3.3%) |
| $45,000 to $49,999 | 71 (3.1%) | 76 (3.6%) |
| $50,000 to $54,999 | 61 (2.7%) | 92 (4.4%) |
| $55,000 to $64,999 | 90 (4.0%) | 106 (5.1%) |
| $65,000 to $74,999 | 139 (6.1%) | 75 (3.6%) |
| $75,000 to $99,999 | 203 (8.9%) | 275 (13.2%) |
| $100,000+ | 921 (40.6%) | 482 (23.2%) |
| Total | 2,271 (100.0%) | 2,080 (100.0%) |
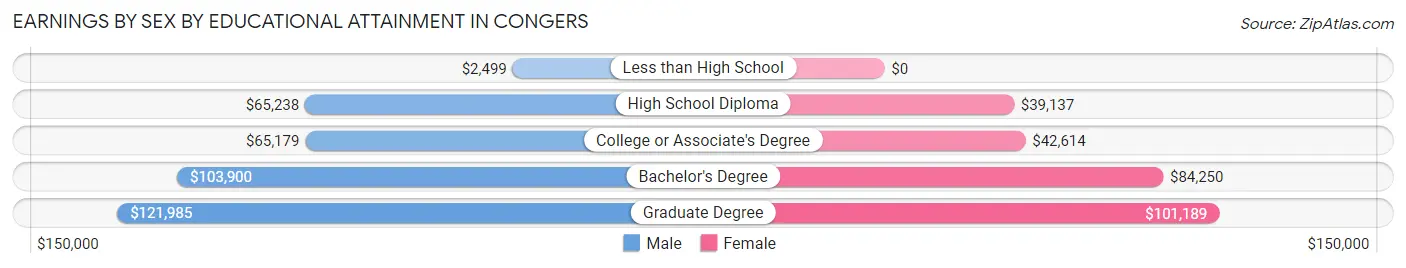
Earnings by Sex by Educational Attainment in Congers
Average earnings in Congers are $96,563 for men and $59,083 for women, a difference of 38.8%. Men with an educational attainment of graduate degree enjoy the highest average annual earnings of $121,985, while those with less than high school education earn the least with $2,499. Women with an educational attainment of graduate degree earn the most with the average annual earnings of $101,189, while those with high school diploma education have the smallest earnings of $39,137.
| Educational Attainment | Male Income | Female Income |
| Less than High School | $2,499 | $0 |
| High School Diploma | $65,238 | $39,137 |
| College or Associate's Degree | $65,179 | $42,614 |
| Bachelor's Degree | $103,900 | $84,250 |
| Graduate Degree | $121,985 | $101,189 |
| Total | $96,563 | $59,083 |
Family Income in Congers
Family Income Brackets in Congers
According to the Congers family income data, there are 793 families falling into the $200,000+ income range, which is the most common income bracket and makes up 36.9% of all families.
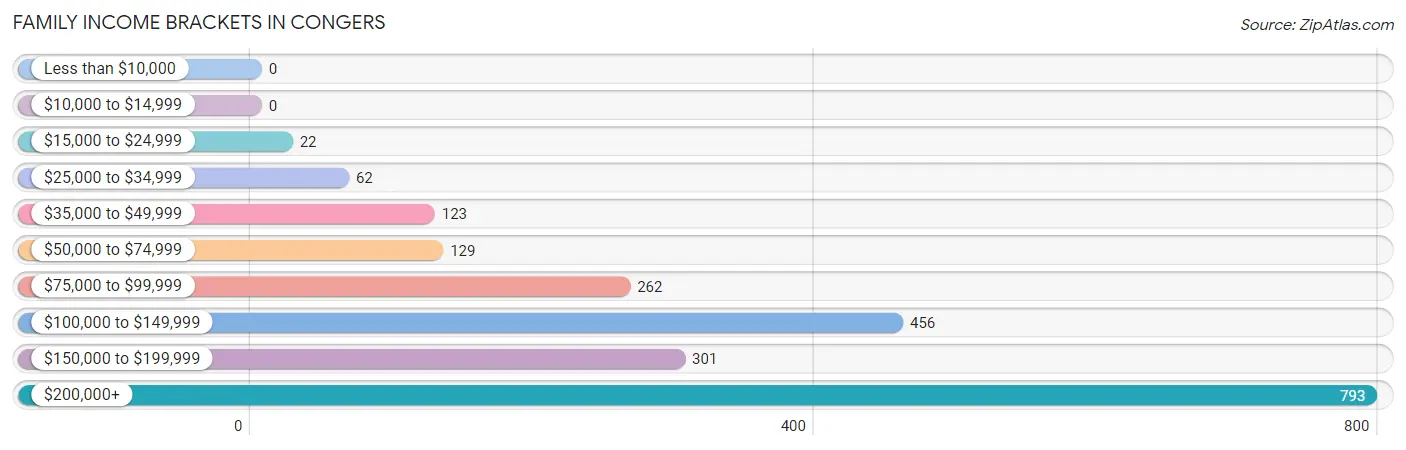
| Income Bracket | # Families | % Families |
| Less than $10,000 | 0 | 0.0% |
| $10,000 to $14,999 | 0 | 0.0% |
| $15,000 to $24,999 | 22 | 1.0% |
| $25,000 to $34,999 | 62 | 2.9% |
| $35,000 to $49,999 | 123 | 5.7% |
| $50,000 to $74,999 | 129 | 6.0% |
| $75,000 to $99,999 | 262 | 12.2% |
| $100,000 to $149,999 | 456 | 21.2% |
| $150,000 to $199,999 | 301 | 14.0% |
| $200,000+ | 793 | 36.9% |
Family Income by Famaliy Size in Congers
6-person families (164 | 7.6%) account for the highest median family income in Congers with $250,001 per family, while 2-person families (780 | 36.3%) have the highest median income of $58,576 per family member.
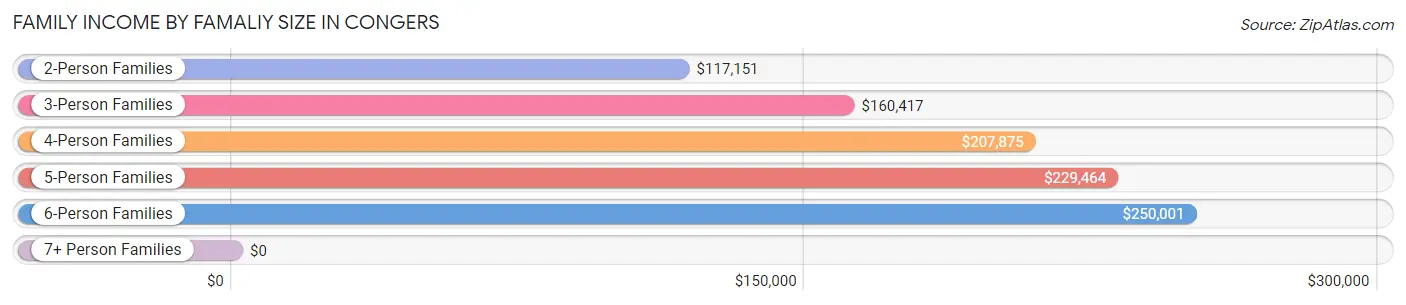
| Income Bracket | # Families | Median Income |
| 2-Person Families | 780 (36.3%) | $117,151 |
| 3-Person Families | 551 (25.6%) | $160,417 |
| 4-Person Families | 507 (23.6%) | $207,875 |
| 5-Person Families | 139 (6.5%) | $229,464 |
| 6-Person Families | 164 (7.6%) | $250,001 |
| 7+ Person Families | 9 (0.4%) | $0 |
| Total | 2,150 (100.0%) | $151,852 |
Family Income by Number of Earners in Congers
The median family income in Congers is $151,852, with families comprising 3+ earners (429) having the highest median family income of $234,625, while families with no earners (222) have the lowest median family income of $94,630, accounting for 20.0% and 10.3% of families, respectively.
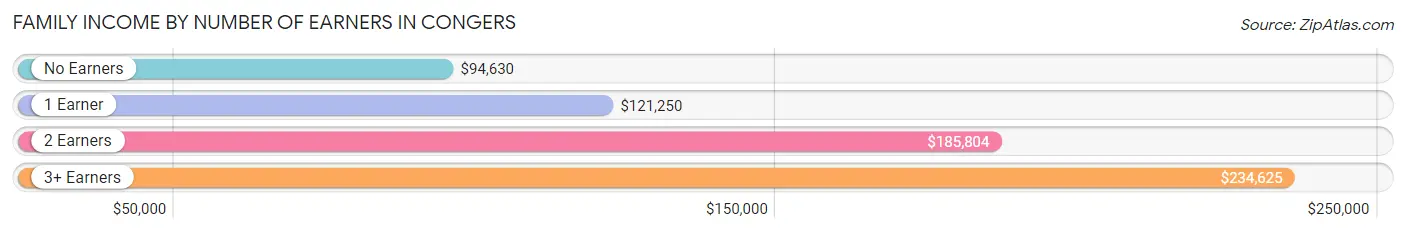
| Number of Earners | # Families | Median Income |
| No Earners | 222 (10.3%) | $94,630 |
| 1 Earner | 603 (28.1%) | $121,250 |
| 2 Earners | 896 (41.7%) | $185,804 |
| 3+ Earners | 429 (20.0%) | $234,625 |
| Total | 2,150 (100.0%) | $151,852 |
Household Income in Congers
Household Income Brackets in Congers
With 859 households falling in the category, the $200,000+ income range is the most frequent in Congers, accounting for 33.4% of all households. In contrast, only 13 households (0.5%) fall into the less than $10,000 income bracket, making it the least populous group.
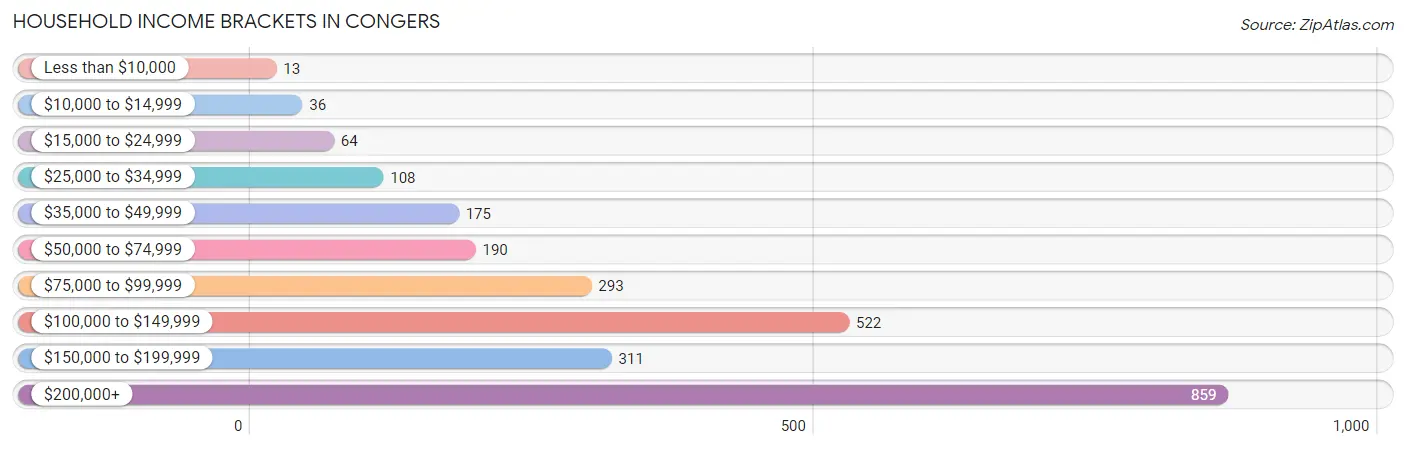
| Income Bracket | # Households | % Households |
| Less than $10,000 | 13 | 0.5% |
| $10,000 to $14,999 | 36 | 1.4% |
| $15,000 to $24,999 | 64 | 2.5% |
| $25,000 to $34,999 | 108 | 4.2% |
| $35,000 to $49,999 | 175 | 6.8% |
| $50,000 to $74,999 | 190 | 7.4% |
| $75,000 to $99,999 | 293 | 11.4% |
| $100,000 to $149,999 | 522 | 20.3% |
| $150,000 to $199,999 | 311 | 12.1% |
| $200,000+ | 859 | 33.4% |
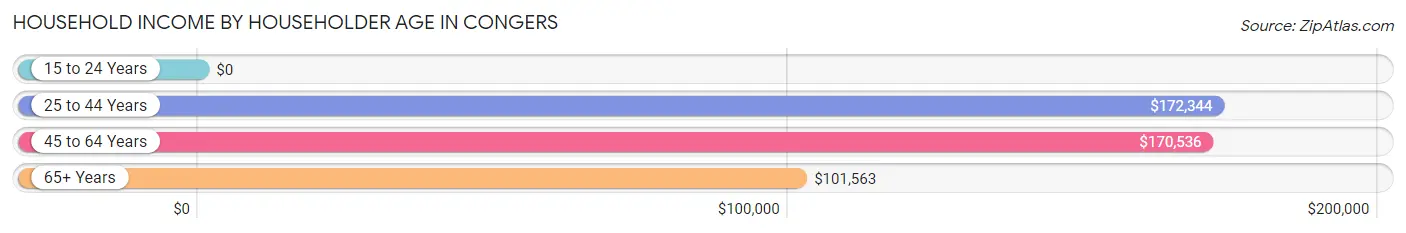
Household Income by Householder Age in Congers
The median household income in Congers is $136,791, with the highest median household income of $172,344 found in the 25 to 44 years age bracket for the primary householder. A total of 457 households (17.8%) fall into this category.
| Income Bracket | # Households | Median Income |
| 15 to 24 Years | 0 (0.0%) | $0 |
| 25 to 44 Years | 457 (17.8%) | $172,344 |
| 45 to 64 Years | 1,361 (52.9%) | $170,536 |
| 65+ Years | 753 (29.3%) | $101,563 |
| Total | 2,571 (100.0%) | $136,791 |
Poverty in Congers
Income Below Poverty by Sex and Age in Congers
With 4.9% poverty level for males and 4.8% for females among the residents of Congers, 6 to 11 year old males and 5 year old females are the most vulnerable to poverty, with 38 males (24.2%) and 28 females (90.3%) in their respective age groups living below the poverty level.
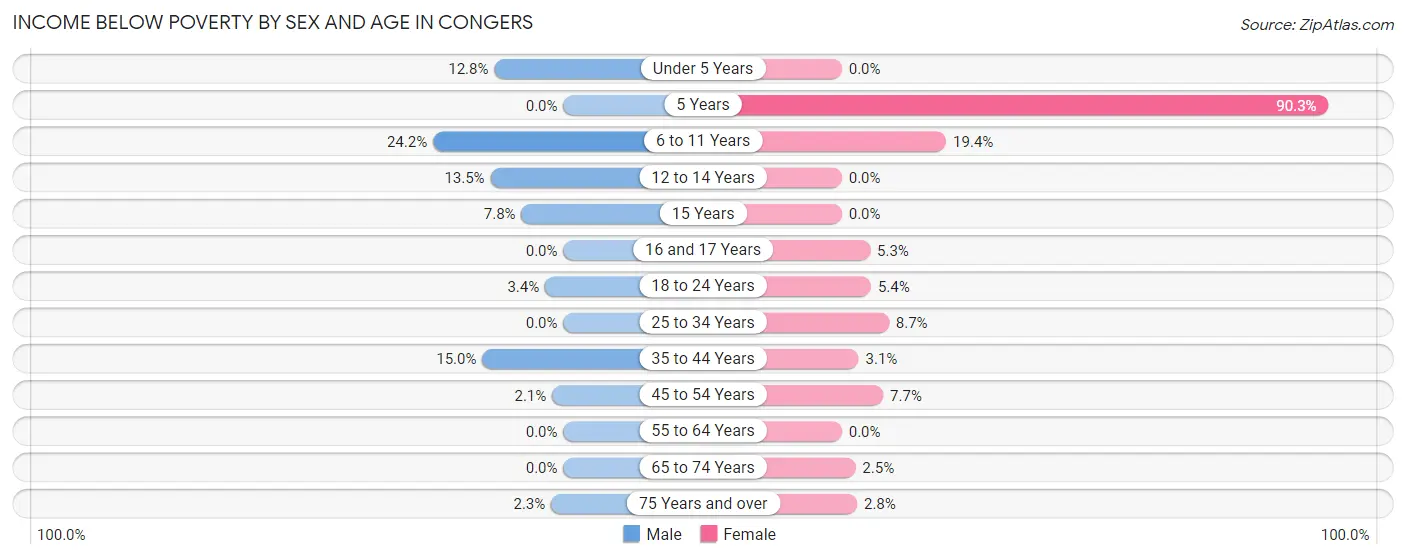
| Age Bracket | Male | Female |
| Under 5 Years | 10 (12.8%) | 0 (0.0%) |
| 5 Years | 0 (0.0%) | 28 (90.3%) |
| 6 to 11 Years | 38 (24.2%) | 37 (19.4%) |
| 12 to 14 Years | 28 (13.5%) | 0 (0.0%) |
| 15 Years | 7 (7.8%) | 0 (0.0%) |
| 16 and 17 Years | 0 (0.0%) | 12 (5.3%) |
| 18 to 24 Years | 13 (3.4%) | 21 (5.4%) |
| 25 to 34 Years | 0 (0.0%) | 24 (8.7%) |
| 35 to 44 Years | 60 (15.0%) | 11 (3.1%) |
| 45 to 54 Years | 15 (2.1%) | 48 (7.7%) |
| 55 to 64 Years | 0 (0.0%) | 0 (0.0%) |
| 65 to 74 Years | 0 (0.0%) | 11 (2.5%) |
| 75 Years and over | 7 (2.3%) | 10 (2.8%) |
| Total | 178 (4.9%) | 202 (4.8%) |
Income Above Poverty by Sex and Age in Congers
According to the poverty statistics in Congers, males aged 5 years and females aged under 5 years are the age groups that are most secure financially, with 100.0% of males and 100.0% of females in these age groups living above the poverty line.
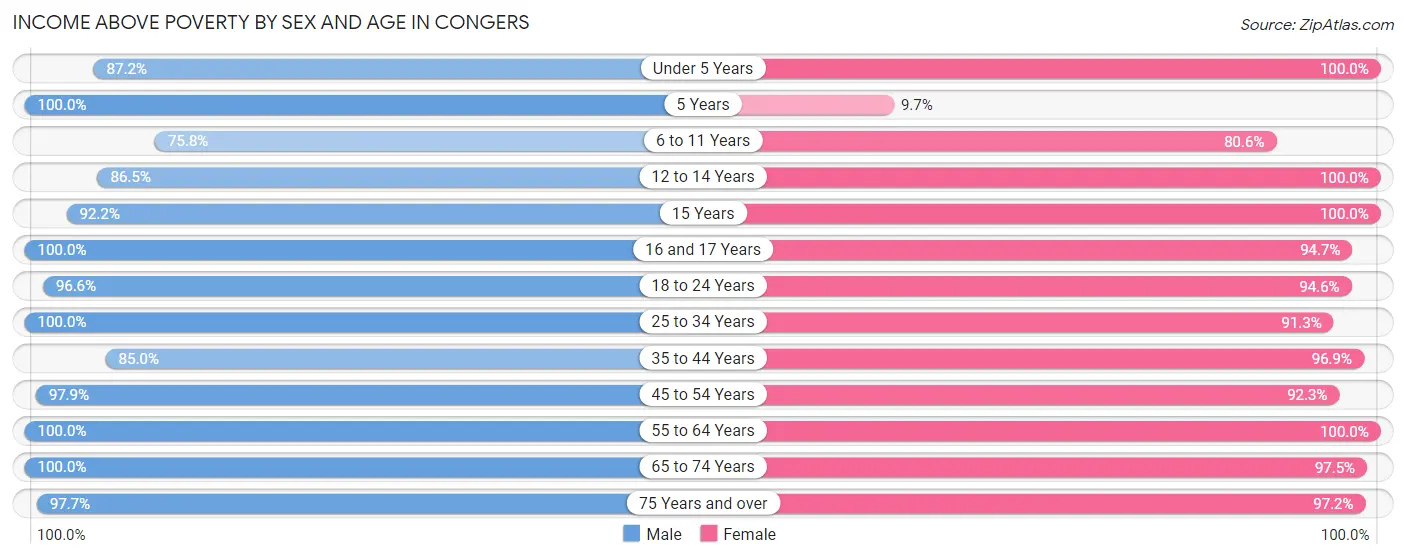
| Age Bracket | Male | Female |
| Under 5 Years | 68 (87.2%) | 281 (100.0%) |
| 5 Years | 42 (100.0%) | 3 (9.7%) |
| 6 to 11 Years | 119 (75.8%) | 154 (80.6%) |
| 12 to 14 Years | 179 (86.5%) | 292 (100.0%) |
| 15 Years | 83 (92.2%) | 38 (100.0%) |
| 16 and 17 Years | 130 (100.0%) | 216 (94.7%) |
| 18 to 24 Years | 371 (96.6%) | 367 (94.6%) |
| 25 to 34 Years | 247 (100.0%) | 251 (91.3%) |
| 35 to 44 Years | 339 (85.0%) | 341 (96.9%) |
| 45 to 54 Years | 702 (97.9%) | 577 (92.3%) |
| 55 to 64 Years | 571 (100.0%) | 726 (100.0%) |
| 65 to 74 Years | 338 (100.0%) | 423 (97.5%) |
| 75 Years and over | 301 (97.7%) | 343 (97.2%) |
| Total | 3,490 (95.2%) | 4,012 (95.2%) |
Income Below Poverty Among Married-Couple Families in Congers
The poverty statistics for married-couple families in Congers show that 2.6% or 46 of the total 1,783 families live below the poverty line. Families with 3 or 4 children have the highest poverty rate of 12.7%, comprising of 24 families. On the other hand, families with no children have the lowest poverty rate of 0.0%, which includes 0 families.
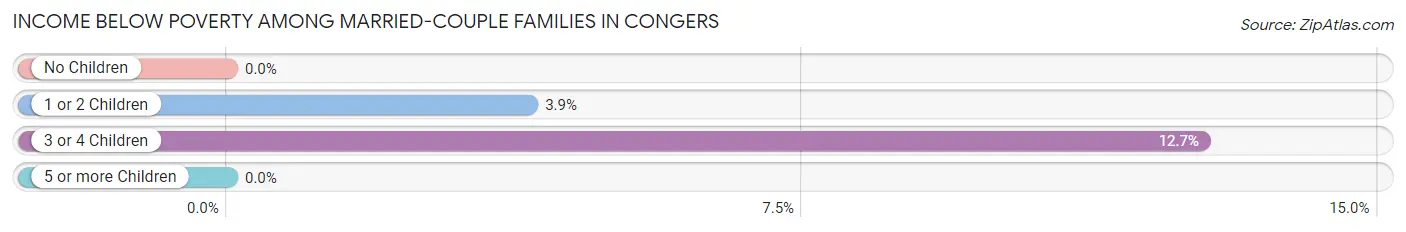
| Children | Above Poverty | Below Poverty |
| No Children | 1,033 (100.0%) | 0 (0.0%) |
| 1 or 2 Children | 539 (96.1%) | 22 (3.9%) |
| 3 or 4 Children | 165 (87.3%) | 24 (12.7%) |
| 5 or more Children | 0 (0.0%) | 0 (0.0%) |
| Total | 1,737 (97.4%) | 46 (2.6%) |
Income Below Poverty Among Single-Parent Households in Congers
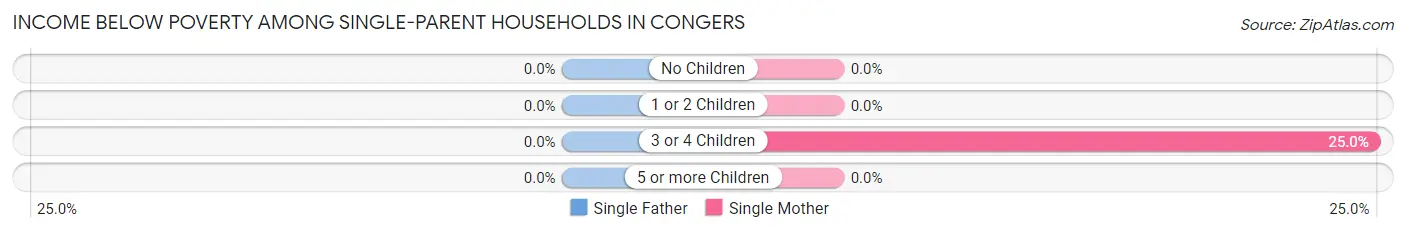
| Children | Single Father | Single Mother |
| No Children | 0 (0.0%) | 0 (0.0%) |
| 1 or 2 Children | 0 (0.0%) | 0 (0.0%) |
| 3 or 4 Children | 0 (0.0%) | 11 (25.0%) |
| 5 or more Children | 0 (0.0%) | 0 (0.0%) |
| Total | 0 (0.0%) | 11 (3.8%) |
Income Below Poverty Among Married-Couple vs Single-Parent Households in Congers
The poverty data for Congers shows that 46 of the married-couple family households (2.6%) and 11 of the single-parent households (3.0%) are living below the poverty level. Within the married-couple family households, those with 3 or 4 children have the highest poverty rate, with 24 households (12.7%) falling below the poverty line. Among the single-parent households, those with 3 or 4 children have the highest poverty rate, with 11 household (23.4%) living below poverty.
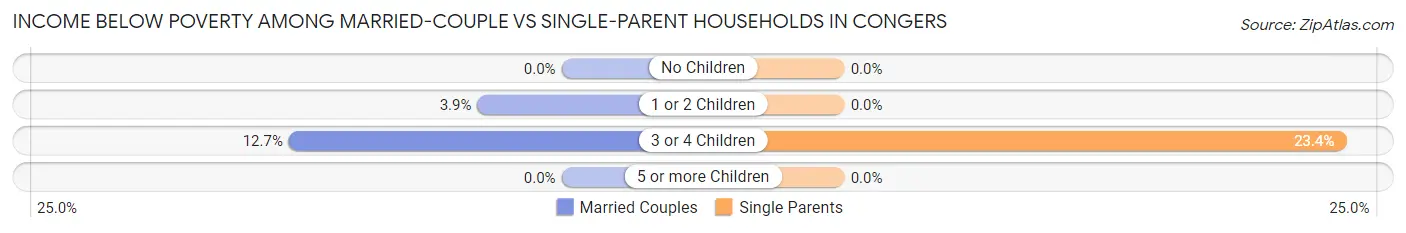
| Children | Married-Couple Families | Single-Parent Households |
| No Children | 0 (0.0%) | 0 (0.0%) |
| 1 or 2 Children | 22 (3.9%) | 0 (0.0%) |
| 3 or 4 Children | 24 (12.7%) | 11 (23.4%) |
| 5 or more Children | 0 (0.0%) | 0 (0.0%) |
| Total | 46 (2.6%) | 11 (3.0%) |
Race in Congers
The most populous races in Congers are White / Caucasian (5,429 | 68.9%), Hispanic or Latino (1,421 | 18.0%), and Two or more Races (974 | 12.4%).
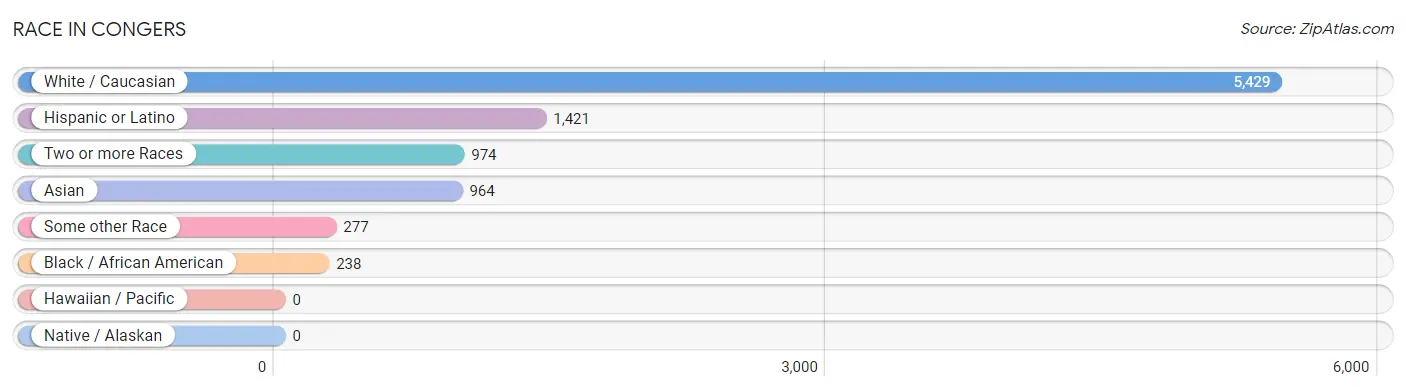
| Race | # Population | % Population |
| Asian | 964 | 12.2% |
| Black / African American | 238 | 3.0% |
| Hawaiian / Pacific | 0 | 0.0% |
| Hispanic or Latino | 1,421 | 18.0% |
| Native / Alaskan | 0 | 0.0% |
| White / Caucasian | 5,429 | 68.9% |
| Two or more Races | 974 | 12.4% |
| Some other Race | 277 | 3.5% |
| Total | 7,882 | 100.0% |
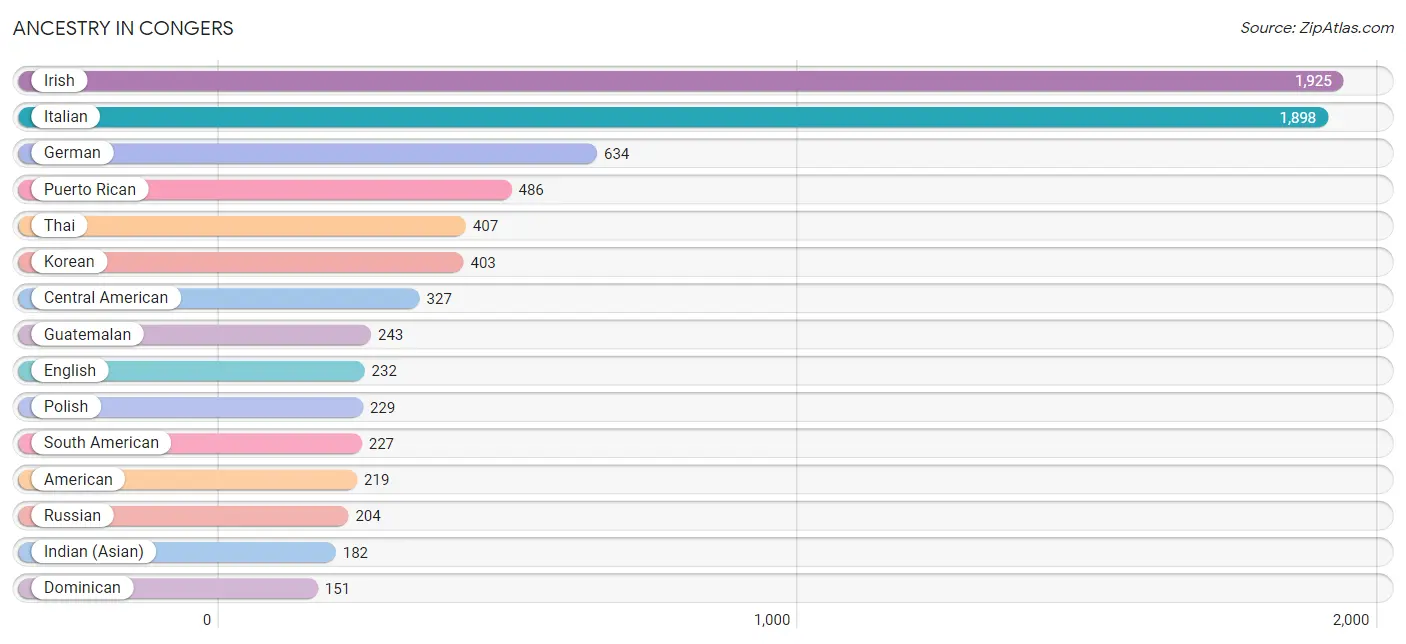
Ancestry in Congers
The most populous ancestries reported in Congers are Irish (1,925 | 24.4%), Italian (1,898 | 24.1%), German (634 | 8.0%), Puerto Rican (486 | 6.2%), and Thai (407 | 5.2%), together accounting for 67.9% of all Congers residents.
| Ancestry | # Population | % Population |
| Albanian | 71 | 0.9% |
| American | 219 | 2.8% |
| Arab | 38 | 0.5% |
| Austrian | 61 | 0.8% |
| Bhutanese | 8 | 0.1% |
| British | 20 | 0.3% |
| Burmese | 75 | 0.9% |
| Canadian | 48 | 0.6% |
| Central American | 327 | 4.2% |
| Cherokee | 18 | 0.2% |
| Colombian | 34 | 0.4% |
| Croatian | 37 | 0.5% |
| Cuban | 79 | 1.0% |
| Cypriot | 9 | 0.1% |
| Czech | 30 | 0.4% |
| Czechoslovakian | 8 | 0.1% |
| Danish | 16 | 0.2% |
| Dominican | 151 | 1.9% |
| Dutch | 12 | 0.2% |
| Eastern European | 65 | 0.8% |
| Ecuadorian | 121 | 1.5% |
| English | 232 | 2.9% |
| European | 40 | 0.5% |
| Finnish | 30 | 0.4% |
| French | 32 | 0.4% |
| French Canadian | 9 | 0.1% |
| German | 634 | 8.0% |
| Greek | 75 | 0.9% |
| Guatemalan | 243 | 3.1% |
| Haitian | 3 | 0.0% |
| Hungarian | 19 | 0.2% |
| Indian (Asian) | 182 | 2.3% |
| Indonesian | 32 | 0.4% |
| Irish | 1,925 | 24.4% |
| Italian | 1,898 | 24.1% |
| Korean | 403 | 5.1% |
| Lebanese | 22 | 0.3% |
| Lithuanian | 17 | 0.2% |
| Maltese | 7 | 0.1% |
| Northern European | 9 | 0.1% |
| Norwegian | 13 | 0.2% |
| Peruvian | 72 | 0.9% |
| Polish | 229 | 2.9% |
| Portuguese | 21 | 0.3% |
| Puerto Rican | 486 | 6.2% |
| Romanian | 10 | 0.1% |
| Russian | 204 | 2.6% |
| Salvadoran | 84 | 1.1% |
| Scandinavian | 102 | 1.3% |
| Scotch-Irish | 19 | 0.2% |
| Scottish | 47 | 0.6% |
| Slovak | 31 | 0.4% |
| South American | 227 | 2.9% |
| Spaniard | 119 | 1.5% |
| Sri Lankan | 24 | 0.3% |
| Swedish | 59 | 0.7% |
| Syrian | 16 | 0.2% |
| Thai | 407 | 5.2% |
| Ukrainian | 18 | 0.2% |
| West Indian | 15 | 0.2% | View All 60 Rows |
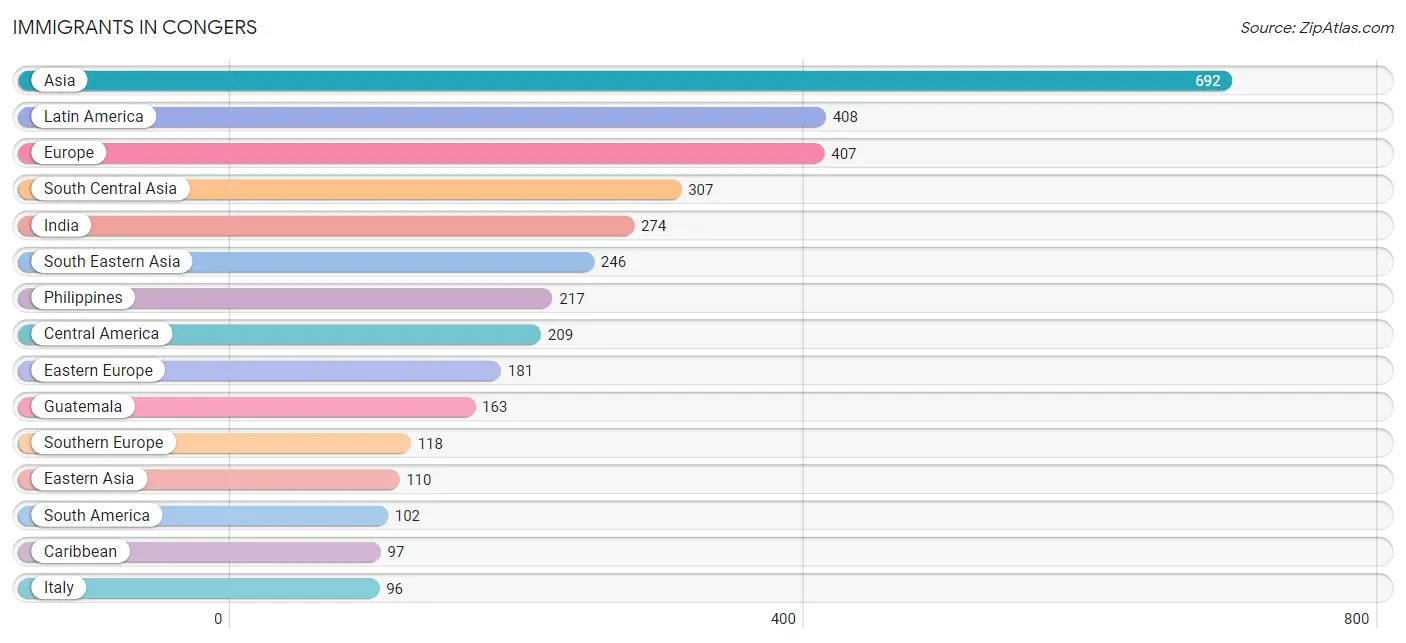
Immigrants in Congers
The most numerous immigrant groups reported in Congers came from Asia (692 | 8.8%), Latin America (408 | 5.2%), Europe (407 | 5.2%), South Central Asia (307 | 3.9%), and India (274 | 3.5%), together accounting for 26.5% of all Congers residents.
| Immigration Origin | # Population | % Population |
| Albania | 50 | 0.6% |
| Asia | 692 | 8.8% |
| Caribbean | 97 | 1.2% |
| Central America | 209 | 2.6% |
| China | 78 | 1.0% |
| Colombia | 34 | 0.4% |
| Croatia | 20 | 0.3% |
| Cuba | 15 | 0.2% |
| Dominican Republic | 33 | 0.4% |
| Eastern Asia | 110 | 1.4% |
| Eastern Europe | 181 | 2.3% |
| Ecuador | 65 | 0.8% |
| El Salvador | 46 | 0.6% |
| Europe | 407 | 5.2% |
| Germany | 44 | 0.6% |
| Greece | 22 | 0.3% |
| Guatemala | 163 | 2.1% |
| Haiti | 18 | 0.2% |
| Hong Kong | 18 | 0.2% |
| India | 274 | 3.5% |
| Ireland | 33 | 0.4% |
| Italy | 96 | 1.2% |
| Jamaica | 31 | 0.4% |
| Japan | 8 | 0.1% |
| Korea | 24 | 0.3% |
| Kuwait | 7 | 0.1% |
| Latin America | 408 | 5.2% |
| Northern Europe | 64 | 0.8% |
| Peru | 3 | 0.0% |
| Philippines | 217 | 2.8% |
| Poland | 21 | 0.3% |
| Russia | 31 | 0.4% |
| South America | 102 | 1.3% |
| South Central Asia | 307 | 3.9% |
| South Eastern Asia | 246 | 3.1% |
| Southern Europe | 118 | 1.5% |
| Thailand | 9 | 0.1% |
| Turkey | 5 | 0.1% |
| Ukraine | 19 | 0.2% |
| Vietnam | 20 | 0.3% |
| Western Asia | 29 | 0.4% |
| Western Europe | 44 | 0.6% | View All 42 Rows |
Sex and Age in Congers
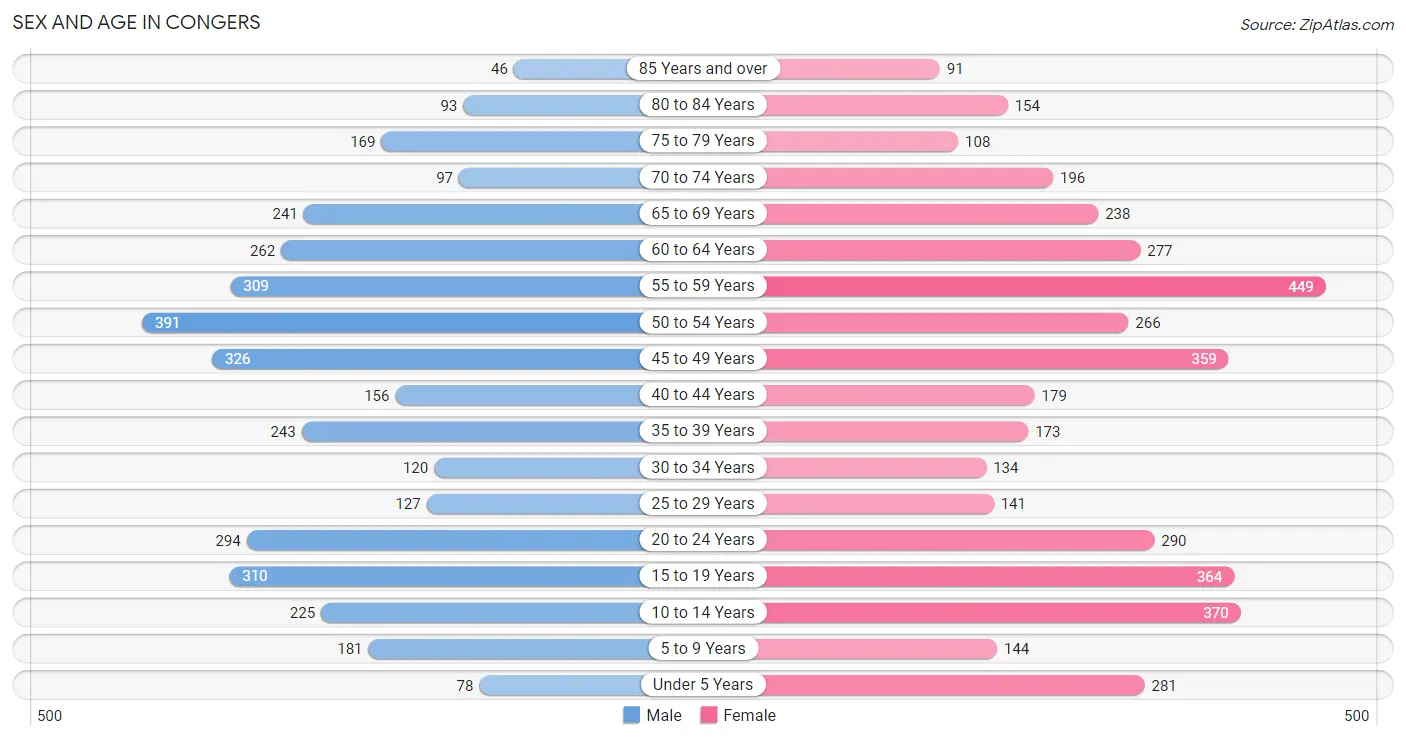
Sex and Age in Congers
The most populous age groups in Congers are 50 to 54 Years (391 | 10.7%) for men and 55 to 59 Years (449 | 10.6%) for women.
| Age Bracket | Male | Female |
| Under 5 Years | 78 (2.1%) | 281 (6.7%) |
| 5 to 9 Years | 181 (4.9%) | 144 (3.4%) |
| 10 to 14 Years | 225 (6.1%) | 370 (8.8%) |
| 15 to 19 Years | 310 (8.5%) | 364 (8.6%) |
| 20 to 24 Years | 294 (8.0%) | 290 (6.9%) |
| 25 to 29 Years | 127 (3.5%) | 141 (3.4%) |
| 30 to 34 Years | 120 (3.3%) | 134 (3.2%) |
| 35 to 39 Years | 243 (6.6%) | 173 (4.1%) |
| 40 to 44 Years | 156 (4.3%) | 179 (4.3%) |
| 45 to 49 Years | 326 (8.9%) | 359 (8.5%) |
| 50 to 54 Years | 391 (10.7%) | 266 (6.3%) |
| 55 to 59 Years | 309 (8.4%) | 449 (10.6%) |
| 60 to 64 Years | 262 (7.1%) | 277 (6.6%) |
| 65 to 69 Years | 241 (6.6%) | 238 (5.7%) |
| 70 to 74 Years | 97 (2.6%) | 196 (4.6%) |
| 75 to 79 Years | 169 (4.6%) | 108 (2.6%) |
| 80 to 84 Years | 93 (2.5%) | 154 (3.6%) |
| 85 Years and over | 46 (1.3%) | 91 (2.2%) |
| Total | 3,668 (100.0%) | 4,214 (100.0%) |
Families and Households in Congers
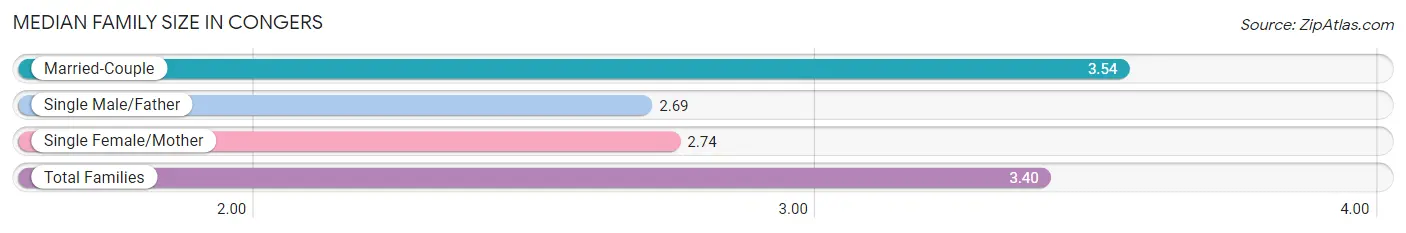
Median Family Size in Congers
The median family size in Congers is 3.40 persons per family, with married-couple families (1,783 | 82.9%) accounting for the largest median family size of 3.54 persons per family. On the other hand, single male/father families (78 | 3.6%) represent the smallest median family size with 2.69 persons per family.
| Family Type | # Families | Family Size |
| Married-Couple | 1,783 (82.9%) | 3.54 |
| Single Male/Father | 78 (3.6%) | 2.69 |
| Single Female/Mother | 289 (13.4%) | 2.74 |
| Total Families | 2,150 (100.0%) | 3.40 |
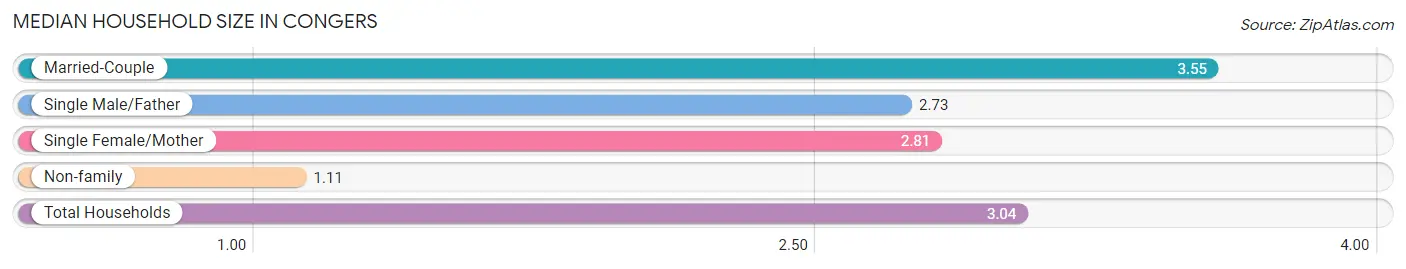
Median Household Size in Congers
The median household size in Congers is 3.04 persons per household, with married-couple households (1,783 | 69.4%) accounting for the largest median household size of 3.55 persons per household. non-family households (421 | 16.4%) represent the smallest median household size with 1.11 persons per household.
| Household Type | # Households | Household Size |
| Married-Couple | 1,783 (69.4%) | 3.55 |
| Single Male/Father | 78 (3.0%) | 2.73 |
| Single Female/Mother | 289 (11.2%) | 2.81 |
| Non-family | 421 (16.4%) | 1.11 |
| Total Households | 2,571 (100.0%) | 3.04 |
Household Size by Marriage Status in Congers
Out of a total of 2,571 households in Congers, 2,150 (83.6%) are family households, while 421 (16.4%) are nonfamily households. The most numerous type of family households are 2-person households, comprising 770, and the most common type of nonfamily households are 1-person households, comprising 372.
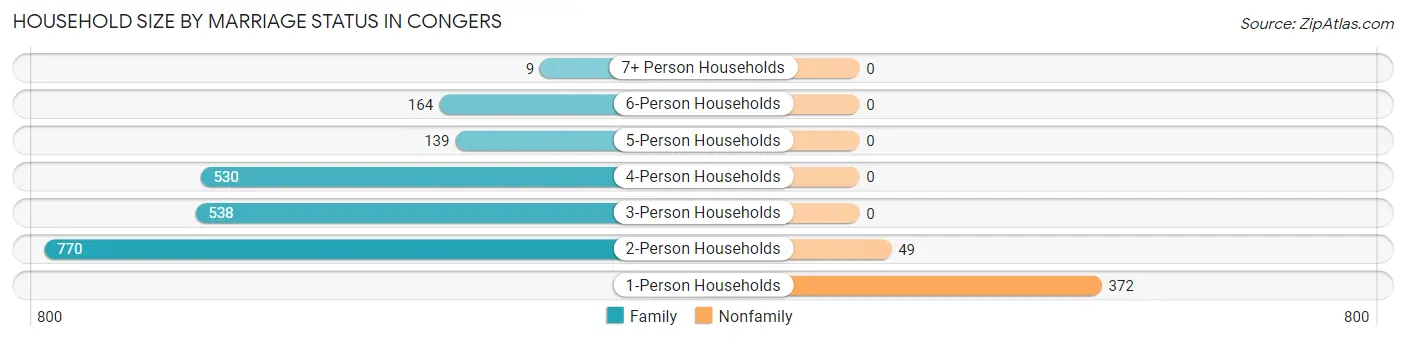
| Household Size | Family Households | Nonfamily Households |
| 1-Person Households | - | 372 (14.5%) |
| 2-Person Households | 770 (29.9%) | 49 (1.9%) |
| 3-Person Households | 538 (20.9%) | 0 (0.0%) |
| 4-Person Households | 530 (20.6%) | 0 (0.0%) |
| 5-Person Households | 139 (5.4%) | 0 (0.0%) |
| 6-Person Households | 164 (6.4%) | 0 (0.0%) |
| 7+ Person Households | 9 (0.4%) | 0 (0.0%) |
| Total | 2,150 (83.6%) | 421 (16.4%) |
Female Fertility in Congers
Fertility by Age in Congers
Average fertility rate in Congers is 34.0 births per 1,000 women. Women in the age bracket of 35 to 50 years have the highest fertility rate with 48.0 births per 1,000 women. Women in the age bracket of 35 to 50 years acount for 65.0% of all women with births.
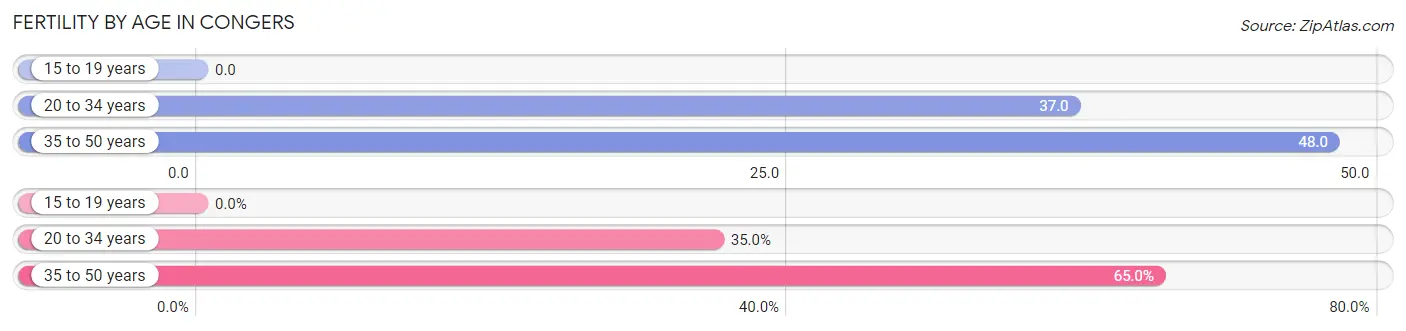
| Age Bracket | Women with Births | Births / 1,000 Women |
| 15 to 19 years | 0 (0.0%) | 0.0 |
| 20 to 34 years | 21 (35.0%) | 37.0 |
| 35 to 50 years | 39 (65.0%) | 48.0 |
| Total | 60 (100.0%) | 34.0 |
Fertility by Age by Marriage Status in Congers
83.3% of women with births (60) in Congers are married. The highest percentage of unmarried women with births falls into 35 to 50 years age bracket with 25.6% of them unmarried at the time of birth, while the lowest percentage of unmarried women with births belong to 20 to 34 years age bracket with 0.0% of them unmarried.
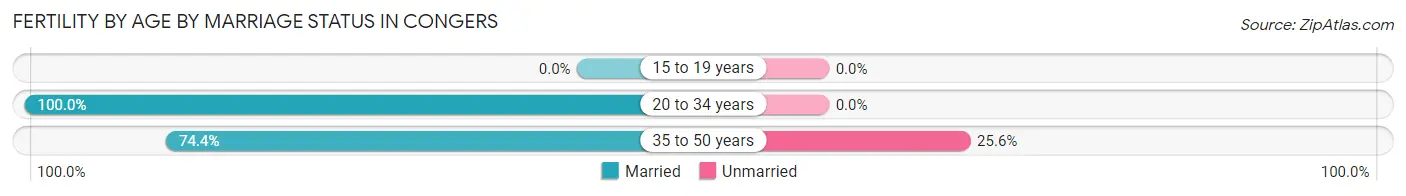
| Age Bracket | Married | Unmarried |
| 15 to 19 years | 0 (0.0%) | 0 (0.0%) |
| 20 to 34 years | 21 (100.0%) | 0 (0.0%) |
| 35 to 50 years | 29 (74.4%) | 10 (25.6%) |
| Total | 50 (83.3%) | 10 (16.7%) |
Fertility by Education in Congers
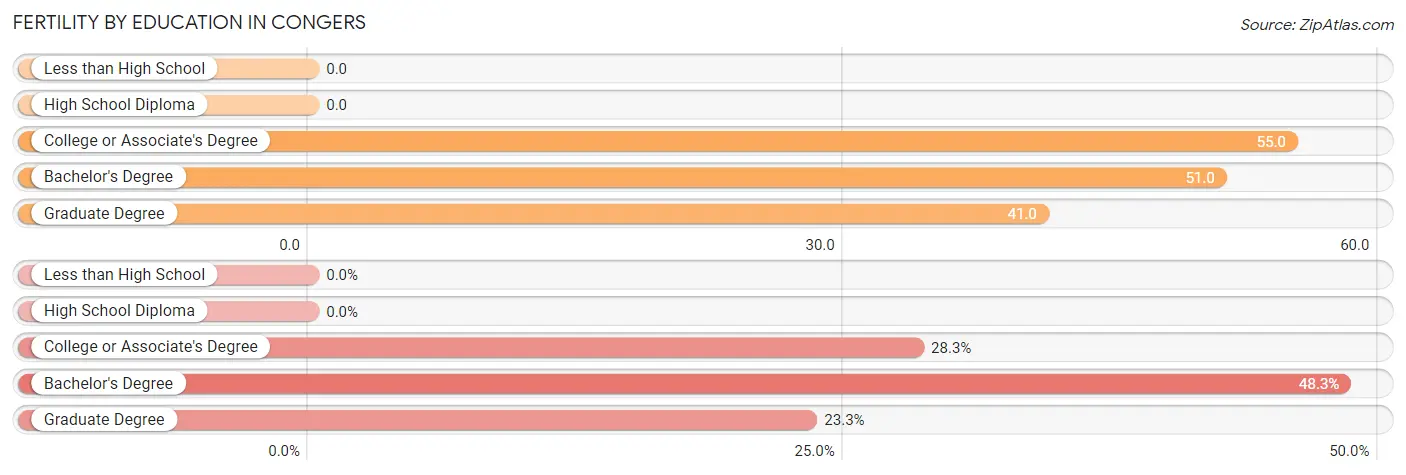
| Educational Attainment | Women with Births | Births / 1,000 Women |
| Less than High School | 0 (0.0%) | 0.0 |
| High School Diploma | 0 (0.0%) | 0.0 |
| College or Associate's Degree | 17 (28.3%) | 55.0 |
| Bachelor's Degree | 29 (48.3%) | 51.0 |
| Graduate Degree | 14 (23.3%) | 41.0 |
| Total | 60 (100.0%) | 34.0 |
Fertility by Education by Marriage Status in Congers
16.7% of women with births in Congers are unmarried. Women with the educational attainment of bachelor's degree are most likely to be married with 100.0% of them married at childbirth, while women with the educational attainment of college or associate's degree are least likely to be married with 58.8% of them unmarried at childbirth.
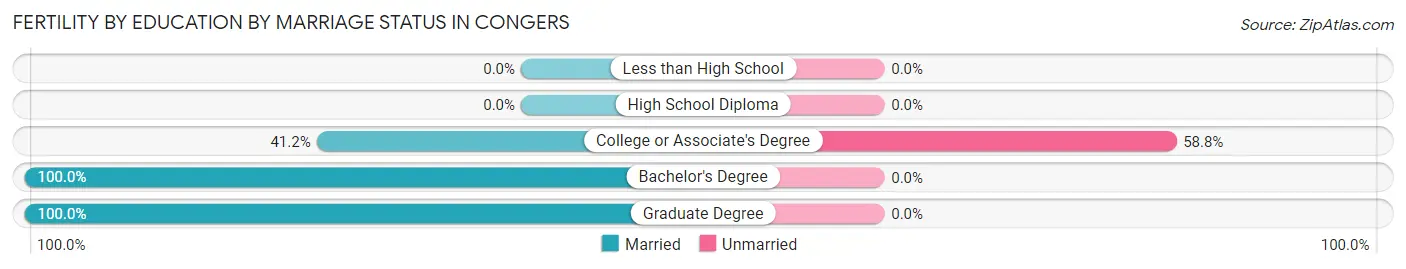
| Educational Attainment | Married | Unmarried |
| Less than High School | 0 (0.0%) | 0 (0.0%) |
| High School Diploma | 0 (0.0%) | 0 (0.0%) |
| College or Associate's Degree | 7 (41.2%) | 10 (58.8%) |
| Bachelor's Degree | 29 (100.0%) | 0 (0.0%) |
| Graduate Degree | 14 (100.0%) | 0 (0.0%) |
| Total | 50 (83.3%) | 10 (16.7%) |
Employment Characteristics in Congers
Employment by Class of Employer in Congers
Among the 3,976 employed individuals in Congers, private company employees (2,406 | 60.5%), local government employees (543 | 13.7%), and not-for-profit organizations (294 | 7.4%) make up the most common classes of employment.
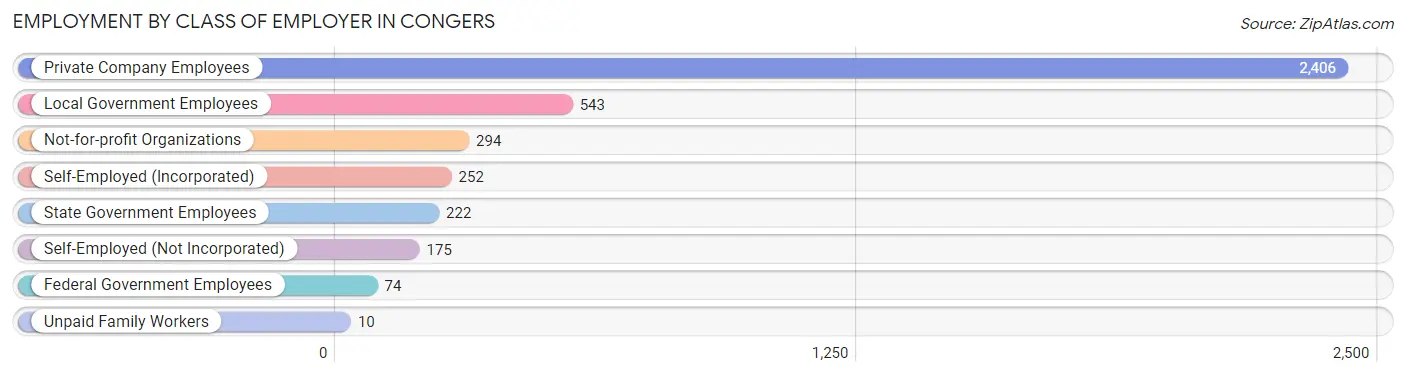
| Employer Class | # Employees | % Employees |
| Private Company Employees | 2,406 | 60.5% |
| Self-Employed (Incorporated) | 252 | 6.3% |
| Self-Employed (Not Incorporated) | 175 | 4.4% |
| Not-for-profit Organizations | 294 | 7.4% |
| Local Government Employees | 543 | 13.7% |
| State Government Employees | 222 | 5.6% |
| Federal Government Employees | 74 | 1.9% |
| Unpaid Family Workers | 10 | 0.3% |
| Total | 3,976 | 100.0% |
Employment Status by Age in Congers
According to the labor force statistics for Congers, out of the total population over 16 years of age (6,475), 65.3% or 4,228 individuals are in the labor force, with 4.8% or 203 of them unemployed. The age group with the highest labor force participation rate is 30 to 34 years, with 97.6% or 248 individuals in the labor force. Within the labor force, the 16 to 19 years age range has the highest percentage of unemployed individuals, with 15.0% or 9 of them being unemployed.
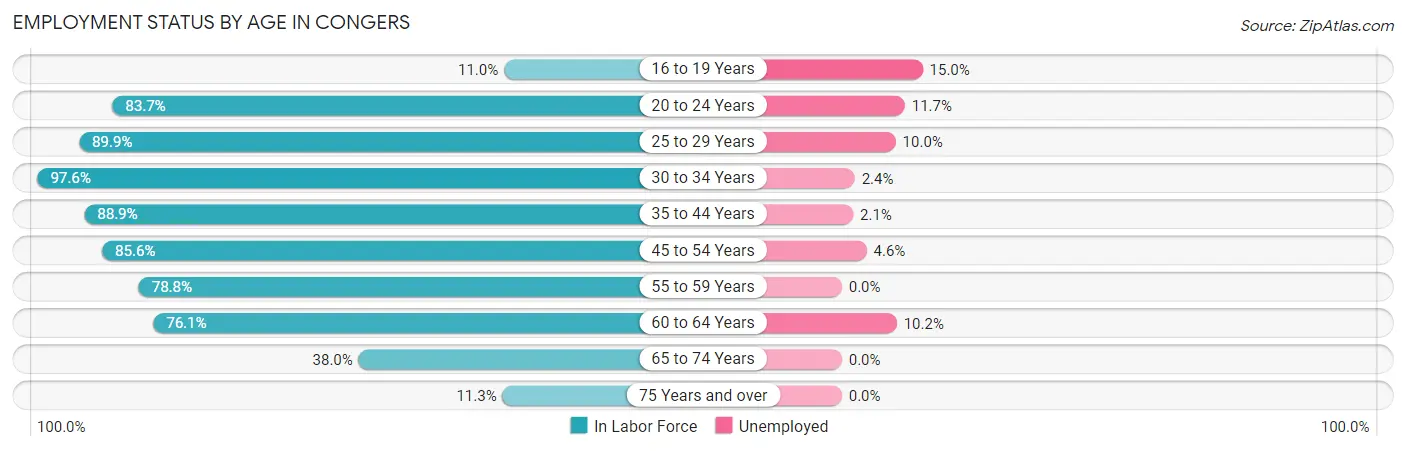
| Age Bracket | In Labor Force | Unemployed |
| 16 to 19 Years | 60 (11.0%) | 9 (15.0%) |
| 20 to 24 Years | 489 (83.7%) | 57 (11.7%) |
| 25 to 29 Years | 241 (89.9%) | 24 (10.0%) |
| 30 to 34 Years | 248 (97.6%) | 6 (2.4%) |
| 35 to 44 Years | 668 (88.9%) | 14 (2.1%) |
| 45 to 54 Years | 1,149 (85.6%) | 53 (4.6%) |
| 55 to 59 Years | 597 (78.8%) | 0 (0.0%) |
| 60 to 64 Years | 410 (76.1%) | 42 (10.2%) |
| 65 to 74 Years | 293 (38.0%) | 0 (0.0%) |
| 75 Years and over | 75 (11.3%) | 0 (0.0%) |
| Total | 4,228 (65.3%) | 203 (4.8%) |
Employment Status by Educational Attainment in Congers
According to labor force statistics for Congers, 84.7% of individuals (3,313) out of the total population between 25 and 64 years of age (3,912) are in the labor force, with 4.2% or 139 of them being unemployed. The group with the highest labor force participation rate are those with the educational attainment of college / associate degree, with 87.9% or 853 individuals in the labor force. Within the labor force, individuals with college / associate degree education have the highest percentage of unemployment, with 11.5% or 98 of them being unemployed.
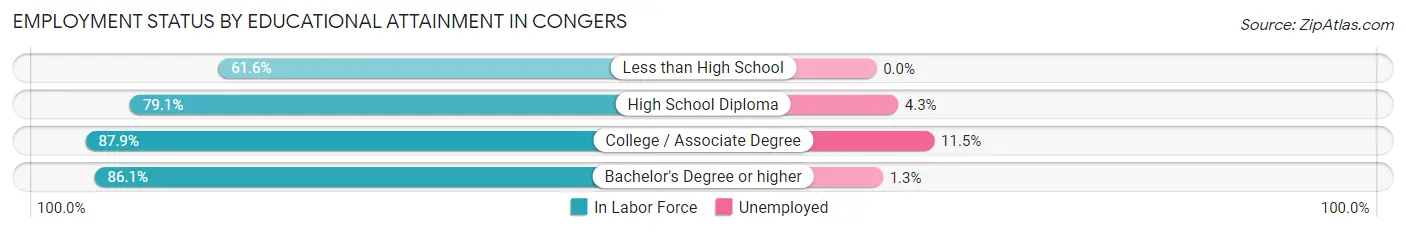
| Educational Attainment | In Labor Force | Unemployed |
| Less than High School | 106 (61.6%) | 0 (0.0%) |
| High School Diploma | 352 (79.1%) | 19 (4.3%) |
| College / Associate Degree | 853 (87.9%) | 112 (11.5%) |
| Bachelor's Degree or higher | 2,002 (86.1%) | 30 (1.3%) |
| Total | 3,313 (84.7%) | 164 (4.2%) |
Employment Occupations by Sex in Congers
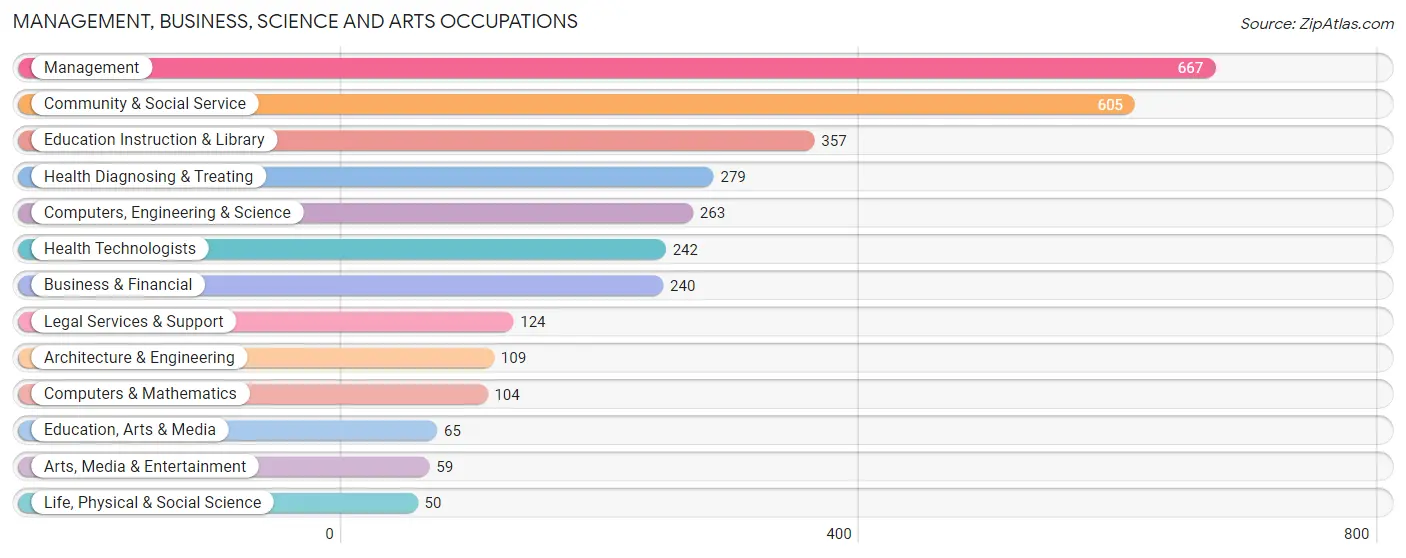
Management, Business, Science and Arts Occupations
The most common Management, Business, Science and Arts occupations in Congers are Management (667 | 16.6%), Community & Social Service (605 | 15.0%), Education Instruction & Library (357 | 8.9%), Health Diagnosing & Treating (279 | 6.9%), and Computers, Engineering & Science (263 | 6.5%).
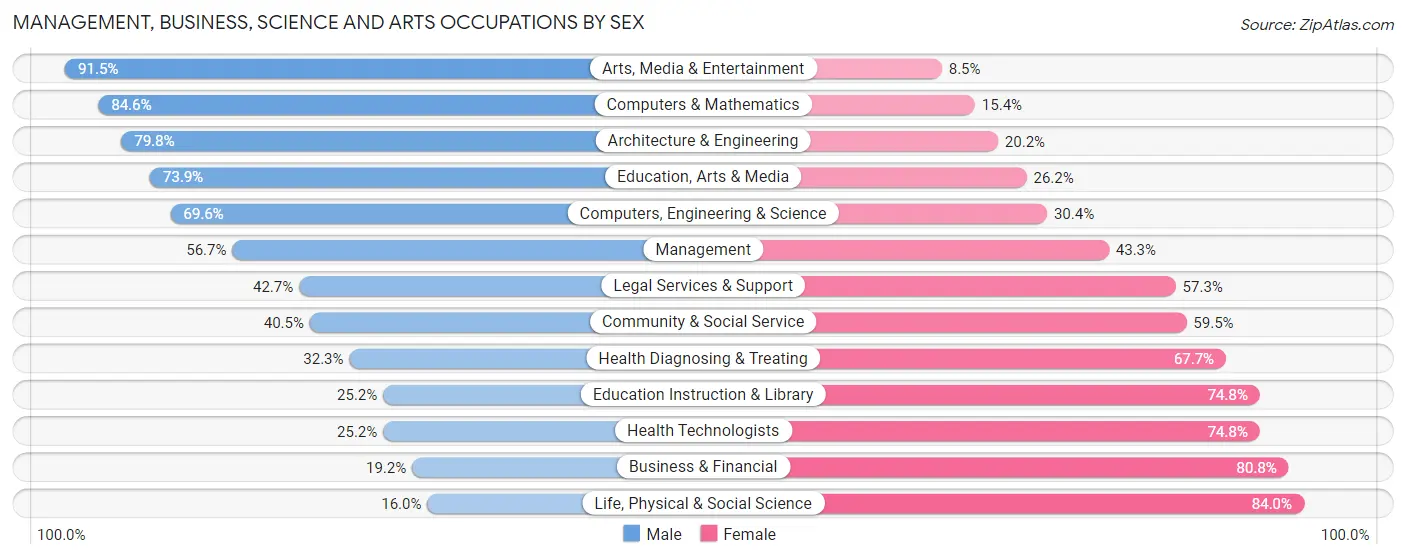
Management, Business, Science and Arts Occupations by Sex
Within the Management, Business, Science and Arts occupations in Congers, the most male-oriented occupations are Arts, Media & Entertainment (91.5%), Computers & Mathematics (84.6%), and Architecture & Engineering (79.8%), while the most female-oriented occupations are Life, Physical & Social Science (84.0%), Business & Financial (80.8%), and Education Instruction & Library (74.8%).
| Occupation | Male | Female |
| Management | 378 (56.7%) | 289 (43.3%) |
| Business & Financial | 46 (19.2%) | 194 (80.8%) |
| Computers, Engineering & Science | 183 (69.6%) | 80 (30.4%) |
| Computers & Mathematics | 88 (84.6%) | 16 (15.4%) |
| Architecture & Engineering | 87 (79.8%) | 22 (20.2%) |
| Life, Physical & Social Science | 8 (16.0%) | 42 (84.0%) |
| Community & Social Service | 245 (40.5%) | 360 (59.5%) |
| Education, Arts & Media | 48 (73.9%) | 17 (26.2%) |
| Legal Services & Support | 53 (42.7%) | 71 (57.3%) |
| Education Instruction & Library | 90 (25.2%) | 267 (74.8%) |
| Arts, Media & Entertainment | 54 (91.5%) | 5 (8.5%) |
| Health Diagnosing & Treating | 90 (32.3%) | 189 (67.7%) |
| Health Technologists | 61 (25.2%) | 181 (74.8%) |
| Total (Category) | 942 (45.9%) | 1,112 (54.1%) |
| Total (Overall) | 2,094 (52.0%) | 1,931 (48.0%) |
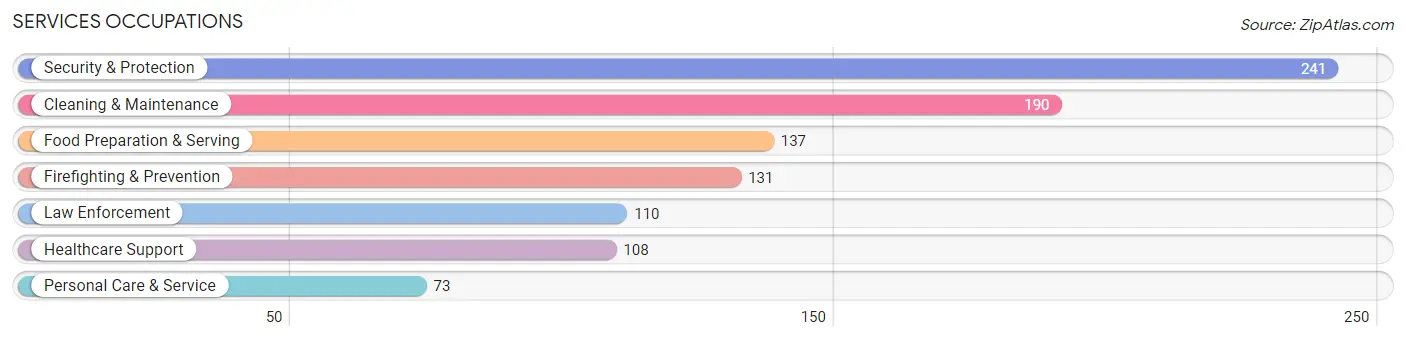
Services Occupations
The most common Services occupations in Congers are Security & Protection (241 | 6.0%), Cleaning & Maintenance (190 | 4.7%), Food Preparation & Serving (137 | 3.4%), Firefighting & Prevention (131 | 3.3%), and Law Enforcement (110 | 2.7%).
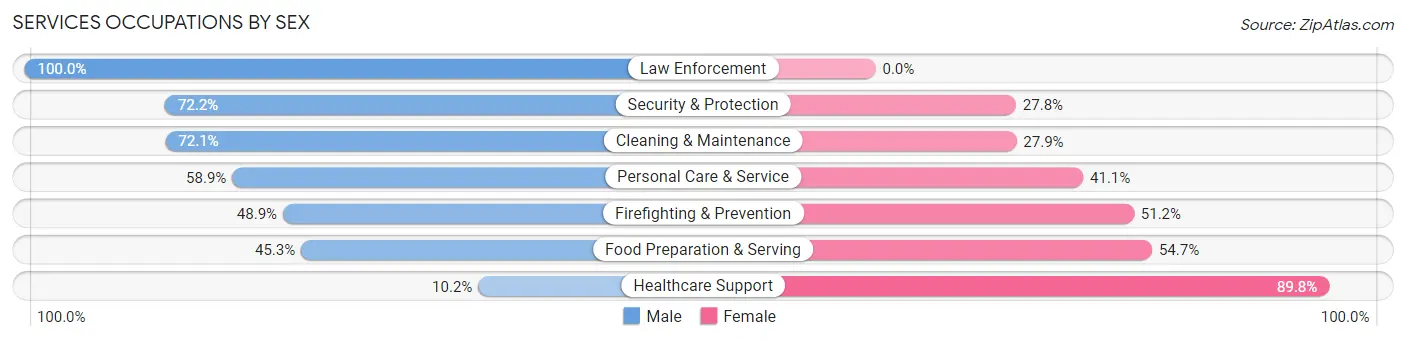
Services Occupations by Sex
Within the Services occupations in Congers, the most male-oriented occupations are Law Enforcement (100.0%), Security & Protection (72.2%), and Cleaning & Maintenance (72.1%), while the most female-oriented occupations are Healthcare Support (89.8%), Food Preparation & Serving (54.7%), and Firefighting & Prevention (51.1%).
| Occupation | Male | Female |
| Healthcare Support | 11 (10.2%) | 97 (89.8%) |
| Security & Protection | 174 (72.2%) | 67 (27.8%) |
| Firefighting & Prevention | 64 (48.8%) | 67 (51.1%) |
| Law Enforcement | 110 (100.0%) | 0 (0.0%) |
| Food Preparation & Serving | 62 (45.3%) | 75 (54.7%) |
| Cleaning & Maintenance | 137 (72.1%) | 53 (27.9%) |
| Personal Care & Service | 43 (58.9%) | 30 (41.1%) |
| Total (Category) | 427 (57.0%) | 322 (43.0%) |
| Total (Overall) | 2,094 (52.0%) | 1,931 (48.0%) |
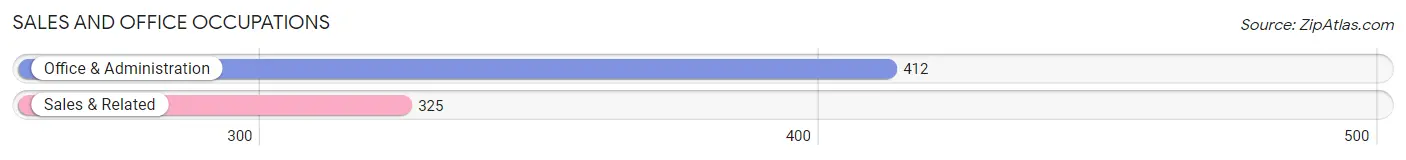
Sales and Office Occupations
The most common Sales and Office occupations in Congers are Office & Administration (412 | 10.2%), and Sales & Related (325 | 8.1%).
Sales and Office Occupations by Sex
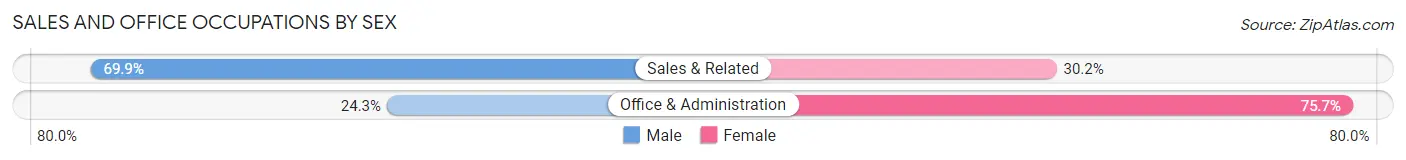
| Occupation | Male | Female |
| Sales & Related | 227 (69.9%) | 98 (30.1%) |
| Office & Administration | 100 (24.3%) | 312 (75.7%) |
| Total (Category) | 327 (44.4%) | 410 (55.6%) |
| Total (Overall) | 2,094 (52.0%) | 1,931 (48.0%) |
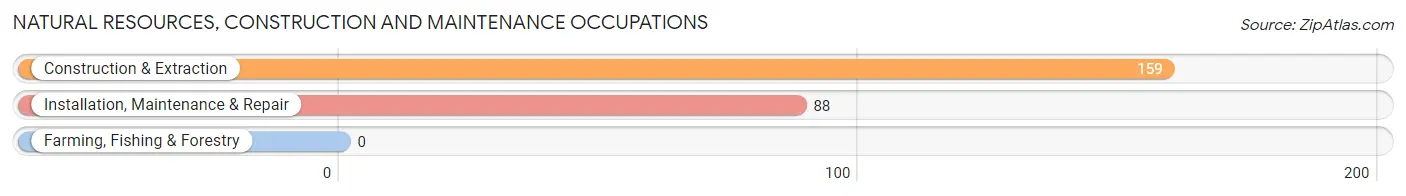
Natural Resources, Construction and Maintenance Occupations
The most common Natural Resources, Construction and Maintenance occupations in Congers are Construction & Extraction (159 | 4.0%), and Installation, Maintenance & Repair (88 | 2.2%).
Natural Resources, Construction and Maintenance Occupations by Sex
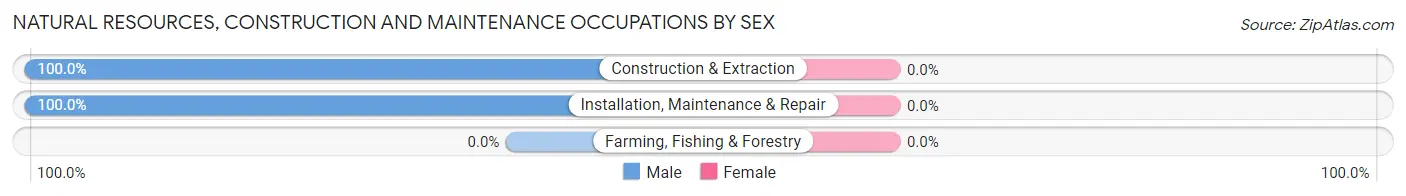
| Occupation | Male | Female |
| Farming, Fishing & Forestry | 0 (0.0%) | 0 (0.0%) |
| Construction & Extraction | 159 (100.0%) | 0 (0.0%) |
| Installation, Maintenance & Repair | 88 (100.0%) | 0 (0.0%) |
| Total (Category) | 247 (100.0%) | 0 (0.0%) |
| Total (Overall) | 2,094 (52.0%) | 1,931 (48.0%) |
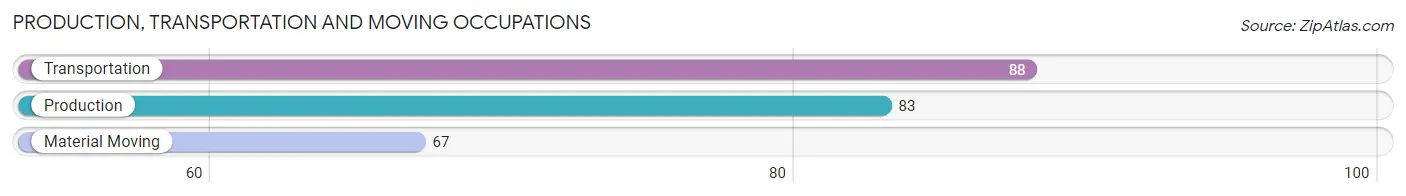
Production, Transportation and Moving Occupations
The most common Production, Transportation and Moving occupations in Congers are Transportation (88 | 2.2%), Production (83 | 2.1%), and Material Moving (67 | 1.7%).
Production, Transportation and Moving Occupations by Sex
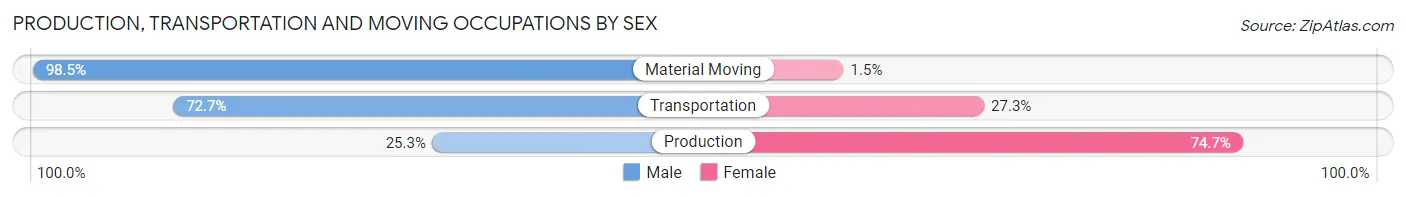
| Occupation | Male | Female |
| Production | 21 (25.3%) | 62 (74.7%) |
| Transportation | 64 (72.7%) | 24 (27.3%) |
| Material Moving | 66 (98.5%) | 1 (1.5%) |
| Total (Category) | 151 (63.4%) | 87 (36.5%) |
| Total (Overall) | 2,094 (52.0%) | 1,931 (48.0%) |
Employment Industries by Sex in Congers
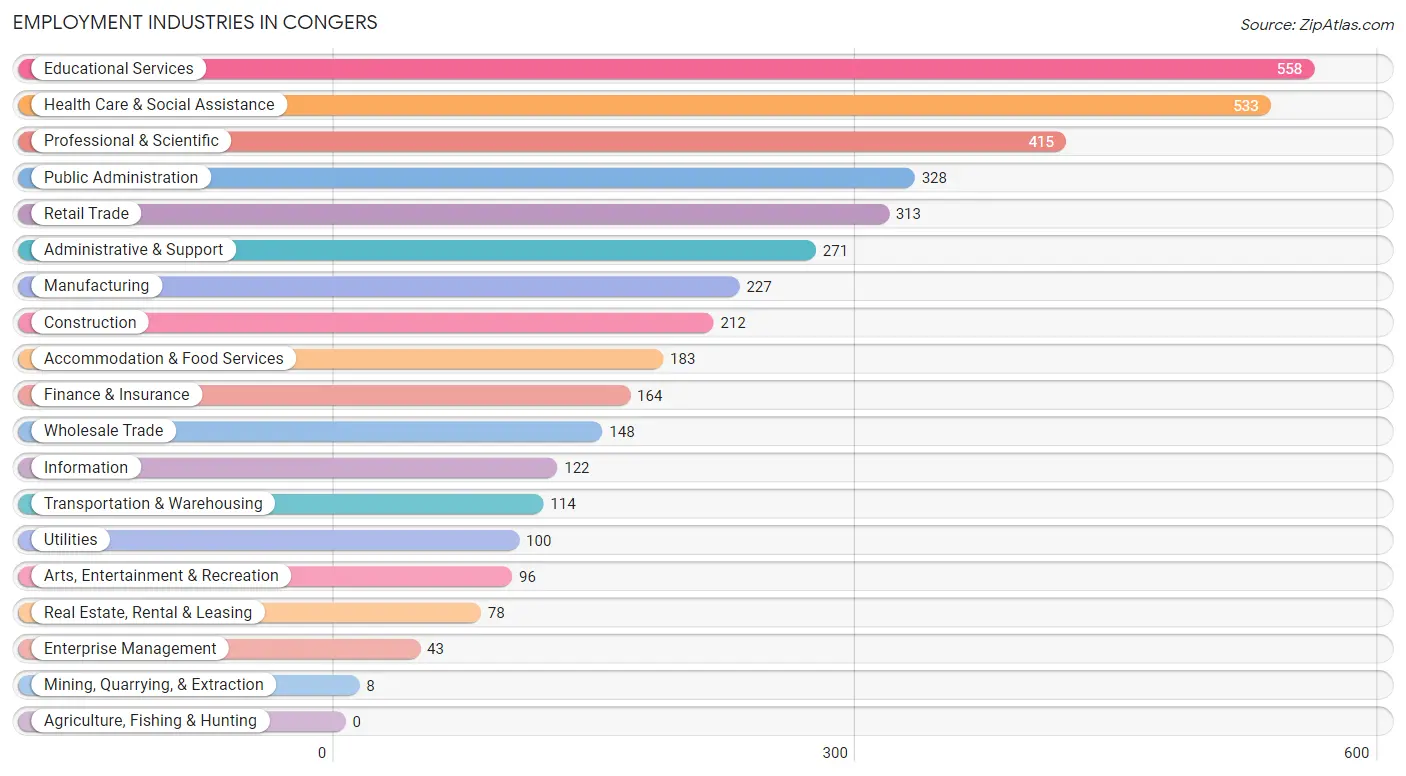
Employment Industries in Congers
The major employment industries in Congers include Educational Services (558 | 13.9%), Health Care & Social Assistance (533 | 13.2%), Professional & Scientific (415 | 10.3%), Public Administration (328 | 8.2%), and Retail Trade (313 | 7.8%).
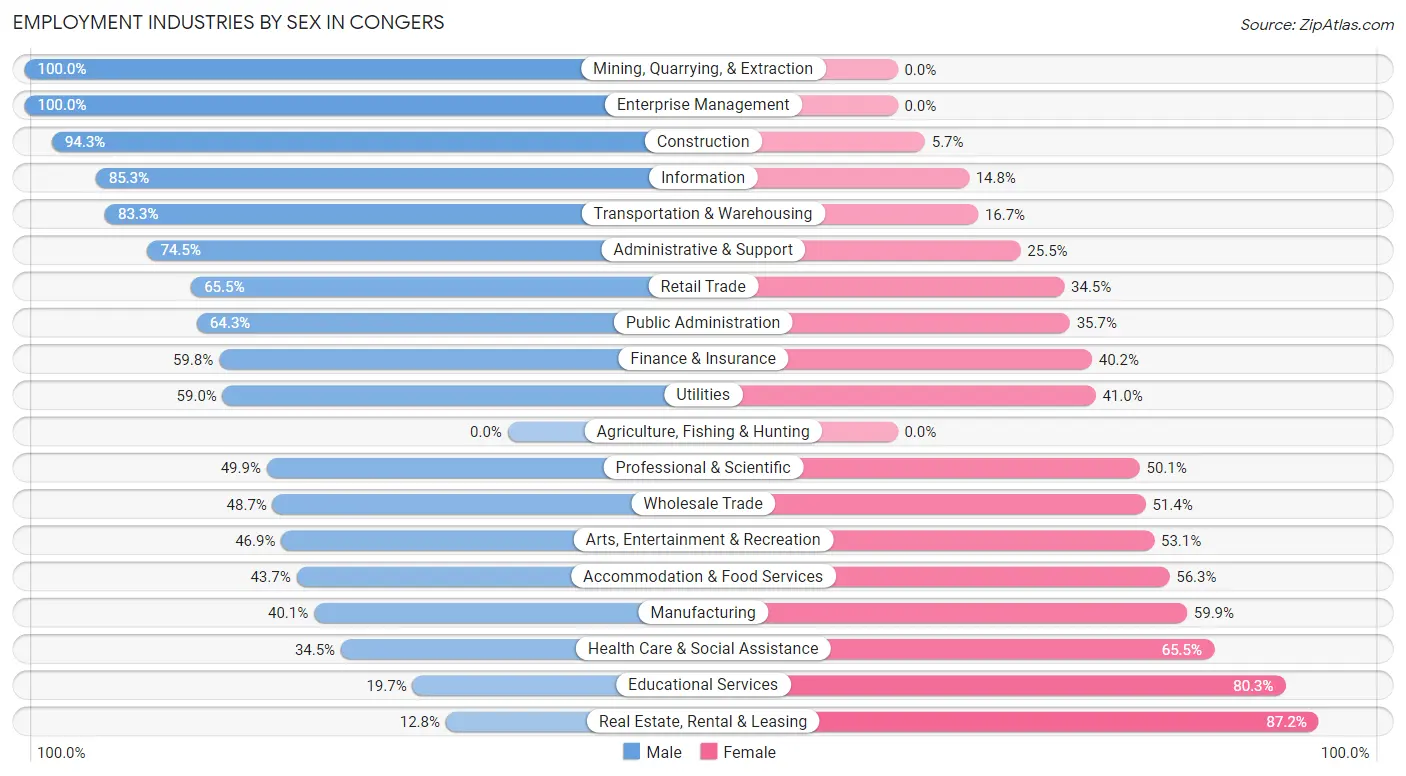
Employment Industries by Sex in Congers
The Congers industries that see more men than women are Mining, Quarrying, & Extraction (100.0%), Enterprise Management (100.0%), and Construction (94.3%), whereas the industries that tend to have a higher number of women are Real Estate, Rental & Leasing (87.2%), Educational Services (80.3%), and Health Care & Social Assistance (65.5%).
| Industry | Male | Female |
| Agriculture, Fishing & Hunting | 0 (0.0%) | 0 (0.0%) |
| Mining, Quarrying, & Extraction | 8 (100.0%) | 0 (0.0%) |
| Construction | 200 (94.3%) | 12 (5.7%) |
| Manufacturing | 91 (40.1%) | 136 (59.9%) |
| Wholesale Trade | 72 (48.6%) | 76 (51.3%) |
| Retail Trade | 205 (65.5%) | 108 (34.5%) |
| Transportation & Warehousing | 95 (83.3%) | 19 (16.7%) |
| Utilities | 59 (59.0%) | 41 (41.0%) |
| Information | 104 (85.3%) | 18 (14.7%) |
| Finance & Insurance | 98 (59.8%) | 66 (40.2%) |
| Real Estate, Rental & Leasing | 10 (12.8%) | 68 (87.2%) |
| Professional & Scientific | 207 (49.9%) | 208 (50.1%) |
| Enterprise Management | 43 (100.0%) | 0 (0.0%) |
| Administrative & Support | 202 (74.5%) | 69 (25.5%) |
| Educational Services | 110 (19.7%) | 448 (80.3%) |
| Health Care & Social Assistance | 184 (34.5%) | 349 (65.5%) |
| Arts, Entertainment & Recreation | 45 (46.9%) | 51 (53.1%) |
| Accommodation & Food Services | 80 (43.7%) | 103 (56.3%) |
| Public Administration | 211 (64.3%) | 117 (35.7%) |
| Total | 2,094 (52.0%) | 1,931 (48.0%) |
Education in Congers
School Enrollment in Congers
The most common levels of schooling among the 2,126 students in Congers are high school (798 | 37.5%), middle school (391 | 18.4%), and college / undergraduate (296 | 13.9%).
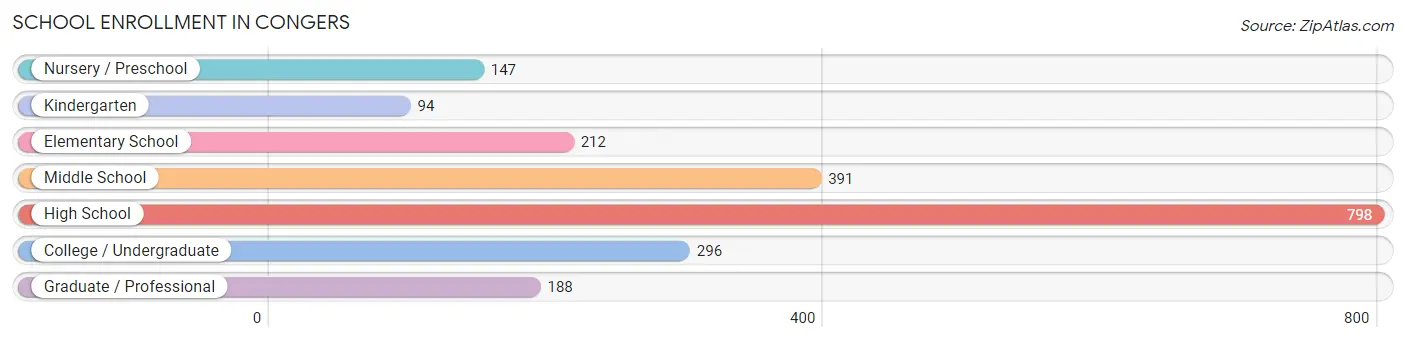
| School Level | # Students | % Students |
| Nursery / Preschool | 147 | 6.9% |
| Kindergarten | 94 | 4.4% |
| Elementary School | 212 | 10.0% |
| Middle School | 391 | 18.4% |
| High School | 798 | 37.5% |
| College / Undergraduate | 296 | 13.9% |
| Graduate / Professional | 188 | 8.8% |
| Total | 2,126 | 100.0% |
School Enrollment by Age by Funding Source in Congers
Out of a total of 2,126 students who are enrolled in schools in Congers, 364 (17.1%) attend a private institution, while the remaining 1,762 (82.9%) are enrolled in public schools. The age group of 25 to 34 year olds has the highest likelihood of being enrolled in private schools, with 50 (87.7% in the age bracket) enrolled. Conversely, the age group of 15 to 17 year olds has the lowest likelihood of being enrolled in a private school, with 461 (94.9% in the age bracket) attending a public institution.
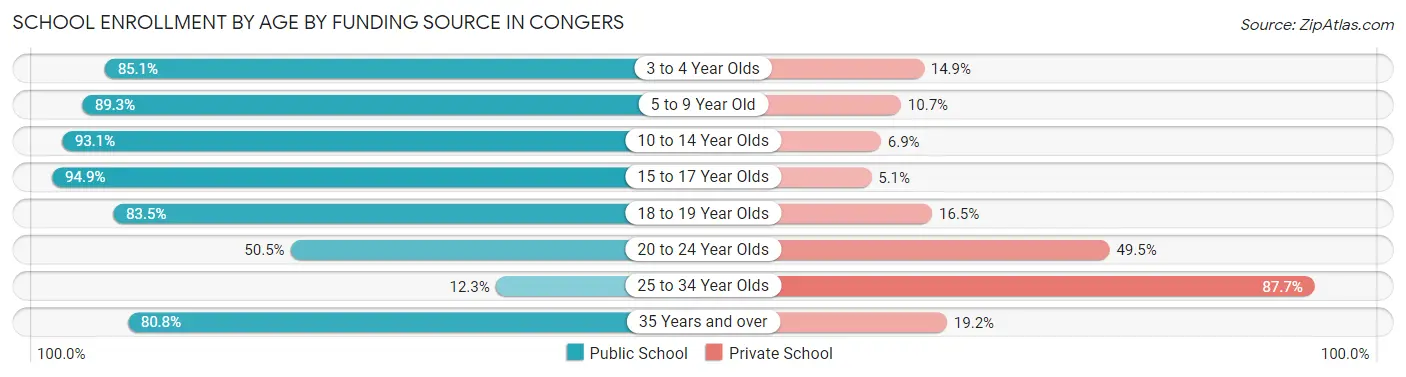
| Age Bracket | Public School | Private School |
| 3 to 4 Year Olds | 114 (85.1%) | 20 (14.9%) |
| 5 to 9 Year Old | 285 (89.3%) | 34 (10.7%) |
| 10 to 14 Year Olds | 537 (93.1%) | 40 (6.9%) |
| 15 to 17 Year Olds | 461 (94.9%) | 25 (5.1%) |
| 18 to 19 Year Olds | 142 (83.5%) | 28 (16.5%) |
| 20 to 24 Year Olds | 154 (50.5%) | 151 (49.5%) |
| 25 to 34 Year Olds | 7 (12.3%) | 50 (87.7%) |
| 35 Years and over | 63 (80.8%) | 15 (19.2%) |
| Total | 1,762 (82.9%) | 364 (17.1%) |
Educational Attainment by Field of Study in Congers
Business (692 | 23.7%), science & technology (365 | 12.5%), education (331 | 11.3%), social sciences (209 | 7.2%), and liberal arts & history (205 | 7.0%) are the most common fields of study among 2,920 individuals in Congers who have obtained a bachelor's degree or higher.
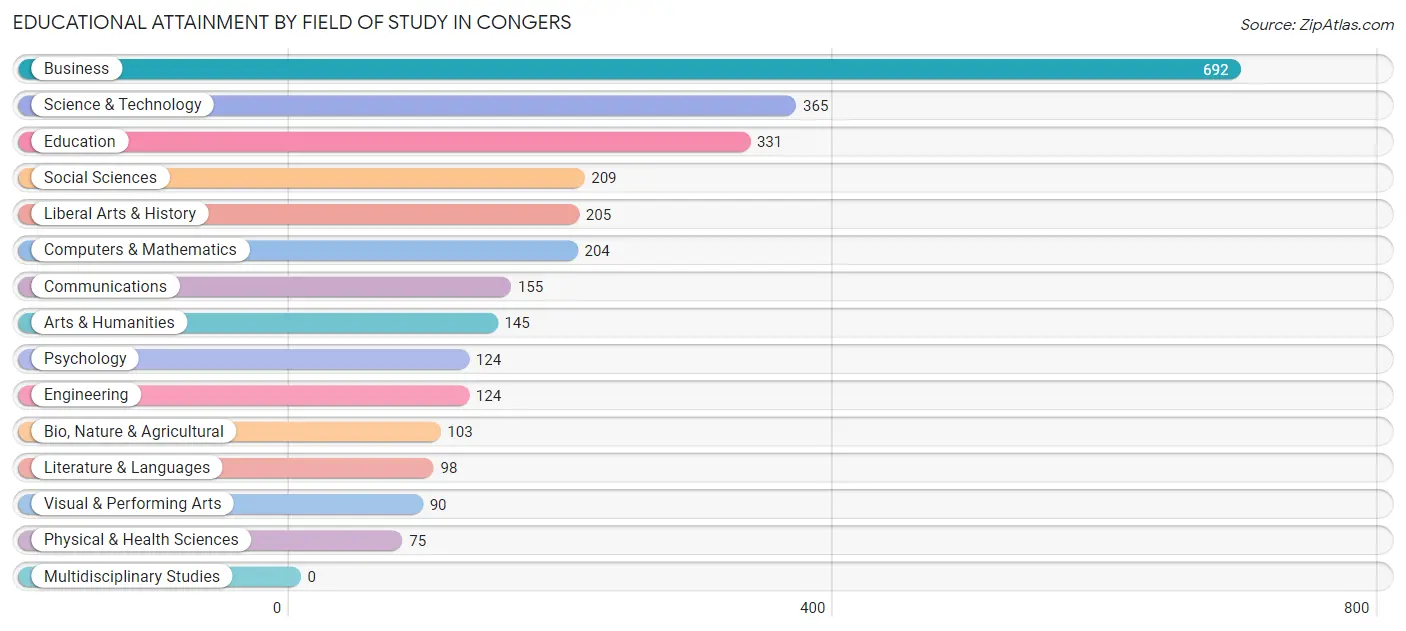
| Field of Study | # Graduates | % Graduates |
| Computers & Mathematics | 204 | 7.0% |
| Bio, Nature & Agricultural | 103 | 3.5% |
| Physical & Health Sciences | 75 | 2.6% |
| Psychology | 124 | 4.3% |
| Social Sciences | 209 | 7.2% |
| Engineering | 124 | 4.3% |
| Multidisciplinary Studies | 0 | 0.0% |
| Science & Technology | 365 | 12.5% |
| Business | 692 | 23.7% |
| Education | 331 | 11.3% |
| Literature & Languages | 98 | 3.4% |
| Liberal Arts & History | 205 | 7.0% |
| Visual & Performing Arts | 90 | 3.1% |
| Communications | 155 | 5.3% |
| Arts & Humanities | 145 | 5.0% |
| Total | 2,920 | 100.0% |
Transportation & Commute in Congers
Vehicle Availability by Sex in Congers
The most prevalent vehicle ownership categories in Congers are males with 2 vehicles (932, accounting for 45.1%) and females with 2 vehicles (926, making up 49.0%).
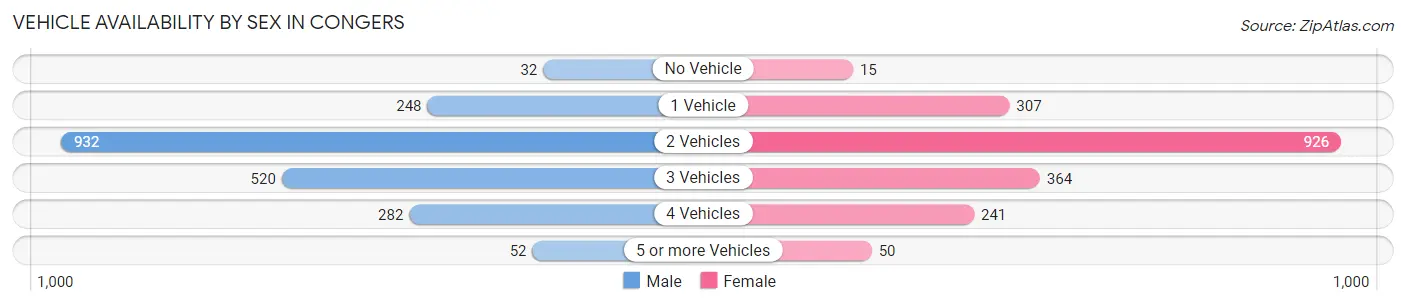
| Vehicles Available | Male | Female |
| No Vehicle | 32 (1.5%) | 15 (0.8%) |
| 1 Vehicle | 248 (12.0%) | 307 (16.1%) |
| 2 Vehicles | 932 (45.1%) | 926 (48.7%) |
| 3 Vehicles | 520 (25.2%) | 364 (19.1%) |
| 4 Vehicles | 282 (13.7%) | 241 (12.7%) |
| 5 or more Vehicles | 52 (2.5%) | 50 (2.6%) |
| Total | 2,066 (100.0%) | 1,903 (100.0%) |
Commute Time in Congers
The most frequently occuring commute durations in Congers are 10 to 14 minutes (595 commuters, 17.2%), 15 to 19 minutes (524 commuters, 15.1%), and 20 to 24 minutes (376 commuters, 10.8%).
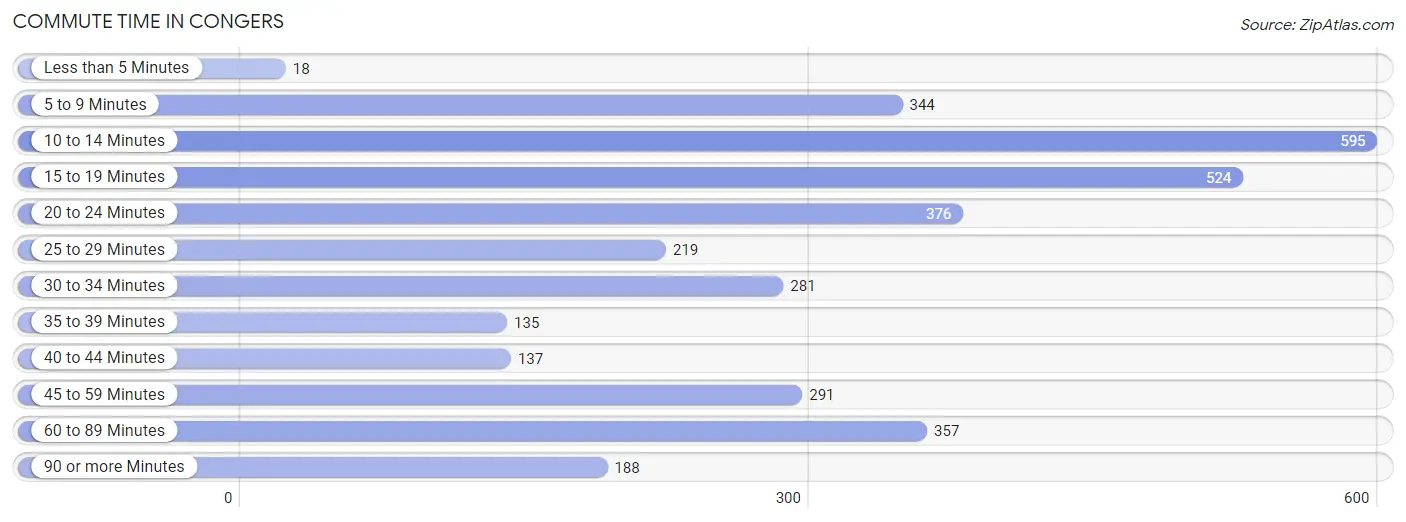
| Commute Time | # Commuters | % Commuters |
| Less than 5 Minutes | 18 | 0.5% |
| 5 to 9 Minutes | 344 | 9.9% |
| 10 to 14 Minutes | 595 | 17.2% |
| 15 to 19 Minutes | 524 | 15.1% |
| 20 to 24 Minutes | 376 | 10.8% |
| 25 to 29 Minutes | 219 | 6.3% |
| 30 to 34 Minutes | 281 | 8.1% |
| 35 to 39 Minutes | 135 | 3.9% |
| 40 to 44 Minutes | 137 | 4.0% |
| 45 to 59 Minutes | 291 | 8.4% |
| 60 to 89 Minutes | 357 | 10.3% |
| 90 or more Minutes | 188 | 5.4% |
Commute Time by Sex in Congers
The most common commute times in Congers are 10 to 14 minutes (268 commuters, 15.0%) for males and 10 to 14 minutes (327 commuters, 19.4%) for females.
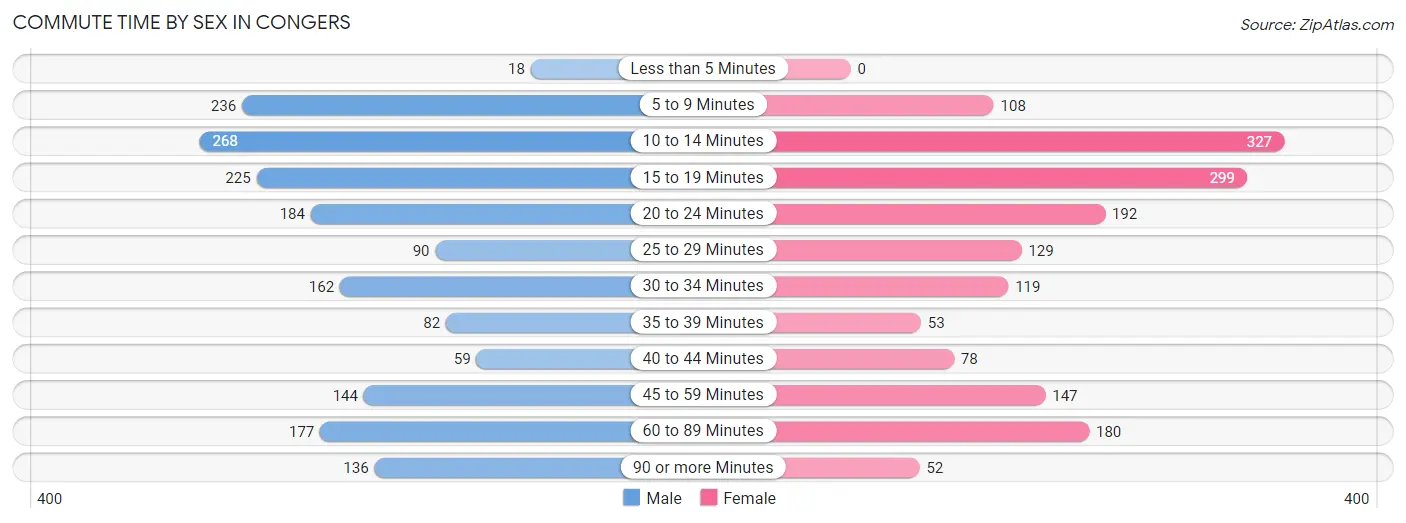
| Commute Time | Male | Female |
| Less than 5 Minutes | 18 (1.0%) | 0 (0.0%) |
| 5 to 9 Minutes | 236 (13.3%) | 108 (6.4%) |
| 10 to 14 Minutes | 268 (15.0%) | 327 (19.4%) |
| 15 to 19 Minutes | 225 (12.6%) | 299 (17.8%) |
| 20 to 24 Minutes | 184 (10.3%) | 192 (11.4%) |
| 25 to 29 Minutes | 90 (5.1%) | 129 (7.7%) |
| 30 to 34 Minutes | 162 (9.1%) | 119 (7.1%) |
| 35 to 39 Minutes | 82 (4.6%) | 53 (3.2%) |
| 40 to 44 Minutes | 59 (3.3%) | 78 (4.6%) |
| 45 to 59 Minutes | 144 (8.1%) | 147 (8.7%) |
| 60 to 89 Minutes | 177 (9.9%) | 180 (10.7%) |
| 90 or more Minutes | 136 (7.6%) | 52 (3.1%) |
Time of Departure to Work by Sex in Congers
The most frequent times of departure to work in Congers are 7:30 AM to 7:59 AM (291, 16.3%) for males and 8:00 AM to 8:29 AM (390, 23.2%) for females.
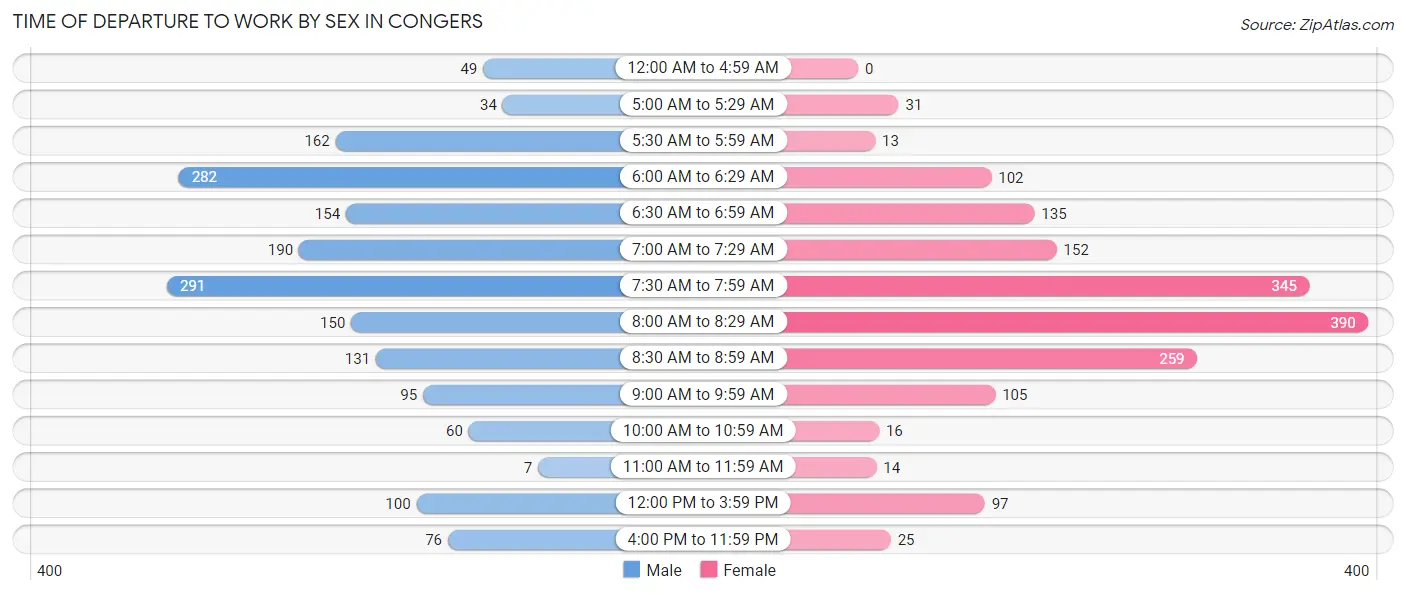
| Time of Departure | Male | Female |
| 12:00 AM to 4:59 AM | 49 (2.8%) | 0 (0.0%) |
| 5:00 AM to 5:29 AM | 34 (1.9%) | 31 (1.8%) |
| 5:30 AM to 5:59 AM | 162 (9.1%) | 13 (0.8%) |
| 6:00 AM to 6:29 AM | 282 (15.8%) | 102 (6.1%) |
| 6:30 AM to 6:59 AM | 154 (8.6%) | 135 (8.0%) |
| 7:00 AM to 7:29 AM | 190 (10.7%) | 152 (9.0%) |
| 7:30 AM to 7:59 AM | 291 (16.3%) | 345 (20.5%) |
| 8:00 AM to 8:29 AM | 150 (8.4%) | 390 (23.2%) |
| 8:30 AM to 8:59 AM | 131 (7.4%) | 259 (15.4%) |
| 9:00 AM to 9:59 AM | 95 (5.3%) | 105 (6.2%) |
| 10:00 AM to 10:59 AM | 60 (3.4%) | 16 (0.9%) |
| 11:00 AM to 11:59 AM | 7 (0.4%) | 14 (0.8%) |
| 12:00 PM to 3:59 PM | 100 (5.6%) | 97 (5.8%) |
| 4:00 PM to 11:59 PM | 76 (4.3%) | 25 (1.5%) |
| Total | 1,781 (100.0%) | 1,684 (100.0%) |
Housing Occupancy in Congers
Occupancy by Ownership in Congers
Of the total 2,571 dwellings in Congers, owner-occupied units account for 2,255 (87.7%), while renter-occupied units make up 316 (12.3%).
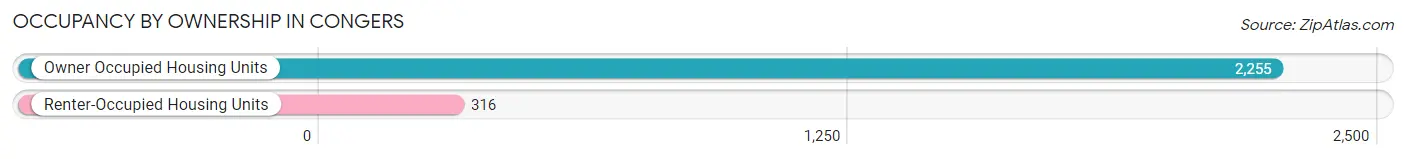
| Occupancy | # Housing Units | % Housing Units |
| Owner Occupied Housing Units | 2,255 | 87.7% |
| Renter-Occupied Housing Units | 316 | 12.3% |
| Total Occupied Housing Units | 2,571 | 100.0% |
Occupancy by Household Size in Congers
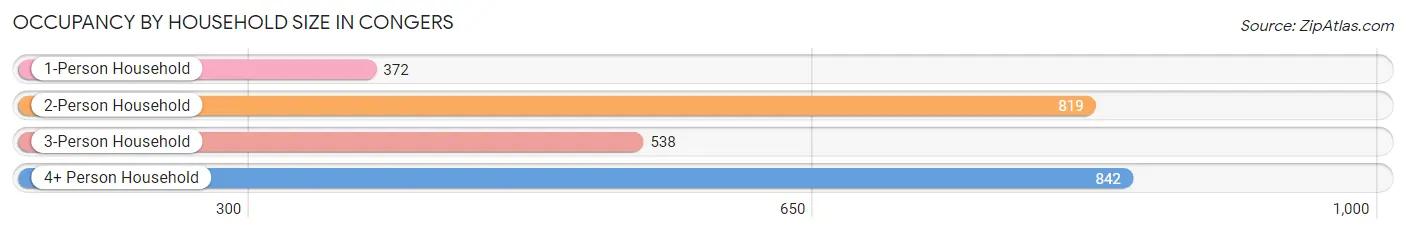
| Household Size | # Housing Units | % Housing Units |
| 1-Person Household | 372 | 14.5% |
| 2-Person Household | 819 | 31.9% |
| 3-Person Household | 538 | 20.9% |
| 4+ Person Household | 842 | 32.8% |
| Total Housing Units | 2,571 | 100.0% |
Occupancy by Ownership by Household Size in Congers
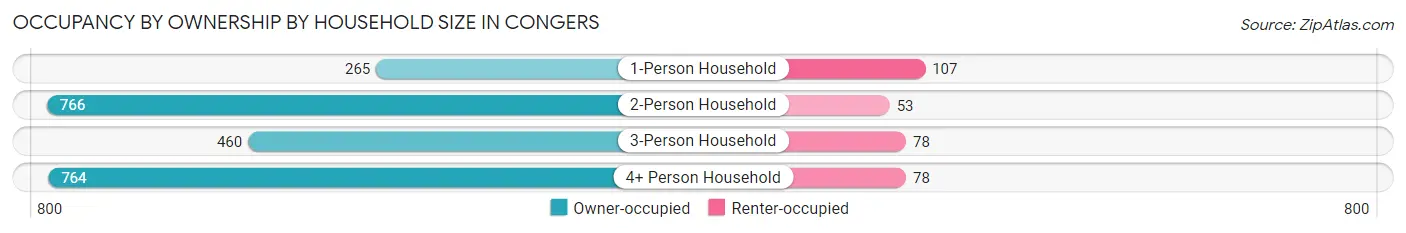
| Household Size | Owner-occupied | Renter-occupied |
| 1-Person Household | 265 (71.2%) | 107 (28.8%) |
| 2-Person Household | 766 (93.5%) | 53 (6.5%) |
| 3-Person Household | 460 (85.5%) | 78 (14.5%) |
| 4+ Person Household | 764 (90.7%) | 78 (9.3%) |
| Total Housing Units | 2,255 (87.7%) | 316 (12.3%) |
Occupancy by Educational Attainment in Congers
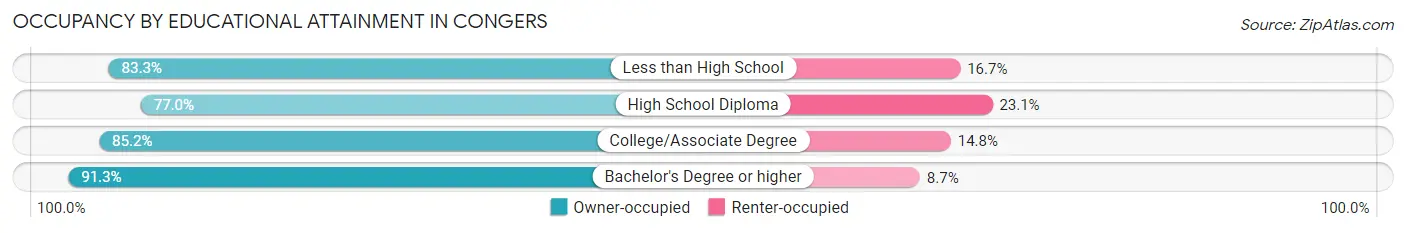
| Household Size | Owner-occupied | Renter-occupied |
| Less than High School | 75 (83.3%) | 15 (16.7%) |
| High School Diploma | 227 (76.9%) | 68 (23.1%) |
| College/Associate Degree | 605 (85.2%) | 105 (14.8%) |
| Bachelor's Degree or higher | 1,348 (91.3%) | 128 (8.7%) |
Occupancy by Age of Householder in Congers
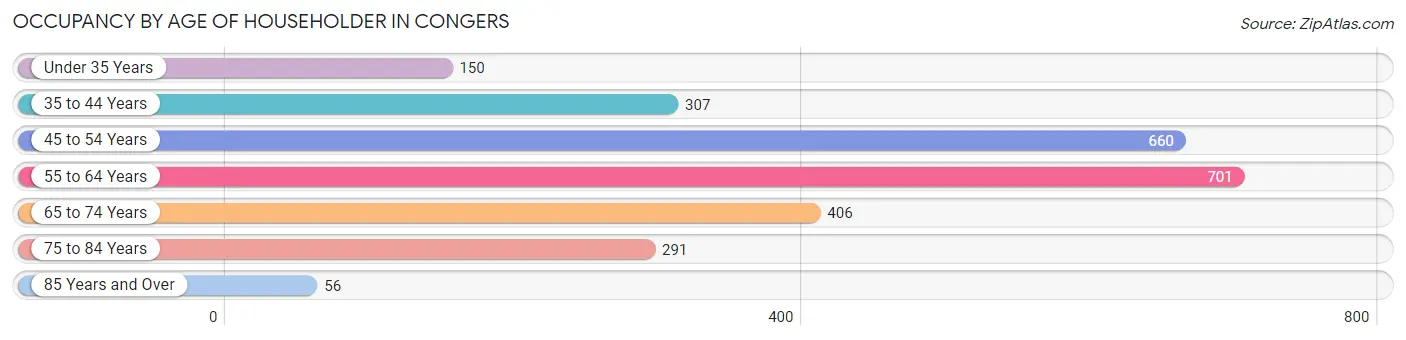
| Age Bracket | # Households | % Households |
| Under 35 Years | 150 | 5.8% |
| 35 to 44 Years | 307 | 11.9% |
| 45 to 54 Years | 660 | 25.7% |
| 55 to 64 Years | 701 | 27.3% |
| 65 to 74 Years | 406 | 15.8% |
| 75 to 84 Years | 291 | 11.3% |
| 85 Years and Over | 56 | 2.2% |
| Total | 2,571 | 100.0% |
Housing Finances in Congers
Median Income by Occupancy in Congers
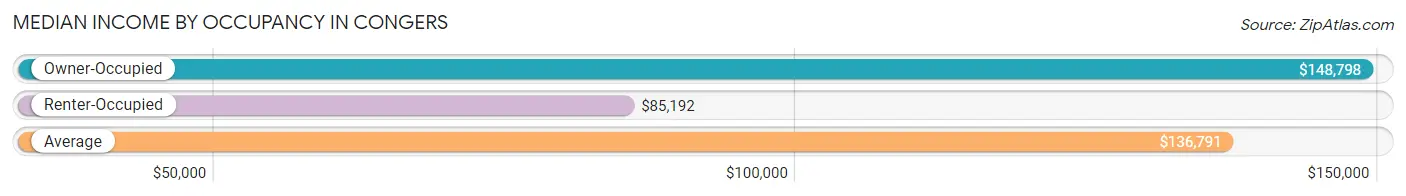
| Occupancy Type | # Households | Median Income |
| Owner-Occupied | 2,255 (87.7%) | $148,798 |
| Renter-Occupied | 316 (12.3%) | $85,192 |
| Average | 2,571 (100.0%) | $136,791 |
Occupancy by Householder Income Bracket in Congers
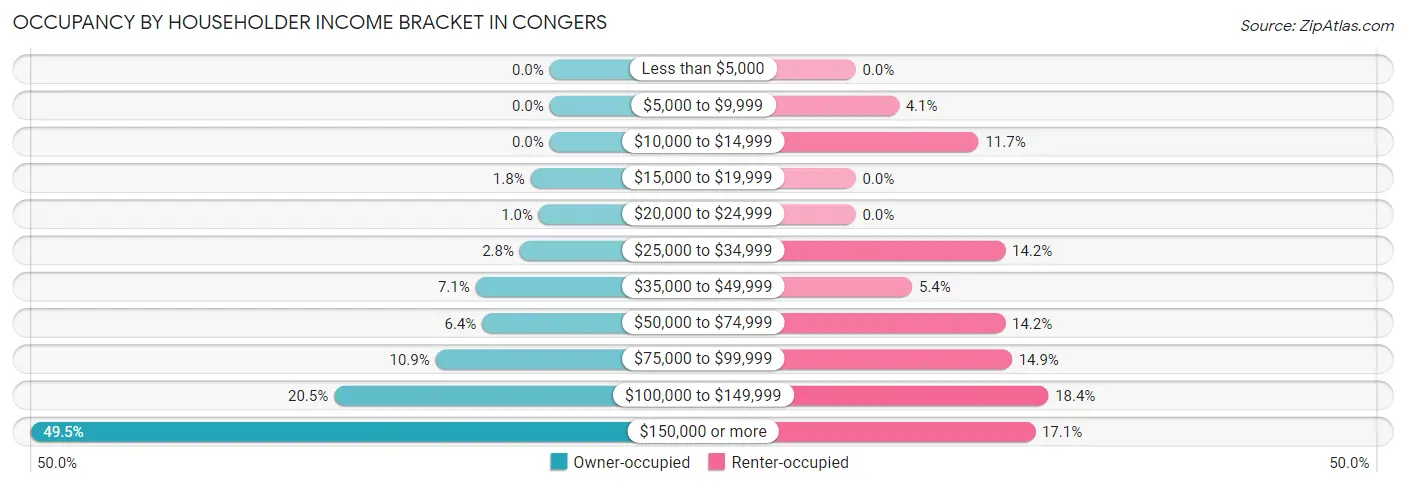
| Income Bracket | Owner-occupied | Renter-occupied |
| Less than $5,000 | 0 (0.0%) | 0 (0.0%) |
| $5,000 to $9,999 | 0 (0.0%) | 13 (4.1%) |
| $10,000 to $14,999 | 0 (0.0%) | 37 (11.7%) |
| $15,000 to $19,999 | 41 (1.8%) | 0 (0.0%) |
| $20,000 to $24,999 | 23 (1.0%) | 0 (0.0%) |
| $25,000 to $34,999 | 64 (2.8%) | 45 (14.2%) |
| $35,000 to $49,999 | 159 (7.0%) | 17 (5.4%) |
| $50,000 to $74,999 | 145 (6.4%) | 45 (14.2%) |
| $75,000 to $99,999 | 245 (10.9%) | 47 (14.9%) |
| $100,000 to $149,999 | 463 (20.5%) | 58 (18.3%) |
| $150,000 or more | 1,115 (49.4%) | 54 (17.1%) |
| Total | 2,255 (100.0%) | 316 (100.0%) |
Monthly Housing Cost Tiers in Congers
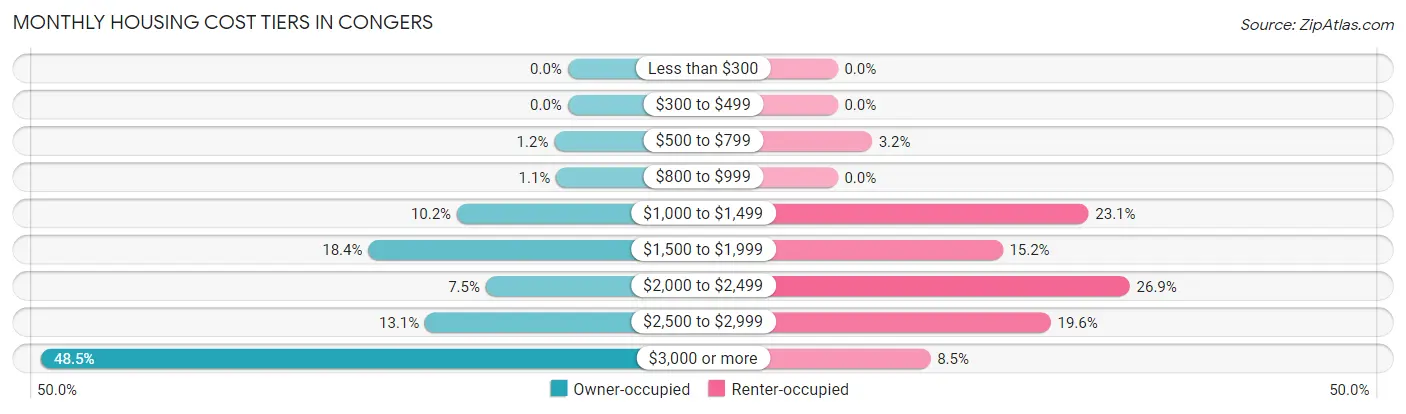
| Monthly Cost | Owner-occupied | Renter-occupied |
| Less than $300 | 0 (0.0%) | 0 (0.0%) |
| $300 to $499 | 0 (0.0%) | 0 (0.0%) |
| $500 to $799 | 28 (1.2%) | 10 (3.2%) |
| $800 to $999 | 24 (1.1%) | 0 (0.0%) |
| $1,000 to $1,499 | 230 (10.2%) | 73 (23.1%) |
| $1,500 to $1,999 | 414 (18.4%) | 48 (15.2%) |
| $2,000 to $2,499 | 170 (7.5%) | 85 (26.9%) |
| $2,500 to $2,999 | 296 (13.1%) | 62 (19.6%) |
| $3,000 or more | 1,093 (48.5%) | 27 (8.5%) |
| Total | 2,255 (100.0%) | 316 (100.0%) |
Physical Housing Characteristics in Congers
Housing Structures in Congers
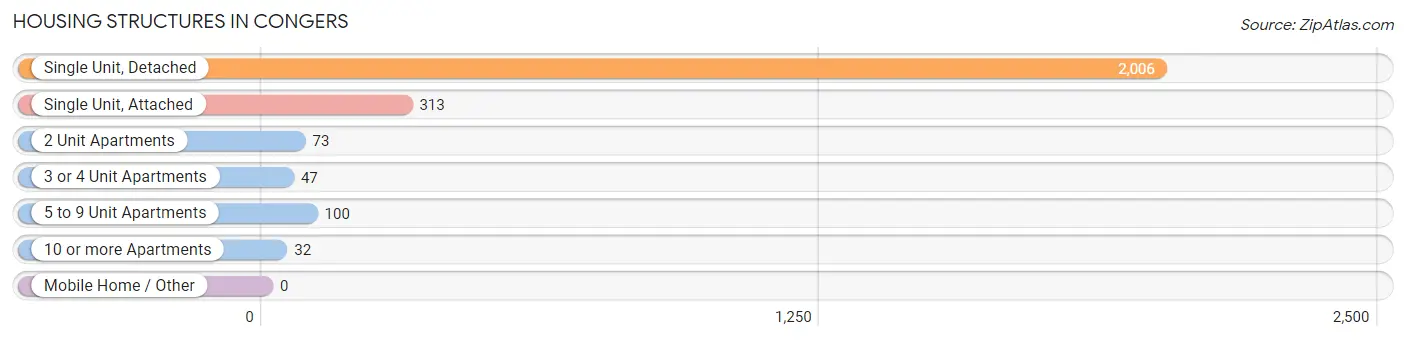
| Structure Type | # Housing Units | % Housing Units |
| Single Unit, Detached | 2,006 | 78.0% |
| Single Unit, Attached | 313 | 12.2% |
| 2 Unit Apartments | 73 | 2.8% |
| 3 or 4 Unit Apartments | 47 | 1.8% |
| 5 to 9 Unit Apartments | 100 | 3.9% |
| 10 or more Apartments | 32 | 1.2% |
| Mobile Home / Other | 0 | 0.0% |
| Total | 2,571 | 100.0% |
Housing Structures by Occupancy in Congers
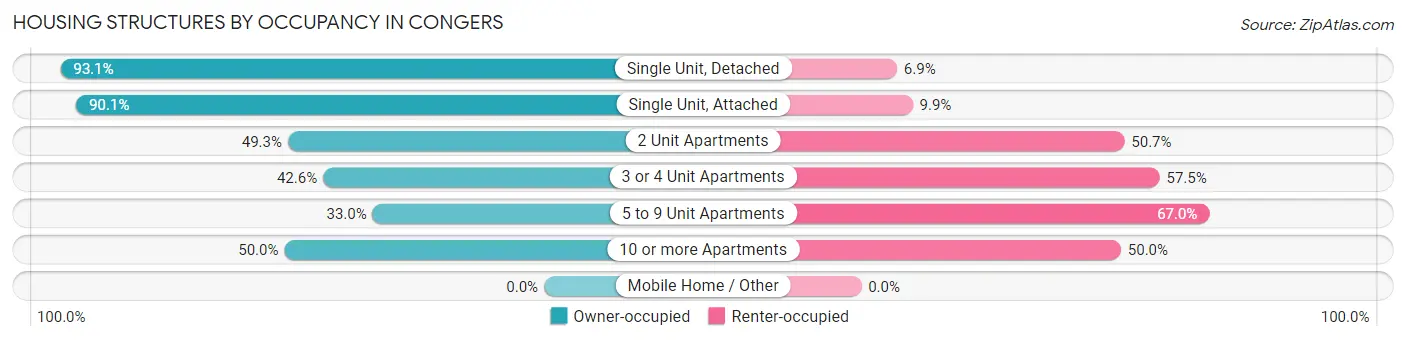
| Structure Type | Owner-occupied | Renter-occupied |
| Single Unit, Detached | 1,868 (93.1%) | 138 (6.9%) |
| Single Unit, Attached | 282 (90.1%) | 31 (9.9%) |
| 2 Unit Apartments | 36 (49.3%) | 37 (50.7%) |
| 3 or 4 Unit Apartments | 20 (42.5%) | 27 (57.5%) |
| 5 to 9 Unit Apartments | 33 (33.0%) | 67 (67.0%) |
| 10 or more Apartments | 16 (50.0%) | 16 (50.0%) |
| Mobile Home / Other | 0 (0.0%) | 0 (0.0%) |
| Total | 2,255 (87.7%) | 316 (12.3%) |
Housing Structures by Number of Rooms in Congers
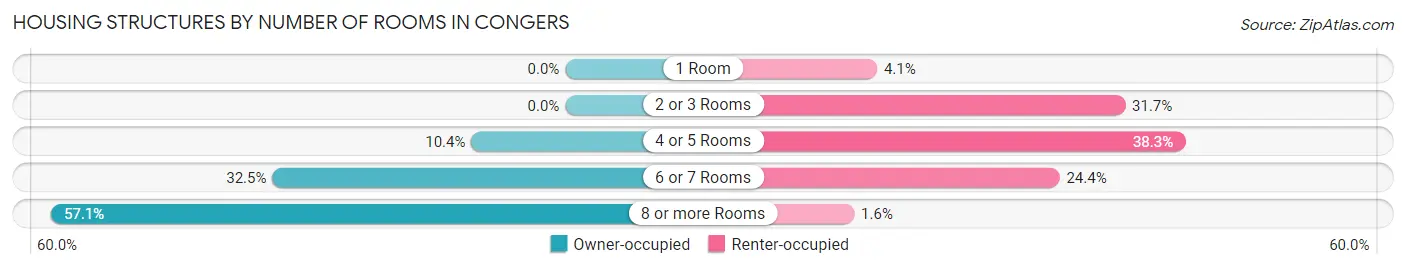
| Number of Rooms | Owner-occupied | Renter-occupied |
| 1 Room | 0 (0.0%) | 13 (4.1%) |
| 2 or 3 Rooms | 0 (0.0%) | 100 (31.7%) |
| 4 or 5 Rooms | 235 (10.4%) | 121 (38.3%) |
| 6 or 7 Rooms | 733 (32.5%) | 77 (24.4%) |
| 8 or more Rooms | 1,287 (57.1%) | 5 (1.6%) |
| Total | 2,255 (100.0%) | 316 (100.0%) |
Housing Structure by Heating Type in Congers
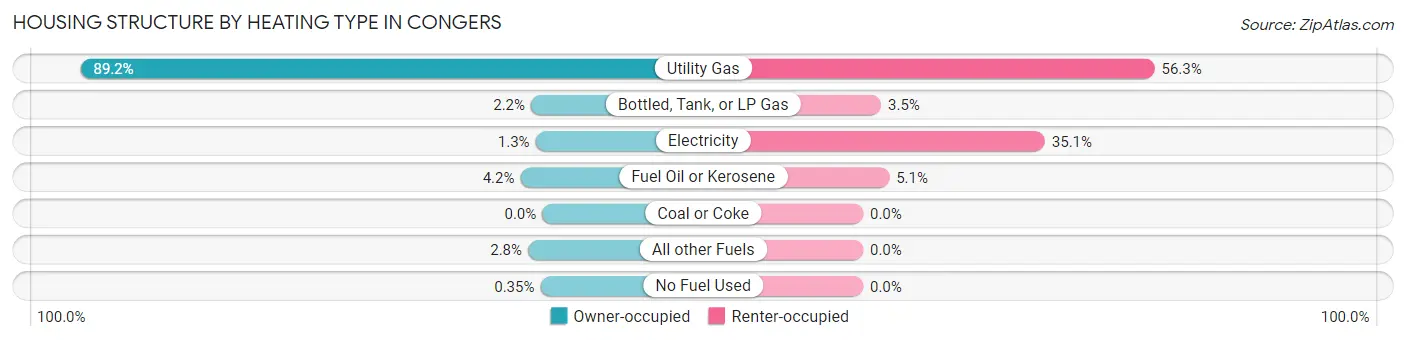
| Heating Type | Owner-occupied | Renter-occupied |
| Utility Gas | 2,012 (89.2%) | 178 (56.3%) |
| Bottled, Tank, or LP Gas | 49 (2.2%) | 11 (3.5%) |
| Electricity | 29 (1.3%) | 111 (35.1%) |
| Fuel Oil or Kerosene | 95 (4.2%) | 16 (5.1%) |
| Coal or Coke | 0 (0.0%) | 0 (0.0%) |
| All other Fuels | 62 (2.8%) | 0 (0.0%) |
| No Fuel Used | 8 (0.4%) | 0 (0.0%) |
| Total | 2,255 (100.0%) | 316 (100.0%) |
Household Vehicle Usage in Congers
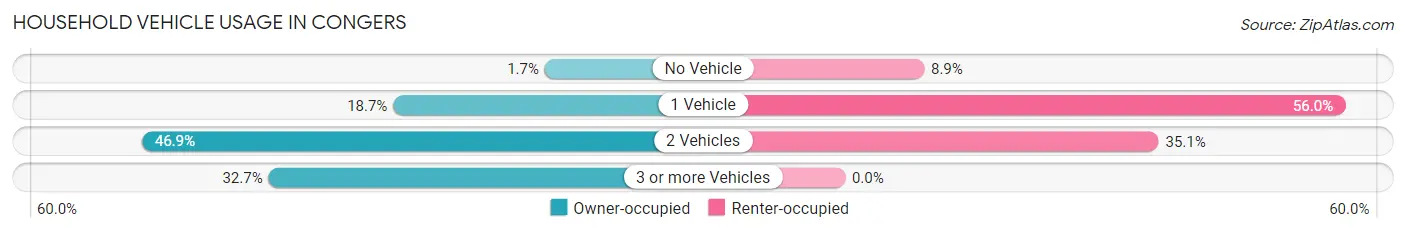
| Vehicles per Household | Owner-occupied | Renter-occupied |
| No Vehicle | 39 (1.7%) | 28 (8.9%) |
| 1 Vehicle | 422 (18.7%) | 177 (56.0%) |
| 2 Vehicles | 1,057 (46.9%) | 111 (35.1%) |
| 3 or more Vehicles | 737 (32.7%) | 0 (0.0%) |
| Total | 2,255 (100.0%) | 316 (100.0%) |
Real Estate & Mortgages in Congers
Real Estate and Mortgage Overview in Congers
| Characteristic | Without Mortgage | With Mortgage |
| Housing Units | 716 | 1,539 |
| Median Property Value | $549,000 | $527,900 |
| Median Household Income | $134,191 | $863 |
| Monthly Housing Costs | $1,501 | $1,058 |
| Real Estate Taxes | $10,001 | $20 |
Property Value by Mortgage Status in Congers
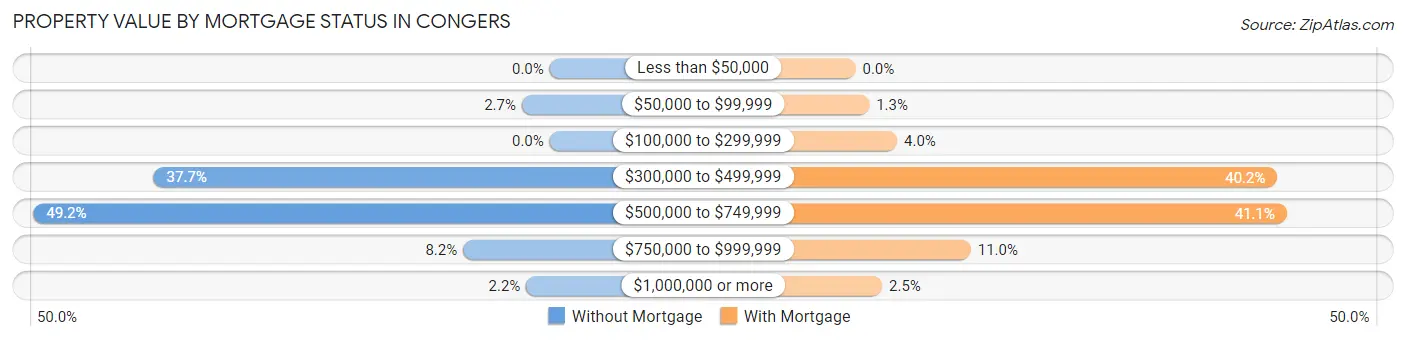
| Property Value | Without Mortgage | With Mortgage |
| Less than $50,000 | 0 (0.0%) | 0 (0.0%) |
| $50,000 to $99,999 | 19 (2.6%) | 20 (1.3%) |
| $100,000 to $299,999 | 0 (0.0%) | 61 (4.0%) |
| $300,000 to $499,999 | 270 (37.7%) | 618 (40.2%) |
| $500,000 to $749,999 | 352 (49.2%) | 632 (41.1%) |
| $750,000 to $999,999 | 59 (8.2%) | 169 (11.0%) |
| $1,000,000 or more | 16 (2.2%) | 39 (2.5%) |
| Total | 716 (100.0%) | 1,539 (100.0%) |
Household Income by Mortgage Status in Congers
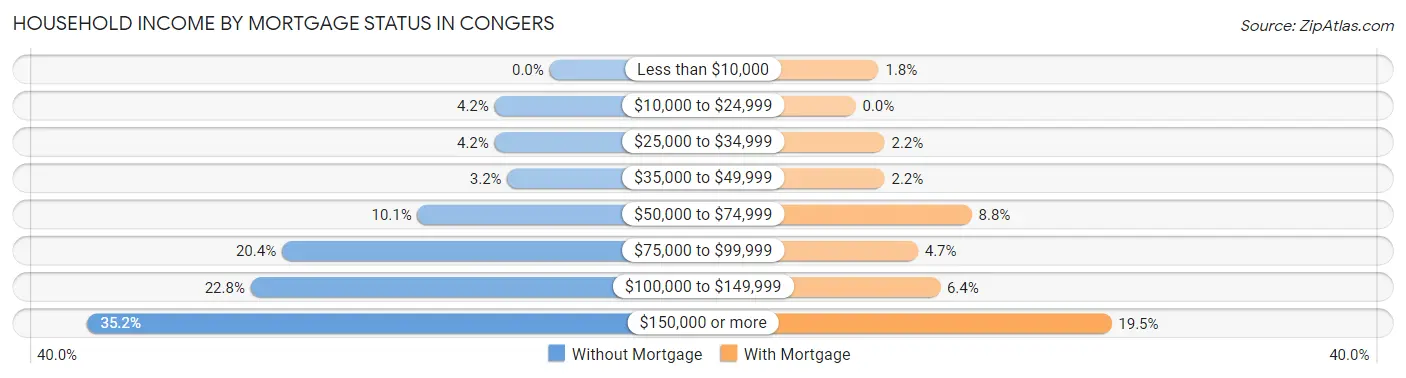
| Household Income | Without Mortgage | With Mortgage |
| Less than $10,000 | 0 (0.0%) | 27 (1.8%) |
| $10,000 to $24,999 | 30 (4.2%) | 0 (0.0%) |
| $25,000 to $34,999 | 30 (4.2%) | 34 (2.2%) |
| $35,000 to $49,999 | 23 (3.2%) | 34 (2.2%) |
| $50,000 to $74,999 | 72 (10.1%) | 136 (8.8%) |
| $75,000 to $99,999 | 146 (20.4%) | 73 (4.7%) |
| $100,000 to $149,999 | 163 (22.8%) | 99 (6.4%) |
| $150,000 or more | 252 (35.2%) | 300 (19.5%) |
| Total | 716 (100.0%) | 1,539 (100.0%) |
Property Value to Household Income Ratio in Congers
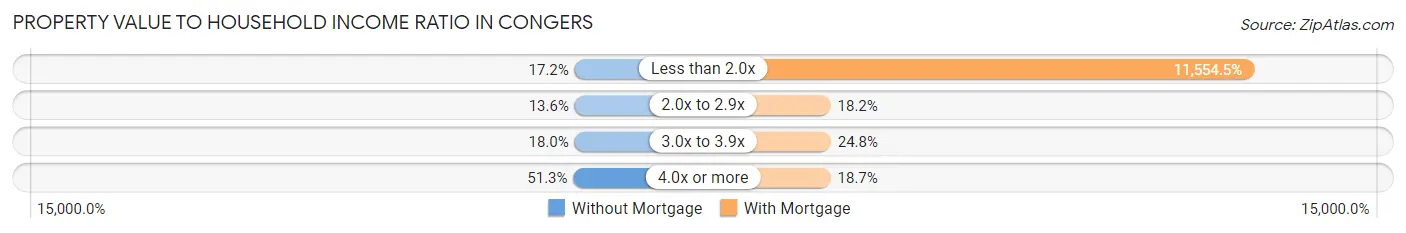
| Value-to-Income Ratio | Without Mortgage | With Mortgage |
| Less than 2.0x | 123 (17.2%) | 177,824 (11,554.5%) |
| 2.0x to 2.9x | 97 (13.6%) | 280 (18.2%) |
| 3.0x to 3.9x | 129 (18.0%) | 381 (24.8%) |
| 4.0x or more | 367 (51.3%) | 288 (18.7%) |
| Total | 716 (100.0%) | 1,539 (100.0%) |
Real Estate Taxes by Mortgage Status in Congers
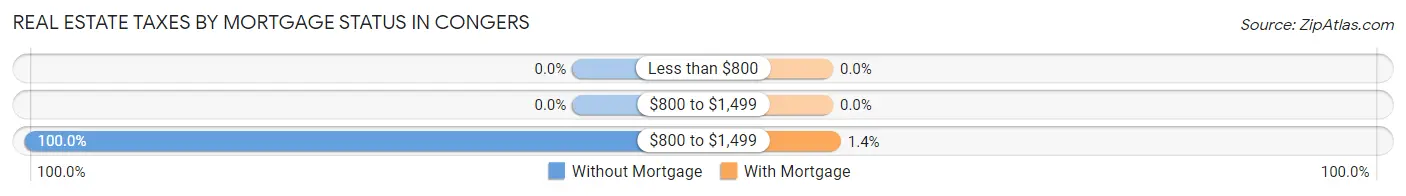
| Property Taxes | Without Mortgage | With Mortgage |
| Less than $800 | 0 (0.0%) | 0 (0.0%) |
| $800 to $1,499 | 0 (0.0%) | 0 (0.0%) |
| $800 to $1,499 | 716 (100.0%) | 22 (1.4%) |
| Total | 716 (100.0%) | 1,539 (100.0%) |
Health & Disability in Congers
Health Insurance Coverage by Age in Congers
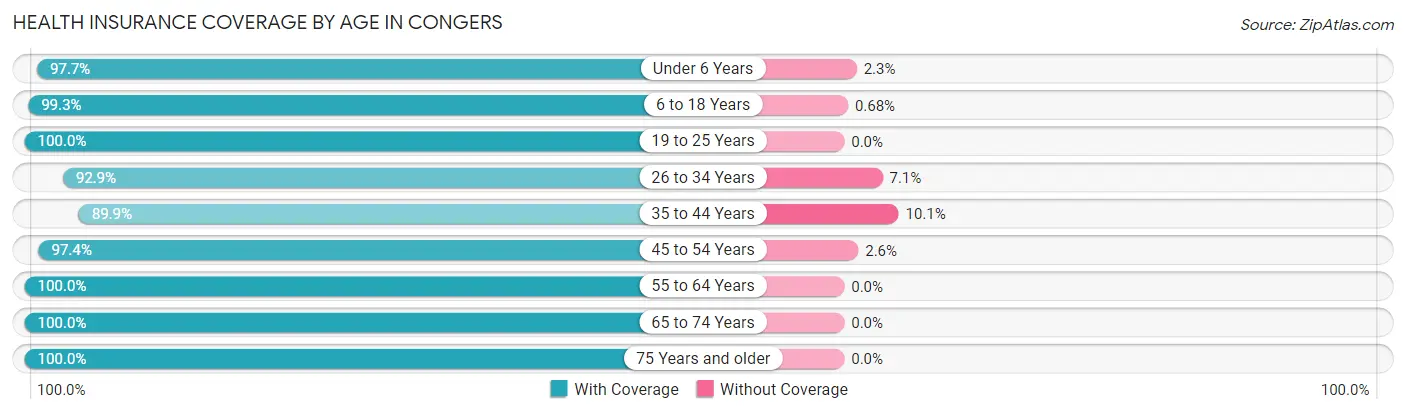
| Age Bracket | With Coverage | Without Coverage |
| Under 6 Years | 422 (97.7%) | 10 (2.3%) |
| 6 to 18 Years | 1,461 (99.3%) | 10 (0.7%) |
| 19 to 25 Years | 721 (100.0%) | 0 (0.0%) |
| 26 to 34 Years | 404 (92.9%) | 31 (7.1%) |
| 35 to 44 Years | 675 (89.9%) | 76 (10.1%) |
| 45 to 54 Years | 1,307 (97.4%) | 35 (2.6%) |
| 55 to 64 Years | 1,297 (100.0%) | 0 (0.0%) |
| 65 to 74 Years | 772 (100.0%) | 0 (0.0%) |
| 75 Years and older | 661 (100.0%) | 0 (0.0%) |
| Total | 7,720 (97.9%) | 162 (2.1%) |
Health Insurance Coverage by Citizenship Status in Congers
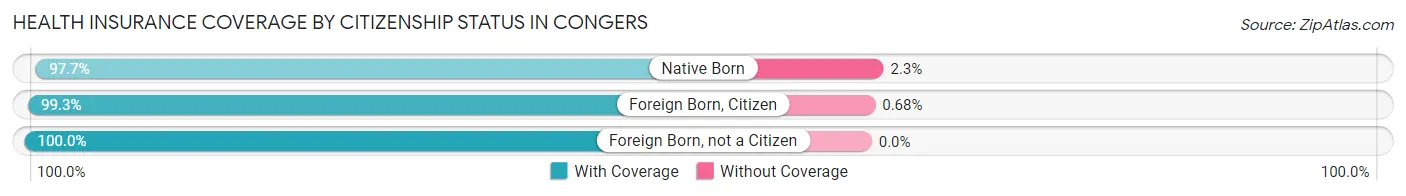
| Citizenship Status | With Coverage | Without Coverage |
| Native Born | 422 (97.7%) | 10 (2.3%) |
| Foreign Born, Citizen | 1,461 (99.3%) | 10 (0.7%) |
| Foreign Born, not a Citizen | 721 (100.0%) | 0 (0.0%) |
Health Insurance Coverage by Household Income in Congers
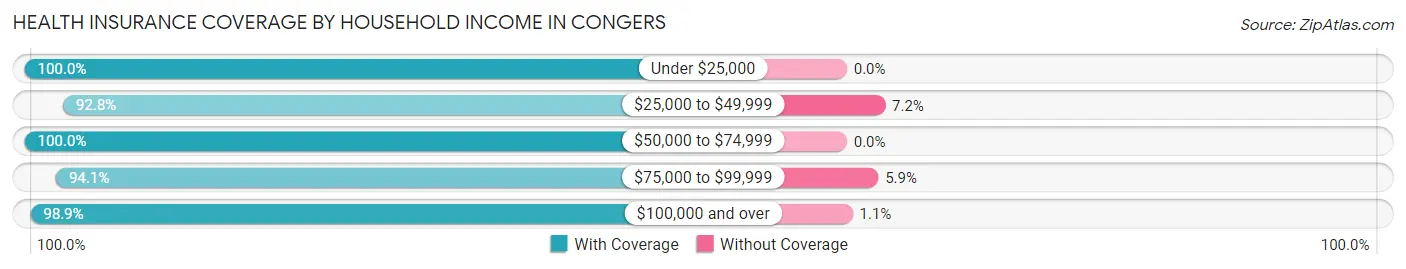
| Household Income | With Coverage | Without Coverage |
| Under $25,000 | 176 (100.0%) | 0 (0.0%) |
| $25,000 to $49,999 | 672 (92.8%) | 52 (7.2%) |
| $50,000 to $74,999 | 390 (100.0%) | 0 (0.0%) |
| $75,000 to $99,999 | 767 (94.1%) | 48 (5.9%) |
| $100,000 and over | 5,653 (98.9%) | 62 (1.1%) |
Public vs Private Health Insurance Coverage by Age in Congers
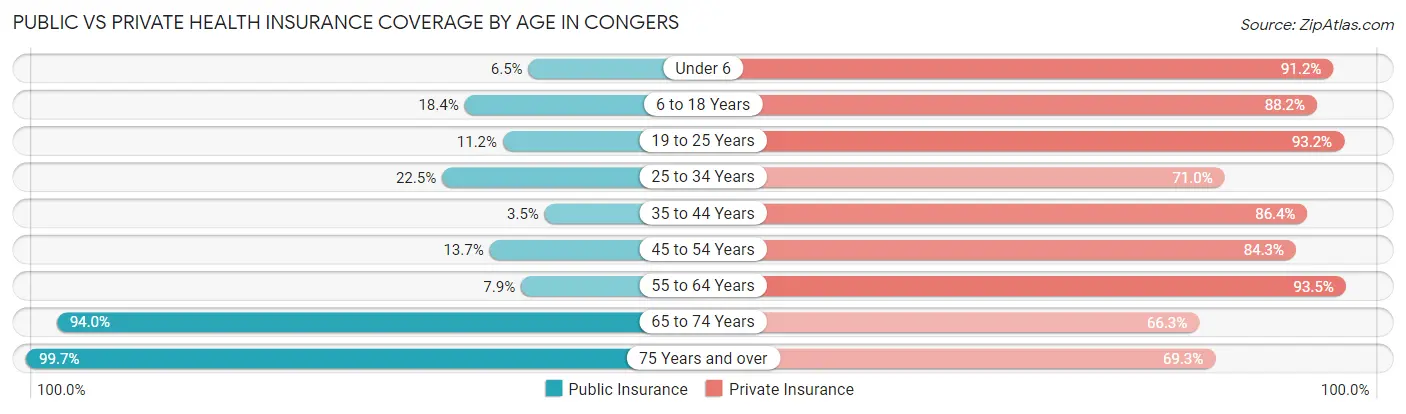
| Age Bracket | Public Insurance | Private Insurance |
| Under 6 | 28 (6.5%) | 394 (91.2%) |
| 6 to 18 Years | 270 (18.3%) | 1,297 (88.2%) |
| 19 to 25 Years | 81 (11.2%) | 672 (93.2%) |
| 25 to 34 Years | 98 (22.5%) | 309 (71.0%) |
| 35 to 44 Years | 26 (3.5%) | 649 (86.4%) |
| 45 to 54 Years | 184 (13.7%) | 1,131 (84.3%) |
| 55 to 64 Years | 102 (7.9%) | 1,213 (93.5%) |
| 65 to 74 Years | 726 (94.0%) | 512 (66.3%) |
| 75 Years and over | 659 (99.7%) | 458 (69.3%) |
| Total | 2,174 (27.6%) | 6,635 (84.2%) |
Disability Status by Sex by Age in Congers
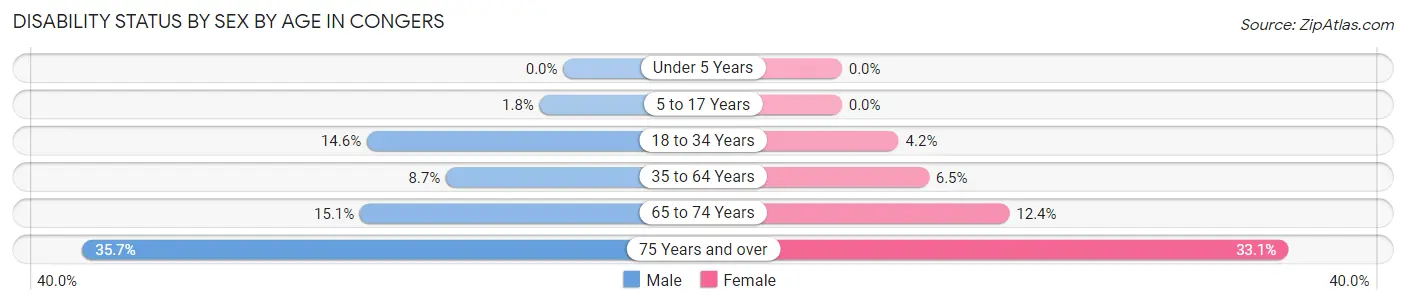
| Age Bracket | Male | Female |
| Under 5 Years | 0 (0.0%) | 0 (0.0%) |
| 5 to 17 Years | 11 (1.8%) | 0 (0.0%) |
| 18 to 34 Years | 92 (14.6%) | 28 (4.2%) |
| 35 to 64 Years | 147 (8.7%) | 110 (6.5%) |
| 65 to 74 Years | 51 (15.1%) | 54 (12.4%) |
| 75 Years and over | 110 (35.7%) | 117 (33.1%) |
Disability Class by Sex by Age in Congers
Disability Class: Hearing Difficulty
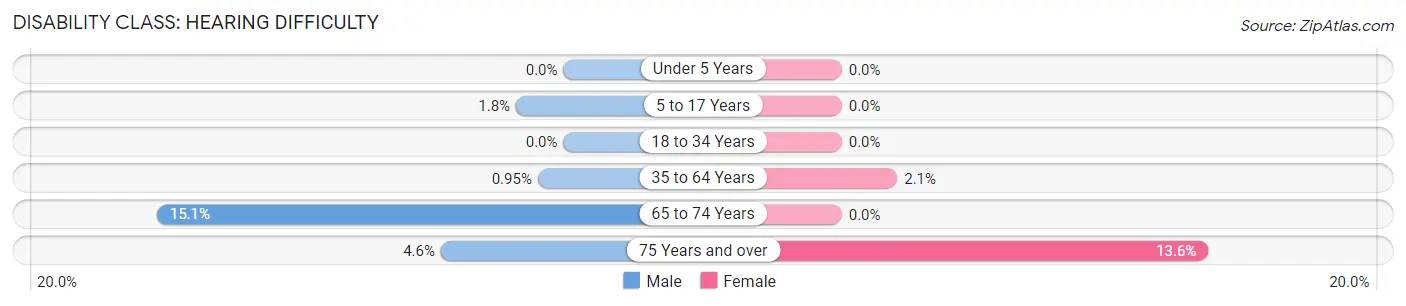
| Age Bracket | Male | Female |
| Under 5 Years | 0 (0.0%) | 0 (0.0%) |
| 5 to 17 Years | 11 (1.8%) | 0 (0.0%) |
| 18 to 34 Years | 0 (0.0%) | 0 (0.0%) |
| 35 to 64 Years | 16 (0.9%) | 35 (2.1%) |
| 65 to 74 Years | 51 (15.1%) | 0 (0.0%) |
| 75 Years and over | 14 (4.5%) | 48 (13.6%) |
Disability Class: Vision Difficulty
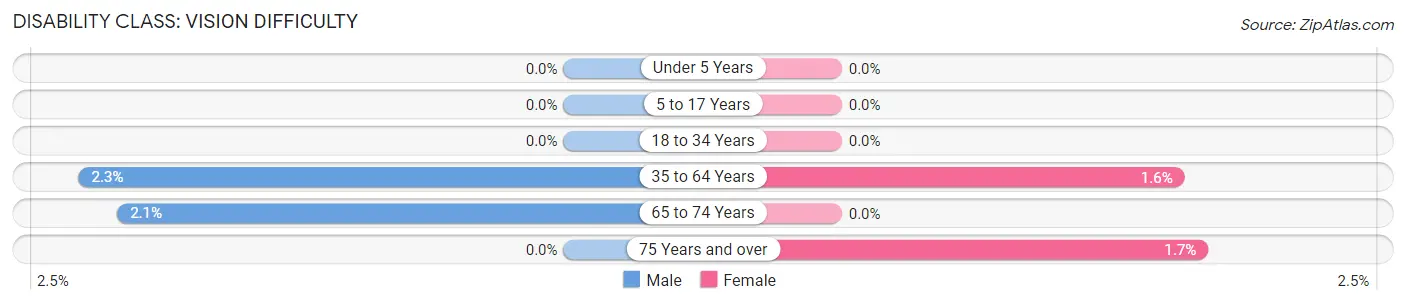
| Age Bracket | Male | Female |
| Under 5 Years | 0 (0.0%) | 0 (0.0%) |
| 5 to 17 Years | 0 (0.0%) | 0 (0.0%) |
| 18 to 34 Years | 0 (0.0%) | 0 (0.0%) |
| 35 to 64 Years | 38 (2.2%) | 27 (1.6%) |
| 65 to 74 Years | 7 (2.1%) | 0 (0.0%) |
| 75 Years and over | 0 (0.0%) | 6 (1.7%) |
Disability Class: Cognitive Difficulty
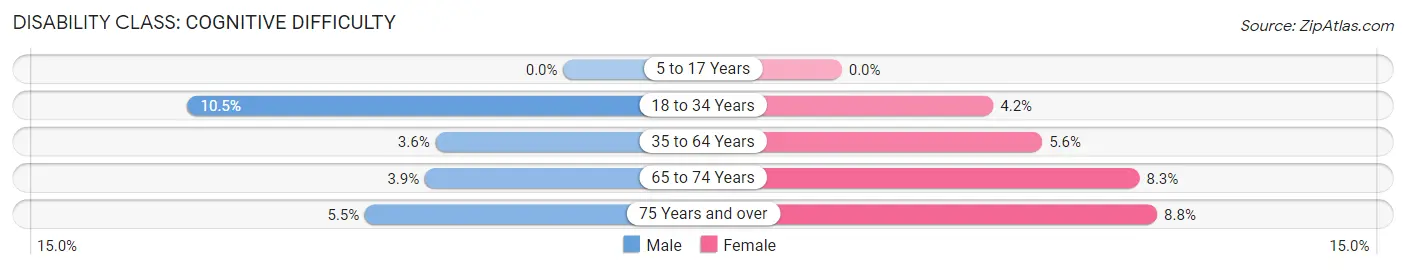
| Age Bracket | Male | Female |
| 5 to 17 Years | 0 (0.0%) | 0 (0.0%) |
| 18 to 34 Years | 66 (10.5%) | 28 (4.2%) |
| 35 to 64 Years | 60 (3.6%) | 95 (5.6%) |
| 65 to 74 Years | 13 (3.8%) | 36 (8.3%) |
| 75 Years and over | 17 (5.5%) | 31 (8.8%) |
Disability Class: Ambulatory Difficulty
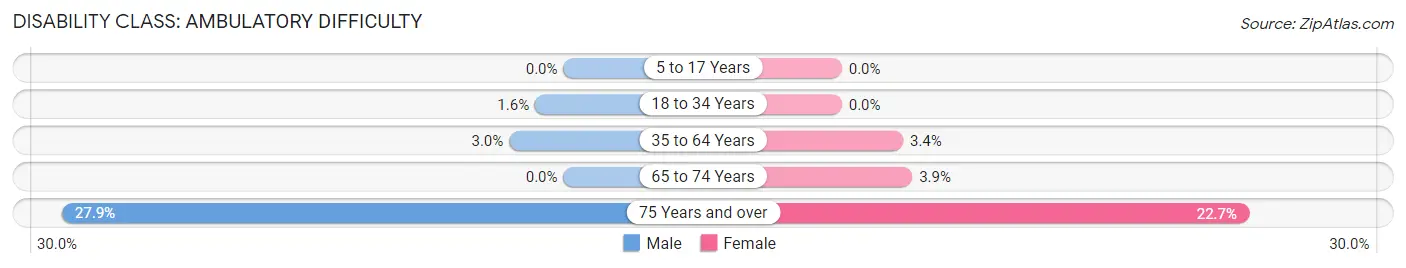
| Age Bracket | Male | Female |
| 5 to 17 Years | 0 (0.0%) | 0 (0.0%) |
| 18 to 34 Years | 10 (1.6%) | 0 (0.0%) |
| 35 to 64 Years | 51 (3.0%) | 58 (3.4%) |
| 65 to 74 Years | 0 (0.0%) | 17 (3.9%) |
| 75 Years and over | 86 (27.9%) | 80 (22.7%) |
Disability Class: Self-Care Difficulty
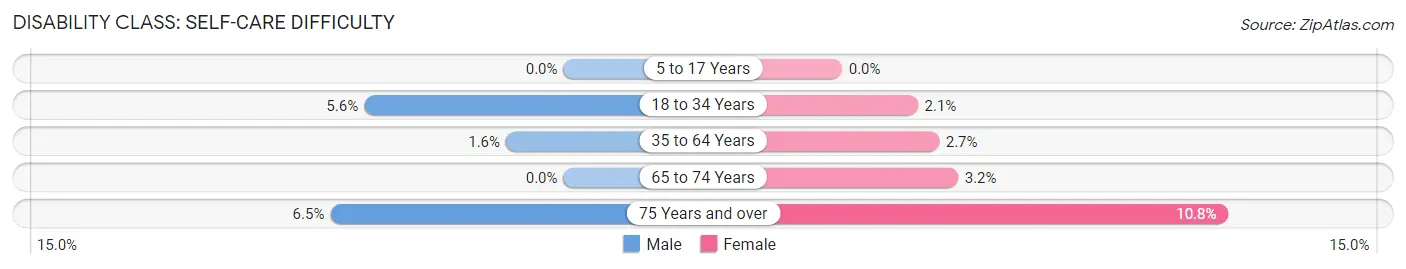
| Age Bracket | Male | Female |
| 5 to 17 Years | 0 (0.0%) | 0 (0.0%) |
| 18 to 34 Years | 35 (5.6%) | 14 (2.1%) |
| 35 to 64 Years | 27 (1.6%) | 46 (2.7%) |
| 65 to 74 Years | 0 (0.0%) | 14 (3.2%) |
| 75 Years and over | 20 (6.5%) | 38 (10.8%) |
Technology Access in Congers
Computing Device Access in Congers
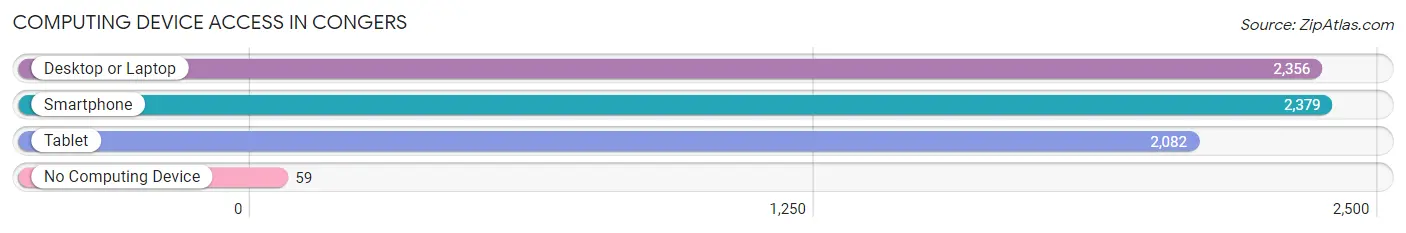
| Device Type | # Households | % Households |
| Desktop or Laptop | 2,356 | 91.6% |
| Smartphone | 2,379 | 92.5% |
| Tablet | 2,082 | 81.0% |
| No Computing Device | 59 | 2.3% |
| Total | 2,571 | 100.0% |
Internet Access in Congers
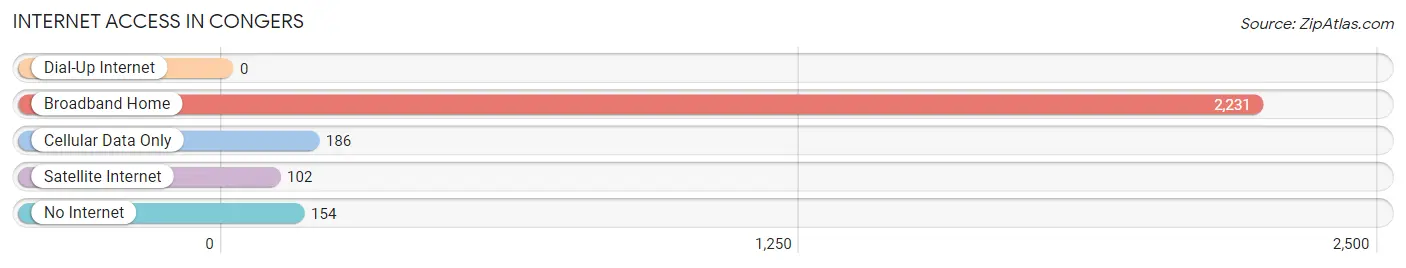
| Internet Type | # Households | % Households |
| Dial-Up Internet | 0 | 0.0% |
| Broadband Home | 2,231 | 86.8% |
| Cellular Data Only | 186 | 7.2% |
| Satellite Internet | 102 | 4.0% |
| No Internet | 154 | 6.0% |
| Total | 2,571 | 100.0% |
Congers Summary
Congers is a hamlet located in the town of Clarkstown in Rockland County, New York. It is situated on the west bank of the Hudson River, about 25 miles north of New York City. The hamlet is bordered by the towns of Haverstraw to the north, Orangetown to the east, and Ramapo to the south. The population of Congers was 8,363 as of the 2010 census.
History
The area that is now Congers was originally inhabited by the Munsee Native Americans. The first European settlers arrived in the area in the late 17th century. The hamlet was originally known as "Haverstraw Landing" and was part of the town of Haverstraw. In 1817, the hamlet was renamed "Congers" after the Conger family, who were among the first settlers in the area.
In the 19th century, Congers was a popular summer resort destination for wealthy New Yorkers. The hamlet was home to several large hotels, including the Congers Hotel, which was built in 1845 and was one of the largest hotels in the area. The hotel was destroyed by fire in 1891.
In the early 20th century, Congers became a popular residential community for commuters to New York City. The hamlet was home to several large estates, including the estate of William Rockefeller, which was built in the early 1900s.
Geography
Congers is located at 41°10'N 73°58'W (41.17, -73.97). The hamlet is situated on the west bank of the Hudson River, about 25 miles north of New York City. The hamlet is bordered by the towns of Haverstraw to the north, Orangetown to the east, and Ramapo to the south.
The terrain of Congers is mostly flat, with some rolling hills. The hamlet is located in the Ramapo Mountains, which are part of the Appalachian Mountains. The highest point in Congers is the summit of High Tor Mountain, which has an elevation of 1,072 feet.
Economy
The economy of Congers is largely based on retail and services. The hamlet is home to several large shopping centers, including the Congers Shopping Center and the Congers Plaza Shopping Center. The hamlet is also home to several restaurants, bars, and other businesses.
The hamlet is also home to several manufacturing and industrial businesses, including the Congers Industrial Park. The park is home to several large companies, including the pharmaceutical company Pfizer and the electronics company Panasonic.
Demographics
As of the 2010 census, the population of Congers was 8,363. The racial makeup of the hamlet was 79.3% White, 11.2% African American, 0.3% Native American, 4.2% Asian, 0.1% Pacific Islander, and 4.9% from other races. Hispanic or Latino of any race were 11.7% of the population.
The median household income in Congers was $77,813 in 2010. The median home value was $521,000. The median age was 41.7 years. The unemployment rate was 4.2%.
Common Questions
What is Per Capita Income in Congers?
Per Capita income in Congers is $58,296.
What is the Median Family Income in Congers?
Median Family Income in Congers is $151,852.
What is the Median Household income in Congers?
Median Household Income in Congers is $136,791.
What is Income or Wage Gap in Congers?
Income or Wage Gap in Congers is 36.5%.
Women in Congers earn 63.5 cents for every dollar earned by a man.
What is Inequality or Gini Index in Congers?
Inequality or Gini Index in Congers is 0.41.
What is the Total Population of Congers?
Total Population of Congers is 7,882.
What is the Total Male Population of Congers?
Total Male Population of Congers is 3,668.
What is the Total Female Population of Congers?
Total Female Population of Congers is 4,214.
What is the Ratio of Males per 100 Females in Congers?
There are 87.04 Males per 100 Females in Congers.
What is the Ratio of Females per 100 Males in Congers?
There are 114.89 Females per 100 Males in Congers.
What is the Median Population Age in Congers?
Median Population Age in Congers is 46.0 Years.
What is the Average Family Size in Congers
Average Family Size in Congers is 3.4 People.
What is the Average Household Size in Congers
Average Household Size in Congers is 3.0 People.
How Large is the Labor Force in Congers?
There are 4,228 People in the Labor Forcein in Congers.
What is the Percentage of People in the Labor Force in Congers?
65.3% of People are in the Labor Force in Congers.
What is the Unemployment Rate in Congers?
Unemployment Rate in Congers is 4.8%.