Aquebogue, NY Map & Demographics
Aquebogue Map
Aquebogue Overview
$47,034
PER CAPITA INCOME
$162,298
AVG FAMILY INCOME
$146,142
AVG HOUSEHOLD INCOME
23.5%
WAGE / INCOME GAP [ % ]
76.5¢/ $1
WAGE / INCOME GAP [ $ ]
0.30
INEQUALITY / GINI INDEX
1,937
TOTAL POPULATION
859
MALE POPULATION
1,078
FEMALE POPULATION
79.68
MALES / 100 FEMALES
125.49
FEMALES / 100 MALES
51.6
MEDIAN AGE
3.5
AVG FAMILY SIZE
2.8
AVG HOUSEHOLD SIZE
1,188
LABOR FORCE [ PEOPLE ]
73.4%
PERCENT IN LABOR FORCE
1.8%
UNEMPLOYMENT RATE
Aquebogue Area Codes
Income in Aquebogue
Income Overview in Aquebogue
Per Capita Income in Aquebogue is $47,034, while median incomes of families and households are $162,298 and $146,142 respectively.
| Characteristic | Number | Measure |
| Per Capita Income | 1,937 | $47,034 |
| Median Family Income | 463 | $162,298 |
| Mean Family Income | 463 | $158,489 |
| Median Household Income | 697 | $146,142 |
| Mean Household Income | 697 | $129,666 |
| Income Deficit | 463 | $0 |
| Wage / Income Gap (%) | 1,937 | 23.49% |
| Wage / Income Gap ($) | 1,937 | 76.51¢ per $1 |
| Gini / Inequality Index | 1,937 | 0.30 |
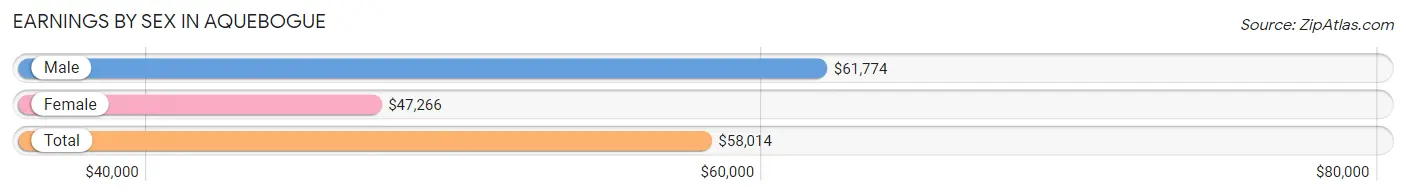
Earnings by Sex in Aquebogue
Average Earnings in Aquebogue are $58,014, $61,774 for men and $47,266 for women, a difference of 23.5%.
| Sex | Number | Average Earnings |
| Male | 598 (47.8%) | $61,774 |
| Female | 653 (52.2%) | $47,266 |
| Total | 1,251 (100.0%) | $58,014 |
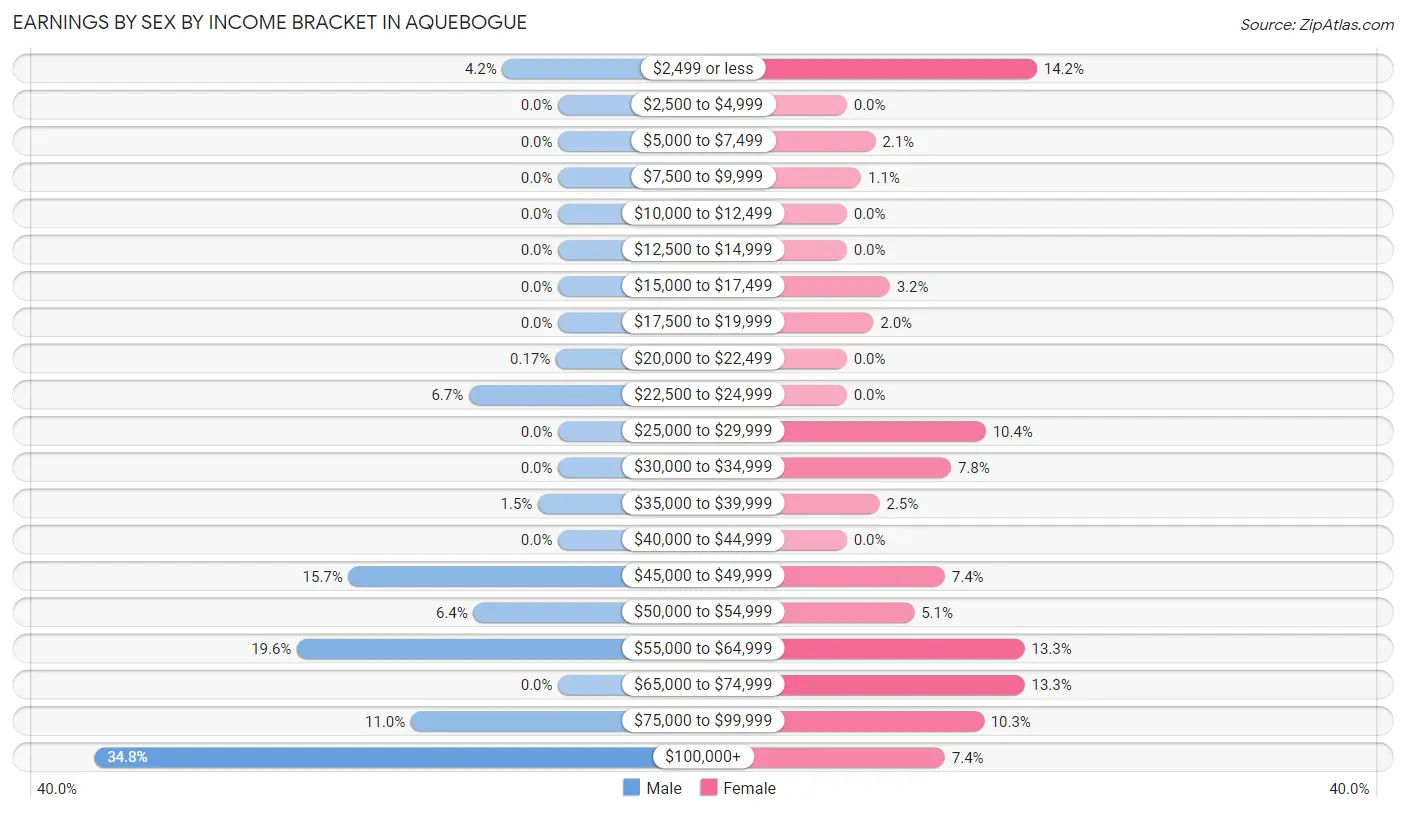
Earnings by Sex by Income Bracket in Aquebogue
The most common earnings brackets in Aquebogue are $100,000+ for men (208 | 34.8%) and $2,499 or less for women (93 | 14.2%).
| Income | Male | Female |
| $2,499 or less | 25 (4.2%) | 93 (14.2%) |
| $2,500 to $4,999 | 0 (0.0%) | 0 (0.0%) |
| $5,000 to $7,499 | 0 (0.0%) | 14 (2.1%) |
| $7,500 to $9,999 | 0 (0.0%) | 7 (1.1%) |
| $10,000 to $12,499 | 0 (0.0%) | 0 (0.0%) |
| $12,500 to $14,999 | 0 (0.0%) | 0 (0.0%) |
| $15,000 to $17,499 | 0 (0.0%) | 21 (3.2%) |
| $17,500 to $19,999 | 0 (0.0%) | 13 (2.0%) |
| $20,000 to $22,499 | 1 (0.2%) | 0 (0.0%) |
| $22,500 to $24,999 | 40 (6.7%) | 0 (0.0%) |
| $25,000 to $29,999 | 0 (0.0%) | 68 (10.4%) |
| $30,000 to $34,999 | 0 (0.0%) | 51 (7.8%) |
| $35,000 to $39,999 | 9 (1.5%) | 16 (2.5%) |
| $40,000 to $44,999 | 0 (0.0%) | 0 (0.0%) |
| $45,000 to $49,999 | 94 (15.7%) | 48 (7.3%) |
| $50,000 to $54,999 | 38 (6.4%) | 33 (5.1%) |
| $55,000 to $64,999 | 117 (19.6%) | 87 (13.3%) |
| $65,000 to $74,999 | 0 (0.0%) | 87 (13.3%) |
| $75,000 to $99,999 | 66 (11.0%) | 67 (10.3%) |
| $100,000+ | 208 (34.8%) | 48 (7.3%) |
| Total | 598 (100.0%) | 653 (100.0%) |
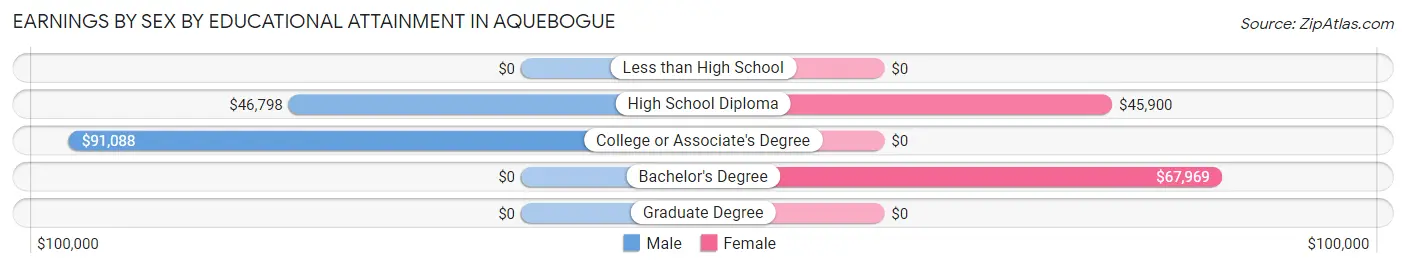
Earnings by Sex by Educational Attainment in Aquebogue
Average earnings in Aquebogue are $90,069 for men and $57,606 for women, a difference of 36.0%. Men with an educational attainment of college or associate's degree enjoy the highest average annual earnings of $91,088, while those with high school diploma education earn the least with $46,798. Women with an educational attainment of bachelor's degree earn the most with the average annual earnings of $67,969, while those with high school diploma education have the smallest earnings of $45,900.
| Educational Attainment | Male Income | Female Income |
| Less than High School | - | - |
| High School Diploma | $46,798 | $45,900 |
| College or Associate's Degree | $91,088 | $0 |
| Bachelor's Degree | - | - |
| Graduate Degree | - | - |
| Total | $90,069 | $57,606 |
Family Income in Aquebogue
Family Income Brackets in Aquebogue
According to the Aquebogue family income data, there are 209 families falling into the $150,000 to $199,999 income range, which is the most common income bracket and makes up 45.1% of all families.
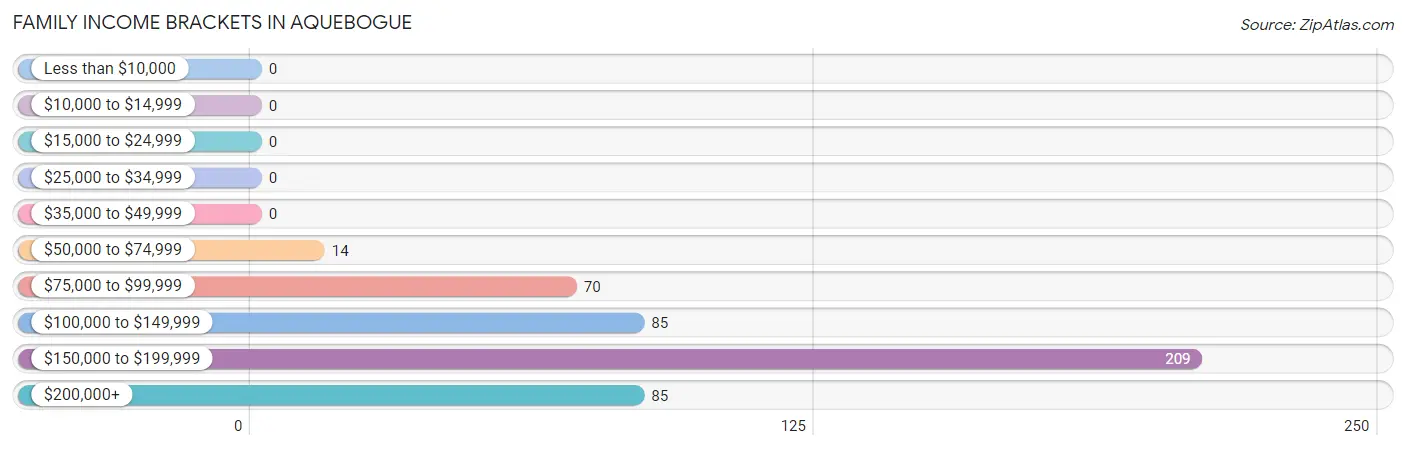
| Income Bracket | # Families | % Families |
| Less than $10,000 | 0 | 0.0% |
| $10,000 to $14,999 | 0 | 0.0% |
| $15,000 to $24,999 | 0 | 0.0% |
| $25,000 to $34,999 | 0 | 0.0% |
| $35,000 to $49,999 | 0 | 0.0% |
| $50,000 to $74,999 | 14 | 3.0% |
| $75,000 to $99,999 | 70 | 15.1% |
| $100,000 to $149,999 | 85 | 18.4% |
| $150,000 to $199,999 | 209 | 45.1% |
| $200,000+ | 85 | 18.4% |
Family Income by Famaliy Size in Aquebogue
4-person families (64 | 13.8%) account for the highest median family income in Aquebogue with $233,500 per family, while 4-person families (64 | 13.8%) have the highest median income of $58,375 per family member.
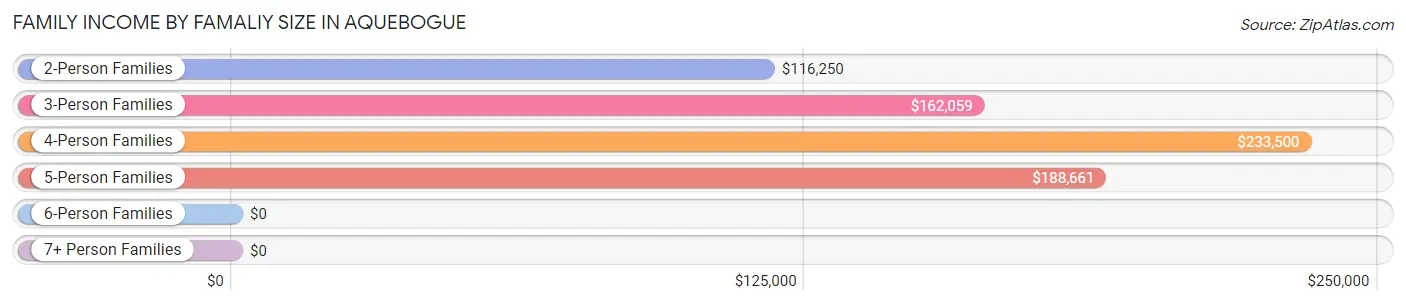
| Income Bracket | # Families | Median Income |
| 2-Person Families | 169 (36.5%) | $116,250 |
| 3-Person Families | 102 (22.0%) | $162,059 |
| 4-Person Families | 64 (13.8%) | $233,500 |
| 5-Person Families | 99 (21.4%) | $188,661 |
| 6-Person Families | 7 (1.5%) | $0 |
| 7+ Person Families | 22 (4.8%) | $0 |
| Total | 463 (100.0%) | $162,298 |
Family Income by Number of Earners in Aquebogue
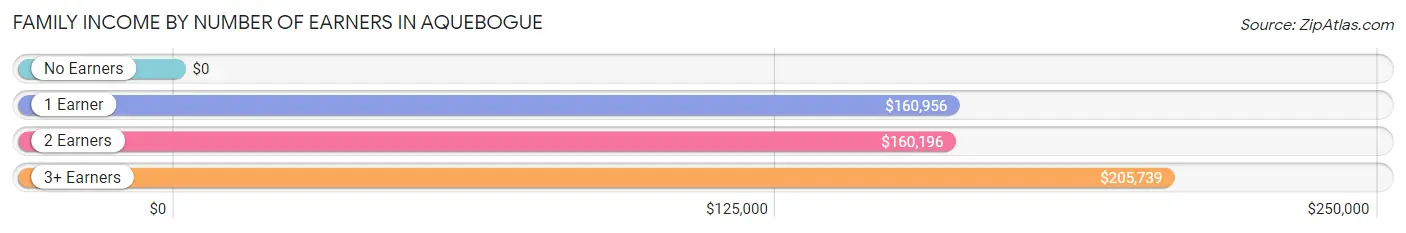
| Number of Earners | # Families | Median Income |
| No Earners | 13 (2.8%) | $0 |
| 1 Earner | 59 (12.7%) | $160,956 |
| 2 Earners | 258 (55.7%) | $160,196 |
| 3+ Earners | 133 (28.7%) | $205,739 |
| Total | 463 (100.0%) | $162,298 |
Household Income in Aquebogue
Household Income Brackets in Aquebogue
With 232 households falling in the category, the $150,000 to $199,999 income range is the most frequent in Aquebogue, accounting for 33.3% of all households.
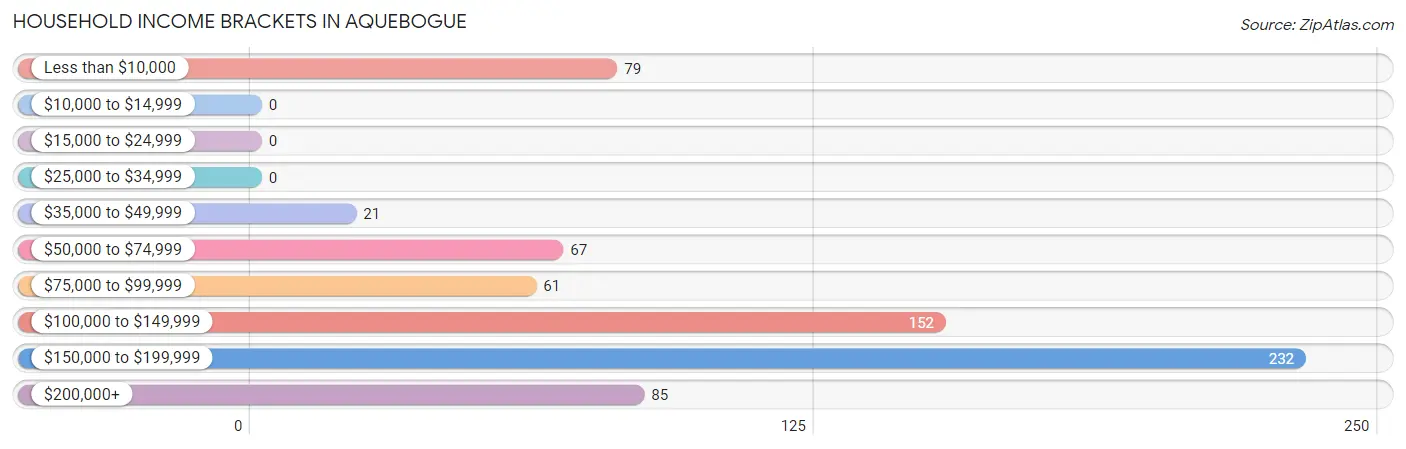
| Income Bracket | # Households | % Households |
| Less than $10,000 | 79 | 11.3% |
| $10,000 to $14,999 | 0 | 0.0% |
| $15,000 to $24,999 | 0 | 0.0% |
| $25,000 to $34,999 | 0 | 0.0% |
| $35,000 to $49,999 | 21 | 3.0% |
| $50,000 to $74,999 | 67 | 9.6% |
| $75,000 to $99,999 | 61 | 8.8% |
| $100,000 to $149,999 | 152 | 21.8% |
| $150,000 to $199,999 | 232 | 33.3% |
| $200,000+ | 85 | 12.2% |
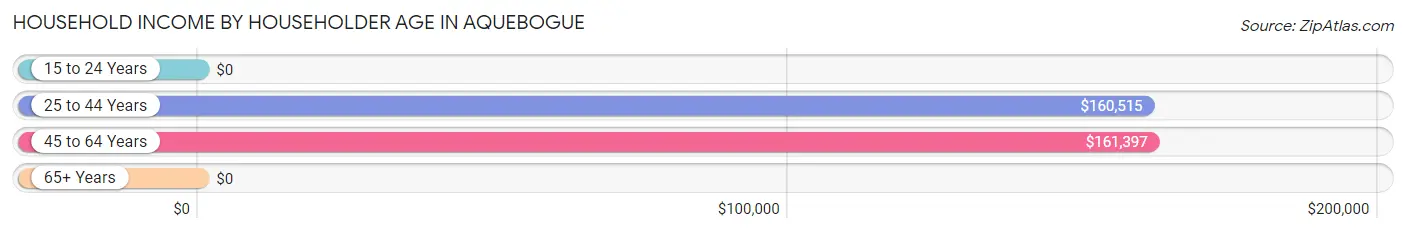
Household Income by Householder Age in Aquebogue
The median household income in Aquebogue is $146,142, with the highest median household income of $161,397 found in the 45 to 64 years age bracket for the primary householder. A total of 517 households (74.2%) fall into this category.
| Income Bracket | # Households | Median Income |
| 15 to 24 Years | 0 (0.0%) | $0 |
| 25 to 44 Years | 27 (3.9%) | $160,515 |
| 45 to 64 Years | 517 (74.2%) | $161,397 |
| 65+ Years | 153 (22.0%) | $0 |
| Total | 697 (100.0%) | $146,142 |
Poverty in Aquebogue
Income Below Poverty by Sex and Age in Aquebogue
With 2.6% poverty level for males and 6.1% for females among the residents of Aquebogue, 35 to 44 year old males and 65 to 74 year old females are the most vulnerable to poverty, with 9 males (32.1%) and 53 females (80.3%) in their respective age groups living below the poverty level.
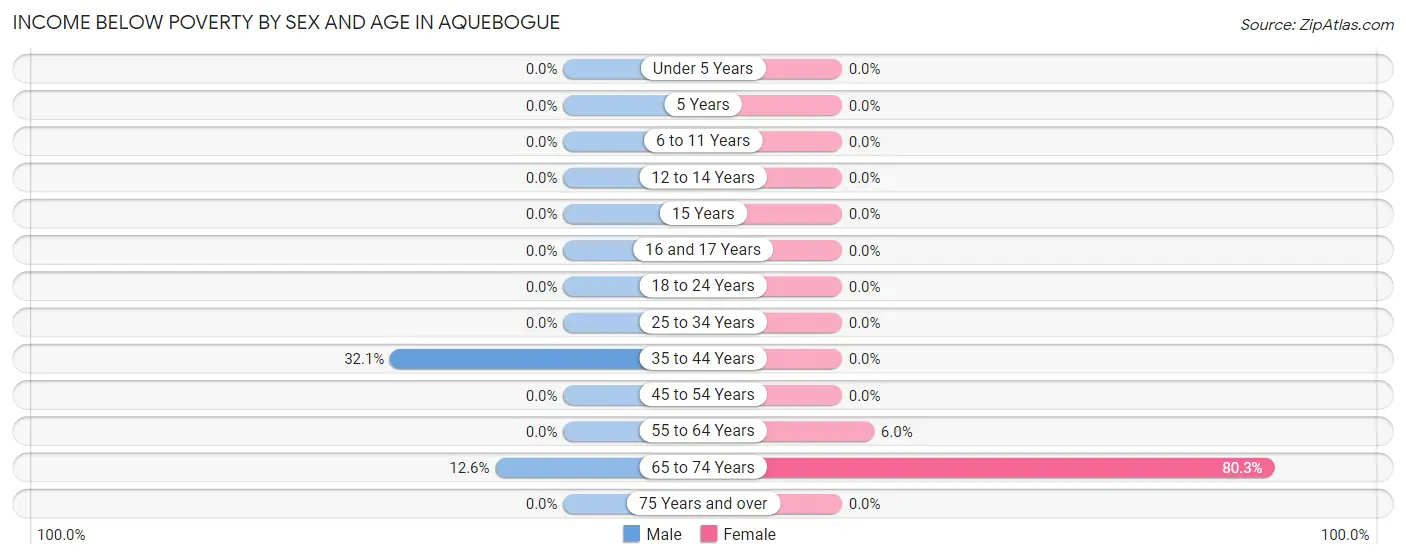
| Age Bracket | Male | Female |
| Under 5 Years | 0 (0.0%) | 0 (0.0%) |
| 5 Years | 0 (0.0%) | 0 (0.0%) |
| 6 to 11 Years | 0 (0.0%) | 0 (0.0%) |
| 12 to 14 Years | 0 (0.0%) | 0 (0.0%) |
| 15 Years | 0 (0.0%) | 0 (0.0%) |
| 16 and 17 Years | 0 (0.0%) | 0 (0.0%) |
| 18 to 24 Years | 0 (0.0%) | 0 (0.0%) |
| 25 to 34 Years | 0 (0.0%) | 0 (0.0%) |
| 35 to 44 Years | 9 (32.1%) | 0 (0.0%) |
| 45 to 54 Years | 0 (0.0%) | 0 (0.0%) |
| 55 to 64 Years | 0 (0.0%) | 13 (6.0%) |
| 65 to 74 Years | 13 (12.6%) | 53 (80.3%) |
| 75 Years and over | 0 (0.0%) | 0 (0.0%) |
| Total | 22 (2.6%) | 66 (6.1%) |
Income Above Poverty by Sex and Age in Aquebogue
According to the poverty statistics in Aquebogue, males aged under 5 years and females aged under 5 years are the age groups that are most secure financially, with 100.0% of males and 100.0% of females in these age groups living above the poverty line.
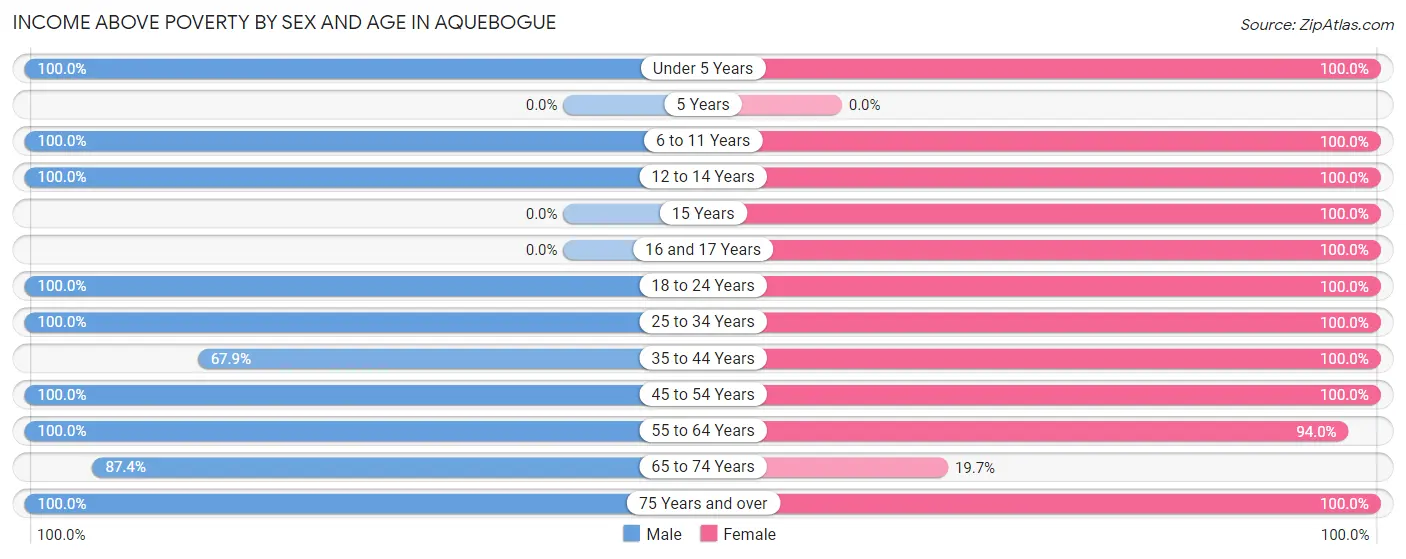
| Age Bracket | Male | Female |
| Under 5 Years | 28 (100.0%) | 18 (100.0%) |
| 5 Years | 0 (0.0%) | 0 (0.0%) |
| 6 to 11 Years | 40 (100.0%) | 33 (100.0%) |
| 12 to 14 Years | 39 (100.0%) | 67 (100.0%) |
| 15 Years | 0 (0.0%) | 93 (100.0%) |
| 16 and 17 Years | 0 (0.0%) | 114 (100.0%) |
| 18 to 24 Years | 53 (100.0%) | 115 (100.0%) |
| 25 to 34 Years | 46 (100.0%) | 23 (100.0%) |
| 35 to 44 Years | 19 (67.9%) | 31 (100.0%) |
| 45 to 54 Years | 233 (100.0%) | 245 (100.0%) |
| 55 to 64 Years | 225 (100.0%) | 205 (94.0%) |
| 65 to 74 Years | 90 (87.4%) | 13 (19.7%) |
| 75 Years and over | 64 (100.0%) | 55 (100.0%) |
| Total | 837 (97.4%) | 1,012 (93.9%) |
Income Below Poverty Among Married-Couple Families in Aquebogue
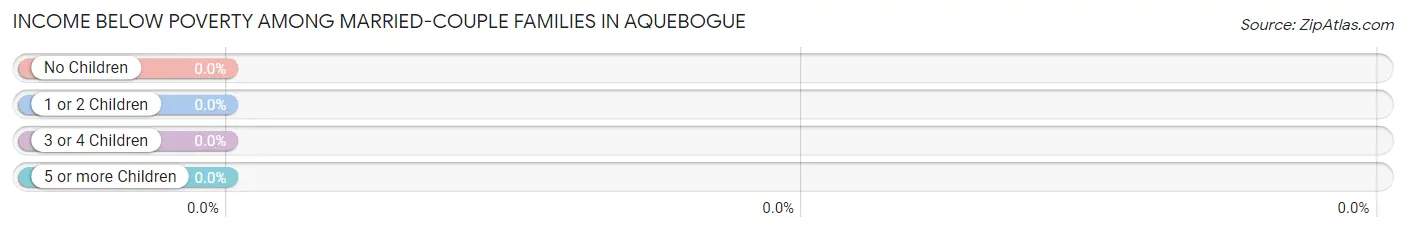
| Children | Above Poverty | Below Poverty |
| No Children | 287 (100.0%) | 0 (0.0%) |
| 1 or 2 Children | 63 (100.0%) | 0 (0.0%) |
| 3 or 4 Children | 104 (100.0%) | 0 (0.0%) |
| 5 or more Children | 0 (0.0%) | 0 (0.0%) |
| Total | 454 (100.0%) | 0 (0.0%) |
Income Below Poverty Among Single-Parent Households in Aquebogue
| Children | Single Father | Single Mother |
| No Children | 0 (0.0%) | 0 (0.0%) |
| 1 or 2 Children | 0 (0.0%) | 0 (0.0%) |
| 3 or 4 Children | 0 (0.0%) | 0 (0.0%) |
| 5 or more Children | 0 (0.0%) | 0 (0.0%) |
| Total | 0 (0.0%) | 0 (0.0%) |
Income Below Poverty Among Married-Couple vs Single-Parent Households in Aquebogue
| Children | Married-Couple Families | Single-Parent Households |
| No Children | 0 (0.0%) | 0 (0.0%) |
| 1 or 2 Children | 0 (0.0%) | 0 (0.0%) |
| 3 or 4 Children | 0 (0.0%) | 0 (0.0%) |
| 5 or more Children | 0 (0.0%) | 0 (0.0%) |
| Total | 0 (0.0%) | 0 (0.0%) |
Race in Aquebogue
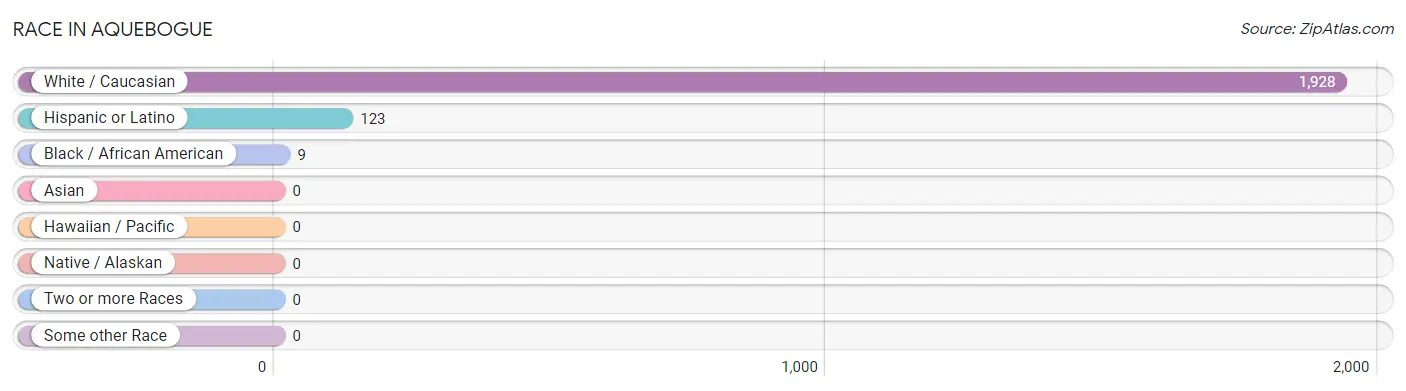
The most populous races in Aquebogue are White / Caucasian (1,928 | 99.5%), Hispanic or Latino (123 | 6.4%), and Black / African American (9 | 0.5%).
| Race | # Population | % Population |
| Asian | 0 | 0.0% |
| Black / African American | 9 | 0.5% |
| Hawaiian / Pacific | 0 | 0.0% |
| Hispanic or Latino | 123 | 6.4% |
| Native / Alaskan | 0 | 0.0% |
| White / Caucasian | 1,928 | 99.5% |
| Two or more Races | 0 | 0.0% |
| Some other Race | 0 | 0.0% |
| Total | 1,937 | 100.0% |
Ancestry in Aquebogue
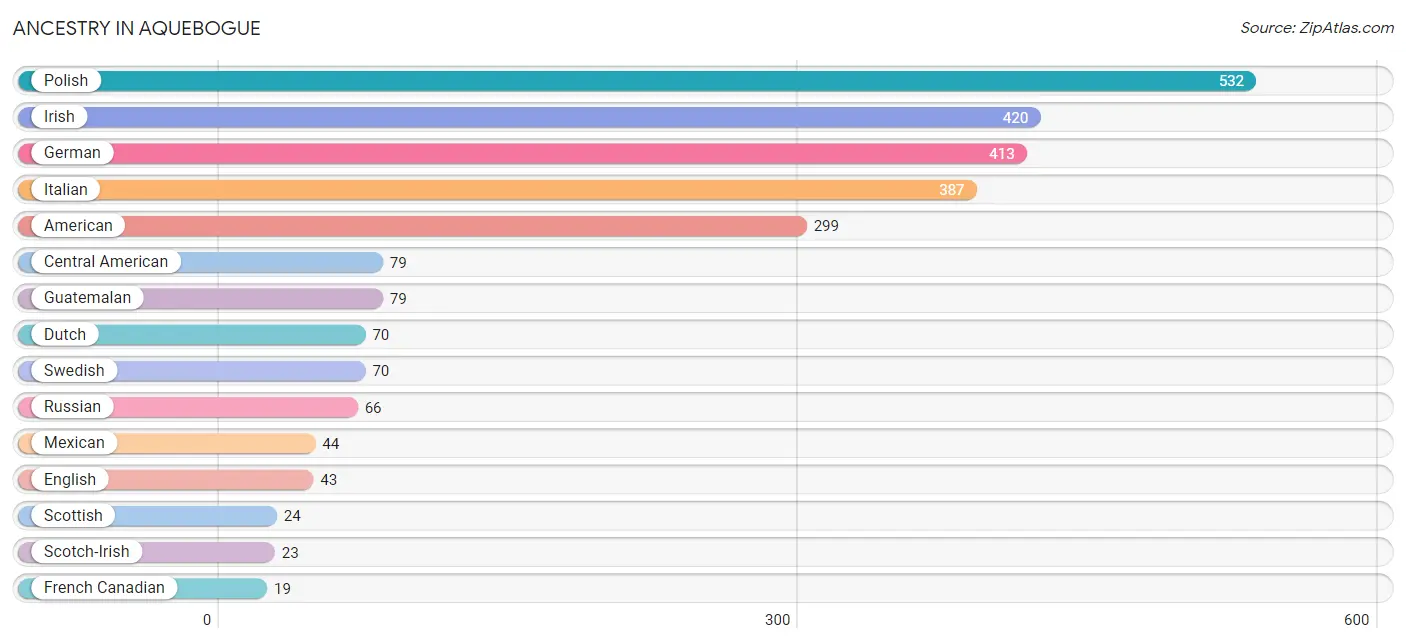
The most populous ancestries reported in Aquebogue are Polish (532 | 27.5%), Irish (420 | 21.7%), German (413 | 21.3%), Italian (387 | 20.0%), and American (299 | 15.4%), together accounting for 105.9% of all Aquebogue residents.
| Ancestry | # Population | % Population |
| American | 299 | 15.4% |
| Armenian | 9 | 0.5% |
| Central American | 79 | 4.1% |
| Dutch | 70 | 3.6% |
| English | 43 | 2.2% |
| French Canadian | 19 | 1.0% |
| German | 413 | 21.3% |
| Guatemalan | 79 | 4.1% |
| Irish | 420 | 21.7% |
| Italian | 387 | 20.0% |
| Mexican | 44 | 2.3% |
| Polish | 532 | 27.5% |
| Russian | 66 | 3.4% |
| Scotch-Irish | 23 | 1.2% |
| Scottish | 24 | 1.2% |
| Swedish | 70 | 3.6% |
| Ukrainian | 14 | 0.7% |
| Welsh | 17 | 0.9% | View All 18 Rows |
Immigrants in Aquebogue
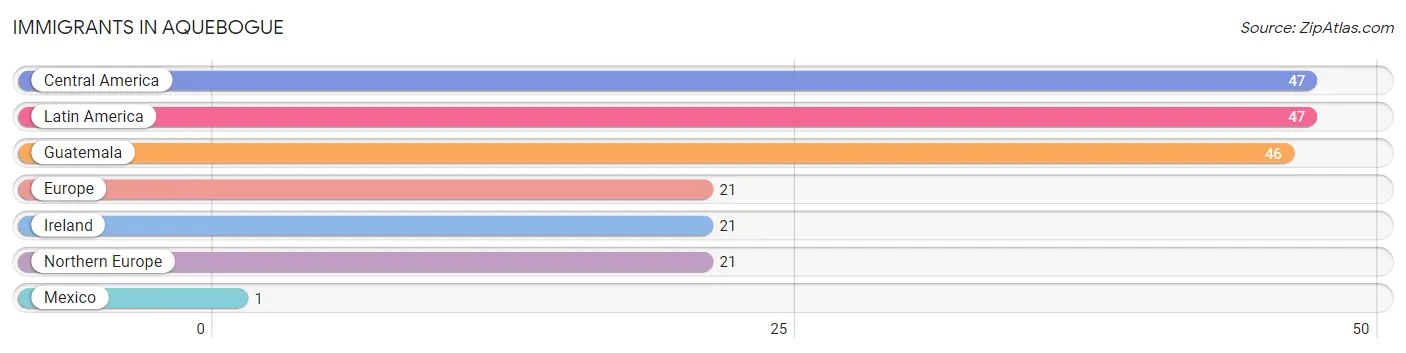
The most numerous immigrant groups reported in Aquebogue came from Central America (47 | 2.4%), Latin America (47 | 2.4%), Guatemala (46 | 2.4%), Europe (21 | 1.1%), and Ireland (21 | 1.1%), together accounting for 9.4% of all Aquebogue residents.
| Immigration Origin | # Population | % Population |
| Central America | 47 | 2.4% |
| Europe | 21 | 1.1% |
| Guatemala | 46 | 2.4% |
| Ireland | 21 | 1.1% |
| Latin America | 47 | 2.4% |
| Mexico | 1 | 0.1% |
| Northern Europe | 21 | 1.1% | View All 7 Rows |
Sex and Age in Aquebogue
Sex and Age in Aquebogue
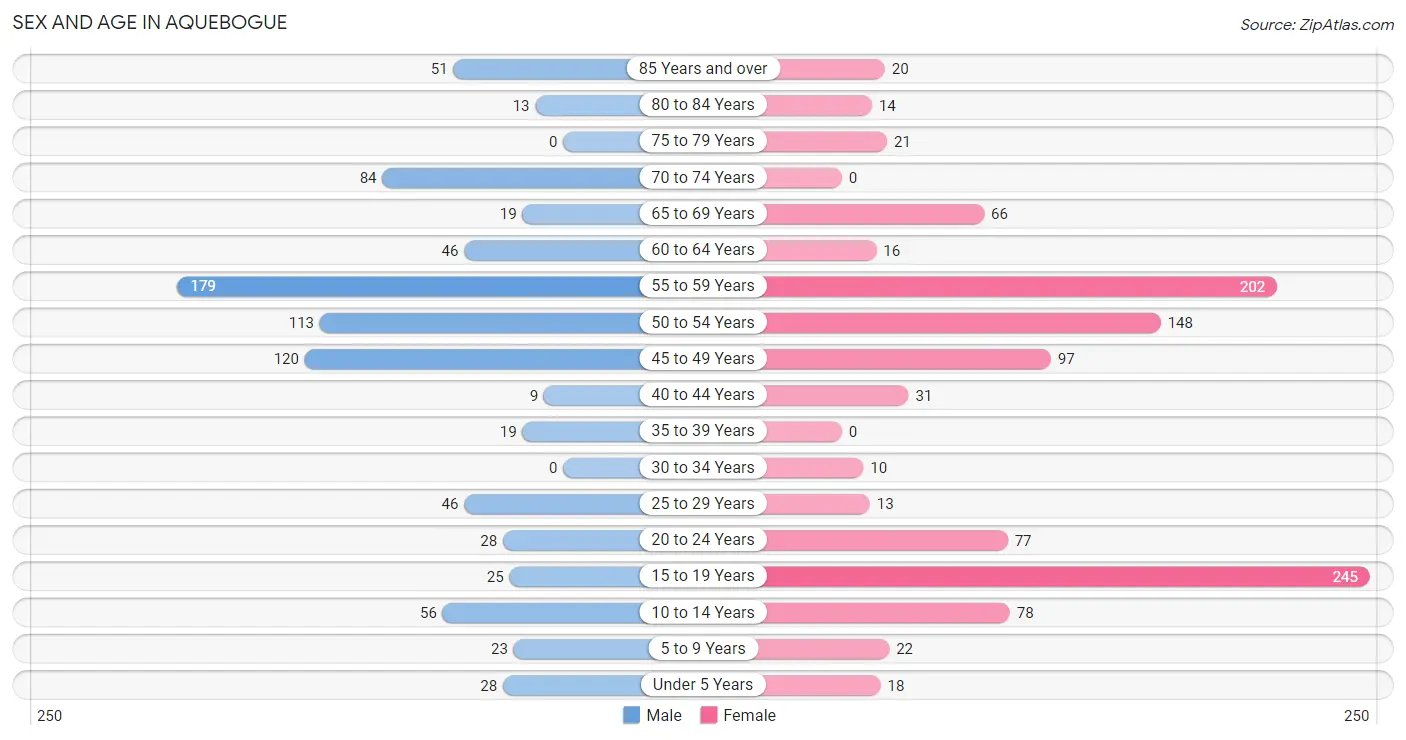
The most populous age groups in Aquebogue are 55 to 59 Years (179 | 20.8%) for men and 15 to 19 Years (245 | 22.7%) for women.
| Age Bracket | Male | Female |
| Under 5 Years | 28 (3.3%) | 18 (1.7%) |
| 5 to 9 Years | 23 (2.7%) | 22 (2.0%) |
| 10 to 14 Years | 56 (6.5%) | 78 (7.2%) |
| 15 to 19 Years | 25 (2.9%) | 245 (22.7%) |
| 20 to 24 Years | 28 (3.3%) | 77 (7.1%) |
| 25 to 29 Years | 46 (5.4%) | 13 (1.2%) |
| 30 to 34 Years | 0 (0.0%) | 10 (0.9%) |
| 35 to 39 Years | 19 (2.2%) | 0 (0.0%) |
| 40 to 44 Years | 9 (1.1%) | 31 (2.9%) |
| 45 to 49 Years | 120 (14.0%) | 97 (9.0%) |
| 50 to 54 Years | 113 (13.2%) | 148 (13.7%) |
| 55 to 59 Years | 179 (20.8%) | 202 (18.7%) |
| 60 to 64 Years | 46 (5.4%) | 16 (1.5%) |
| 65 to 69 Years | 19 (2.2%) | 66 (6.1%) |
| 70 to 74 Years | 84 (9.8%) | 0 (0.0%) |
| 75 to 79 Years | 0 (0.0%) | 21 (1.9%) |
| 80 to 84 Years | 13 (1.5%) | 14 (1.3%) |
| 85 Years and over | 51 (5.9%) | 20 (1.9%) |
| Total | 859 (100.0%) | 1,078 (100.0%) |
Families and Households in Aquebogue
Median Family Size in Aquebogue
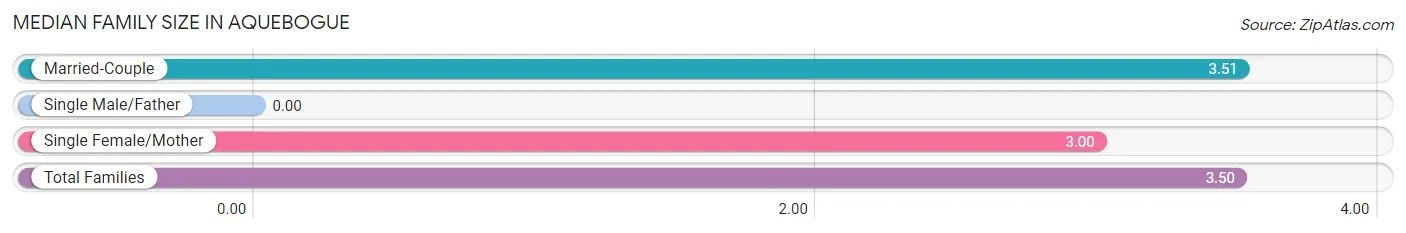
| Family Type | # Families | Family Size |
| Married-Couple | 454 (98.1%) | 3.51 |
| Single Male/Father | 0 (0.0%) | - |
| Single Female/Mother | 9 (1.9%) | 3.00 |
| Total Families | 463 (100.0%) | 3.50 |
Median Household Size in Aquebogue
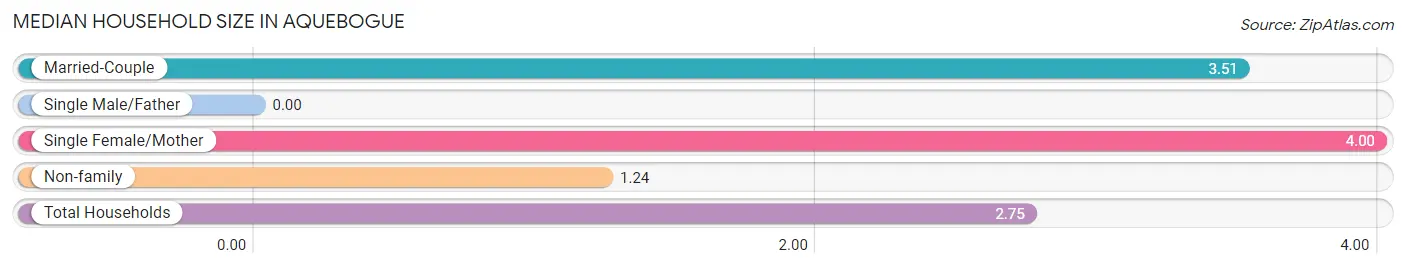
| Household Type | # Households | Household Size |
| Married-Couple | 454 (65.1%) | 3.51 |
| Single Male/Father | 0 (0.0%) | - |
| Single Female/Mother | 9 (1.3%) | 4.00 |
| Non-family | 234 (33.6%) | 1.24 |
| Total Households | 697 (100.0%) | 2.75 |
Household Size by Marriage Status in Aquebogue
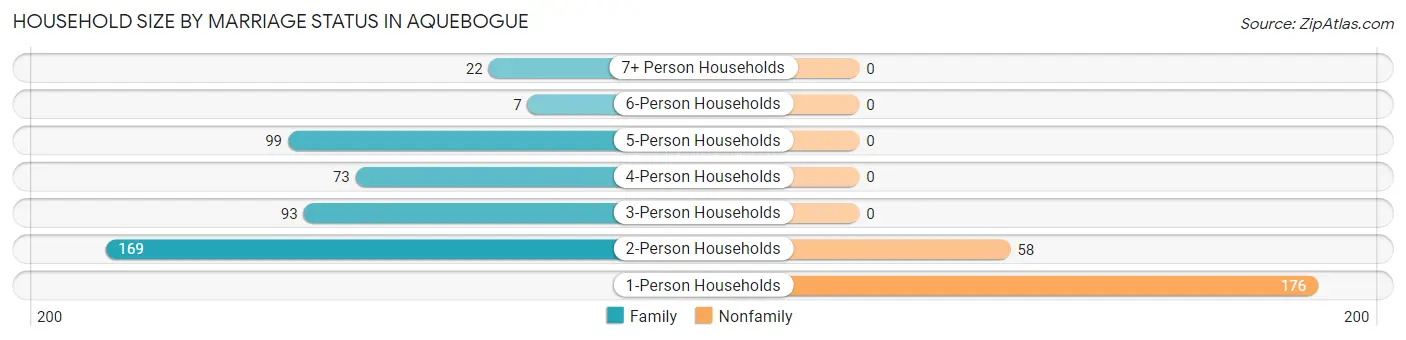
Out of a total of 697 households in Aquebogue, 463 (66.4%) are family households, while 234 (33.6%) are nonfamily households. The most numerous type of family households are 2-person households, comprising 169, and the most common type of nonfamily households are 1-person households, comprising 176.
| Household Size | Family Households | Nonfamily Households |
| 1-Person Households | - | 176 (25.3%) |
| 2-Person Households | 169 (24.2%) | 58 (8.3%) |
| 3-Person Households | 93 (13.3%) | 0 (0.0%) |
| 4-Person Households | 73 (10.5%) | 0 (0.0%) |
| 5-Person Households | 99 (14.2%) | 0 (0.0%) |
| 6-Person Households | 7 (1.0%) | 0 (0.0%) |
| 7+ Person Households | 22 (3.2%) | 0 (0.0%) |
| Total | 463 (66.4%) | 234 (33.6%) |
Female Fertility in Aquebogue
Fertility by Age in Aquebogue
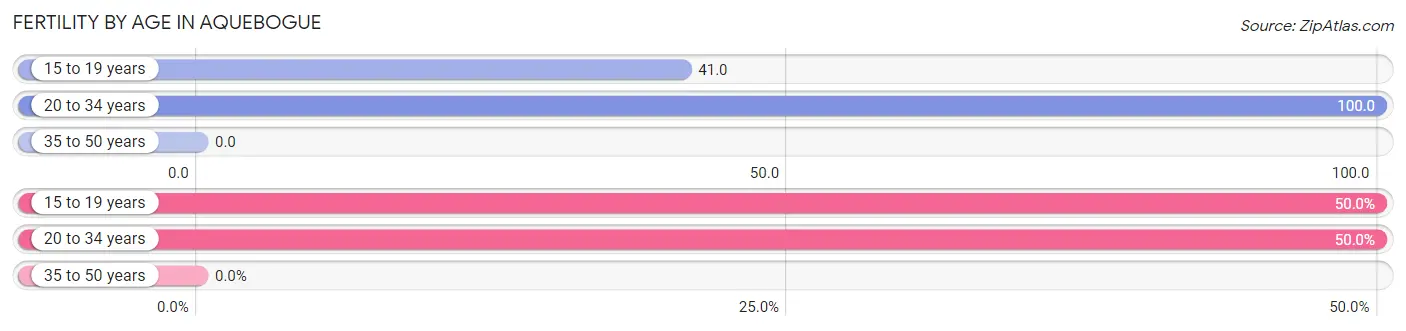
Average fertility rate in Aquebogue is 42.0 births per 1,000 women. Women in the age bracket of 20 to 34 years have the highest fertility rate with 100.0 births per 1,000 women. Women in the age bracket of 15 to 19 years acount for 50.0% of all women with births.
| Age Bracket | Women with Births | Births / 1,000 Women |
| 15 to 19 years | 10 (50.0%) | 41.0 |
| 20 to 34 years | 10 (50.0%) | 100.0 |
| 35 to 50 years | 0 (0.0%) | 0.0 |
| Total | 20 (100.0%) | 42.0 |
Fertility by Age by Marriage Status in Aquebogue
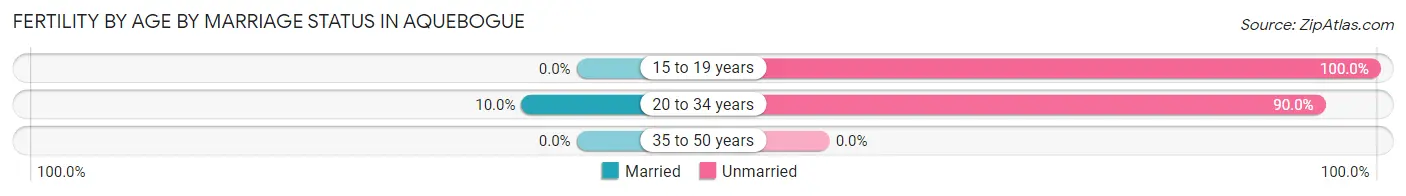
5.0% of women with births (20) in Aquebogue are married. The highest percentage of unmarried women with births falls into 15 to 19 years age bracket with 100.0% of them unmarried at the time of birth, while the lowest percentage of unmarried women with births belong to 20 to 34 years age bracket with 90.0% of them unmarried.
| Age Bracket | Married | Unmarried |
| 15 to 19 years | 0 (0.0%) | 10 (100.0%) |
| 20 to 34 years | 1 (10.0%) | 9 (90.0%) |
| 35 to 50 years | 0 (0.0%) | 0 (0.0%) |
| Total | 1 (5.0%) | 19 (95.0%) |
Fertility by Education in Aquebogue
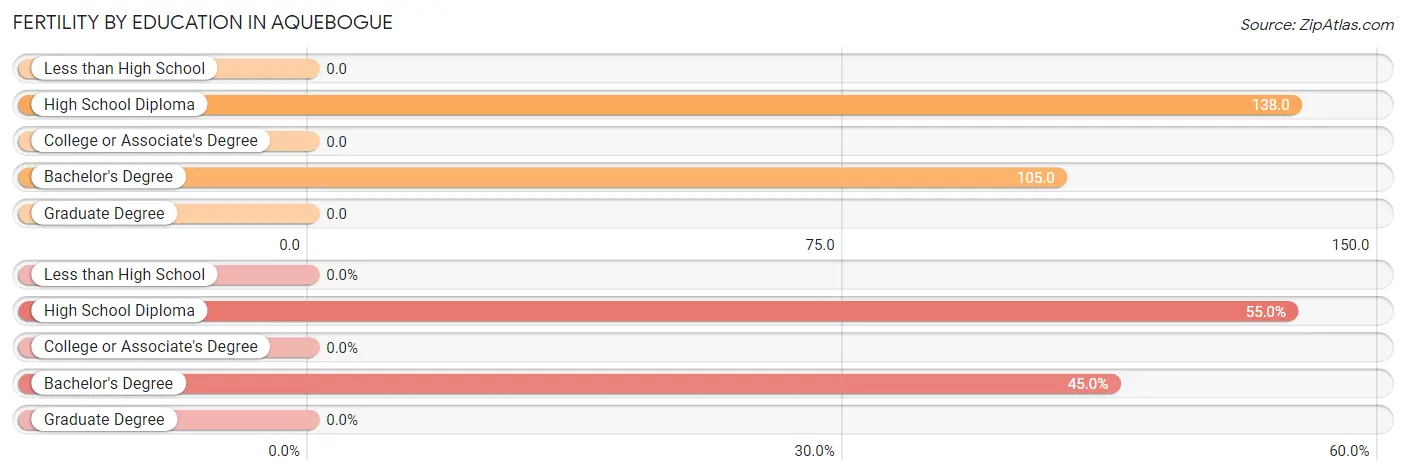
| Educational Attainment | Women with Births | Births / 1,000 Women |
| Less than High School | 0 (0.0%) | 0.0 |
| High School Diploma | 11 (55.0%) | 138.0 |
| College or Associate's Degree | 0 (0.0%) | 0.0 |
| Bachelor's Degree | 9 (45.0%) | 105.0 |
| Graduate Degree | 0 (0.0%) | 0.0 |
| Total | 20 (100.0%) | 42.0 |
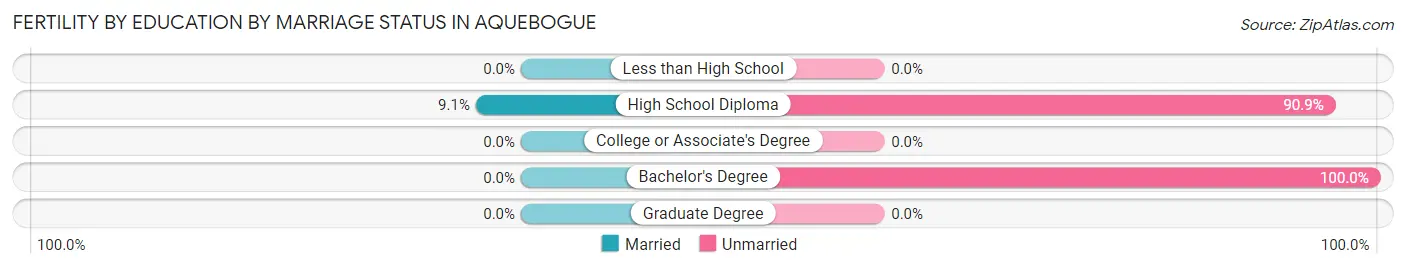
Fertility by Education by Marriage Status in Aquebogue
95.0% of women with births in Aquebogue are unmarried. Women with the educational attainment of high school diploma are most likely to be married with 9.1% of them married at childbirth, while women with the educational attainment of bachelor's degree are least likely to be married with 100.0% of them unmarried at childbirth.
| Educational Attainment | Married | Unmarried |
| Less than High School | 0 (0.0%) | 0 (0.0%) |
| High School Diploma | 1 (9.1%) | 10 (90.9%) |
| College or Associate's Degree | 0 (0.0%) | 0 (0.0%) |
| Bachelor's Degree | 0 (0.0%) | 9 (100.0%) |
| Graduate Degree | 0 (0.0%) | 0 (0.0%) |
| Total | 1 (5.0%) | 19 (95.0%) |
Employment Characteristics in Aquebogue
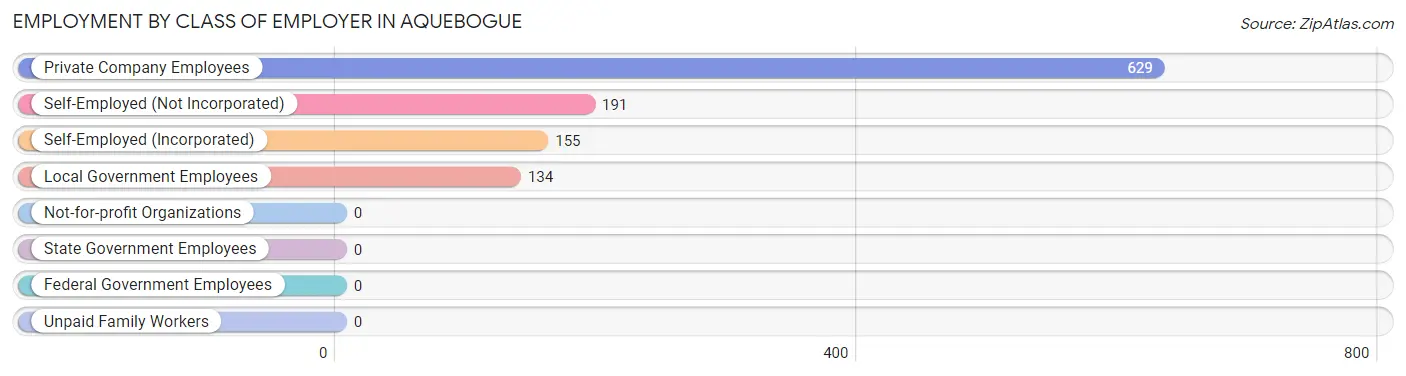
Employment by Class of Employer in Aquebogue
Among the 1,109 employed individuals in Aquebogue, private company employees (629 | 56.7%), self-employed (not incorporated) (191 | 17.2%), and self-employed (incorporated) (155 | 14.0%) make up the most common classes of employment.
| Employer Class | # Employees | % Employees |
| Private Company Employees | 629 | 56.7% |
| Self-Employed (Incorporated) | 155 | 14.0% |
| Self-Employed (Not Incorporated) | 191 | 17.2% |
| Not-for-profit Organizations | 0 | 0.0% |
| Local Government Employees | 134 | 12.1% |
| State Government Employees | 0 | 0.0% |
| Federal Government Employees | 0 | 0.0% |
| Unpaid Family Workers | 0 | 0.0% |
| Total | 1,109 | 100.0% |
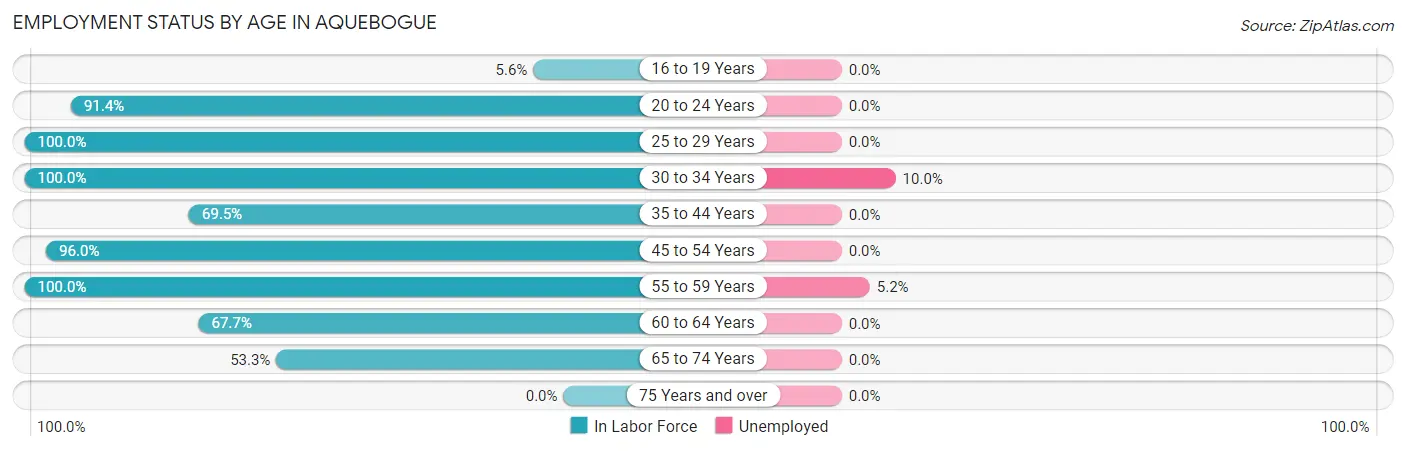
Employment Status by Age in Aquebogue
According to the labor force statistics for Aquebogue, out of the total population over 16 years of age (1,619), 73.4% or 1,188 individuals are in the labor force, with 1.8% or 21 of them unemployed. The age group with the highest labor force participation rate is 25 to 29 years, with 100.0% or 59 individuals in the labor force. Within the labor force, the 30 to 34 years age range has the highest percentage of unemployed individuals, with 10.0% or 1 of them being unemployed.
| Age Bracket | In Labor Force | Unemployed |
| 16 to 19 Years | 10 (5.6%) | 0 (0.0%) |
| 20 to 24 Years | 96 (91.4%) | 0 (0.0%) |
| 25 to 29 Years | 59 (100.0%) | 0 (0.0%) |
| 30 to 34 Years | 10 (100.0%) | 1 (10.0%) |
| 35 to 44 Years | 41 (69.5%) | 0 (0.0%) |
| 45 to 54 Years | 459 (96.0%) | 0 (0.0%) |
| 55 to 59 Years | 381 (100.0%) | 20 (5.2%) |
| 60 to 64 Years | 42 (67.7%) | 0 (0.0%) |
| 65 to 74 Years | 90 (53.3%) | 0 (0.0%) |
| 75 Years and over | 0 (0.0%) | 0 (0.0%) |
| Total | 1,188 (73.4%) | 21 (1.8%) |
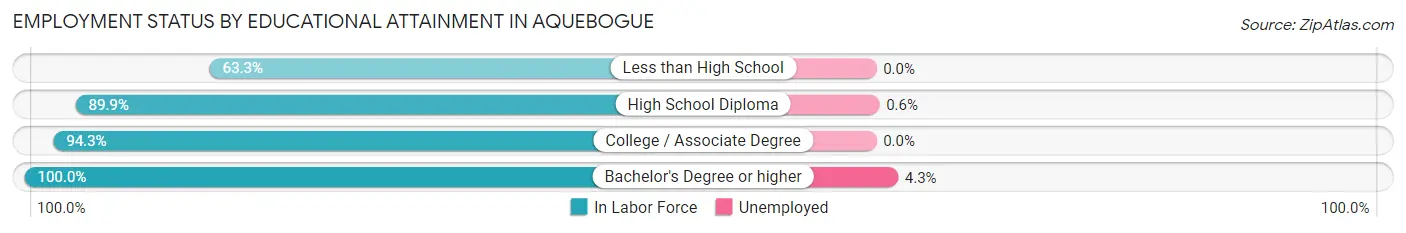
Employment Status by Educational Attainment in Aquebogue
According to labor force statistics for Aquebogue, 94.6% of individuals (992) out of the total population between 25 and 64 years of age (1,049) are in the labor force, with 2.1% or 21 of them being unemployed. The group with the highest labor force participation rate are those with the educational attainment of bachelor's degree or higher, with 100.0% or 462 individuals in the labor force. Within the labor force, individuals with bachelor's degree or higher education have the highest percentage of unemployment, with 4.3% or 20 of them being unemployed.
| Educational Attainment | In Labor Force | Unemployed |
| Less than High School | 31 (63.3%) | 0 (0.0%) |
| High School Diploma | 169 (89.9%) | 1 (0.6%) |
| College / Associate Degree | 330 (94.3%) | 0 (0.0%) |
| Bachelor's Degree or higher | 462 (100.0%) | 20 (4.3%) |
| Total | 992 (94.6%) | 22 (2.1%) |
Employment Occupations by Sex in Aquebogue
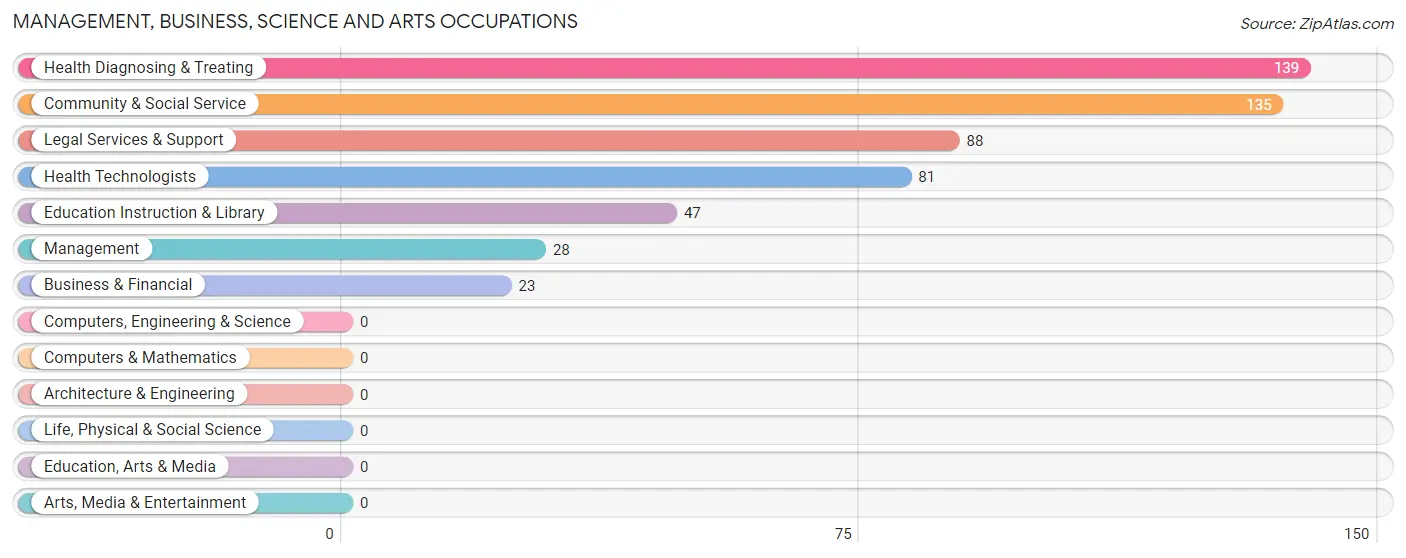
Management, Business, Science and Arts Occupations
The most common Management, Business, Science and Arts occupations in Aquebogue are Health Diagnosing & Treating (139 | 11.9%), Community & Social Service (135 | 11.6%), Legal Services & Support (88 | 7.5%), Health Technologists (81 | 6.9%), and Education Instruction & Library (47 | 4.0%).
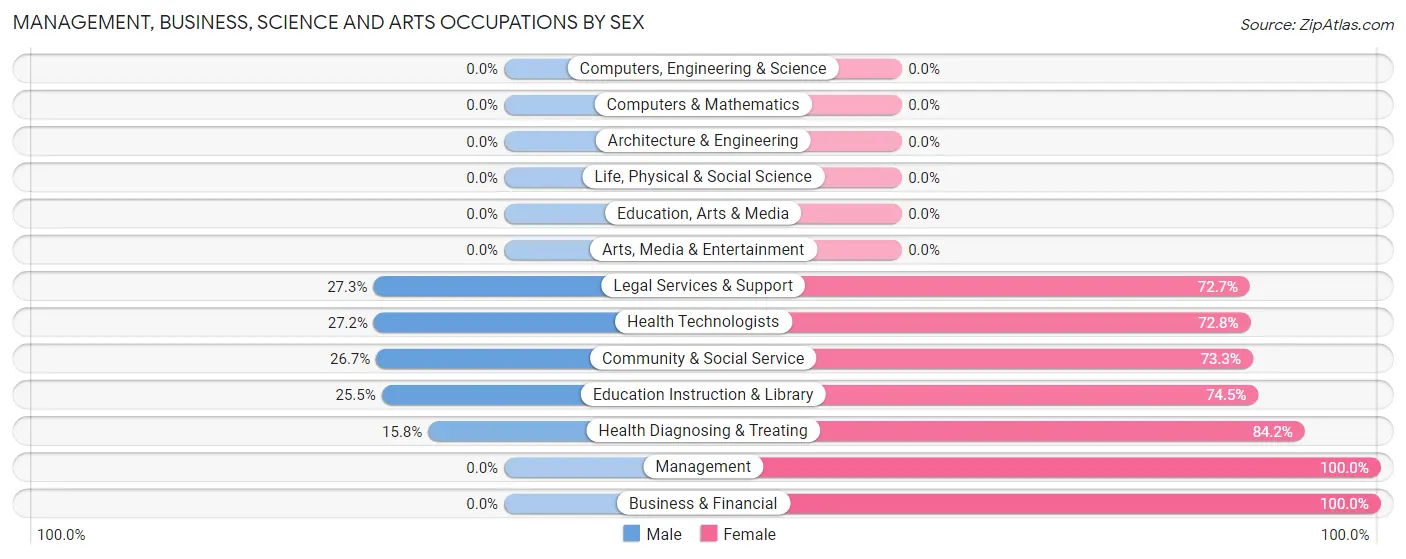
Management, Business, Science and Arts Occupations by Sex
Within the Management, Business, Science and Arts occupations in Aquebogue, the most male-oriented occupations are Legal Services & Support (27.3%), Health Technologists (27.2%), and Community & Social Service (26.7%), while the most female-oriented occupations are Management (100.0%), Business & Financial (100.0%), and Health Diagnosing & Treating (84.2%).
| Occupation | Male | Female |
| Management | 0 (0.0%) | 28 (100.0%) |
| Business & Financial | 0 (0.0%) | 23 (100.0%) |
| Computers, Engineering & Science | 0 (0.0%) | 0 (0.0%) |
| Computers & Mathematics | 0 (0.0%) | 0 (0.0%) |
| Architecture & Engineering | 0 (0.0%) | 0 (0.0%) |
| Life, Physical & Social Science | 0 (0.0%) | 0 (0.0%) |
| Community & Social Service | 36 (26.7%) | 99 (73.3%) |
| Education, Arts & Media | 0 (0.0%) | 0 (0.0%) |
| Legal Services & Support | 24 (27.3%) | 64 (72.7%) |
| Education Instruction & Library | 12 (25.5%) | 35 (74.5%) |
| Arts, Media & Entertainment | 0 (0.0%) | 0 (0.0%) |
| Health Diagnosing & Treating | 22 (15.8%) | 117 (84.2%) |
| Health Technologists | 22 (27.2%) | 59 (72.8%) |
| Total (Category) | 58 (17.8%) | 267 (82.2%) |
| Total (Overall) | 573 (49.1%) | 594 (50.9%) |
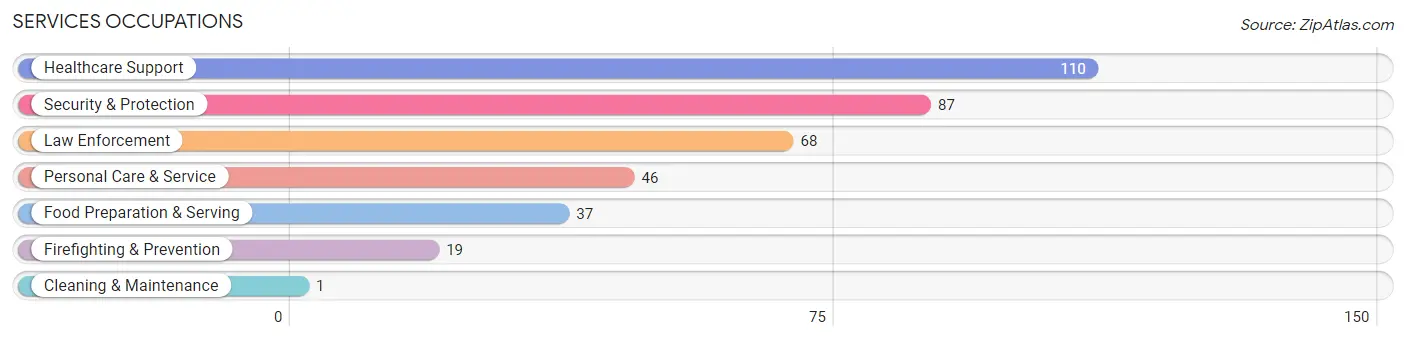
Services Occupations
The most common Services occupations in Aquebogue are Healthcare Support (110 | 9.4%), Security & Protection (87 | 7.5%), Law Enforcement (68 | 5.8%), Personal Care & Service (46 | 3.9%), and Food Preparation & Serving (37 | 3.2%).
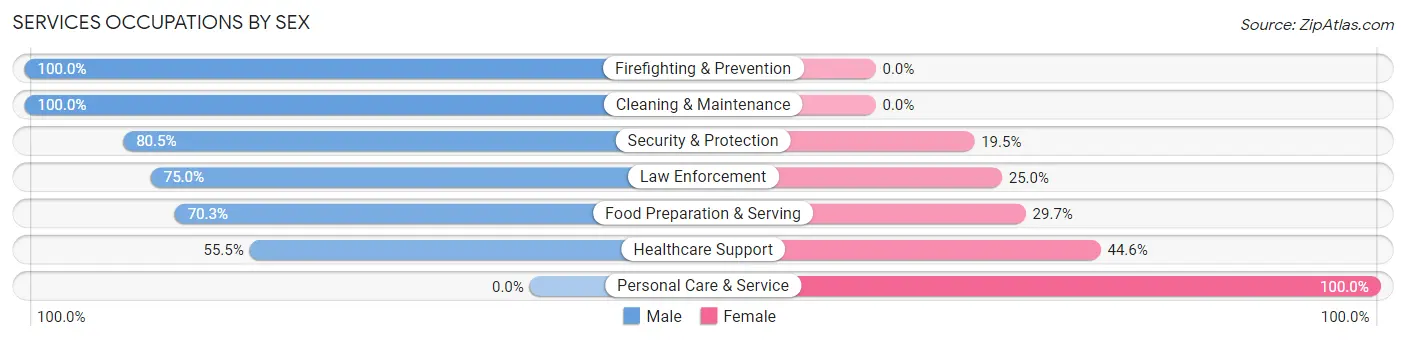
Services Occupations by Sex
Within the Services occupations in Aquebogue, the most male-oriented occupations are Firefighting & Prevention (100.0%), Cleaning & Maintenance (100.0%), and Security & Protection (80.5%), while the most female-oriented occupations are Personal Care & Service (100.0%), Healthcare Support (44.6%), and Food Preparation & Serving (29.7%).
| Occupation | Male | Female |
| Healthcare Support | 61 (55.4%) | 49 (44.6%) |
| Security & Protection | 70 (80.5%) | 17 (19.5%) |
| Firefighting & Prevention | 19 (100.0%) | 0 (0.0%) |
| Law Enforcement | 51 (75.0%) | 17 (25.0%) |
| Food Preparation & Serving | 26 (70.3%) | 11 (29.7%) |
| Cleaning & Maintenance | 1 (100.0%) | 0 (0.0%) |
| Personal Care & Service | 0 (0.0%) | 46 (100.0%) |
| Total (Category) | 158 (56.2%) | 123 (43.8%) |
| Total (Overall) | 573 (49.1%) | 594 (50.9%) |
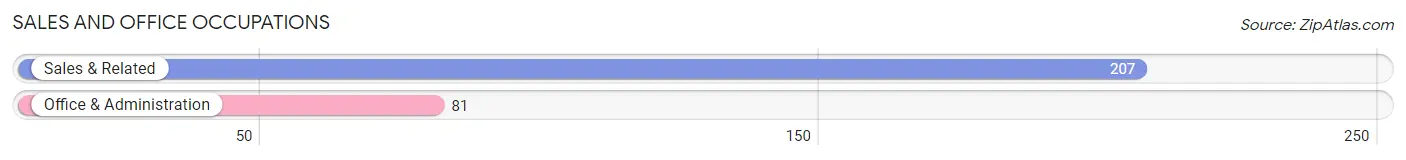
Sales and Office Occupations
The most common Sales and Office occupations in Aquebogue are Sales & Related (207 | 17.7%), and Office & Administration (81 | 6.9%).
Sales and Office Occupations by Sex
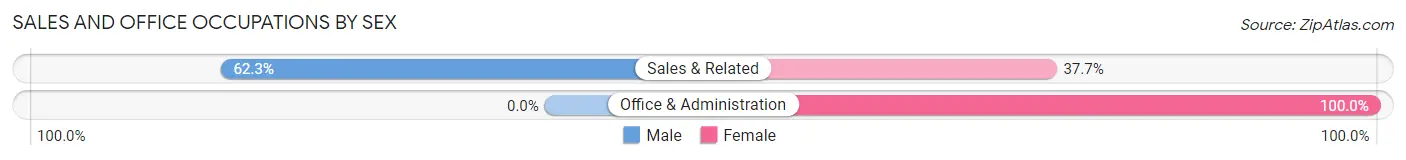
| Occupation | Male | Female |
| Sales & Related | 129 (62.3%) | 78 (37.7%) |
| Office & Administration | 0 (0.0%) | 81 (100.0%) |
| Total (Category) | 129 (44.8%) | 159 (55.2%) |
| Total (Overall) | 573 (49.1%) | 594 (50.9%) |
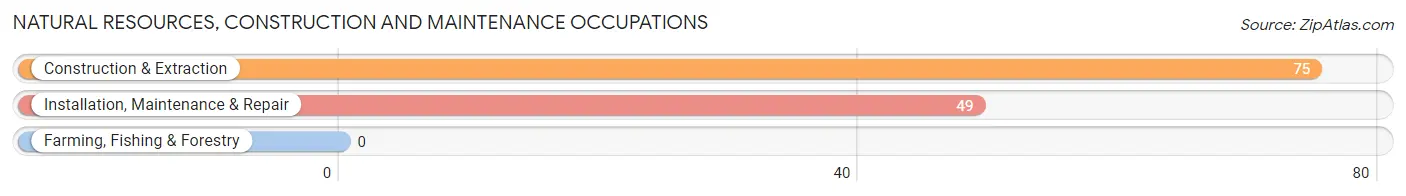
Natural Resources, Construction and Maintenance Occupations
The most common Natural Resources, Construction and Maintenance occupations in Aquebogue are Construction & Extraction (75 | 6.4%), and Installation, Maintenance & Repair (49 | 4.2%).
Natural Resources, Construction and Maintenance Occupations by Sex
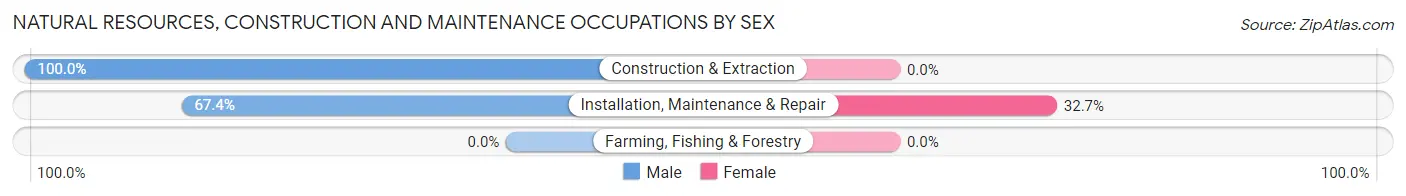
| Occupation | Male | Female |
| Farming, Fishing & Forestry | 0 (0.0%) | 0 (0.0%) |
| Construction & Extraction | 75 (100.0%) | 0 (0.0%) |
| Installation, Maintenance & Repair | 33 (67.3%) | 16 (32.7%) |
| Total (Category) | 108 (87.1%) | 16 (12.9%) |
| Total (Overall) | 573 (49.1%) | 594 (50.9%) |
Production, Transportation and Moving Occupations
The most common Production, Transportation and Moving occupations in Aquebogue are Transportation (130 | 11.1%), and Material Moving (19 | 1.6%).
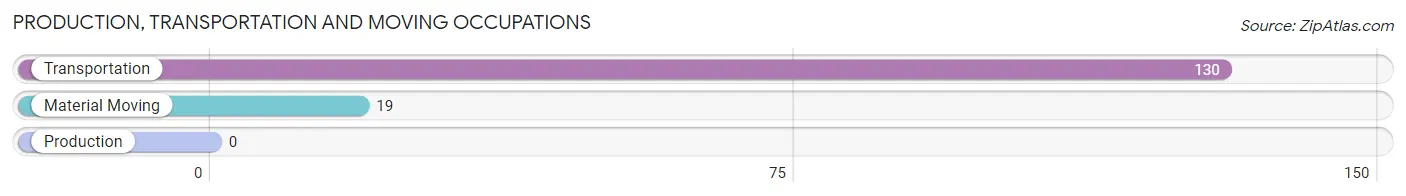
Production, Transportation and Moving Occupations by Sex
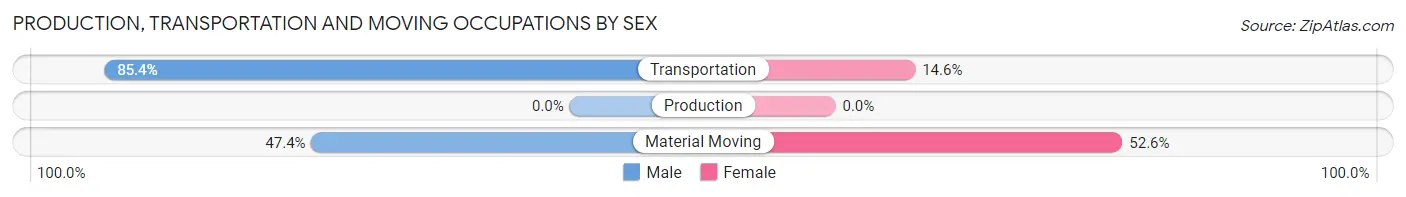
| Occupation | Male | Female |
| Production | 0 (0.0%) | 0 (0.0%) |
| Transportation | 111 (85.4%) | 19 (14.6%) |
| Material Moving | 9 (47.4%) | 10 (52.6%) |
| Total (Category) | 120 (80.5%) | 29 (19.5%) |
| Total (Overall) | 573 (49.1%) | 594 (50.9%) |
Employment Industries by Sex in Aquebogue
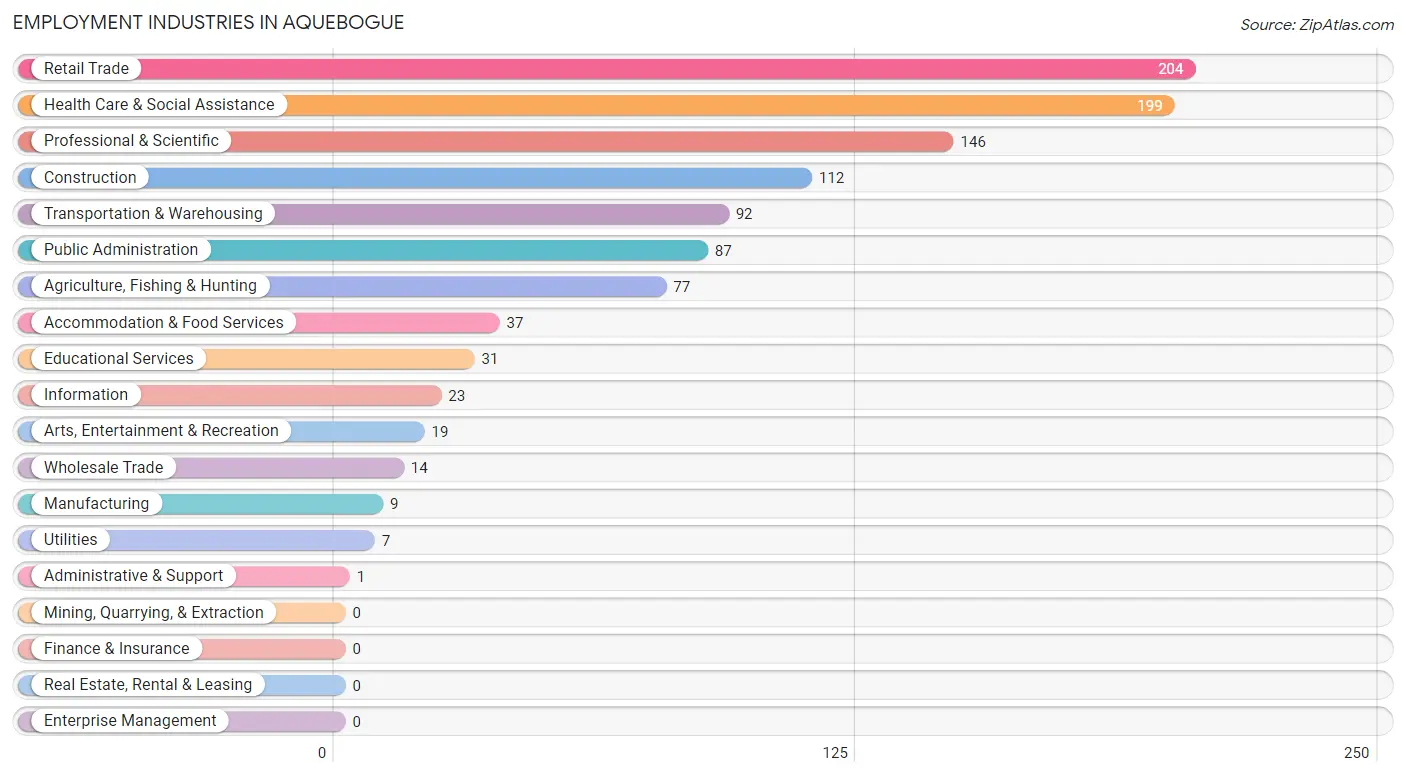
Employment Industries in Aquebogue
The major employment industries in Aquebogue include Retail Trade (204 | 17.5%), Health Care & Social Assistance (199 | 17.1%), Professional & Scientific (146 | 12.5%), Construction (112 | 9.6%), and Transportation & Warehousing (92 | 7.9%).
Employment Industries by Sex in Aquebogue
The Aquebogue industries that see more men than women are Utilities (100.0%), Administrative & Support (100.0%), and Arts, Entertainment & Recreation (100.0%), whereas the industries that tend to have a higher number of women are Manufacturing (100.0%), Wholesale Trade (100.0%), and Information (100.0%).
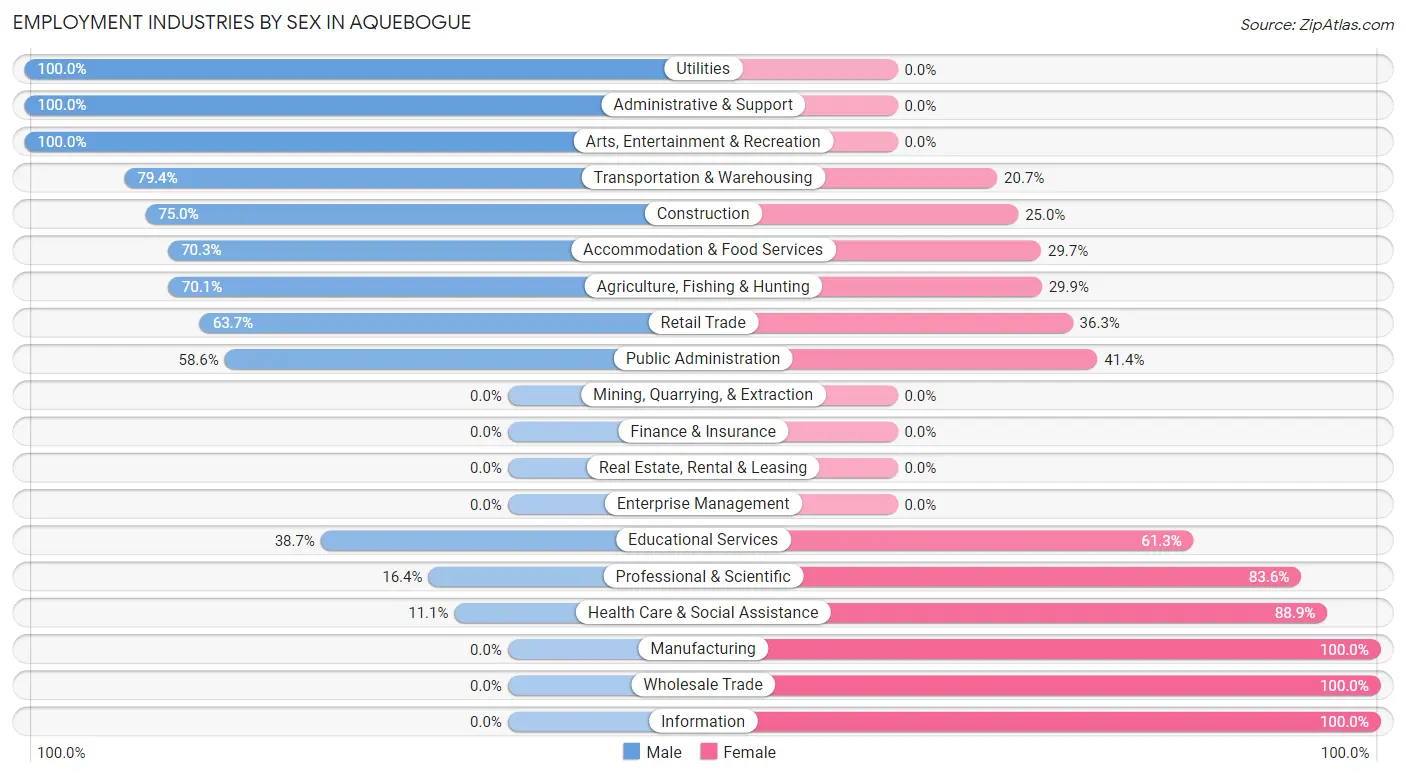
| Industry | Male | Female |
| Agriculture, Fishing & Hunting | 54 (70.1%) | 23 (29.9%) |
| Mining, Quarrying, & Extraction | 0 (0.0%) | 0 (0.0%) |
| Construction | 84 (75.0%) | 28 (25.0%) |
| Manufacturing | 0 (0.0%) | 9 (100.0%) |
| Wholesale Trade | 0 (0.0%) | 14 (100.0%) |
| Retail Trade | 130 (63.7%) | 74 (36.3%) |
| Transportation & Warehousing | 73 (79.3%) | 19 (20.6%) |
| Utilities | 7 (100.0%) | 0 (0.0%) |
| Information | 0 (0.0%) | 23 (100.0%) |
| Finance & Insurance | 0 (0.0%) | 0 (0.0%) |
| Real Estate, Rental & Leasing | 0 (0.0%) | 0 (0.0%) |
| Professional & Scientific | 24 (16.4%) | 122 (83.6%) |
| Enterprise Management | 0 (0.0%) | 0 (0.0%) |
| Administrative & Support | 1 (100.0%) | 0 (0.0%) |
| Educational Services | 12 (38.7%) | 19 (61.3%) |
| Health Care & Social Assistance | 22 (11.1%) | 177 (88.9%) |
| Arts, Entertainment & Recreation | 19 (100.0%) | 0 (0.0%) |
| Accommodation & Food Services | 26 (70.3%) | 11 (29.7%) |
| Public Administration | 51 (58.6%) | 36 (41.4%) |
| Total | 573 (49.1%) | 594 (50.9%) |
Education in Aquebogue
School Enrollment in Aquebogue
The most common levels of schooling among the 501 students in Aquebogue are high school (207 | 41.3%), middle school (134 | 26.8%), and college / undergraduate (115 | 23.0%).
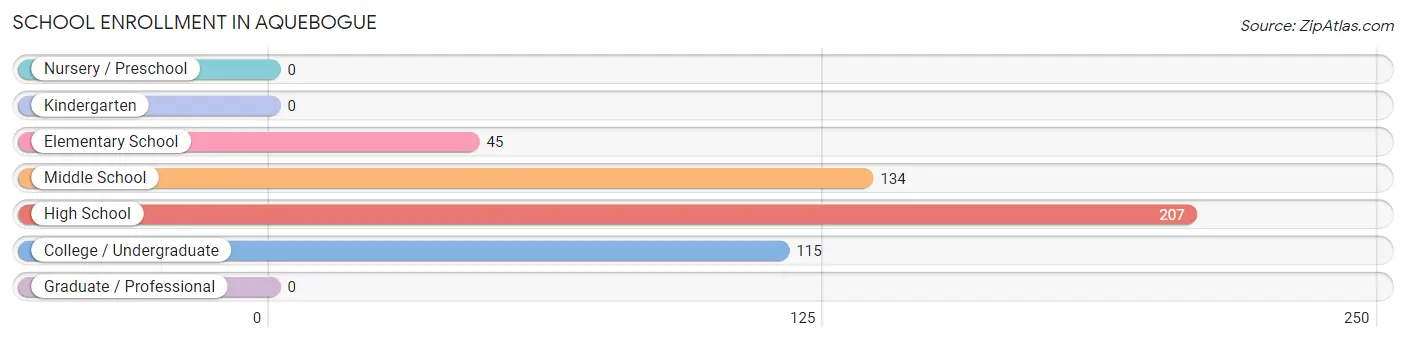
| School Level | # Students | % Students |
| Nursery / Preschool | 0 | 0.0% |
| Kindergarten | 0 | 0.0% |
| Elementary School | 45 | 9.0% |
| Middle School | 134 | 26.8% |
| High School | 207 | 41.3% |
| College / Undergraduate | 115 | 23.0% |
| Graduate / Professional | 0 | 0.0% |
| Total | 501 | 100.0% |
School Enrollment by Age by Funding Source in Aquebogue
Out of a total of 501 students who are enrolled in schools in Aquebogue, 121 (24.2%) attend a private institution, while the remaining 380 (75.8%) are enrolled in public schools. The age group of 35 years and over has the highest likelihood of being enrolled in private schools, with 27 (67.5% in the age bracket) enrolled. Conversely, the age group of 20 to 24 year olds has the lowest likelihood of being enrolled in a private school, with 9 (100.0% in the age bracket) attending a public institution.
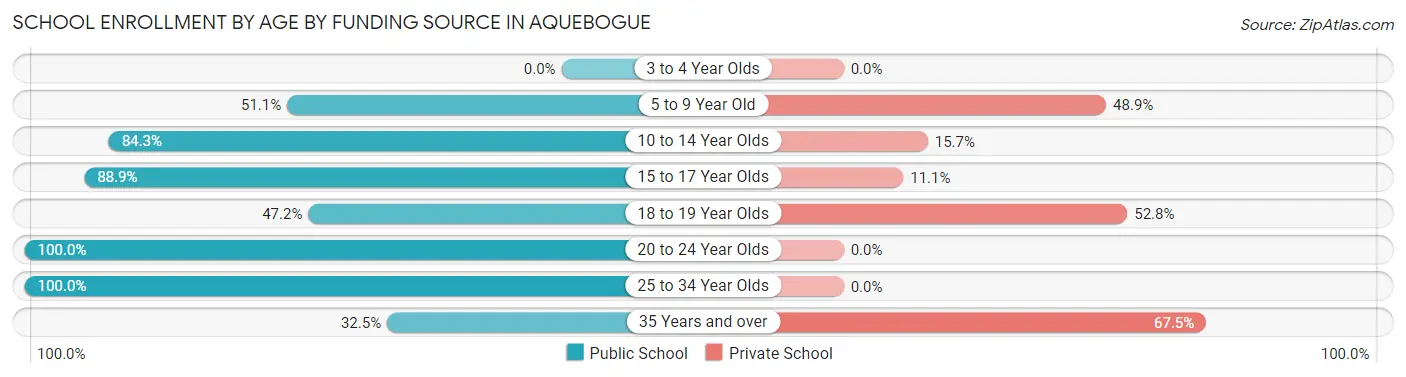
| Age Bracket | Public School | Private School |
| 3 to 4 Year Olds | 0 (0.0%) | 0 (0.0%) |
| 5 to 9 Year Old | 23 (51.1%) | 22 (48.9%) |
| 10 to 14 Year Olds | 113 (84.3%) | 21 (15.7%) |
| 15 to 17 Year Olds | 184 (88.9%) | 23 (11.1%) |
| 18 to 19 Year Olds | 25 (47.2%) | 28 (52.8%) |
| 20 to 24 Year Olds | 9 (100.0%) | 0 (0.0%) |
| 25 to 34 Year Olds | 13 (100.0%) | 0 (0.0%) |
| 35 Years and over | 13 (32.5%) | 27 (67.5%) |
| Total | 380 (75.8%) | 121 (24.2%) |
Educational Attainment by Field of Study in Aquebogue
Business (219 | 43.6%), science & technology (142 | 28.3%), communications (34 | 6.8%), engineering (24 | 4.8%), and education (24 | 4.8%) are the most common fields of study among 502 individuals in Aquebogue who have obtained a bachelor's degree or higher.
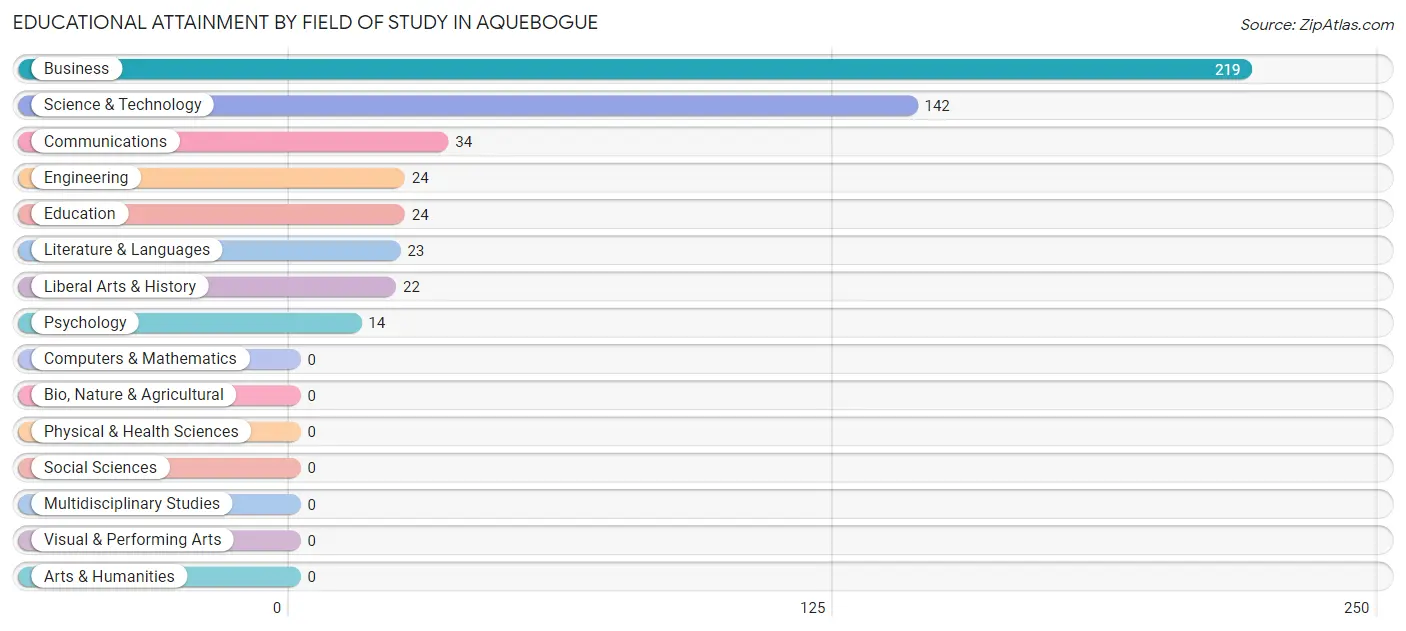
| Field of Study | # Graduates | % Graduates |
| Computers & Mathematics | 0 | 0.0% |
| Bio, Nature & Agricultural | 0 | 0.0% |
| Physical & Health Sciences | 0 | 0.0% |
| Psychology | 14 | 2.8% |
| Social Sciences | 0 | 0.0% |
| Engineering | 24 | 4.8% |
| Multidisciplinary Studies | 0 | 0.0% |
| Science & Technology | 142 | 28.3% |
| Business | 219 | 43.6% |
| Education | 24 | 4.8% |
| Literature & Languages | 23 | 4.6% |
| Liberal Arts & History | 22 | 4.4% |
| Visual & Performing Arts | 0 | 0.0% |
| Communications | 34 | 6.8% |
| Arts & Humanities | 0 | 0.0% |
| Total | 502 | 100.0% |
Transportation & Commute in Aquebogue
Vehicle Availability by Sex in Aquebogue
The most prevalent vehicle ownership categories in Aquebogue are males with 4 vehicles (212, accounting for 37.0%) and females with 4 vehicles (202, making up 39.6%).
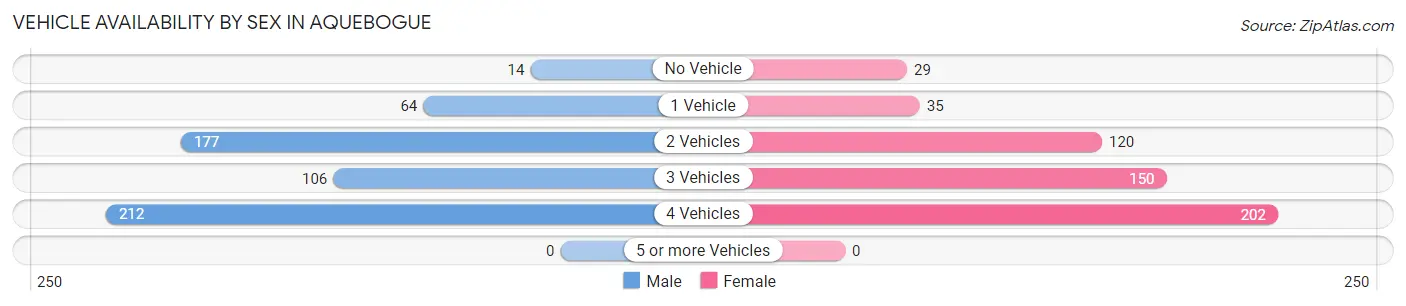
| Vehicles Available | Male | Female |
| No Vehicle | 14 (2.4%) | 29 (5.4%) |
| 1 Vehicle | 64 (11.2%) | 35 (6.5%) |
| 2 Vehicles | 177 (30.9%) | 120 (22.4%) |
| 3 Vehicles | 106 (18.5%) | 150 (28.0%) |
| 4 Vehicles | 212 (37.0%) | 202 (37.7%) |
| 5 or more Vehicles | 0 (0.0%) | 0 (0.0%) |
| Total | 573 (100.0%) | 536 (100.0%) |
Commute Time in Aquebogue
The most frequently occuring commute durations in Aquebogue are 10 to 14 minutes (219 commuters, 20.7%), 30 to 34 minutes (209 commuters, 19.8%), and 15 to 19 minutes (175 commuters, 16.5%).
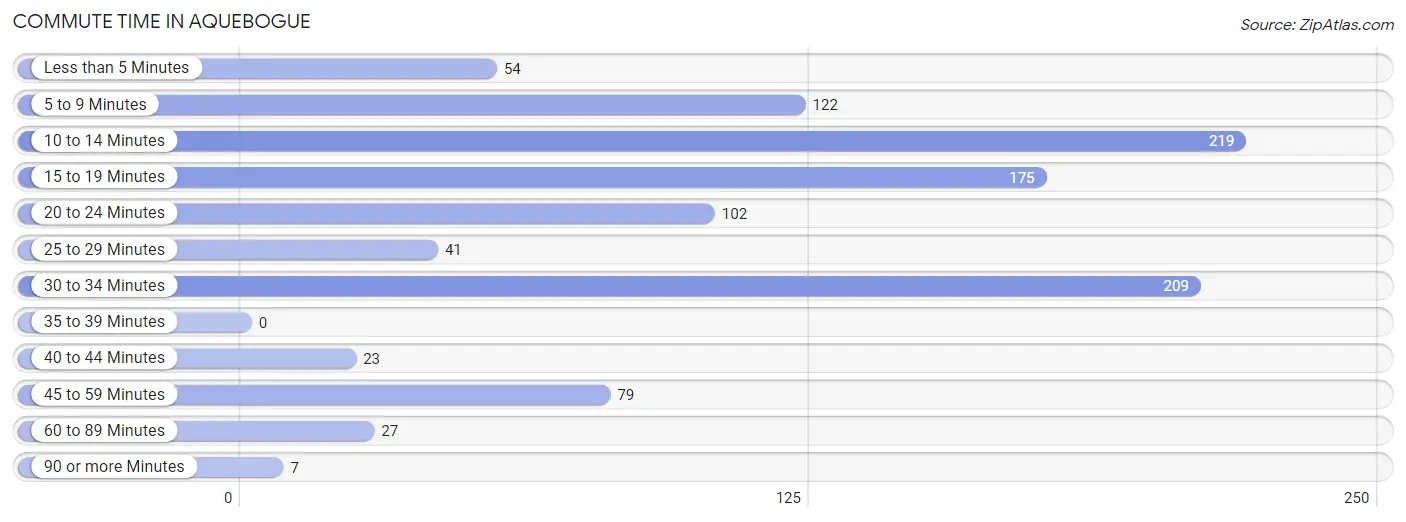
| Commute Time | # Commuters | % Commuters |
| Less than 5 Minutes | 54 | 5.1% |
| 5 to 9 Minutes | 122 | 11.5% |
| 10 to 14 Minutes | 219 | 20.7% |
| 15 to 19 Minutes | 175 | 16.5% |
| 20 to 24 Minutes | 102 | 9.6% |
| 25 to 29 Minutes | 41 | 3.9% |
| 30 to 34 Minutes | 209 | 19.8% |
| 35 to 39 Minutes | 0 | 0.0% |
| 40 to 44 Minutes | 23 | 2.2% |
| 45 to 59 Minutes | 79 | 7.5% |
| 60 to 89 Minutes | 27 | 2.5% |
| 90 or more Minutes | 7 | 0.7% |
Commute Time by Sex in Aquebogue
The most common commute times in Aquebogue are 30 to 34 minutes (183 commuters, 31.9%) for males and 10 to 14 minutes (140 commuters, 28.9%) for females.
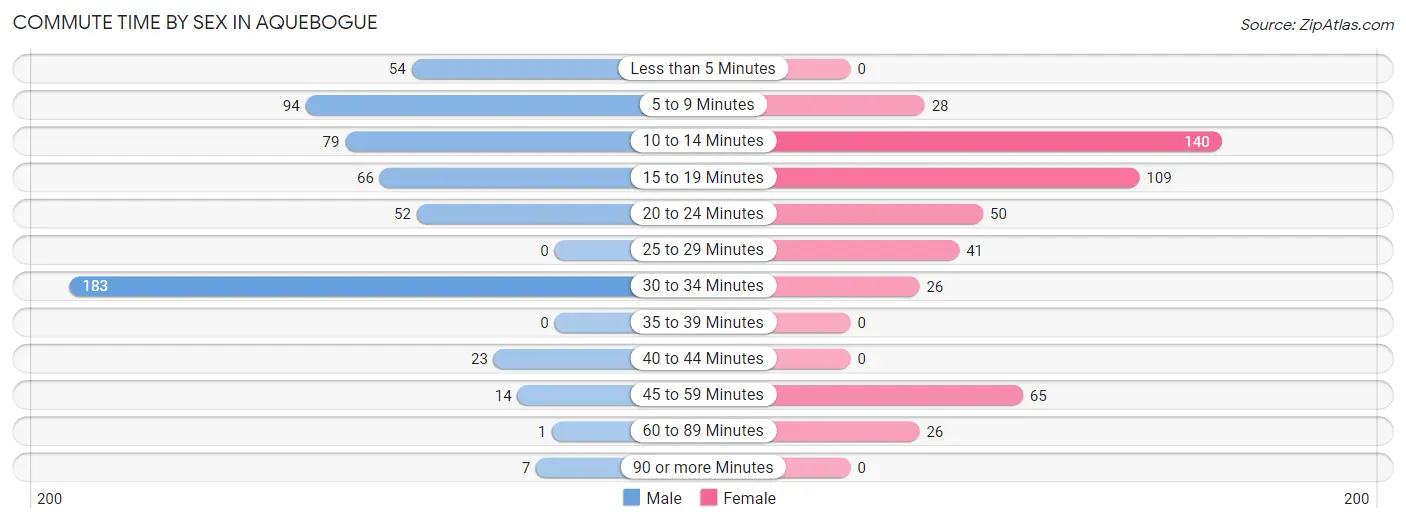
| Commute Time | Male | Female |
| Less than 5 Minutes | 54 (9.4%) | 0 (0.0%) |
| 5 to 9 Minutes | 94 (16.4%) | 28 (5.8%) |
| 10 to 14 Minutes | 79 (13.8%) | 140 (28.9%) |
| 15 to 19 Minutes | 66 (11.5%) | 109 (22.5%) |
| 20 to 24 Minutes | 52 (9.1%) | 50 (10.3%) |
| 25 to 29 Minutes | 0 (0.0%) | 41 (8.5%) |
| 30 to 34 Minutes | 183 (31.9%) | 26 (5.4%) |
| 35 to 39 Minutes | 0 (0.0%) | 0 (0.0%) |
| 40 to 44 Minutes | 23 (4.0%) | 0 (0.0%) |
| 45 to 59 Minutes | 14 (2.4%) | 65 (13.4%) |
| 60 to 89 Minutes | 1 (0.2%) | 26 (5.4%) |
| 90 or more Minutes | 7 (1.2%) | 0 (0.0%) |
Time of Departure to Work by Sex in Aquebogue
The most frequent times of departure to work in Aquebogue are 7:00 AM to 7:29 AM (161, 28.1%) for males and 8:00 AM to 8:29 AM (114, 23.5%) for females.
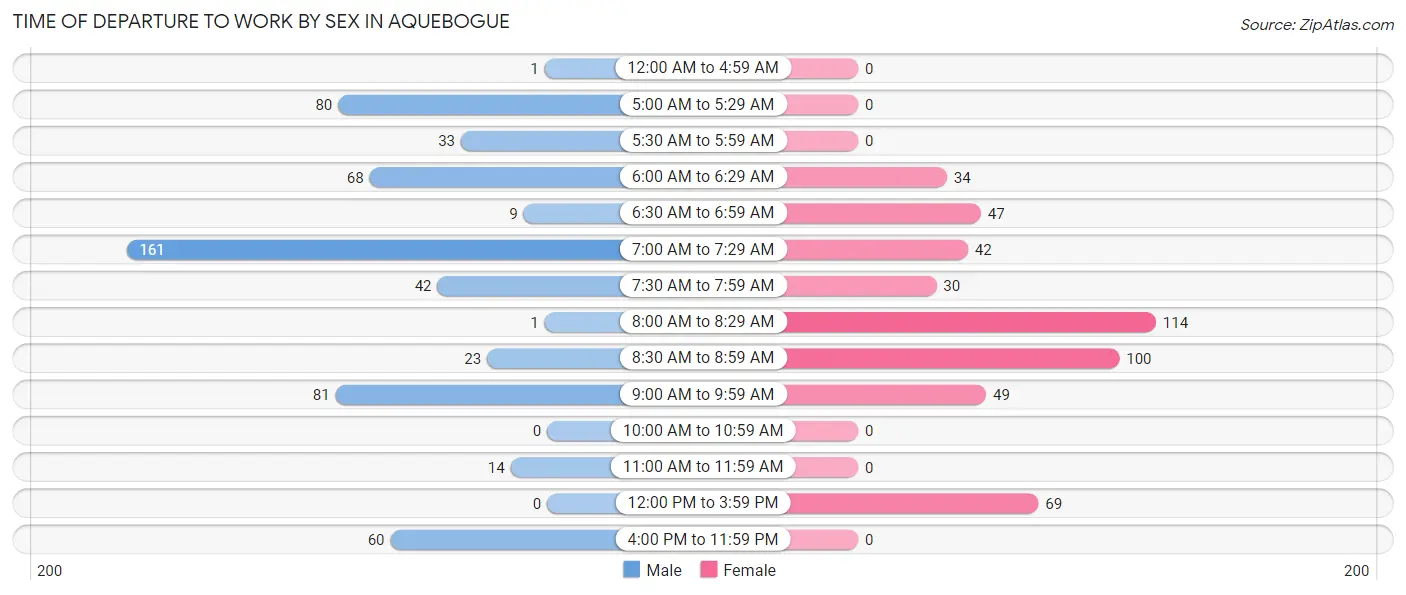
| Time of Departure | Male | Female |
| 12:00 AM to 4:59 AM | 1 (0.2%) | 0 (0.0%) |
| 5:00 AM to 5:29 AM | 80 (14.0%) | 0 (0.0%) |
| 5:30 AM to 5:59 AM | 33 (5.8%) | 0 (0.0%) |
| 6:00 AM to 6:29 AM | 68 (11.9%) | 34 (7.0%) |
| 6:30 AM to 6:59 AM | 9 (1.6%) | 47 (9.7%) |
| 7:00 AM to 7:29 AM | 161 (28.1%) | 42 (8.7%) |
| 7:30 AM to 7:59 AM | 42 (7.3%) | 30 (6.2%) |
| 8:00 AM to 8:29 AM | 1 (0.2%) | 114 (23.5%) |
| 8:30 AM to 8:59 AM | 23 (4.0%) | 100 (20.6%) |
| 9:00 AM to 9:59 AM | 81 (14.1%) | 49 (10.1%) |
| 10:00 AM to 10:59 AM | 0 (0.0%) | 0 (0.0%) |
| 11:00 AM to 11:59 AM | 14 (2.4%) | 0 (0.0%) |
| 12:00 PM to 3:59 PM | 0 (0.0%) | 69 (14.2%) |
| 4:00 PM to 11:59 PM | 60 (10.5%) | 0 (0.0%) |
| Total | 573 (100.0%) | 485 (100.0%) |
Housing Occupancy in Aquebogue
Occupancy by Ownership in Aquebogue
Of the total 697 dwellings in Aquebogue, owner-occupied units account for 588 (84.4%), while renter-occupied units make up 109 (15.6%).
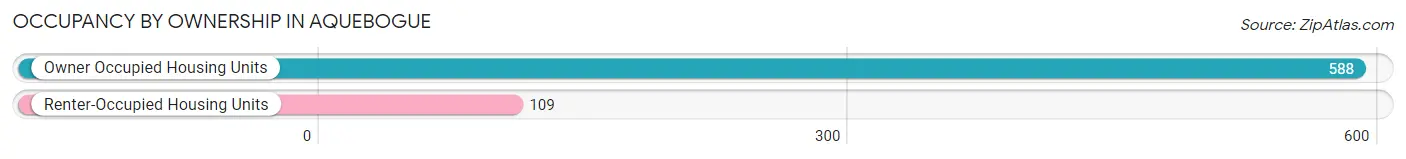
| Occupancy | # Housing Units | % Housing Units |
| Owner Occupied Housing Units | 588 | 84.4% |
| Renter-Occupied Housing Units | 109 | 15.6% |
| Total Occupied Housing Units | 697 | 100.0% |
Occupancy by Household Size in Aquebogue
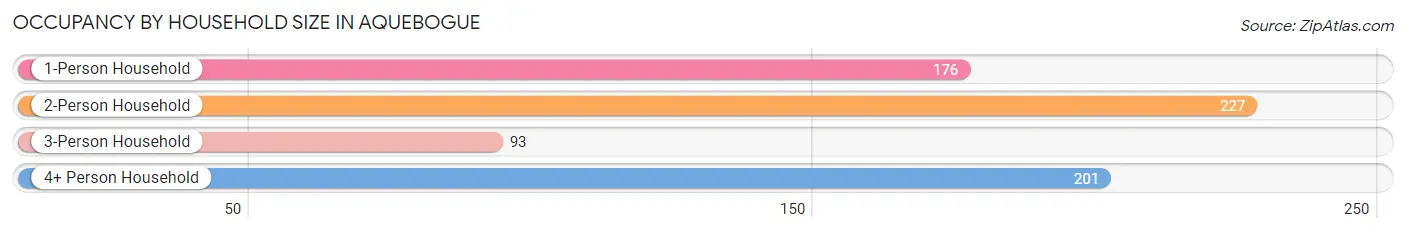
| Household Size | # Housing Units | % Housing Units |
| 1-Person Household | 176 | 25.3% |
| 2-Person Household | 227 | 32.6% |
| 3-Person Household | 93 | 13.3% |
| 4+ Person Household | 201 | 28.8% |
| Total Housing Units | 697 | 100.0% |
Occupancy by Ownership by Household Size in Aquebogue
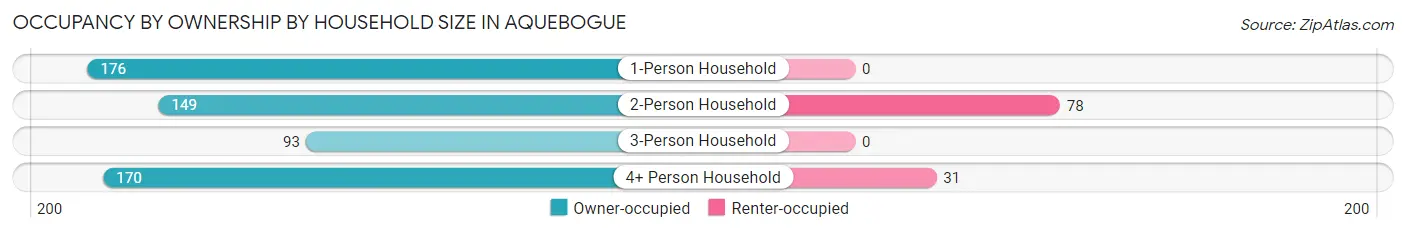
| Household Size | Owner-occupied | Renter-occupied |
| 1-Person Household | 176 (100.0%) | 0 (0.0%) |
| 2-Person Household | 149 (65.6%) | 78 (34.4%) |
| 3-Person Household | 93 (100.0%) | 0 (0.0%) |
| 4+ Person Household | 170 (84.6%) | 31 (15.4%) |
| Total Housing Units | 588 (84.4%) | 109 (15.6%) |
Occupancy by Educational Attainment in Aquebogue
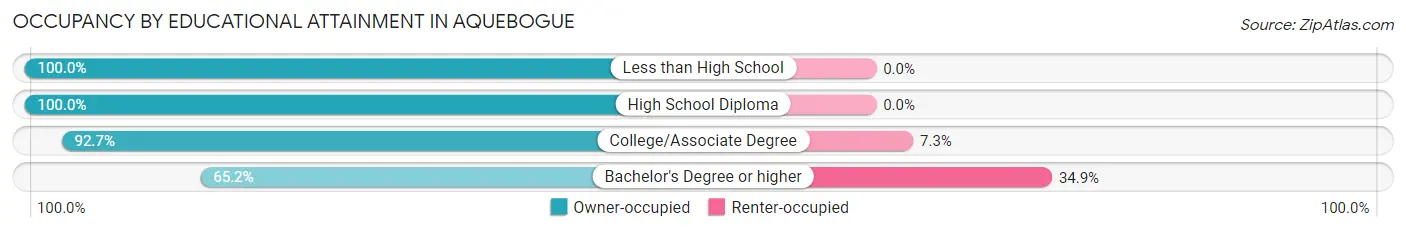
| Household Size | Owner-occupied | Renter-occupied |
| Less than High School | 16 (100.0%) | 0 (0.0%) |
| High School Diploma | 185 (100.0%) | 0 (0.0%) |
| College/Associate Degree | 215 (92.7%) | 17 (7.3%) |
| Bachelor's Degree or higher | 172 (65.1%) | 92 (34.8%) |
Occupancy by Age of Householder in Aquebogue
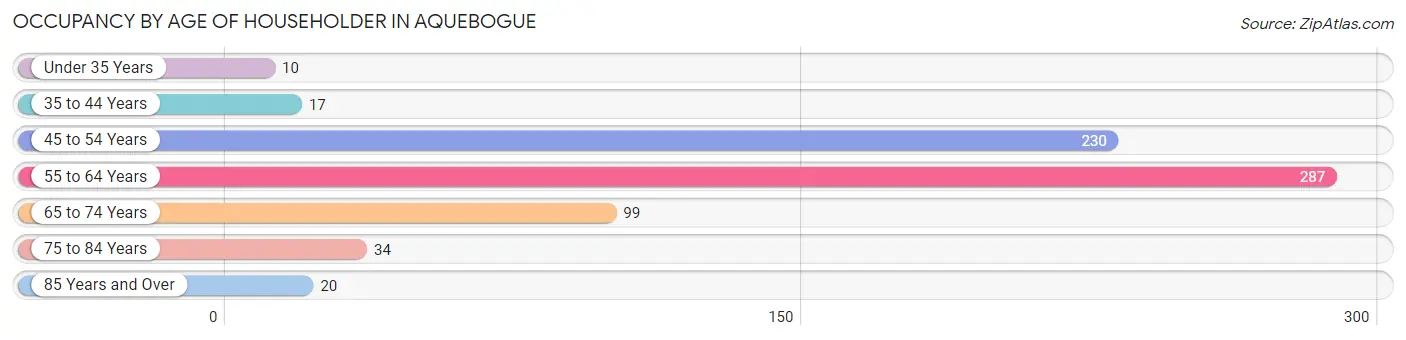
| Age Bracket | # Households | % Households |
| Under 35 Years | 10 | 1.4% |
| 35 to 44 Years | 17 | 2.4% |
| 45 to 54 Years | 230 | 33.0% |
| 55 to 64 Years | 287 | 41.2% |
| 65 to 74 Years | 99 | 14.2% |
| 75 to 84 Years | 34 | 4.9% |
| 85 Years and Over | 20 | 2.9% |
| Total | 697 | 100.0% |
Housing Finances in Aquebogue
Median Income by Occupancy in Aquebogue
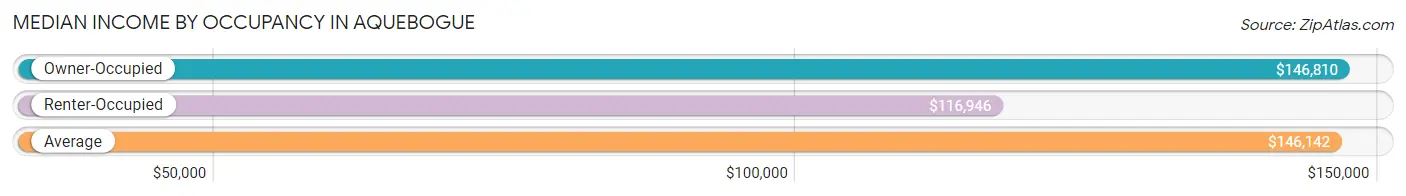
| Occupancy Type | # Households | Median Income |
| Owner-Occupied | 588 (84.4%) | $146,810 |
| Renter-Occupied | 109 (15.6%) | $116,946 |
| Average | 697 (100.0%) | $146,142 |
Occupancy by Householder Income Bracket in Aquebogue
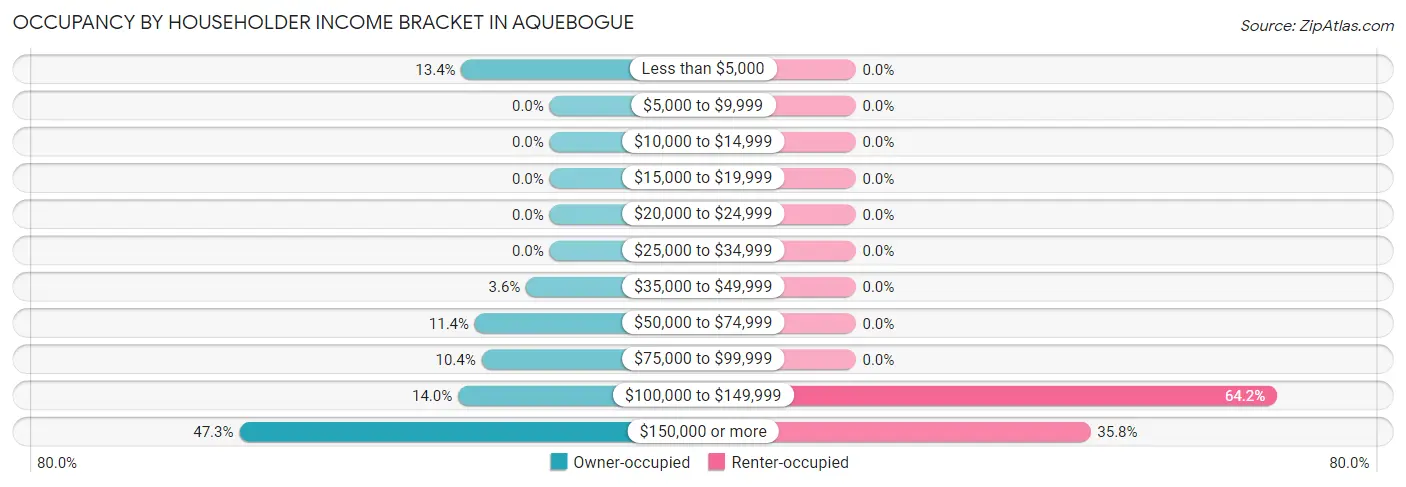
| Income Bracket | Owner-occupied | Renter-occupied |
| Less than $5,000 | 79 (13.4%) | 0 (0.0%) |
| $5,000 to $9,999 | 0 (0.0%) | 0 (0.0%) |
| $10,000 to $14,999 | 0 (0.0%) | 0 (0.0%) |
| $15,000 to $19,999 | 0 (0.0%) | 0 (0.0%) |
| $20,000 to $24,999 | 0 (0.0%) | 0 (0.0%) |
| $25,000 to $34,999 | 0 (0.0%) | 0 (0.0%) |
| $35,000 to $49,999 | 21 (3.6%) | 0 (0.0%) |
| $50,000 to $74,999 | 67 (11.4%) | 0 (0.0%) |
| $75,000 to $99,999 | 61 (10.4%) | 0 (0.0%) |
| $100,000 to $149,999 | 82 (14.0%) | 70 (64.2%) |
| $150,000 or more | 278 (47.3%) | 39 (35.8%) |
| Total | 588 (100.0%) | 109 (100.0%) |
Monthly Housing Cost Tiers in Aquebogue
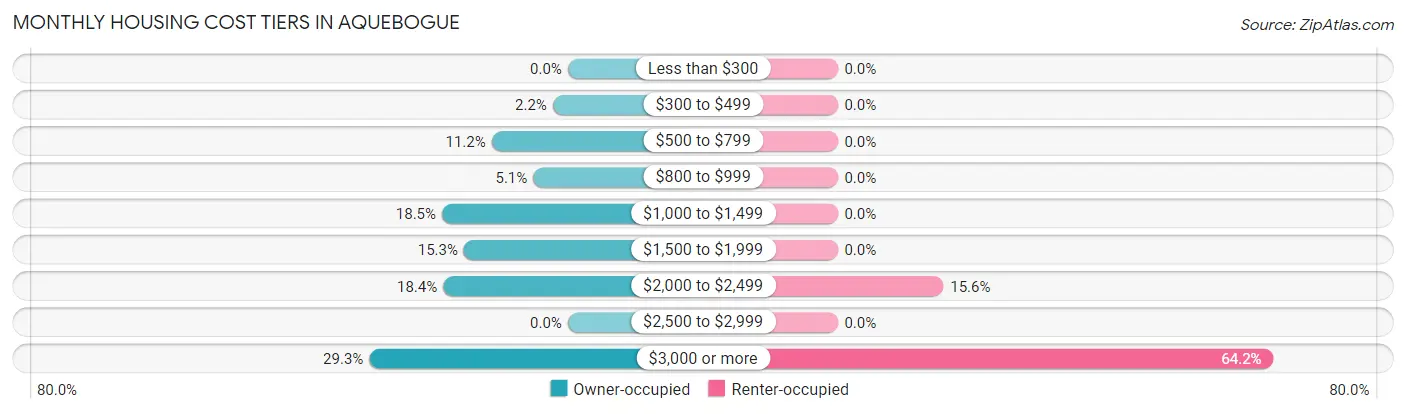
| Monthly Cost | Owner-occupied | Renter-occupied |
| Less than $300 | 0 (0.0%) | 0 (0.0%) |
| $300 to $499 | 13 (2.2%) | 0 (0.0%) |
| $500 to $799 | 66 (11.2%) | 0 (0.0%) |
| $800 to $999 | 30 (5.1%) | 0 (0.0%) |
| $1,000 to $1,499 | 109 (18.5%) | 0 (0.0%) |
| $1,500 to $1,999 | 90 (15.3%) | 0 (0.0%) |
| $2,000 to $2,499 | 108 (18.4%) | 17 (15.6%) |
| $2,500 to $2,999 | 0 (0.0%) | 0 (0.0%) |
| $3,000 or more | 172 (29.2%) | 70 (64.2%) |
| Total | 588 (100.0%) | 109 (100.0%) |
Physical Housing Characteristics in Aquebogue
Housing Structures in Aquebogue
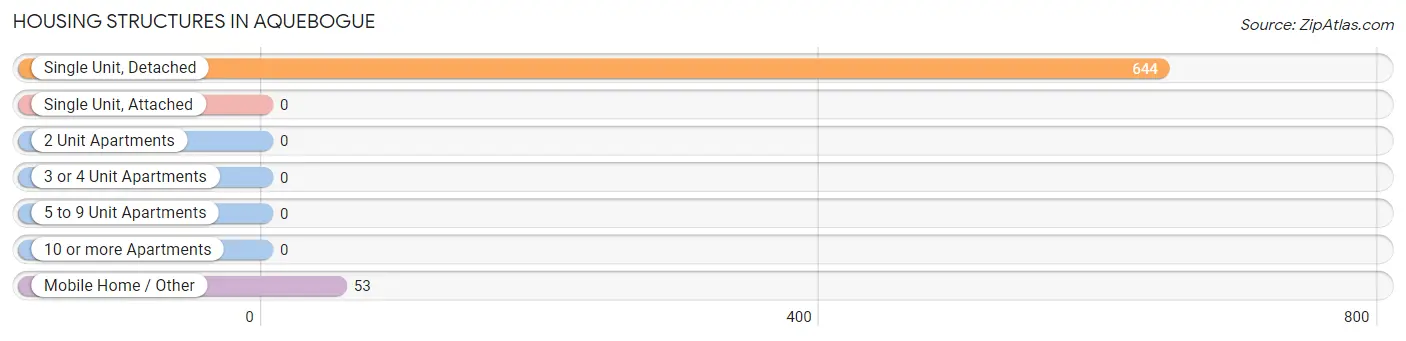
| Structure Type | # Housing Units | % Housing Units |
| Single Unit, Detached | 644 | 92.4% |
| Single Unit, Attached | 0 | 0.0% |
| 2 Unit Apartments | 0 | 0.0% |
| 3 or 4 Unit Apartments | 0 | 0.0% |
| 5 to 9 Unit Apartments | 0 | 0.0% |
| 10 or more Apartments | 0 | 0.0% |
| Mobile Home / Other | 53 | 7.6% |
| Total | 697 | 100.0% |
Housing Structures by Occupancy in Aquebogue
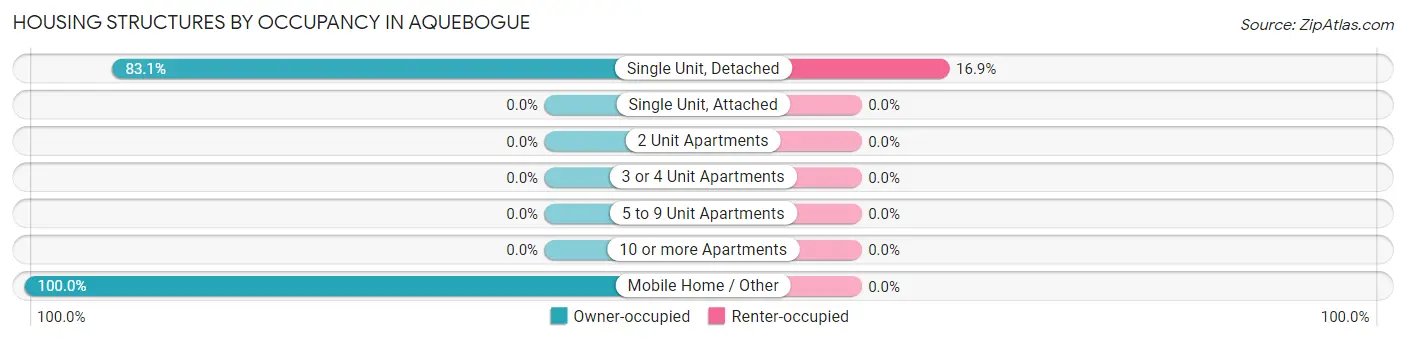
| Structure Type | Owner-occupied | Renter-occupied |
| Single Unit, Detached | 535 (83.1%) | 109 (16.9%) |
| Single Unit, Attached | 0 (0.0%) | 0 (0.0%) |
| 2 Unit Apartments | 0 (0.0%) | 0 (0.0%) |
| 3 or 4 Unit Apartments | 0 (0.0%) | 0 (0.0%) |
| 5 to 9 Unit Apartments | 0 (0.0%) | 0 (0.0%) |
| 10 or more Apartments | 0 (0.0%) | 0 (0.0%) |
| Mobile Home / Other | 53 (100.0%) | 0 (0.0%) |
| Total | 588 (84.4%) | 109 (15.6%) |
Housing Structures by Number of Rooms in Aquebogue
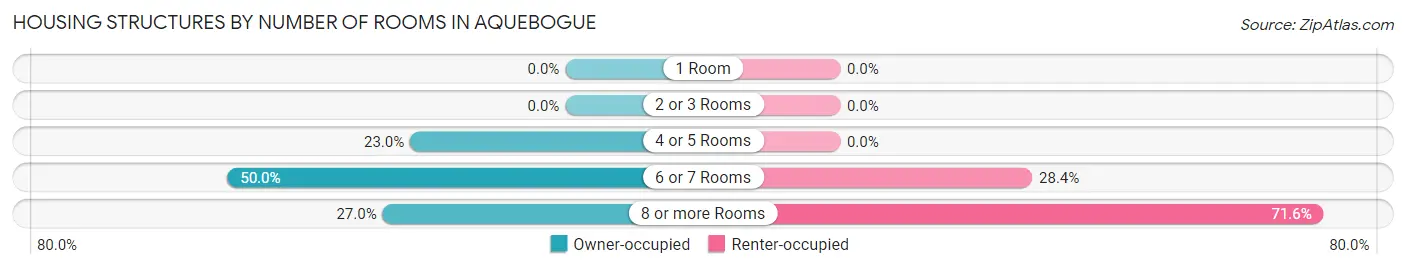
| Number of Rooms | Owner-occupied | Renter-occupied |
| 1 Room | 0 (0.0%) | 0 (0.0%) |
| 2 or 3 Rooms | 0 (0.0%) | 0 (0.0%) |
| 4 or 5 Rooms | 135 (23.0%) | 0 (0.0%) |
| 6 or 7 Rooms | 294 (50.0%) | 31 (28.4%) |
| 8 or more Rooms | 159 (27.0%) | 78 (71.6%) |
| Total | 588 (100.0%) | 109 (100.0%) |
Housing Structure by Heating Type in Aquebogue
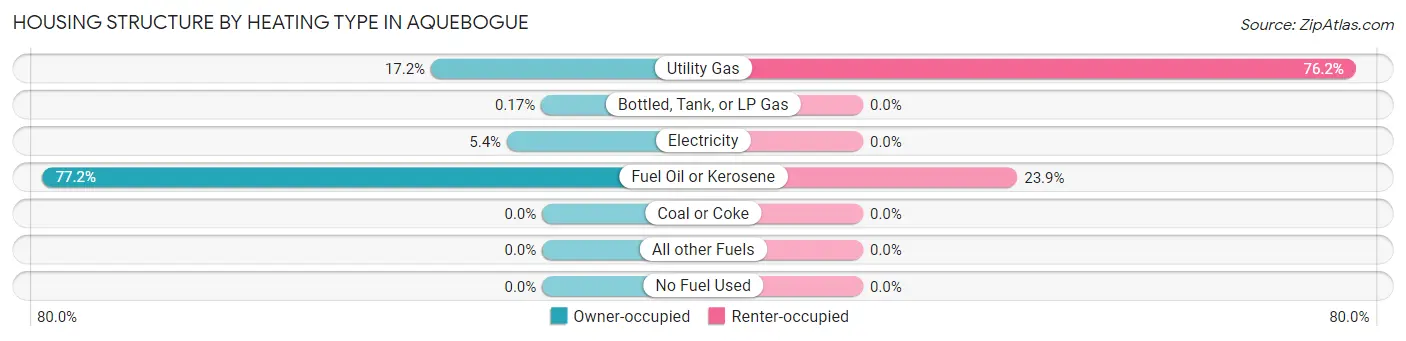
| Heating Type | Owner-occupied | Renter-occupied |
| Utility Gas | 101 (17.2%) | 83 (76.1%) |
| Bottled, Tank, or LP Gas | 1 (0.2%) | 0 (0.0%) |
| Electricity | 32 (5.4%) | 0 (0.0%) |
| Fuel Oil or Kerosene | 454 (77.2%) | 26 (23.8%) |
| Coal or Coke | 0 (0.0%) | 0 (0.0%) |
| All other Fuels | 0 (0.0%) | 0 (0.0%) |
| No Fuel Used | 0 (0.0%) | 0 (0.0%) |
| Total | 588 (100.0%) | 109 (100.0%) |
Household Vehicle Usage in Aquebogue
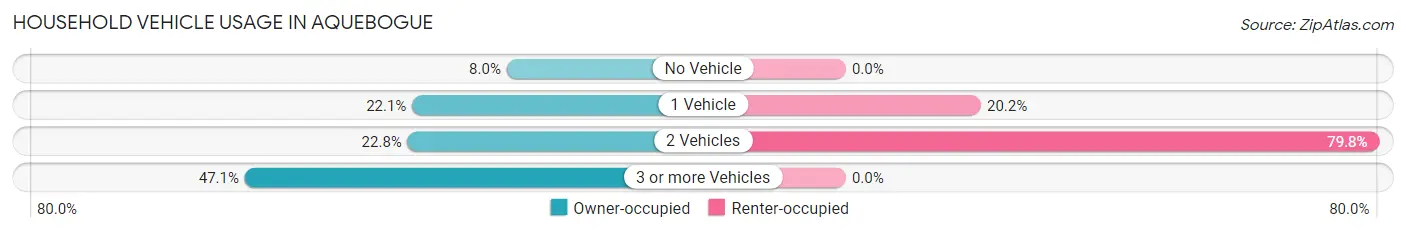
| Vehicles per Household | Owner-occupied | Renter-occupied |
| No Vehicle | 47 (8.0%) | 0 (0.0%) |
| 1 Vehicle | 130 (22.1%) | 22 (20.2%) |
| 2 Vehicles | 134 (22.8%) | 87 (79.8%) |
| 3 or more Vehicles | 277 (47.1%) | 0 (0.0%) |
| Total | 588 (100.0%) | 109 (100.0%) |
Real Estate & Mortgages in Aquebogue
Real Estate and Mortgage Overview in Aquebogue
| Characteristic | Without Mortgage | With Mortgage |
| Housing Units | 343 | 245 |
| Median Property Value | $497,400 | $563,000 |
| Median Household Income | - | - |
| Monthly Housing Costs | $1,266 | $172 |
| Real Estate Taxes | $8,787 | $0 |
Property Value by Mortgage Status in Aquebogue
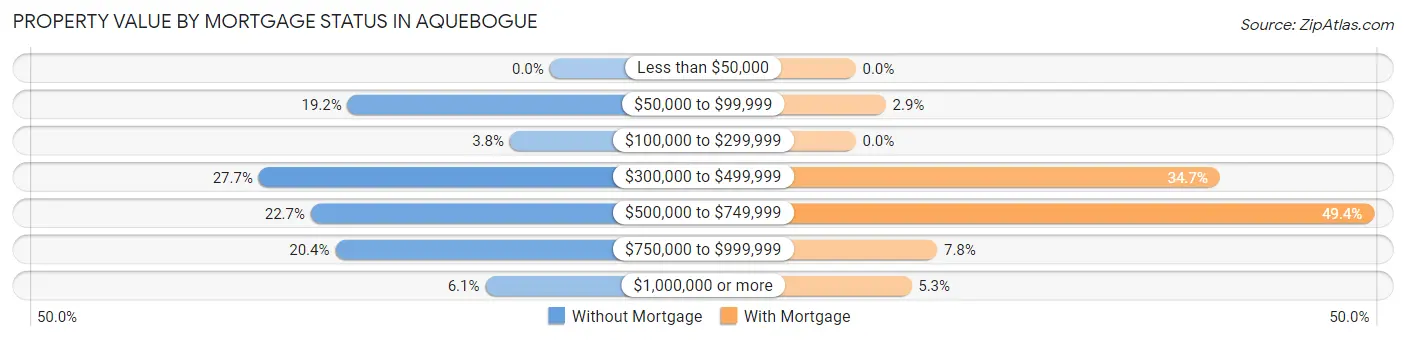
| Property Value | Without Mortgage | With Mortgage |
| Less than $50,000 | 0 (0.0%) | 0 (0.0%) |
| $50,000 to $99,999 | 66 (19.2%) | 7 (2.9%) |
| $100,000 to $299,999 | 13 (3.8%) | 0 (0.0%) |
| $300,000 to $499,999 | 95 (27.7%) | 85 (34.7%) |
| $500,000 to $749,999 | 78 (22.7%) | 121 (49.4%) |
| $750,000 to $999,999 | 70 (20.4%) | 19 (7.8%) |
| $1,000,000 or more | 21 (6.1%) | 13 (5.3%) |
| Total | 343 (100.0%) | 245 (100.0%) |
Household Income by Mortgage Status in Aquebogue
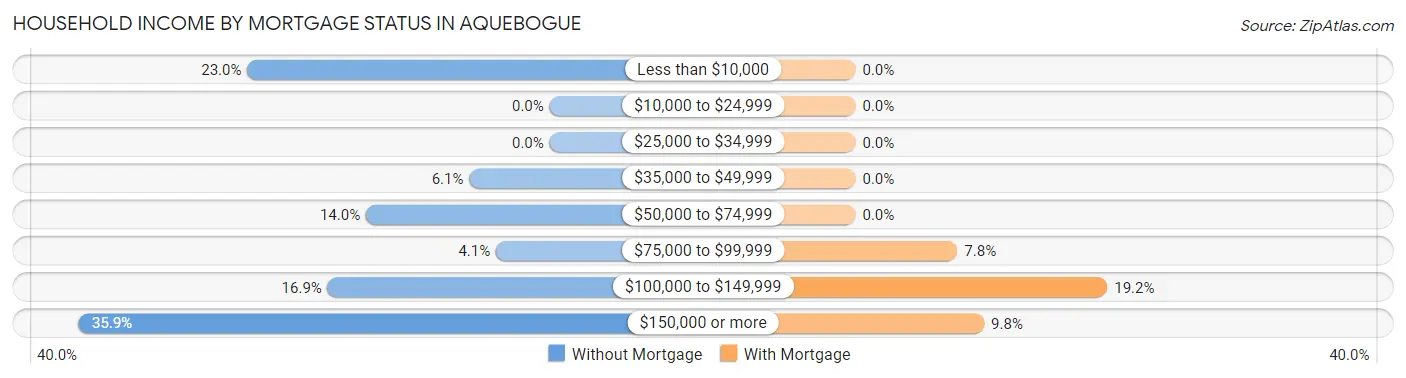
| Household Income | Without Mortgage | With Mortgage |
| Less than $10,000 | 79 (23.0%) | 0 (0.0%) |
| $10,000 to $24,999 | 0 (0.0%) | 0 (0.0%) |
| $25,000 to $34,999 | 0 (0.0%) | 0 (0.0%) |
| $35,000 to $49,999 | 21 (6.1%) | 0 (0.0%) |
| $50,000 to $74,999 | 48 (14.0%) | 0 (0.0%) |
| $75,000 to $99,999 | 14 (4.1%) | 19 (7.8%) |
| $100,000 to $149,999 | 58 (16.9%) | 47 (19.2%) |
| $150,000 or more | 123 (35.9%) | 24 (9.8%) |
| Total | 343 (100.0%) | 245 (100.0%) |
Property Value to Household Income Ratio in Aquebogue
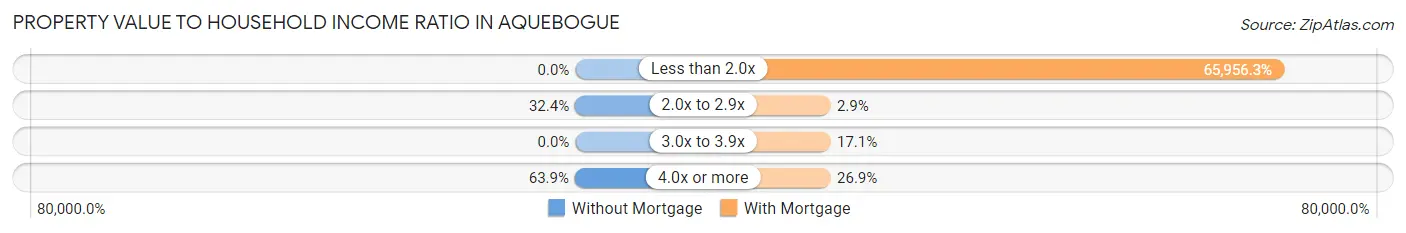
| Value-to-Income Ratio | Without Mortgage | With Mortgage |
| Less than 2.0x | 0 (0.0%) | 161,593 (65,956.3%) |
| 2.0x to 2.9x | 111 (32.4%) | 7 (2.9%) |
| 3.0x to 3.9x | 0 (0.0%) | 42 (17.1%) |
| 4.0x or more | 219 (63.8%) | 66 (26.9%) |
| Total | 343 (100.0%) | 245 (100.0%) |
Real Estate Taxes by Mortgage Status in Aquebogue
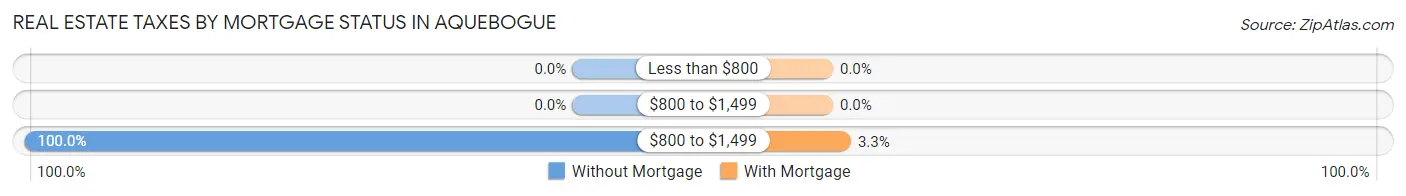
| Property Taxes | Without Mortgage | With Mortgage |
| Less than $800 | 0 (0.0%) | 0 (0.0%) |
| $800 to $1,499 | 0 (0.0%) | 0 (0.0%) |
| $800 to $1,499 | 343 (100.0%) | 8 (3.3%) |
| Total | 343 (100.0%) | 245 (100.0%) |
Health & Disability in Aquebogue
Health Insurance Coverage by Age in Aquebogue
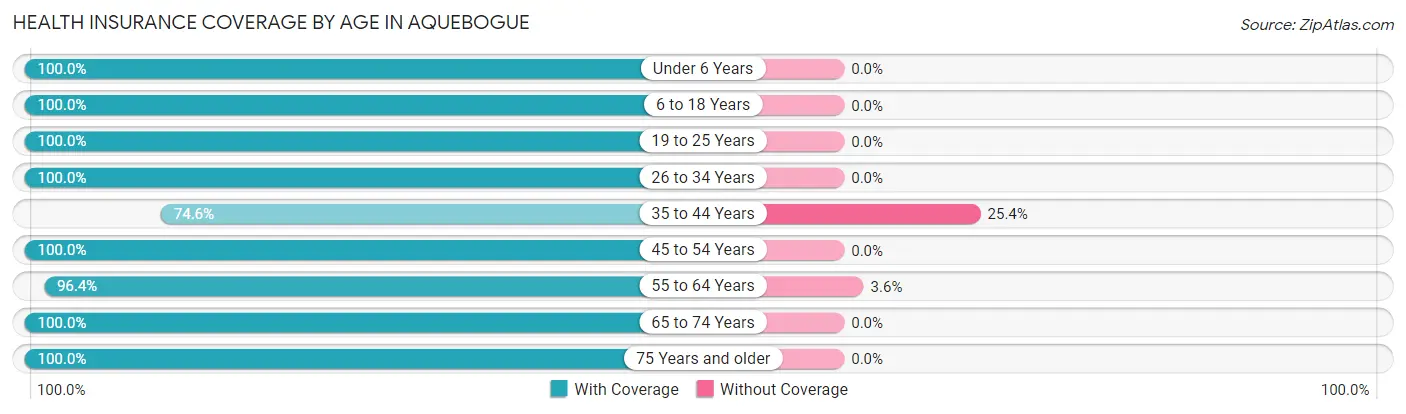
| Age Bracket | With Coverage | Without Coverage |
| Under 6 Years | 46 (100.0%) | 0 (0.0%) |
| 6 to 18 Years | 414 (100.0%) | 0 (0.0%) |
| 19 to 25 Years | 153 (100.0%) | 0 (0.0%) |
| 26 to 34 Years | 56 (100.0%) | 0 (0.0%) |
| 35 to 44 Years | 44 (74.6%) | 15 (25.4%) |
| 45 to 54 Years | 478 (100.0%) | 0 (0.0%) |
| 55 to 64 Years | 427 (96.4%) | 16 (3.6%) |
| 65 to 74 Years | 169 (100.0%) | 0 (0.0%) |
| 75 Years and older | 119 (100.0%) | 0 (0.0%) |
| Total | 1,906 (98.4%) | 31 (1.6%) |
Health Insurance Coverage by Citizenship Status in Aquebogue
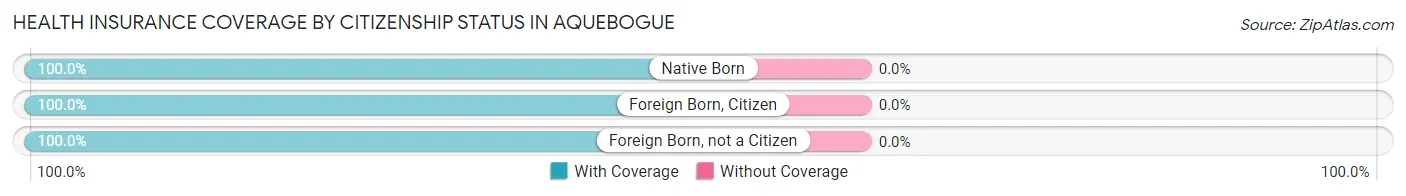
| Citizenship Status | With Coverage | Without Coverage |
| Native Born | 46 (100.0%) | 0 (0.0%) |
| Foreign Born, Citizen | 414 (100.0%) | 0 (0.0%) |
| Foreign Born, not a Citizen | 153 (100.0%) | 0 (0.0%) |
Health Insurance Coverage by Household Income in Aquebogue
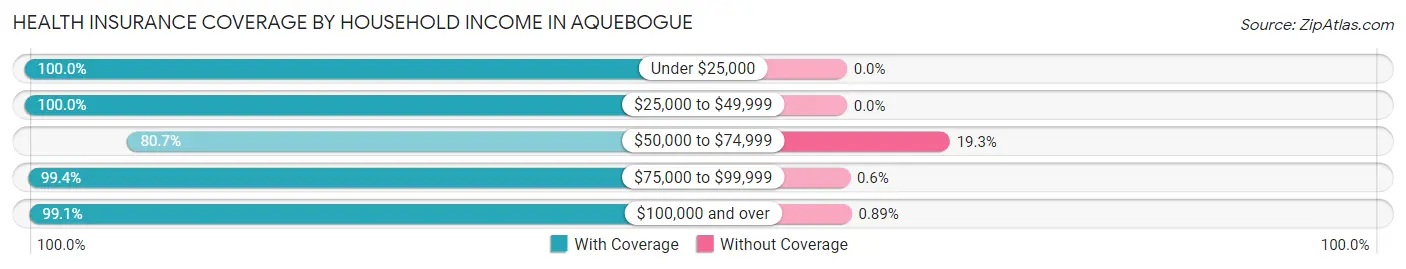
| Household Income | With Coverage | Without Coverage |
| Under $25,000 | 79 (100.0%) | 0 (0.0%) |
| $25,000 to $49,999 | 21 (100.0%) | 0 (0.0%) |
| $50,000 to $74,999 | 67 (80.7%) | 16 (19.3%) |
| $75,000 to $99,999 | 167 (99.4%) | 1 (0.6%) |
| $100,000 and over | 1,554 (99.1%) | 14 (0.9%) |
Public vs Private Health Insurance Coverage by Age in Aquebogue
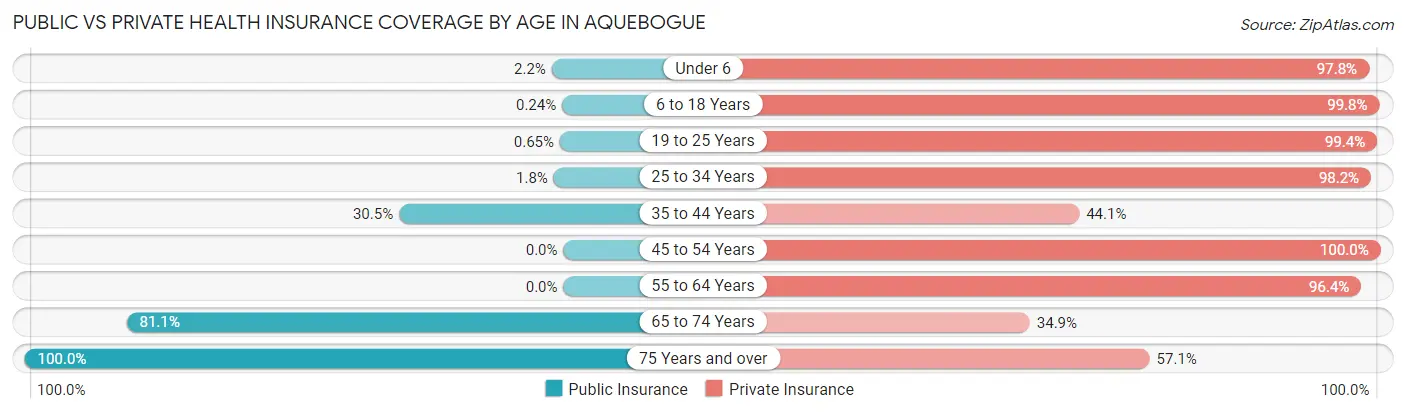
| Age Bracket | Public Insurance | Private Insurance |
| Under 6 | 1 (2.2%) | 45 (97.8%) |
| 6 to 18 Years | 1 (0.2%) | 413 (99.8%) |
| 19 to 25 Years | 1 (0.6%) | 152 (99.4%) |
| 25 to 34 Years | 1 (1.8%) | 55 (98.2%) |
| 35 to 44 Years | 18 (30.5%) | 26 (44.1%) |
| 45 to 54 Years | 0 (0.0%) | 478 (100.0%) |
| 55 to 64 Years | 0 (0.0%) | 427 (96.4%) |
| 65 to 74 Years | 137 (81.1%) | 59 (34.9%) |
| 75 Years and over | 119 (100.0%) | 68 (57.1%) |
| Total | 278 (14.3%) | 1,723 (88.9%) |
Disability Status by Sex by Age in Aquebogue
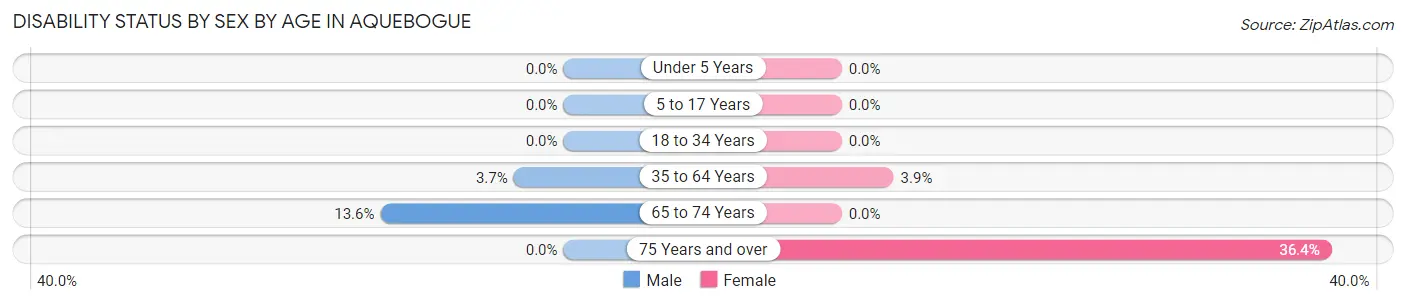
| Age Bracket | Male | Female |
| Under 5 Years | 0 (0.0%) | 0 (0.0%) |
| 5 to 17 Years | 0 (0.0%) | 0 (0.0%) |
| 18 to 34 Years | 0 (0.0%) | 0 (0.0%) |
| 35 to 64 Years | 18 (3.7%) | 19 (3.8%) |
| 65 to 74 Years | 14 (13.6%) | 0 (0.0%) |
| 75 Years and over | 0 (0.0%) | 20 (36.4%) |
Disability Class by Sex by Age in Aquebogue
Disability Class: Hearing Difficulty
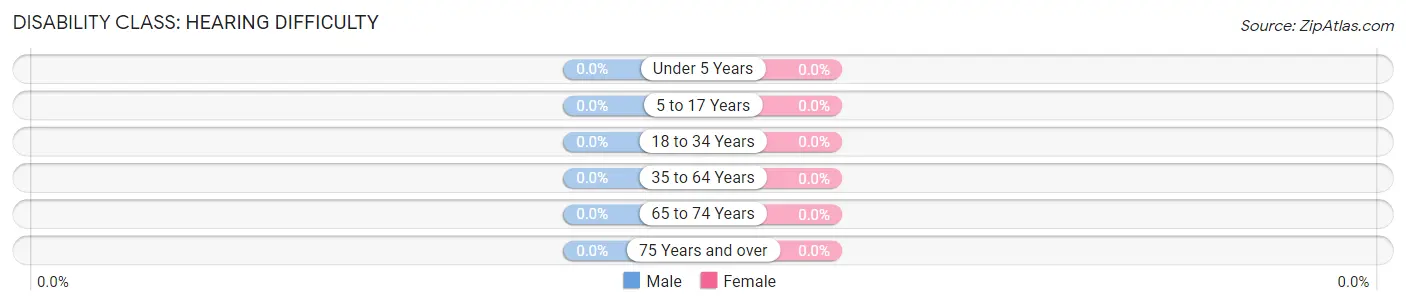
| Age Bracket | Male | Female |
| Under 5 Years | 0 (0.0%) | 0 (0.0%) |
| 5 to 17 Years | 0 (0.0%) | 0 (0.0%) |
| 18 to 34 Years | 0 (0.0%) | 0 (0.0%) |
| 35 to 64 Years | 0 (0.0%) | 0 (0.0%) |
| 65 to 74 Years | 0 (0.0%) | 0 (0.0%) |
| 75 Years and over | 0 (0.0%) | 0 (0.0%) |
Disability Class: Vision Difficulty
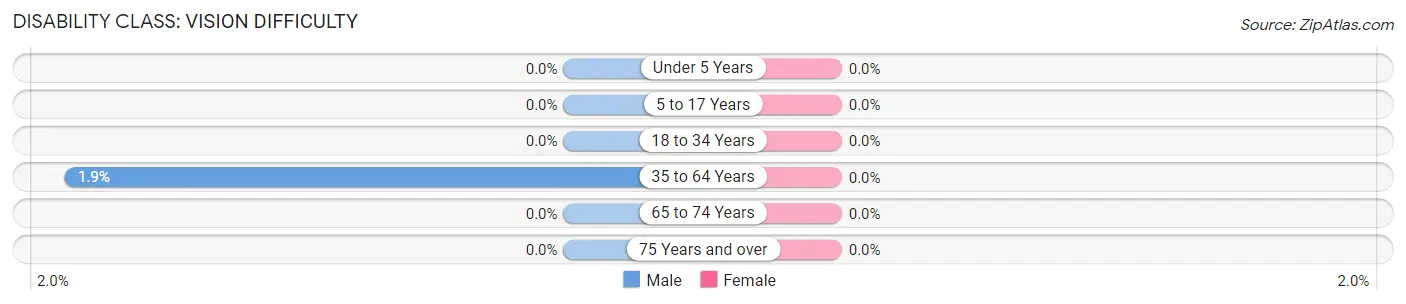
| Age Bracket | Male | Female |
| Under 5 Years | 0 (0.0%) | 0 (0.0%) |
| 5 to 17 Years | 0 (0.0%) | 0 (0.0%) |
| 18 to 34 Years | 0 (0.0%) | 0 (0.0%) |
| 35 to 64 Years | 9 (1.8%) | 0 (0.0%) |
| 65 to 74 Years | 0 (0.0%) | 0 (0.0%) |
| 75 Years and over | 0 (0.0%) | 0 (0.0%) |
Disability Class: Cognitive Difficulty
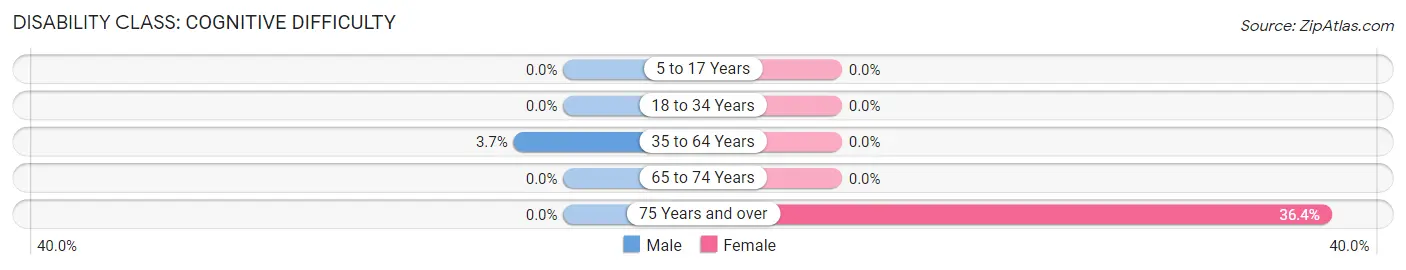
| Age Bracket | Male | Female |
| 5 to 17 Years | 0 (0.0%) | 0 (0.0%) |
| 18 to 34 Years | 0 (0.0%) | 0 (0.0%) |
| 35 to 64 Years | 18 (3.7%) | 0 (0.0%) |
| 65 to 74 Years | 0 (0.0%) | 0 (0.0%) |
| 75 Years and over | 0 (0.0%) | 20 (36.4%) |
Disability Class: Ambulatory Difficulty
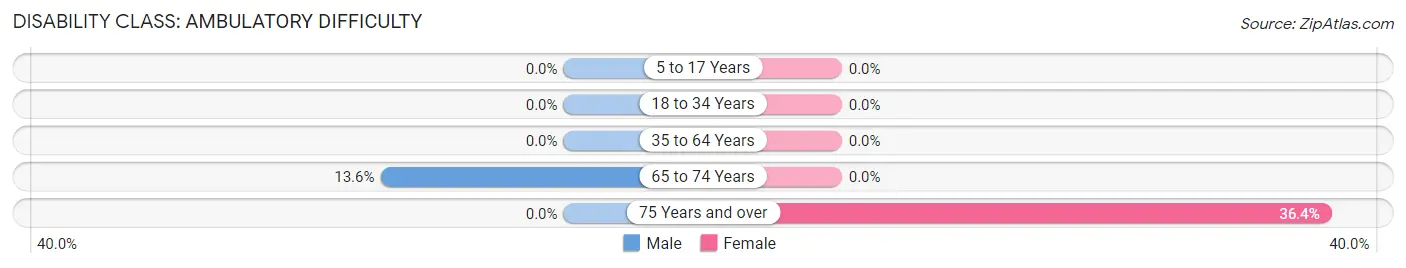
| Age Bracket | Male | Female |
| 5 to 17 Years | 0 (0.0%) | 0 (0.0%) |
| 18 to 34 Years | 0 (0.0%) | 0 (0.0%) |
| 35 to 64 Years | 0 (0.0%) | 0 (0.0%) |
| 65 to 74 Years | 14 (13.6%) | 0 (0.0%) |
| 75 Years and over | 0 (0.0%) | 20 (36.4%) |
Disability Class: Self-Care Difficulty
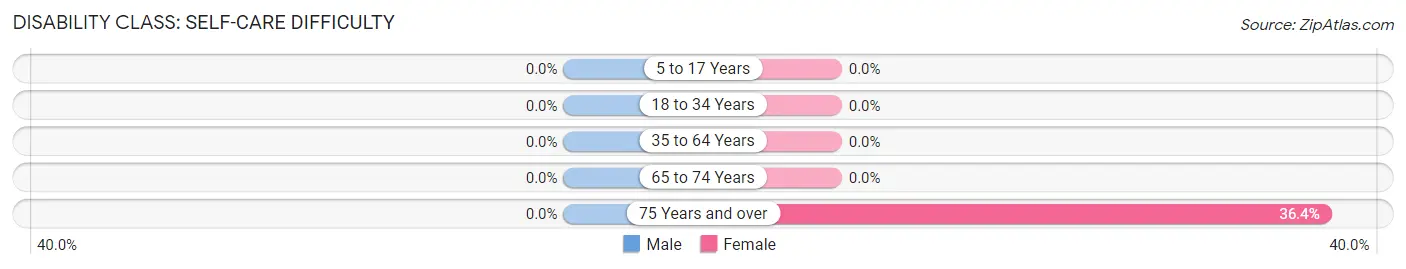
| Age Bracket | Male | Female |
| 5 to 17 Years | 0 (0.0%) | 0 (0.0%) |
| 18 to 34 Years | 0 (0.0%) | 0 (0.0%) |
| 35 to 64 Years | 0 (0.0%) | 0 (0.0%) |
| 65 to 74 Years | 0 (0.0%) | 0 (0.0%) |
| 75 Years and over | 0 (0.0%) | 20 (36.4%) |
Technology Access in Aquebogue
Computing Device Access in Aquebogue
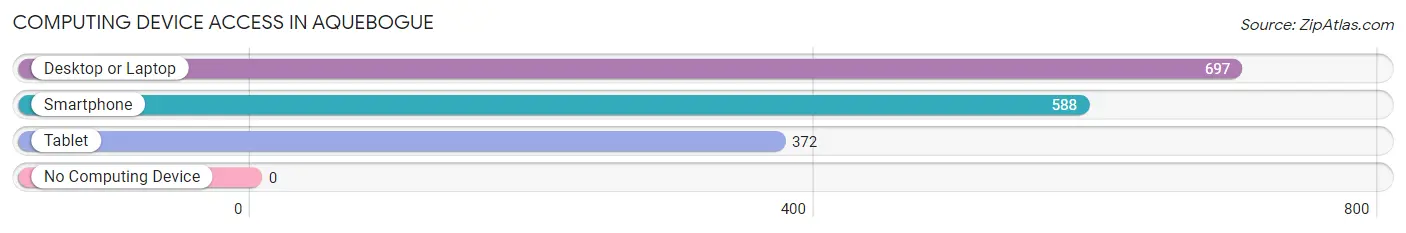
| Device Type | # Households | % Households |
| Desktop or Laptop | 697 | 100.0% |
| Smartphone | 588 | 84.4% |
| Tablet | 372 | 53.4% |
| No Computing Device | 0 | 0.0% |
| Total | 697 | 100.0% |
Internet Access in Aquebogue
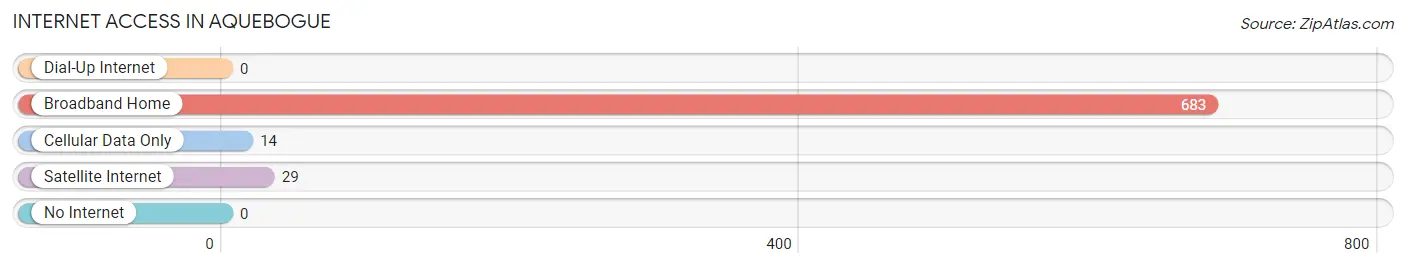
| Internet Type | # Households | % Households |
| Dial-Up Internet | 0 | 0.0% |
| Broadband Home | 683 | 98.0% |
| Cellular Data Only | 14 | 2.0% |
| Satellite Internet | 29 | 4.2% |
| No Internet | 0 | 0.0% |
| Total | 697 | 100.0% |
Aquebogue Summary
Aquebogue is a hamlet located in the Town of Riverhead in Suffolk County, New York. It is situated on the North Fork of Long Island, approximately 90 miles east of New York City. The hamlet is bordered by Jamesport to the west, Peconic to the east, and Flanders to the south. Aquebogue is a small, rural community with a population of approximately 3,000 people.
History
The area now known as Aquebogue was originally inhabited by the Shinnecock Native American tribe. The name “Aquebogue” is derived from the Shinnecock word “Aquebogus,” which means “place of many creeks.” The first European settlers arrived in the area in the late 1600s. The hamlet was officially established in 1730 and was initially known as “Aquebogue Neck.”
In the late 1700s, Aquebogue was a thriving agricultural community. The hamlet was home to several farms, which produced a variety of crops, including potatoes, corn, and wheat. In the early 1800s, the hamlet began to develop a commercial fishing industry. This industry was centered around the Peconic Bay, which was home to a variety of fish, including flounder, bluefish, and striped bass.
In the late 1800s, Aquebogue began to develop a tourism industry. The hamlet was home to several resorts, which attracted visitors from all over the country. The resorts offered a variety of activities, including swimming, fishing, and boating.
Geography
Aquebogue is located on the North Fork of Long Island, approximately 90 miles east of New York City. The hamlet is bordered by Jamesport to the west, Peconic to the east, and Flanders to the south. Aquebogue is situated on the Peconic Bay, which is home to a variety of fish, including flounder, bluefish, and striped bass. The hamlet is also home to several creeks, which provide a habitat for a variety of wildlife, including ducks, geese, and swans.
Economy
Aquebogue’s economy is largely based on agriculture and tourism. The hamlet is home to several farms, which produce a variety of crops, including potatoes, corn, and wheat. Aquebogue is also home to several resorts, which attract visitors from all over the country. The resorts offer a variety of activities, including swimming, fishing, and boating.
Demographics
As of the 2010 census, Aquebogue had a population of 3,000 people. The median age of the population was 44.7 years old. The median household income was $68,750. The median home value was $400,000. The majority of the population (90%) was white, while 5% was Hispanic or Latino, and 5% was African American.
Conclusion
Aquebogue is a small, rural hamlet located on the North Fork of Long Island. The hamlet has a population of approximately 3,000 people and is home to several farms and resorts. The economy of Aquebogue is largely based on agriculture and tourism. The hamlet is also home to a variety of wildlife, including ducks, geese, and swans.
Common Questions
What is Per Capita Income in Aquebogue?
Per Capita income in Aquebogue is $47,034.
What is the Median Family Income in Aquebogue?
Median Family Income in Aquebogue is $162,298.
What is the Median Household income in Aquebogue?
Median Household Income in Aquebogue is $146,142.
What is Income or Wage Gap in Aquebogue?
Income or Wage Gap in Aquebogue is 23.5%.
Women in Aquebogue earn 76.5 cents for every dollar earned by a man.
What is Inequality or Gini Index in Aquebogue?
Inequality or Gini Index in Aquebogue is 0.30.
What is the Total Population of Aquebogue?
Total Population of Aquebogue is 1,937.
What is the Total Male Population of Aquebogue?
Total Male Population of Aquebogue is 859.
What is the Total Female Population of Aquebogue?
Total Female Population of Aquebogue is 1,078.
What is the Ratio of Males per 100 Females in Aquebogue?
There are 79.68 Males per 100 Females in Aquebogue.
What is the Ratio of Females per 100 Males in Aquebogue?
There are 125.49 Females per 100 Males in Aquebogue.
What is the Median Population Age in Aquebogue?
Median Population Age in Aquebogue is 51.6 Years.
What is the Average Family Size in Aquebogue
Average Family Size in Aquebogue is 3.5 People.
What is the Average Household Size in Aquebogue
Average Household Size in Aquebogue is 2.8 People.
How Large is the Labor Force in Aquebogue?
There are 1,188 People in the Labor Forcein in Aquebogue.
What is the Percentage of People in the Labor Force in Aquebogue?
73.4% of People are in the Labor Force in Aquebogue.
What is the Unemployment Rate in Aquebogue?
Unemployment Rate in Aquebogue is 1.8%.