Old Westbury, NY Map & Demographics
Old Westbury Map
Old Westbury Overview
$108,134
PER CAPITA INCOME
$250,001
AVG FAMILY INCOME
$250,001
AVG HOUSEHOLD INCOME
77.0%
WAGE / INCOME GAP [ % ]
23.0¢/ $1
WAGE / INCOME GAP [ $ ]
0.50
INEQUALITY / GINI INDEX
4,410
TOTAL POPULATION
2,119
MALE POPULATION
2,291
FEMALE POPULATION
92.49
MALES / 100 FEMALES
108.12
FEMALES / 100 MALES
27.4
MEDIAN AGE
3.6
AVG FAMILY SIZE
3.1
AVG HOUSEHOLD SIZE
2,188
LABOR FORCE [ PEOPLE ]
56.0%
PERCENT IN LABOR FORCE
7.3%
UNEMPLOYMENT RATE
Old Westbury Zip Codes
Income in Old Westbury
Income Overview in Old Westbury
Per Capita Income in Old Westbury is $108,134, while median incomes of families and households are $250,001 and $250,001 respectively.
| Characteristic | Number | Measure |
| Per Capita Income | 4,410 | $108,134 |
| Median Family Income | 806 | $250,001 |
| Mean Family Income | 806 | $465,690 |
| Median Household Income | 1,052 | $250,001 |
| Mean Household Income | 1,052 | $456,581 |
| Income Deficit | 806 | $0 |
| Wage / Income Gap (%) | 4,410 | 76.98% |
| Wage / Income Gap ($) | 4,410 | 23.02¢ per $1 |
| Gini / Inequality Index | 4,410 | 0.50 |
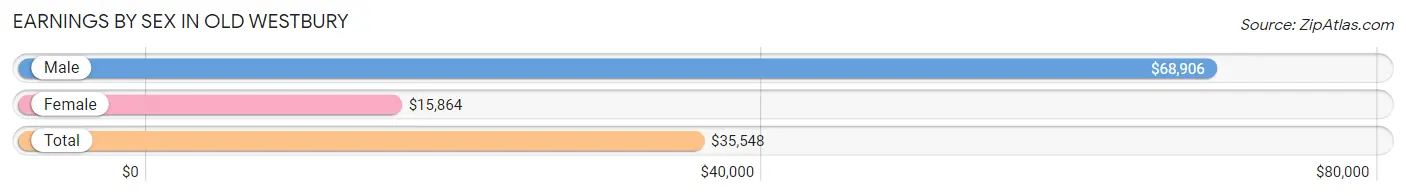
Earnings by Sex in Old Westbury
Average Earnings in Old Westbury are $35,548, $68,906 for men and $15,864 for women, a difference of 77.0%.
| Sex | Number | Average Earnings |
| Male | 1,259 (49.6%) | $68,906 |
| Female | 1,281 (50.4%) | $15,864 |
| Total | 2,540 (100.0%) | $35,548 |
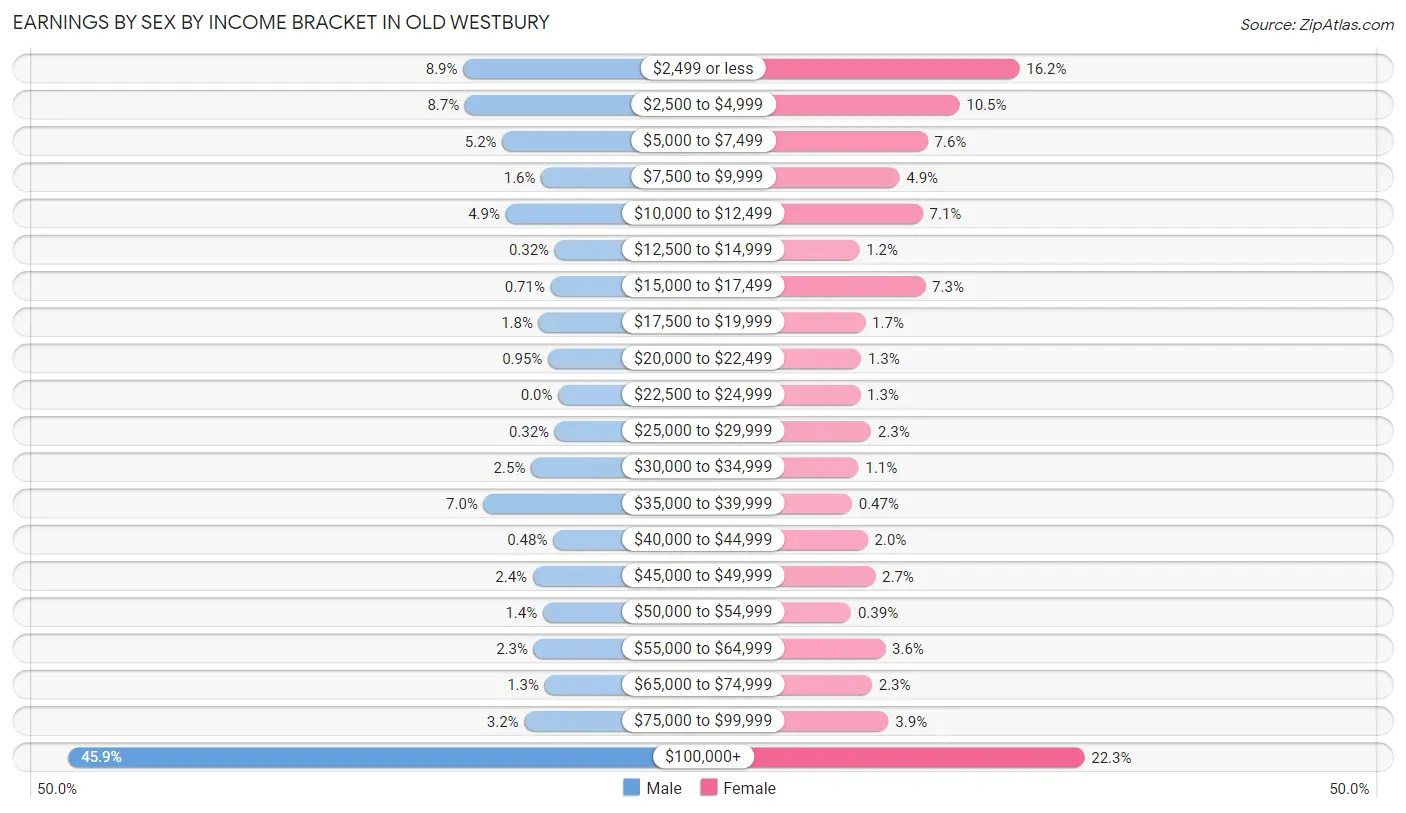
Earnings by Sex by Income Bracket in Old Westbury
The most common earnings brackets in Old Westbury are $100,000+ for men (578 | 45.9%) and $100,000+ for women (285 | 22.3%).
| Income | Male | Female |
| $2,499 or less | 112 (8.9%) | 207 (16.2%) |
| $2,500 to $4,999 | 110 (8.7%) | 135 (10.5%) |
| $5,000 to $7,499 | 66 (5.2%) | 97 (7.6%) |
| $7,500 to $9,999 | 20 (1.6%) | 63 (4.9%) |
| $10,000 to $12,499 | 62 (4.9%) | 91 (7.1%) |
| $12,500 to $14,999 | 4 (0.3%) | 15 (1.2%) |
| $15,000 to $17,499 | 9 (0.7%) | 94 (7.3%) |
| $17,500 to $19,999 | 23 (1.8%) | 22 (1.7%) |
| $20,000 to $22,499 | 12 (0.9%) | 17 (1.3%) |
| $22,500 to $24,999 | 0 (0.0%) | 16 (1.3%) |
| $25,000 to $29,999 | 4 (0.3%) | 29 (2.3%) |
| $30,000 to $34,999 | 32 (2.5%) | 14 (1.1%) |
| $35,000 to $39,999 | 88 (7.0%) | 6 (0.5%) |
| $40,000 to $44,999 | 6 (0.5%) | 25 (1.9%) |
| $45,000 to $49,999 | 30 (2.4%) | 34 (2.6%) |
| $50,000 to $54,999 | 18 (1.4%) | 5 (0.4%) |
| $55,000 to $64,999 | 29 (2.3%) | 46 (3.6%) |
| $65,000 to $74,999 | 16 (1.3%) | 30 (2.3%) |
| $75,000 to $99,999 | 40 (3.2%) | 50 (3.9%) |
| $100,000+ | 578 (45.9%) | 285 (22.3%) |
| Total | 1,259 (100.0%) | 1,281 (100.0%) |
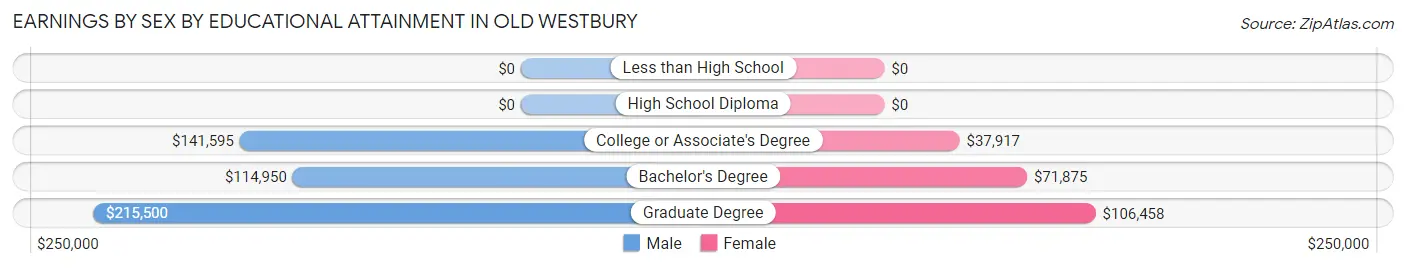
Earnings by Sex by Educational Attainment in Old Westbury
Average earnings in Old Westbury are $160,156 for men and $70,781 for women, a difference of 55.8%. Men with an educational attainment of graduate degree enjoy the highest average annual earnings of $215,500, while those with bachelor's degree education earn the least with $114,950. Women with an educational attainment of graduate degree earn the most with the average annual earnings of $106,458, while those with college or associate's degree education have the smallest earnings of $37,917.
| Educational Attainment | Male Income | Female Income |
| Less than High School | - | - |
| High School Diploma | - | - |
| College or Associate's Degree | $141,595 | $37,917 |
| Bachelor's Degree | $114,950 | $71,875 |
| Graduate Degree | $215,500 | $106,458 |
| Total | $160,156 | $70,781 |
Family Income in Old Westbury
Family Income Brackets in Old Westbury
According to the Old Westbury family income data, there are 511 families falling into the $200,000+ income range, which is the most common income bracket and makes up 63.4% of all families.
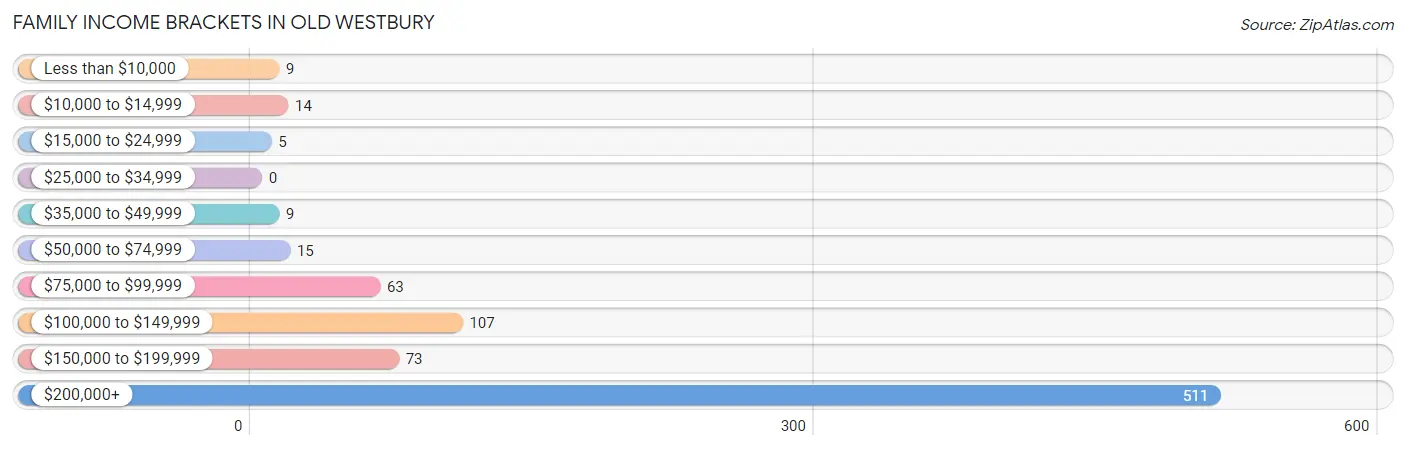
| Income Bracket | # Families | % Families |
| Less than $10,000 | 9 | 1.1% |
| $10,000 to $14,999 | 14 | 1.7% |
| $15,000 to $24,999 | 5 | 0.6% |
| $25,000 to $34,999 | 0 | 0.0% |
| $35,000 to $49,999 | 9 | 1.1% |
| $50,000 to $74,999 | 15 | 1.9% |
| $75,000 to $99,999 | 63 | 7.8% |
| $100,000 to $149,999 | 107 | 13.3% |
| $150,000 to $199,999 | 73 | 9.1% |
| $200,000+ | 511 | 63.4% |
Family Income by Famaliy Size in Old Westbury
2-person families (285 | 35.4%) account for the highest median family income in Old Westbury with $250,001 per family, while 2-person families (285 | 35.4%) have the highest median income of $125,000 per family member.
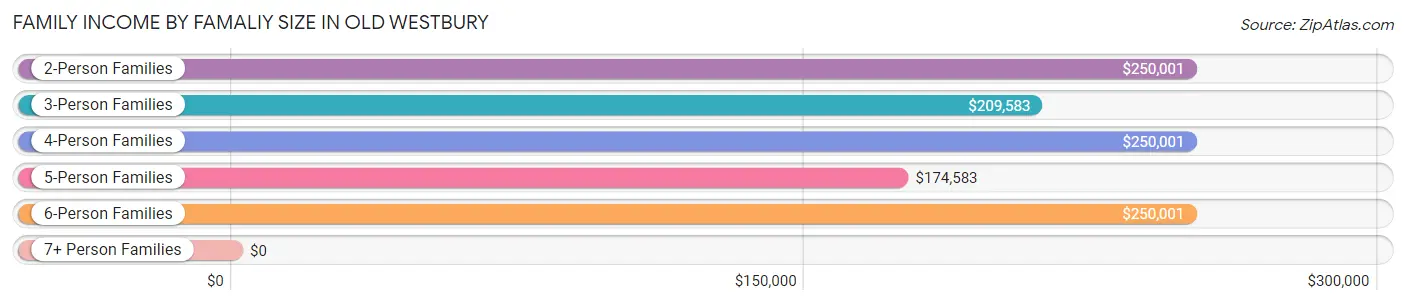
| Income Bracket | # Families | Median Income |
| 2-Person Families | 285 (35.4%) | $250,001 |
| 3-Person Families | 146 (18.1%) | $209,583 |
| 4-Person Families | 206 (25.6%) | $250,001 |
| 5-Person Families | 133 (16.5%) | $174,583 |
| 6-Person Families | 36 (4.5%) | $250,001 |
| 7+ Person Families | 0 (0.0%) | $0 |
| Total | 806 (100.0%) | $250,001 |
Family Income by Number of Earners in Old Westbury
The median family income in Old Westbury is $250,001, with families comprising no earners (70) having the highest median family income of $250,001, while families with 1 earner (295) have the lowest median family income of $248,750, accounting for 8.7% and 36.6% of families, respectively.
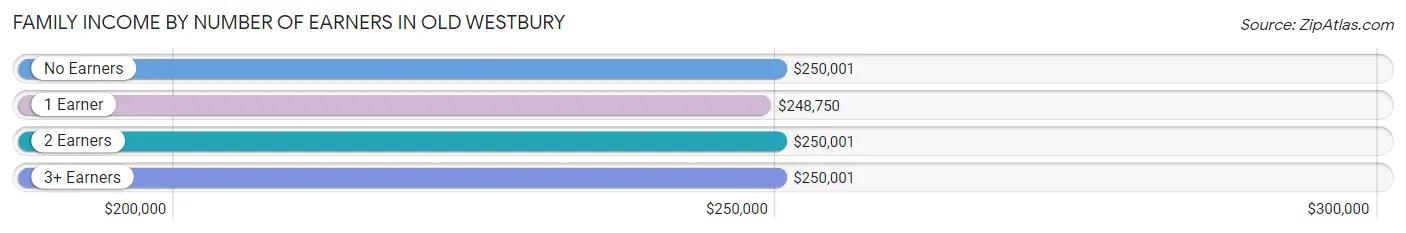
| Number of Earners | # Families | Median Income |
| No Earners | 70 (8.7%) | $250,001 |
| 1 Earner | 295 (36.6%) | $248,750 |
| 2 Earners | 321 (39.8%) | $250,001 |
| 3+ Earners | 120 (14.9%) | $250,001 |
| Total | 806 (100.0%) | $250,001 |
Household Income in Old Westbury
Household Income Brackets in Old Westbury
With 649 households falling in the category, the $200,000+ income range is the most frequent in Old Westbury, accounting for 61.7% of all households. In contrast, only 5 households (0.5%) fall into the $15,000 to $24,999 income bracket, making it the least populous group.
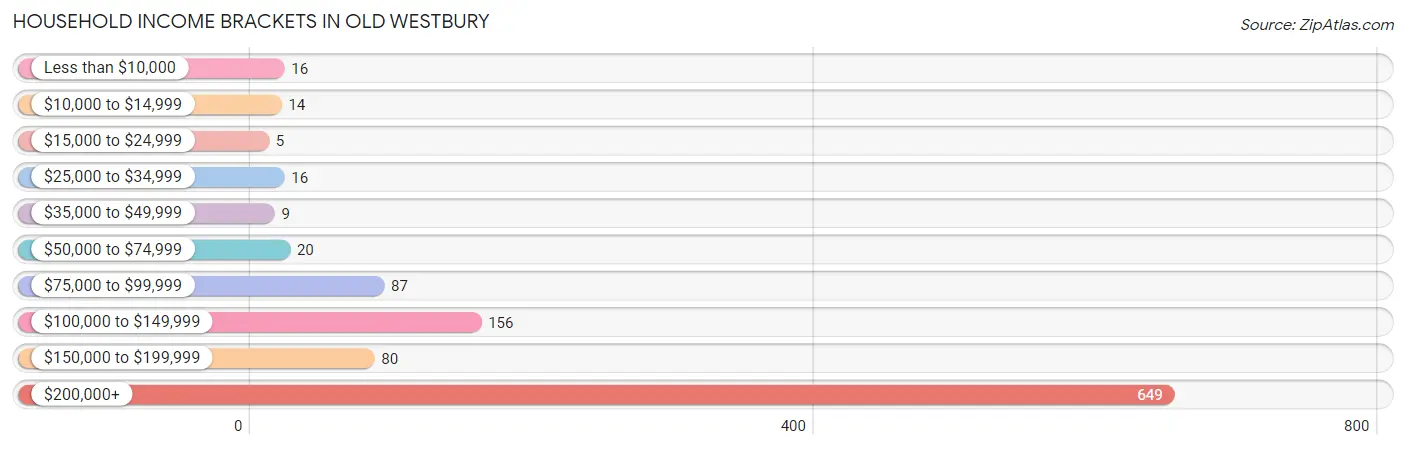
| Income Bracket | # Households | % Households |
| Less than $10,000 | 16 | 1.5% |
| $10,000 to $14,999 | 14 | 1.3% |
| $15,000 to $24,999 | 5 | 0.5% |
| $25,000 to $34,999 | 16 | 1.5% |
| $35,000 to $49,999 | 9 | 0.9% |
| $50,000 to $74,999 | 20 | 1.9% |
| $75,000 to $99,999 | 87 | 8.3% |
| $100,000 to $149,999 | 156 | 14.8% |
| $150,000 to $199,999 | 80 | 7.6% |
| $200,000+ | 649 | 61.7% |
Household Income by Householder Age in Old Westbury
The median household income in Old Westbury is $250,001, with the highest median household income of $250,001 found in the 25 to 44 years age bracket for the primary householder. A total of 202 households (19.2%) fall into this category.
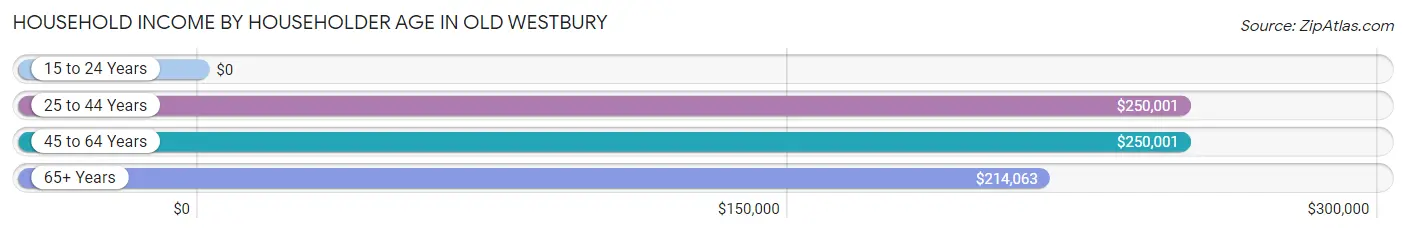
| Income Bracket | # Households | Median Income |
| 15 to 24 Years | 0 (0.0%) | $0 |
| 25 to 44 Years | 202 (19.2%) | $250,001 |
| 45 to 64 Years | 486 (46.2%) | $250,001 |
| 65+ Years | 364 (34.6%) | $214,063 |
| Total | 1,052 (100.0%) | $250,001 |
Poverty in Old Westbury
Income Below Poverty by Sex and Age in Old Westbury
With 4.7% poverty level for males and 3.8% for females among the residents of Old Westbury, 65 to 74 year old males and 12 to 14 year old females are the most vulnerable to poverty, with 19 males (12.0%) and 15 females (31.2%) in their respective age groups living below the poverty level.
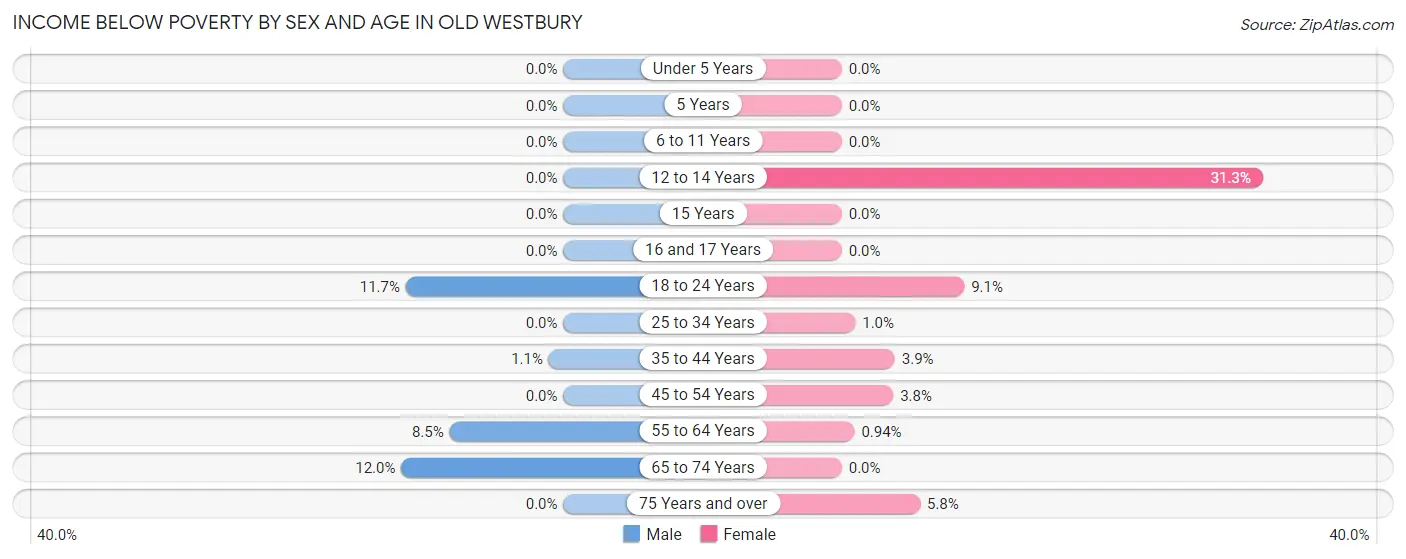
| Age Bracket | Male | Female |
| Under 5 Years | 0 (0.0%) | 0 (0.0%) |
| 5 Years | 0 (0.0%) | 0 (0.0%) |
| 6 to 11 Years | 0 (0.0%) | 0 (0.0%) |
| 12 to 14 Years | 0 (0.0%) | 15 (31.2%) |
| 15 Years | 0 (0.0%) | 0 (0.0%) |
| 16 and 17 Years | 0 (0.0%) | 0 (0.0%) |
| 18 to 24 Years | 31 (11.7%) | 16 (9.1%) |
| 25 to 34 Years | 0 (0.0%) | 2 (1.0%) |
| 35 to 44 Years | 2 (1.1%) | 5 (3.9%) |
| 45 to 54 Years | 0 (0.0%) | 11 (3.8%) |
| 55 to 64 Years | 25 (8.5%) | 2 (0.9%) |
| 65 to 74 Years | 19 (12.0%) | 0 (0.0%) |
| 75 Years and over | 0 (0.0%) | 10 (5.8%) |
| Total | 77 (4.7%) | 61 (3.8%) |
Income Above Poverty by Sex and Age in Old Westbury
According to the poverty statistics in Old Westbury, males aged under 5 years and females aged under 5 years are the age groups that are most secure financially, with 100.0% of males and 100.0% of females in these age groups living above the poverty line.
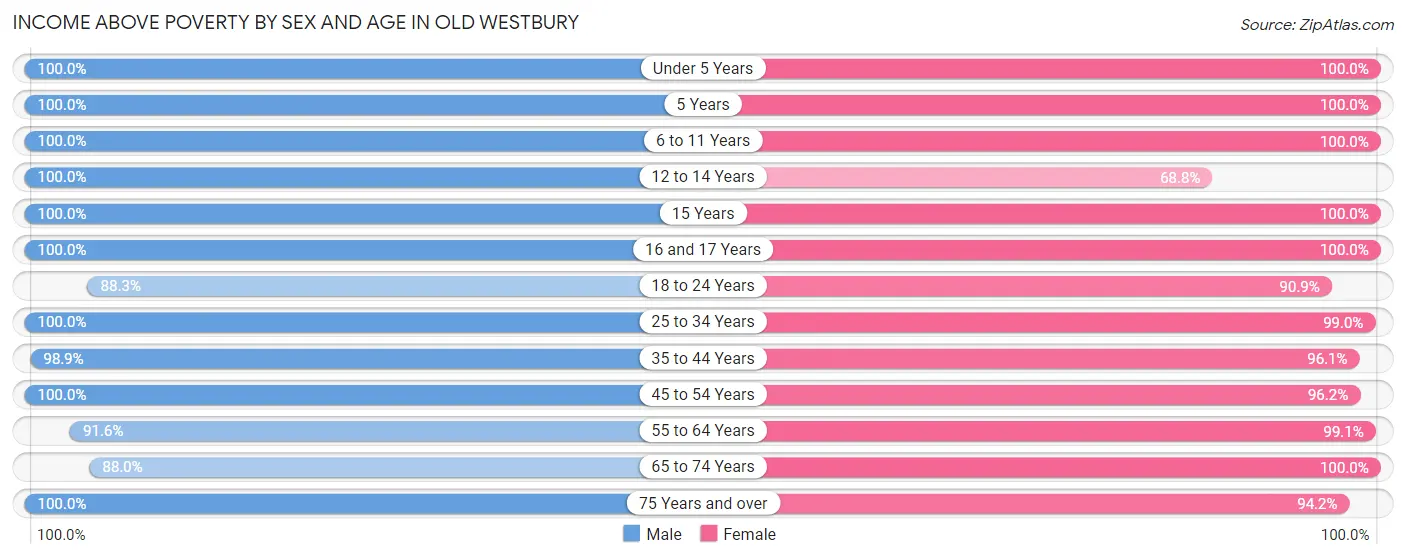
| Age Bracket | Male | Female |
| Under 5 Years | 23 (100.0%) | 35 (100.0%) |
| 5 Years | 15 (100.0%) | 23 (100.0%) |
| 6 to 11 Years | 150 (100.0%) | 104 (100.0%) |
| 12 to 14 Years | 46 (100.0%) | 33 (68.8%) |
| 15 Years | 43 (100.0%) | 11 (100.0%) |
| 16 and 17 Years | 10 (100.0%) | 48 (100.0%) |
| 18 to 24 Years | 234 (88.3%) | 160 (90.9%) |
| 25 to 34 Years | 94 (100.0%) | 199 (99.0%) |
| 35 to 44 Years | 183 (98.9%) | 122 (96.1%) |
| 45 to 54 Years | 187 (100.0%) | 277 (96.2%) |
| 55 to 64 Years | 271 (91.5%) | 210 (99.1%) |
| 65 to 74 Years | 139 (88.0%) | 178 (100.0%) |
| 75 Years and over | 162 (100.0%) | 162 (94.2%) |
| Total | 1,557 (95.3%) | 1,562 (96.2%) |
Income Below Poverty Among Married-Couple Families in Old Westbury
The poverty statistics for married-couple families in Old Westbury show that 1.2% or 9 of the total 731 families live below the poverty line. Families with no children have the highest poverty rate of 1.9%, comprising of 9 families. On the other hand, families with 1 or 2 children have the lowest poverty rate of 0.0%, which includes 0 families.
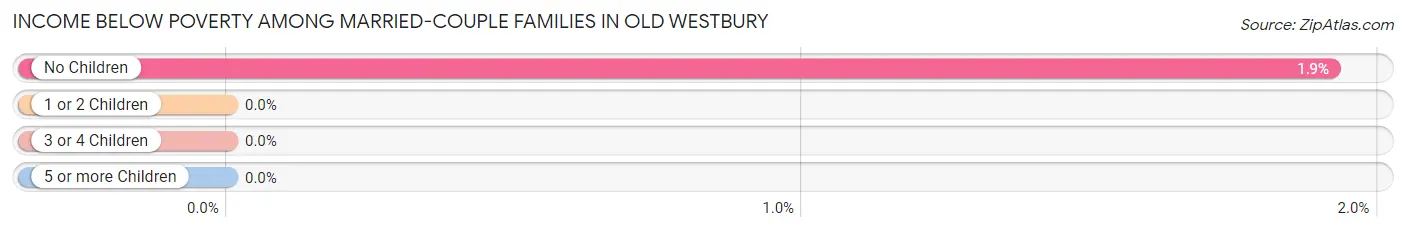
| Children | Above Poverty | Below Poverty |
| No Children | 459 (98.1%) | 9 (1.9%) |
| 1 or 2 Children | 192 (100.0%) | 0 (0.0%) |
| 3 or 4 Children | 71 (100.0%) | 0 (0.0%) |
| 5 or more Children | 0 (0.0%) | 0 (0.0%) |
| Total | 722 (98.8%) | 9 (1.2%) |
Income Below Poverty Among Single-Parent Households in Old Westbury
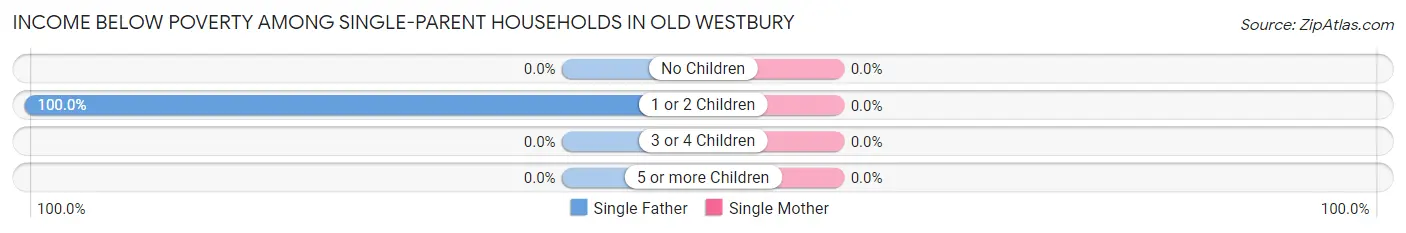
| Children | Single Father | Single Mother |
| No Children | 0 (0.0%) | 0 (0.0%) |
| 1 or 2 Children | 14 (100.0%) | 0 (0.0%) |
| 3 or 4 Children | 0 (0.0%) | 0 (0.0%) |
| 5 or more Children | 0 (0.0%) | 0 (0.0%) |
| Total | 14 (46.7%) | 0 (0.0%) |
Income Below Poverty Among Married-Couple vs Single-Parent Households in Old Westbury
The poverty data for Old Westbury shows that 9 of the married-couple family households (1.2%) and 14 of the single-parent households (18.7%) are living below the poverty level. Within the married-couple family households, those with no children have the highest poverty rate, with 9 households (1.9%) falling below the poverty line. Among the single-parent households, those with 1 or 2 children have the highest poverty rate, with 14 household (100.0%) living below poverty.
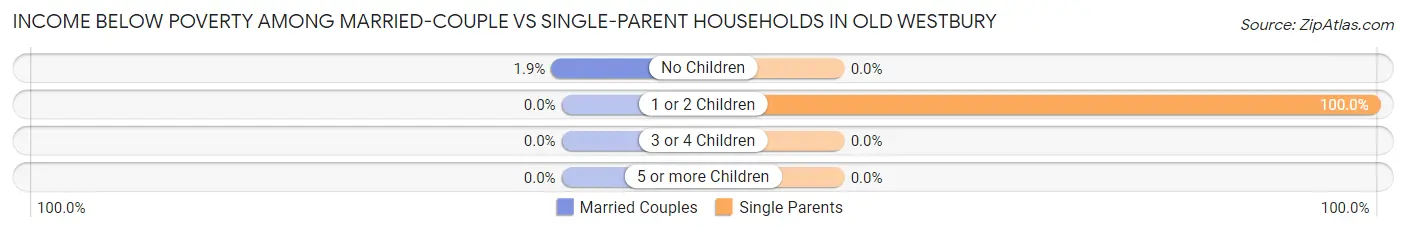
| Children | Married-Couple Families | Single-Parent Households |
| No Children | 9 (1.9%) | 0 (0.0%) |
| 1 or 2 Children | 0 (0.0%) | 14 (100.0%) |
| 3 or 4 Children | 0 (0.0%) | 0 (0.0%) |
| 5 or more Children | 0 (0.0%) | 0 (0.0%) |
| Total | 9 (1.2%) | 14 (18.7%) |
Race in Old Westbury
The most populous races in Old Westbury are White / Caucasian (2,975 | 67.5%), Asian (672 | 15.2%), and Black / African American (348 | 7.9%).
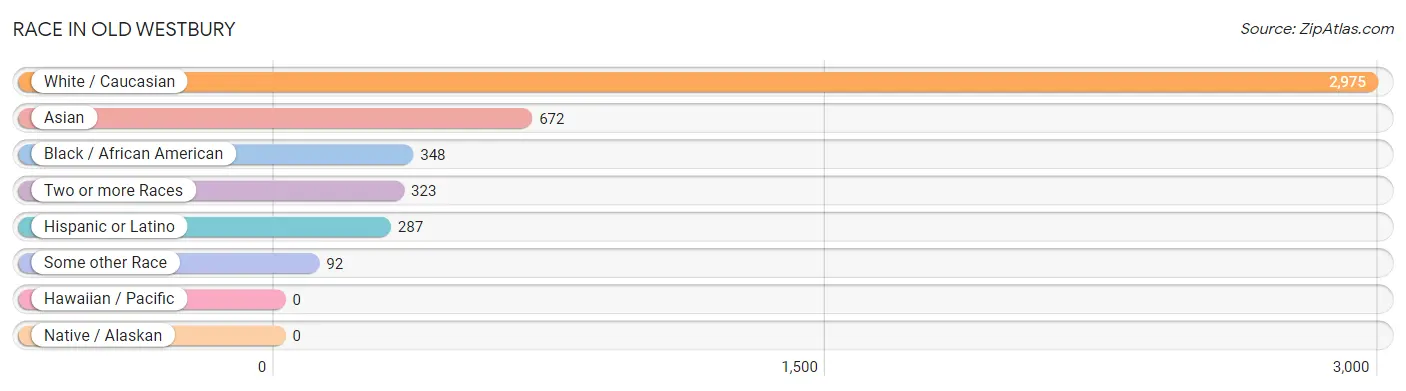
| Race | # Population | % Population |
| Asian | 672 | 15.2% |
| Black / African American | 348 | 7.9% |
| Hawaiian / Pacific | 0 | 0.0% |
| Hispanic or Latino | 287 | 6.5% |
| Native / Alaskan | 0 | 0.0% |
| White / Caucasian | 2,975 | 67.5% |
| Two or more Races | 323 | 7.3% |
| Some other Race | 92 | 2.1% |
| Total | 4,410 | 100.0% |
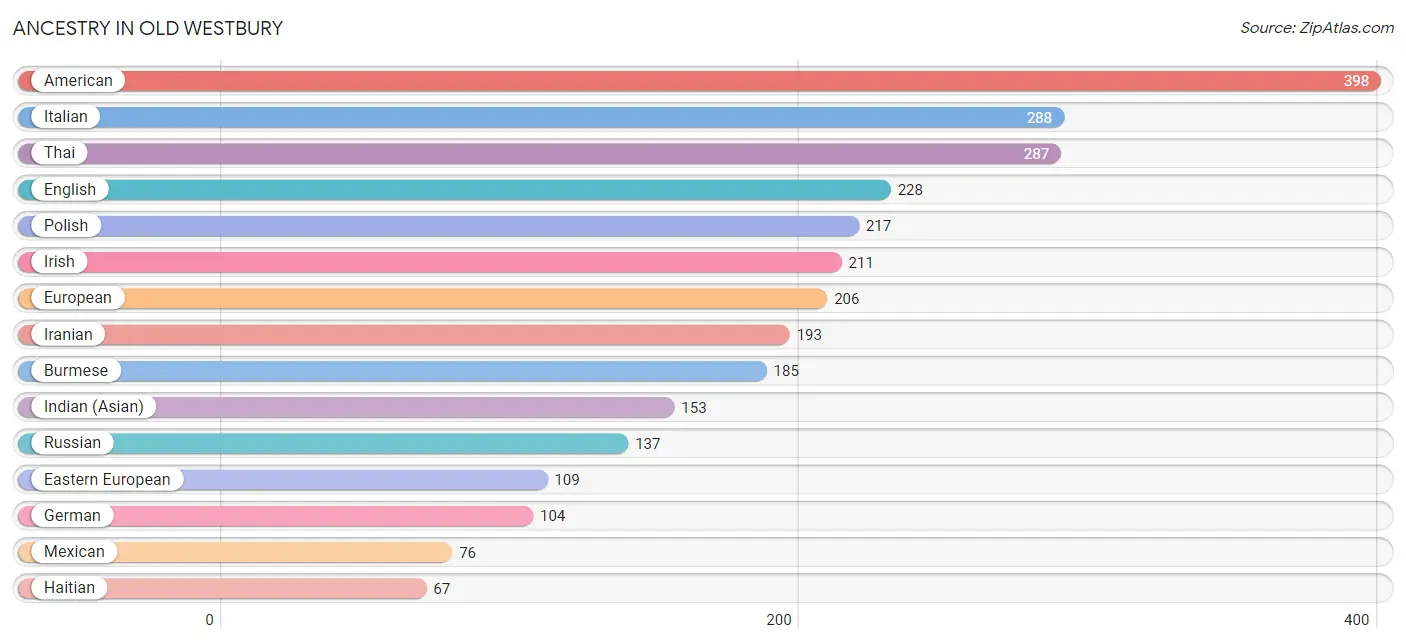
Ancestry in Old Westbury
The most populous ancestries reported in Old Westbury are American (398 | 9.0%), Italian (288 | 6.5%), Thai (287 | 6.5%), English (228 | 5.2%), and Polish (217 | 4.9%), together accounting for 32.2% of all Old Westbury residents.
| Ancestry | # Population | % Population |
| African | 19 | 0.4% |
| Albanian | 34 | 0.8% |
| American | 398 | 9.0% |
| Arab | 52 | 1.2% |
| Argentinean | 19 | 0.4% |
| Armenian | 7 | 0.2% |
| Austrian | 46 | 1.0% |
| Barbadian | 7 | 0.2% |
| Bhutanese | 14 | 0.3% |
| Brazilian | 14 | 0.3% |
| Burmese | 185 | 4.2% |
| Canadian | 29 | 0.7% |
| Central American | 30 | 0.7% |
| Cherokee | 7 | 0.2% |
| Colombian | 32 | 0.7% |
| Croatian | 12 | 0.3% |
| Cuban | 13 | 0.3% |
| Dominican | 59 | 1.3% |
| Eastern European | 109 | 2.5% |
| Egyptian | 22 | 0.5% |
| English | 228 | 5.2% |
| European | 206 | 4.7% |
| French | 14 | 0.3% |
| French Canadian | 3 | 0.1% |
| German | 104 | 2.4% |
| Ghanaian | 23 | 0.5% |
| Greek | 27 | 0.6% |
| Guyanese | 12 | 0.3% |
| Haitian | 67 | 1.5% |
| Honduran | 20 | 0.4% |
| Hungarian | 6 | 0.1% |
| Indian (Asian) | 153 | 3.5% |
| Iranian | 193 | 4.4% |
| Irish | 211 | 4.8% |
| Italian | 288 | 6.5% |
| Jamaican | 52 | 1.2% |
| Korean | 31 | 0.7% |
| Lebanese | 16 | 0.4% |
| Lithuanian | 8 | 0.2% |
| Mexican | 76 | 1.7% |
| Moroccan | 8 | 0.2% |
| Nigerian | 6 | 0.1% |
| Norwegian | 6 | 0.1% |
| Pakistani | 27 | 0.6% |
| Polish | 217 | 4.9% |
| Puerto Rican | 29 | 0.7% |
| Romanian | 32 | 0.7% |
| Russian | 137 | 3.1% |
| Salvadoran | 10 | 0.2% |
| Scottish | 8 | 0.2% |
| Slovene | 15 | 0.3% |
| South African | 3 | 0.1% |
| South American | 51 | 1.2% |
| Sri Lankan | 6 | 0.1% |
| Subsaharan African | 57 | 1.3% |
| Swedish | 6 | 0.1% |
| Thai | 287 | 6.5% |
| Trinidadian and Tobagonian | 15 | 0.3% |
| Turkish | 20 | 0.4% |
| U.S. Virgin Islander | 8 | 0.2% |
| Ugandan | 6 | 0.1% |
| Ukrainian | 14 | 0.3% |
| Vietnamese | 11 | 0.3% |
| West Indian | 3 | 0.1% | View All 64 Rows |
Immigrants in Old Westbury
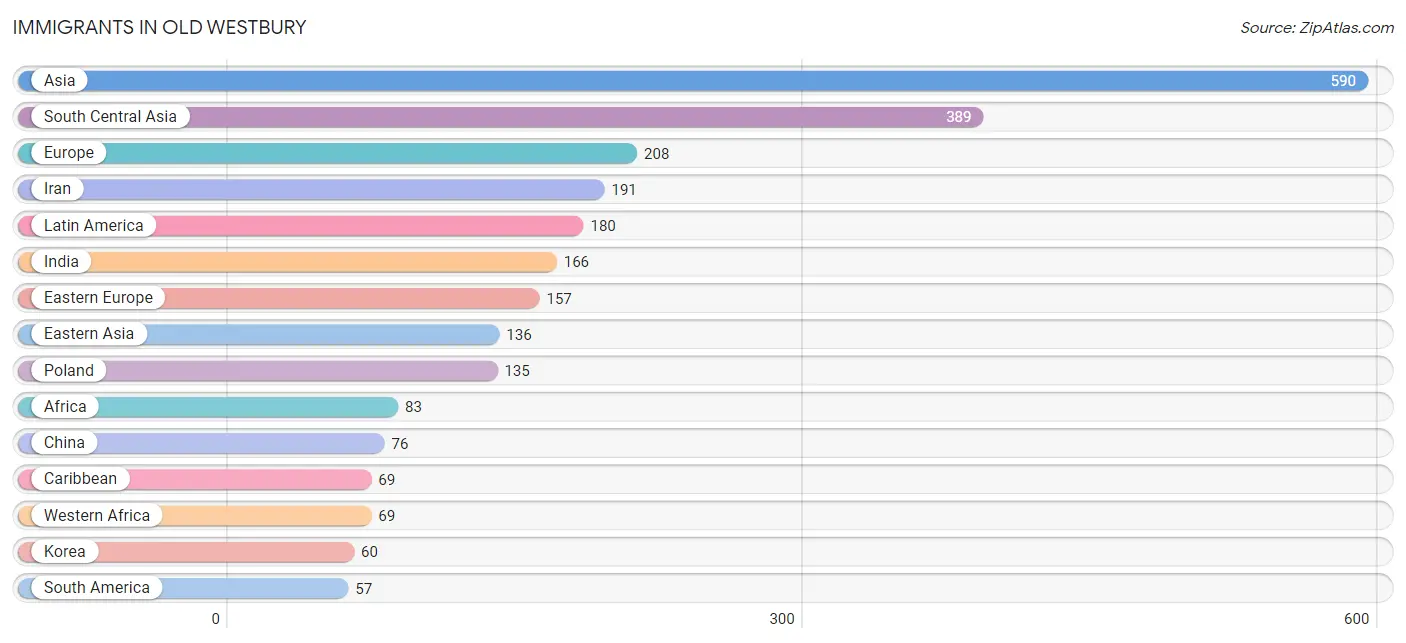
The most numerous immigrant groups reported in Old Westbury came from Asia (590 | 13.4%), South Central Asia (389 | 8.8%), Europe (208 | 4.7%), Iran (191 | 4.3%), and Latin America (180 | 4.1%), together accounting for 35.3% of all Old Westbury residents.
| Immigration Origin | # Population | % Population |
| Africa | 83 | 1.9% |
| Argentina | 19 | 0.4% |
| Asia | 590 | 13.4% |
| Bangladesh | 17 | 0.4% |
| Canada | 26 | 0.6% |
| Caribbean | 69 | 1.6% |
| Central America | 54 | 1.2% |
| China | 76 | 1.7% |
| Colombia | 2 | 0.1% |
| Dominican Republic | 30 | 0.7% |
| Eastern Africa | 6 | 0.1% |
| Eastern Asia | 136 | 3.1% |
| Eastern Europe | 157 | 3.6% |
| Ecuador | 16 | 0.4% |
| Europe | 208 | 4.7% |
| Germany | 6 | 0.1% |
| Ghana | 25 | 0.6% |
| Greece | 16 | 0.4% |
| Guatemala | 29 | 0.7% |
| Guyana | 12 | 0.3% |
| Haiti | 39 | 0.9% |
| India | 166 | 3.8% |
| Iran | 191 | 4.3% |
| Israel | 7 | 0.2% |
| Italy | 14 | 0.3% |
| Korea | 60 | 1.4% |
| Latin America | 180 | 4.1% |
| Lebanon | 7 | 0.2% |
| Mexico | 25 | 0.6% |
| Morocco | 8 | 0.2% |
| Nigeria | 23 | 0.5% |
| Northern Africa | 8 | 0.2% |
| Northern Europe | 15 | 0.3% |
| Pakistan | 15 | 0.3% |
| Peru | 8 | 0.2% |
| Philippines | 8 | 0.2% |
| Poland | 135 | 3.1% |
| Romania | 7 | 0.2% |
| Russia | 6 | 0.1% |
| Scotland | 8 | 0.2% |
| Sierra Leone | 21 | 0.5% |
| South America | 57 | 1.3% |
| South Central Asia | 389 | 8.8% |
| South Eastern Asia | 31 | 0.7% |
| Southern Europe | 30 | 0.7% |
| Taiwan | 8 | 0.2% |
| Thailand | 8 | 0.2% |
| Turkey | 20 | 0.4% |
| Uganda | 6 | 0.1% |
| Vietnam | 15 | 0.3% |
| Western Africa | 69 | 1.6% |
| Western Asia | 34 | 0.8% |
| Western Europe | 6 | 0.1% | View All 53 Rows |
Sex and Age in Old Westbury
Sex and Age in Old Westbury
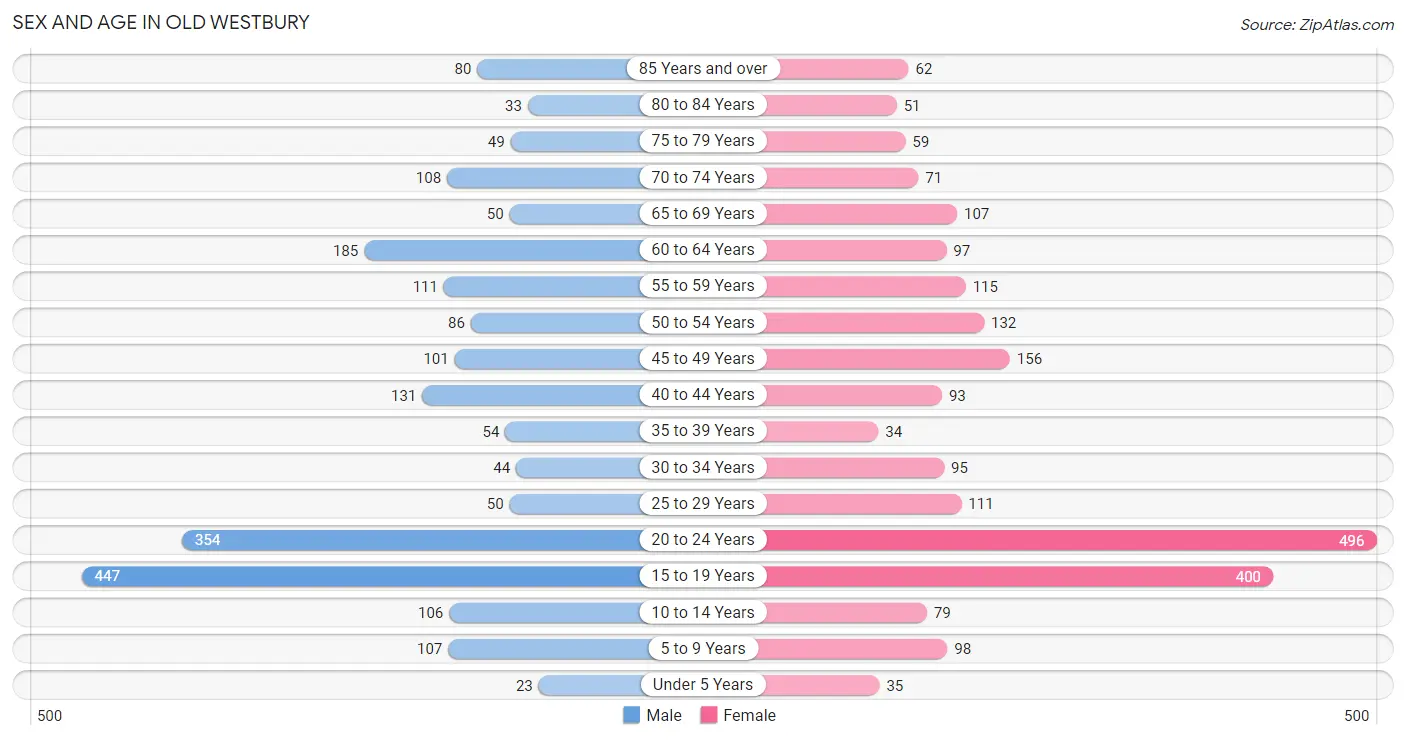
The most populous age groups in Old Westbury are 15 to 19 Years (447 | 21.1%) for men and 20 to 24 Years (496 | 21.6%) for women.
| Age Bracket | Male | Female |
| Under 5 Years | 23 (1.1%) | 35 (1.5%) |
| 5 to 9 Years | 107 (5.1%) | 98 (4.3%) |
| 10 to 14 Years | 106 (5.0%) | 79 (3.5%) |
| 15 to 19 Years | 447 (21.1%) | 400 (17.5%) |
| 20 to 24 Years | 354 (16.7%) | 496 (21.6%) |
| 25 to 29 Years | 50 (2.4%) | 111 (4.9%) |
| 30 to 34 Years | 44 (2.1%) | 95 (4.2%) |
| 35 to 39 Years | 54 (2.5%) | 34 (1.5%) |
| 40 to 44 Years | 131 (6.2%) | 93 (4.1%) |
| 45 to 49 Years | 101 (4.8%) | 156 (6.8%) |
| 50 to 54 Years | 86 (4.1%) | 132 (5.8%) |
| 55 to 59 Years | 111 (5.2%) | 115 (5.0%) |
| 60 to 64 Years | 185 (8.7%) | 97 (4.2%) |
| 65 to 69 Years | 50 (2.4%) | 107 (4.7%) |
| 70 to 74 Years | 108 (5.1%) | 71 (3.1%) |
| 75 to 79 Years | 49 (2.3%) | 59 (2.6%) |
| 80 to 84 Years | 33 (1.6%) | 51 (2.2%) |
| 85 Years and over | 80 (3.8%) | 62 (2.7%) |
| Total | 2,119 (100.0%) | 2,291 (100.0%) |
Families and Households in Old Westbury
Median Family Size in Old Westbury
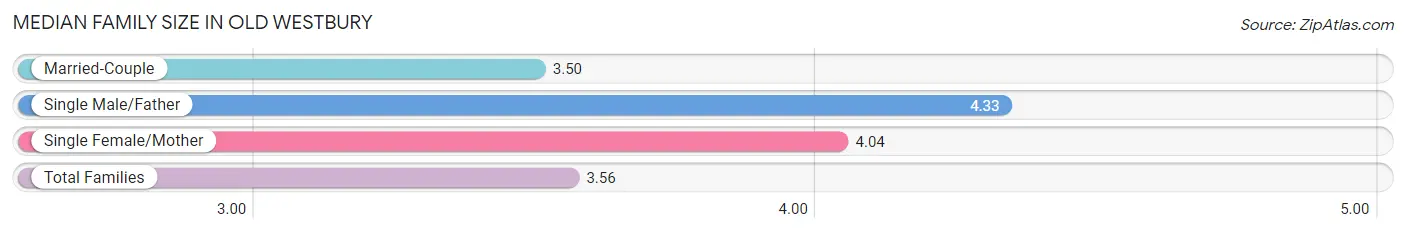
The median family size in Old Westbury is 3.56 persons per family, with single male/father families (30 | 3.7%) accounting for the largest median family size of 4.33 persons per family. On the other hand, married-couple families (731 | 90.7%) represent the smallest median family size with 3.50 persons per family.
| Family Type | # Families | Family Size |
| Married-Couple | 731 (90.7%) | 3.50 |
| Single Male/Father | 30 (3.7%) | 4.33 |
| Single Female/Mother | 45 (5.6%) | 4.04 |
| Total Families | 806 (100.0%) | 3.56 |
Median Household Size in Old Westbury
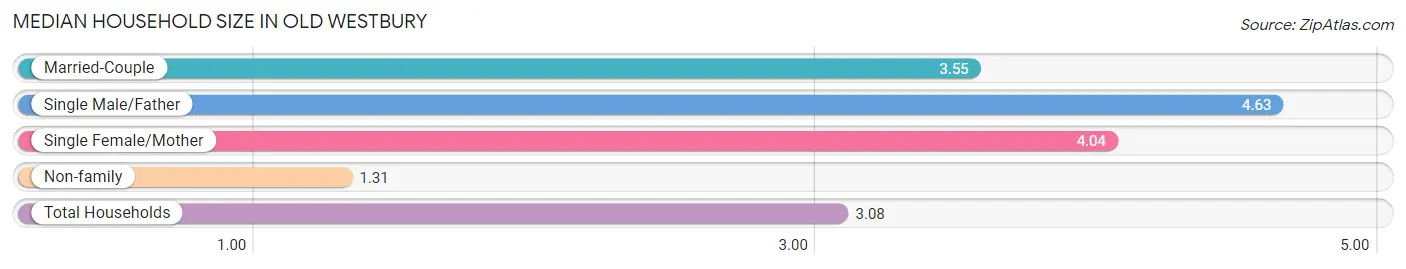
The median household size in Old Westbury is 3.08 persons per household, with single male/father households (30 | 2.9%) accounting for the largest median household size of 4.63 persons per household. non-family households (246 | 23.4%) represent the smallest median household size with 1.31 persons per household.
| Household Type | # Households | Household Size |
| Married-Couple | 731 (69.5%) | 3.55 |
| Single Male/Father | 30 (2.9%) | 4.63 |
| Single Female/Mother | 45 (4.3%) | 4.04 |
| Non-family | 246 (23.4%) | 1.31 |
| Total Households | 1,052 (100.0%) | 3.08 |
Household Size by Marriage Status in Old Westbury
Out of a total of 1,052 households in Old Westbury, 806 (76.6%) are family households, while 246 (23.4%) are nonfamily households. The most numerous type of family households are 2-person households, comprising 277, and the most common type of nonfamily households are 1-person households, comprising 169.
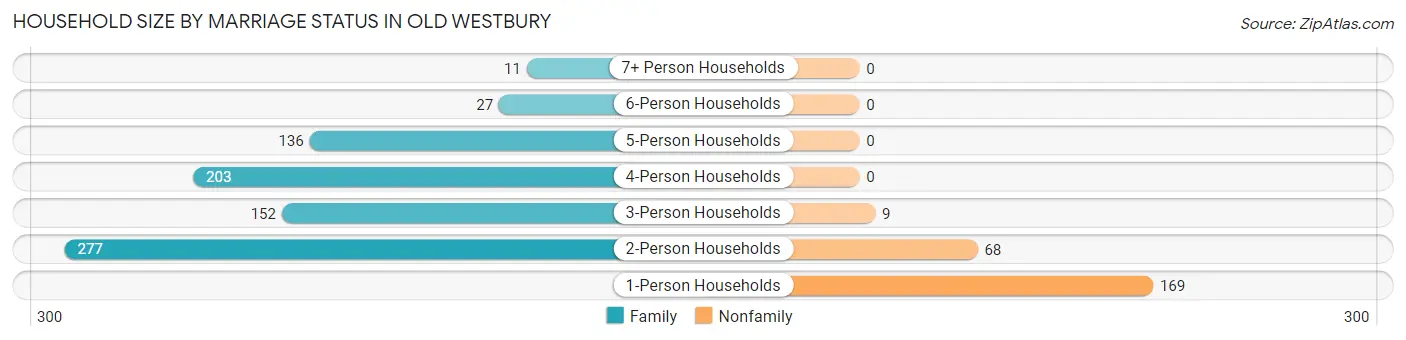
| Household Size | Family Households | Nonfamily Households |
| 1-Person Households | - | 169 (16.1%) |
| 2-Person Households | 277 (26.3%) | 68 (6.5%) |
| 3-Person Households | 152 (14.4%) | 9 (0.9%) |
| 4-Person Households | 203 (19.3%) | 0 (0.0%) |
| 5-Person Households | 136 (12.9%) | 0 (0.0%) |
| 6-Person Households | 27 (2.6%) | 0 (0.0%) |
| 7+ Person Households | 11 (1.1%) | 0 (0.0%) |
| Total | 806 (76.6%) | 246 (23.4%) |
Female Fertility in Old Westbury
Fertility by Age in Old Westbury
| Age Bracket | Women with Births | Births / 1,000 Women |
| 15 to 19 years | 0 (0.0%) | 0.0 |
| 20 to 34 years | 0 (0.0%) | 0.0 |
| 35 to 50 years | 0 (0.0%) | 0.0 |
| Total | 0 (0.0%) | 0.0 |
Fertility by Age by Marriage Status in Old Westbury
| Age Bracket | Married | Unmarried |
| 15 to 19 years | 0 (0.0%) | 0 (0.0%) |
| 20 to 34 years | 0 (0.0%) | 0 (0.0%) |
| 35 to 50 years | 0 (0.0%) | 0 (0.0%) |
| Total | 0 (0.0%) | 0 (0.0%) |
Fertility by Education in Old Westbury
| Educational Attainment | Women with Births | Births / 1,000 Women |
| Less than High School | 0 (0.0%) | 0.0 |
| High School Diploma | 0 (0.0%) | 0.0 |
| College or Associate's Degree | 0 (0.0%) | 0.0 |
| Bachelor's Degree | 0 (0.0%) | 0.0 |
| Graduate Degree | 0 (0.0%) | 0.0 |
| Total | 0 (0.0%) | 0.0 |
Fertility by Education by Marriage Status in Old Westbury
| Educational Attainment | Married | Unmarried |
| Less than High School | 0 (0.0%) | 0 (0.0%) |
| High School Diploma | 0 (0.0%) | 0 (0.0%) |
| College or Associate's Degree | 0 (0.0%) | 0 (0.0%) |
| Bachelor's Degree | 0 (0.0%) | 0 (0.0%) |
| Graduate Degree | 0 (0.0%) | 0 (0.0%) |
| Total | 0 (0.0%) | 0 (0.0%) |
Employment Characteristics in Old Westbury
Employment by Class of Employer in Old Westbury
Among the 1,969 employed individuals in Old Westbury, private company employees (1,268 | 64.4%), self-employed (incorporated) (235 | 11.9%), and not-for-profit organizations (126 | 6.4%) make up the most common classes of employment.
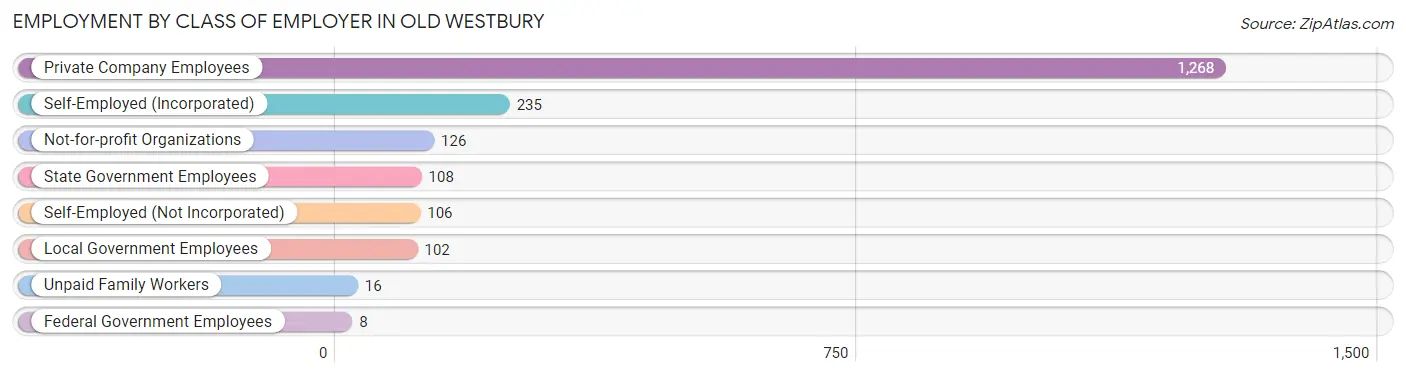
| Employer Class | # Employees | % Employees |
| Private Company Employees | 1,268 | 64.4% |
| Self-Employed (Incorporated) | 235 | 11.9% |
| Self-Employed (Not Incorporated) | 106 | 5.4% |
| Not-for-profit Organizations | 126 | 6.4% |
| Local Government Employees | 102 | 5.2% |
| State Government Employees | 108 | 5.5% |
| Federal Government Employees | 8 | 0.4% |
| Unpaid Family Workers | 16 | 0.8% |
| Total | 1,969 | 100.0% |
Employment Status by Age in Old Westbury
According to the labor force statistics for Old Westbury, out of the total population over 16 years of age (3,908), 56.0% or 2,188 individuals are in the labor force, with 7.3% or 160 of them unemployed. The age group with the highest labor force participation rate is 25 to 29 years, with 100.0% or 161 individuals in the labor force. Within the labor force, the 16 to 19 years age range has the highest percentage of unemployed individuals, with 22.2% or 59 of them being unemployed.
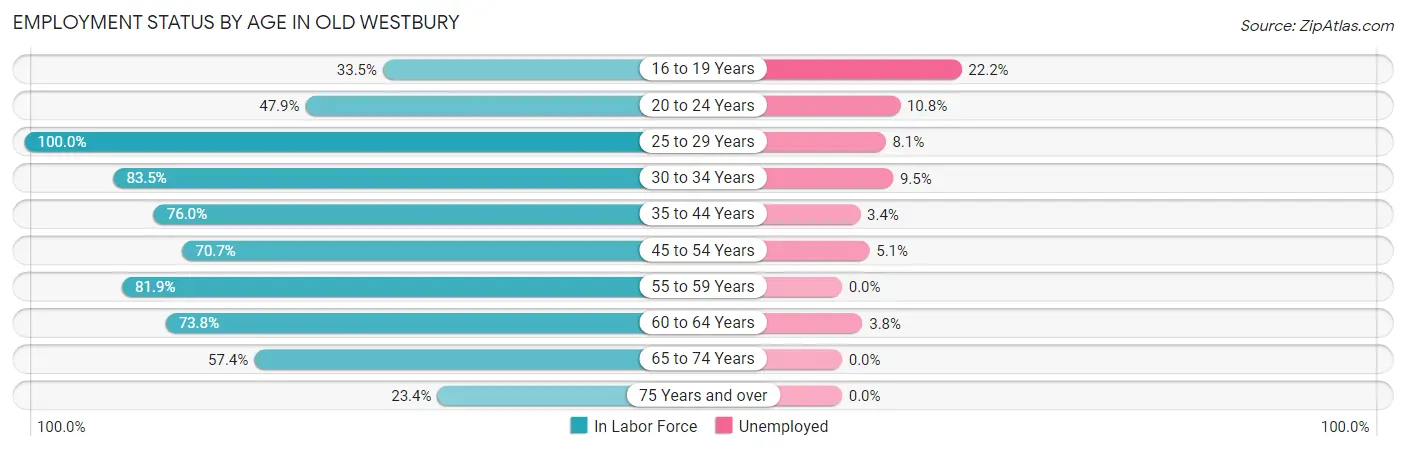
| Age Bracket | In Labor Force | Unemployed |
| 16 to 19 Years | 266 (33.5%) | 59 (22.2%) |
| 20 to 24 Years | 407 (47.9%) | 44 (10.8%) |
| 25 to 29 Years | 161 (100.0%) | 13 (8.1%) |
| 30 to 34 Years | 116 (83.5%) | 11 (9.5%) |
| 35 to 44 Years | 237 (76.0%) | 8 (3.4%) |
| 45 to 54 Years | 336 (70.7%) | 17 (5.1%) |
| 55 to 59 Years | 185 (81.9%) | 0 (0.0%) |
| 60 to 64 Years | 208 (73.8%) | 8 (3.8%) |
| 65 to 74 Years | 193 (57.4%) | 0 (0.0%) |
| 75 Years and over | 78 (23.4%) | 0 (0.0%) |
| Total | 2,188 (56.0%) | 160 (7.3%) |
Employment Status by Educational Attainment in Old Westbury
According to labor force statistics for Old Westbury, 77.9% of individuals (1,243) out of the total population between 25 and 64 years of age (1,595) are in the labor force, with 4.6% or 57 of them being unemployed. The group with the highest labor force participation rate are those with the educational attainment of bachelor's degree or higher, with 84.5% or 1,060 individuals in the labor force. Within the labor force, individuals with high school diploma education have the highest percentage of unemployment, with 10.6% or 5 of them being unemployed.
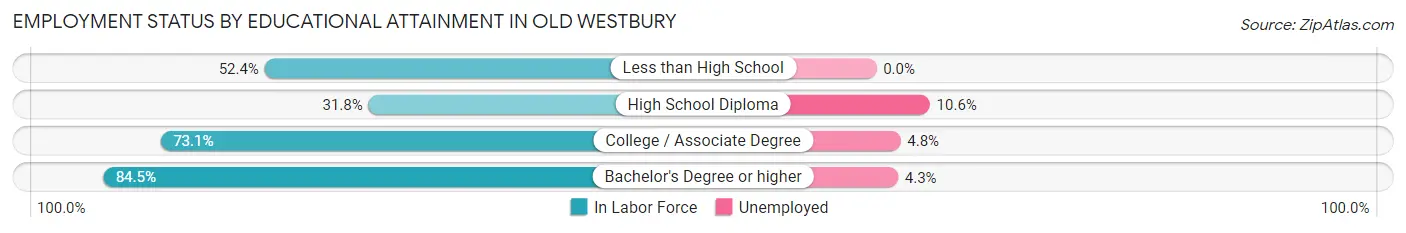
| Educational Attainment | In Labor Force | Unemployed |
| Less than High School | 11 (52.4%) | 0 (0.0%) |
| High School Diploma | 47 (31.8%) | 16 (10.6%) |
| College / Associate Degree | 125 (73.1%) | 8 (4.8%) |
| Bachelor's Degree or higher | 1,060 (84.5%) | 54 (4.3%) |
| Total | 1,243 (77.9%) | 73 (4.6%) |
Employment Occupations by Sex in Old Westbury
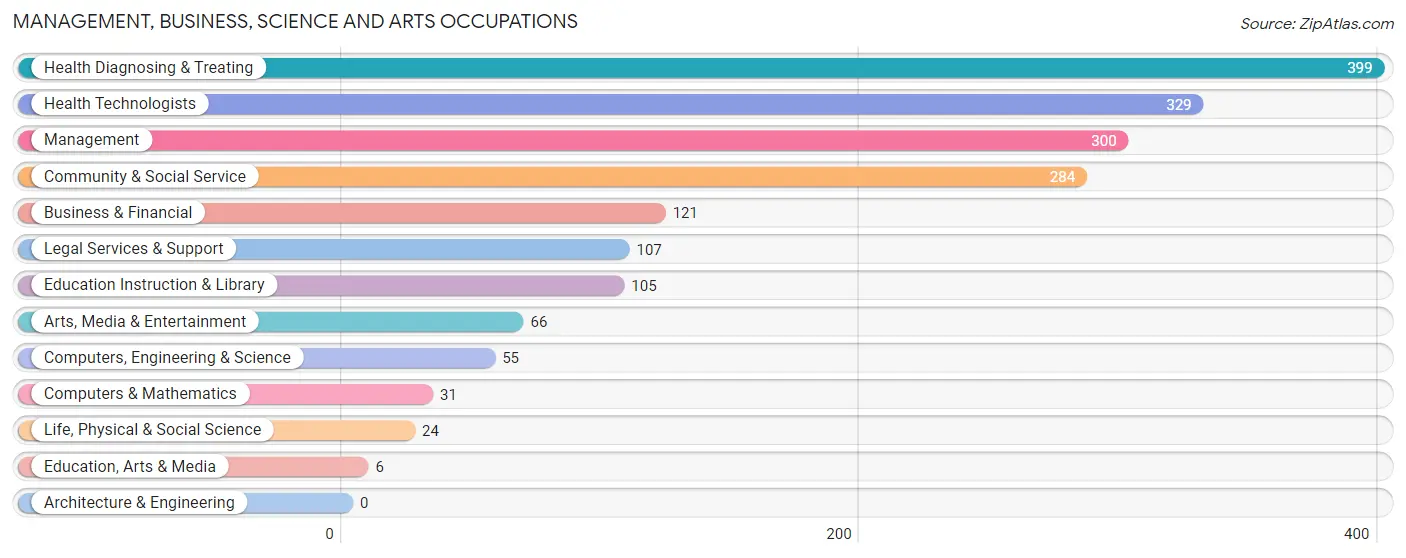
Management, Business, Science and Arts Occupations
The most common Management, Business, Science and Arts occupations in Old Westbury are Health Diagnosing & Treating (399 | 19.7%), Health Technologists (329 | 16.2%), Management (300 | 14.8%), Community & Social Service (284 | 14.0%), and Business & Financial (121 | 6.0%).
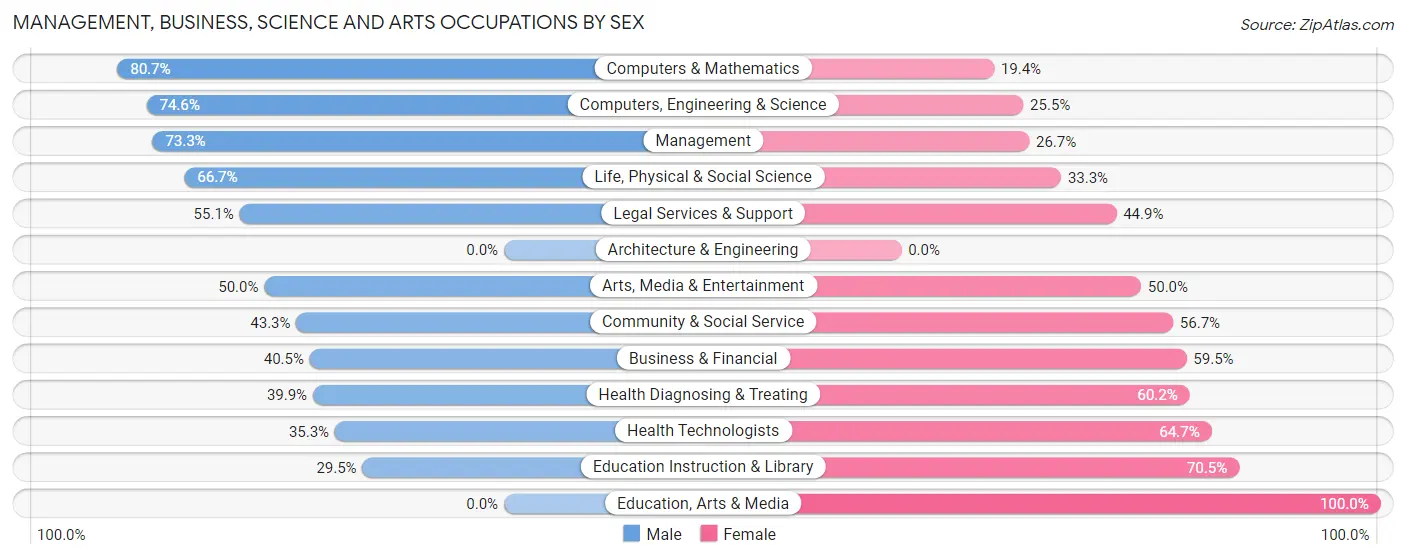
Management, Business, Science and Arts Occupations by Sex
Within the Management, Business, Science and Arts occupations in Old Westbury, the most male-oriented occupations are Computers & Mathematics (80.6%), Computers, Engineering & Science (74.6%), and Management (73.3%), while the most female-oriented occupations are Education, Arts & Media (100.0%), Education Instruction & Library (70.5%), and Health Technologists (64.7%).
| Occupation | Male | Female |
| Management | 220 (73.3%) | 80 (26.7%) |
| Business & Financial | 49 (40.5%) | 72 (59.5%) |
| Computers, Engineering & Science | 41 (74.6%) | 14 (25.5%) |
| Computers & Mathematics | 25 (80.6%) | 6 (19.4%) |
| Architecture & Engineering | 0 (0.0%) | 0 (0.0%) |
| Life, Physical & Social Science | 16 (66.7%) | 8 (33.3%) |
| Community & Social Service | 123 (43.3%) | 161 (56.7%) |
| Education, Arts & Media | 0 (0.0%) | 6 (100.0%) |
| Legal Services & Support | 59 (55.1%) | 48 (44.9%) |
| Education Instruction & Library | 31 (29.5%) | 74 (70.5%) |
| Arts, Media & Entertainment | 33 (50.0%) | 33 (50.0%) |
| Health Diagnosing & Treating | 159 (39.9%) | 240 (60.2%) |
| Health Technologists | 116 (35.3%) | 213 (64.7%) |
| Total (Category) | 592 (51.1%) | 567 (48.9%) |
| Total (Overall) | 1,031 (50.9%) | 996 (49.1%) |
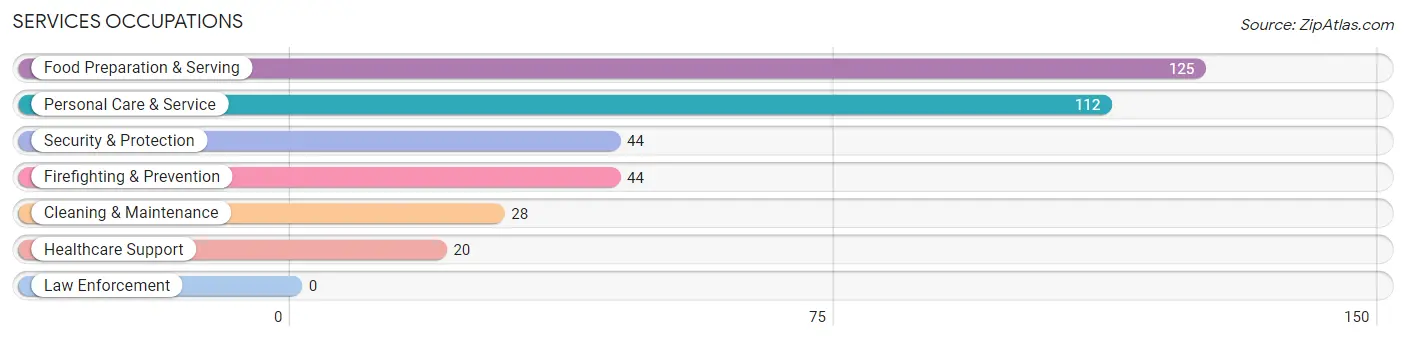
Services Occupations
The most common Services occupations in Old Westbury are Food Preparation & Serving (125 | 6.2%), Personal Care & Service (112 | 5.5%), Security & Protection (44 | 2.2%), Firefighting & Prevention (44 | 2.2%), and Cleaning & Maintenance (28 | 1.4%).
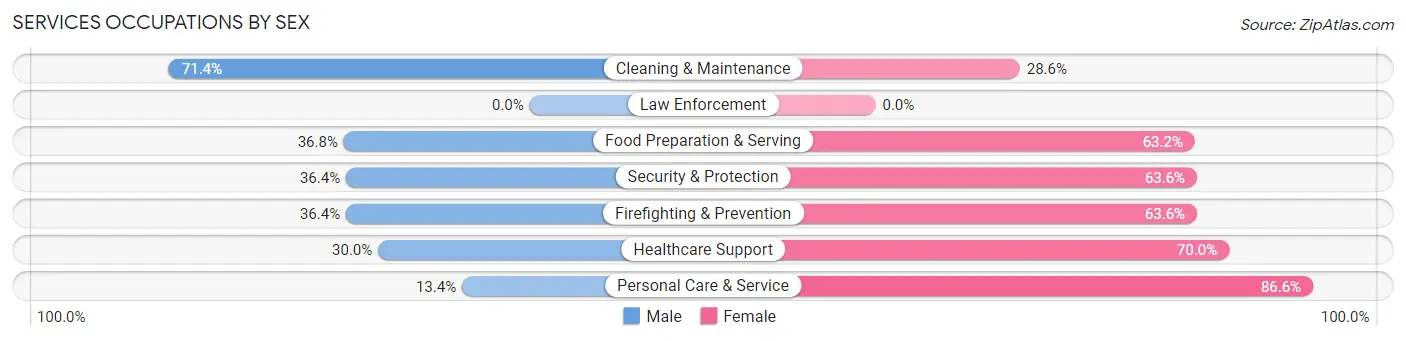
Services Occupations by Sex
Within the Services occupations in Old Westbury, the most male-oriented occupations are Cleaning & Maintenance (71.4%), Food Preparation & Serving (36.8%), and Security & Protection (36.4%), while the most female-oriented occupations are Personal Care & Service (86.6%), Healthcare Support (70.0%), and Security & Protection (63.6%).
| Occupation | Male | Female |
| Healthcare Support | 6 (30.0%) | 14 (70.0%) |
| Security & Protection | 16 (36.4%) | 28 (63.6%) |
| Firefighting & Prevention | 16 (36.4%) | 28 (63.6%) |
| Law Enforcement | 0 (0.0%) | 0 (0.0%) |
| Food Preparation & Serving | 46 (36.8%) | 79 (63.2%) |
| Cleaning & Maintenance | 20 (71.4%) | 8 (28.6%) |
| Personal Care & Service | 15 (13.4%) | 97 (86.6%) |
| Total (Category) | 103 (31.3%) | 226 (68.7%) |
| Total (Overall) | 1,031 (50.9%) | 996 (49.1%) |
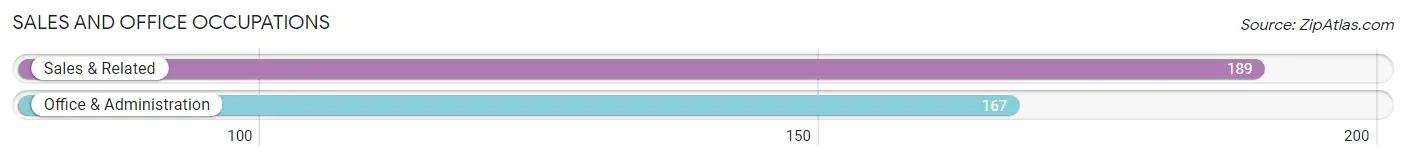
Sales and Office Occupations
The most common Sales and Office occupations in Old Westbury are Sales & Related (189 | 9.3%), and Office & Administration (167 | 8.2%).
Sales and Office Occupations by Sex
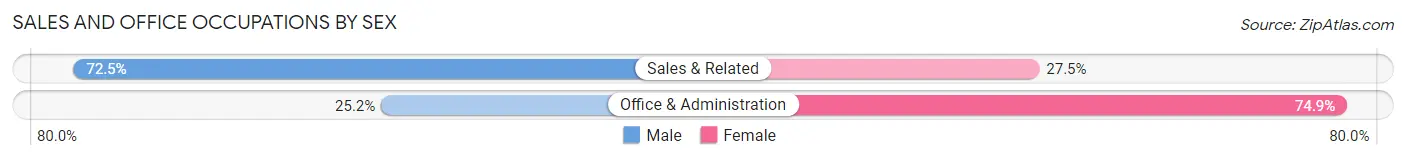
| Occupation | Male | Female |
| Sales & Related | 137 (72.5%) | 52 (27.5%) |
| Office & Administration | 42 (25.2%) | 125 (74.9%) |
| Total (Category) | 179 (50.3%) | 177 (49.7%) |
| Total (Overall) | 1,031 (50.9%) | 996 (49.1%) |
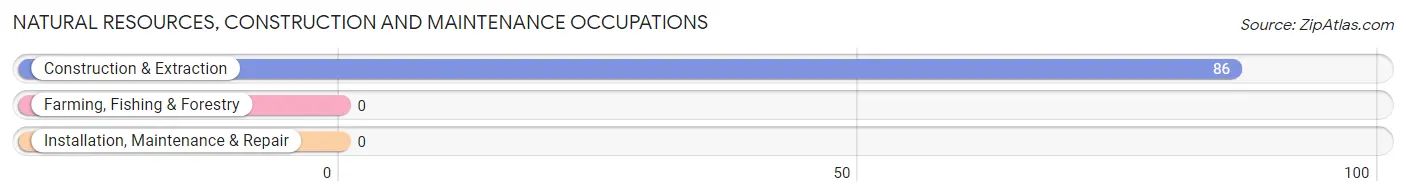
Natural Resources, Construction and Maintenance Occupations
The most common Natural Resources, Construction and Maintenance occupations in Old Westbury are , and Construction & Extraction (86 | 4.2%).
Natural Resources, Construction and Maintenance Occupations by Sex
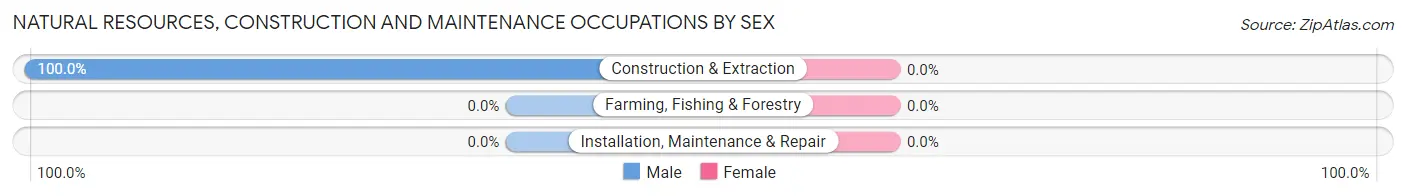
| Occupation | Male | Female |
| Farming, Fishing & Forestry | 0 (0.0%) | 0 (0.0%) |
| Construction & Extraction | 86 (100.0%) | 0 (0.0%) |
| Installation, Maintenance & Repair | 0 (0.0%) | 0 (0.0%) |
| Total (Category) | 86 (100.0%) | 0 (0.0%) |
| Total (Overall) | 1,031 (50.9%) | 996 (49.1%) |
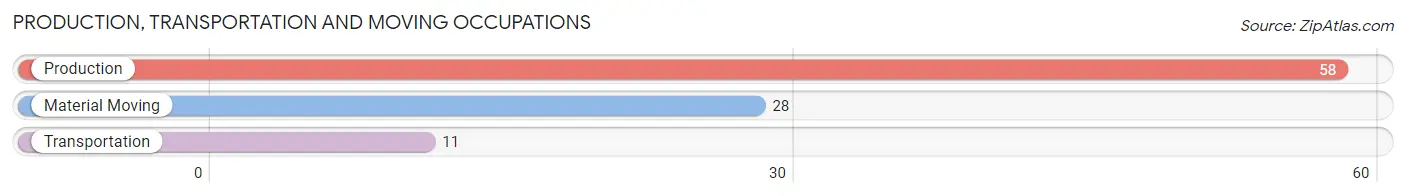
Production, Transportation and Moving Occupations
The most common Production, Transportation and Moving occupations in Old Westbury are Production (58 | 2.9%), Material Moving (28 | 1.4%), and Transportation (11 | 0.5%).
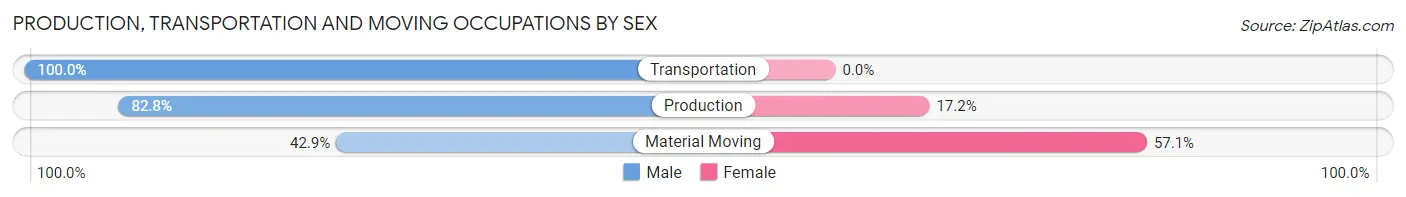
Production, Transportation and Moving Occupations by Sex
| Occupation | Male | Female |
| Production | 48 (82.8%) | 10 (17.2%) |
| Transportation | 11 (100.0%) | 0 (0.0%) |
| Material Moving | 12 (42.9%) | 16 (57.1%) |
| Total (Category) | 71 (73.2%) | 26 (26.8%) |
| Total (Overall) | 1,031 (50.9%) | 996 (49.1%) |
Employment Industries by Sex in Old Westbury
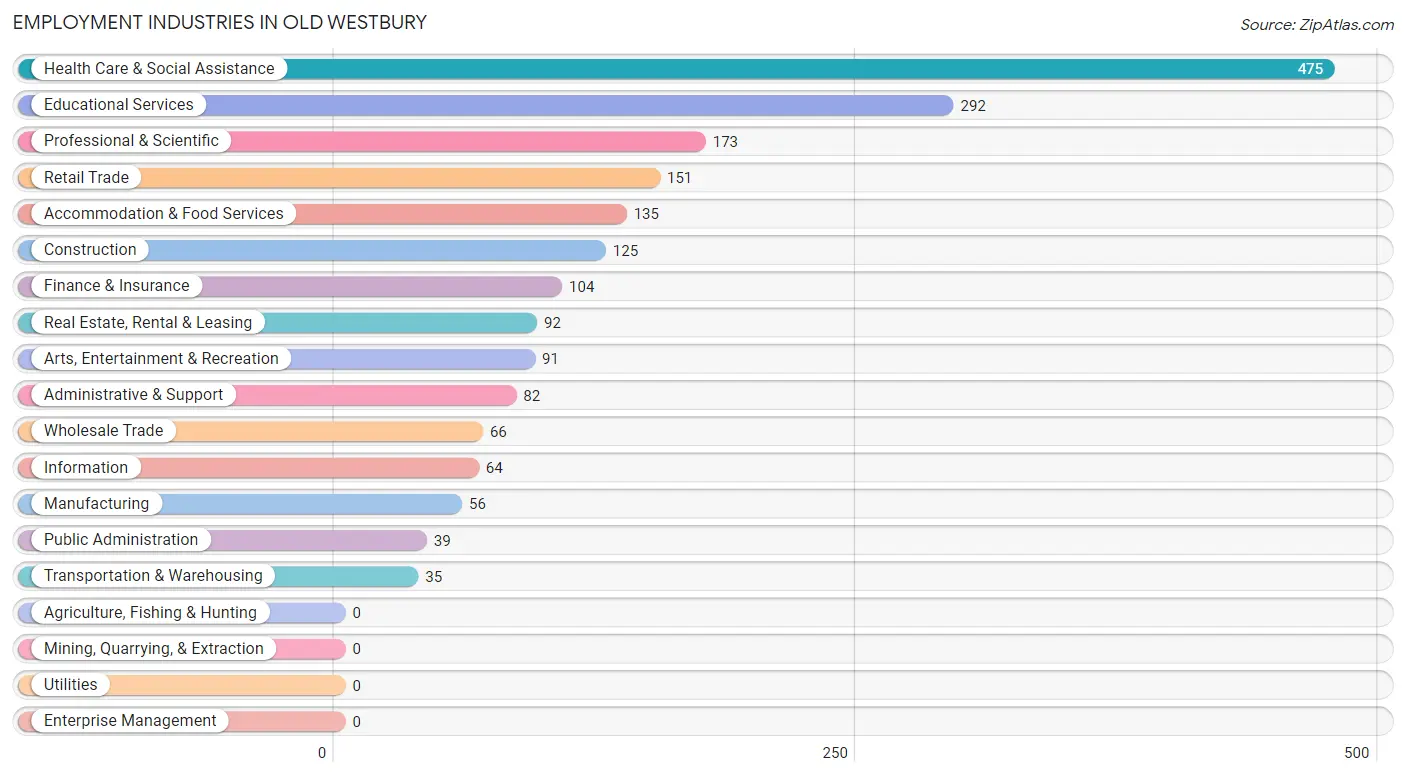
Employment Industries in Old Westbury
The major employment industries in Old Westbury include Health Care & Social Assistance (475 | 23.4%), Educational Services (292 | 14.4%), Professional & Scientific (173 | 8.5%), Retail Trade (151 | 7.4%), and Accommodation & Food Services (135 | 6.7%).
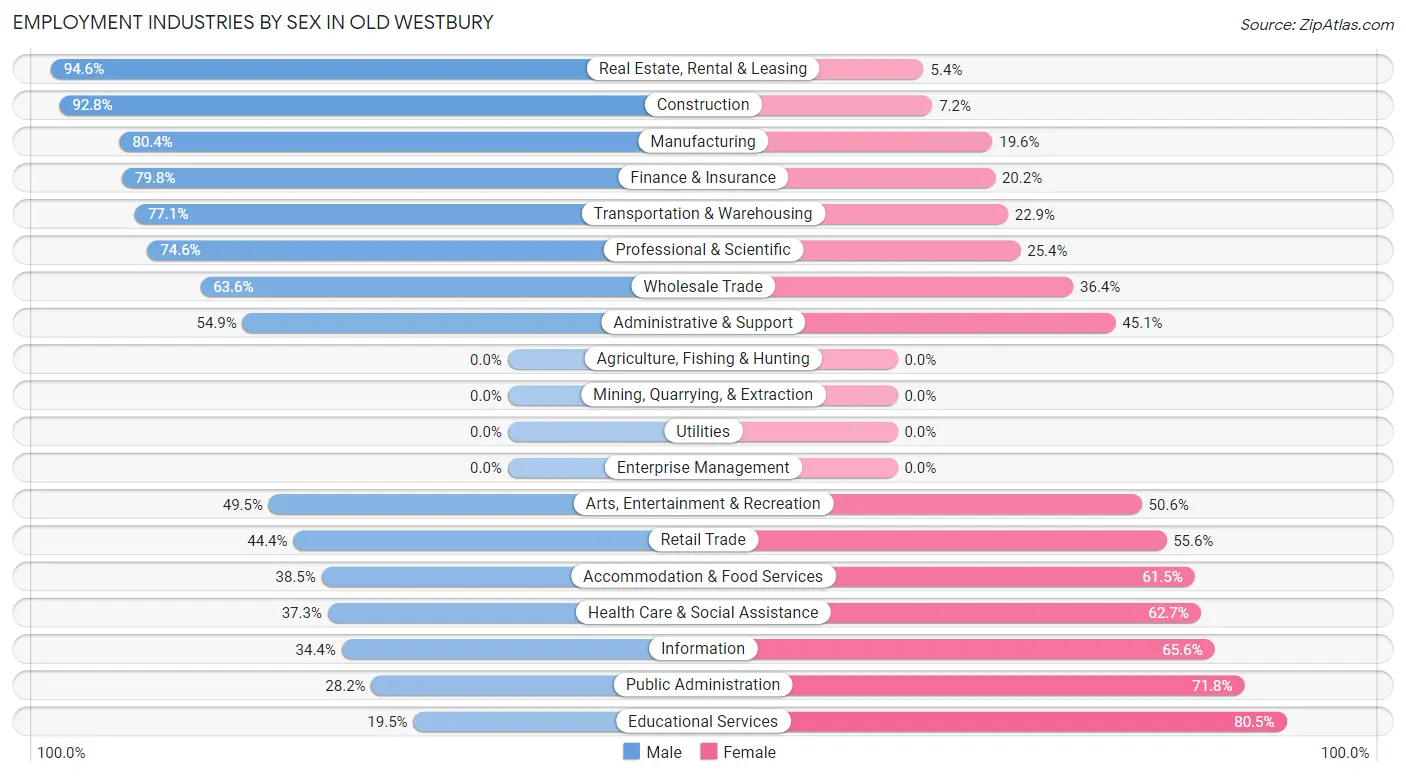
Employment Industries by Sex in Old Westbury
The Old Westbury industries that see more men than women are Real Estate, Rental & Leasing (94.6%), Construction (92.8%), and Manufacturing (80.4%), whereas the industries that tend to have a higher number of women are Educational Services (80.5%), Public Administration (71.8%), and Information (65.6%).
| Industry | Male | Female |
| Agriculture, Fishing & Hunting | 0 (0.0%) | 0 (0.0%) |
| Mining, Quarrying, & Extraction | 0 (0.0%) | 0 (0.0%) |
| Construction | 116 (92.8%) | 9 (7.2%) |
| Manufacturing | 45 (80.4%) | 11 (19.6%) |
| Wholesale Trade | 42 (63.6%) | 24 (36.4%) |
| Retail Trade | 67 (44.4%) | 84 (55.6%) |
| Transportation & Warehousing | 27 (77.1%) | 8 (22.9%) |
| Utilities | 0 (0.0%) | 0 (0.0%) |
| Information | 22 (34.4%) | 42 (65.6%) |
| Finance & Insurance | 83 (79.8%) | 21 (20.2%) |
| Real Estate, Rental & Leasing | 87 (94.6%) | 5 (5.4%) |
| Professional & Scientific | 129 (74.6%) | 44 (25.4%) |
| Enterprise Management | 0 (0.0%) | 0 (0.0%) |
| Administrative & Support | 45 (54.9%) | 37 (45.1%) |
| Educational Services | 57 (19.5%) | 235 (80.5%) |
| Health Care & Social Assistance | 177 (37.3%) | 298 (62.7%) |
| Arts, Entertainment & Recreation | 45 (49.4%) | 46 (50.5%) |
| Accommodation & Food Services | 52 (38.5%) | 83 (61.5%) |
| Public Administration | 11 (28.2%) | 28 (71.8%) |
| Total | 1,031 (50.9%) | 996 (49.1%) |
Education in Old Westbury
School Enrollment in Old Westbury
The most common levels of schooling among the 2,077 students in Old Westbury are college / undergraduate (1,436 | 69.1%), elementary school (189 | 9.1%), and high school (151 | 7.3%).
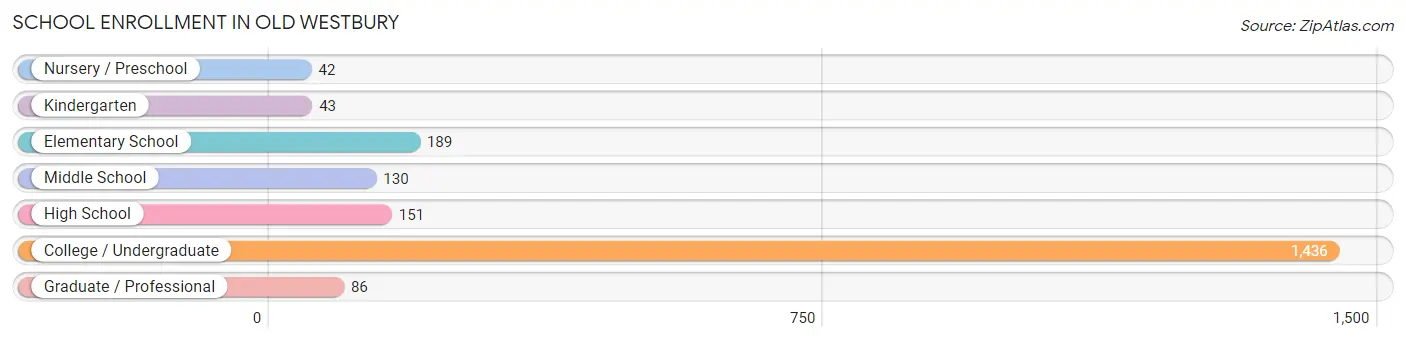
| School Level | # Students | % Students |
| Nursery / Preschool | 42 | 2.0% |
| Kindergarten | 43 | 2.1% |
| Elementary School | 189 | 9.1% |
| Middle School | 130 | 6.3% |
| High School | 151 | 7.3% |
| College / Undergraduate | 1,436 | 69.1% |
| Graduate / Professional | 86 | 4.1% |
| Total | 2,077 | 100.0% |
School Enrollment by Age by Funding Source in Old Westbury
Out of a total of 2,077 students who are enrolled in schools in Old Westbury, 1,132 (54.5%) attend a private institution, while the remaining 945 (45.5%) are enrolled in public schools. The age group of 25 to 34 year olds has the highest likelihood of being enrolled in private schools, with 28 (84.9% in the age bracket) enrolled. Conversely, the age group of 5 to 9 year old has the lowest likelihood of being enrolled in a private school, with 171 (83.4% in the age bracket) attending a public institution.
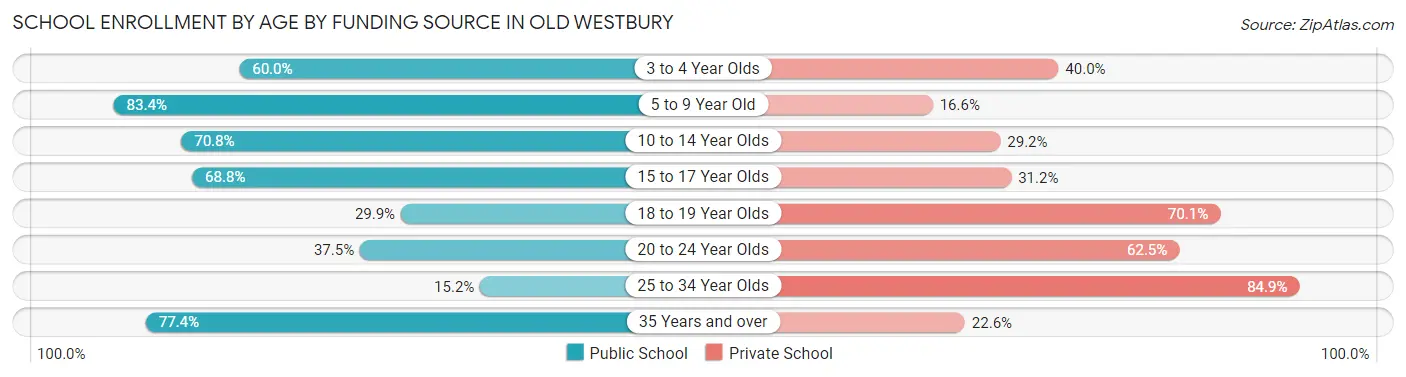
| Age Bracket | Public School | Private School |
| 3 to 4 Year Olds | 21 (60.0%) | 14 (40.0%) |
| 5 to 9 Year Old | 171 (83.4%) | 34 (16.6%) |
| 10 to 14 Year Olds | 131 (70.8%) | 54 (29.2%) |
| 15 to 17 Year Olds | 108 (68.8%) | 49 (31.2%) |
| 18 to 19 Year Olds | 200 (29.9%) | 469 (70.1%) |
| 20 to 24 Year Olds | 286 (37.5%) | 476 (62.5%) |
| 25 to 34 Year Olds | 5 (15.1%) | 28 (84.9%) |
| 35 Years and over | 24 (77.4%) | 7 (22.6%) |
| Total | 945 (45.5%) | 1,132 (54.5%) |
Educational Attainment by Field of Study in Old Westbury
Business (357 | 19.2%), bio, nature & agricultural (280 | 15.0%), social sciences (215 | 11.6%), engineering (169 | 9.1%), and education (136 | 7.3%) are the most common fields of study among 1,860 individuals in Old Westbury who have obtained a bachelor's degree or higher.
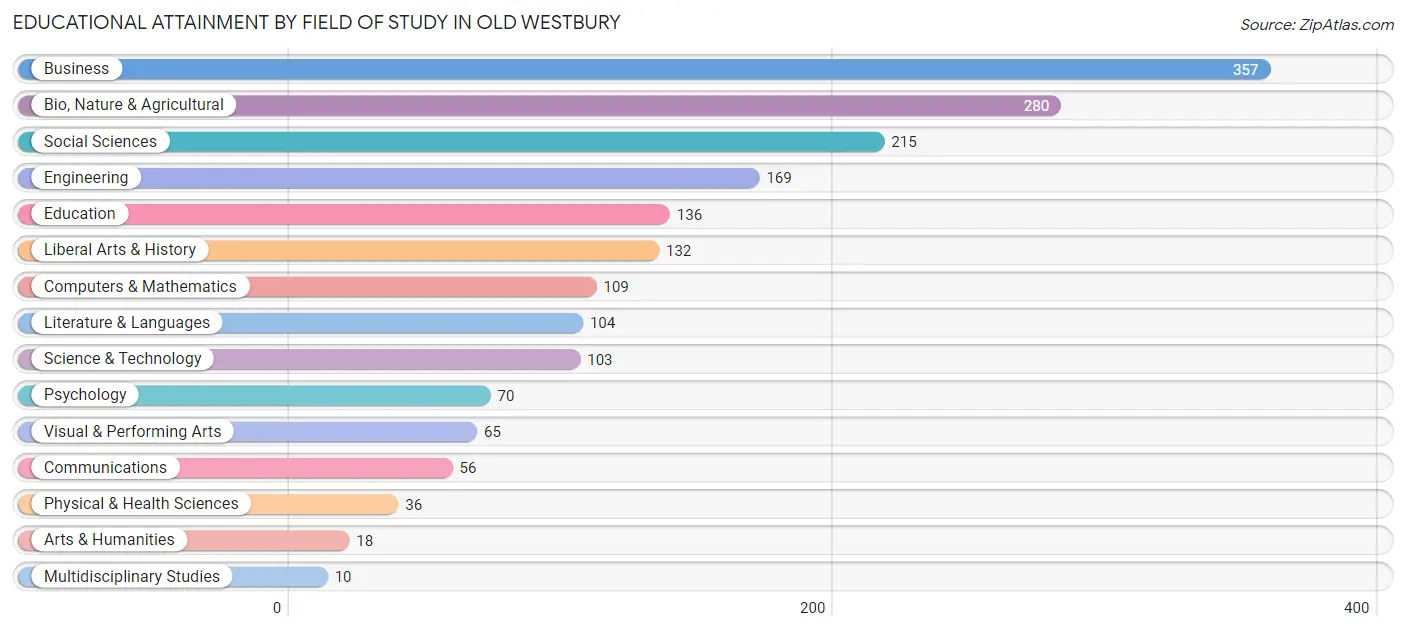
| Field of Study | # Graduates | % Graduates |
| Computers & Mathematics | 109 | 5.9% |
| Bio, Nature & Agricultural | 280 | 15.0% |
| Physical & Health Sciences | 36 | 1.9% |
| Psychology | 70 | 3.8% |
| Social Sciences | 215 | 11.6% |
| Engineering | 169 | 9.1% |
| Multidisciplinary Studies | 10 | 0.5% |
| Science & Technology | 103 | 5.5% |
| Business | 357 | 19.2% |
| Education | 136 | 7.3% |
| Literature & Languages | 104 | 5.6% |
| Liberal Arts & History | 132 | 7.1% |
| Visual & Performing Arts | 65 | 3.5% |
| Communications | 56 | 3.0% |
| Arts & Humanities | 18 | 1.0% |
| Total | 1,860 | 100.0% |
Transportation & Commute in Old Westbury
Vehicle Availability by Sex in Old Westbury
The most prevalent vehicle ownership categories in Old Westbury are males with 2 vehicles (380, accounting for 42.4%) and females with 2 vehicles (260, making up 56.6%).
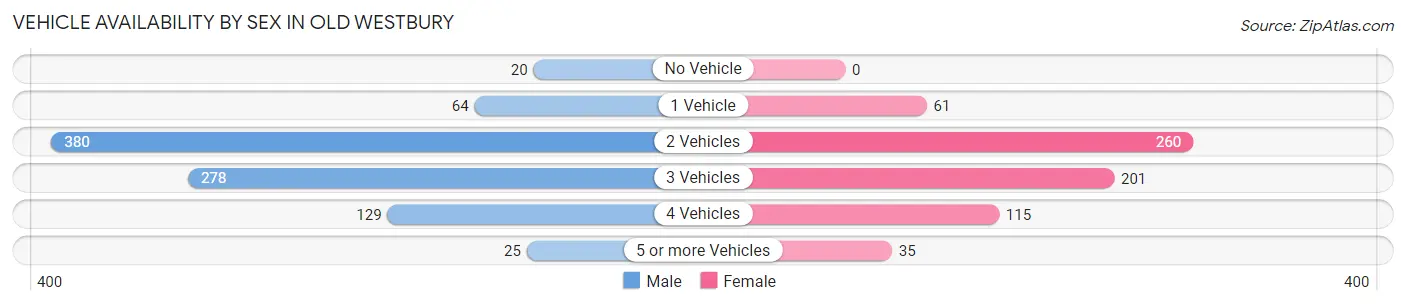
| Vehicles Available | Male | Female |
| No Vehicle | 20 (2.2%) | 0 (0.0%) |
| 1 Vehicle | 64 (7.1%) | 61 (9.1%) |
| 2 Vehicles | 380 (42.4%) | 260 (38.7%) |
| 3 Vehicles | 278 (31.0%) | 201 (29.9%) |
| 4 Vehicles | 129 (14.4%) | 115 (17.1%) |
| 5 or more Vehicles | 25 (2.8%) | 35 (5.2%) |
| Total | 896 (100.0%) | 672 (100.0%) |
Commute Time in Old Westbury
The most frequently occuring commute durations in Old Westbury are 15 to 19 minutes (364 commuters, 23.3%), 60 to 89 minutes (300 commuters, 19.2%), and 90 or more minutes (178 commuters, 11.4%).
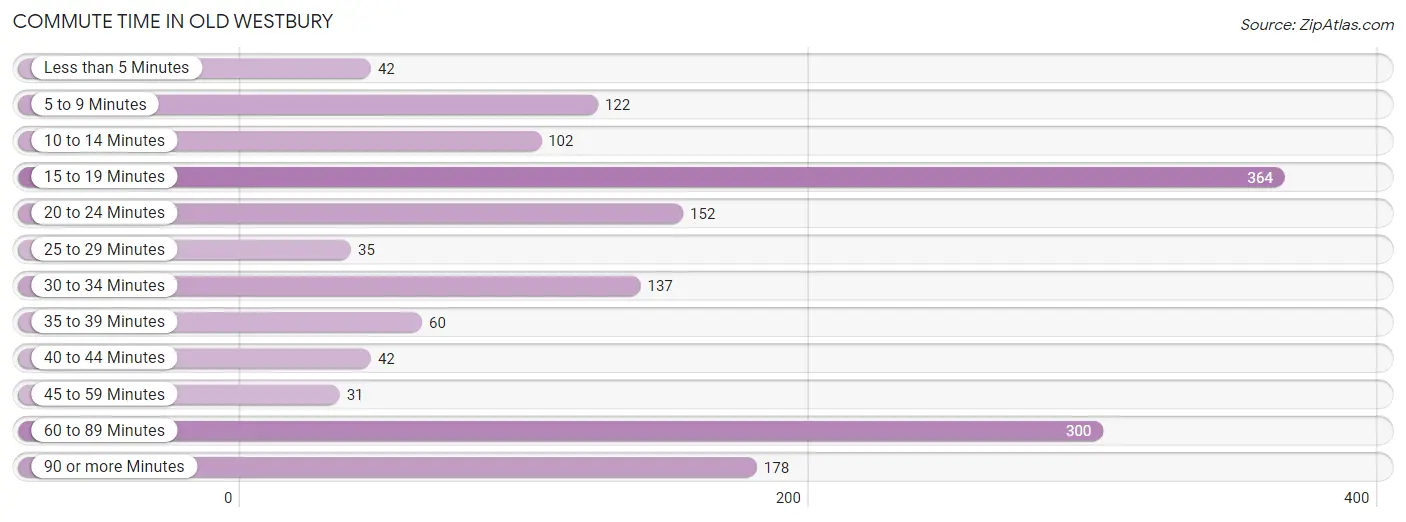
| Commute Time | # Commuters | % Commuters |
| Less than 5 Minutes | 42 | 2.7% |
| 5 to 9 Minutes | 122 | 7.8% |
| 10 to 14 Minutes | 102 | 6.5% |
| 15 to 19 Minutes | 364 | 23.3% |
| 20 to 24 Minutes | 152 | 9.7% |
| 25 to 29 Minutes | 35 | 2.2% |
| 30 to 34 Minutes | 137 | 8.7% |
| 35 to 39 Minutes | 60 | 3.8% |
| 40 to 44 Minutes | 42 | 2.7% |
| 45 to 59 Minutes | 31 | 2.0% |
| 60 to 89 Minutes | 300 | 19.2% |
| 90 or more Minutes | 178 | 11.4% |
Commute Time by Sex in Old Westbury
The most common commute times in Old Westbury are 60 to 89 minutes (209 commuters, 25.4%) for males and 15 to 19 minutes (238 commuters, 32.1%) for females.
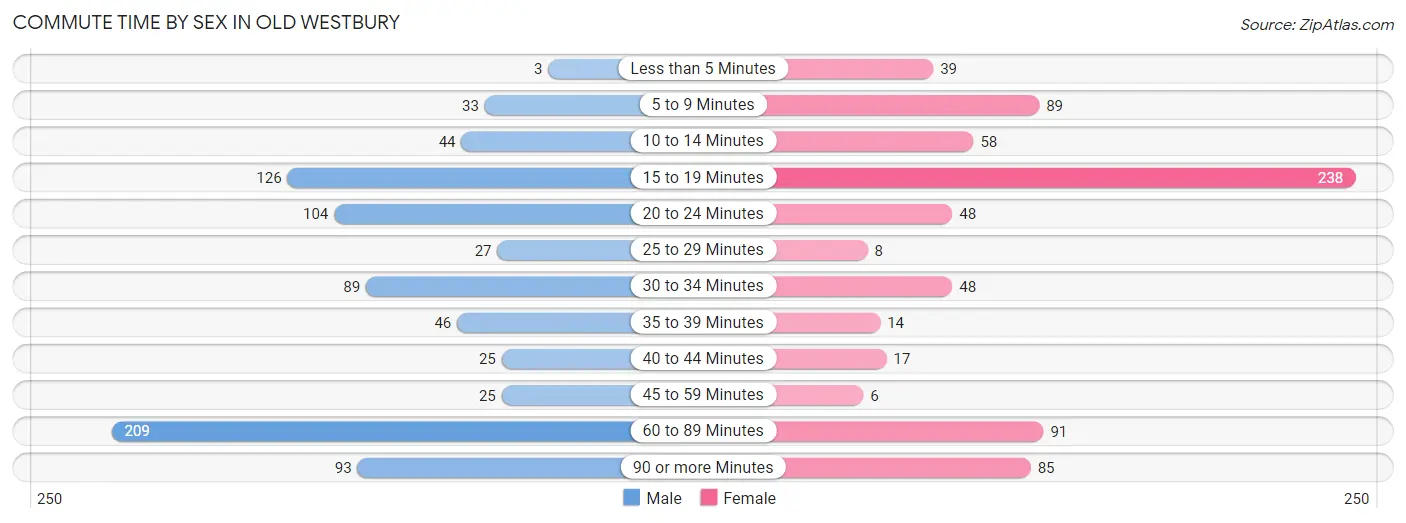
| Commute Time | Male | Female |
| Less than 5 Minutes | 3 (0.4%) | 39 (5.3%) |
| 5 to 9 Minutes | 33 (4.0%) | 89 (12.0%) |
| 10 to 14 Minutes | 44 (5.3%) | 58 (7.8%) |
| 15 to 19 Minutes | 126 (15.3%) | 238 (32.1%) |
| 20 to 24 Minutes | 104 (12.6%) | 48 (6.5%) |
| 25 to 29 Minutes | 27 (3.3%) | 8 (1.1%) |
| 30 to 34 Minutes | 89 (10.8%) | 48 (6.5%) |
| 35 to 39 Minutes | 46 (5.6%) | 14 (1.9%) |
| 40 to 44 Minutes | 25 (3.0%) | 17 (2.3%) |
| 45 to 59 Minutes | 25 (3.0%) | 6 (0.8%) |
| 60 to 89 Minutes | 209 (25.4%) | 91 (12.3%) |
| 90 or more Minutes | 93 (11.3%) | 85 (11.5%) |
Time of Departure to Work by Sex in Old Westbury
The most frequent times of departure to work in Old Westbury are 7:30 AM to 7:59 AM (167, 20.3%) for males and 9:00 AM to 9:59 AM (170, 22.9%) for females.
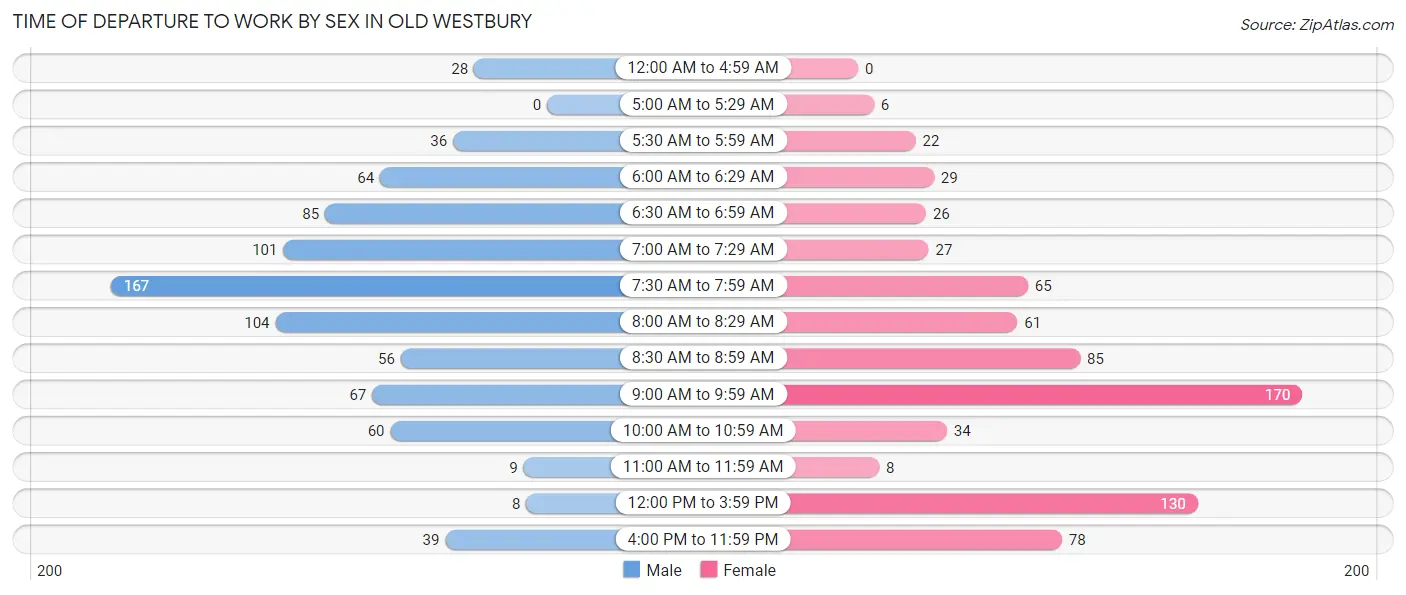
| Time of Departure | Male | Female |
| 12:00 AM to 4:59 AM | 28 (3.4%) | 0 (0.0%) |
| 5:00 AM to 5:29 AM | 0 (0.0%) | 6 (0.8%) |
| 5:30 AM to 5:59 AM | 36 (4.4%) | 22 (3.0%) |
| 6:00 AM to 6:29 AM | 64 (7.8%) | 29 (3.9%) |
| 6:30 AM to 6:59 AM | 85 (10.3%) | 26 (3.5%) |
| 7:00 AM to 7:29 AM | 101 (12.3%) | 27 (3.6%) |
| 7:30 AM to 7:59 AM | 167 (20.3%) | 65 (8.8%) |
| 8:00 AM to 8:29 AM | 104 (12.6%) | 61 (8.2%) |
| 8:30 AM to 8:59 AM | 56 (6.8%) | 85 (11.5%) |
| 9:00 AM to 9:59 AM | 67 (8.1%) | 170 (22.9%) |
| 10:00 AM to 10:59 AM | 60 (7.3%) | 34 (4.6%) |
| 11:00 AM to 11:59 AM | 9 (1.1%) | 8 (1.1%) |
| 12:00 PM to 3:59 PM | 8 (1.0%) | 130 (17.5%) |
| 4:00 PM to 11:59 PM | 39 (4.7%) | 78 (10.5%) |
| Total | 824 (100.0%) | 741 (100.0%) |
Housing Occupancy in Old Westbury
Occupancy by Ownership in Old Westbury
Of the total 1,052 dwellings in Old Westbury, owner-occupied units account for 979 (93.1%), while renter-occupied units make up 73 (6.9%).
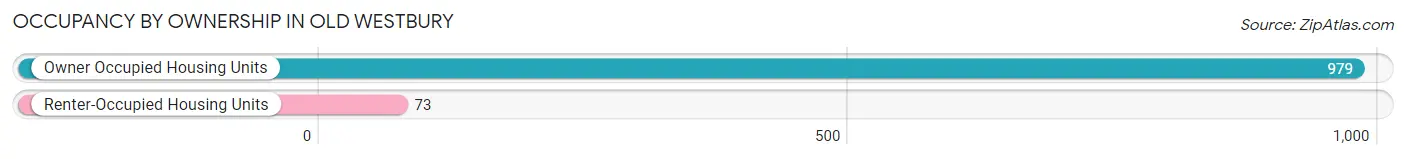
| Occupancy | # Housing Units | % Housing Units |
| Owner Occupied Housing Units | 979 | 93.1% |
| Renter-Occupied Housing Units | 73 | 6.9% |
| Total Occupied Housing Units | 1,052 | 100.0% |
Occupancy by Household Size in Old Westbury
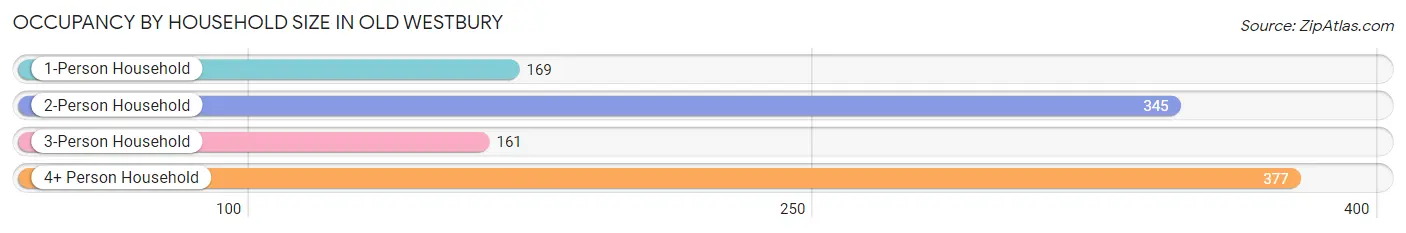
| Household Size | # Housing Units | % Housing Units |
| 1-Person Household | 169 | 16.1% |
| 2-Person Household | 345 | 32.8% |
| 3-Person Household | 161 | 15.3% |
| 4+ Person Household | 377 | 35.8% |
| Total Housing Units | 1,052 | 100.0% |
Occupancy by Ownership by Household Size in Old Westbury
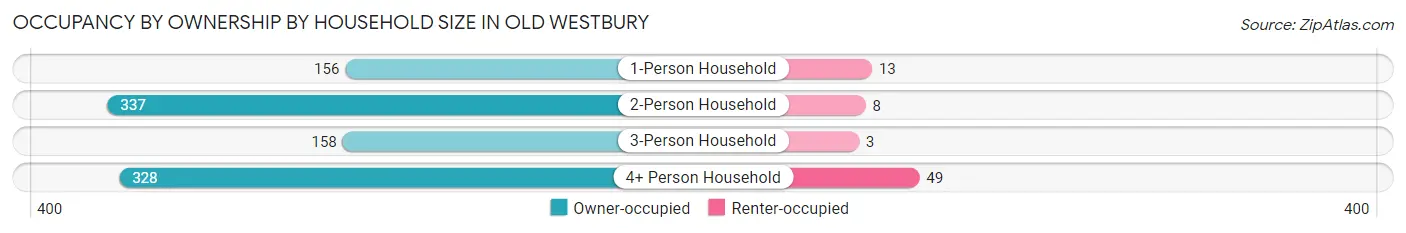
| Household Size | Owner-occupied | Renter-occupied |
| 1-Person Household | 156 (92.3%) | 13 (7.7%) |
| 2-Person Household | 337 (97.7%) | 8 (2.3%) |
| 3-Person Household | 158 (98.1%) | 3 (1.9%) |
| 4+ Person Household | 328 (87.0%) | 49 (13.0%) |
| Total Housing Units | 979 (93.1%) | 73 (6.9%) |
Occupancy by Educational Attainment in Old Westbury
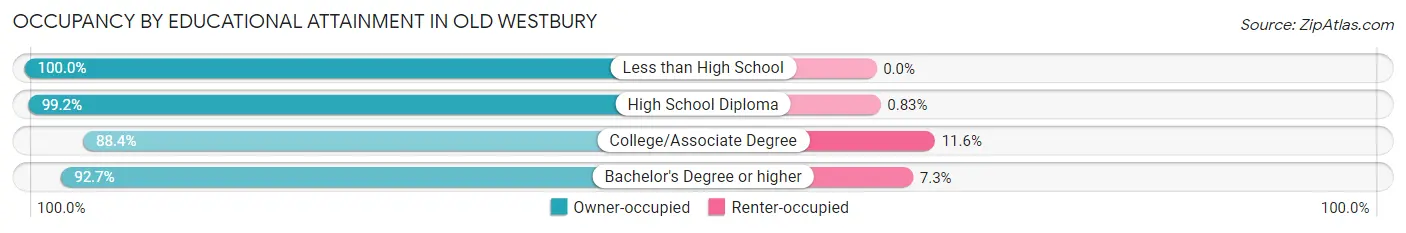
| Household Size | Owner-occupied | Renter-occupied |
| Less than High School | 9 (100.0%) | 0 (0.0%) |
| High School Diploma | 120 (99.2%) | 1 (0.8%) |
| College/Associate Degree | 99 (88.4%) | 13 (11.6%) |
| Bachelor's Degree or higher | 751 (92.7%) | 59 (7.3%) |
Occupancy by Age of Householder in Old Westbury
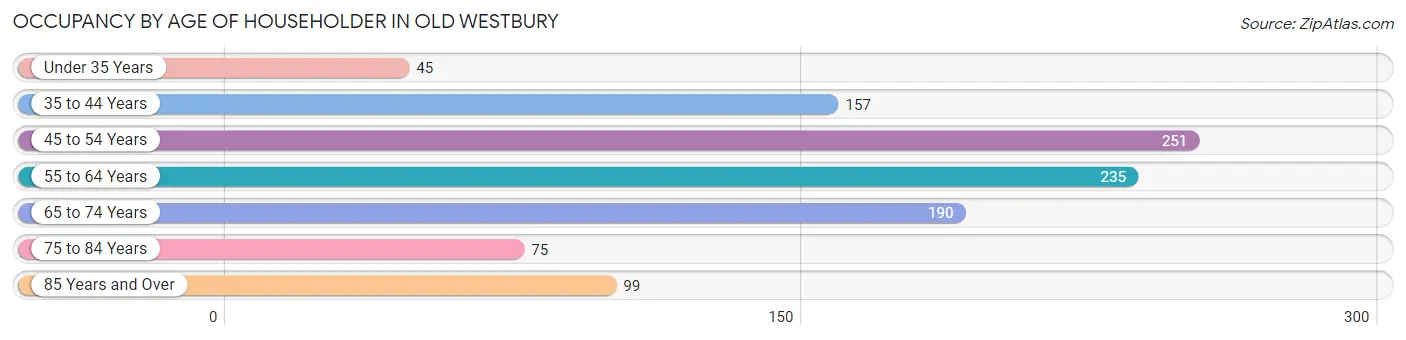
| Age Bracket | # Households | % Households |
| Under 35 Years | 45 | 4.3% |
| 35 to 44 Years | 157 | 14.9% |
| 45 to 54 Years | 251 | 23.9% |
| 55 to 64 Years | 235 | 22.3% |
| 65 to 74 Years | 190 | 18.1% |
| 75 to 84 Years | 75 | 7.1% |
| 85 Years and Over | 99 | 9.4% |
| Total | 1,052 | 100.0% |
Housing Finances in Old Westbury
Median Income by Occupancy in Old Westbury
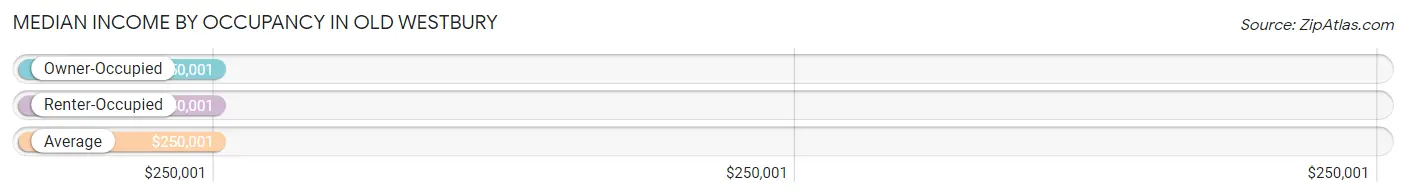
| Occupancy Type | # Households | Median Income |
| Owner-Occupied | 979 (93.1%) | $250,001 |
| Renter-Occupied | 73 (6.9%) | $250,001 |
| Average | 1,052 (100.0%) | $250,001 |
Occupancy by Householder Income Bracket in Old Westbury
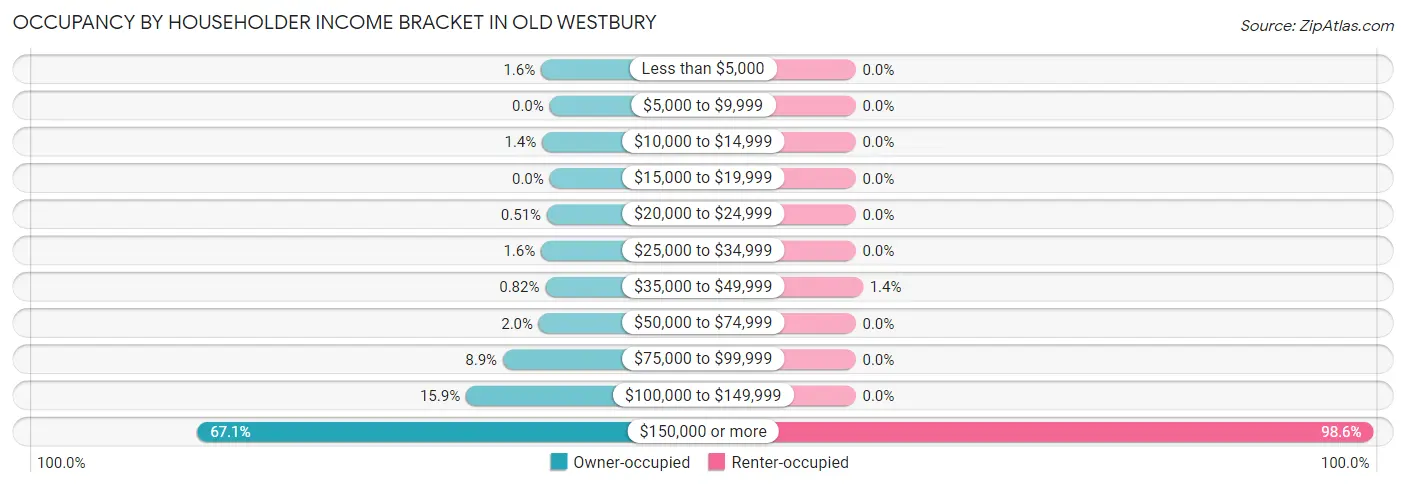
| Income Bracket | Owner-occupied | Renter-occupied |
| Less than $5,000 | 16 (1.6%) | 0 (0.0%) |
| $5,000 to $9,999 | 0 (0.0%) | 0 (0.0%) |
| $10,000 to $14,999 | 14 (1.4%) | 0 (0.0%) |
| $15,000 to $19,999 | 0 (0.0%) | 0 (0.0%) |
| $20,000 to $24,999 | 5 (0.5%) | 0 (0.0%) |
| $25,000 to $34,999 | 16 (1.6%) | 0 (0.0%) |
| $35,000 to $49,999 | 8 (0.8%) | 1 (1.4%) |
| $50,000 to $74,999 | 20 (2.0%) | 0 (0.0%) |
| $75,000 to $99,999 | 87 (8.9%) | 0 (0.0%) |
| $100,000 to $149,999 | 156 (15.9%) | 0 (0.0%) |
| $150,000 or more | 657 (67.1%) | 72 (98.6%) |
| Total | 979 (100.0%) | 73 (100.0%) |
Monthly Housing Cost Tiers in Old Westbury
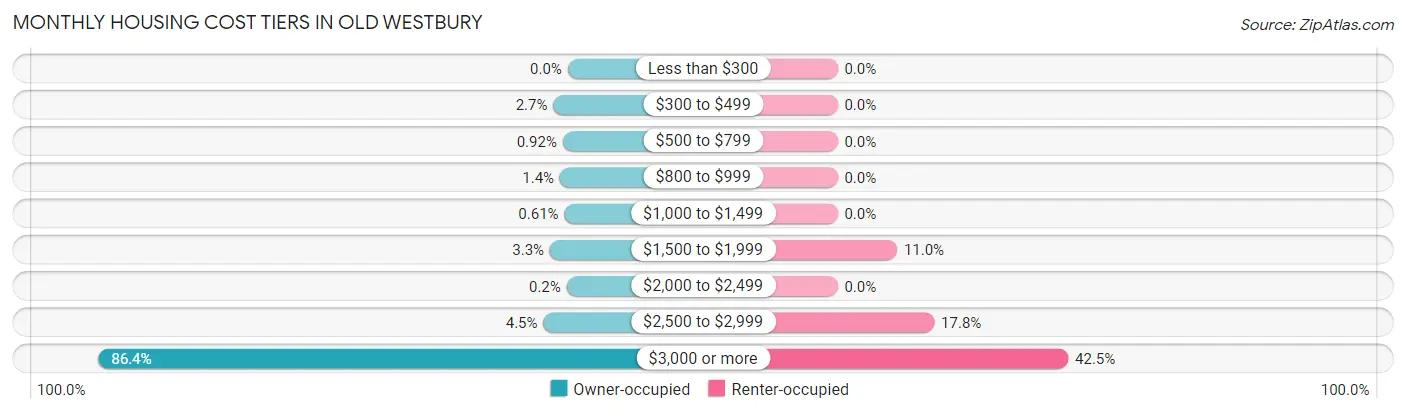
| Monthly Cost | Owner-occupied | Renter-occupied |
| Less than $300 | 0 (0.0%) | 0 (0.0%) |
| $300 to $499 | 26 (2.7%) | 0 (0.0%) |
| $500 to $799 | 9 (0.9%) | 0 (0.0%) |
| $800 to $999 | 14 (1.4%) | 0 (0.0%) |
| $1,000 to $1,499 | 6 (0.6%) | 0 (0.0%) |
| $1,500 to $1,999 | 32 (3.3%) | 8 (11.0%) |
| $2,000 to $2,499 | 2 (0.2%) | 0 (0.0%) |
| $2,500 to $2,999 | 44 (4.5%) | 13 (17.8%) |
| $3,000 or more | 846 (86.4%) | 31 (42.5%) |
| Total | 979 (100.0%) | 73 (100.0%) |
Physical Housing Characteristics in Old Westbury
Housing Structures in Old Westbury
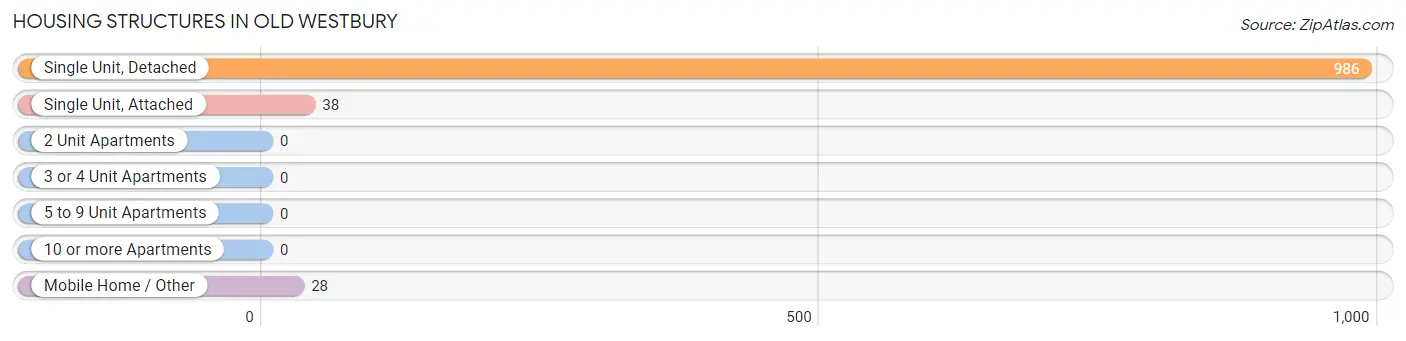
| Structure Type | # Housing Units | % Housing Units |
| Single Unit, Detached | 986 | 93.7% |
| Single Unit, Attached | 38 | 3.6% |
| 2 Unit Apartments | 0 | 0.0% |
| 3 or 4 Unit Apartments | 0 | 0.0% |
| 5 to 9 Unit Apartments | 0 | 0.0% |
| 10 or more Apartments | 0 | 0.0% |
| Mobile Home / Other | 28 | 2.7% |
| Total | 1,052 | 100.0% |
Housing Structures by Occupancy in Old Westbury
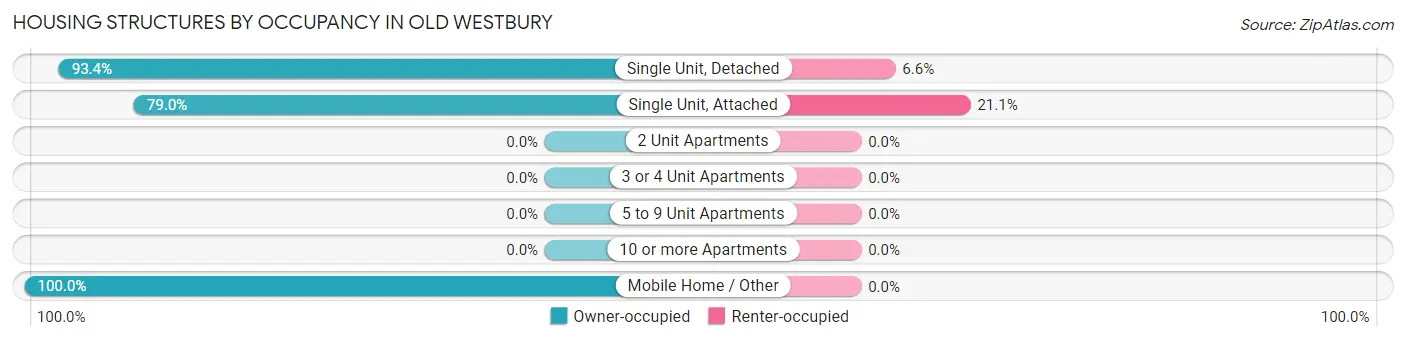
| Structure Type | Owner-occupied | Renter-occupied |
| Single Unit, Detached | 921 (93.4%) | 65 (6.6%) |
| Single Unit, Attached | 30 (78.9%) | 8 (21.0%) |
| 2 Unit Apartments | 0 (0.0%) | 0 (0.0%) |
| 3 or 4 Unit Apartments | 0 (0.0%) | 0 (0.0%) |
| 5 to 9 Unit Apartments | 0 (0.0%) | 0 (0.0%) |
| 10 or more Apartments | 0 (0.0%) | 0 (0.0%) |
| Mobile Home / Other | 28 (100.0%) | 0 (0.0%) |
| Total | 979 (93.1%) | 73 (6.9%) |
Housing Structures by Number of Rooms in Old Westbury
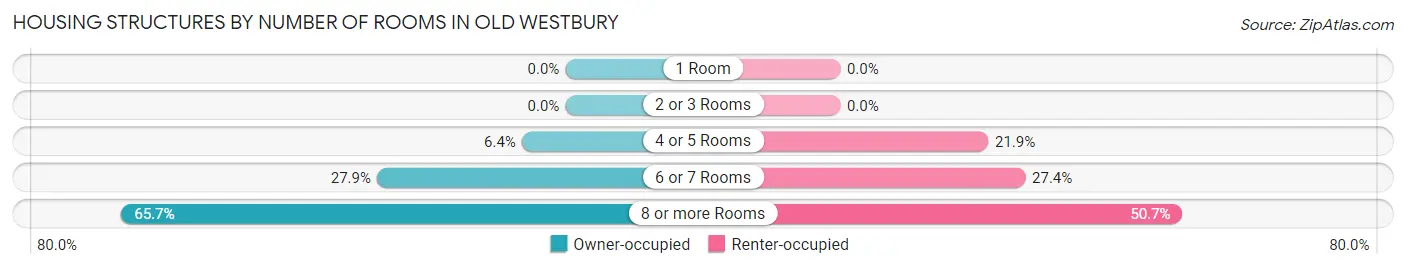
| Number of Rooms | Owner-occupied | Renter-occupied |
| 1 Room | 0 (0.0%) | 0 (0.0%) |
| 2 or 3 Rooms | 0 (0.0%) | 0 (0.0%) |
| 4 or 5 Rooms | 63 (6.4%) | 16 (21.9%) |
| 6 or 7 Rooms | 273 (27.9%) | 20 (27.4%) |
| 8 or more Rooms | 643 (65.7%) | 37 (50.7%) |
| Total | 979 (100.0%) | 73 (100.0%) |
Housing Structure by Heating Type in Old Westbury
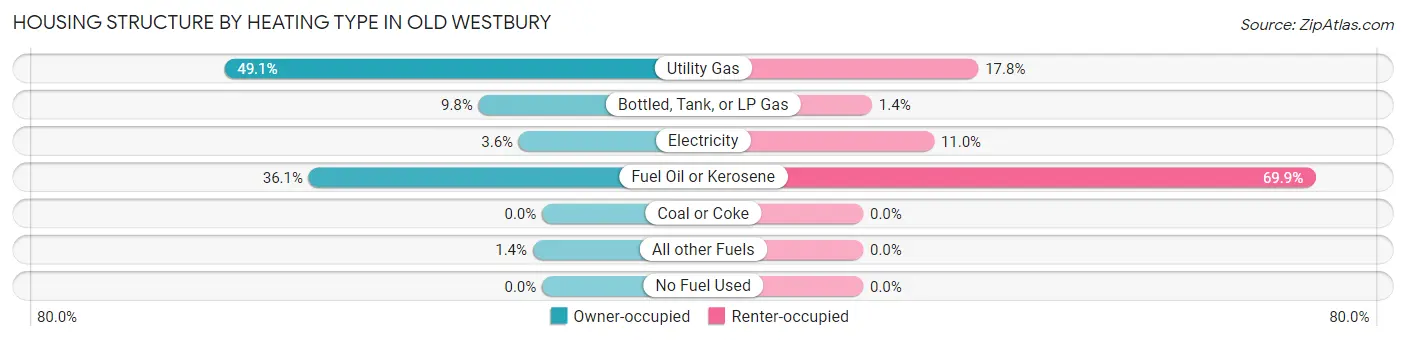
| Heating Type | Owner-occupied | Renter-occupied |
| Utility Gas | 481 (49.1%) | 13 (17.8%) |
| Bottled, Tank, or LP Gas | 96 (9.8%) | 1 (1.4%) |
| Electricity | 35 (3.6%) | 8 (11.0%) |
| Fuel Oil or Kerosene | 353 (36.1%) | 51 (69.9%) |
| Coal or Coke | 0 (0.0%) | 0 (0.0%) |
| All other Fuels | 14 (1.4%) | 0 (0.0%) |
| No Fuel Used | 0 (0.0%) | 0 (0.0%) |
| Total | 979 (100.0%) | 73 (100.0%) |
Household Vehicle Usage in Old Westbury
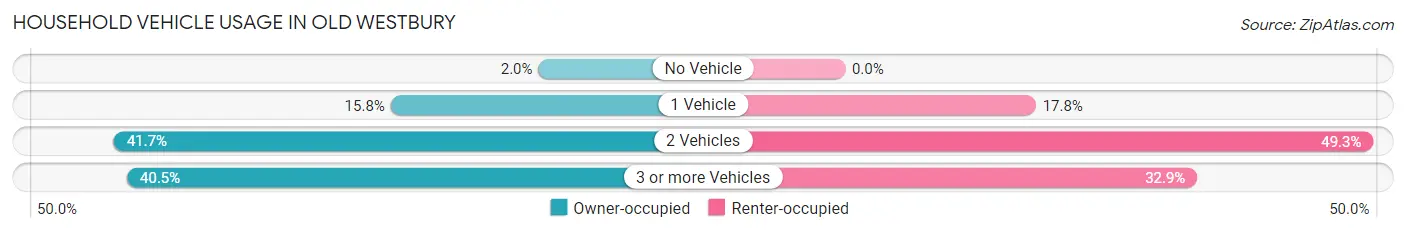
| Vehicles per Household | Owner-occupied | Renter-occupied |
| No Vehicle | 20 (2.0%) | 0 (0.0%) |
| 1 Vehicle | 155 (15.8%) | 13 (17.8%) |
| 2 Vehicles | 408 (41.7%) | 36 (49.3%) |
| 3 or more Vehicles | 396 (40.5%) | 24 (32.9%) |
| Total | 979 (100.0%) | 73 (100.0%) |
Real Estate & Mortgages in Old Westbury
Real Estate and Mortgage Overview in Old Westbury
| Characteristic | Without Mortgage | With Mortgage |
| Housing Units | 413 | 566 |
| Median Property Value | $2,000,001 | $2,000,001 |
| Median Household Income | $250,001 | $377 |
| Monthly Housing Costs | $1,501 | $553 |
| Real Estate Taxes | $10,001 | $8 |
Property Value by Mortgage Status in Old Westbury
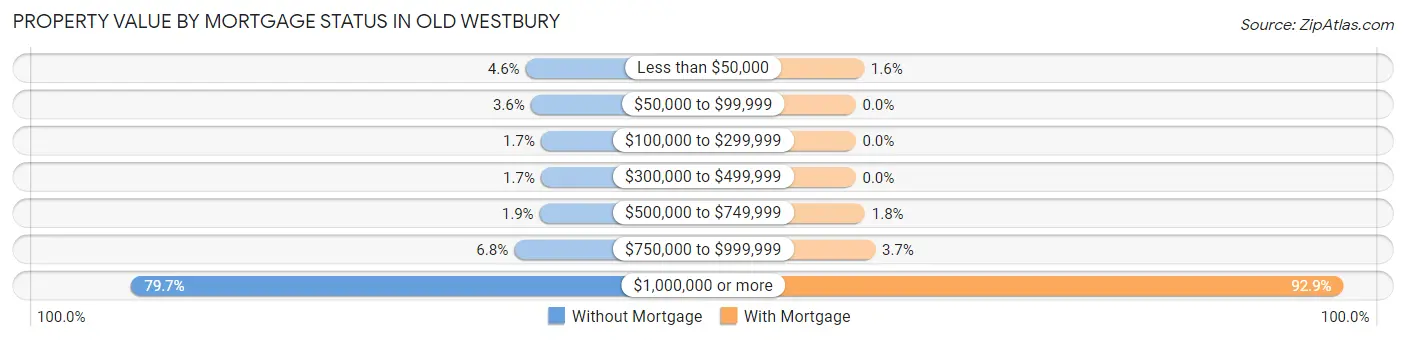
| Property Value | Without Mortgage | With Mortgage |
| Less than $50,000 | 19 (4.6%) | 9 (1.6%) |
| $50,000 to $99,999 | 15 (3.6%) | 0 (0.0%) |
| $100,000 to $299,999 | 7 (1.7%) | 0 (0.0%) |
| $300,000 to $499,999 | 7 (1.7%) | 0 (0.0%) |
| $500,000 to $749,999 | 8 (1.9%) | 10 (1.8%) |
| $750,000 to $999,999 | 28 (6.8%) | 21 (3.7%) |
| $1,000,000 or more | 329 (79.7%) | 526 (92.9%) |
| Total | 413 (100.0%) | 566 (100.0%) |
Household Income by Mortgage Status in Old Westbury
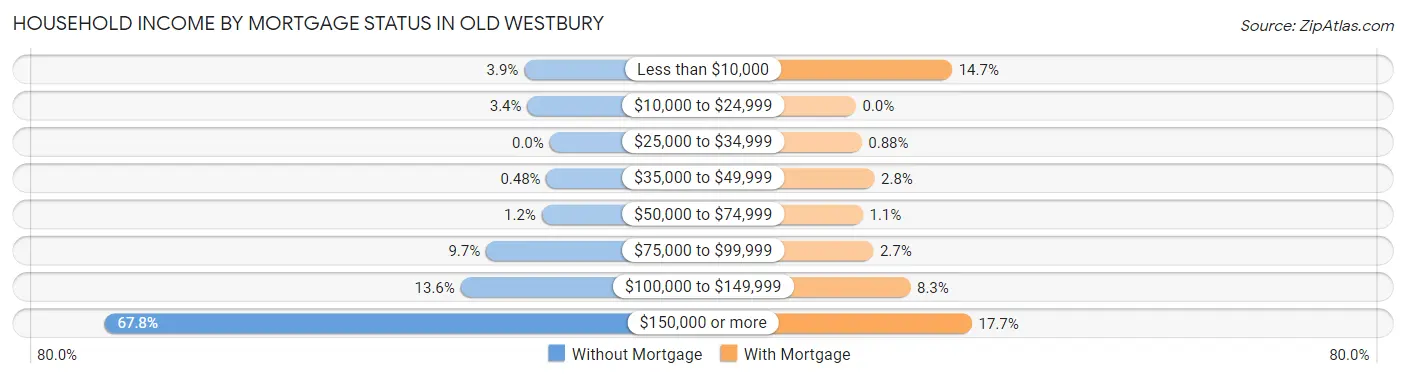
| Household Income | Without Mortgage | With Mortgage |
| Less than $10,000 | 16 (3.9%) | 83 (14.7%) |
| $10,000 to $24,999 | 14 (3.4%) | 0 (0.0%) |
| $25,000 to $34,999 | 0 (0.0%) | 5 (0.9%) |
| $35,000 to $49,999 | 2 (0.5%) | 16 (2.8%) |
| $50,000 to $74,999 | 5 (1.2%) | 6 (1.1%) |
| $75,000 to $99,999 | 40 (9.7%) | 15 (2.6%) |
| $100,000 to $149,999 | 56 (13.6%) | 47 (8.3%) |
| $150,000 or more | 280 (67.8%) | 100 (17.7%) |
| Total | 413 (100.0%) | 566 (100.0%) |
Property Value to Household Income Ratio in Old Westbury
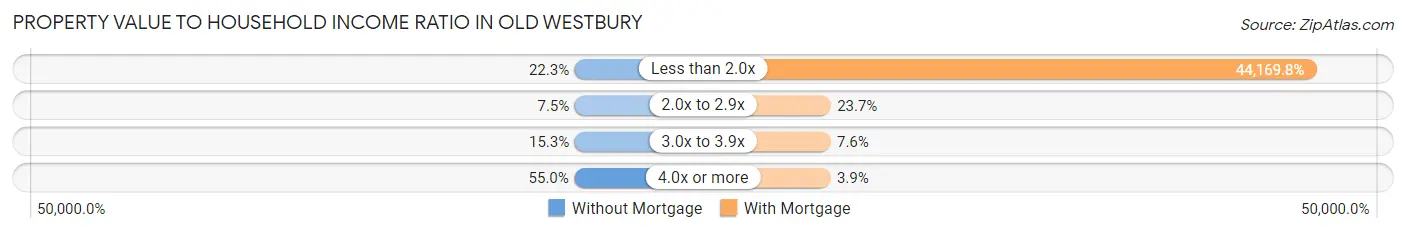
| Value-to-Income Ratio | Without Mortgage | With Mortgage |
| Less than 2.0x | 92 (22.3%) | 250,001 (44,169.8%) |
| 2.0x to 2.9x | 31 (7.5%) | 134 (23.7%) |
| 3.0x to 3.9x | 63 (15.2%) | 43 (7.6%) |
| 4.0x or more | 227 (55.0%) | 22 (3.9%) |
| Total | 413 (100.0%) | 566 (100.0%) |
Real Estate Taxes by Mortgage Status in Old Westbury
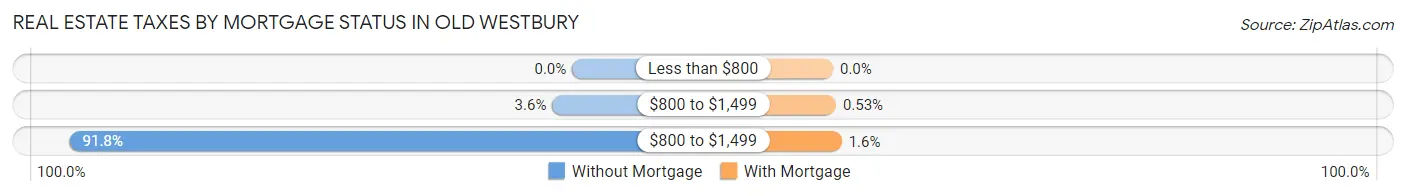
| Property Taxes | Without Mortgage | With Mortgage |
| Less than $800 | 0 (0.0%) | 0 (0.0%) |
| $800 to $1,499 | 15 (3.6%) | 3 (0.5%) |
| $800 to $1,499 | 379 (91.8%) | 9 (1.6%) |
| Total | 413 (100.0%) | 566 (100.0%) |
Health & Disability in Old Westbury
Health Insurance Coverage by Age in Old Westbury
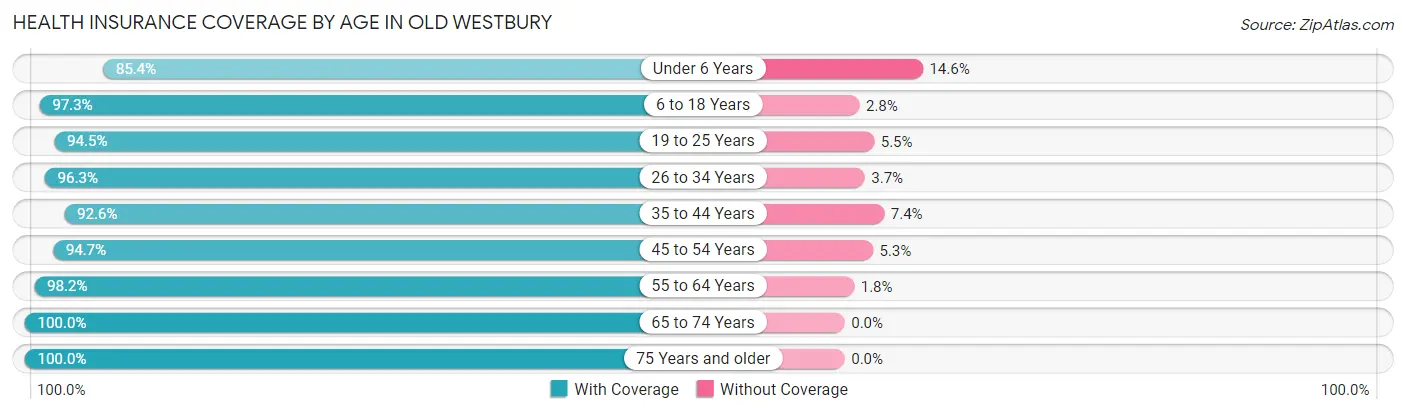
| Age Bracket | With Coverage | Without Coverage |
| Under 6 Years | 82 (85.4%) | 14 (14.6%) |
| 6 to 18 Years | 814 (97.3%) | 23 (2.8%) |
| 19 to 25 Years | 1,151 (94.5%) | 67 (5.5%) |
| 26 to 34 Years | 283 (96.3%) | 11 (3.7%) |
| 35 to 44 Years | 289 (92.6%) | 23 (7.4%) |
| 45 to 54 Years | 450 (94.7%) | 25 (5.3%) |
| 55 to 64 Years | 499 (98.2%) | 9 (1.8%) |
| 65 to 74 Years | 336 (100.0%) | 0 (0.0%) |
| 75 Years and older | 334 (100.0%) | 0 (0.0%) |
| Total | 4,238 (96.1%) | 172 (3.9%) |
Health Insurance Coverage by Citizenship Status in Old Westbury
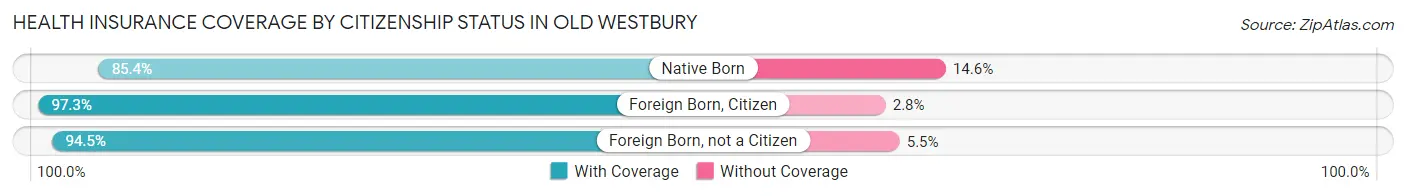
| Citizenship Status | With Coverage | Without Coverage |
| Native Born | 82 (85.4%) | 14 (14.6%) |
| Foreign Born, Citizen | 814 (97.3%) | 23 (2.8%) |
| Foreign Born, not a Citizen | 1,151 (94.5%) | 67 (5.5%) |
Health Insurance Coverage by Household Income in Old Westbury
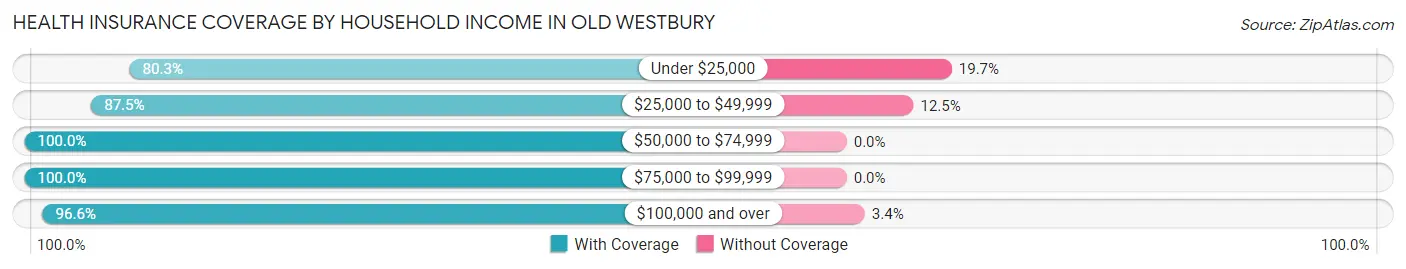
| Household Income | With Coverage | Without Coverage |
| Under $25,000 | 102 (80.3%) | 25 (19.7%) |
| $25,000 to $49,999 | 42 (87.5%) | 6 (12.5%) |
| $50,000 to $74,999 | 53 (100.0%) | 0 (0.0%) |
| $75,000 to $99,999 | 269 (100.0%) | 0 (0.0%) |
| $100,000 and over | 2,652 (96.6%) | 93 (3.4%) |
Public vs Private Health Insurance Coverage by Age in Old Westbury
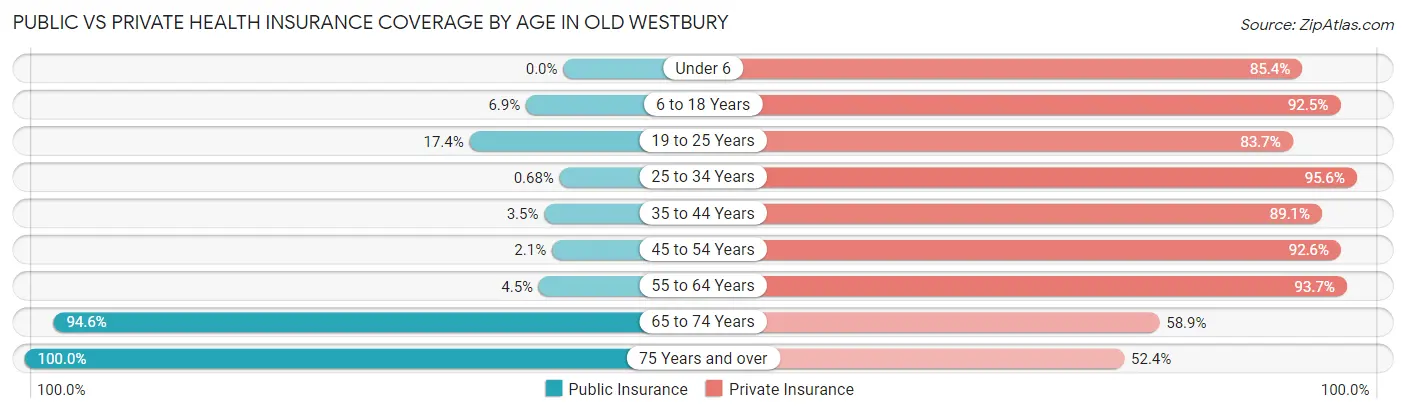
| Age Bracket | Public Insurance | Private Insurance |
| Under 6 | 0 (0.0%) | 82 (85.4%) |
| 6 to 18 Years | 58 (6.9%) | 774 (92.5%) |
| 19 to 25 Years | 212 (17.4%) | 1,019 (83.7%) |
| 25 to 34 Years | 2 (0.7%) | 281 (95.6%) |
| 35 to 44 Years | 11 (3.5%) | 278 (89.1%) |
| 45 to 54 Years | 10 (2.1%) | 440 (92.6%) |
| 55 to 64 Years | 23 (4.5%) | 476 (93.7%) |
| 65 to 74 Years | 318 (94.6%) | 198 (58.9%) |
| 75 Years and over | 334 (100.0%) | 175 (52.4%) |
| Total | 968 (22.0%) | 3,723 (84.4%) |
Disability Status by Sex by Age in Old Westbury
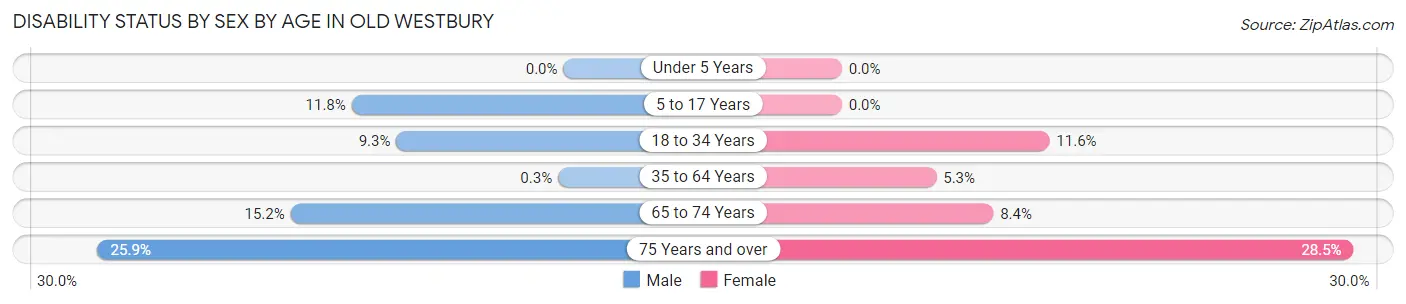
| Age Bracket | Male | Female |
| Under 5 Years | 0 (0.0%) | 0 (0.0%) |
| 5 to 17 Years | 33 (11.8%) | 0 (0.0%) |
| 18 to 34 Years | 77 (9.3%) | 117 (11.6%) |
| 35 to 64 Years | 2 (0.3%) | 33 (5.3%) |
| 65 to 74 Years | 24 (15.2%) | 15 (8.4%) |
| 75 Years and over | 42 (25.9%) | 49 (28.5%) |
Disability Class by Sex by Age in Old Westbury
Disability Class: Hearing Difficulty
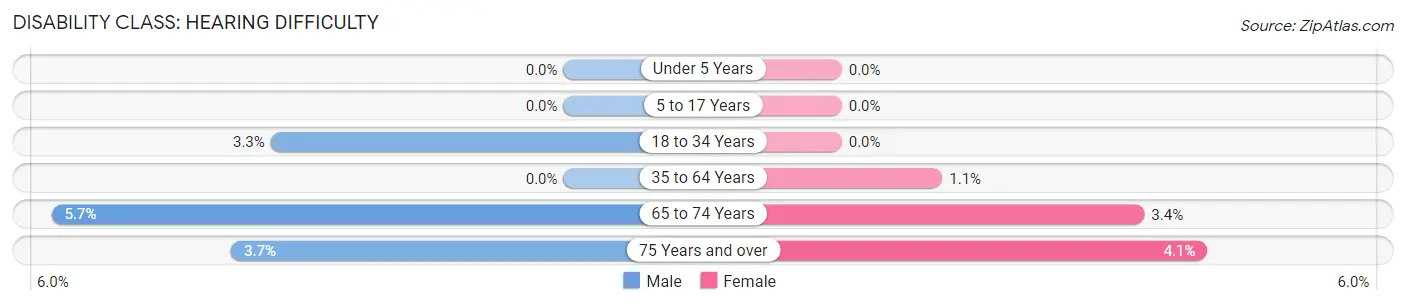
| Age Bracket | Male | Female |
| Under 5 Years | 0 (0.0%) | 0 (0.0%) |
| 5 to 17 Years | 0 (0.0%) | 0 (0.0%) |
| 18 to 34 Years | 27 (3.3%) | 0 (0.0%) |
| 35 to 64 Years | 0 (0.0%) | 7 (1.1%) |
| 65 to 74 Years | 9 (5.7%) | 6 (3.4%) |
| 75 Years and over | 6 (3.7%) | 7 (4.1%) |
Disability Class: Vision Difficulty
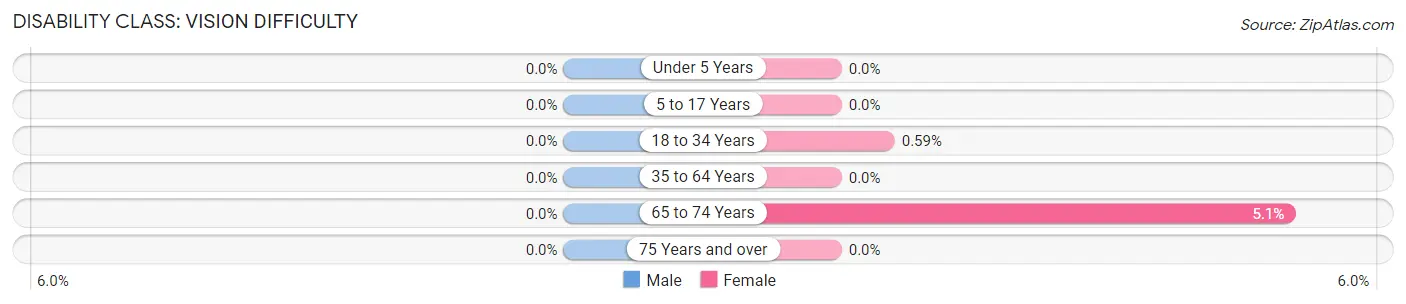
| Age Bracket | Male | Female |
| Under 5 Years | 0 (0.0%) | 0 (0.0%) |
| 5 to 17 Years | 0 (0.0%) | 0 (0.0%) |
| 18 to 34 Years | 0 (0.0%) | 6 (0.6%) |
| 35 to 64 Years | 0 (0.0%) | 0 (0.0%) |
| 65 to 74 Years | 0 (0.0%) | 9 (5.1%) |
| 75 Years and over | 0 (0.0%) | 0 (0.0%) |
Disability Class: Cognitive Difficulty
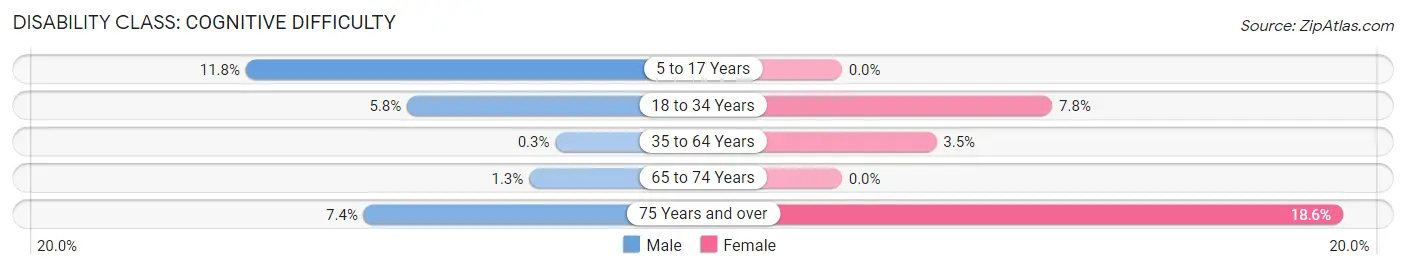
| Age Bracket | Male | Female |
| 5 to 17 Years | 33 (11.8%) | 0 (0.0%) |
| 18 to 34 Years | 48 (5.8%) | 79 (7.8%) |
| 35 to 64 Years | 2 (0.3%) | 22 (3.5%) |
| 65 to 74 Years | 2 (1.3%) | 0 (0.0%) |
| 75 Years and over | 12 (7.4%) | 32 (18.6%) |
Disability Class: Ambulatory Difficulty
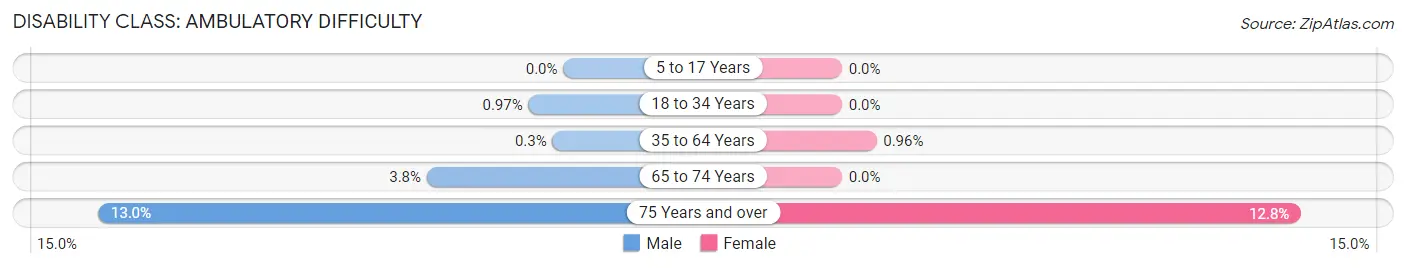
| Age Bracket | Male | Female |
| 5 to 17 Years | 0 (0.0%) | 0 (0.0%) |
| 18 to 34 Years | 8 (1.0%) | 0 (0.0%) |
| 35 to 64 Years | 2 (0.3%) | 6 (1.0%) |
| 65 to 74 Years | 6 (3.8%) | 0 (0.0%) |
| 75 Years and over | 21 (13.0%) | 22 (12.8%) |
Disability Class: Self-Care Difficulty
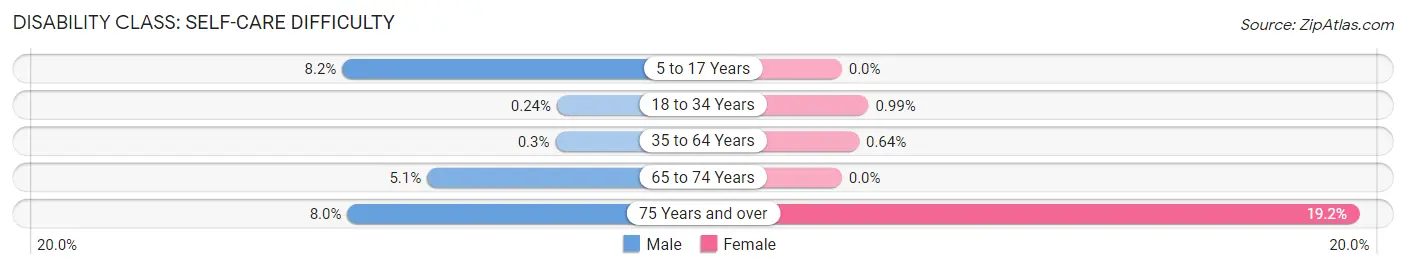
| Age Bracket | Male | Female |
| 5 to 17 Years | 23 (8.2%) | 0 (0.0%) |
| 18 to 34 Years | 2 (0.2%) | 10 (1.0%) |
| 35 to 64 Years | 2 (0.3%) | 4 (0.6%) |
| 65 to 74 Years | 8 (5.1%) | 0 (0.0%) |
| 75 Years and over | 13 (8.0%) | 33 (19.2%) |
Technology Access in Old Westbury
Computing Device Access in Old Westbury
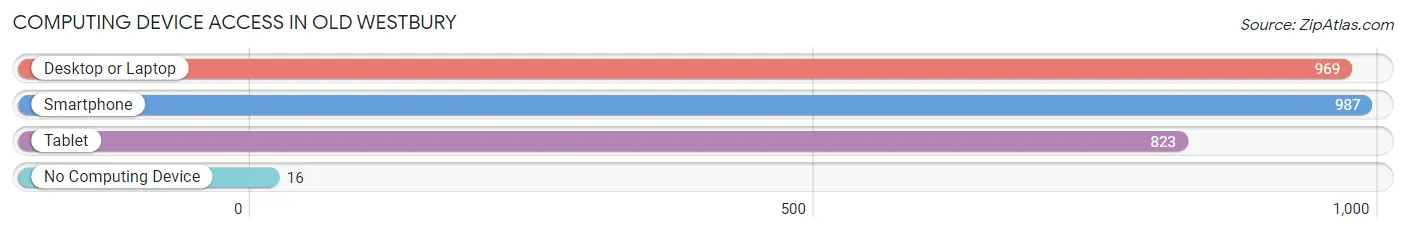
| Device Type | # Households | % Households |
| Desktop or Laptop | 969 | 92.1% |
| Smartphone | 987 | 93.8% |
| Tablet | 823 | 78.2% |
| No Computing Device | 16 | 1.5% |
| Total | 1,052 | 100.0% |
Internet Access in Old Westbury
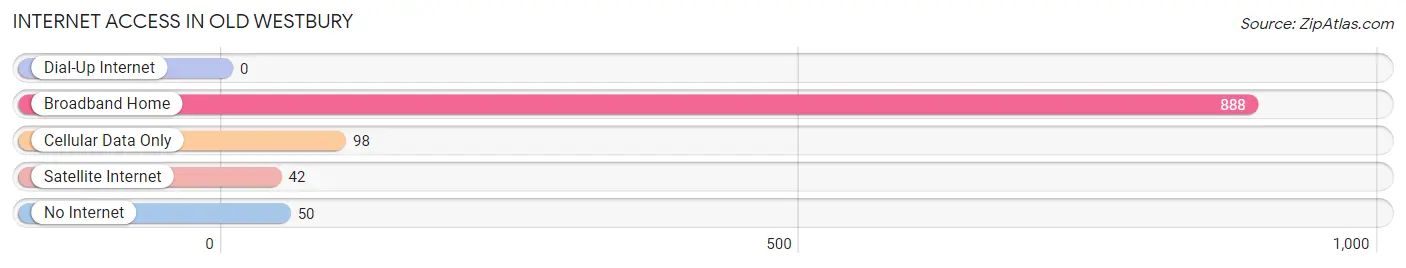
| Internet Type | # Households | % Households |
| Dial-Up Internet | 0 | 0.0% |
| Broadband Home | 888 | 84.4% |
| Cellular Data Only | 98 | 9.3% |
| Satellite Internet | 42 | 4.0% |
| No Internet | 50 | 4.8% |
| Total | 1,052 | 100.0% |
Old Westbury Summary
Westbury is a hamlet located in the Town of North Hempstead in Nassau County, New York. It is located on the North Shore of Long Island, approximately 20 miles east of Manhattan. Westbury is a diverse community with a population of 15,146 as of the 2010 census.
History
Westbury was originally inhabited by the Matinecock Native American tribe. The area was first settled by Europeans in 1658, when Thomas Powell purchased land from the Matinecock. The area was known as “Powell’s Purchase” until 1720, when it was renamed “Westbury” after Westbury, Wiltshire, England.
In the late 19th century, Westbury became a popular summer resort for wealthy New Yorkers. The area was home to several grand estates, including the estate of William K. Vanderbilt, which was later converted into a golf course.
In the early 20th century, Westbury began to develop into a residential community. The area was served by the Long Island Rail Road, which made it an attractive option for commuters. The population of Westbury grew rapidly in the 1950s and 1960s, and the hamlet was officially incorporated in 1932.
Geography
Westbury is located in the Town of North Hempstead in Nassau County, New York. It is located on the North Shore of Long Island, approximately 20 miles east of Manhattan. The hamlet is bordered by Old Westbury to the north, Jericho to the east, Carle Place to the south, and Garden City to the west.
Westbury is located on the Hempstead Plains, a flat, low-lying area of land that stretches from the North Shore of Long Island to the South Shore. The area is characterized by rolling hills, wooded areas, and wetlands.
Economy
Westbury is a primarily residential community, but it is also home to several businesses and industries. The hamlet is home to several corporate headquarters, including the headquarters of the Long Island Power Authority and the New York State Office of Mental Health.
Westbury is also home to several retail establishments, including the Westbury Plaza Shopping Center and the Westbury Mall. The hamlet is also home to several restaurants, bars, and entertainment venues.
Demographics
As of the 2010 census, Westbury had a population of 15,146. The racial makeup of the hamlet was 57.3% White, 22.2% African American, 0.3% Native American, 8.2% Asian, 0.1% Pacific Islander, 8.2% from other races, and 3.9% from two or more races. Hispanic or Latino of any race were 18.3% of the population.
The median household income in Westbury was $76,845, and the median family income was $87,845. The per capita income was $35,945. About 8.2% of families and 10.2% of the population were below the poverty line, including 14.2% of those under age 18 and 6.2% of those age 65 or over.
Common Questions
What is Per Capita Income in Old Westbury?
Per Capita income in Old Westbury is $108,134.
What is the Median Family Income in Old Westbury?
Median Family Income in Old Westbury is $250,001.
What is the Median Household income in Old Westbury?
Median Household Income in Old Westbury is $250,001.
What is Income or Wage Gap in Old Westbury?
Income or Wage Gap in Old Westbury is 77.0%.
Women in Old Westbury earn 23.0 cents for every dollar earned by a man.
What is Inequality or Gini Index in Old Westbury?
Inequality or Gini Index in Old Westbury is 0.50.
What is the Total Population of Old Westbury?
Total Population of Old Westbury is 4,410.
What is the Total Male Population of Old Westbury?
Total Male Population of Old Westbury is 2,119.
What is the Total Female Population of Old Westbury?
Total Female Population of Old Westbury is 2,291.
What is the Ratio of Males per 100 Females in Old Westbury?
There are 92.49 Males per 100 Females in Old Westbury.
What is the Ratio of Females per 100 Males in Old Westbury?
There are 108.12 Females per 100 Males in Old Westbury.
What is the Median Population Age in Old Westbury?
Median Population Age in Old Westbury is 27.4 Years.
What is the Average Family Size in Old Westbury
Average Family Size in Old Westbury is 3.6 People.
What is the Average Household Size in Old Westbury
Average Household Size in Old Westbury is 3.1 People.
How Large is the Labor Force in Old Westbury?
There are 2,188 People in the Labor Forcein in Old Westbury.
What is the Percentage of People in the Labor Force in Old Westbury?
56.0% of People are in the Labor Force in Old Westbury.
What is the Unemployment Rate in Old Westbury?
Unemployment Rate in Old Westbury is 7.3%.