Nocatee, FL Map & Demographics
Nocatee Map
Nocatee Overview
$62,690
PER CAPITA INCOME
$146,888
AVG FAMILY INCOME
$131,738
AVG HOUSEHOLD INCOME
57.9%
WAGE / INCOME GAP [ % ]
42.1¢/ $1
WAGE / INCOME GAP [ $ ]
0.47
INEQUALITY / GINI INDEX
22,950
TOTAL POPULATION
11,496
MALE POPULATION
11,454
FEMALE POPULATION
100.37
MALES / 100 FEMALES
99.63
FEMALES / 100 MALES
39.9
MEDIAN AGE
3.3
AVG FAMILY SIZE
3.0
AVG HOUSEHOLD SIZE
9,633
LABOR FORCE [ PEOPLE ]
57.7%
PERCENT IN LABOR FORCE
6.7%
UNEMPLOYMENT RATE
Nocatee Zip Codes
Income in Nocatee
Income Overview in Nocatee
Per Capita Income in Nocatee is $62,690, while median incomes of families and households are $146,888 and $131,738 respectively.
| Characteristic | Number | Measure |
| Per Capita Income | 22,950 | $62,690 |
| Median Family Income | 6,532 | $146,888 |
| Mean Family Income | 6,532 | $207,415 |
| Median Household Income | 7,641 | $131,738 |
| Mean Household Income | 7,641 | $188,420 |
| Income Deficit | 6,532 | $0 |
| Wage / Income Gap (%) | 22,950 | 57.87% |
| Wage / Income Gap ($) | 22,950 | 42.13¢ per $1 |
| Gini / Inequality Index | 22,950 | 0.47 |
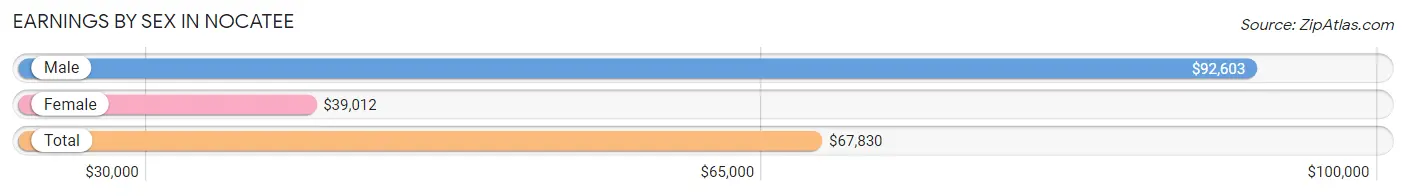
Earnings by Sex in Nocatee
Average Earnings in Nocatee are $67,830, $92,603 for men and $39,012 for women, a difference of 57.9%.
| Sex | Number | Average Earnings |
| Male | 5,354 (53.6%) | $92,603 |
| Female | 4,643 (46.4%) | $39,012 |
| Total | 9,997 (100.0%) | $67,830 |
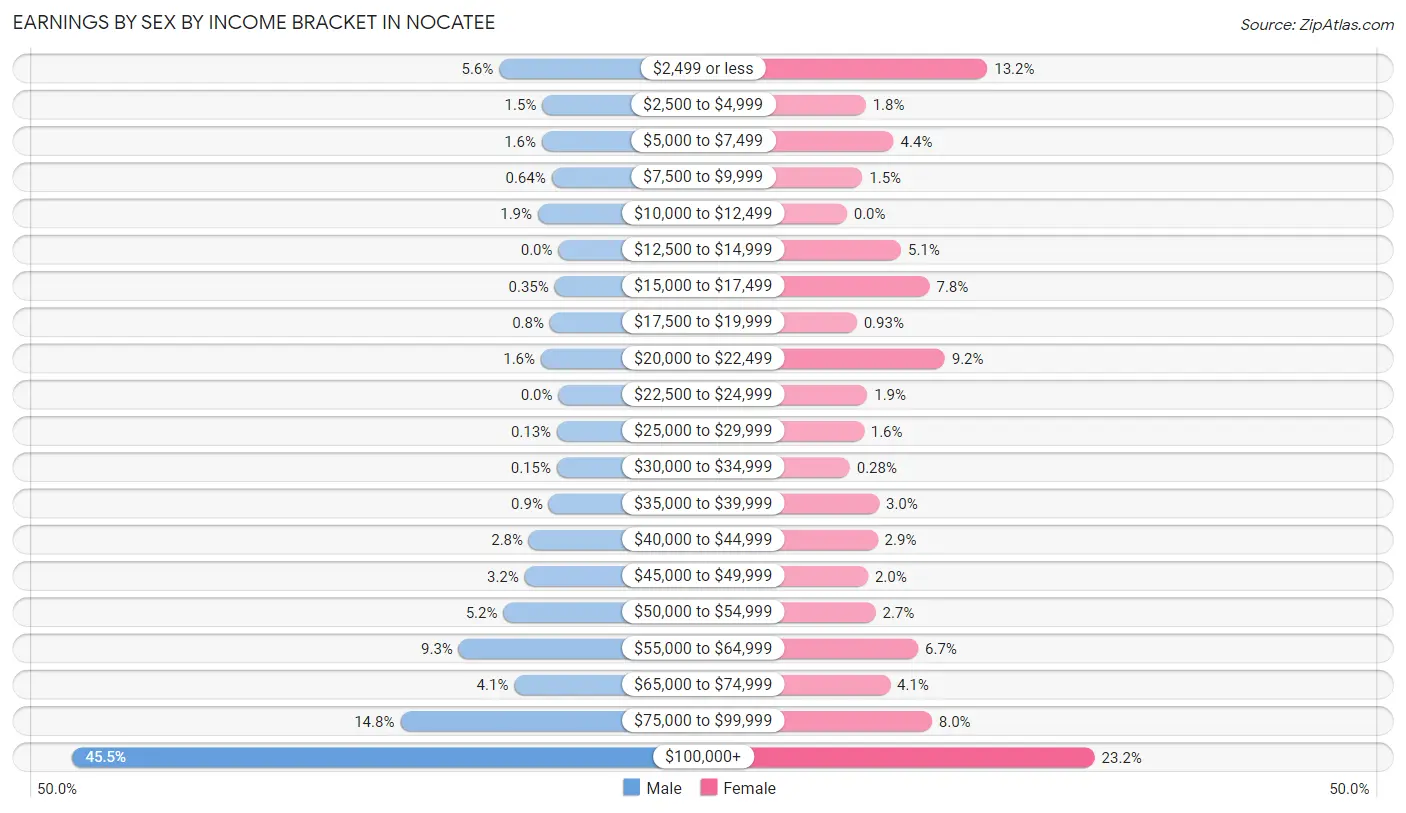
Earnings by Sex by Income Bracket in Nocatee
The most common earnings brackets in Nocatee are $100,000+ for men (2,436 | 45.5%) and $100,000+ for women (1,078 | 23.2%).
| Income | Male | Female |
| $2,499 or less | 297 (5.6%) | 611 (13.2%) |
| $2,500 to $4,999 | 81 (1.5%) | 82 (1.8%) |
| $5,000 to $7,499 | 83 (1.5%) | 204 (4.4%) |
| $7,500 to $9,999 | 34 (0.6%) | 68 (1.5%) |
| $10,000 to $12,499 | 103 (1.9%) | 0 (0.0%) |
| $12,500 to $14,999 | 0 (0.0%) | 236 (5.1%) |
| $15,000 to $17,499 | 19 (0.4%) | 360 (7.7%) |
| $17,500 to $19,999 | 43 (0.8%) | 43 (0.9%) |
| $20,000 to $22,499 | 88 (1.6%) | 426 (9.2%) |
| $22,500 to $24,999 | 0 (0.0%) | 89 (1.9%) |
| $25,000 to $29,999 | 7 (0.1%) | 74 (1.6%) |
| $30,000 to $34,999 | 8 (0.2%) | 13 (0.3%) |
| $35,000 to $39,999 | 48 (0.9%) | 140 (3.0%) |
| $40,000 to $44,999 | 148 (2.8%) | 134 (2.9%) |
| $45,000 to $49,999 | 169 (3.2%) | 92 (2.0%) |
| $50,000 to $54,999 | 276 (5.2%) | 125 (2.7%) |
| $55,000 to $64,999 | 500 (9.3%) | 310 (6.7%) |
| $65,000 to $74,999 | 221 (4.1%) | 188 (4.1%) |
| $75,000 to $99,999 | 793 (14.8%) | 370 (8.0%) |
| $100,000+ | 2,436 (45.5%) | 1,078 (23.2%) |
| Total | 5,354 (100.0%) | 4,643 (100.0%) |
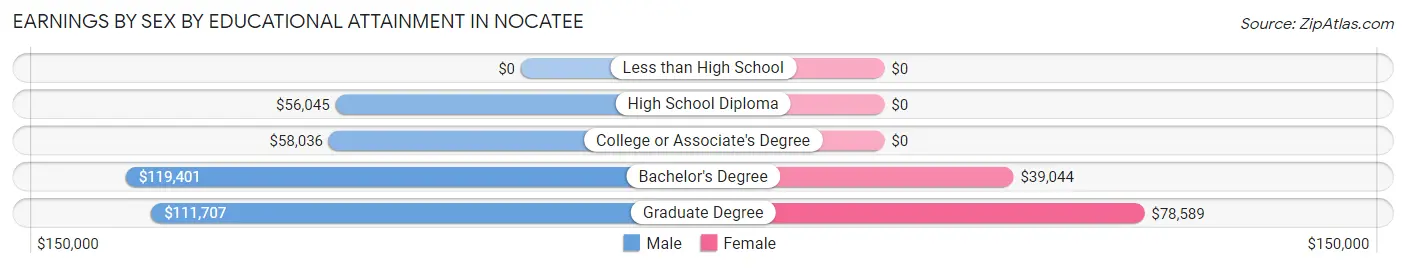
Earnings by Sex by Educational Attainment in Nocatee
Average earnings in Nocatee are $96,742 for men and $42,108 for women, a difference of 56.5%. Men with an educational attainment of bachelor's degree enjoy the highest average annual earnings of $119,401, while those with high school diploma education earn the least with $56,045. Women with an educational attainment of graduate degree earn the most with the average annual earnings of $78,589, while those with bachelor's degree education have the smallest earnings of $39,044.
| Educational Attainment | Male Income | Female Income |
| Less than High School | - | - |
| High School Diploma | $56,045 | $0 |
| College or Associate's Degree | $58,036 | $0 |
| Bachelor's Degree | $119,401 | $39,044 |
| Graduate Degree | $111,707 | $78,589 |
| Total | $96,742 | $42,108 |
Family Income in Nocatee
Family Income Brackets in Nocatee
According to the Nocatee family income data, there are 2,495 families falling into the $200,000+ income range, which is the most common income bracket and makes up 38.2% of all families. Conversely, the $10,000 to $14,999 income bracket is the least frequent group with only 39 families (0.6%) belonging to this category.
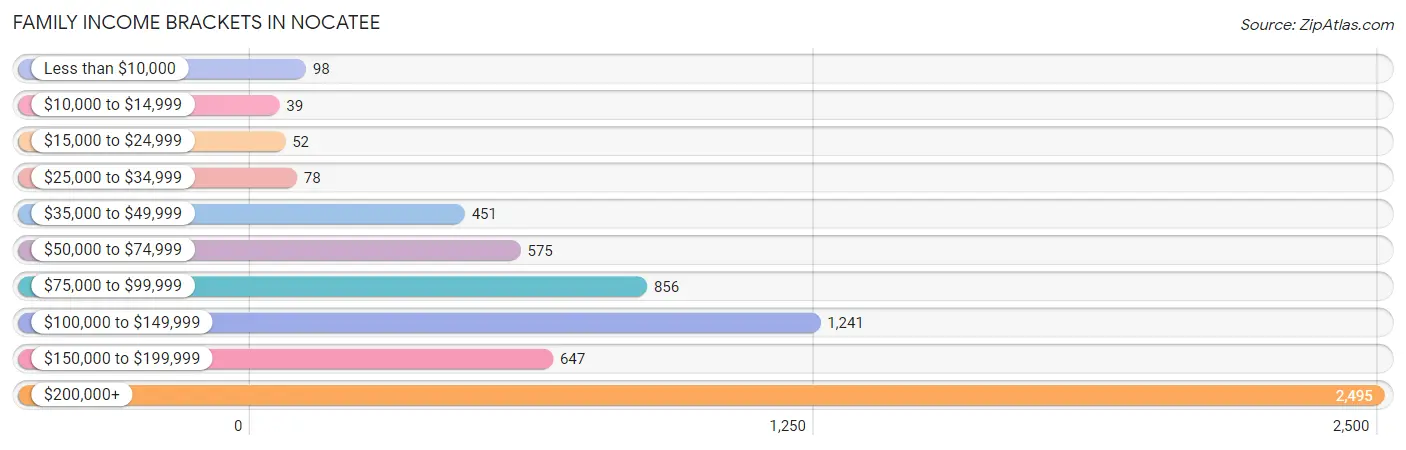
| Income Bracket | # Families | % Families |
| Less than $10,000 | 98 | 1.5% |
| $10,000 to $14,999 | 39 | 0.6% |
| $15,000 to $24,999 | 52 | 0.8% |
| $25,000 to $34,999 | 78 | 1.2% |
| $35,000 to $49,999 | 451 | 6.9% |
| $50,000 to $74,999 | 575 | 8.8% |
| $75,000 to $99,999 | 856 | 13.1% |
| $100,000 to $149,999 | 1,241 | 19.0% |
| $150,000 to $199,999 | 647 | 9.9% |
| $200,000+ | 2,495 | 38.2% |
Family Income by Famaliy Size in Nocatee
5-person families (766 | 11.7%) account for the highest median family income in Nocatee with $241,304 per family, while 3-person families (1,351 | 20.7%) have the highest median income of $64,250 per family member.
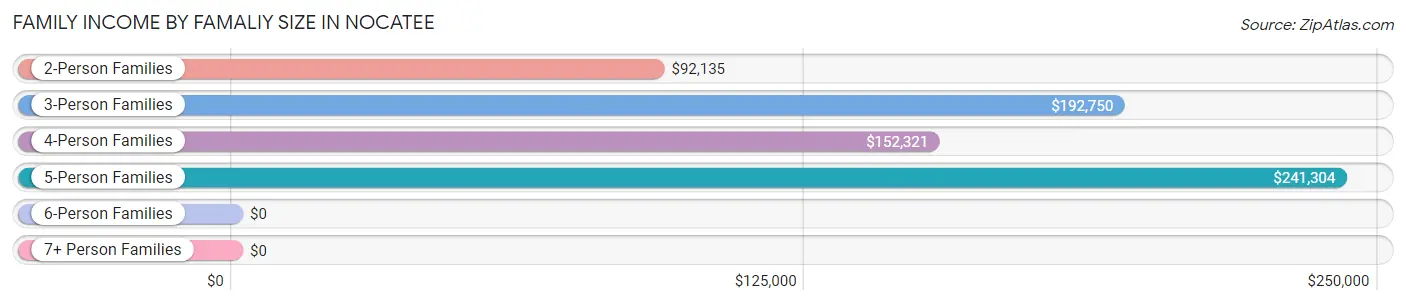
| Income Bracket | # Families | Median Income |
| 2-Person Families | 2,317 (35.5%) | $92,135 |
| 3-Person Families | 1,351 (20.7%) | $192,750 |
| 4-Person Families | 1,906 (29.2%) | $152,321 |
| 5-Person Families | 766 (11.7%) | $241,304 |
| 6-Person Families | 137 (2.1%) | $0 |
| 7+ Person Families | 55 (0.8%) | $0 |
| Total | 6,532 (100.0%) | $146,888 |
Family Income by Number of Earners in Nocatee
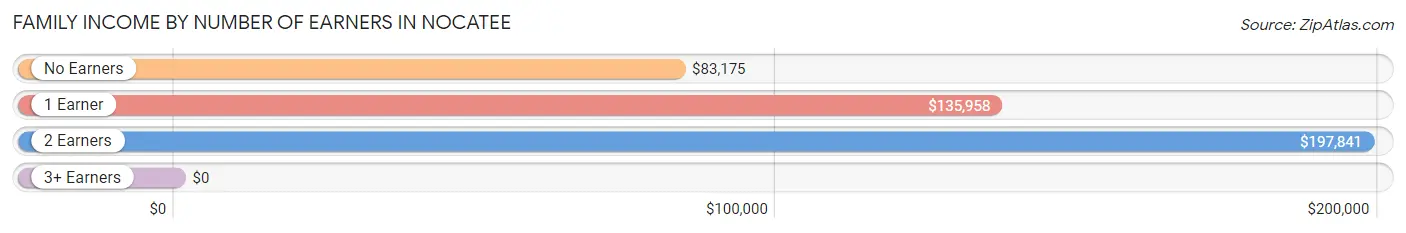
| Number of Earners | # Families | Median Income |
| No Earners | 1,295 (19.8%) | $83,175 |
| 1 Earner | 1,775 (27.2%) | $135,958 |
| 2 Earners | 3,109 (47.6%) | $197,841 |
| 3+ Earners | 353 (5.4%) | $0 |
| Total | 6,532 (100.0%) | $146,888 |
Household Income in Nocatee
Household Income Brackets in Nocatee
With 2,629 households falling in the category, the $200,000+ income range is the most frequent in Nocatee, accounting for 34.4% of all households. In contrast, only 38 households (0.5%) fall into the $10,000 to $14,999 income bracket, making it the least populous group.
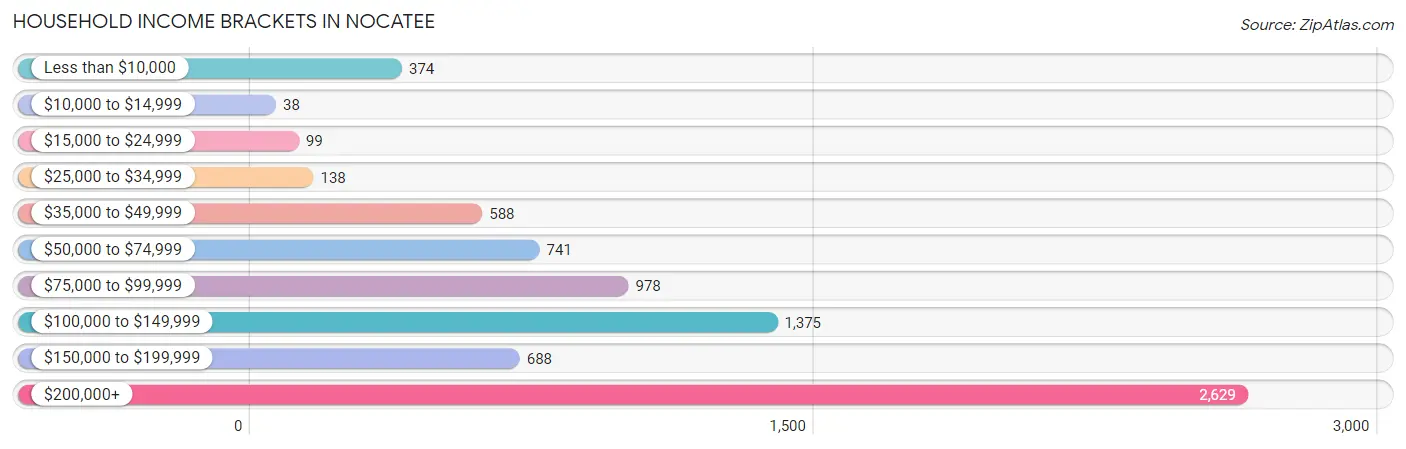
| Income Bracket | # Households | % Households |
| Less than $10,000 | 374 | 4.9% |
| $10,000 to $14,999 | 38 | 0.5% |
| $15,000 to $24,999 | 99 | 1.3% |
| $25,000 to $34,999 | 138 | 1.8% |
| $35,000 to $49,999 | 588 | 7.7% |
| $50,000 to $74,999 | 741 | 9.7% |
| $75,000 to $99,999 | 978 | 12.8% |
| $100,000 to $149,999 | 1,375 | 18.0% |
| $150,000 to $199,999 | 688 | 9.0% |
| $200,000+ | 2,629 | 34.4% |
Household Income by Householder Age in Nocatee
The median household income in Nocatee is $131,738, with the highest median household income of $207,539 found in the 25 to 44 years age bracket for the primary householder. A total of 2,591 households (33.9%) fall into this category.
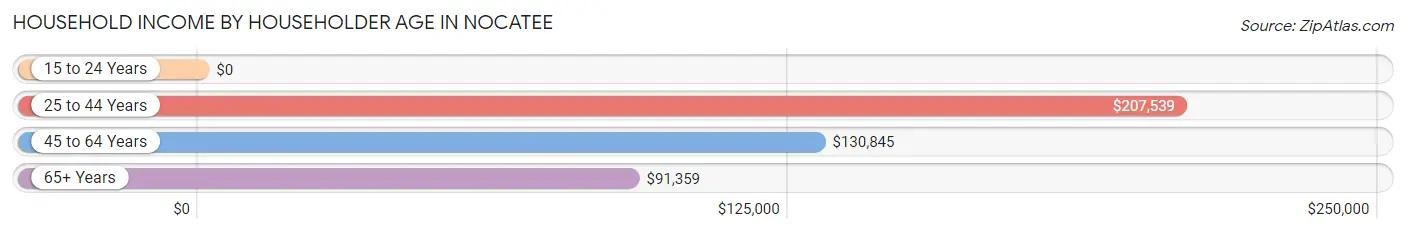
| Income Bracket | # Households | Median Income |
| 15 to 24 Years | 0 (0.0%) | $0 |
| 25 to 44 Years | 2,591 (33.9%) | $207,539 |
| 45 to 64 Years | 2,743 (35.9%) | $130,845 |
| 65+ Years | 2,307 (30.2%) | $91,359 |
| Total | 7,641 (100.0%) | $131,738 |
Poverty in Nocatee
Income Below Poverty by Sex and Age in Nocatee
With 1.4% poverty level for males and 5.7% for females among the residents of Nocatee, 12 to 14 year old males and 45 to 54 year old females are the most vulnerable to poverty, with 38 males (9.8%) and 245 females (18.3%) in their respective age groups living below the poverty level.
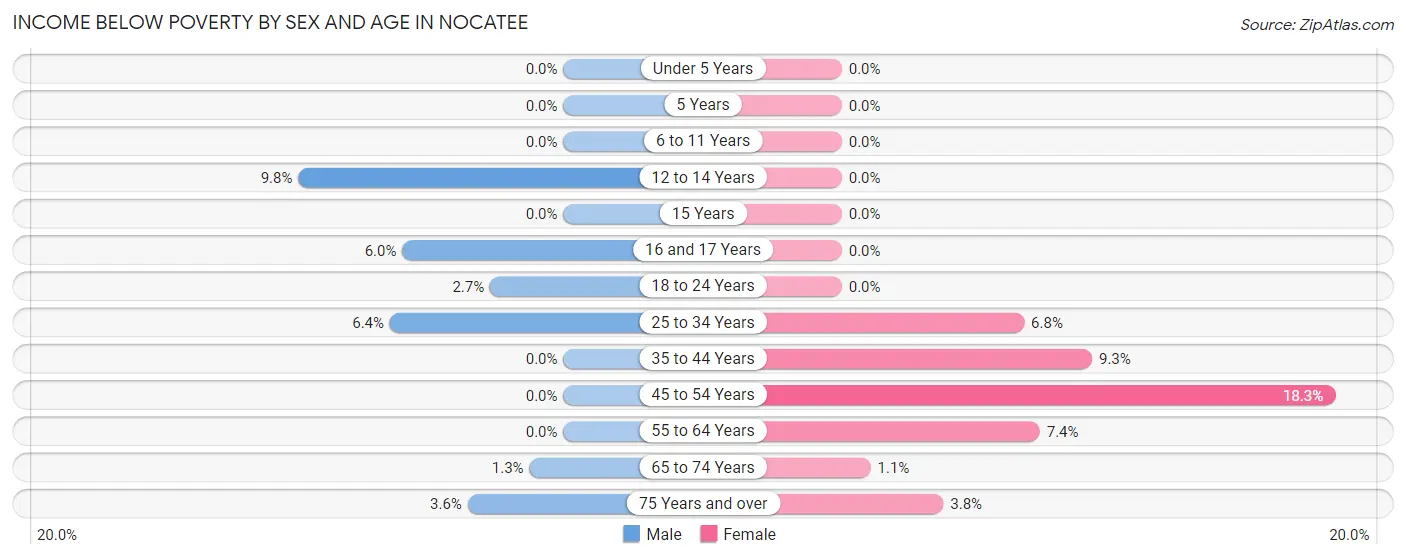
| Age Bracket | Male | Female |
| Under 5 Years | 0 (0.0%) | 0 (0.0%) |
| 5 Years | 0 (0.0%) | 0 (0.0%) |
| 6 to 11 Years | 0 (0.0%) | 0 (0.0%) |
| 12 to 14 Years | 38 (9.8%) | 0 (0.0%) |
| 15 Years | 0 (0.0%) | 0 (0.0%) |
| 16 and 17 Years | 15 (6.0%) | 0 (0.0%) |
| 18 to 24 Years | 21 (2.7%) | 0 (0.0%) |
| 25 to 34 Years | 28 (6.4%) | 60 (6.8%) |
| 35 to 44 Years | 0 (0.0%) | 209 (9.3%) |
| 45 to 54 Years | 0 (0.0%) | 245 (18.3%) |
| 55 to 64 Years | 0 (0.0%) | 82 (7.3%) |
| 65 to 74 Years | 14 (1.3%) | 14 (1.1%) |
| 75 Years and over | 40 (3.5%) | 43 (3.8%) |
| Total | 156 (1.4%) | 653 (5.7%) |
Income Above Poverty by Sex and Age in Nocatee
According to the poverty statistics in Nocatee, males aged under 5 years and females aged under 5 years are the age groups that are most secure financially, with 100.0% of males and 100.0% of females in these age groups living above the poverty line.
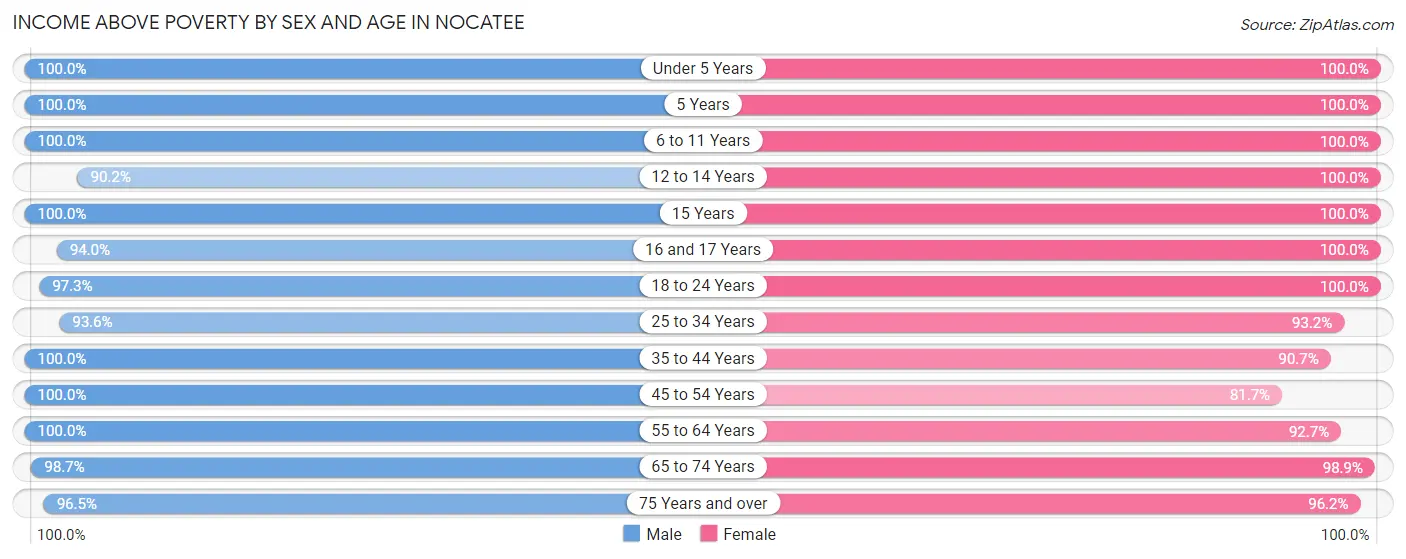
| Age Bracket | Male | Female |
| Under 5 Years | 1,092 (100.0%) | 1,260 (100.0%) |
| 5 Years | 315 (100.0%) | 73 (100.0%) |
| 6 to 11 Years | 1,328 (100.0%) | 1,137 (100.0%) |
| 12 to 14 Years | 348 (90.2%) | 441 (100.0%) |
| 15 Years | 71 (100.0%) | 152 (100.0%) |
| 16 and 17 Years | 236 (94.0%) | 79 (100.0%) |
| 18 to 24 Years | 752 (97.3%) | 271 (100.0%) |
| 25 to 34 Years | 407 (93.6%) | 826 (93.2%) |
| 35 to 44 Years | 2,153 (100.0%) | 2,041 (90.7%) |
| 45 to 54 Years | 1,428 (100.0%) | 1,093 (81.7%) |
| 55 to 64 Years | 1,024 (100.0%) | 1,033 (92.6%) |
| 65 to 74 Years | 1,099 (98.7%) | 1,296 (98.9%) |
| 75 Years and over | 1,087 (96.5%) | 1,099 (96.2%) |
| Total | 11,340 (98.6%) | 10,801 (94.3%) |
Income Below Poverty Among Married-Couple Families in Nocatee
The poverty statistics for married-couple families in Nocatee show that 2.0% or 120 of the total 5,963 families live below the poverty line. Families with no children have the highest poverty rate of 3.0%, comprising of 83 families. On the other hand, families with 3 or 4 children have the lowest poverty rate of 0.0%, which includes 0 families.
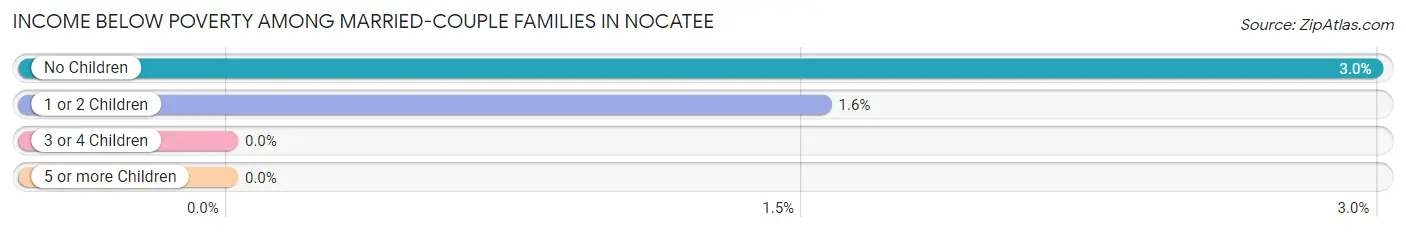
| Children | Above Poverty | Below Poverty |
| No Children | 2,697 (97.0%) | 83 (3.0%) |
| 1 or 2 Children | 2,347 (98.5%) | 37 (1.5%) |
| 3 or 4 Children | 753 (100.0%) | 0 (0.0%) |
| 5 or more Children | 46 (100.0%) | 0 (0.0%) |
| Total | 5,843 (98.0%) | 120 (2.0%) |
Income Below Poverty Among Single-Parent Households in Nocatee
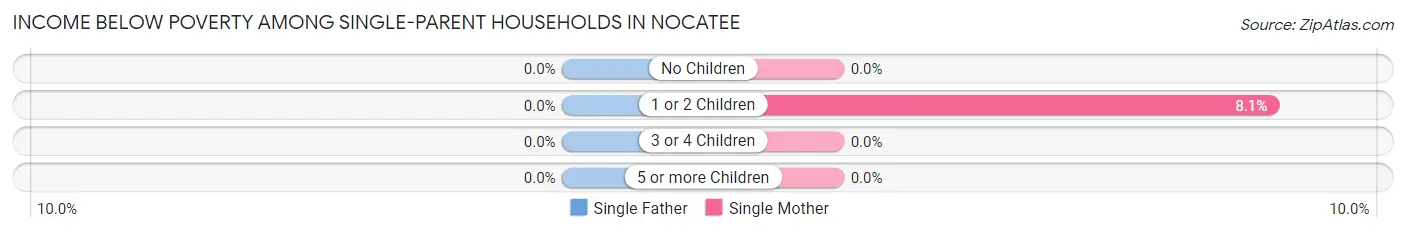
| Children | Single Father | Single Mother |
| No Children | 0 (0.0%) | 0 (0.0%) |
| 1 or 2 Children | 0 (0.0%) | 15 (8.1%) |
| 3 or 4 Children | 0 (0.0%) | 0 (0.0%) |
| 5 or more Children | 0 (0.0%) | 0 (0.0%) |
| Total | 0 (0.0%) | 15 (6.6%) |
Income Below Poverty Among Married-Couple vs Single-Parent Households in Nocatee
The poverty data for Nocatee shows that 120 of the married-couple family households (2.0%) and 15 of the single-parent households (2.6%) are living below the poverty level. Within the married-couple family households, those with no children have the highest poverty rate, with 83 households (3.0%) falling below the poverty line. Among the single-parent households, those with 1 or 2 children have the highest poverty rate, with 15 household (2.9%) living below poverty.
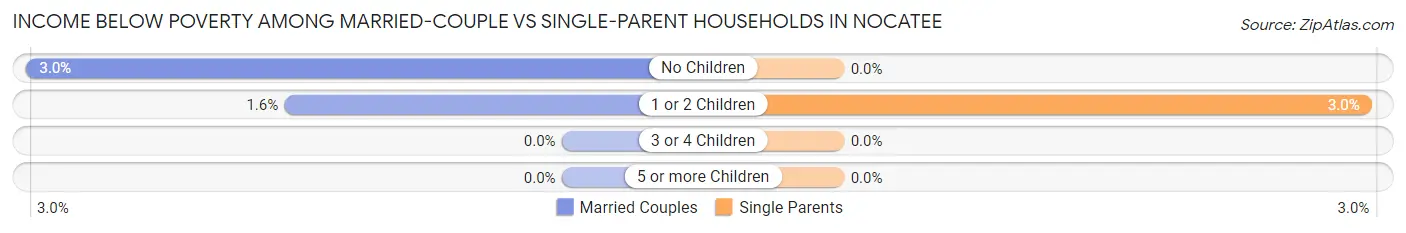
| Children | Married-Couple Families | Single-Parent Households |
| No Children | 83 (3.0%) | 0 (0.0%) |
| 1 or 2 Children | 37 (1.5%) | 15 (2.9%) |
| 3 or 4 Children | 0 (0.0%) | 0 (0.0%) |
| 5 or more Children | 0 (0.0%) | 0 (0.0%) |
| Total | 120 (2.0%) | 15 (2.6%) |
Race in Nocatee
The most populous races in Nocatee are White / Caucasian (19,309 | 84.1%), Hispanic or Latino (1,874 | 8.2%), and Two or more Races (1,604 | 7.0%).
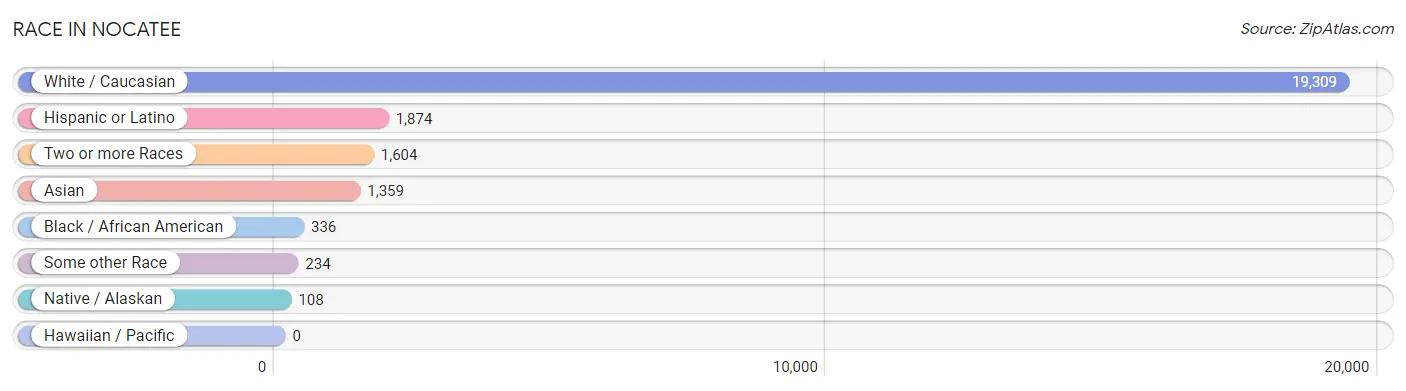
| Race | # Population | % Population |
| Asian | 1,359 | 5.9% |
| Black / African American | 336 | 1.5% |
| Hawaiian / Pacific | 0 | 0.0% |
| Hispanic or Latino | 1,874 | 8.2% |
| Native / Alaskan | 108 | 0.5% |
| White / Caucasian | 19,309 | 84.1% |
| Two or more Races | 1,604 | 7.0% |
| Some other Race | 234 | 1.0% |
| Total | 22,950 | 100.0% |
Ancestry in Nocatee
The most populous ancestries reported in Nocatee are German (4,888 | 21.3%), Irish (3,507 | 15.3%), English (3,122 | 13.6%), American (1,640 | 7.1%), and Italian (1,604 | 7.0%), together accounting for 64.3% of all Nocatee residents.
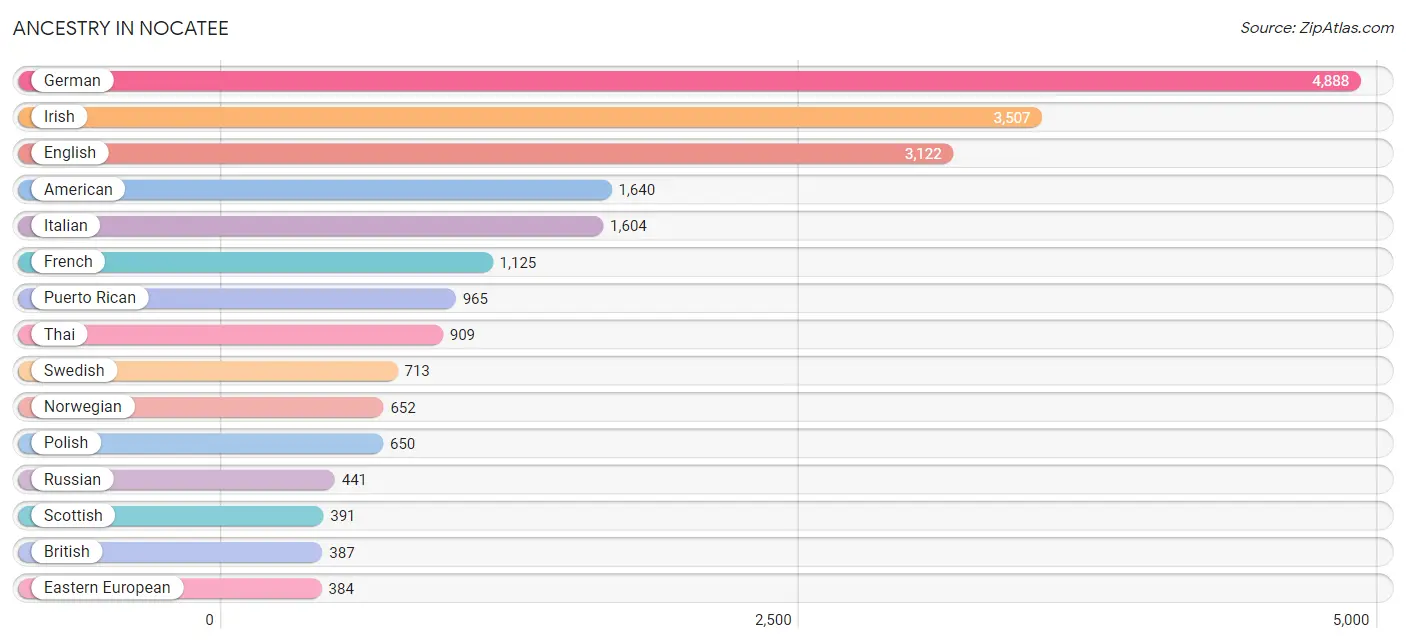
| Ancestry | # Population | % Population |
| American | 1,640 | 7.1% |
| Arab | 146 | 0.6% |
| Australian | 54 | 0.2% |
| Bhutanese | 169 | 0.7% |
| Brazilian | 139 | 0.6% |
| British | 387 | 1.7% |
| Burmese | 100 | 0.4% |
| Central American | 47 | 0.2% |
| Cherokee | 150 | 0.6% |
| Colombian | 276 | 1.2% |
| Creek | 29 | 0.1% |
| Cuban | 135 | 0.6% |
| Czech | 119 | 0.5% |
| Czechoslovakian | 34 | 0.2% |
| Danish | 88 | 0.4% |
| Dominican | 91 | 0.4% |
| Dutch | 278 | 1.2% |
| Eastern European | 384 | 1.7% |
| English | 3,122 | 13.6% |
| Ethiopian | 81 | 0.4% |
| European | 340 | 1.5% |
| French | 1,125 | 4.9% |
| French Canadian | 122 | 0.5% |
| German | 4,888 | 21.3% |
| Greek | 16 | 0.1% |
| Honduran | 31 | 0.1% |
| Hungarian | 44 | 0.2% |
| Indian (Asian) | 255 | 1.1% |
| Irish | 3,507 | 15.3% |
| Italian | 1,604 | 7.0% |
| Korean | 326 | 1.4% |
| Laotian | 63 | 0.3% |
| Lebanese | 146 | 0.6% |
| Mexican | 155 | 0.7% |
| Northern European | 11 | 0.1% |
| Norwegian | 652 | 2.8% |
| Panamanian | 16 | 0.1% |
| Peruvian | 31 | 0.1% |
| Polish | 650 | 2.8% |
| Portuguese | 270 | 1.2% |
| Puerto Rican | 965 | 4.2% |
| Romanian | 31 | 0.1% |
| Russian | 441 | 1.9% |
| Scotch-Irish | 154 | 0.7% |
| Scottish | 391 | 1.7% |
| Serbian | 54 | 0.2% |
| Slovak | 75 | 0.3% |
| South American | 307 | 1.3% |
| Spaniard | 30 | 0.1% |
| Spanish | 144 | 0.6% |
| Sri Lankan | 25 | 0.1% |
| Subsaharan African | 81 | 0.4% |
| Swedish | 713 | 3.1% |
| Swiss | 21 | 0.1% |
| Thai | 909 | 4.0% |
| Ukrainian | 134 | 0.6% |
| Welsh | 165 | 0.7% |
| Yugoslavian | 29 | 0.1% | View All 58 Rows |
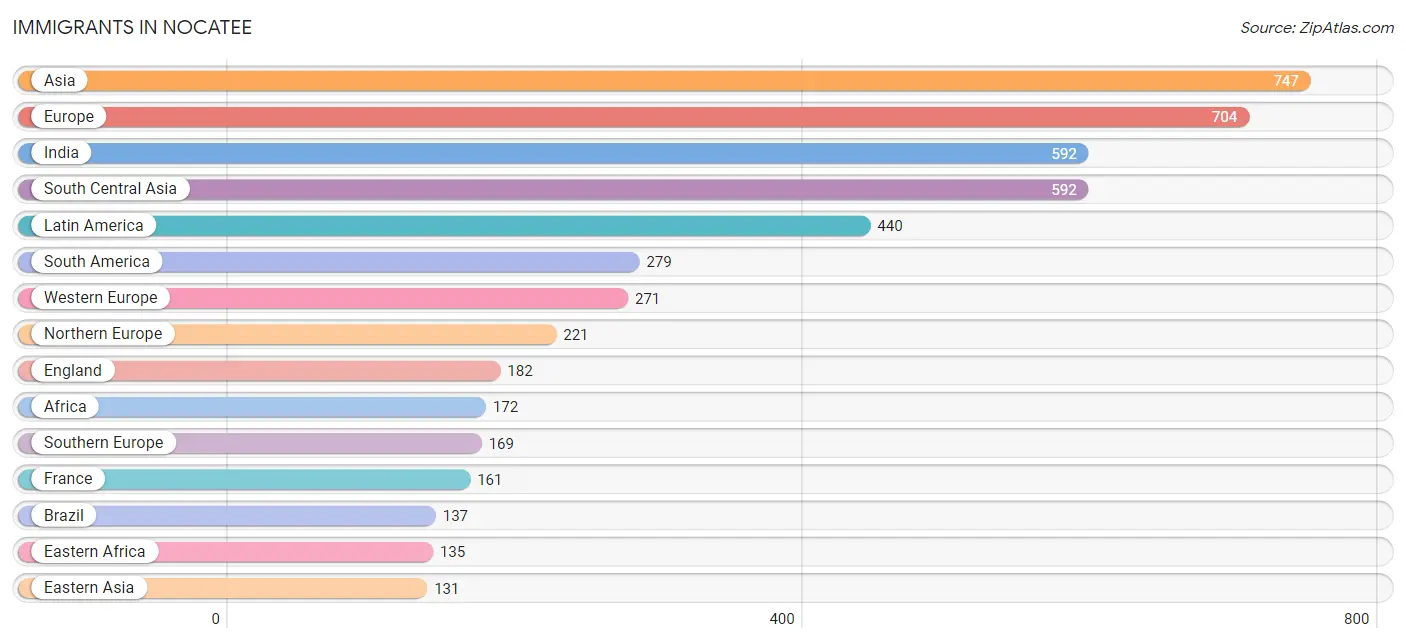
Immigrants in Nocatee
The most numerous immigrant groups reported in Nocatee came from Asia (747 | 3.3%), Europe (704 | 3.1%), India (592 | 2.6%), South Central Asia (592 | 2.6%), and Latin America (440 | 1.9%), together accounting for 13.4% of all Nocatee residents.
| Immigration Origin | # Population | % Population |
| Africa | 172 | 0.7% |
| Asia | 747 | 3.3% |
| Australia | 102 | 0.4% |
| Austria | 15 | 0.1% |
| Brazil | 137 | 0.6% |
| Canada | 23 | 0.1% |
| Caribbean | 47 | 0.2% |
| Central America | 114 | 0.5% |
| China | 97 | 0.4% |
| Colombia | 115 | 0.5% |
| Dominican Republic | 47 | 0.2% |
| Eastern Africa | 135 | 0.6% |
| Eastern Asia | 131 | 0.6% |
| Eastern Europe | 43 | 0.2% |
| England | 182 | 0.8% |
| Ethiopia | 81 | 0.4% |
| Europe | 704 | 3.1% |
| France | 161 | 0.7% |
| Germany | 95 | 0.4% |
| India | 592 | 2.6% |
| Italy | 59 | 0.3% |
| Kenya | 16 | 0.1% |
| Korea | 34 | 0.2% |
| Latin America | 440 | 1.9% |
| Mexico | 42 | 0.2% |
| Nigeria | 37 | 0.2% |
| Northern Europe | 221 | 1.0% |
| Oceania | 102 | 0.4% |
| Panama | 72 | 0.3% |
| Philippines | 24 | 0.1% |
| Portugal | 95 | 0.4% |
| South America | 279 | 1.2% |
| South Central Asia | 592 | 2.6% |
| South Eastern Asia | 24 | 0.1% |
| Southern Europe | 169 | 0.7% |
| Spain | 15 | 0.1% |
| Sweden | 22 | 0.1% |
| Western Africa | 37 | 0.2% |
| Western Europe | 271 | 1.2% | View All 39 Rows |
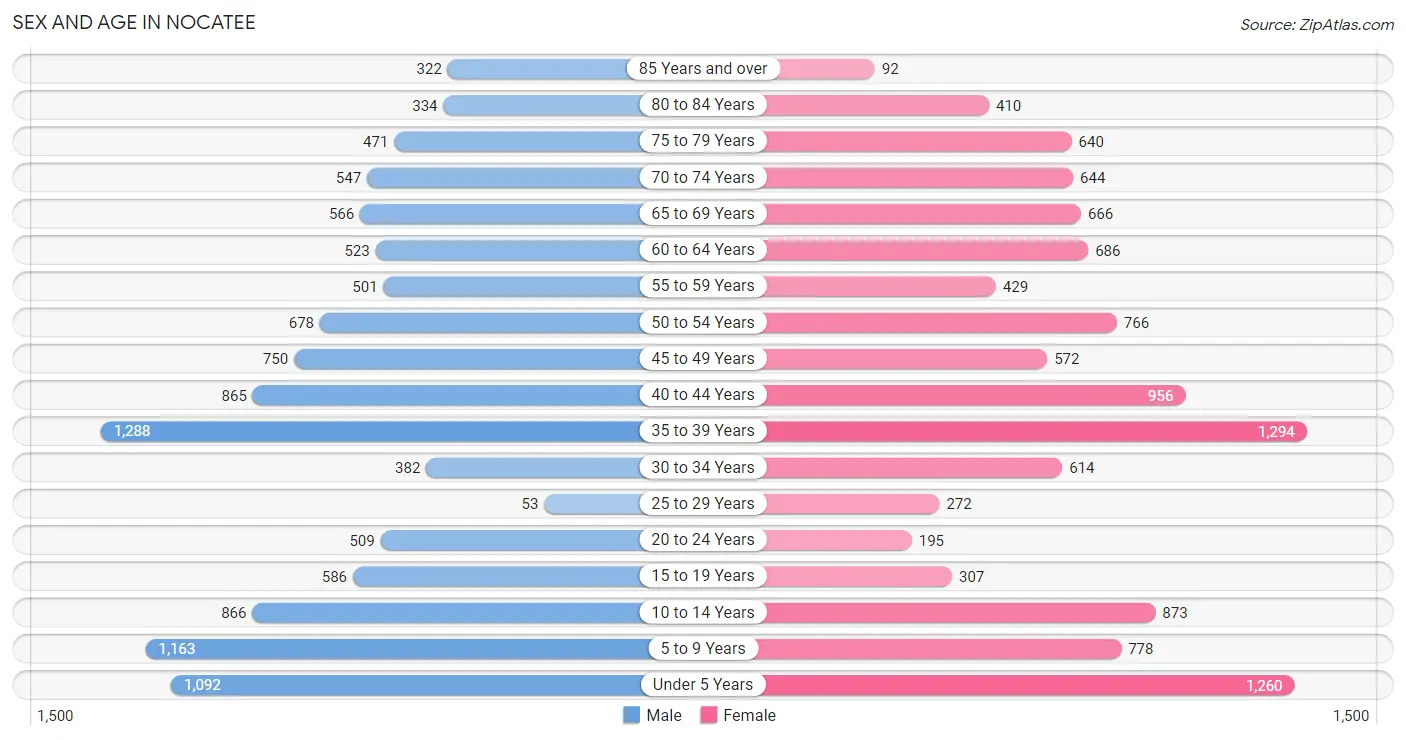
Sex and Age in Nocatee
Sex and Age in Nocatee
The most populous age groups in Nocatee are 35 to 39 Years (1,288 | 11.2%) for men and 35 to 39 Years (1,294 | 11.3%) for women.
| Age Bracket | Male | Female |
| Under 5 Years | 1,092 (9.5%) | 1,260 (11.0%) |
| 5 to 9 Years | 1,163 (10.1%) | 778 (6.8%) |
| 10 to 14 Years | 866 (7.5%) | 873 (7.6%) |
| 15 to 19 Years | 586 (5.1%) | 307 (2.7%) |
| 20 to 24 Years | 509 (4.4%) | 195 (1.7%) |
| 25 to 29 Years | 53 (0.5%) | 272 (2.4%) |
| 30 to 34 Years | 382 (3.3%) | 614 (5.4%) |
| 35 to 39 Years | 1,288 (11.2%) | 1,294 (11.3%) |
| 40 to 44 Years | 865 (7.5%) | 956 (8.4%) |
| 45 to 49 Years | 750 (6.5%) | 572 (5.0%) |
| 50 to 54 Years | 678 (5.9%) | 766 (6.7%) |
| 55 to 59 Years | 501 (4.4%) | 429 (3.7%) |
| 60 to 64 Years | 523 (4.5%) | 686 (6.0%) |
| 65 to 69 Years | 566 (4.9%) | 666 (5.8%) |
| 70 to 74 Years | 547 (4.8%) | 644 (5.6%) |
| 75 to 79 Years | 471 (4.1%) | 640 (5.6%) |
| 80 to 84 Years | 334 (2.9%) | 410 (3.6%) |
| 85 Years and over | 322 (2.8%) | 92 (0.8%) |
| Total | 11,496 (100.0%) | 11,454 (100.0%) |
Families and Households in Nocatee
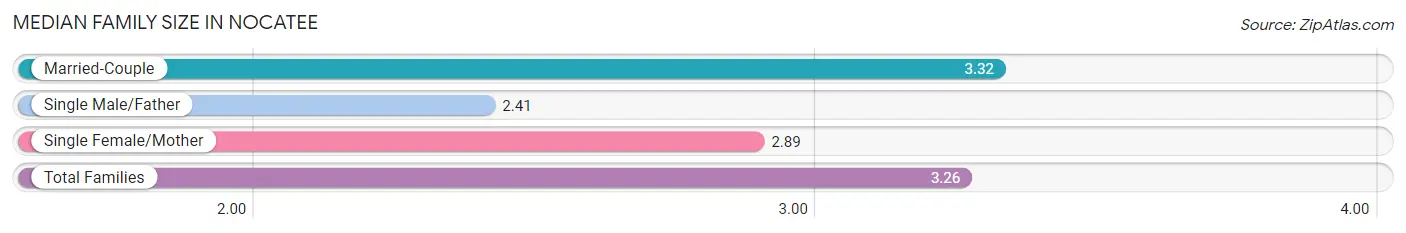
Median Family Size in Nocatee
The median family size in Nocatee is 3.26 persons per family, with married-couple families (5,963 | 91.3%) accounting for the largest median family size of 3.32 persons per family. On the other hand, single male/father families (343 | 5.2%) represent the smallest median family size with 2.41 persons per family.
| Family Type | # Families | Family Size |
| Married-Couple | 5,963 (91.3%) | 3.32 |
| Single Male/Father | 343 (5.2%) | 2.41 |
| Single Female/Mother | 226 (3.5%) | 2.89 |
| Total Families | 6,532 (100.0%) | 3.26 |
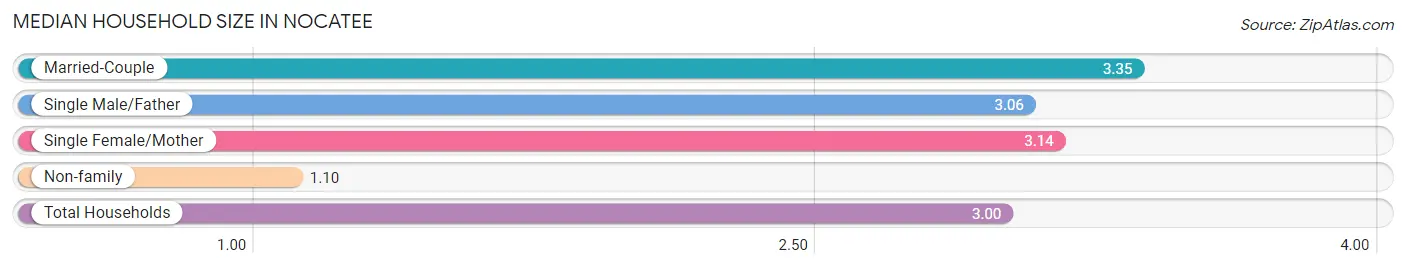
Median Household Size in Nocatee
The median household size in Nocatee is 3.00 persons per household, with married-couple households (5,963 | 78.0%) accounting for the largest median household size of 3.35 persons per household. non-family households (1,109 | 14.5%) represent the smallest median household size with 1.10 persons per household.
| Household Type | # Households | Household Size |
| Married-Couple | 5,963 (78.0%) | 3.35 |
| Single Male/Father | 343 (4.5%) | 3.06 |
| Single Female/Mother | 226 (3.0%) | 3.14 |
| Non-family | 1,109 (14.5%) | 1.10 |
| Total Households | 7,641 (100.0%) | 3.00 |
Household Size by Marriage Status in Nocatee
Out of a total of 7,641 households in Nocatee, 6,532 (85.5%) are family households, while 1,109 (14.5%) are nonfamily households. The most numerous type of family households are 2-person households, comprising 2,286, and the most common type of nonfamily households are 1-person households, comprising 1,011.
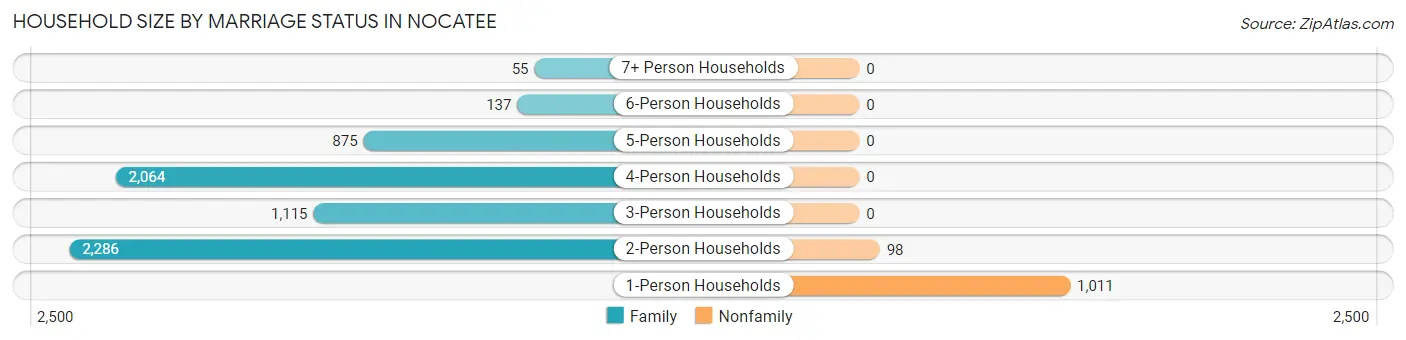
| Household Size | Family Households | Nonfamily Households |
| 1-Person Households | - | 1,011 (13.2%) |
| 2-Person Households | 2,286 (29.9%) | 98 (1.3%) |
| 3-Person Households | 1,115 (14.6%) | 0 (0.0%) |
| 4-Person Households | 2,064 (27.0%) | 0 (0.0%) |
| 5-Person Households | 875 (11.5%) | 0 (0.0%) |
| 6-Person Households | 137 (1.8%) | 0 (0.0%) |
| 7+ Person Households | 55 (0.7%) | 0 (0.0%) |
| Total | 6,532 (85.5%) | 1,109 (14.5%) |
Female Fertility in Nocatee
Fertility by Age in Nocatee
Average fertility rate in Nocatee is 143.0 births per 1,000 women. Women in the age bracket of 20 to 34 years have the highest fertility rate with 253.0 births per 1,000 women. Women in the age bracket of 35 to 50 years acount for 58.2% of all women with births.
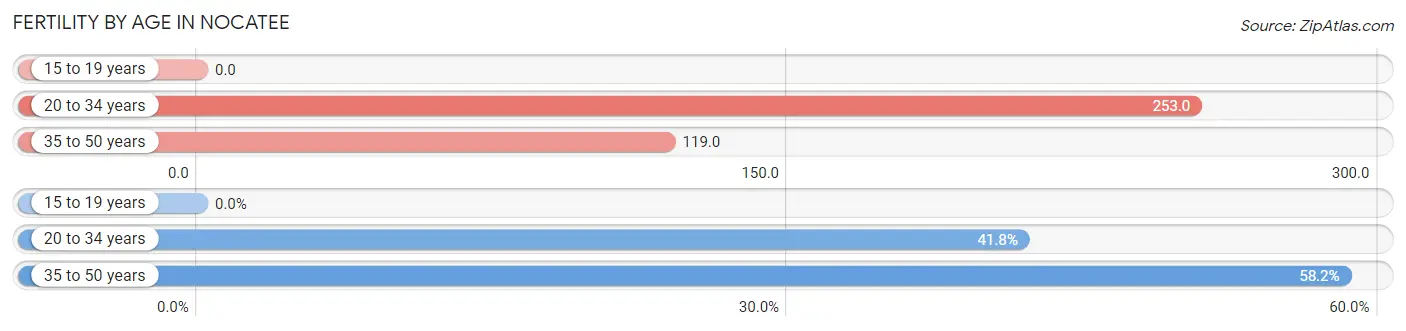
| Age Bracket | Women with Births | Births / 1,000 Women |
| 15 to 19 years | 0 (0.0%) | 0.0 |
| 20 to 34 years | 273 (41.8%) | 253.0 |
| 35 to 50 years | 380 (58.2%) | 119.0 |
| Total | 653 (100.0%) | 143.0 |
Fertility by Age by Marriage Status in Nocatee
68.0% of women with births (653) in Nocatee are married. The highest percentage of unmarried women with births falls into 35 to 50 years age bracket with 55.0% of them unmarried at the time of birth, while the lowest percentage of unmarried women with births belong to 20 to 34 years age bracket with 0.0% of them unmarried.
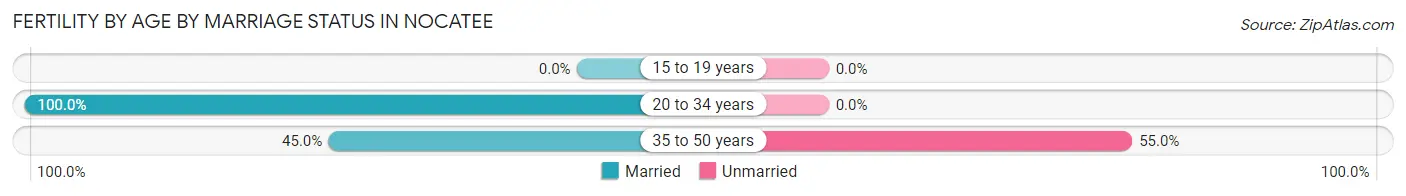
| Age Bracket | Married | Unmarried |
| 15 to 19 years | 0 (0.0%) | 0 (0.0%) |
| 20 to 34 years | 273 (100.0%) | 0 (0.0%) |
| 35 to 50 years | 171 (45.0%) | 209 (55.0%) |
| Total | 444 (68.0%) | 209 (32.0%) |
Fertility by Education in Nocatee
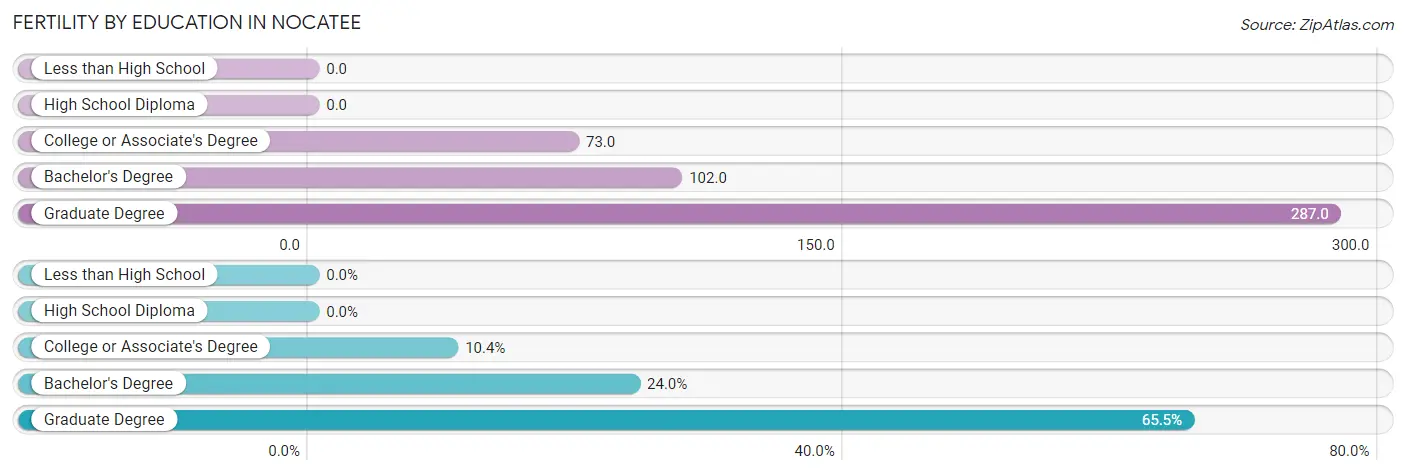
| Educational Attainment | Women with Births | Births / 1,000 Women |
| Less than High School | 0 (0.0%) | 0.0 |
| High School Diploma | 0 (0.0%) | 0.0 |
| College or Associate's Degree | 68 (10.4%) | 73.0 |
| Bachelor's Degree | 157 (24.0%) | 102.0 |
| Graduate Degree | 428 (65.5%) | 287.0 |
| Total | 653 (100.0%) | 143.0 |
Fertility by Education by Marriage Status in Nocatee
32.0% of women with births in Nocatee are unmarried. Women with the educational attainment of college or associate's degree are most likely to be married with 100.0% of them married at childbirth, while women with the educational attainment of graduate degree are least likely to be married with 48.8% of them unmarried at childbirth.
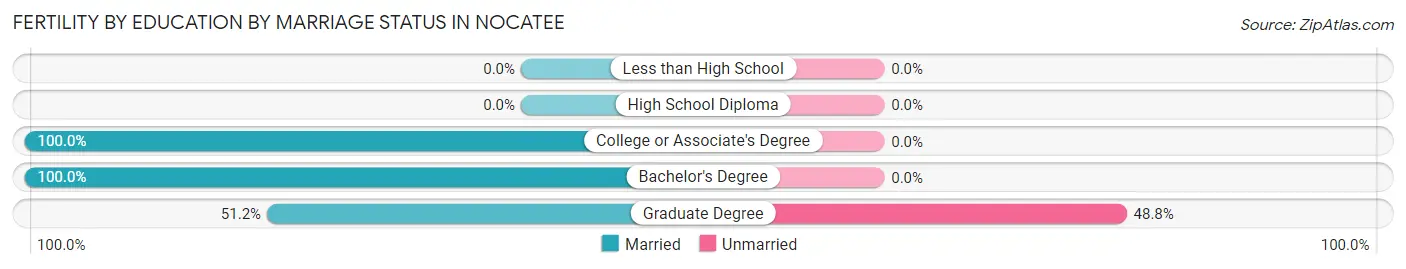
| Educational Attainment | Married | Unmarried |
| Less than High School | 0 (0.0%) | 0 (0.0%) |
| High School Diploma | 0 (0.0%) | 0 (0.0%) |
| College or Associate's Degree | 68 (100.0%) | 0 (0.0%) |
| Bachelor's Degree | 157 (100.0%) | 0 (0.0%) |
| Graduate Degree | 219 (51.2%) | 209 (48.8%) |
| Total | 444 (68.0%) | 209 (32.0%) |
Employment Characteristics in Nocatee
Employment by Class of Employer in Nocatee
Among the 8,792 employed individuals in Nocatee, private company employees (5,540 | 63.0%), not-for-profit organizations (949 | 10.8%), and self-employed (incorporated) (897 | 10.2%) make up the most common classes of employment.
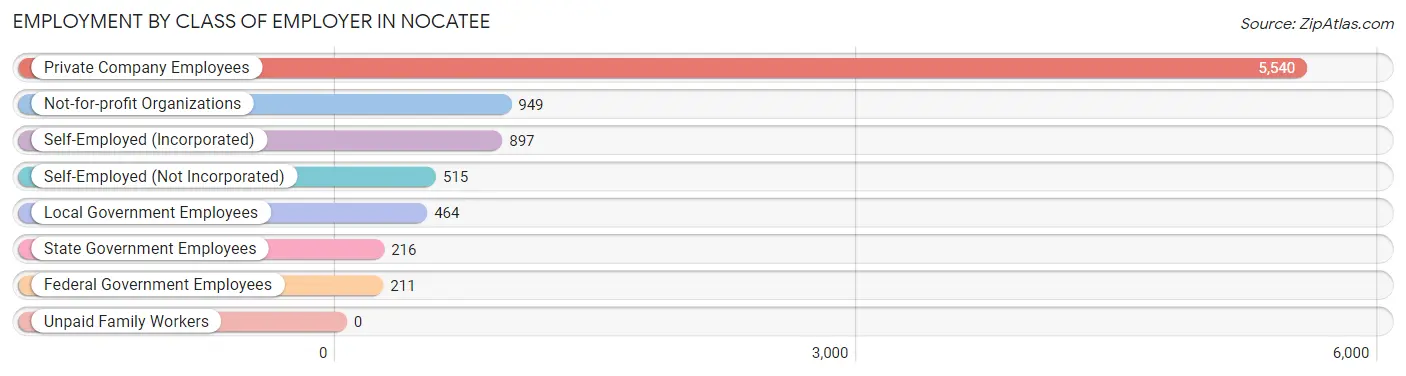
| Employer Class | # Employees | % Employees |
| Private Company Employees | 5,540 | 63.0% |
| Self-Employed (Incorporated) | 897 | 10.2% |
| Self-Employed (Not Incorporated) | 515 | 5.9% |
| Not-for-profit Organizations | 949 | 10.8% |
| Local Government Employees | 464 | 5.3% |
| State Government Employees | 216 | 2.5% |
| Federal Government Employees | 211 | 2.4% |
| Unpaid Family Workers | 0 | 0.0% |
| Total | 8,792 | 100.0% |
Employment Status by Age in Nocatee
According to the labor force statistics for Nocatee, out of the total population over 16 years of age (16,695), 57.7% or 9,633 individuals are in the labor force, with 6.7% or 645 of them unemployed. The age group with the highest labor force participation rate is 30 to 34 years, with 86.0% or 857 individuals in the labor force. Within the labor force, the 16 to 19 years age range has the highest percentage of unemployed individuals, with 80.2% or 253 of them being unemployed.
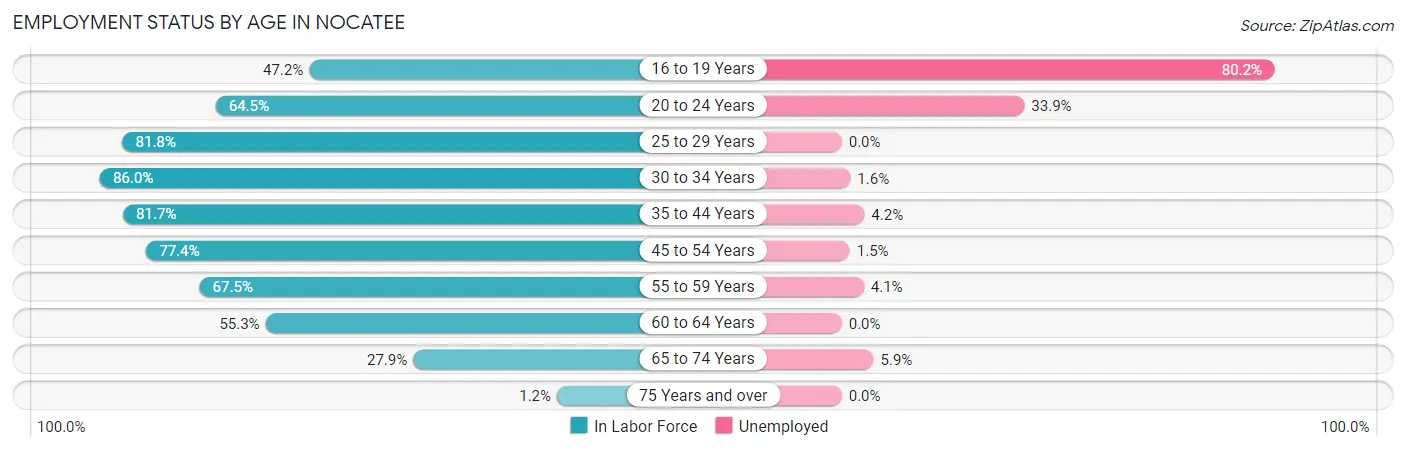
| Age Bracket | In Labor Force | Unemployed |
| 16 to 19 Years | 316 (47.2%) | 253 (80.2%) |
| 20 to 24 Years | 454 (64.5%) | 154 (33.9%) |
| 25 to 29 Years | 266 (81.8%) | 0 (0.0%) |
| 30 to 34 Years | 857 (86.0%) | 14 (1.6%) |
| 35 to 44 Years | 3,597 (81.7%) | 151 (4.2%) |
| 45 to 54 Years | 2,141 (77.4%) | 32 (1.5%) |
| 55 to 59 Years | 628 (67.5%) | 26 (4.1%) |
| 60 to 64 Years | 669 (55.3%) | 0 (0.0%) |
| 65 to 74 Years | 676 (27.9%) | 40 (5.9%) |
| 75 Years and over | 27 (1.2%) | 0 (0.0%) |
| Total | 9,633 (57.7%) | 645 (6.7%) |
Employment Status by Educational Attainment in Nocatee
According to labor force statistics for Nocatee, 76.8% of individuals (8,163) out of the total population between 25 and 64 years of age (10,629) are in the labor force, with 2.8% or 229 of them being unemployed. The group with the highest labor force participation rate are those with the educational attainment of less than high school, with 95.4% or 185 individuals in the labor force. Within the labor force, individuals with bachelor's degree or higher education have the highest percentage of unemployment, with 3.8% or 225 of them being unemployed.
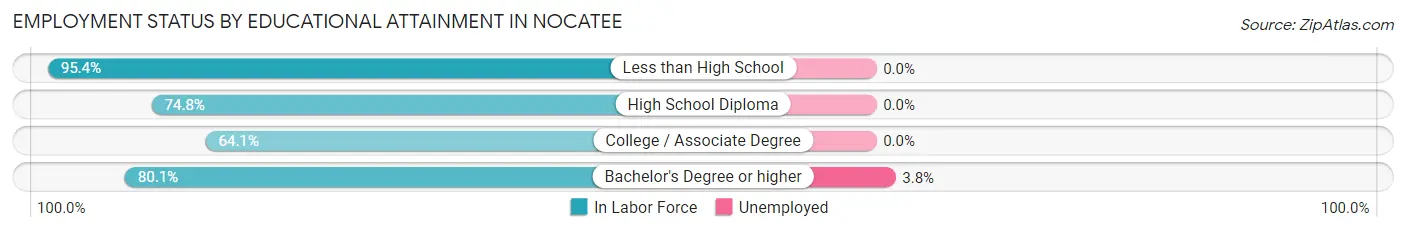
| Educational Attainment | In Labor Force | Unemployed |
| Less than High School | 185 (95.4%) | 0 (0.0%) |
| High School Diploma | 705 (74.8%) | 0 (0.0%) |
| College / Associate Degree | 1,337 (64.1%) | 0 (0.0%) |
| Bachelor's Degree or higher | 5,933 (80.1%) | 281 (3.8%) |
| Total | 8,163 (76.8%) | 298 (2.8%) |
Employment Occupations by Sex in Nocatee
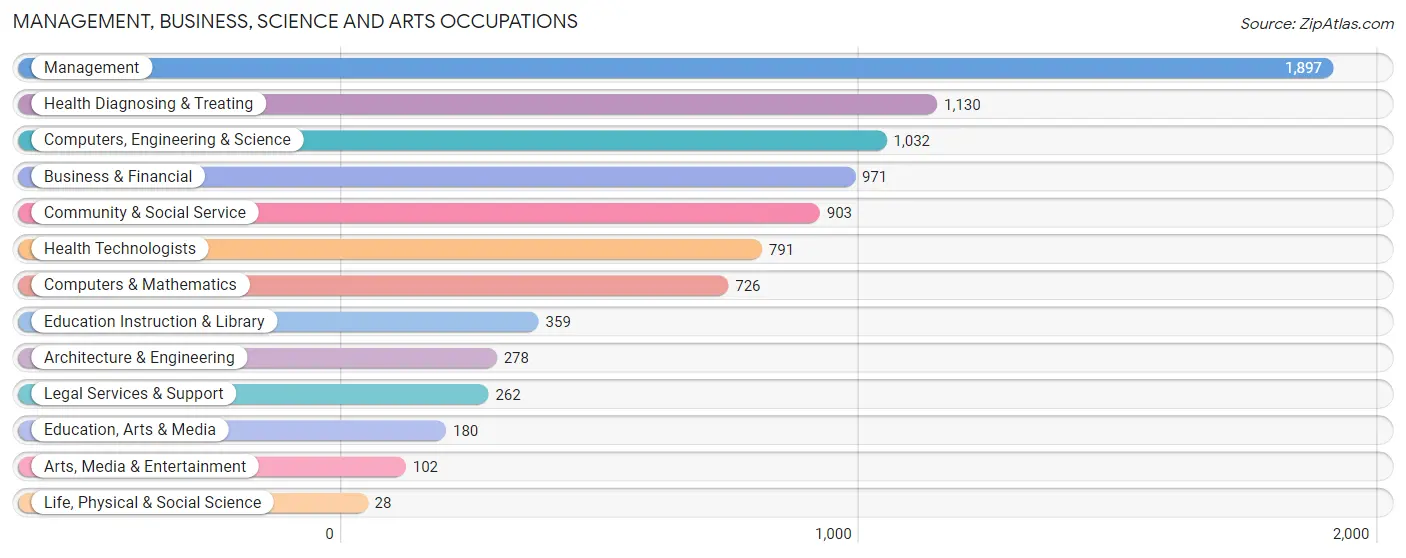
Management, Business, Science and Arts Occupations
The most common Management, Business, Science and Arts occupations in Nocatee are Management (1,897 | 21.2%), Health Diagnosing & Treating (1,130 | 12.6%), Computers, Engineering & Science (1,032 | 11.5%), Business & Financial (971 | 10.9%), and Community & Social Service (903 | 10.1%).
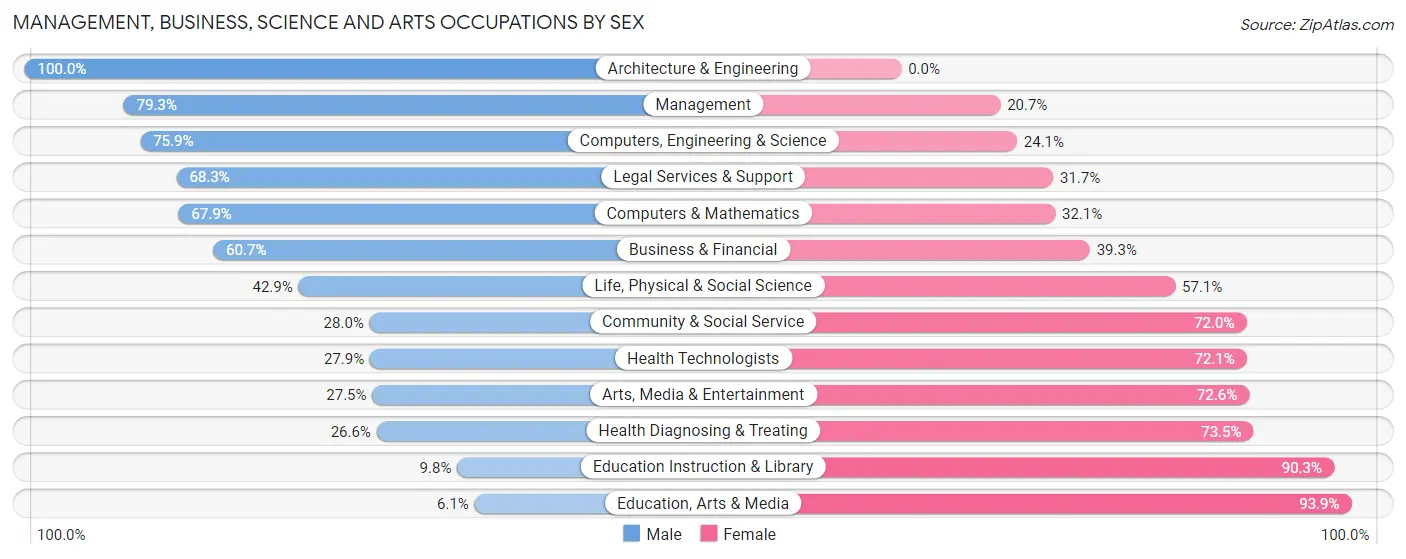
Management, Business, Science and Arts Occupations by Sex
Within the Management, Business, Science and Arts occupations in Nocatee, the most male-oriented occupations are Architecture & Engineering (100.0%), Management (79.3%), and Computers, Engineering & Science (75.9%), while the most female-oriented occupations are Education, Arts & Media (93.9%), Education Instruction & Library (90.2%), and Health Diagnosing & Treating (73.5%).
| Occupation | Male | Female |
| Management | 1,505 (79.3%) | 392 (20.7%) |
| Business & Financial | 589 (60.7%) | 382 (39.3%) |
| Computers, Engineering & Science | 783 (75.9%) | 249 (24.1%) |
| Computers & Mathematics | 493 (67.9%) | 233 (32.1%) |
| Architecture & Engineering | 278 (100.0%) | 0 (0.0%) |
| Life, Physical & Social Science | 12 (42.9%) | 16 (57.1%) |
| Community & Social Service | 253 (28.0%) | 650 (72.0%) |
| Education, Arts & Media | 11 (6.1%) | 169 (93.9%) |
| Legal Services & Support | 179 (68.3%) | 83 (31.7%) |
| Education Instruction & Library | 35 (9.8%) | 324 (90.2%) |
| Arts, Media & Entertainment | 28 (27.5%) | 74 (72.6%) |
| Health Diagnosing & Treating | 300 (26.6%) | 830 (73.5%) |
| Health Technologists | 221 (27.9%) | 570 (72.1%) |
| Total (Category) | 3,430 (57.8%) | 2,503 (42.2%) |
| Total (Overall) | 4,893 (54.7%) | 4,046 (45.3%) |
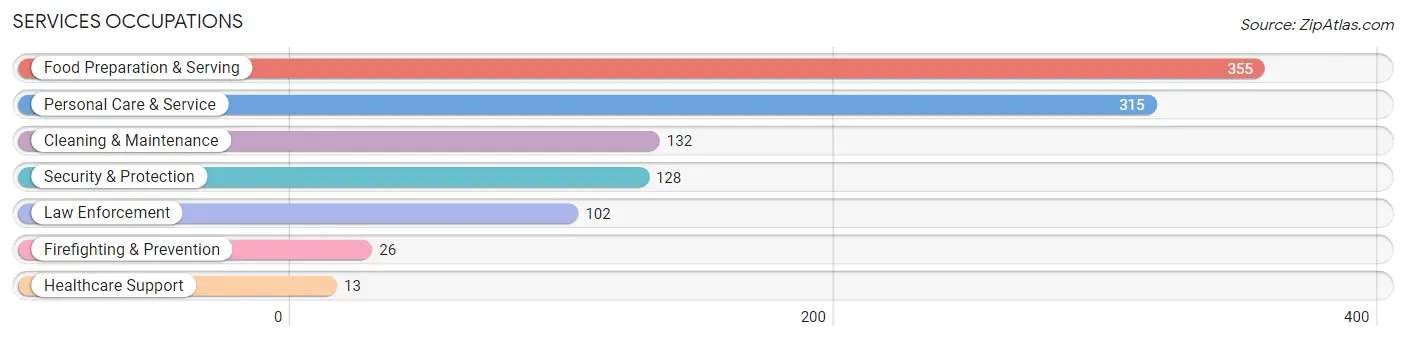
Services Occupations
The most common Services occupations in Nocatee are Food Preparation & Serving (355 | 4.0%), Personal Care & Service (315 | 3.5%), Cleaning & Maintenance (132 | 1.5%), Security & Protection (128 | 1.4%), and Law Enforcement (102 | 1.1%).
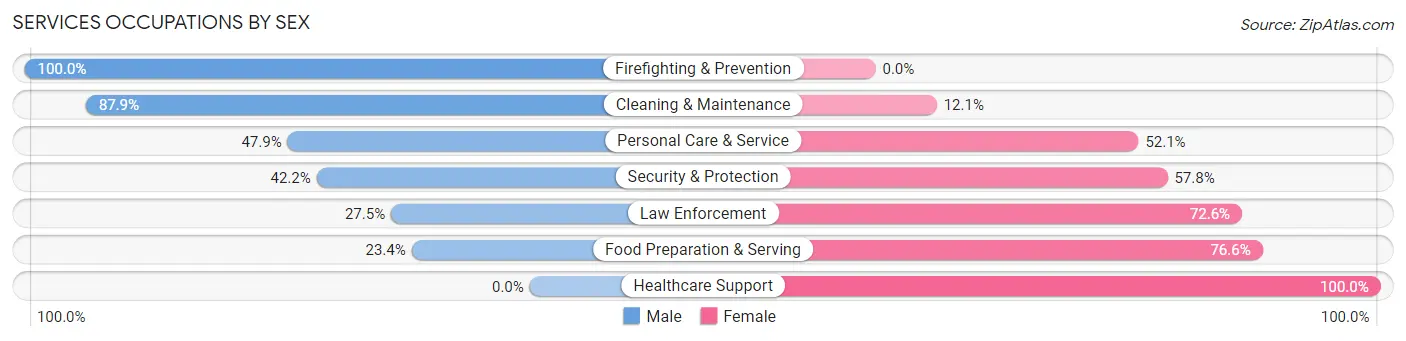
Services Occupations by Sex
Within the Services occupations in Nocatee, the most male-oriented occupations are Firefighting & Prevention (100.0%), Cleaning & Maintenance (87.9%), and Personal Care & Service (47.9%), while the most female-oriented occupations are Healthcare Support (100.0%), Food Preparation & Serving (76.6%), and Law Enforcement (72.6%).
| Occupation | Male | Female |
| Healthcare Support | 0 (0.0%) | 13 (100.0%) |
| Security & Protection | 54 (42.2%) | 74 (57.8%) |
| Firefighting & Prevention | 26 (100.0%) | 0 (0.0%) |
| Law Enforcement | 28 (27.5%) | 74 (72.6%) |
| Food Preparation & Serving | 83 (23.4%) | 272 (76.6%) |
| Cleaning & Maintenance | 116 (87.9%) | 16 (12.1%) |
| Personal Care & Service | 151 (47.9%) | 164 (52.1%) |
| Total (Category) | 404 (42.8%) | 539 (57.2%) |
| Total (Overall) | 4,893 (54.7%) | 4,046 (45.3%) |
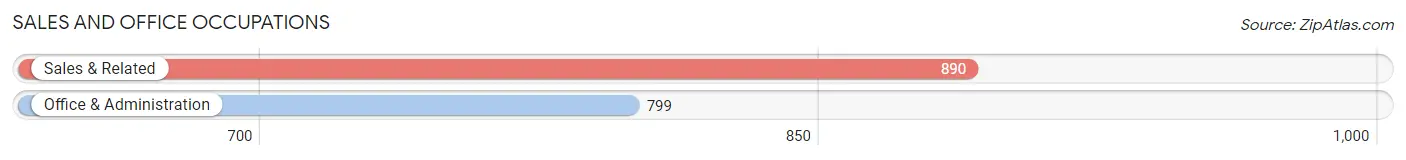
Sales and Office Occupations
The most common Sales and Office occupations in Nocatee are Sales & Related (890 | 10.0%), and Office & Administration (799 | 8.9%).
Sales and Office Occupations by Sex
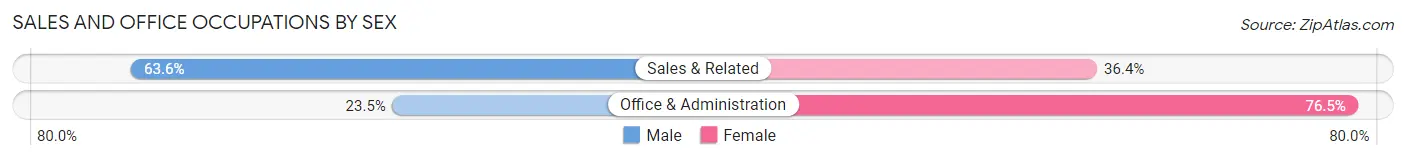
| Occupation | Male | Female |
| Sales & Related | 566 (63.6%) | 324 (36.4%) |
| Office & Administration | 188 (23.5%) | 611 (76.5%) |
| Total (Category) | 754 (44.6%) | 935 (55.4%) |
| Total (Overall) | 4,893 (54.7%) | 4,046 (45.3%) |
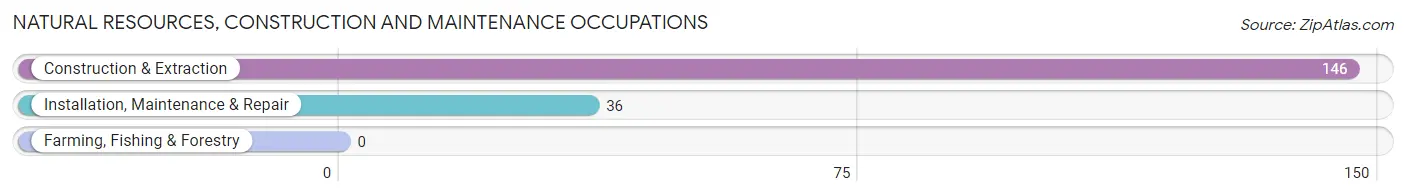
Natural Resources, Construction and Maintenance Occupations
The most common Natural Resources, Construction and Maintenance occupations in Nocatee are Construction & Extraction (146 | 1.6%), and Installation, Maintenance & Repair (36 | 0.4%).
Natural Resources, Construction and Maintenance Occupations by Sex
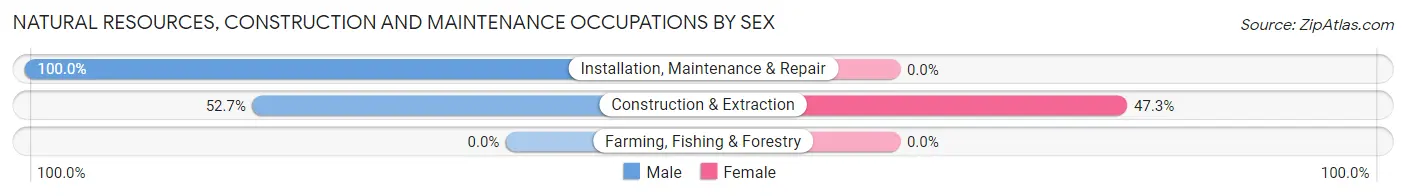
| Occupation | Male | Female |
| Farming, Fishing & Forestry | 0 (0.0%) | 0 (0.0%) |
| Construction & Extraction | 77 (52.7%) | 69 (47.3%) |
| Installation, Maintenance & Repair | 36 (100.0%) | 0 (0.0%) |
| Total (Category) | 113 (62.1%) | 69 (37.9%) |
| Total (Overall) | 4,893 (54.7%) | 4,046 (45.3%) |
Production, Transportation and Moving Occupations
The most common Production, Transportation and Moving occupations in Nocatee are Material Moving (105 | 1.2%), Transportation (68 | 0.8%), and Production (19 | 0.2%).
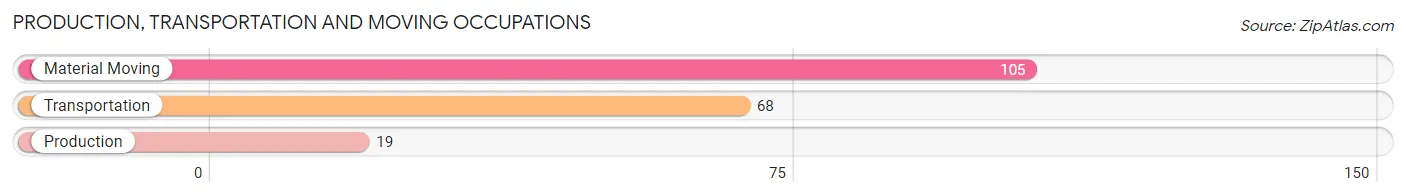
Production, Transportation and Moving Occupations by Sex
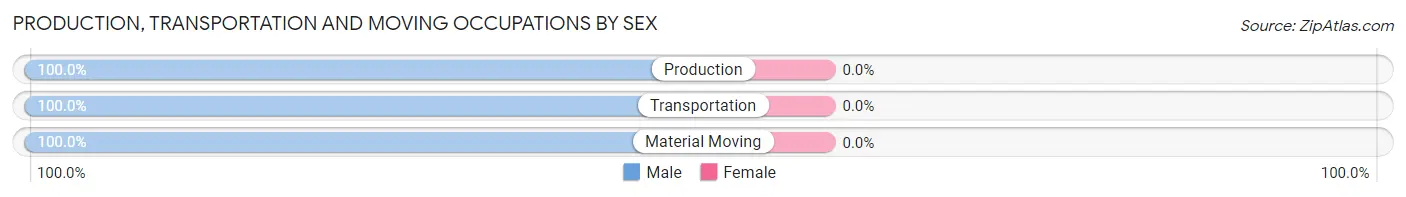
| Occupation | Male | Female |
| Production | 19 (100.0%) | 0 (0.0%) |
| Transportation | 68 (100.0%) | 0 (0.0%) |
| Material Moving | 105 (100.0%) | 0 (0.0%) |
| Total (Category) | 192 (100.0%) | 0 (0.0%) |
| Total (Overall) | 4,893 (54.7%) | 4,046 (45.3%) |
Employment Industries by Sex in Nocatee
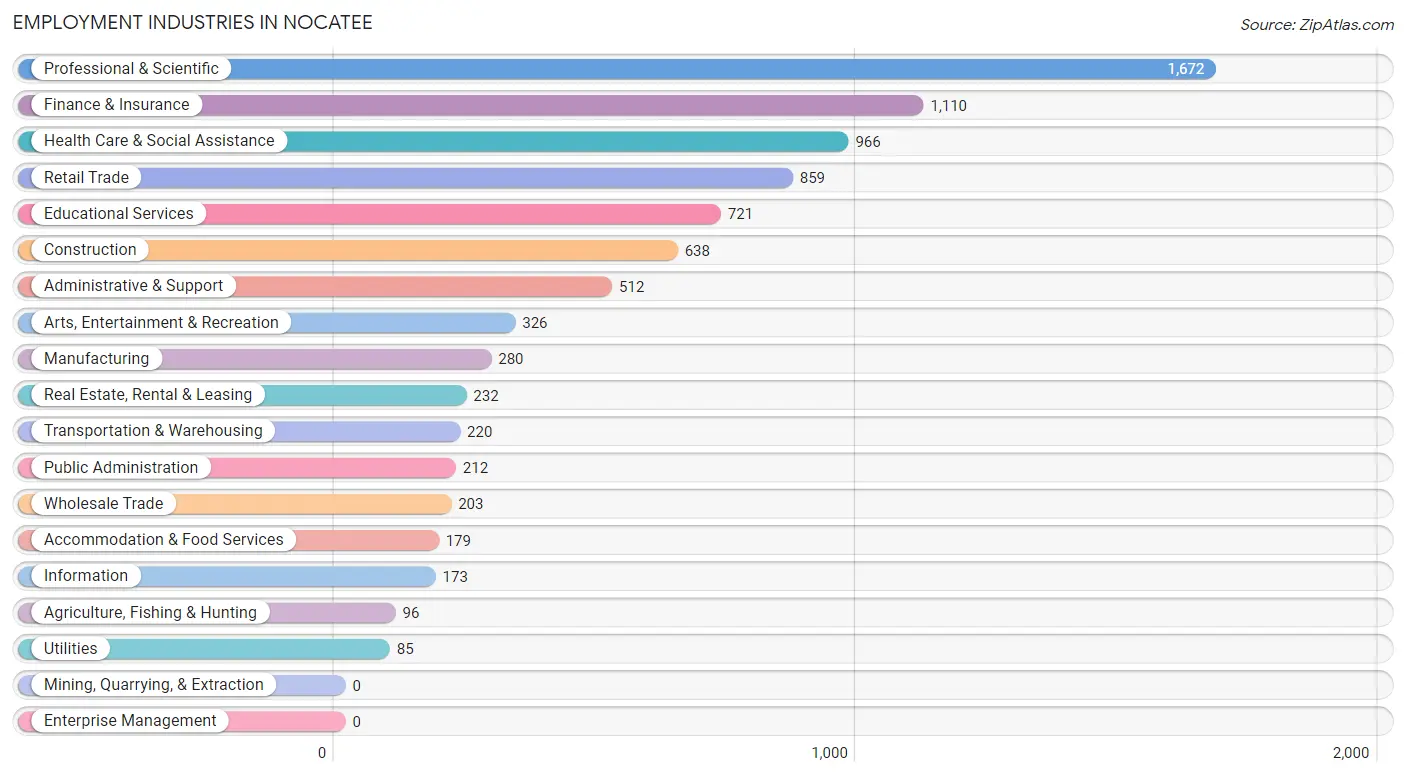
Employment Industries in Nocatee
The major employment industries in Nocatee include Professional & Scientific (1,672 | 18.7%), Finance & Insurance (1,110 | 12.4%), Health Care & Social Assistance (966 | 10.8%), Retail Trade (859 | 9.6%), and Educational Services (721 | 8.1%).
Employment Industries by Sex in Nocatee
The Nocatee industries that see more men than women are Utilities (100.0%), Wholesale Trade (95.6%), and Transportation & Warehousing (90.9%), whereas the industries that tend to have a higher number of women are Agriculture, Fishing & Hunting (100.0%), Educational Services (85.4%), and Retail Trade (76.6%).
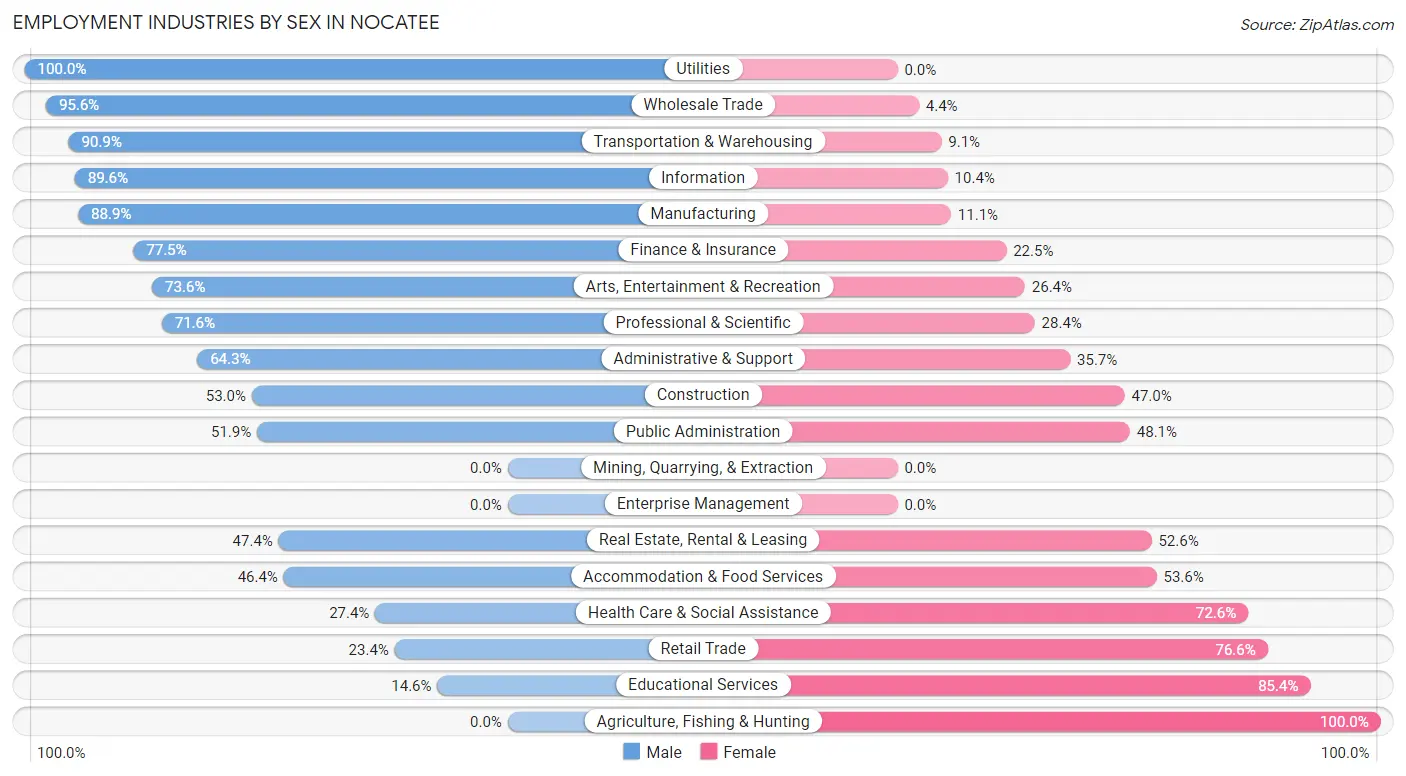
| Industry | Male | Female |
| Agriculture, Fishing & Hunting | 0 (0.0%) | 96 (100.0%) |
| Mining, Quarrying, & Extraction | 0 (0.0%) | 0 (0.0%) |
| Construction | 338 (53.0%) | 300 (47.0%) |
| Manufacturing | 249 (88.9%) | 31 (11.1%) |
| Wholesale Trade | 194 (95.6%) | 9 (4.4%) |
| Retail Trade | 201 (23.4%) | 658 (76.6%) |
| Transportation & Warehousing | 200 (90.9%) | 20 (9.1%) |
| Utilities | 85 (100.0%) | 0 (0.0%) |
| Information | 155 (89.6%) | 18 (10.4%) |
| Finance & Insurance | 860 (77.5%) | 250 (22.5%) |
| Real Estate, Rental & Leasing | 110 (47.4%) | 122 (52.6%) |
| Professional & Scientific | 1,197 (71.6%) | 475 (28.4%) |
| Enterprise Management | 0 (0.0%) | 0 (0.0%) |
| Administrative & Support | 329 (64.3%) | 183 (35.7%) |
| Educational Services | 105 (14.6%) | 616 (85.4%) |
| Health Care & Social Assistance | 265 (27.4%) | 701 (72.6%) |
| Arts, Entertainment & Recreation | 240 (73.6%) | 86 (26.4%) |
| Accommodation & Food Services | 83 (46.4%) | 96 (53.6%) |
| Public Administration | 110 (51.9%) | 102 (48.1%) |
| Total | 4,893 (54.7%) | 4,046 (45.3%) |
Education in Nocatee
School Enrollment in Nocatee
The most common levels of schooling among the 5,186 students in Nocatee are middle school (1,411 | 27.2%), elementary school (1,270 | 24.5%), and high school (858 | 16.5%).
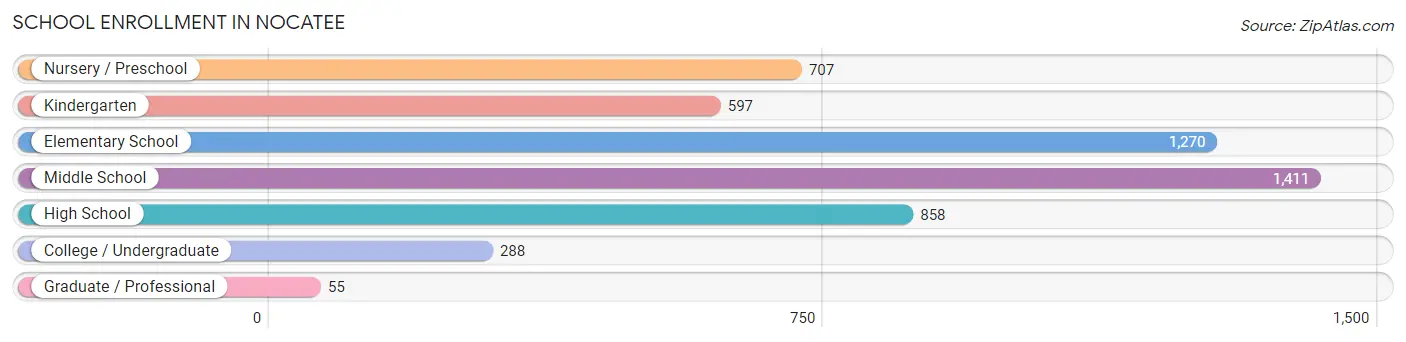
| School Level | # Students | % Students |
| Nursery / Preschool | 707 | 13.6% |
| Kindergarten | 597 | 11.5% |
| Elementary School | 1,270 | 24.5% |
| Middle School | 1,411 | 27.2% |
| High School | 858 | 16.5% |
| College / Undergraduate | 288 | 5.6% |
| Graduate / Professional | 55 | 1.1% |
| Total | 5,186 | 100.0% |
School Enrollment by Age by Funding Source in Nocatee
Out of a total of 5,186 students who are enrolled in schools in Nocatee, 721 (13.9%) attend a private institution, while the remaining 4,465 (86.1%) are enrolled in public schools. The age group of 3 to 4 year olds has the highest likelihood of being enrolled in private schools, with 276 (54.0% in the age bracket) enrolled. Conversely, the age group of 18 to 19 year olds has the lowest likelihood of being enrolled in a private school, with 197 (100.0% in the age bracket) attending a public institution.
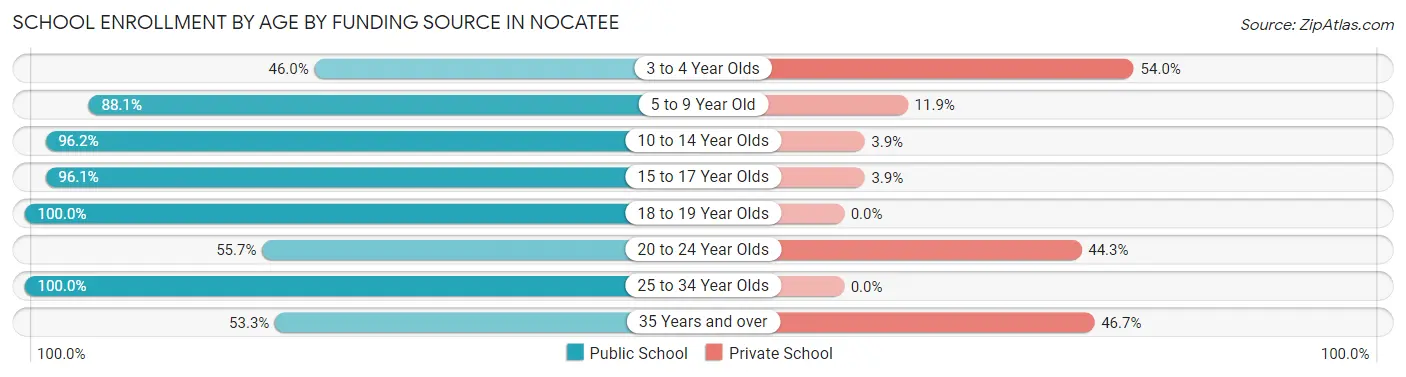
| Age Bracket | Public School | Private School |
| 3 to 4 Year Olds | 235 (46.0%) | 276 (54.0%) |
| 5 to 9 Year Old | 1,699 (88.1%) | 230 (11.9%) |
| 10 to 14 Year Olds | 1,625 (96.2%) | 65 (3.8%) |
| 15 to 17 Year Olds | 496 (96.1%) | 20 (3.9%) |
| 18 to 19 Year Olds | 197 (100.0%) | 0 (0.0%) |
| 20 to 24 Year Olds | 68 (55.7%) | 54 (44.3%) |
| 25 to 34 Year Olds | 56 (100.0%) | 0 (0.0%) |
| 35 Years and over | 88 (53.3%) | 77 (46.7%) |
| Total | 4,465 (86.1%) | 721 (13.9%) |
Educational Attainment by Field of Study in Nocatee
Business (2,338 | 21.1%), engineering (1,141 | 10.3%), education (1,038 | 9.4%), arts & humanities (960 | 8.7%), and science & technology (812 | 7.3%) are the most common fields of study among 11,055 individuals in Nocatee who have obtained a bachelor's degree or higher.
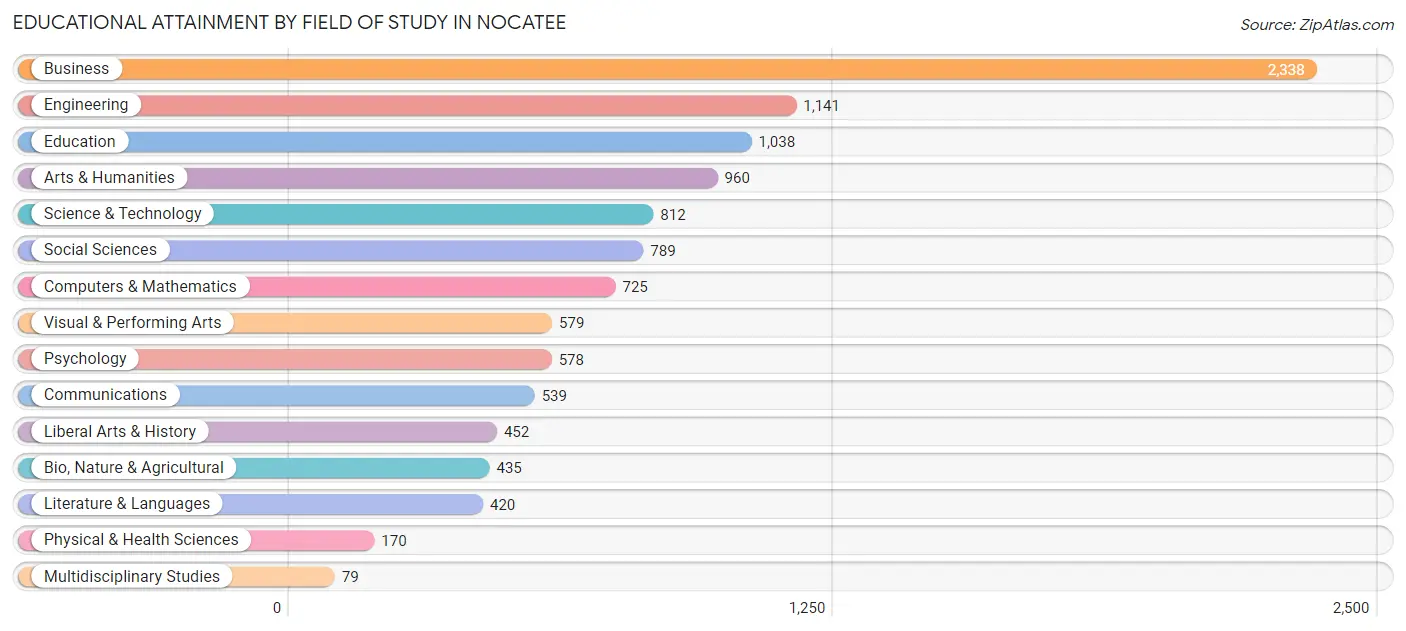
| Field of Study | # Graduates | % Graduates |
| Computers & Mathematics | 725 | 6.6% |
| Bio, Nature & Agricultural | 435 | 3.9% |
| Physical & Health Sciences | 170 | 1.5% |
| Psychology | 578 | 5.2% |
| Social Sciences | 789 | 7.1% |
| Engineering | 1,141 | 10.3% |
| Multidisciplinary Studies | 79 | 0.7% |
| Science & Technology | 812 | 7.3% |
| Business | 2,338 | 21.1% |
| Education | 1,038 | 9.4% |
| Literature & Languages | 420 | 3.8% |
| Liberal Arts & History | 452 | 4.1% |
| Visual & Performing Arts | 579 | 5.2% |
| Communications | 539 | 4.9% |
| Arts & Humanities | 960 | 8.7% |
| Total | 11,055 | 100.0% |
Transportation & Commute in Nocatee
Vehicle Availability by Sex in Nocatee
The most prevalent vehicle ownership categories in Nocatee are males with 2 vehicles (3,098, accounting for 63.6%) and females with 2 vehicles (2,328, making up 79.0%).
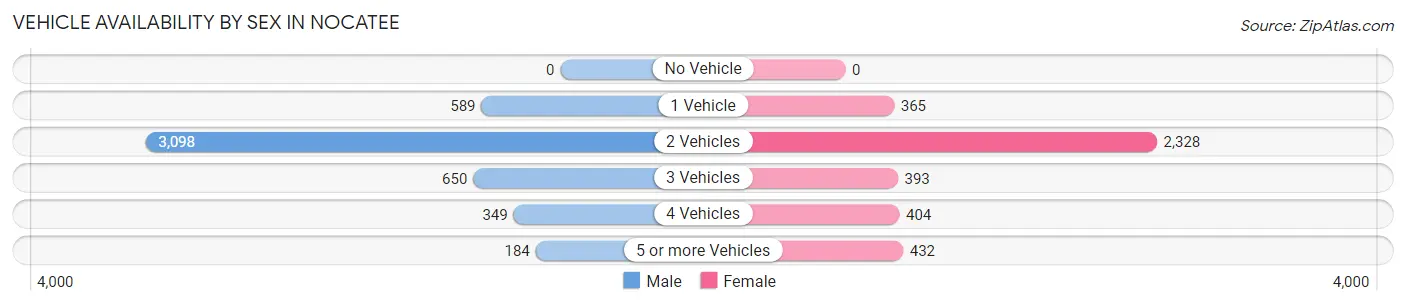
| Vehicles Available | Male | Female |
| No Vehicle | 0 (0.0%) | 0 (0.0%) |
| 1 Vehicle | 589 (12.1%) | 365 (9.3%) |
| 2 Vehicles | 3,098 (63.6%) | 2,328 (59.4%) |
| 3 Vehicles | 650 (13.4%) | 393 (10.0%) |
| 4 Vehicles | 349 (7.2%) | 404 (10.3%) |
| 5 or more Vehicles | 184 (3.8%) | 432 (11.0%) |
| Total | 4,870 (100.0%) | 3,922 (100.0%) |
Commute Time in Nocatee
The most frequently occuring commute durations in Nocatee are 30 to 34 minutes (1,264 commuters, 21.7%), 20 to 24 minutes (988 commuters, 17.0%), and 45 to 59 minutes (708 commuters, 12.2%).
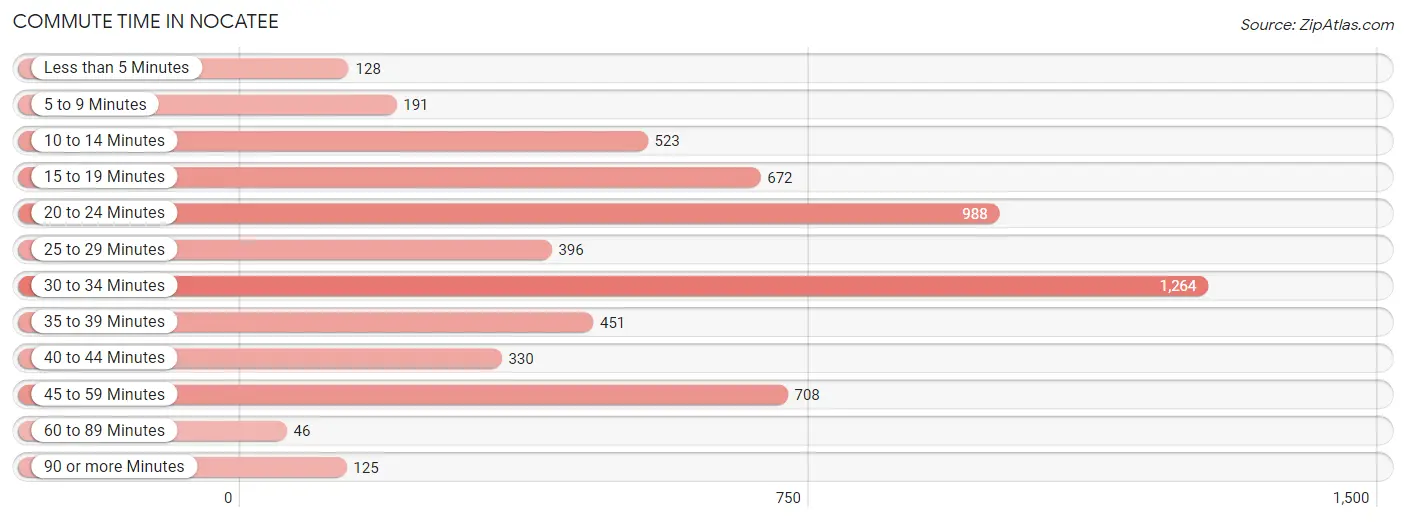
| Commute Time | # Commuters | % Commuters |
| Less than 5 Minutes | 128 | 2.2% |
| 5 to 9 Minutes | 191 | 3.3% |
| 10 to 14 Minutes | 523 | 9.0% |
| 15 to 19 Minutes | 672 | 11.5% |
| 20 to 24 Minutes | 988 | 17.0% |
| 25 to 29 Minutes | 396 | 6.8% |
| 30 to 34 Minutes | 1,264 | 21.7% |
| 35 to 39 Minutes | 451 | 7.7% |
| 40 to 44 Minutes | 330 | 5.7% |
| 45 to 59 Minutes | 708 | 12.2% |
| 60 to 89 Minutes | 46 | 0.8% |
| 90 or more Minutes | 125 | 2.1% |
Commute Time by Sex in Nocatee
The most common commute times in Nocatee are 30 to 34 minutes (623 commuters, 20.8%) for males and 30 to 34 minutes (641 commuters, 22.7%) for females.
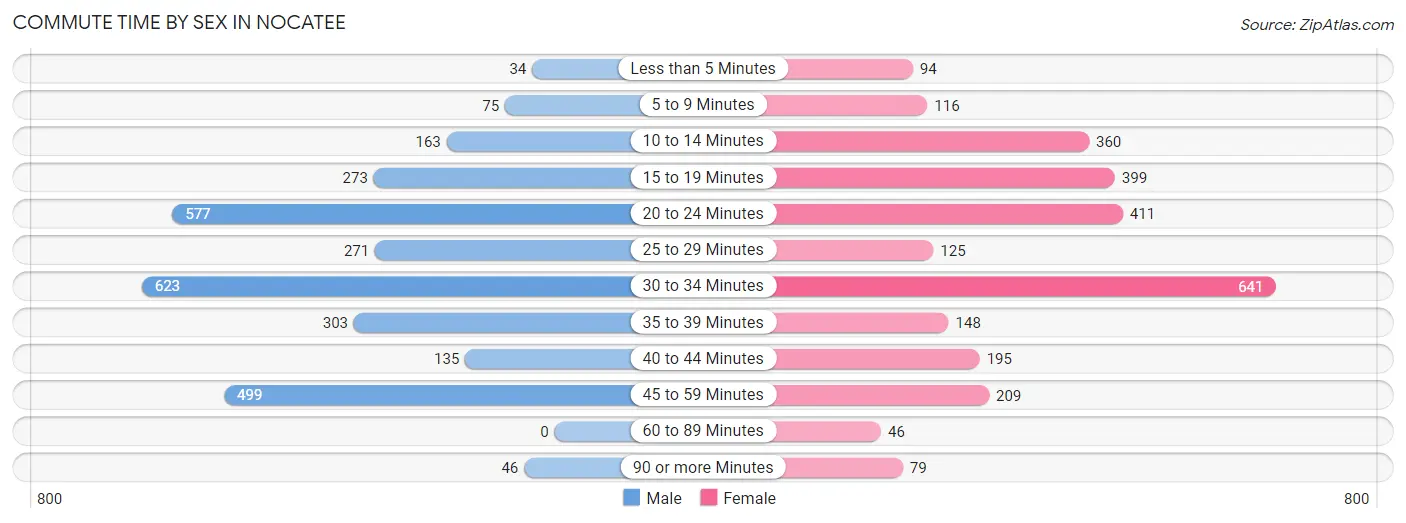
| Commute Time | Male | Female |
| Less than 5 Minutes | 34 (1.1%) | 94 (3.3%) |
| 5 to 9 Minutes | 75 (2.5%) | 116 (4.1%) |
| 10 to 14 Minutes | 163 (5.4%) | 360 (12.8%) |
| 15 to 19 Minutes | 273 (9.1%) | 399 (14.1%) |
| 20 to 24 Minutes | 577 (19.2%) | 411 (14.6%) |
| 25 to 29 Minutes | 271 (9.0%) | 125 (4.4%) |
| 30 to 34 Minutes | 623 (20.8%) | 641 (22.7%) |
| 35 to 39 Minutes | 303 (10.1%) | 148 (5.2%) |
| 40 to 44 Minutes | 135 (4.5%) | 195 (6.9%) |
| 45 to 59 Minutes | 499 (16.6%) | 209 (7.4%) |
| 60 to 89 Minutes | 0 (0.0%) | 46 (1.6%) |
| 90 or more Minutes | 46 (1.5%) | 79 (2.8%) |
Time of Departure to Work by Sex in Nocatee
The most frequent times of departure to work in Nocatee are 8:00 AM to 8:29 AM (859, 28.6%) for males and 8:00 AM to 8:29 AM (518, 18.3%) for females.
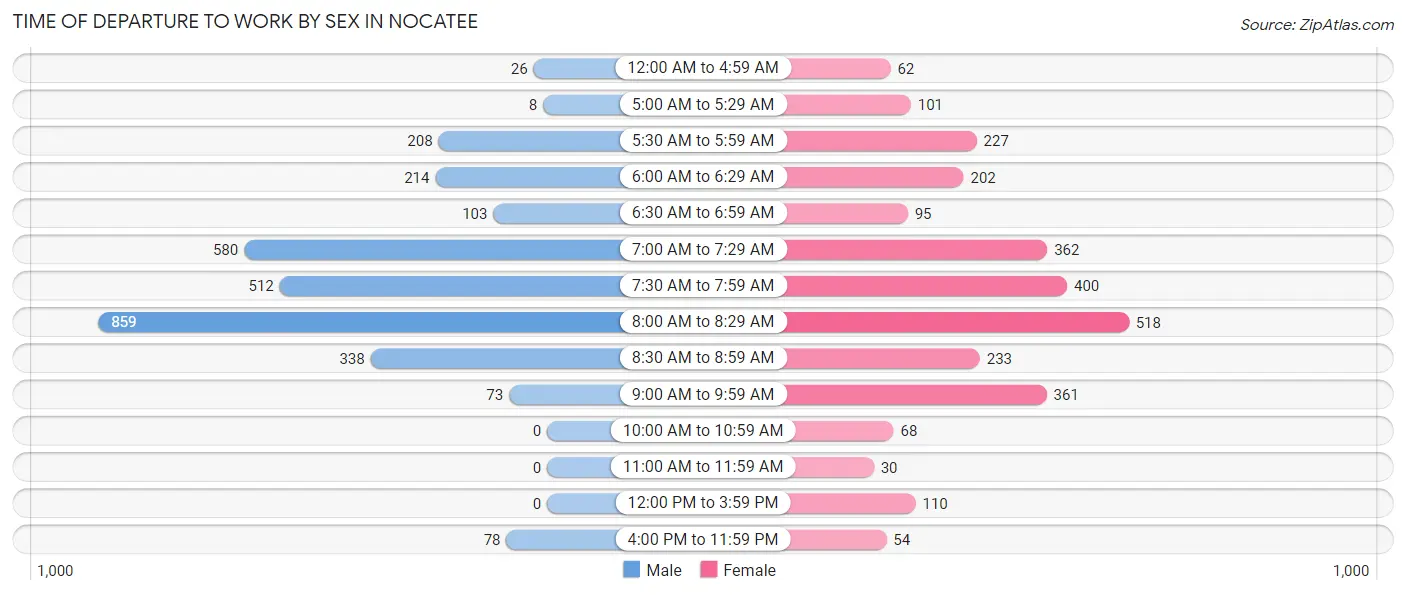
| Time of Departure | Male | Female |
| 12:00 AM to 4:59 AM | 26 (0.9%) | 62 (2.2%) |
| 5:00 AM to 5:29 AM | 8 (0.3%) | 101 (3.6%) |
| 5:30 AM to 5:59 AM | 208 (6.9%) | 227 (8.0%) |
| 6:00 AM to 6:29 AM | 214 (7.1%) | 202 (7.2%) |
| 6:30 AM to 6:59 AM | 103 (3.4%) | 95 (3.4%) |
| 7:00 AM to 7:29 AM | 580 (19.3%) | 362 (12.8%) |
| 7:30 AM to 7:59 AM | 512 (17.1%) | 400 (14.2%) |
| 8:00 AM to 8:29 AM | 859 (28.6%) | 518 (18.3%) |
| 8:30 AM to 8:59 AM | 338 (11.3%) | 233 (8.3%) |
| 9:00 AM to 9:59 AM | 73 (2.4%) | 361 (12.8%) |
| 10:00 AM to 10:59 AM | 0 (0.0%) | 68 (2.4%) |
| 11:00 AM to 11:59 AM | 0 (0.0%) | 30 (1.1%) |
| 12:00 PM to 3:59 PM | 0 (0.0%) | 110 (3.9%) |
| 4:00 PM to 11:59 PM | 78 (2.6%) | 54 (1.9%) |
| Total | 2,999 (100.0%) | 2,823 (100.0%) |
Housing Occupancy in Nocatee
Occupancy by Ownership in Nocatee
Of the total 7,641 dwellings in Nocatee, owner-occupied units account for 6,560 (85.9%), while renter-occupied units make up 1,081 (14.1%).
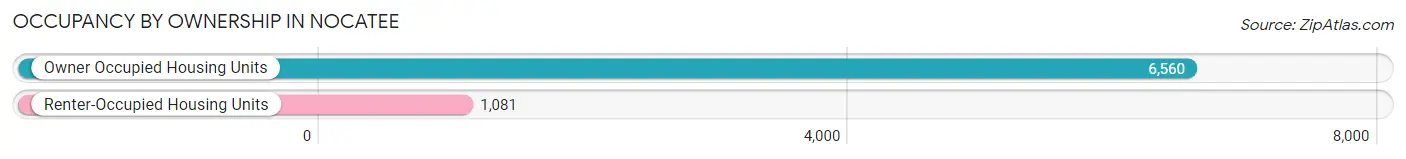
| Occupancy | # Housing Units | % Housing Units |
| Owner Occupied Housing Units | 6,560 | 85.9% |
| Renter-Occupied Housing Units | 1,081 | 14.1% |
| Total Occupied Housing Units | 7,641 | 100.0% |
Occupancy by Household Size in Nocatee
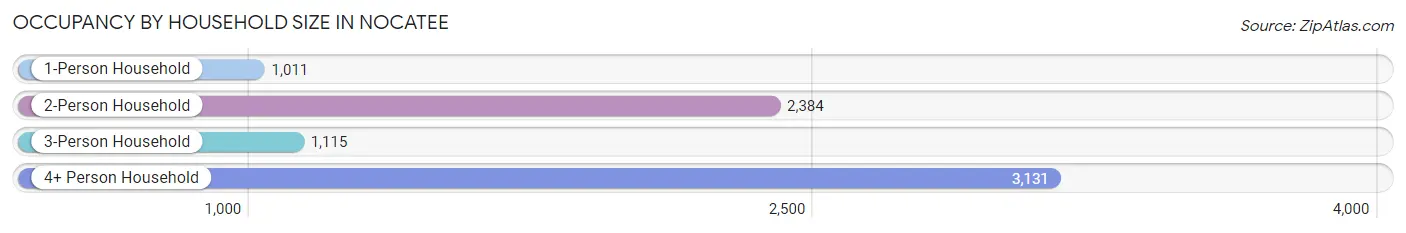
| Household Size | # Housing Units | % Housing Units |
| 1-Person Household | 1,011 | 13.2% |
| 2-Person Household | 2,384 | 31.2% |
| 3-Person Household | 1,115 | 14.6% |
| 4+ Person Household | 3,131 | 41.0% |
| Total Housing Units | 7,641 | 100.0% |
Occupancy by Ownership by Household Size in Nocatee
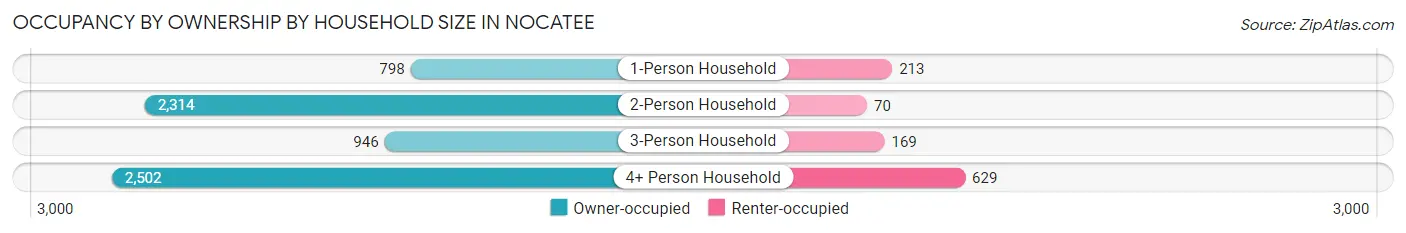
| Household Size | Owner-occupied | Renter-occupied |
| 1-Person Household | 798 (78.9%) | 213 (21.1%) |
| 2-Person Household | 2,314 (97.1%) | 70 (2.9%) |
| 3-Person Household | 946 (84.8%) | 169 (15.2%) |
| 4+ Person Household | 2,502 (79.9%) | 629 (20.1%) |
| Total Housing Units | 6,560 (85.9%) | 1,081 (14.1%) |
Occupancy by Educational Attainment in Nocatee
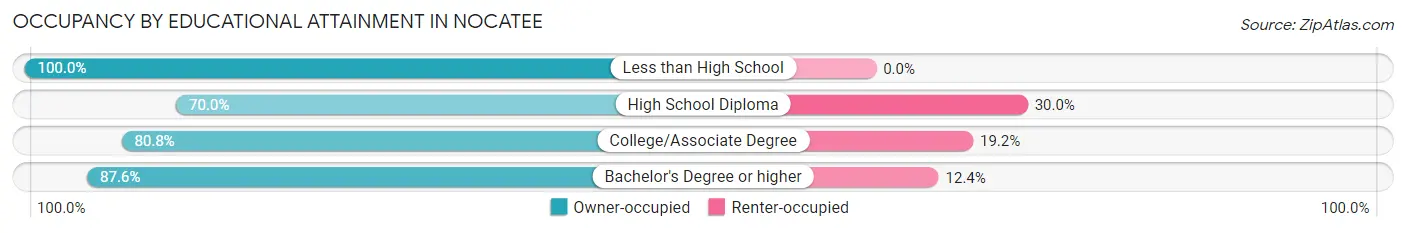
| Household Size | Owner-occupied | Renter-occupied |
| Less than High School | 109 (100.0%) | 0 (0.0%) |
| High School Diploma | 163 (70.0%) | 70 (30.0%) |
| College/Associate Degree | 1,270 (80.8%) | 302 (19.2%) |
| Bachelor's Degree or higher | 5,018 (87.6%) | 709 (12.4%) |
Occupancy by Age of Householder in Nocatee
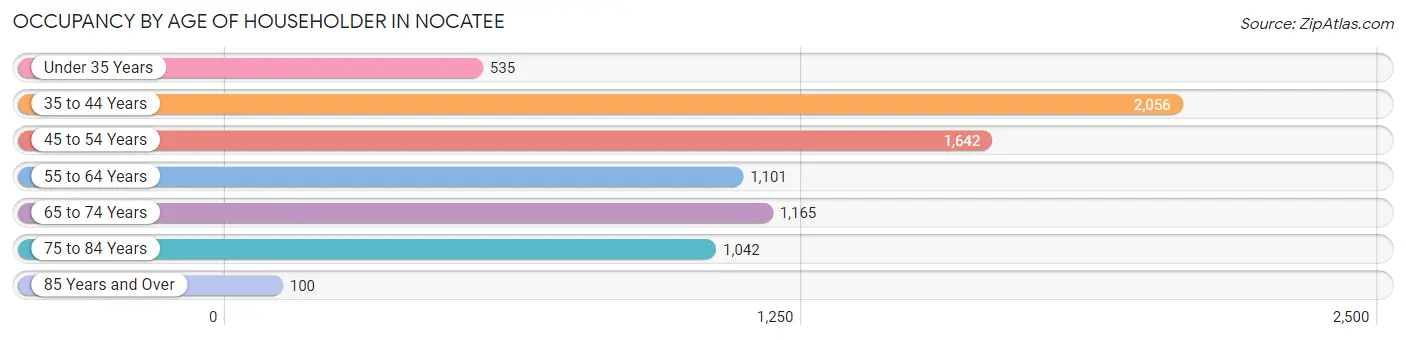
| Age Bracket | # Households | % Households |
| Under 35 Years | 535 | 7.0% |
| 35 to 44 Years | 2,056 | 26.9% |
| 45 to 54 Years | 1,642 | 21.5% |
| 55 to 64 Years | 1,101 | 14.4% |
| 65 to 74 Years | 1,165 | 15.2% |
| 75 to 84 Years | 1,042 | 13.6% |
| 85 Years and Over | 100 | 1.3% |
| Total | 7,641 | 100.0% |
Housing Finances in Nocatee
Median Income by Occupancy in Nocatee
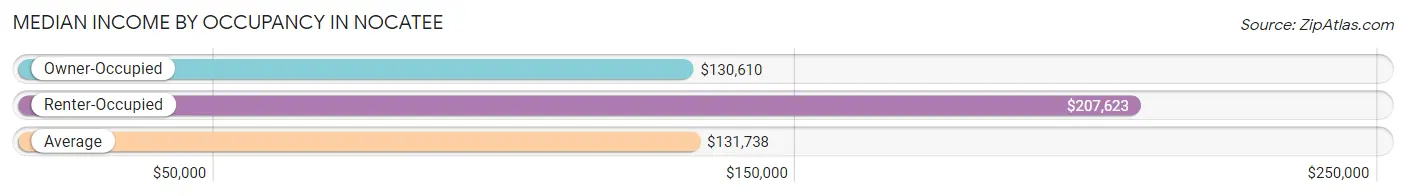
| Occupancy Type | # Households | Median Income |
| Owner-Occupied | 6,560 (85.9%) | $130,610 |
| Renter-Occupied | 1,081 (14.1%) | $207,623 |
| Average | 7,641 (100.0%) | $131,738 |
Occupancy by Householder Income Bracket in Nocatee
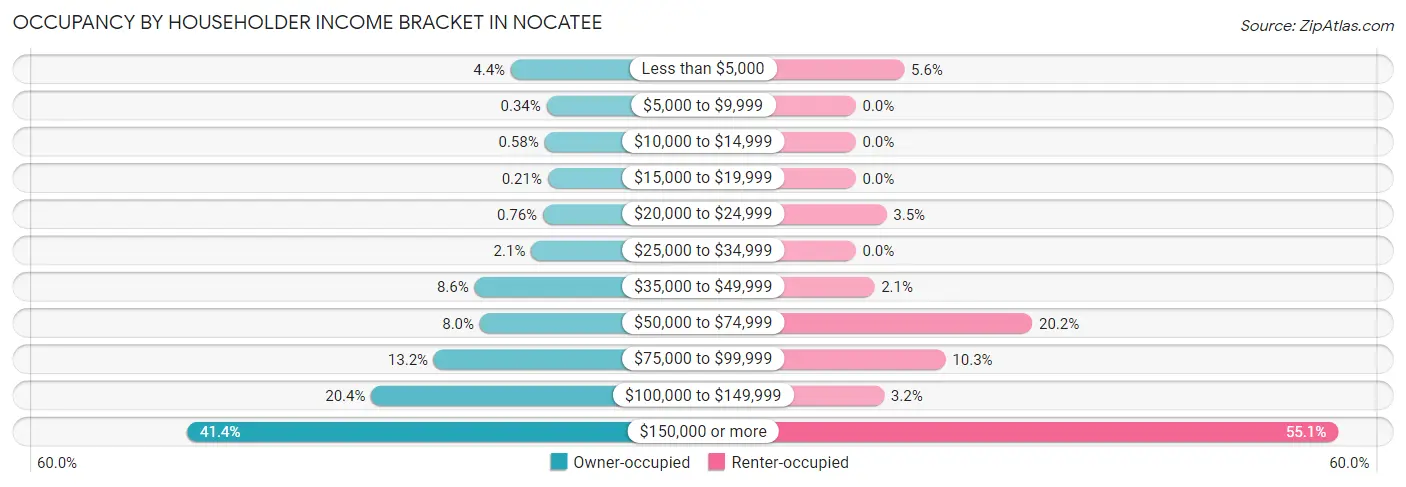
| Income Bracket | Owner-occupied | Renter-occupied |
| Less than $5,000 | 290 (4.4%) | 60 (5.6%) |
| $5,000 to $9,999 | 22 (0.3%) | 0 (0.0%) |
| $10,000 to $14,999 | 38 (0.6%) | 0 (0.0%) |
| $15,000 to $19,999 | 14 (0.2%) | 0 (0.0%) |
| $20,000 to $24,999 | 50 (0.8%) | 38 (3.5%) |
| $25,000 to $34,999 | 138 (2.1%) | 0 (0.0%) |
| $35,000 to $49,999 | 563 (8.6%) | 23 (2.1%) |
| $50,000 to $74,999 | 523 (8.0%) | 218 (20.2%) |
| $75,000 to $99,999 | 867 (13.2%) | 111 (10.3%) |
| $100,000 to $149,999 | 1,337 (20.4%) | 35 (3.2%) |
| $150,000 or more | 2,718 (41.4%) | 596 (55.1%) |
| Total | 6,560 (100.0%) | 1,081 (100.0%) |
Monthly Housing Cost Tiers in Nocatee
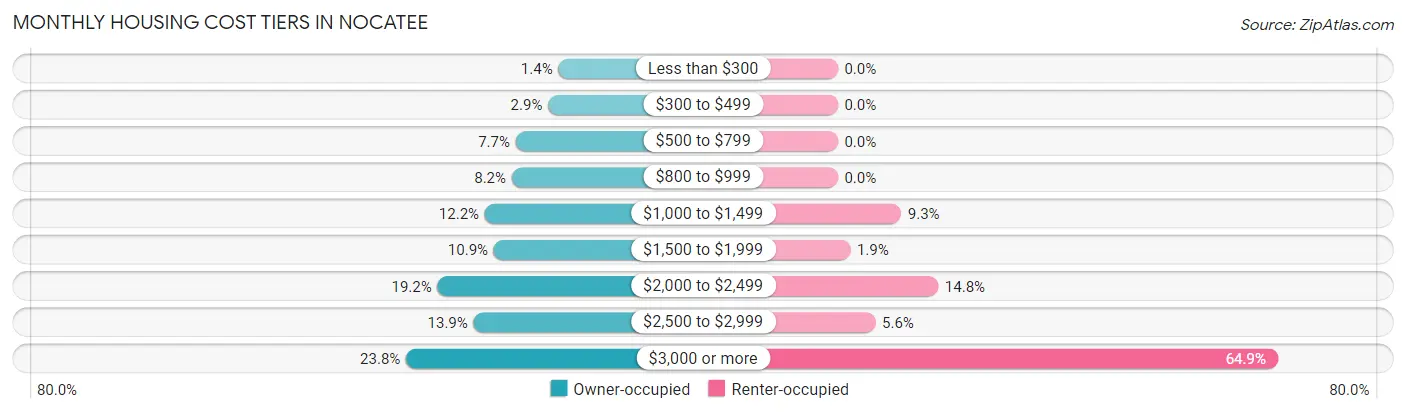
| Monthly Cost | Owner-occupied | Renter-occupied |
| Less than $300 | 89 (1.4%) | 0 (0.0%) |
| $300 to $499 | 188 (2.9%) | 0 (0.0%) |
| $500 to $799 | 502 (7.6%) | 0 (0.0%) |
| $800 to $999 | 540 (8.2%) | 0 (0.0%) |
| $1,000 to $1,499 | 800 (12.2%) | 101 (9.3%) |
| $1,500 to $1,999 | 713 (10.9%) | 20 (1.8%) |
| $2,000 to $2,499 | 1,258 (19.2%) | 160 (14.8%) |
| $2,500 to $2,999 | 909 (13.9%) | 60 (5.6%) |
| $3,000 or more | 1,561 (23.8%) | 701 (64.8%) |
| Total | 6,560 (100.0%) | 1,081 (100.0%) |
Physical Housing Characteristics in Nocatee
Housing Structures in Nocatee
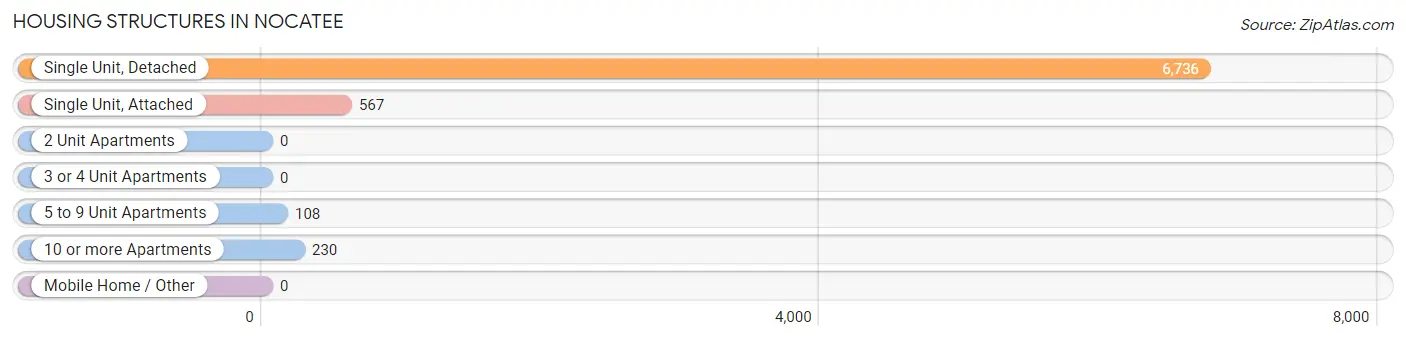
| Structure Type | # Housing Units | % Housing Units |
| Single Unit, Detached | 6,736 | 88.2% |
| Single Unit, Attached | 567 | 7.4% |
| 2 Unit Apartments | 0 | 0.0% |
| 3 or 4 Unit Apartments | 0 | 0.0% |
| 5 to 9 Unit Apartments | 108 | 1.4% |
| 10 or more Apartments | 230 | 3.0% |
| Mobile Home / Other | 0 | 0.0% |
| Total | 7,641 | 100.0% |
Housing Structures by Occupancy in Nocatee
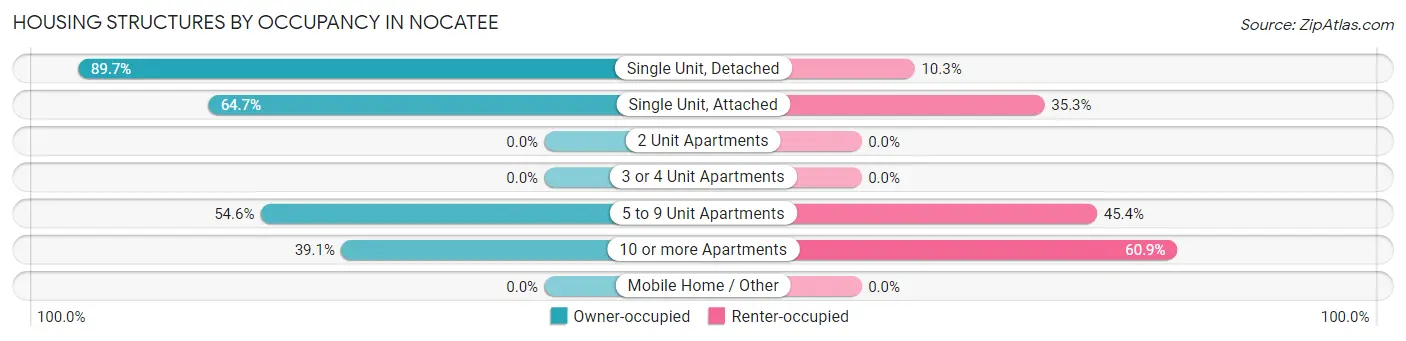
| Structure Type | Owner-occupied | Renter-occupied |
| Single Unit, Detached | 6,044 (89.7%) | 692 (10.3%) |
| Single Unit, Attached | 367 (64.7%) | 200 (35.3%) |
| 2 Unit Apartments | 0 (0.0%) | 0 (0.0%) |
| 3 or 4 Unit Apartments | 0 (0.0%) | 0 (0.0%) |
| 5 to 9 Unit Apartments | 59 (54.6%) | 49 (45.4%) |
| 10 or more Apartments | 90 (39.1%) | 140 (60.9%) |
| Mobile Home / Other | 0 (0.0%) | 0 (0.0%) |
| Total | 6,560 (85.9%) | 1,081 (14.1%) |
Housing Structures by Number of Rooms in Nocatee
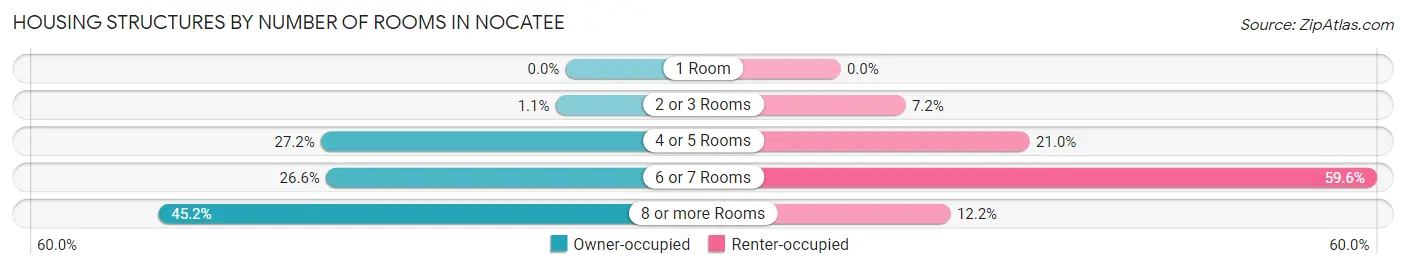
| Number of Rooms | Owner-occupied | Renter-occupied |
| 1 Room | 0 (0.0%) | 0 (0.0%) |
| 2 or 3 Rooms | 72 (1.1%) | 78 (7.2%) |
| 4 or 5 Rooms | 1,782 (27.2%) | 227 (21.0%) |
| 6 or 7 Rooms | 1,744 (26.6%) | 644 (59.6%) |
| 8 or more Rooms | 2,962 (45.2%) | 132 (12.2%) |
| Total | 6,560 (100.0%) | 1,081 (100.0%) |
Housing Structure by Heating Type in Nocatee
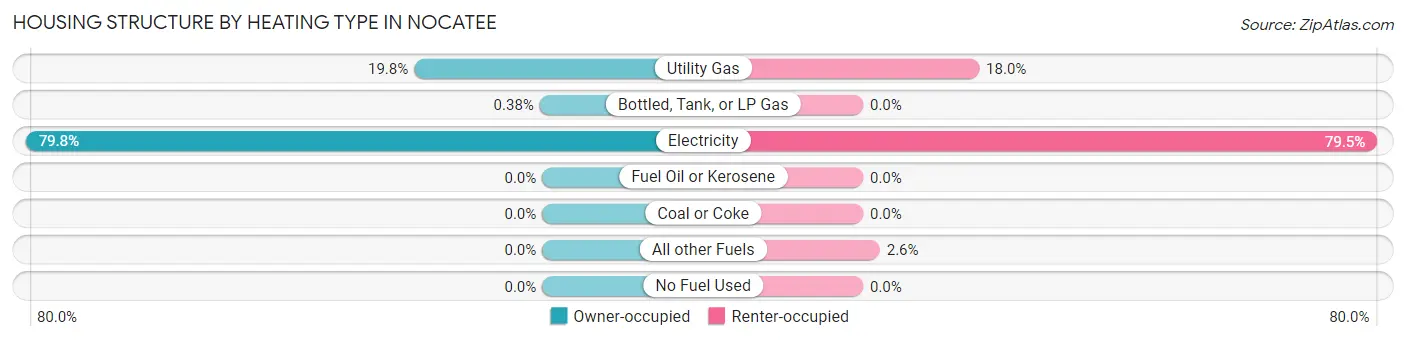
| Heating Type | Owner-occupied | Renter-occupied |
| Utility Gas | 1,299 (19.8%) | 194 (17.9%) |
| Bottled, Tank, or LP Gas | 25 (0.4%) | 0 (0.0%) |
| Electricity | 5,236 (79.8%) | 859 (79.5%) |
| Fuel Oil or Kerosene | 0 (0.0%) | 0 (0.0%) |
| Coal or Coke | 0 (0.0%) | 0 (0.0%) |
| All other Fuels | 0 (0.0%) | 28 (2.6%) |
| No Fuel Used | 0 (0.0%) | 0 (0.0%) |
| Total | 6,560 (100.0%) | 1,081 (100.0%) |
Household Vehicle Usage in Nocatee
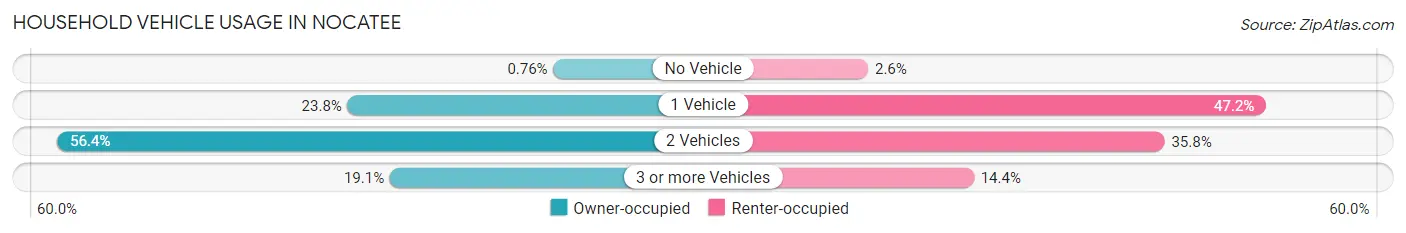
| Vehicles per Household | Owner-occupied | Renter-occupied |
| No Vehicle | 50 (0.8%) | 28 (2.6%) |
| 1 Vehicle | 1,562 (23.8%) | 510 (47.2%) |
| 2 Vehicles | 3,697 (56.4%) | 387 (35.8%) |
| 3 or more Vehicles | 1,251 (19.1%) | 156 (14.4%) |
| Total | 6,560 (100.0%) | 1,081 (100.0%) |
Real Estate & Mortgages in Nocatee
Real Estate and Mortgage Overview in Nocatee
| Characteristic | Without Mortgage | With Mortgage |
| Housing Units | 1,732 | 4,828 |
| Median Property Value | $534,900 | $496,900 |
| Median Household Income | $90,021 | $2,355 |
| Monthly Housing Costs | $891 | $1,561 |
| Real Estate Taxes | $5,416 | $0 |
Property Value by Mortgage Status in Nocatee
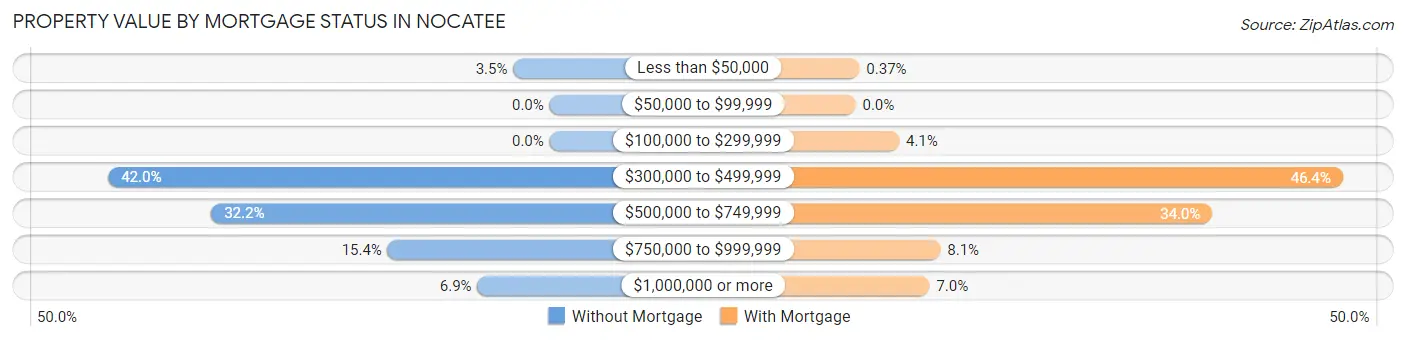
| Property Value | Without Mortgage | With Mortgage |
| Less than $50,000 | 60 (3.5%) | 18 (0.4%) |
| $50,000 to $99,999 | 0 (0.0%) | 0 (0.0%) |
| $100,000 to $299,999 | 0 (0.0%) | 200 (4.1%) |
| $300,000 to $499,999 | 728 (42.0%) | 2,240 (46.4%) |
| $500,000 to $749,999 | 558 (32.2%) | 1,640 (34.0%) |
| $750,000 to $999,999 | 267 (15.4%) | 390 (8.1%) |
| $1,000,000 or more | 119 (6.9%) | 340 (7.0%) |
| Total | 1,732 (100.0%) | 4,828 (100.0%) |
Household Income by Mortgage Status in Nocatee
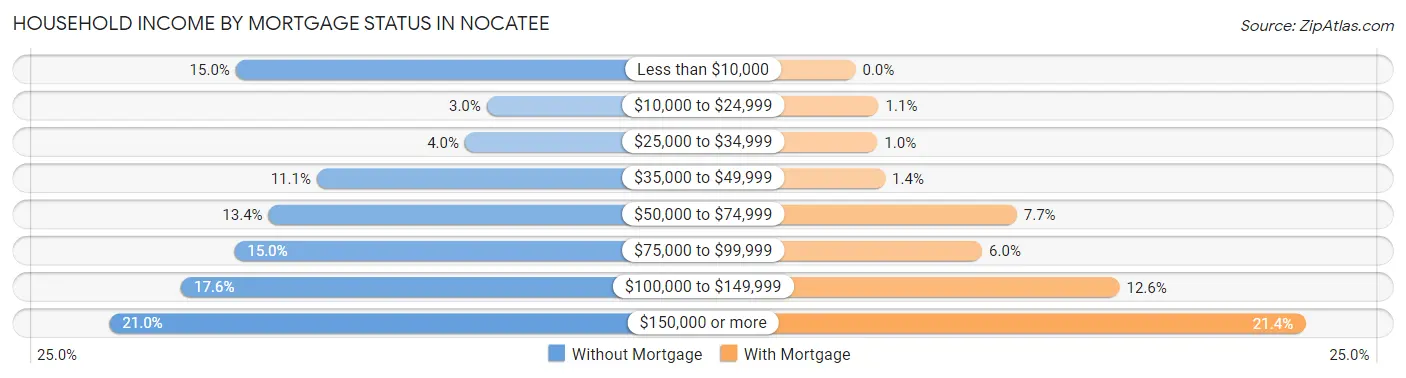
| Household Income | Without Mortgage | With Mortgage |
| Less than $10,000 | 259 (14.9%) | 0 (0.0%) |
| $10,000 to $24,999 | 52 (3.0%) | 53 (1.1%) |
| $25,000 to $34,999 | 70 (4.0%) | 50 (1.0%) |
| $35,000 to $49,999 | 192 (11.1%) | 68 (1.4%) |
| $50,000 to $74,999 | 232 (13.4%) | 371 (7.7%) |
| $75,000 to $99,999 | 260 (15.0%) | 291 (6.0%) |
| $100,000 to $149,999 | 304 (17.5%) | 607 (12.6%) |
| $150,000 or more | 363 (21.0%) | 1,033 (21.4%) |
| Total | 1,732 (100.0%) | 4,828 (100.0%) |
Property Value to Household Income Ratio in Nocatee
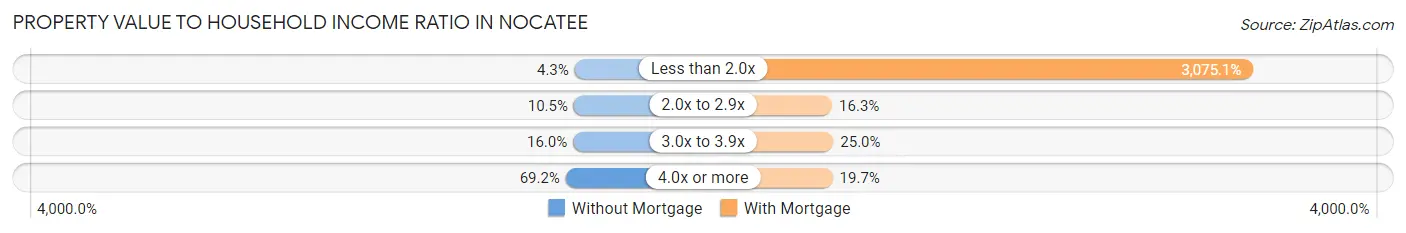
| Value-to-Income Ratio | Without Mortgage | With Mortgage |
| Less than 2.0x | 75 (4.3%) | 148,464 (3,075.1%) |
| 2.0x to 2.9x | 181 (10.4%) | 788 (16.3%) |
| 3.0x to 3.9x | 277 (16.0%) | 1,209 (25.0%) |
| 4.0x or more | 1,199 (69.2%) | 953 (19.7%) |
| Total | 1,732 (100.0%) | 4,828 (100.0%) |
Real Estate Taxes by Mortgage Status in Nocatee
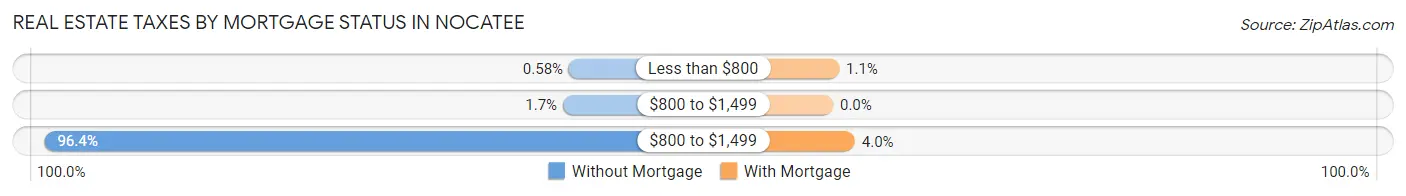
| Property Taxes | Without Mortgage | With Mortgage |
| Less than $800 | 10 (0.6%) | 53 (1.1%) |
| $800 to $1,499 | 29 (1.7%) | 0 (0.0%) |
| $800 to $1,499 | 1,669 (96.4%) | 192 (4.0%) |
| Total | 1,732 (100.0%) | 4,828 (100.0%) |
Health & Disability in Nocatee
Health Insurance Coverage by Age in Nocatee
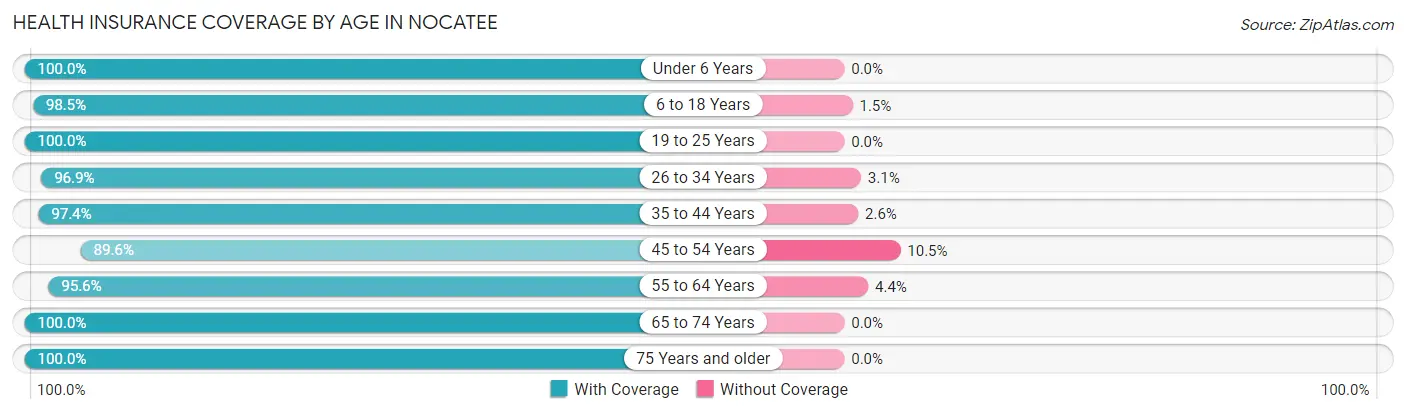
| Age Bracket | With Coverage | Without Coverage |
| Under 6 Years | 2,740 (100.0%) | 0 (0.0%) |
| 6 to 18 Years | 4,040 (98.5%) | 63 (1.5%) |
| 19 to 25 Years | 772 (100.0%) | 0 (0.0%) |
| 26 to 34 Years | 1,252 (96.9%) | 40 (3.1%) |
| 35 to 44 Years | 4,277 (97.4%) | 113 (2.6%) |
| 45 to 54 Years | 2,477 (89.5%) | 289 (10.4%) |
| 55 to 64 Years | 2,044 (95.6%) | 95 (4.4%) |
| 65 to 74 Years | 2,423 (100.0%) | 0 (0.0%) |
| 75 Years and older | 2,269 (100.0%) | 0 (0.0%) |
| Total | 22,294 (97.4%) | 600 (2.6%) |
Health Insurance Coverage by Citizenship Status in Nocatee
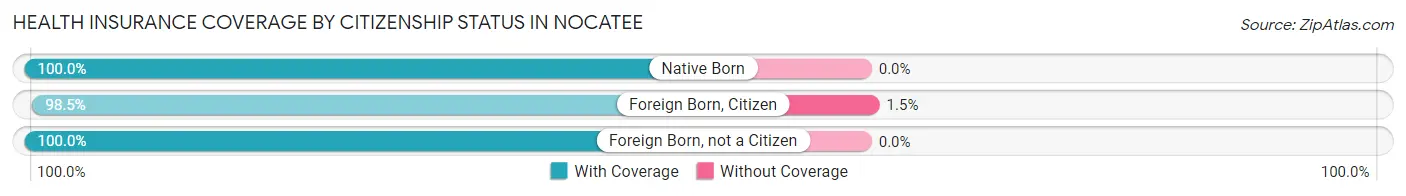
| Citizenship Status | With Coverage | Without Coverage |
| Native Born | 2,740 (100.0%) | 0 (0.0%) |
| Foreign Born, Citizen | 4,040 (98.5%) | 63 (1.5%) |
| Foreign Born, not a Citizen | 772 (100.0%) | 0 (0.0%) |
Health Insurance Coverage by Household Income in Nocatee
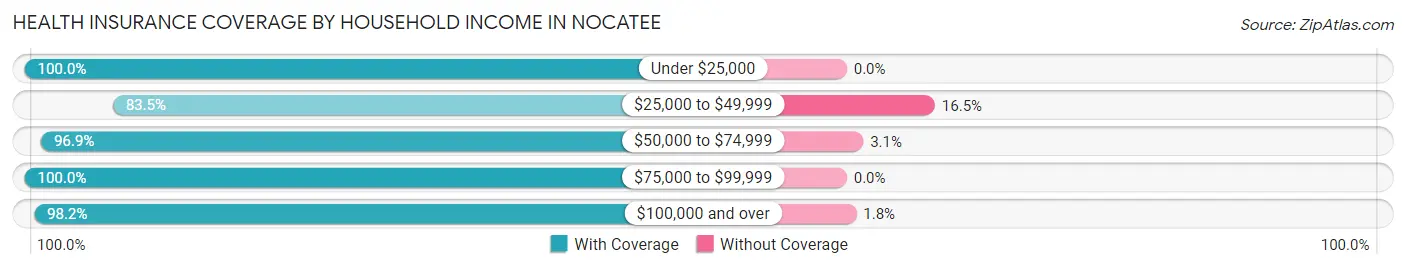
| Household Income | With Coverage | Without Coverage |
| Under $25,000 | 719 (100.0%) | 0 (0.0%) |
| $25,000 to $49,999 | 1,254 (83.5%) | 248 (16.5%) |
| $50,000 to $74,999 | 2,012 (96.9%) | 64 (3.1%) |
| $75,000 to $99,999 | 2,464 (100.0%) | 0 (0.0%) |
| $100,000 and over | 15,845 (98.2%) | 288 (1.8%) |
Public vs Private Health Insurance Coverage by Age in Nocatee
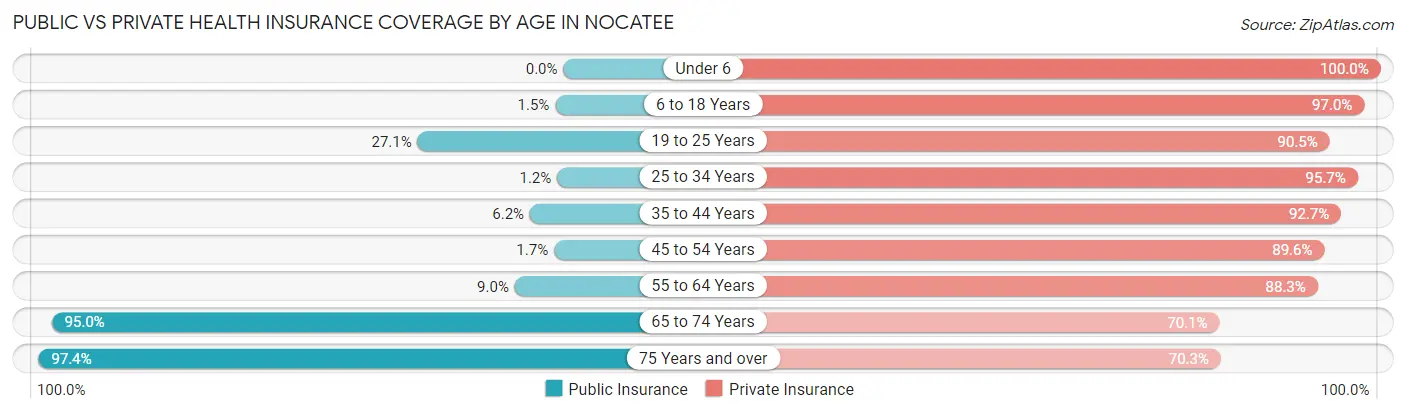
| Age Bracket | Public Insurance | Private Insurance |
| Under 6 | 0 (0.0%) | 2,740 (100.0%) |
| 6 to 18 Years | 62 (1.5%) | 3,978 (97.0%) |
| 19 to 25 Years | 209 (27.1%) | 699 (90.5%) |
| 25 to 34 Years | 15 (1.2%) | 1,237 (95.7%) |
| 35 to 44 Years | 272 (6.2%) | 4,068 (92.7%) |
| 45 to 54 Years | 48 (1.7%) | 2,477 (89.5%) |
| 55 to 64 Years | 193 (9.0%) | 1,889 (88.3%) |
| 65 to 74 Years | 2,302 (95.0%) | 1,698 (70.1%) |
| 75 Years and over | 2,211 (97.4%) | 1,596 (70.3%) |
| Total | 5,312 (23.2%) | 20,382 (89.0%) |
Disability Status by Sex by Age in Nocatee
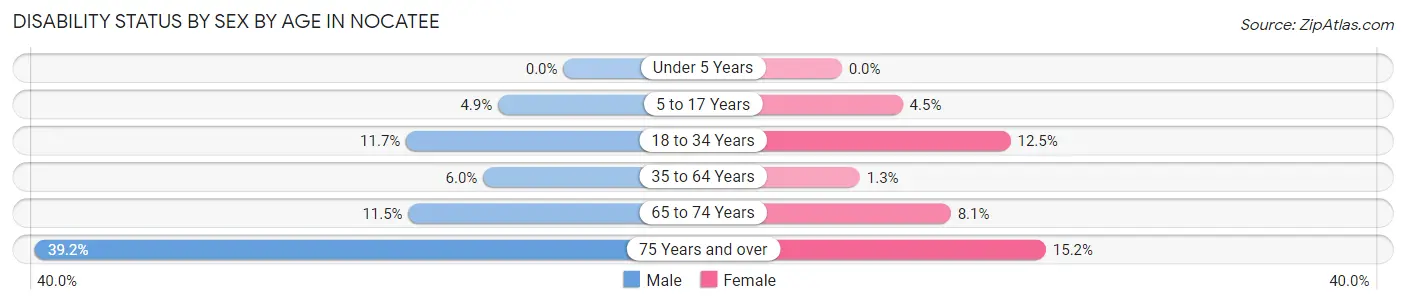
| Age Bracket | Male | Female |
| Under 5 Years | 0 (0.0%) | 0 (0.0%) |
| 5 to 17 Years | 114 (4.9%) | 85 (4.5%) |
| 18 to 34 Years | 136 (11.7%) | 145 (12.5%) |
| 35 to 64 Years | 273 (5.9%) | 63 (1.3%) |
| 65 to 74 Years | 128 (11.5%) | 106 (8.1%) |
| 75 Years and over | 442 (39.2%) | 173 (15.1%) |
Disability Class by Sex by Age in Nocatee
Disability Class: Hearing Difficulty
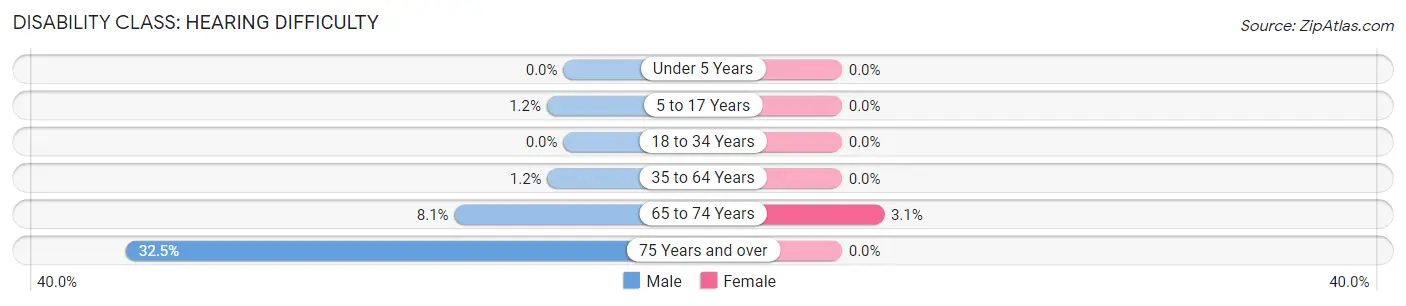
| Age Bracket | Male | Female |
| Under 5 Years | 0 (0.0%) | 0 (0.0%) |
| 5 to 17 Years | 29 (1.2%) | 0 (0.0%) |
| 18 to 34 Years | 0 (0.0%) | 0 (0.0%) |
| 35 to 64 Years | 54 (1.2%) | 0 (0.0%) |
| 65 to 74 Years | 90 (8.1%) | 41 (3.1%) |
| 75 Years and over | 366 (32.5%) | 0 (0.0%) |
Disability Class: Vision Difficulty
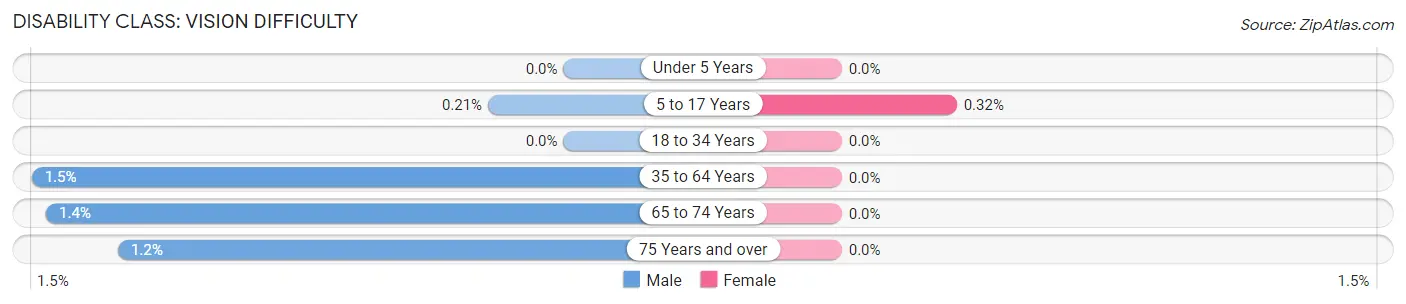
| Age Bracket | Male | Female |
| Under 5 Years | 0 (0.0%) | 0 (0.0%) |
| 5 to 17 Years | 5 (0.2%) | 6 (0.3%) |
| 18 to 34 Years | 0 (0.0%) | 0 (0.0%) |
| 35 to 64 Years | 68 (1.5%) | 0 (0.0%) |
| 65 to 74 Years | 16 (1.4%) | 0 (0.0%) |
| 75 Years and over | 14 (1.2%) | 0 (0.0%) |
Disability Class: Cognitive Difficulty
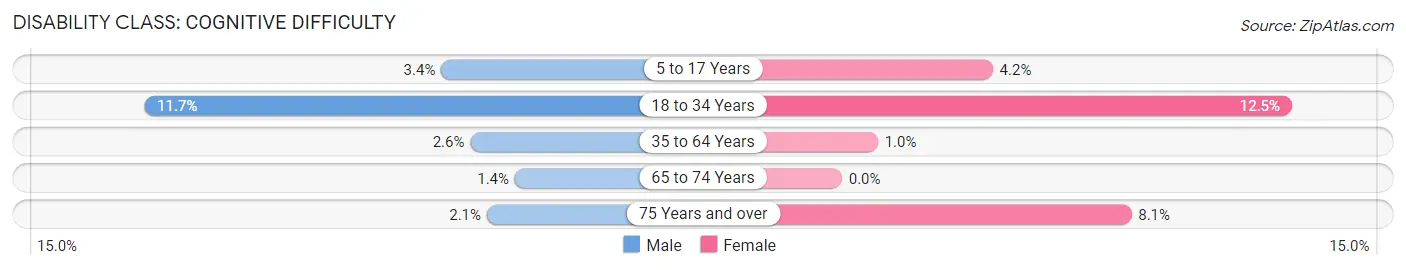
| Age Bracket | Male | Female |
| 5 to 17 Years | 80 (3.4%) | 79 (4.2%) |
| 18 to 34 Years | 136 (11.7%) | 145 (12.5%) |
| 35 to 64 Years | 119 (2.6%) | 47 (1.0%) |
| 65 to 74 Years | 15 (1.3%) | 0 (0.0%) |
| 75 Years and over | 24 (2.1%) | 92 (8.1%) |
Disability Class: Ambulatory Difficulty
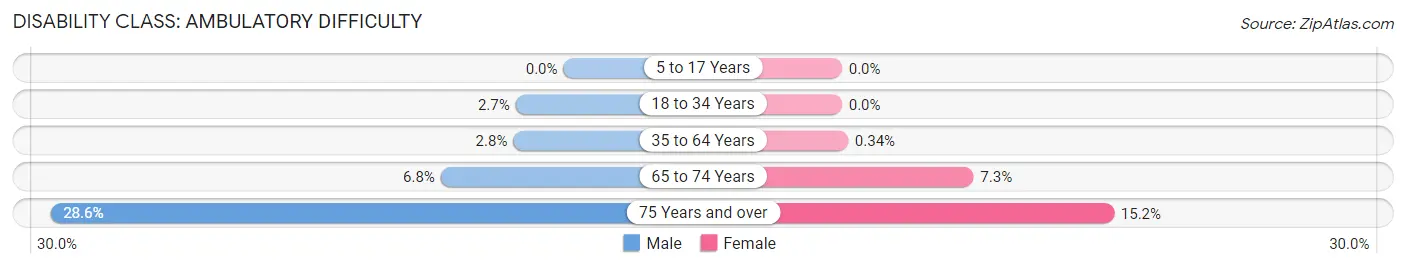
| Age Bracket | Male | Female |
| 5 to 17 Years | 0 (0.0%) | 0 (0.0%) |
| 18 to 34 Years | 31 (2.7%) | 0 (0.0%) |
| 35 to 64 Years | 128 (2.8%) | 16 (0.3%) |
| 65 to 74 Years | 76 (6.8%) | 96 (7.3%) |
| 75 Years and over | 322 (28.6%) | 173 (15.1%) |
Disability Class: Self-Care Difficulty
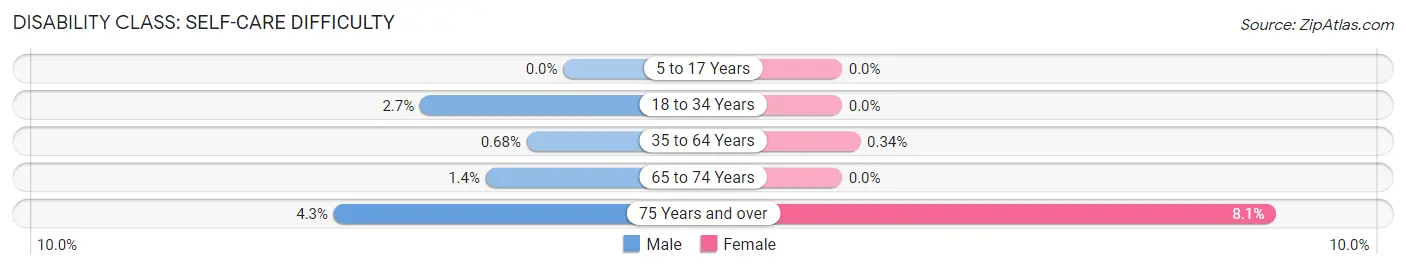
| Age Bracket | Male | Female |
| 5 to 17 Years | 0 (0.0%) | 0 (0.0%) |
| 18 to 34 Years | 31 (2.7%) | 0 (0.0%) |
| 35 to 64 Years | 31 (0.7%) | 16 (0.3%) |
| 65 to 74 Years | 16 (1.4%) | 0 (0.0%) |
| 75 Years and over | 48 (4.3%) | 92 (8.1%) |
Technology Access in Nocatee
Computing Device Access in Nocatee
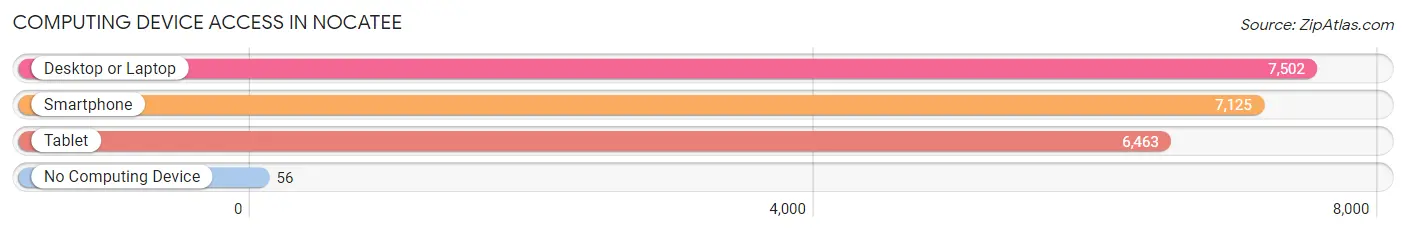
| Device Type | # Households | % Households |
| Desktop or Laptop | 7,502 | 98.2% |
| Smartphone | 7,125 | 93.2% |
| Tablet | 6,463 | 84.6% |
| No Computing Device | 56 | 0.7% |
| Total | 7,641 | 100.0% |
Internet Access in Nocatee
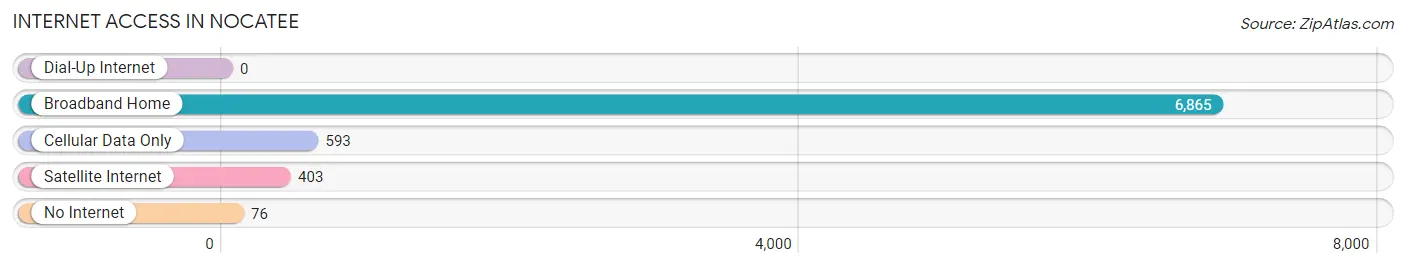
| Internet Type | # Households | % Households |
| Dial-Up Internet | 0 | 0.0% |
| Broadband Home | 6,865 | 89.8% |
| Cellular Data Only | 593 | 7.8% |
| Satellite Internet | 403 | 5.3% |
| No Internet | 76 | 1.0% |
| Total | 7,641 | 100.0% |
Nocatee Summary
Nocatee is a master-planned community located in St. Johns County, Florida, United States. It is situated between Jacksonville and St. Augustine, and is part of the Jacksonville metropolitan area. Nocatee is one of the fastest growing communities in the United States, with a population of over 20,000 people as of 2020.
History
Nocatee was originally part of the Timucuan Indian territory, and was later settled by Spanish colonists in the late 1700s. The area was known as "Nocatee" due to the abundance of wild turkeys in the area. In the early 1800s, the area was settled by farmers and ranchers, and the community of Nocatee was established in 1884.
In the early 1900s, the area was used for timber harvesting and citrus farming. In the 1950s, the area was developed for residential use, and the first homes were built in the area in the 1960s.
In the late 1990s, the area was purchased by the PARC Group, a real estate development company, and the master-planned community of Nocatee was established in 2005. The community was designed to be a self-sustaining community, with a variety of housing options, retail, and recreational amenities.
Geography
Nocatee is located in St. Johns County, Florida, and is situated between Jacksonville and St. Augustine. The community is located on the Intracoastal Waterway, and is bordered by the Nocatee Preserve to the north and the Nocatee Creek to the south. The community is located on the Atlantic Coastal Plain, and is characterized by flat terrain and sandy soils.
Economy
Nocatee is a master-planned community, and the economy is largely driven by the real estate industry. The community is home to a variety of retail and commercial businesses, including restaurants, banks, and grocery stores. The community is also home to a variety of recreational amenities, including parks, trails, and golf courses.
Demographics
As of 2020, the population of Nocatee is estimated to be over 20,000 people. The population is largely white (83.3%), followed by Hispanic (7.3%), African American (4.2%), and Asian (2.2%). The median household income is estimated to be $90,000, and the median home value is estimated to be $320,000.
Conclusion
Nocatee is a master-planned community located in St. Johns County, Florida, United States. It is situated between Jacksonville and St. Augustine, and is part of the Jacksonville metropolitan area. Nocatee is one of the fastest growing communities in the United States, with a population of over 20,000 people as of 2020. The economy is largely driven by the real estate industry, and the population is largely white. Nocatee is a vibrant community with a variety of housing options, retail, and recreational amenities.
Common Questions
What is Per Capita Income in Nocatee?
Per Capita income in Nocatee is $62,690.
What is the Median Family Income in Nocatee?
Median Family Income in Nocatee is $146,888.
What is the Median Household income in Nocatee?
Median Household Income in Nocatee is $131,738.
What is Income or Wage Gap in Nocatee?
Income or Wage Gap in Nocatee is 57.9%.
Women in Nocatee earn 42.1 cents for every dollar earned by a man.
What is Inequality or Gini Index in Nocatee?
Inequality or Gini Index in Nocatee is 0.47.
What is the Total Population of Nocatee?
Total Population of Nocatee is 22,950.
What is the Total Male Population of Nocatee?
Total Male Population of Nocatee is 11,496.
What is the Total Female Population of Nocatee?
Total Female Population of Nocatee is 11,454.
What is the Ratio of Males per 100 Females in Nocatee?
There are 100.37 Males per 100 Females in Nocatee.
What is the Ratio of Females per 100 Males in Nocatee?
There are 99.63 Females per 100 Males in Nocatee.
What is the Median Population Age in Nocatee?
Median Population Age in Nocatee is 39.9 Years.
What is the Average Family Size in Nocatee
Average Family Size in Nocatee is 3.3 People.
What is the Average Household Size in Nocatee
Average Household Size in Nocatee is 3.0 People.
How Large is the Labor Force in Nocatee?
There are 9,633 People in the Labor Forcein in Nocatee.
What is the Percentage of People in the Labor Force in Nocatee?
57.7% of People are in the Labor Force in Nocatee.
What is the Unemployment Rate in Nocatee?
Unemployment Rate in Nocatee is 6.7%.