Kensington, CA Map & Demographics
Kensington Map
Kensington Overview
$101,295
PER CAPITA INCOME
$250,001
AVG FAMILY INCOME
$199,808
AVG HOUSEHOLD INCOME
37.6%
WAGE / INCOME GAP [ % ]
62.4¢/ $1
WAGE / INCOME GAP [ $ ]
0.43
INEQUALITY / GINI INDEX
5,309
TOTAL POPULATION
2,496
MALE POPULATION
2,813
FEMALE POPULATION
88.73
MALES / 100 FEMALES
112.70
FEMALES / 100 MALES
47.9
MEDIAN AGE
3.0
AVG FAMILY SIZE
2.5
AVG HOUSEHOLD SIZE
2,803
LABOR FORCE [ PEOPLE ]
66.2%
PERCENT IN LABOR FORCE
6.3%
UNEMPLOYMENT RATE
Kensington Area Codes
Income in Kensington
Income Overview in Kensington
Per Capita Income in Kensington is $101,295, while median incomes of families and households are $250,001 and $199,808 respectively.
| Characteristic | Number | Measure |
| Per Capita Income | 5,309 | $101,295 |
| Median Family Income | 1,421 | $250,001 |
| Mean Family Income | 1,421 | $308,484 |
| Median Household Income | 2,110 | $199,808 |
| Mean Household Income | 2,110 | $253,171 |
| Income Deficit | 1,421 | $0 |
| Wage / Income Gap (%) | 5,309 | 37.61% |
| Wage / Income Gap ($) | 5,309 | 62.39¢ per $1 |
| Gini / Inequality Index | 5,309 | 0.43 |
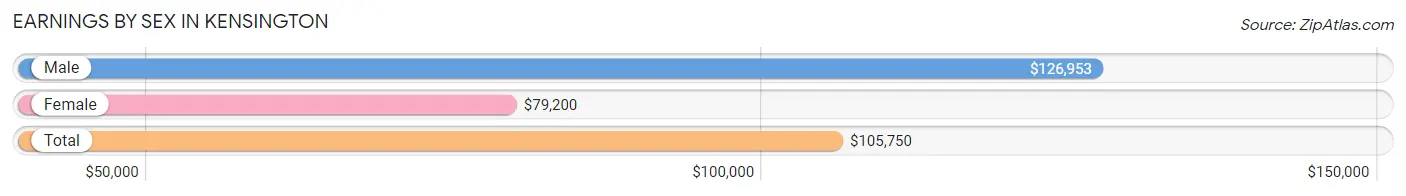
Earnings by Sex in Kensington
Average Earnings in Kensington are $105,750, $126,953 for men and $79,200 for women, a difference of 37.6%.
| Sex | Number | Average Earnings |
| Male | 1,483 (51.5%) | $126,953 |
| Female | 1,396 (48.5%) | $79,200 |
| Total | 2,879 (100.0%) | $105,750 |
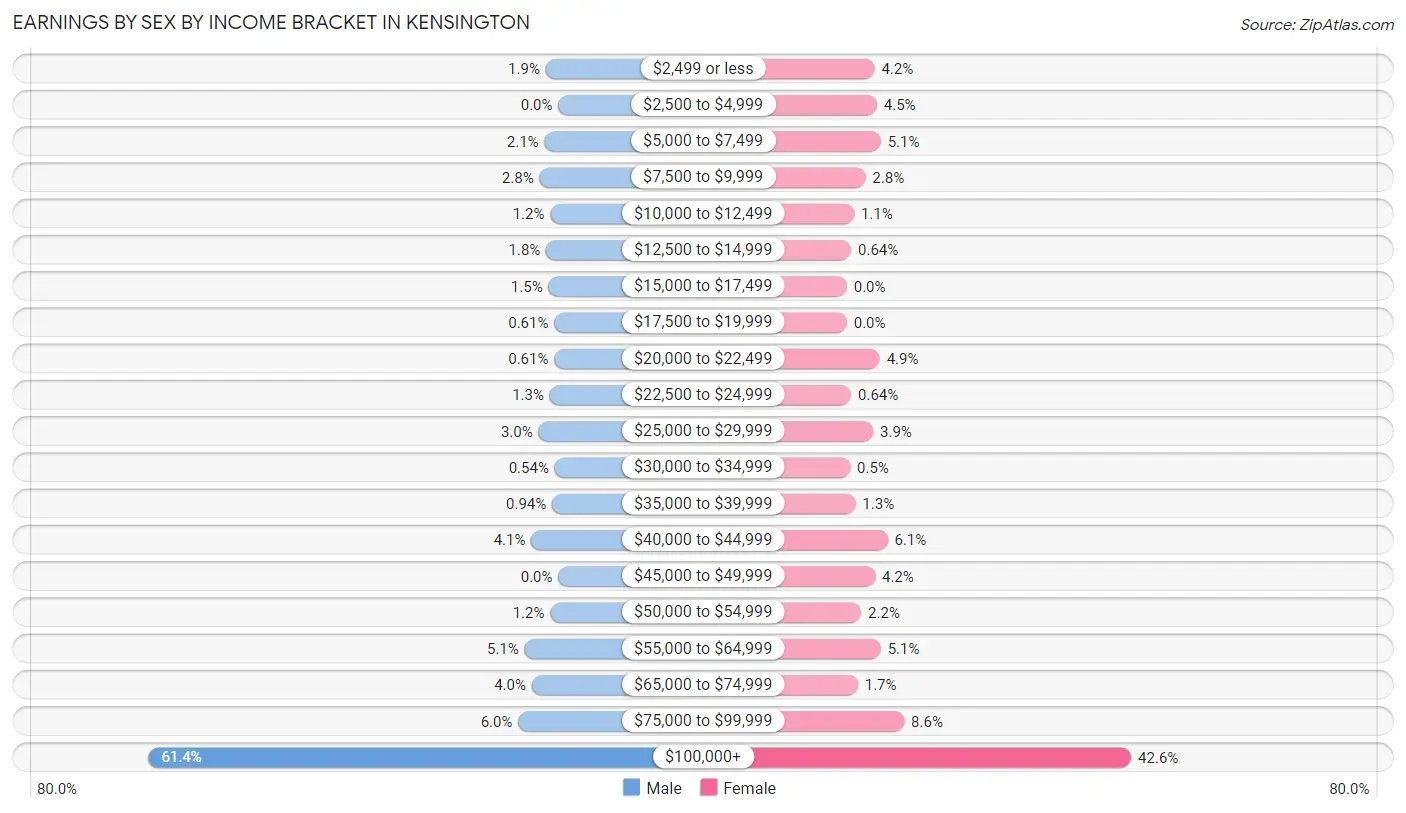
Earnings by Sex by Income Bracket in Kensington
The most common earnings brackets in Kensington are $100,000+ for men (911 | 61.4%) and $100,000+ for women (595 | 42.6%).
| Income | Male | Female |
| $2,499 or less | 28 (1.9%) | 58 (4.2%) |
| $2,500 to $4,999 | 0 (0.0%) | 63 (4.5%) |
| $5,000 to $7,499 | 31 (2.1%) | 71 (5.1%) |
| $7,500 to $9,999 | 42 (2.8%) | 39 (2.8%) |
| $10,000 to $12,499 | 18 (1.2%) | 15 (1.1%) |
| $12,500 to $14,999 | 27 (1.8%) | 9 (0.6%) |
| $15,000 to $17,499 | 22 (1.5%) | 0 (0.0%) |
| $17,500 to $19,999 | 9 (0.6%) | 0 (0.0%) |
| $20,000 to $22,499 | 9 (0.6%) | 69 (4.9%) |
| $22,500 to $24,999 | 19 (1.3%) | 9 (0.6%) |
| $25,000 to $29,999 | 44 (3.0%) | 55 (3.9%) |
| $30,000 to $34,999 | 8 (0.5%) | 7 (0.5%) |
| $35,000 to $39,999 | 14 (0.9%) | 18 (1.3%) |
| $40,000 to $44,999 | 60 (4.1%) | 85 (6.1%) |
| $45,000 to $49,999 | 0 (0.0%) | 59 (4.2%) |
| $50,000 to $54,999 | 18 (1.2%) | 30 (2.1%) |
| $55,000 to $64,999 | 75 (5.1%) | 71 (5.1%) |
| $65,000 to $74,999 | 59 (4.0%) | 23 (1.7%) |
| $75,000 to $99,999 | 89 (6.0%) | 120 (8.6%) |
| $100,000+ | 911 (61.4%) | 595 (42.6%) |
| Total | 1,483 (100.0%) | 1,396 (100.0%) |
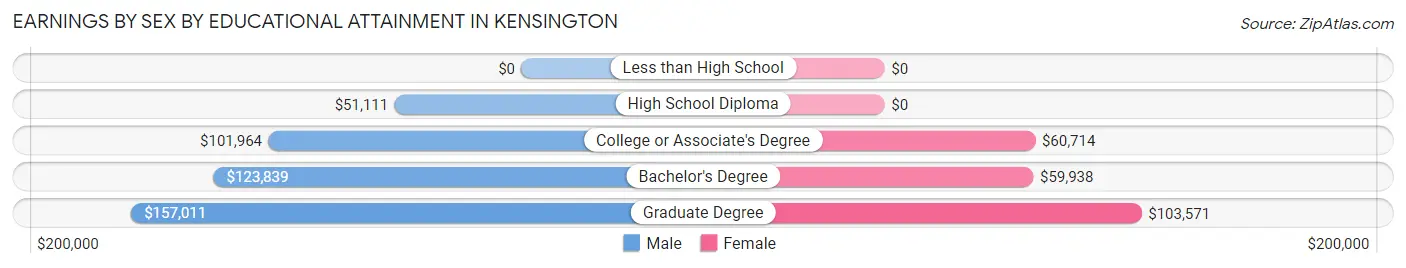
Earnings by Sex by Educational Attainment in Kensington
Average earnings in Kensington are $143,924 for men and $83,659 for women, a difference of 41.9%. Men with an educational attainment of graduate degree enjoy the highest average annual earnings of $157,011, while those with high school diploma education earn the least with $51,111. Women with an educational attainment of graduate degree earn the most with the average annual earnings of $103,571, while those with bachelor's degree education have the smallest earnings of $59,938.
| Educational Attainment | Male Income | Female Income |
| Less than High School | - | - |
| High School Diploma | $51,111 | $0 |
| College or Associate's Degree | $101,964 | $60,714 |
| Bachelor's Degree | $123,839 | $59,938 |
| Graduate Degree | $157,011 | $103,571 |
| Total | $143,924 | $83,659 |
Family Income in Kensington
Family Income Brackets in Kensington
According to the Kensington family income data, there are 926 families falling into the $200,000+ income range, which is the most common income bracket and makes up 65.2% of all families.
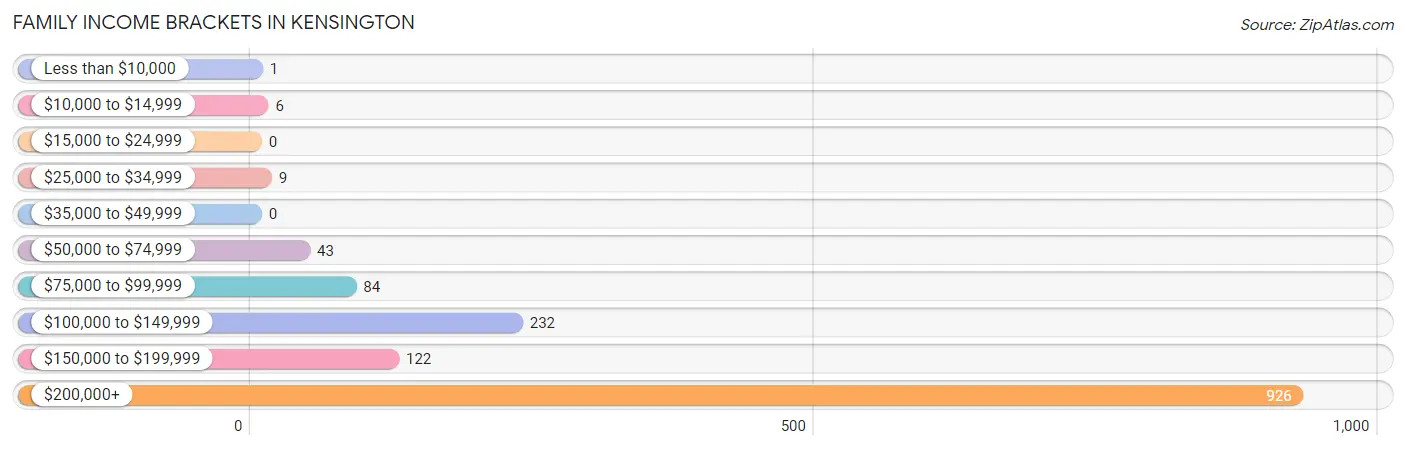
| Income Bracket | # Families | % Families |
| Less than $10,000 | 1 | 0.1% |
| $10,000 to $14,999 | 6 | 0.4% |
| $15,000 to $24,999 | 0 | 0.0% |
| $25,000 to $34,999 | 9 | 0.6% |
| $35,000 to $49,999 | 0 | 0.0% |
| $50,000 to $74,999 | 43 | 3.0% |
| $75,000 to $99,999 | 84 | 5.9% |
| $100,000 to $149,999 | 232 | 16.3% |
| $150,000 to $199,999 | 122 | 8.6% |
| $200,000+ | 926 | 65.2% |
Family Income by Famaliy Size in Kensington
3-person families (232 | 16.3%) account for the highest median family income in Kensington with $250,001 per family, while 2-person families (729 | 51.3%) have the highest median income of $84,952 per family member.
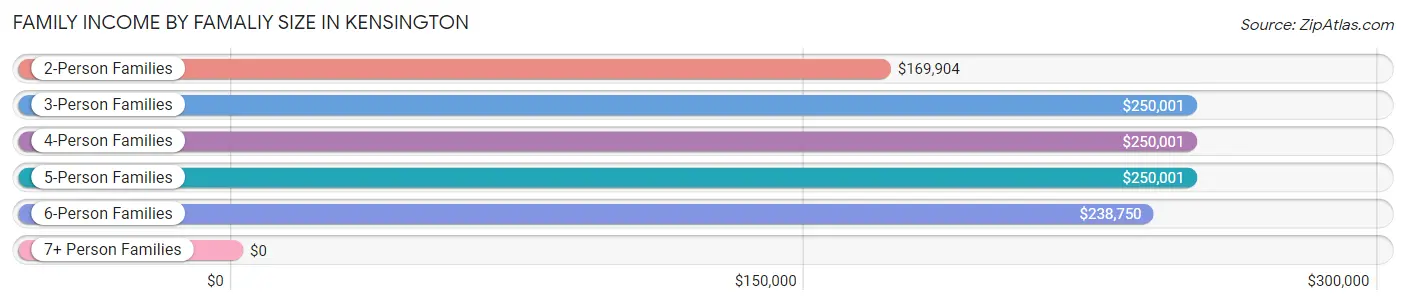
| Income Bracket | # Families | Median Income |
| 2-Person Families | 729 (51.3%) | $169,904 |
| 3-Person Families | 232 (16.3%) | $250,001 |
| 4-Person Families | 324 (22.8%) | $250,001 |
| 5-Person Families | 119 (8.4%) | $250,001 |
| 6-Person Families | 17 (1.2%) | $238,750 |
| 7+ Person Families | 0 (0.0%) | $0 |
| Total | 1,421 (100.0%) | $250,001 |
Family Income by Number of Earners in Kensington
The median family income in Kensington is $250,001, with families comprising 2 earners (752) having the highest median family income of $250,001, while families with no earners (173) have the lowest median family income of $102,344, accounting for 52.9% and 12.2% of families, respectively.
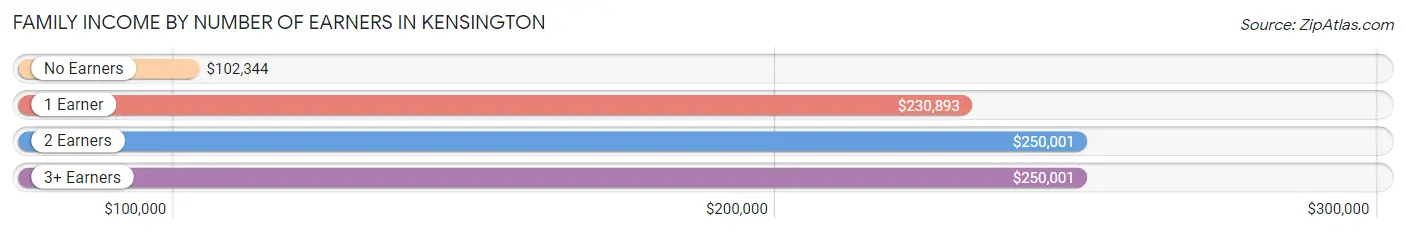
| Number of Earners | # Families | Median Income |
| No Earners | 173 (12.2%) | $102,344 |
| 1 Earner | 383 (27.0%) | $230,893 |
| 2 Earners | 752 (52.9%) | $250,001 |
| 3+ Earners | 113 (8.0%) | $250,001 |
| Total | 1,421 (100.0%) | $250,001 |
Household Income in Kensington
Household Income Brackets in Kensington
With 1,053 households falling in the category, the $200,000+ income range is the most frequent in Kensington, accounting for 49.9% of all households. In contrast, only 8 households (0.4%) fall into the $25,000 to $34,999 income bracket, making it the least populous group.
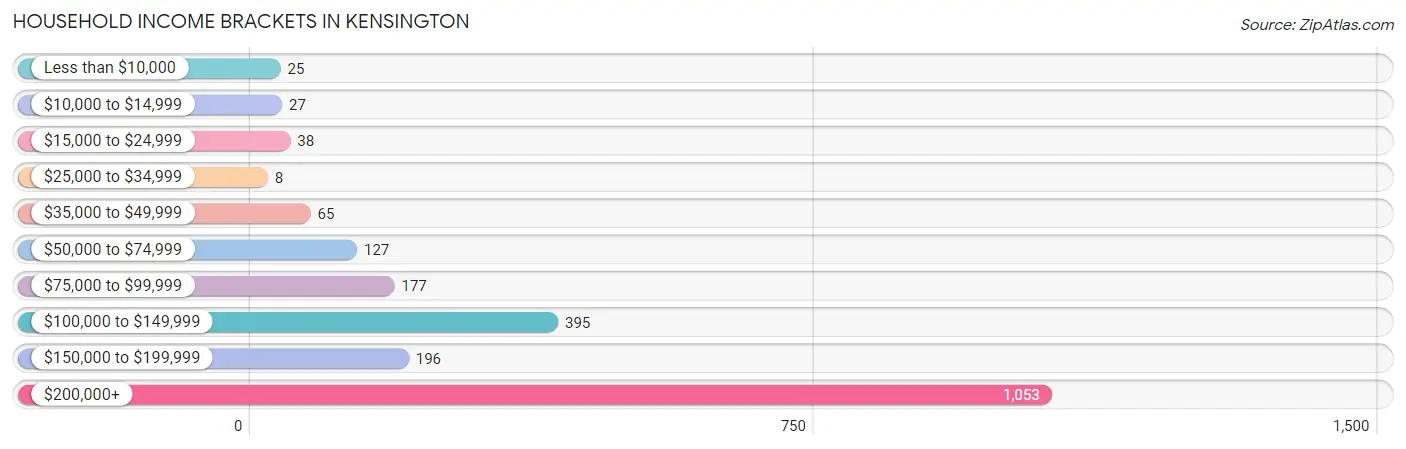
| Income Bracket | # Households | % Households |
| Less than $10,000 | 25 | 1.2% |
| $10,000 to $14,999 | 27 | 1.3% |
| $15,000 to $24,999 | 38 | 1.8% |
| $25,000 to $34,999 | 8 | 0.4% |
| $35,000 to $49,999 | 65 | 3.1% |
| $50,000 to $74,999 | 127 | 6.0% |
| $75,000 to $99,999 | 177 | 8.4% |
| $100,000 to $149,999 | 395 | 18.7% |
| $150,000 to $199,999 | 196 | 9.3% |
| $200,000+ | 1,053 | 49.9% |
Household Income by Householder Age in Kensington
The median household income in Kensington is $199,808, with the highest median household income of $250,001 found in the 25 to 44 years age bracket for the primary householder. A total of 434 households (20.6%) fall into this category.
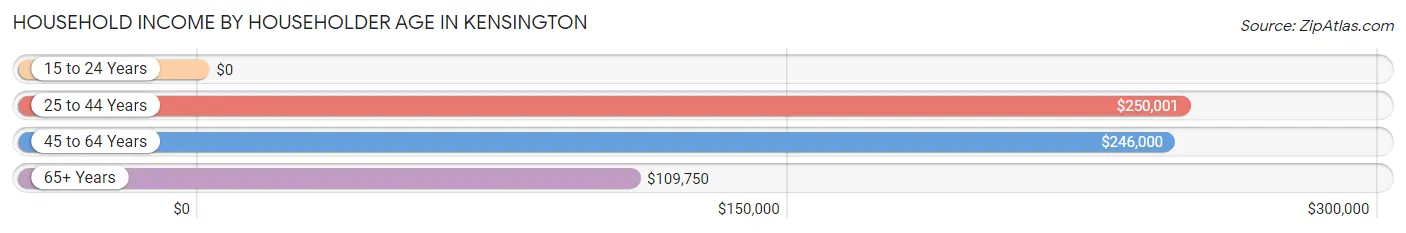
| Income Bracket | # Households | Median Income |
| 15 to 24 Years | 0 (0.0%) | $0 |
| 25 to 44 Years | 434 (20.6%) | $250,001 |
| 45 to 64 Years | 784 (37.2%) | $246,000 |
| 65+ Years | 892 (42.3%) | $109,750 |
| Total | 2,110 (100.0%) | $199,808 |
Poverty in Kensington
Income Below Poverty by Sex and Age in Kensington
With 4.1% poverty level for males and 2.8% for females among the residents of Kensington, 18 to 24 year old males and 18 to 24 year old females are the most vulnerable to poverty, with 19 males (19.4%) and 9 females (11.5%) in their respective age groups living below the poverty level.
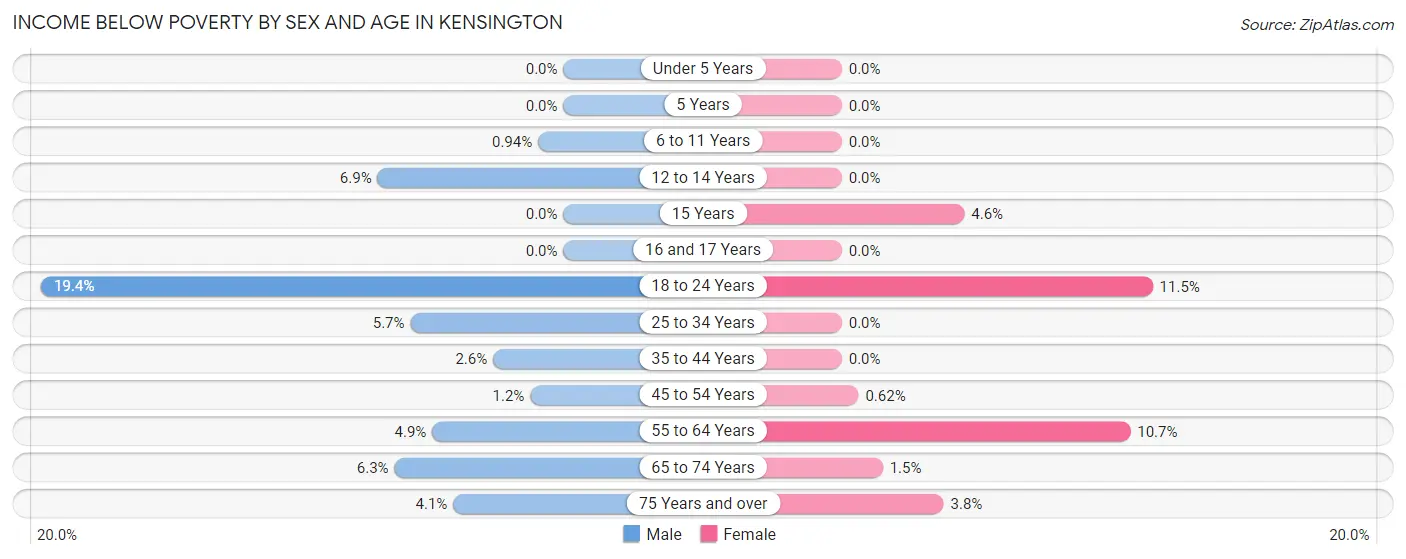
| Age Bracket | Male | Female |
| Under 5 Years | 0 (0.0%) | 0 (0.0%) |
| 5 Years | 0 (0.0%) | 0 (0.0%) |
| 6 to 11 Years | 2 (0.9%) | 0 (0.0%) |
| 12 to 14 Years | 2 (6.9%) | 0 (0.0%) |
| 15 Years | 0 (0.0%) | 3 (4.5%) |
| 16 and 17 Years | 0 (0.0%) | 0 (0.0%) |
| 18 to 24 Years | 19 (19.4%) | 9 (11.5%) |
| 25 to 34 Years | 15 (5.7%) | 0 (0.0%) |
| 35 to 44 Years | 8 (2.6%) | 0 (0.0%) |
| 45 to 54 Years | 5 (1.2%) | 2 (0.6%) |
| 55 to 64 Years | 19 (4.9%) | 45 (10.7%) |
| 65 to 74 Years | 22 (6.3%) | 6 (1.5%) |
| 75 Years and over | 9 (4.1%) | 13 (3.8%) |
| Total | 101 (4.1%) | 78 (2.8%) |
Income Above Poverty by Sex and Age in Kensington
According to the poverty statistics in Kensington, males aged under 5 years and females aged under 5 years are the age groups that are most secure financially, with 100.0% of males and 100.0% of females in these age groups living above the poverty line.
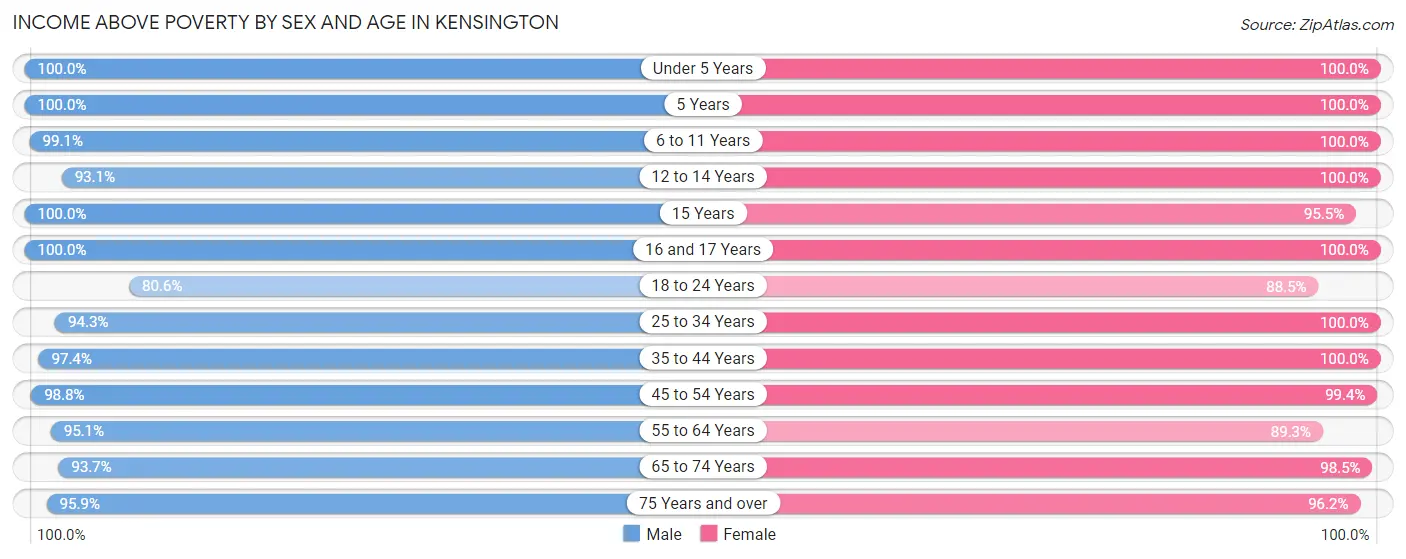
| Age Bracket | Male | Female |
| Under 5 Years | 72 (100.0%) | 136 (100.0%) |
| 5 Years | 38 (100.0%) | 30 (100.0%) |
| 6 to 11 Years | 210 (99.1%) | 396 (100.0%) |
| 12 to 14 Years | 27 (93.1%) | 52 (100.0%) |
| 15 Years | 37 (100.0%) | 63 (95.5%) |
| 16 and 17 Years | 74 (100.0%) | 45 (100.0%) |
| 18 to 24 Years | 79 (80.6%) | 69 (88.5%) |
| 25 to 34 Years | 249 (94.3%) | 148 (100.0%) |
| 35 to 44 Years | 298 (97.4%) | 372 (100.0%) |
| 45 to 54 Years | 400 (98.8%) | 321 (99.4%) |
| 55 to 64 Years | 371 (95.1%) | 375 (89.3%) |
| 65 to 74 Years | 329 (93.7%) | 390 (98.5%) |
| 75 Years and over | 211 (95.9%) | 331 (96.2%) |
| Total | 2,395 (96.0%) | 2,728 (97.2%) |
Income Below Poverty Among Married-Couple Families in Kensington
The poverty statistics for married-couple families in Kensington show that 0.7% or 8 of the total 1,204 families live below the poverty line. Families with no children have the highest poverty rate of 0.9%, comprising of 6 families. On the other hand, families with 3 or 4 children have the lowest poverty rate of 0.0%, which includes 0 families.
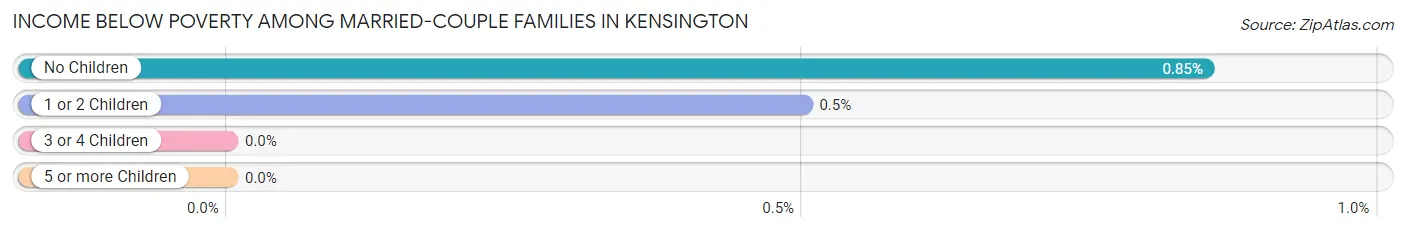
| Children | Above Poverty | Below Poverty |
| No Children | 697 (99.2%) | 6 (0.9%) |
| 1 or 2 Children | 399 (99.5%) | 2 (0.5%) |
| 3 or 4 Children | 100 (100.0%) | 0 (0.0%) |
| 5 or more Children | 0 (0.0%) | 0 (0.0%) |
| Total | 1,196 (99.3%) | 8 (0.7%) |
Income Below Poverty Among Single-Parent Households in Kensington
| Children | Single Father | Single Mother |
| No Children | 0 (0.0%) | 0 (0.0%) |
| 1 or 2 Children | 0 (0.0%) | 0 (0.0%) |
| 3 or 4 Children | 0 (0.0%) | 0 (0.0%) |
| 5 or more Children | 0 (0.0%) | 0 (0.0%) |
| Total | 0 (0.0%) | 0 (0.0%) |
Income Below Poverty Among Married-Couple vs Single-Parent Households in Kensington
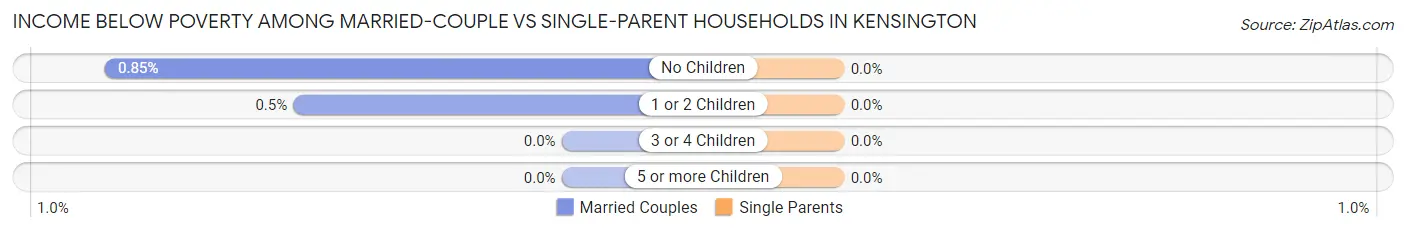
| Children | Married-Couple Families | Single-Parent Households |
| No Children | 6 (0.9%) | 0 (0.0%) |
| 1 or 2 Children | 2 (0.5%) | 0 (0.0%) |
| 3 or 4 Children | 0 (0.0%) | 0 (0.0%) |
| 5 or more Children | 0 (0.0%) | 0 (0.0%) |
| Total | 8 (0.7%) | 0 (0.0%) |
Race in Kensington
The most populous races in Kensington are White / Caucasian (3,880 | 73.1%), Two or more Races (705 | 13.3%), and Asian (559 | 10.5%).
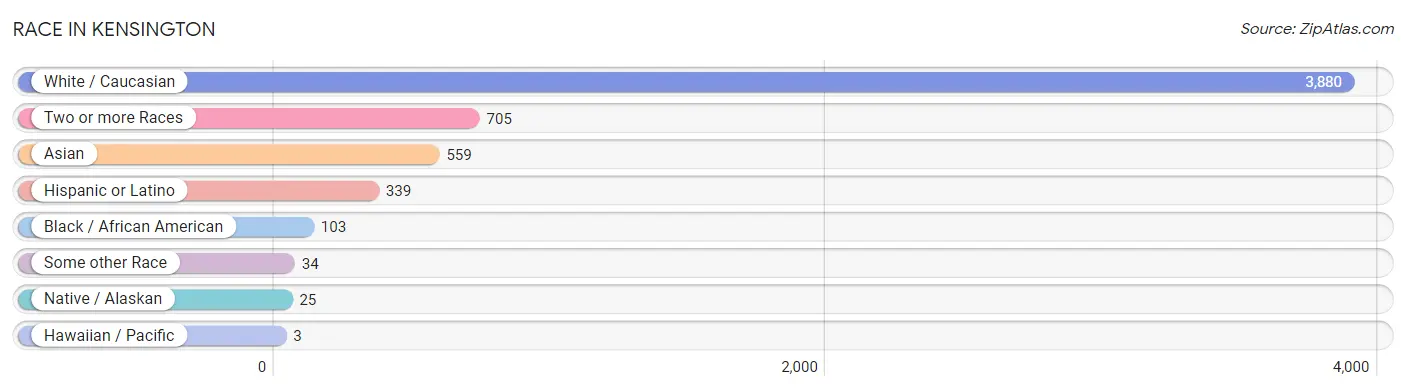
| Race | # Population | % Population |
| Asian | 559 | 10.5% |
| Black / African American | 103 | 1.9% |
| Hawaiian / Pacific | 3 | 0.1% |
| Hispanic or Latino | 339 | 6.4% |
| Native / Alaskan | 25 | 0.5% |
| White / Caucasian | 3,880 | 73.1% |
| Two or more Races | 705 | 13.3% |
| Some other Race | 34 | 0.6% |
| Total | 5,309 | 100.0% |
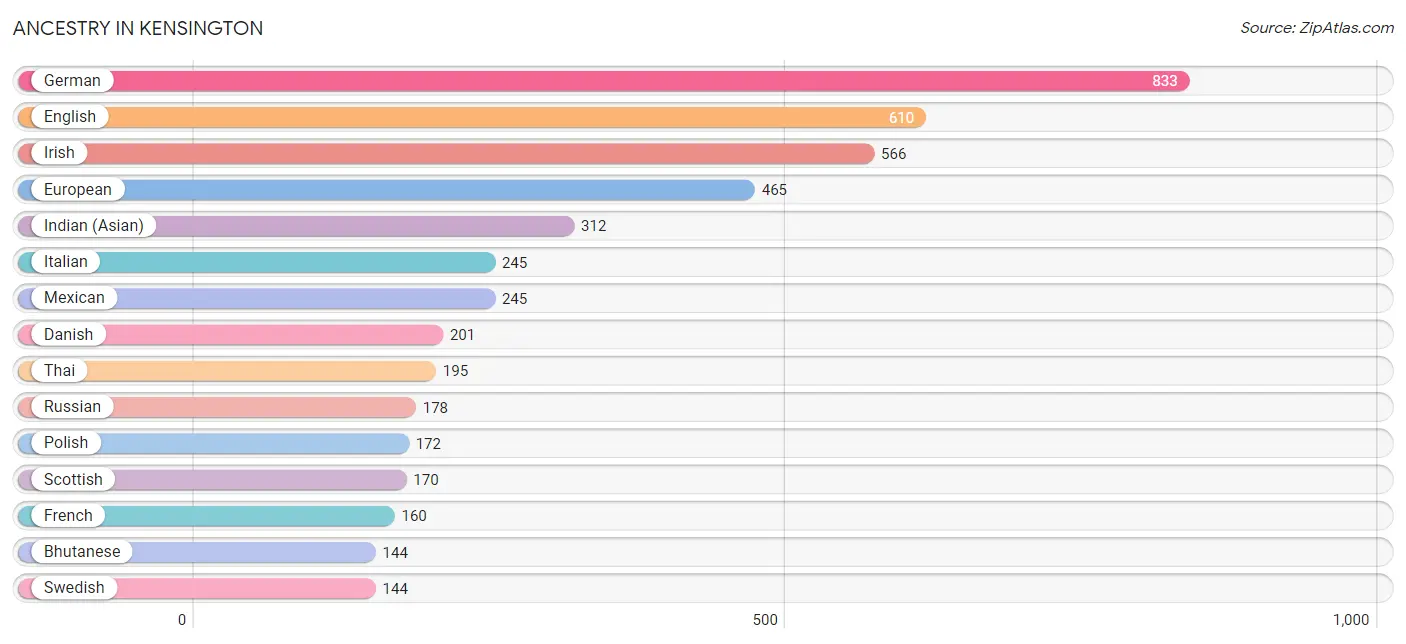
Ancestry in Kensington
The most populous ancestries reported in Kensington are German (833 | 15.7%), English (610 | 11.5%), Irish (566 | 10.7%), European (465 | 8.8%), and Indian (Asian) (312 | 5.9%), together accounting for 52.5% of all Kensington residents.
| Ancestry | # Population | % Population |
| African | 21 | 0.4% |
| American | 131 | 2.5% |
| Austrian | 18 | 0.3% |
| Belgian | 40 | 0.7% |
| Bhutanese | 144 | 2.7% |
| Brazilian | 19 | 0.4% |
| British | 70 | 1.3% |
| Cajun | 30 | 0.6% |
| Central American | 14 | 0.3% |
| Central American Indian | 27 | 0.5% |
| Cherokee | 13 | 0.2% |
| Chilean | 7 | 0.1% |
| Choctaw | 22 | 0.4% |
| Czech | 22 | 0.4% |
| Danish | 201 | 3.8% |
| Dominican | 34 | 0.6% |
| Dutch | 91 | 1.7% |
| Eastern European | 78 | 1.5% |
| English | 610 | 11.5% |
| European | 465 | 8.8% |
| Finnish | 55 | 1.0% |
| French | 160 | 3.0% |
| French American Indian | 7 | 0.1% |
| French Canadian | 45 | 0.9% |
| German | 833 | 15.7% |
| Greek | 16 | 0.3% |
| Guatemalan | 10 | 0.2% |
| Hungarian | 25 | 0.5% |
| Indian (Asian) | 312 | 5.9% |
| Iranian | 99 | 1.9% |
| Irish | 566 | 10.7% |
| Israeli | 20 | 0.4% |
| Italian | 245 | 4.6% |
| Jamaican | 6 | 0.1% |
| Korean | 51 | 1.0% |
| Latvian | 9 | 0.2% |
| Lithuanian | 22 | 0.4% |
| Mexican | 245 | 4.6% |
| Mexican American Indian | 11 | 0.2% |
| Native Hawaiian | 3 | 0.1% |
| Northern European | 83 | 1.6% |
| Norwegian | 71 | 1.3% |
| Pakistani | 47 | 0.9% |
| Peruvian | 39 | 0.7% |
| Polish | 172 | 3.2% |
| Portuguese | 14 | 0.3% |
| Russian | 178 | 3.4% |
| Salvadoran | 4 | 0.1% |
| Scandinavian | 43 | 0.8% |
| Scotch-Irish | 51 | 1.0% |
| Scottish | 170 | 3.2% |
| Slavic | 13 | 0.2% |
| South American | 46 | 0.9% |
| South American Indian | 12 | 0.2% |
| Sri Lankan | 15 | 0.3% |
| Subsaharan African | 21 | 0.4% |
| Swedish | 144 | 2.7% |
| Swiss | 67 | 1.3% |
| Thai | 195 | 3.7% |
| Ukrainian | 51 | 1.0% |
| Welsh | 31 | 0.6% |
| West Indian | 8 | 0.2% | View All 62 Rows |
Immigrants in Kensington
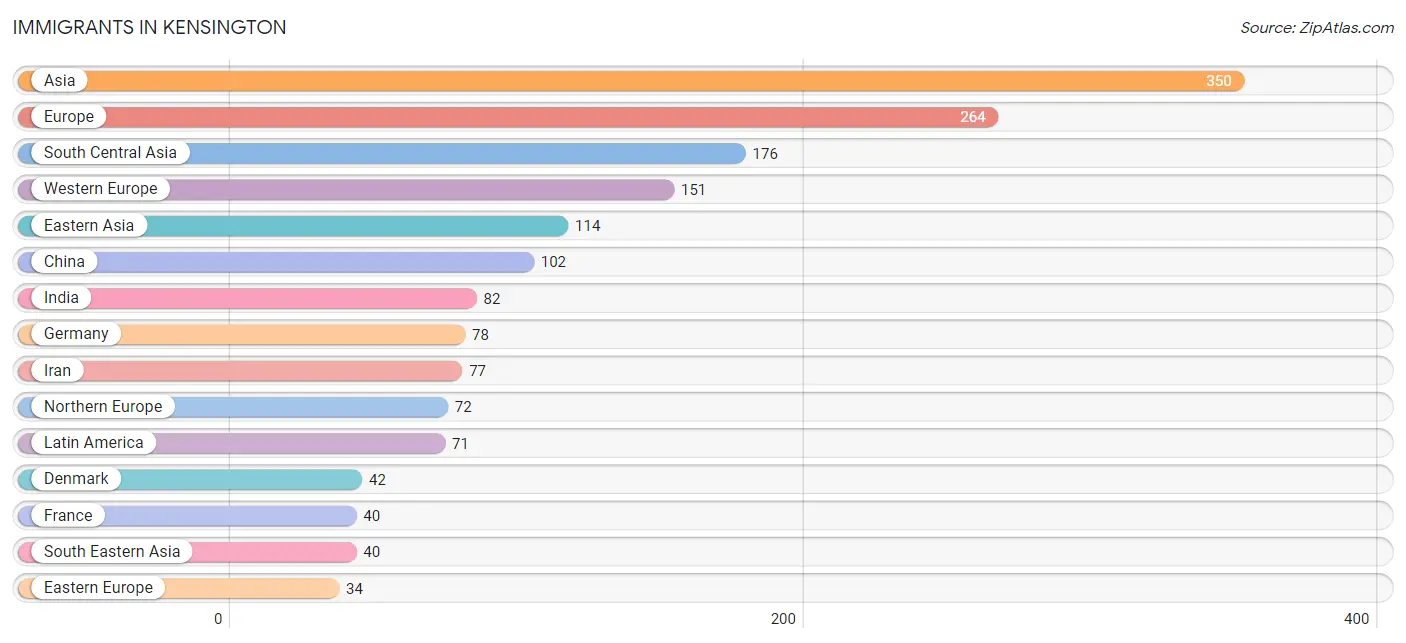
The most numerous immigrant groups reported in Kensington came from Asia (350 | 6.6%), Europe (264 | 5.0%), South Central Asia (176 | 3.3%), Western Europe (151 | 2.8%), and Eastern Asia (114 | 2.1%), together accounting for 19.9% of all Kensington residents.
| Immigration Origin | # Population | % Population |
| Asia | 350 | 6.6% |
| Belgium | 18 | 0.3% |
| Brazil | 14 | 0.3% |
| Canada | 8 | 0.2% |
| Caribbean | 17 | 0.3% |
| Central America | 29 | 0.5% |
| China | 102 | 1.9% |
| Denmark | 42 | 0.8% |
| Dominican Republic | 17 | 0.3% |
| Eastern Asia | 114 | 2.1% |
| Eastern Europe | 34 | 0.6% |
| El Salvador | 4 | 0.1% |
| England | 7 | 0.1% |
| Europe | 264 | 5.0% |
| France | 40 | 0.7% |
| Germany | 78 | 1.5% |
| Guatemala | 10 | 0.2% |
| Hong Kong | 18 | 0.3% |
| India | 82 | 1.5% |
| Iran | 77 | 1.5% |
| Israel | 20 | 0.4% |
| Italy | 7 | 0.1% |
| Japan | 12 | 0.2% |
| Latin America | 71 | 1.3% |
| Malaysia | 5 | 0.1% |
| Mexico | 15 | 0.3% |
| Nepal | 17 | 0.3% |
| Netherlands | 10 | 0.2% |
| Northern Europe | 72 | 1.4% |
| Oceania | 6 | 0.1% |
| Peru | 11 | 0.2% |
| Philippines | 32 | 0.6% |
| Russia | 34 | 0.6% |
| South America | 25 | 0.5% |
| South Central Asia | 176 | 3.3% |
| South Eastern Asia | 40 | 0.7% |
| Southern Europe | 7 | 0.1% |
| Switzerland | 5 | 0.1% |
| Vietnam | 3 | 0.1% |
| Western Asia | 20 | 0.4% |
| Western Europe | 151 | 2.8% | View All 41 Rows |
Sex and Age in Kensington
Sex and Age in Kensington
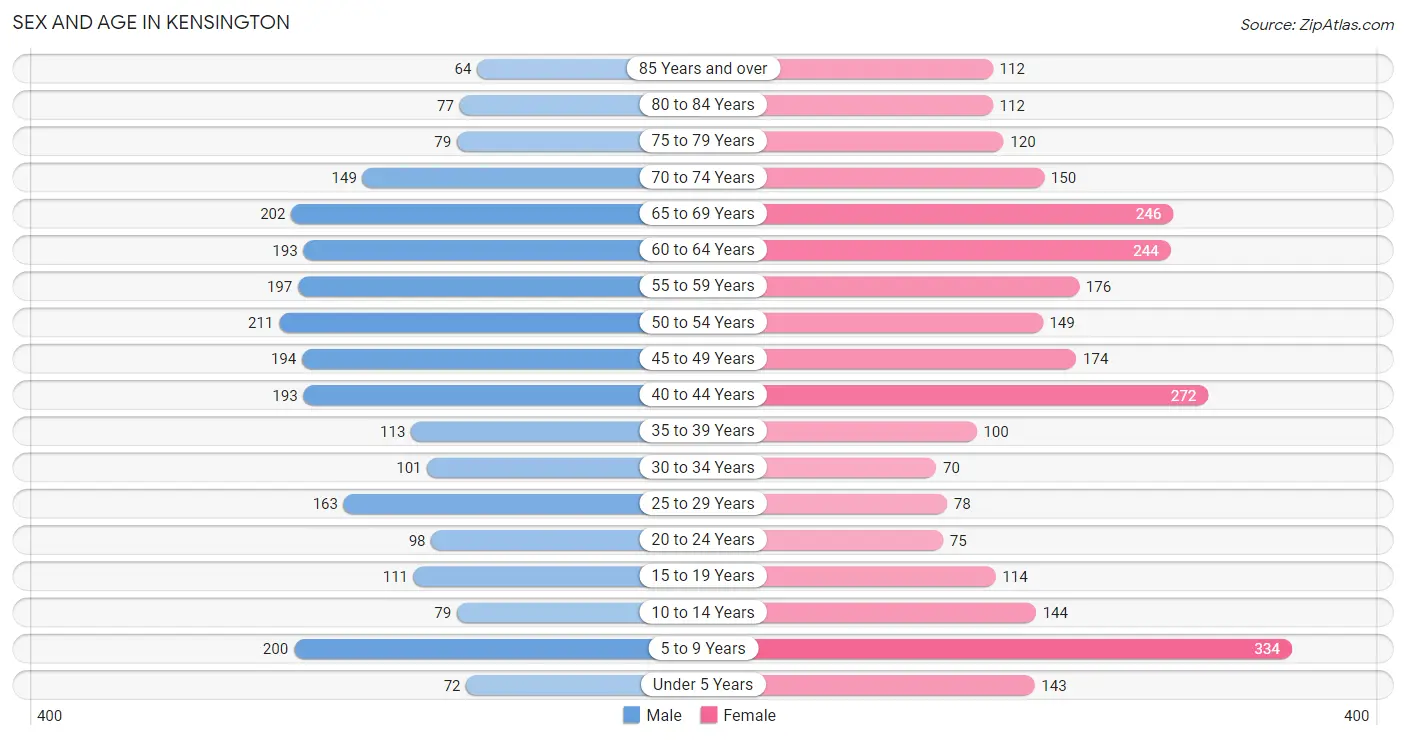
The most populous age groups in Kensington are 50 to 54 Years (211 | 8.5%) for men and 5 to 9 Years (334 | 11.9%) for women.
| Age Bracket | Male | Female |
| Under 5 Years | 72 (2.9%) | 143 (5.1%) |
| 5 to 9 Years | 200 (8.0%) | 334 (11.9%) |
| 10 to 14 Years | 79 (3.2%) | 144 (5.1%) |
| 15 to 19 Years | 111 (4.4%) | 114 (4.1%) |
| 20 to 24 Years | 98 (3.9%) | 75 (2.7%) |
| 25 to 29 Years | 163 (6.5%) | 78 (2.8%) |
| 30 to 34 Years | 101 (4.1%) | 70 (2.5%) |
| 35 to 39 Years | 113 (4.5%) | 100 (3.5%) |
| 40 to 44 Years | 193 (7.7%) | 272 (9.7%) |
| 45 to 49 Years | 194 (7.8%) | 174 (6.2%) |
| 50 to 54 Years | 211 (8.5%) | 149 (5.3%) |
| 55 to 59 Years | 197 (7.9%) | 176 (6.3%) |
| 60 to 64 Years | 193 (7.7%) | 244 (8.7%) |
| 65 to 69 Years | 202 (8.1%) | 246 (8.7%) |
| 70 to 74 Years | 149 (6.0%) | 150 (5.3%) |
| 75 to 79 Years | 79 (3.2%) | 120 (4.3%) |
| 80 to 84 Years | 77 (3.1%) | 112 (4.0%) |
| 85 Years and over | 64 (2.6%) | 112 (4.0%) |
| Total | 2,496 (100.0%) | 2,813 (100.0%) |
Families and Households in Kensington
Median Family Size in Kensington
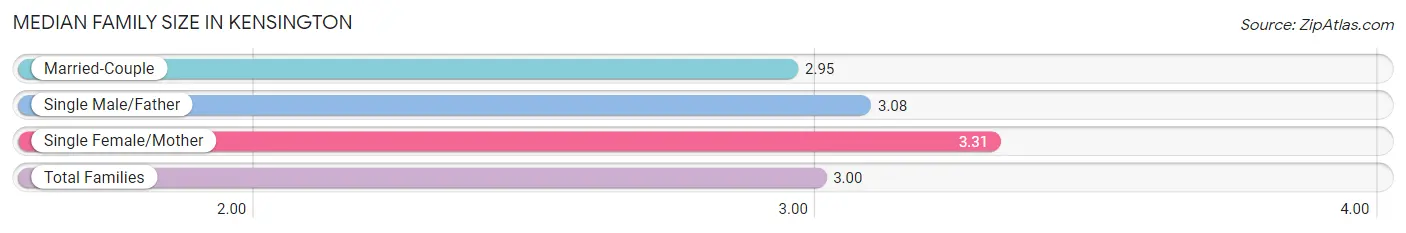
The median family size in Kensington is 3.00 persons per family, with single female/mother families (165 | 11.6%) accounting for the largest median family size of 3.31 persons per family. On the other hand, married-couple families (1,204 | 84.7%) represent the smallest median family size with 2.95 persons per family.
| Family Type | # Families | Family Size |
| Married-Couple | 1,204 (84.7%) | 2.95 |
| Single Male/Father | 52 (3.7%) | 3.08 |
| Single Female/Mother | 165 (11.6%) | 3.31 |
| Total Families | 1,421 (100.0%) | 3.00 |
Median Household Size in Kensington
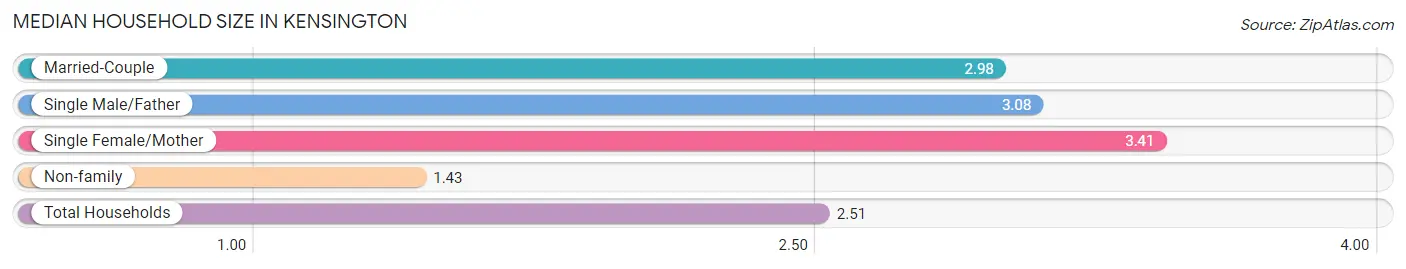
The median household size in Kensington is 2.51 persons per household, with single female/mother households (165 | 7.8%) accounting for the largest median household size of 3.41 persons per household. non-family households (689 | 32.7%) represent the smallest median household size with 1.43 persons per household.
| Household Type | # Households | Household Size |
| Married-Couple | 1,204 (57.1%) | 2.98 |
| Single Male/Father | 52 (2.5%) | 3.08 |
| Single Female/Mother | 165 (7.8%) | 3.41 |
| Non-family | 689 (32.7%) | 1.43 |
| Total Households | 2,110 (100.0%) | 2.51 |
Household Size by Marriage Status in Kensington
Out of a total of 2,110 households in Kensington, 1,421 (67.3%) are family households, while 689 (32.7%) are nonfamily households. The most numerous type of family households are 2-person households, comprising 708, and the most common type of nonfamily households are 1-person households, comprising 516.
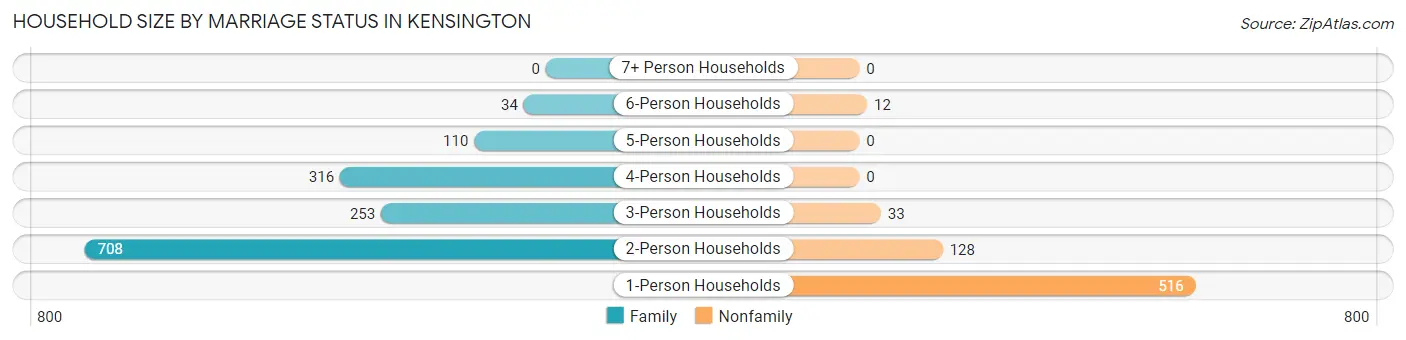
| Household Size | Family Households | Nonfamily Households |
| 1-Person Households | - | 516 (24.4%) |
| 2-Person Households | 708 (33.6%) | 128 (6.1%) |
| 3-Person Households | 253 (12.0%) | 33 (1.6%) |
| 4-Person Households | 316 (15.0%) | 0 (0.0%) |
| 5-Person Households | 110 (5.2%) | 0 (0.0%) |
| 6-Person Households | 34 (1.6%) | 12 (0.6%) |
| 7+ Person Households | 0 (0.0%) | 0 (0.0%) |
| Total | 1,421 (67.3%) | 689 (32.7%) |
Female Fertility in Kensington
Fertility by Age in Kensington
Average fertility rate in Kensington is 14.0 births per 1,000 women. Women in the age bracket of 20 to 34 years have the highest fertility rate with 27.0 births per 1,000 women. Women in the age bracket of 35 to 50 years acount for 53.8% of all women with births.
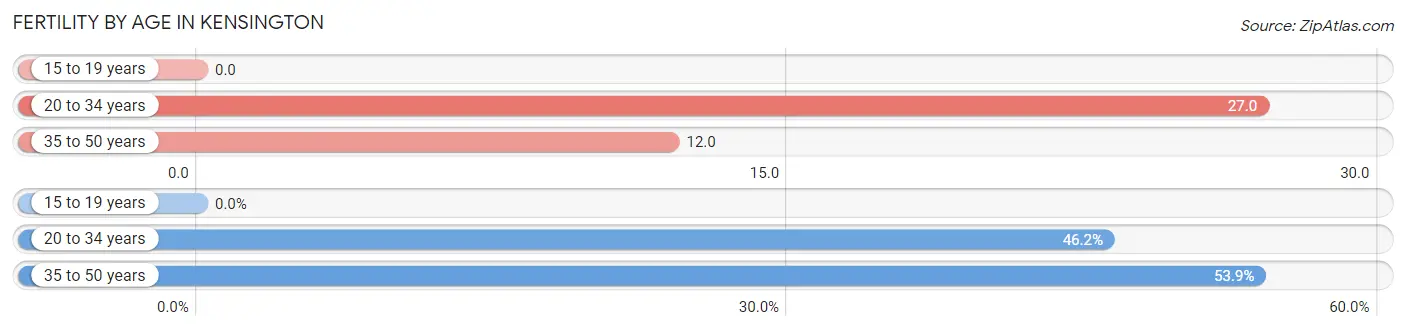
| Age Bracket | Women with Births | Births / 1,000 Women |
| 15 to 19 years | 0 (0.0%) | 0.0 |
| 20 to 34 years | 6 (46.2%) | 27.0 |
| 35 to 50 years | 7 (53.8%) | 12.0 |
| Total | 13 (100.0%) | 14.0 |
Fertility by Age by Marriage Status in Kensington
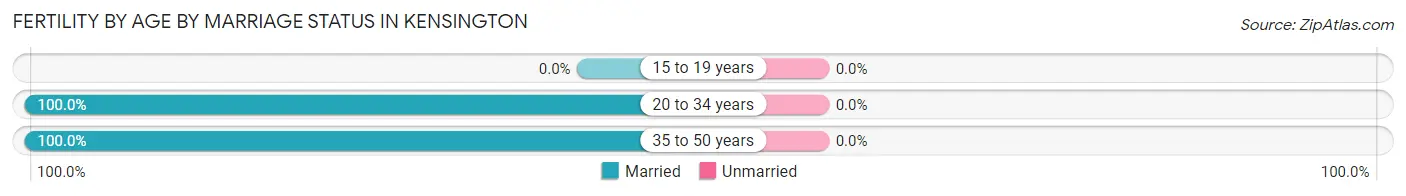
| Age Bracket | Married | Unmarried |
| 15 to 19 years | 0 (0.0%) | 0 (0.0%) |
| 20 to 34 years | 6 (100.0%) | 0 (0.0%) |
| 35 to 50 years | 7 (100.0%) | 0 (0.0%) |
| Total | 13 (100.0%) | 0 (0.0%) |
Fertility by Education in Kensington
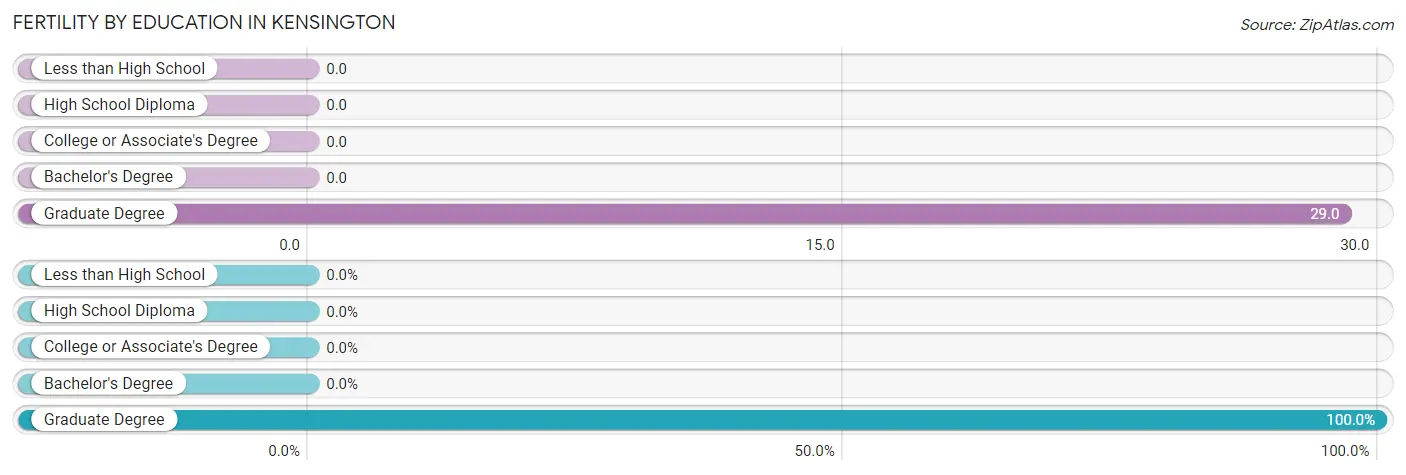
| Educational Attainment | Women with Births | Births / 1,000 Women |
| Less than High School | 0 (0.0%) | 0.0 |
| High School Diploma | 0 (0.0%) | 0.0 |
| College or Associate's Degree | 0 (0.0%) | 0.0 |
| Bachelor's Degree | 0 (0.0%) | 0.0 |
| Graduate Degree | 13 (100.0%) | 29.0 |
| Total | 13 (100.0%) | 14.0 |
Fertility by Education by Marriage Status in Kensington
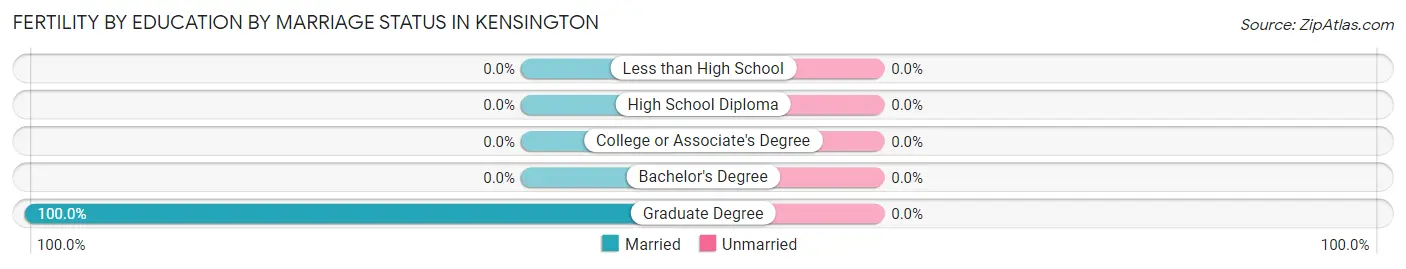
| Educational Attainment | Married | Unmarried |
| Less than High School | 0 (0.0%) | 0 (0.0%) |
| High School Diploma | 0 (0.0%) | 0 (0.0%) |
| College or Associate's Degree | 0 (0.0%) | 0 (0.0%) |
| Bachelor's Degree | 0 (0.0%) | 0 (0.0%) |
| Graduate Degree | 13 (100.0%) | 0 (0.0%) |
| Total | 13 (100.0%) | 0 (0.0%) |
Employment Characteristics in Kensington
Employment by Class of Employer in Kensington
Among the 2,562 employed individuals in Kensington, private company employees (1,192 | 46.5%), self-employed (not incorporated) (381 | 14.9%), and state government employees (311 | 12.1%) make up the most common classes of employment.
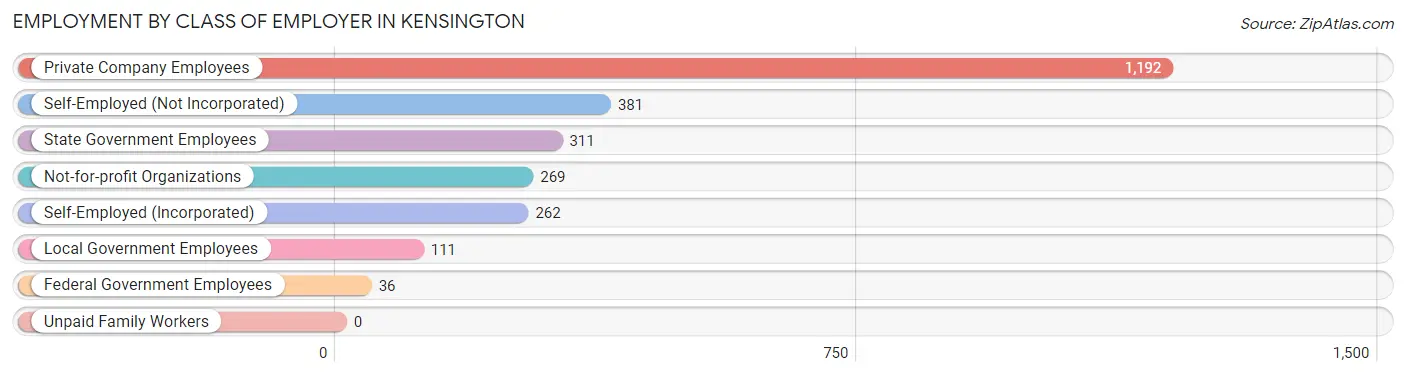
| Employer Class | # Employees | % Employees |
| Private Company Employees | 1,192 | 46.5% |
| Self-Employed (Incorporated) | 262 | 10.2% |
| Self-Employed (Not Incorporated) | 381 | 14.9% |
| Not-for-profit Organizations | 269 | 10.5% |
| Local Government Employees | 111 | 4.3% |
| State Government Employees | 311 | 12.1% |
| Federal Government Employees | 36 | 1.4% |
| Unpaid Family Workers | 0 | 0.0% |
| Total | 2,562 | 100.0% |
Employment Status by Age in Kensington
According to the labor force statistics for Kensington, out of the total population over 16 years of age (4,234), 66.2% or 2,803 individuals are in the labor force, with 6.3% or 177 of them unemployed. The age group with the highest labor force participation rate is 35 to 44 years, with 96.2% or 652 individuals in the labor force. Within the labor force, the 60 to 64 years age range has the highest percentage of unemployed individuals, with 16.8% or 56 of them being unemployed.
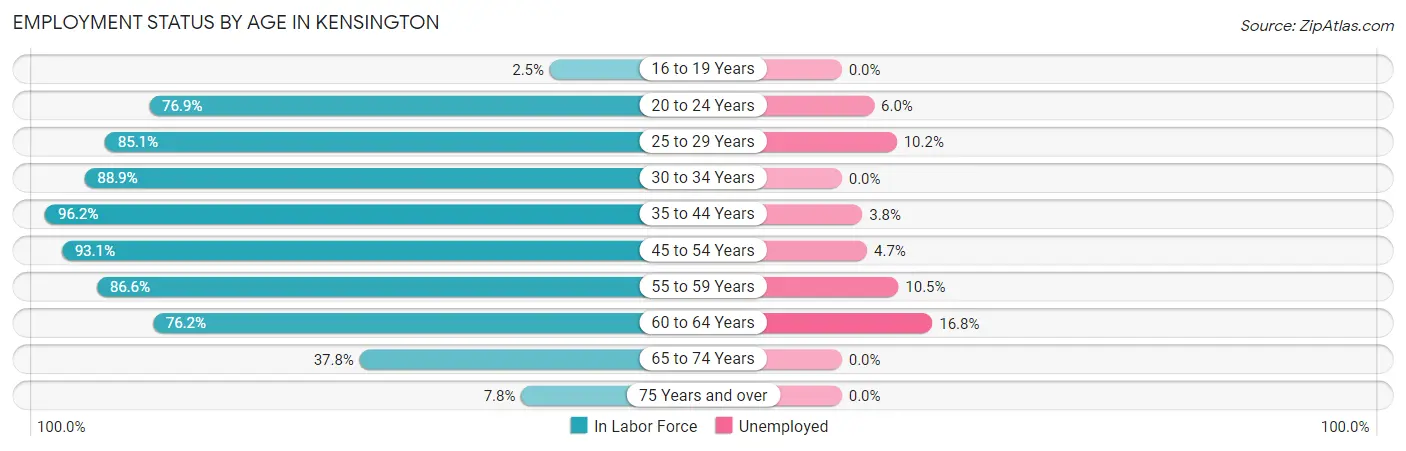
| Age Bracket | In Labor Force | Unemployed |
| 16 to 19 Years | 3 (2.5%) | 0 (0.0%) |
| 20 to 24 Years | 133 (76.9%) | 8 (6.0%) |
| 25 to 29 Years | 205 (85.1%) | 21 (10.2%) |
| 30 to 34 Years | 152 (88.9%) | 0 (0.0%) |
| 35 to 44 Years | 652 (96.2%) | 25 (3.8%) |
| 45 to 54 Years | 678 (93.1%) | 32 (4.7%) |
| 55 to 59 Years | 323 (86.6%) | 34 (10.5%) |
| 60 to 64 Years | 333 (76.2%) | 56 (16.8%) |
| 65 to 74 Years | 282 (37.8%) | 0 (0.0%) |
| 75 Years and over | 44 (7.8%) | 0 (0.0%) |
| Total | 2,803 (66.2%) | 177 (6.3%) |
Employment Status by Educational Attainment in Kensington
According to labor force statistics for Kensington, 89.2% of individuals (2,344) out of the total population between 25 and 64 years of age (2,628) are in the labor force, with 7.2% or 169 of them being unemployed. The group with the highest labor force participation rate are those with the educational attainment of high school diploma, with 96.7% or 58 individuals in the labor force. Within the labor force, individuals with college / associate degree education have the highest percentage of unemployment, with 14.4% or 47 of them being unemployed.
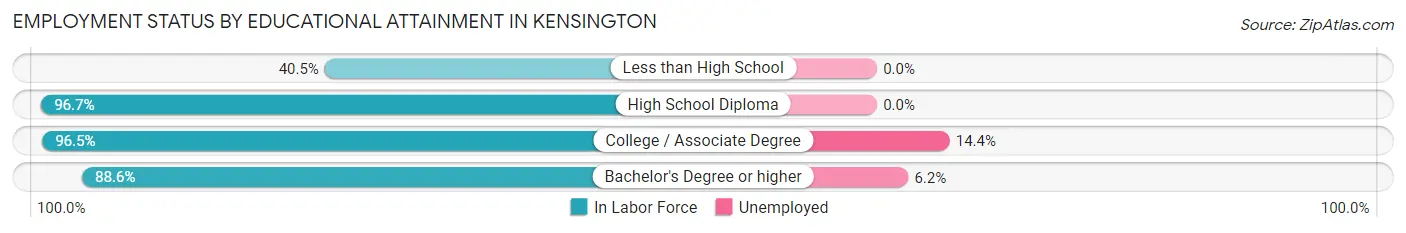
| Educational Attainment | In Labor Force | Unemployed |
| Less than High School | 15 (40.5%) | 0 (0.0%) |
| High School Diploma | 58 (96.7%) | 0 (0.0%) |
| College / Associate Degree | 327 (96.5%) | 49 (14.4%) |
| Bachelor's Degree or higher | 1,942 (88.6%) | 136 (6.2%) |
| Total | 2,344 (89.2%) | 189 (7.2%) |
Employment Occupations by Sex in Kensington
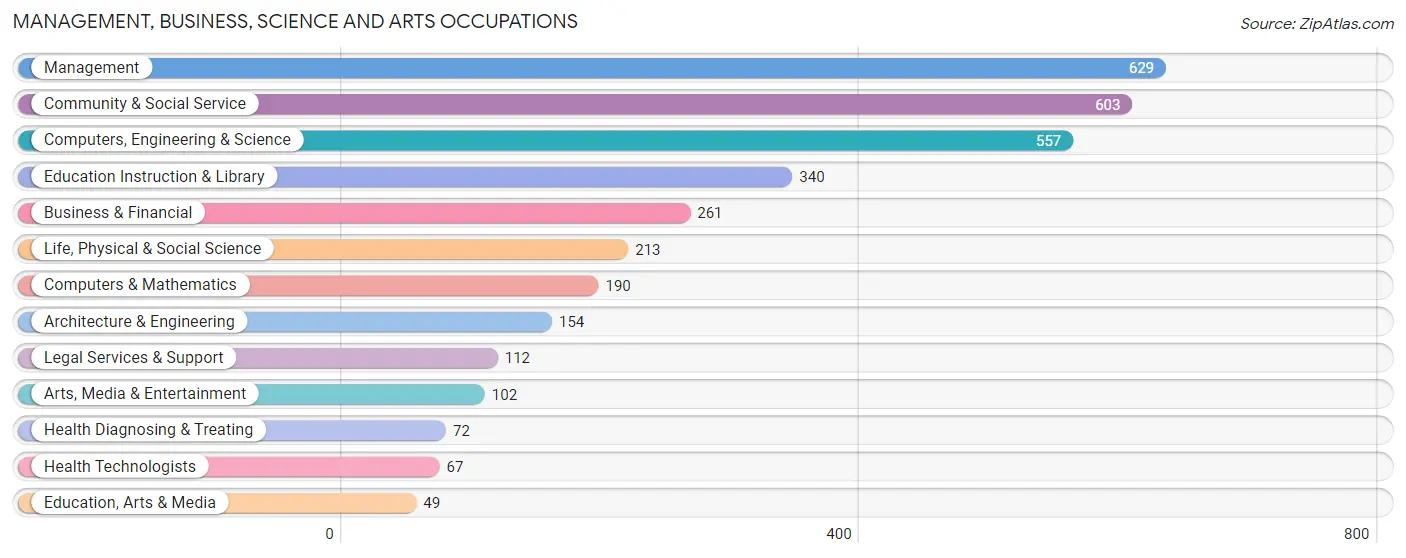
Management, Business, Science and Arts Occupations
The most common Management, Business, Science and Arts occupations in Kensington are Management (629 | 23.9%), Community & Social Service (603 | 22.9%), Computers, Engineering & Science (557 | 21.2%), Education Instruction & Library (340 | 12.9%), and Business & Financial (261 | 9.9%).
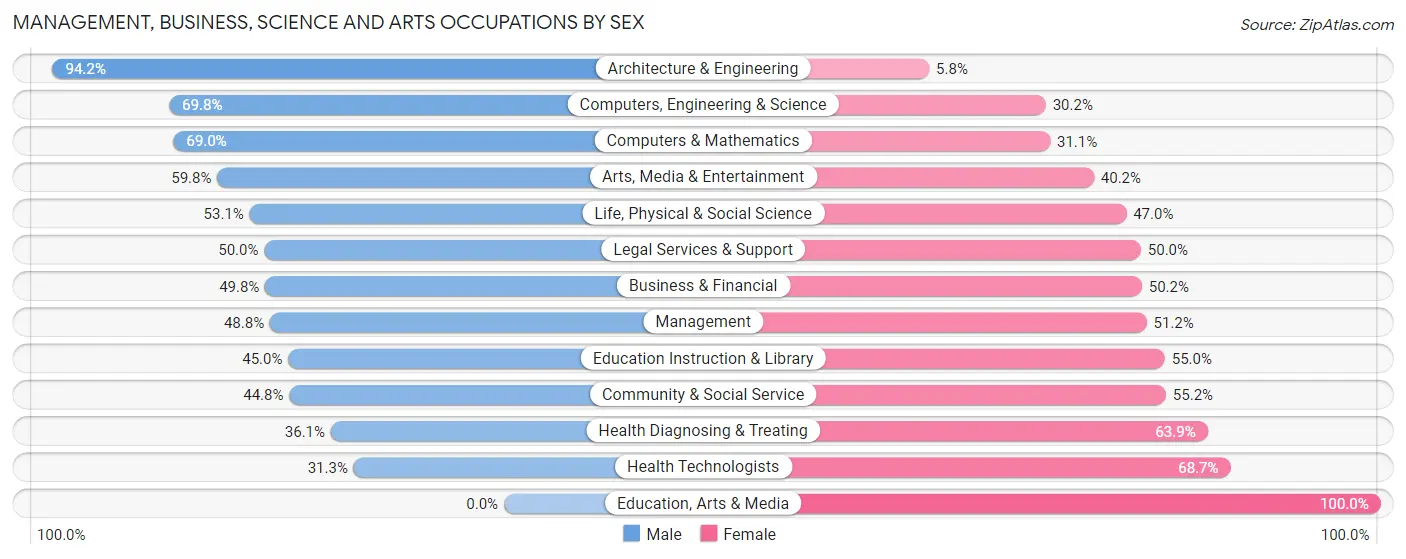
Management, Business, Science and Arts Occupations by Sex
Within the Management, Business, Science and Arts occupations in Kensington, the most male-oriented occupations are Architecture & Engineering (94.2%), Computers, Engineering & Science (69.8%), and Computers & Mathematics (69.0%), while the most female-oriented occupations are Education, Arts & Media (100.0%), Health Technologists (68.7%), and Health Diagnosing & Treating (63.9%).
| Occupation | Male | Female |
| Management | 307 (48.8%) | 322 (51.2%) |
| Business & Financial | 130 (49.8%) | 131 (50.2%) |
| Computers, Engineering & Science | 389 (69.8%) | 168 (30.2%) |
| Computers & Mathematics | 131 (69.0%) | 59 (31.0%) |
| Architecture & Engineering | 145 (94.2%) | 9 (5.8%) |
| Life, Physical & Social Science | 113 (53.0%) | 100 (46.9%) |
| Community & Social Service | 270 (44.8%) | 333 (55.2%) |
| Education, Arts & Media | 0 (0.0%) | 49 (100.0%) |
| Legal Services & Support | 56 (50.0%) | 56 (50.0%) |
| Education Instruction & Library | 153 (45.0%) | 187 (55.0%) |
| Arts, Media & Entertainment | 61 (59.8%) | 41 (40.2%) |
| Health Diagnosing & Treating | 26 (36.1%) | 46 (63.9%) |
| Health Technologists | 21 (31.3%) | 46 (68.7%) |
| Total (Category) | 1,122 (52.9%) | 1,000 (47.1%) |
| Total (Overall) | 1,404 (53.4%) | 1,225 (46.6%) |
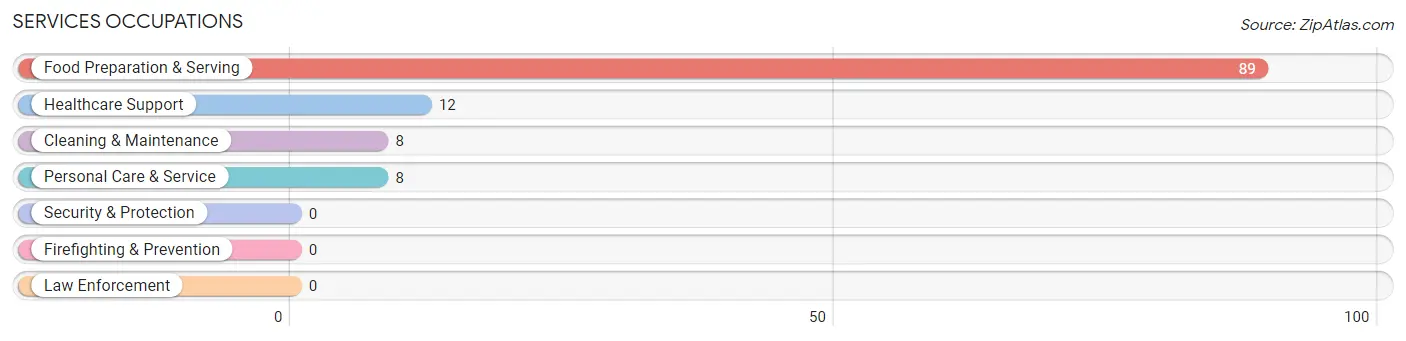
Services Occupations
The most common Services occupations in Kensington are Food Preparation & Serving (89 | 3.4%), Healthcare Support (12 | 0.5%), Cleaning & Maintenance (8 | 0.3%), and Personal Care & Service (8 | 0.3%).
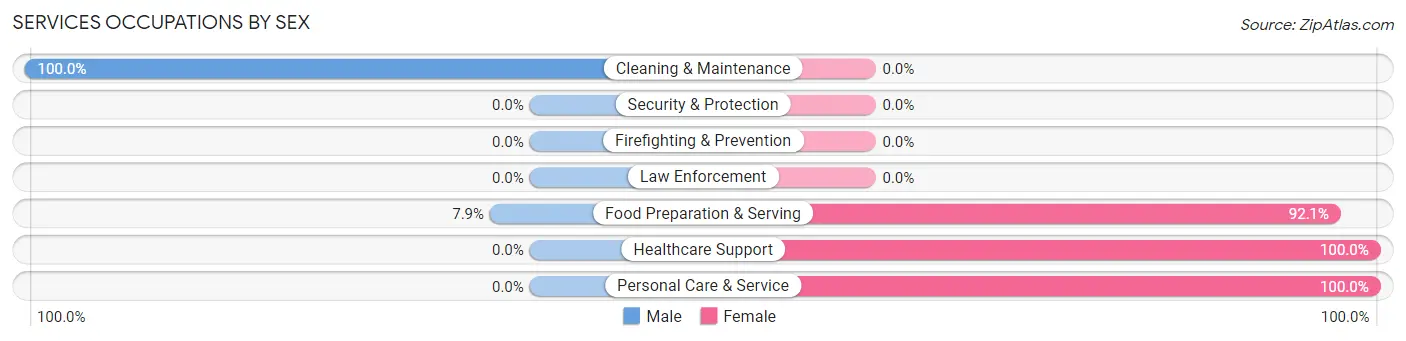
Services Occupations by Sex
Within the Services occupations in Kensington, the most male-oriented occupations are Cleaning & Maintenance (100.0%), and Food Preparation & Serving (7.9%), while the most female-oriented occupations are Healthcare Support (100.0%), Personal Care & Service (100.0%), and Food Preparation & Serving (92.1%).
| Occupation | Male | Female |
| Healthcare Support | 0 (0.0%) | 12 (100.0%) |
| Security & Protection | 0 (0.0%) | 0 (0.0%) |
| Firefighting & Prevention | 0 (0.0%) | 0 (0.0%) |
| Law Enforcement | 0 (0.0%) | 0 (0.0%) |
| Food Preparation & Serving | 7 (7.9%) | 82 (92.1%) |
| Cleaning & Maintenance | 8 (100.0%) | 0 (0.0%) |
| Personal Care & Service | 0 (0.0%) | 8 (100.0%) |
| Total (Category) | 15 (12.8%) | 102 (87.2%) |
| Total (Overall) | 1,404 (53.4%) | 1,225 (46.6%) |
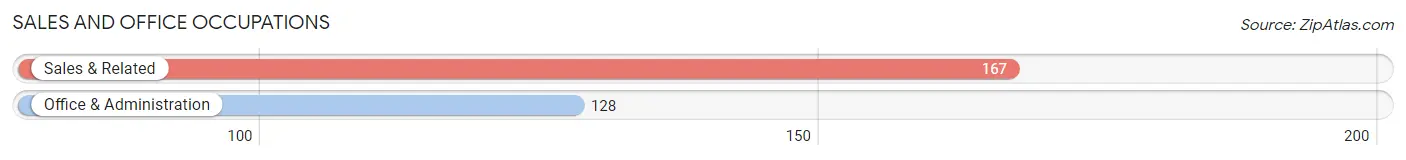
Sales and Office Occupations
The most common Sales and Office occupations in Kensington are Sales & Related (167 | 6.4%), and Office & Administration (128 | 4.9%).
Sales and Office Occupations by Sex
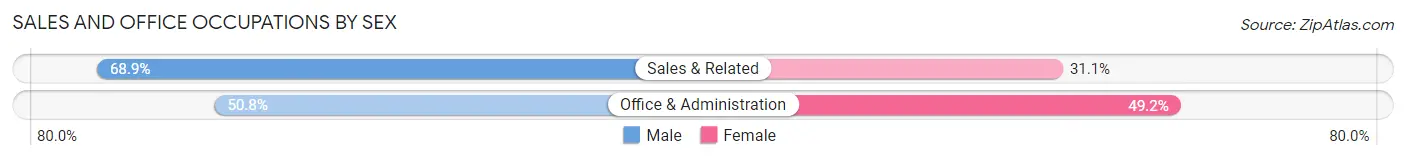
| Occupation | Male | Female |
| Sales & Related | 115 (68.9%) | 52 (31.1%) |
| Office & Administration | 65 (50.8%) | 63 (49.2%) |
| Total (Category) | 180 (61.0%) | 115 (39.0%) |
| Total (Overall) | 1,404 (53.4%) | 1,225 (46.6%) |
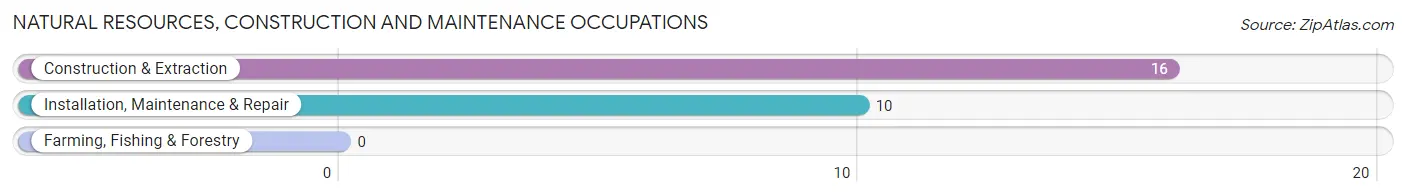
Natural Resources, Construction and Maintenance Occupations
The most common Natural Resources, Construction and Maintenance occupations in Kensington are Construction & Extraction (16 | 0.6%), and Installation, Maintenance & Repair (10 | 0.4%).
Natural Resources, Construction and Maintenance Occupations by Sex
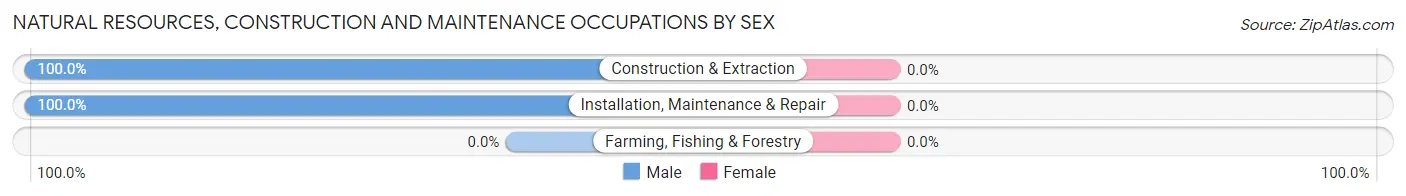
| Occupation | Male | Female |
| Farming, Fishing & Forestry | 0 (0.0%) | 0 (0.0%) |
| Construction & Extraction | 16 (100.0%) | 0 (0.0%) |
| Installation, Maintenance & Repair | 10 (100.0%) | 0 (0.0%) |
| Total (Category) | 26 (100.0%) | 0 (0.0%) |
| Total (Overall) | 1,404 (53.4%) | 1,225 (46.6%) |
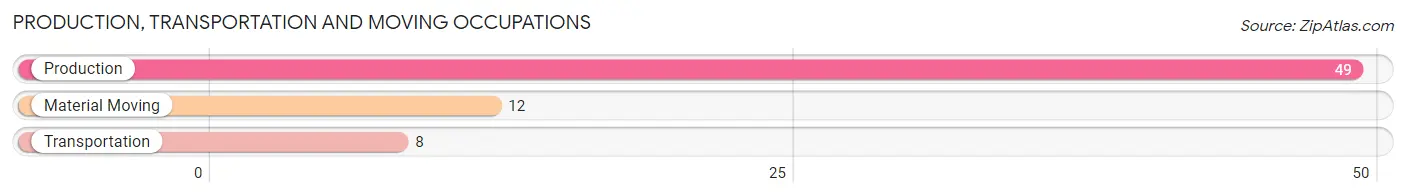
Production, Transportation and Moving Occupations
The most common Production, Transportation and Moving occupations in Kensington are Production (49 | 1.9%), Material Moving (12 | 0.5%), and Transportation (8 | 0.3%).
Production, Transportation and Moving Occupations by Sex
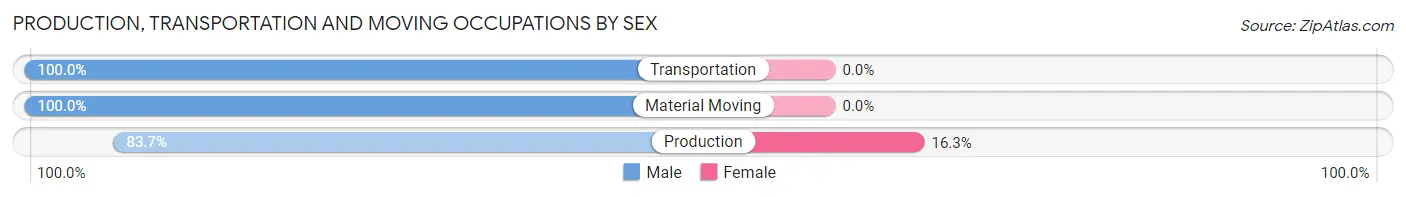
| Occupation | Male | Female |
| Production | 41 (83.7%) | 8 (16.3%) |
| Transportation | 8 (100.0%) | 0 (0.0%) |
| Material Moving | 12 (100.0%) | 0 (0.0%) |
| Total (Category) | 61 (88.4%) | 8 (11.6%) |
| Total (Overall) | 1,404 (53.4%) | 1,225 (46.6%) |
Employment Industries by Sex in Kensington
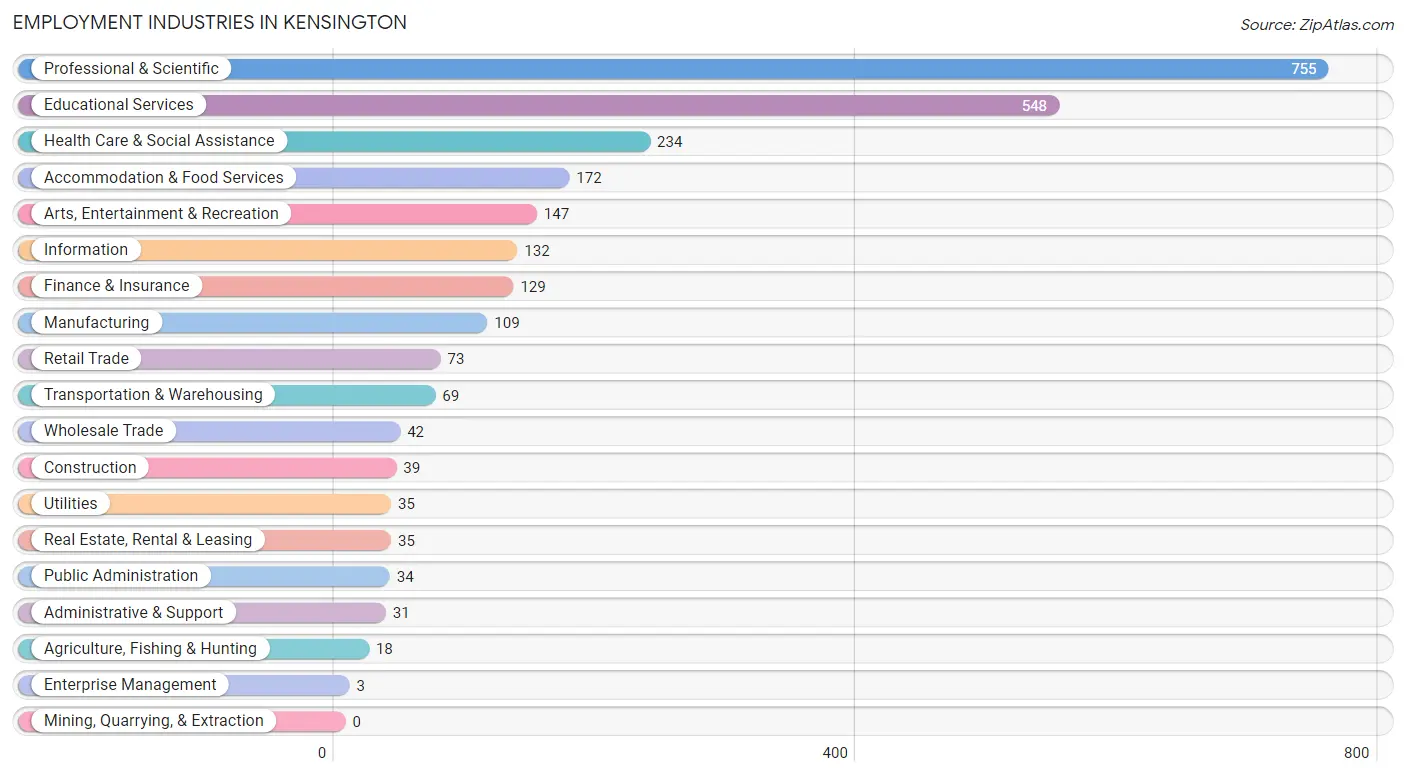
Employment Industries in Kensington
The major employment industries in Kensington include Professional & Scientific (755 | 28.7%), Educational Services (548 | 20.8%), Health Care & Social Assistance (234 | 8.9%), Accommodation & Food Services (172 | 6.5%), and Arts, Entertainment & Recreation (147 | 5.6%).
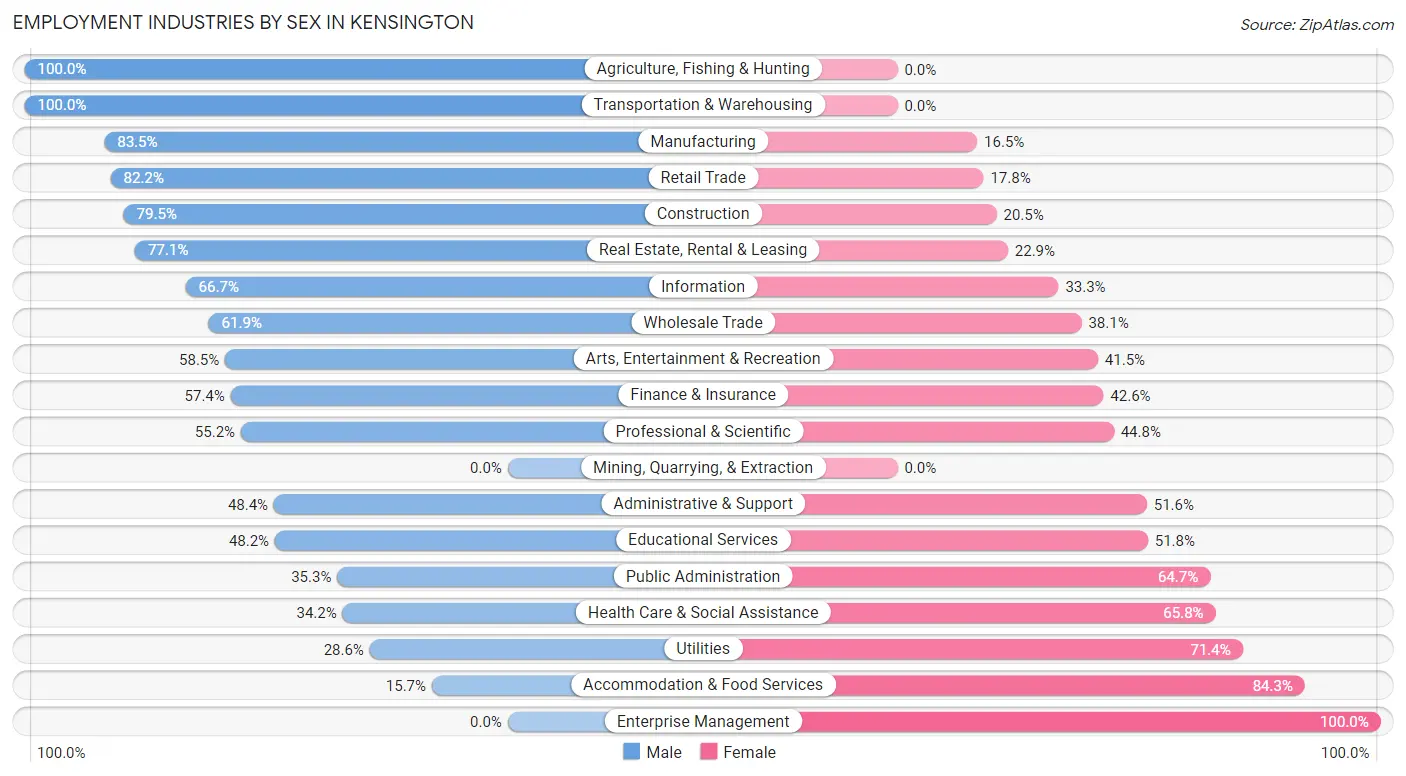
Employment Industries by Sex in Kensington
The Kensington industries that see more men than women are Agriculture, Fishing & Hunting (100.0%), Transportation & Warehousing (100.0%), and Manufacturing (83.5%), whereas the industries that tend to have a higher number of women are Enterprise Management (100.0%), Accommodation & Food Services (84.3%), and Utilities (71.4%).
| Industry | Male | Female |
| Agriculture, Fishing & Hunting | 18 (100.0%) | 0 (0.0%) |
| Mining, Quarrying, & Extraction | 0 (0.0%) | 0 (0.0%) |
| Construction | 31 (79.5%) | 8 (20.5%) |
| Manufacturing | 91 (83.5%) | 18 (16.5%) |
| Wholesale Trade | 26 (61.9%) | 16 (38.1%) |
| Retail Trade | 60 (82.2%) | 13 (17.8%) |
| Transportation & Warehousing | 69 (100.0%) | 0 (0.0%) |
| Utilities | 10 (28.6%) | 25 (71.4%) |
| Information | 88 (66.7%) | 44 (33.3%) |
| Finance & Insurance | 74 (57.4%) | 55 (42.6%) |
| Real Estate, Rental & Leasing | 27 (77.1%) | 8 (22.9%) |
| Professional & Scientific | 417 (55.2%) | 338 (44.8%) |
| Enterprise Management | 0 (0.0%) | 3 (100.0%) |
| Administrative & Support | 15 (48.4%) | 16 (51.6%) |
| Educational Services | 264 (48.2%) | 284 (51.8%) |
| Health Care & Social Assistance | 80 (34.2%) | 154 (65.8%) |
| Arts, Entertainment & Recreation | 86 (58.5%) | 61 (41.5%) |
| Accommodation & Food Services | 27 (15.7%) | 145 (84.3%) |
| Public Administration | 12 (35.3%) | 22 (64.7%) |
| Total | 1,404 (53.4%) | 1,225 (46.6%) |
Education in Kensington
School Enrollment in Kensington
The most common levels of schooling among the 1,207 students in Kensington are elementary school (370 | 30.6%), high school (220 | 18.2%), and middle school (196 | 16.2%).
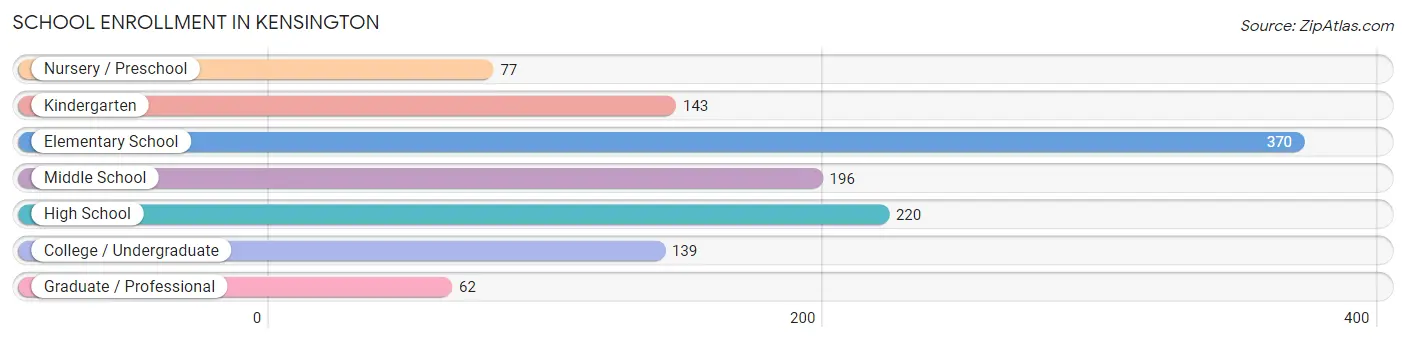
| School Level | # Students | % Students |
| Nursery / Preschool | 77 | 6.4% |
| Kindergarten | 143 | 11.8% |
| Elementary School | 370 | 30.6% |
| Middle School | 196 | 16.2% |
| High School | 220 | 18.2% |
| College / Undergraduate | 139 | 11.5% |
| Graduate / Professional | 62 | 5.1% |
| Total | 1,207 | 100.0% |
School Enrollment by Age by Funding Source in Kensington
Out of a total of 1,207 students who are enrolled in schools in Kensington, 313 (25.9%) attend a private institution, while the remaining 894 (74.1%) are enrolled in public schools. The age group of 3 to 4 year olds has the highest likelihood of being enrolled in private schools, with 55 (100.0% in the age bracket) enrolled. Conversely, the age group of 18 to 19 year olds has the lowest likelihood of being enrolled in a private school, with 3 (100.0% in the age bracket) attending a public institution.
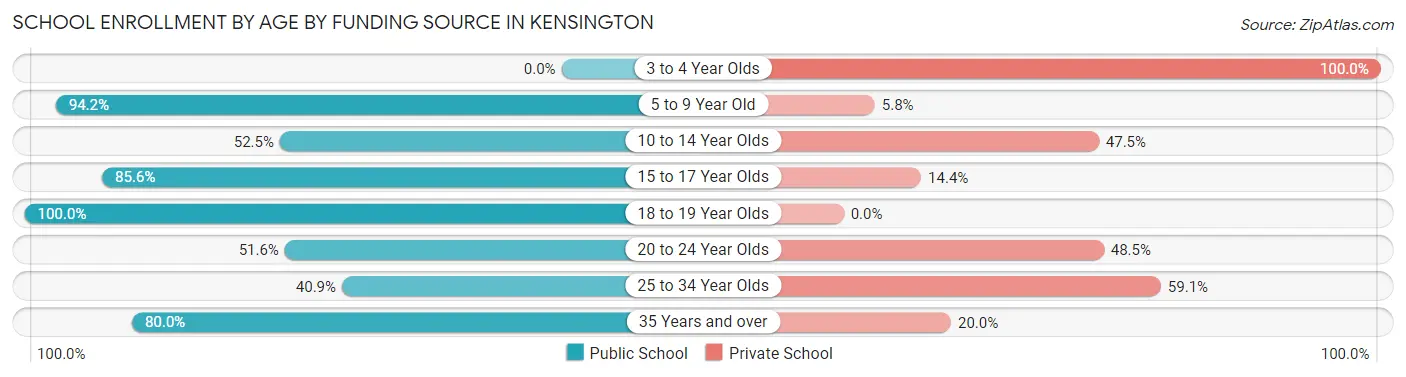
| Age Bracket | Public School | Private School |
| 3 to 4 Year Olds | 0 (0.0%) | 55 (100.0%) |
| 5 to 9 Year Old | 503 (94.2%) | 31 (5.8%) |
| 10 to 14 Year Olds | 117 (52.5%) | 106 (47.5%) |
| 15 to 17 Year Olds | 166 (85.6%) | 28 (14.4%) |
| 18 to 19 Year Olds | 3 (100.0%) | 0 (0.0%) |
| 20 to 24 Year Olds | 50 (51.5%) | 47 (48.4%) |
| 25 to 34 Year Olds | 27 (40.9%) | 39 (59.1%) |
| 35 Years and over | 28 (80.0%) | 7 (20.0%) |
| Total | 894 (74.1%) | 313 (25.9%) |
Educational Attainment by Field of Study in Kensington
Social sciences (674 | 18.5%), literature & languages (368 | 10.1%), bio, nature & agricultural (316 | 8.7%), liberal arts & history (312 | 8.6%), and engineering (302 | 8.3%) are the most common fields of study among 3,637 individuals in Kensington who have obtained a bachelor's degree or higher.
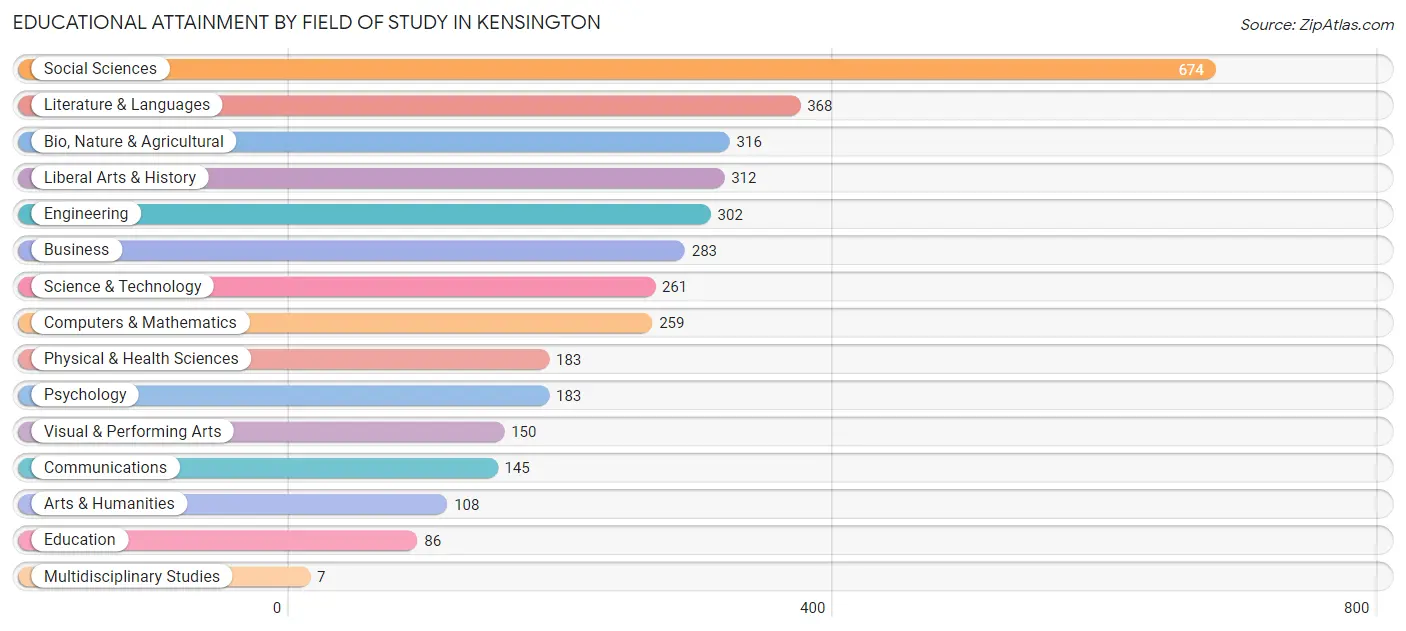
| Field of Study | # Graduates | % Graduates |
| Computers & Mathematics | 259 | 7.1% |
| Bio, Nature & Agricultural | 316 | 8.7% |
| Physical & Health Sciences | 183 | 5.0% |
| Psychology | 183 | 5.0% |
| Social Sciences | 674 | 18.5% |
| Engineering | 302 | 8.3% |
| Multidisciplinary Studies | 7 | 0.2% |
| Science & Technology | 261 | 7.2% |
| Business | 283 | 7.8% |
| Education | 86 | 2.4% |
| Literature & Languages | 368 | 10.1% |
| Liberal Arts & History | 312 | 8.6% |
| Visual & Performing Arts | 150 | 4.1% |
| Communications | 145 | 4.0% |
| Arts & Humanities | 108 | 3.0% |
| Total | 3,637 | 100.0% |
Transportation & Commute in Kensington
Vehicle Availability by Sex in Kensington
The most prevalent vehicle ownership categories in Kensington are males with 2 vehicles (584, accounting for 42.0%) and females with 2 vehicles (421, making up 49.9%).
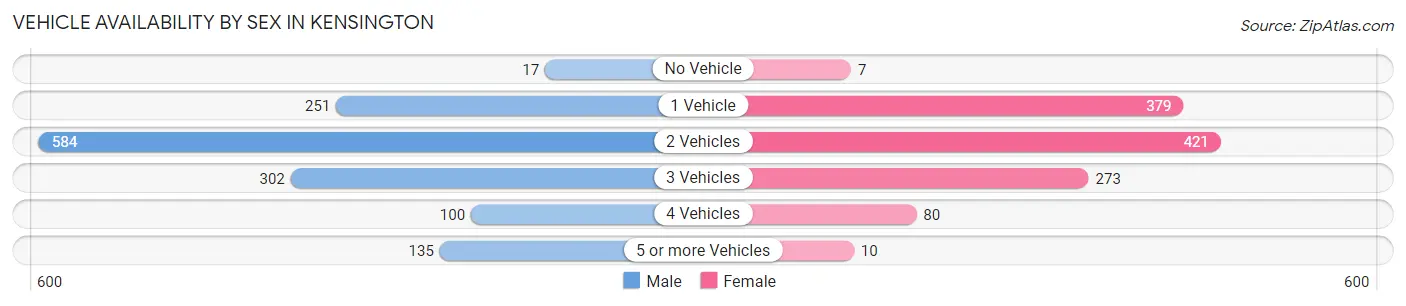
| Vehicles Available | Male | Female |
| No Vehicle | 17 (1.2%) | 7 (0.6%) |
| 1 Vehicle | 251 (18.1%) | 379 (32.4%) |
| 2 Vehicles | 584 (42.0%) | 421 (36.0%) |
| 3 Vehicles | 302 (21.7%) | 273 (23.3%) |
| 4 Vehicles | 100 (7.2%) | 80 (6.8%) |
| 5 or more Vehicles | 135 (9.7%) | 10 (0.9%) |
| Total | 1,389 (100.0%) | 1,170 (100.0%) |
Commute Time in Kensington
The most frequently occuring commute durations in Kensington are 10 to 14 minutes (259 commuters, 18.9%), 60 to 89 minutes (220 commuters, 16.0%), and 20 to 24 minutes (155 commuters, 11.3%).
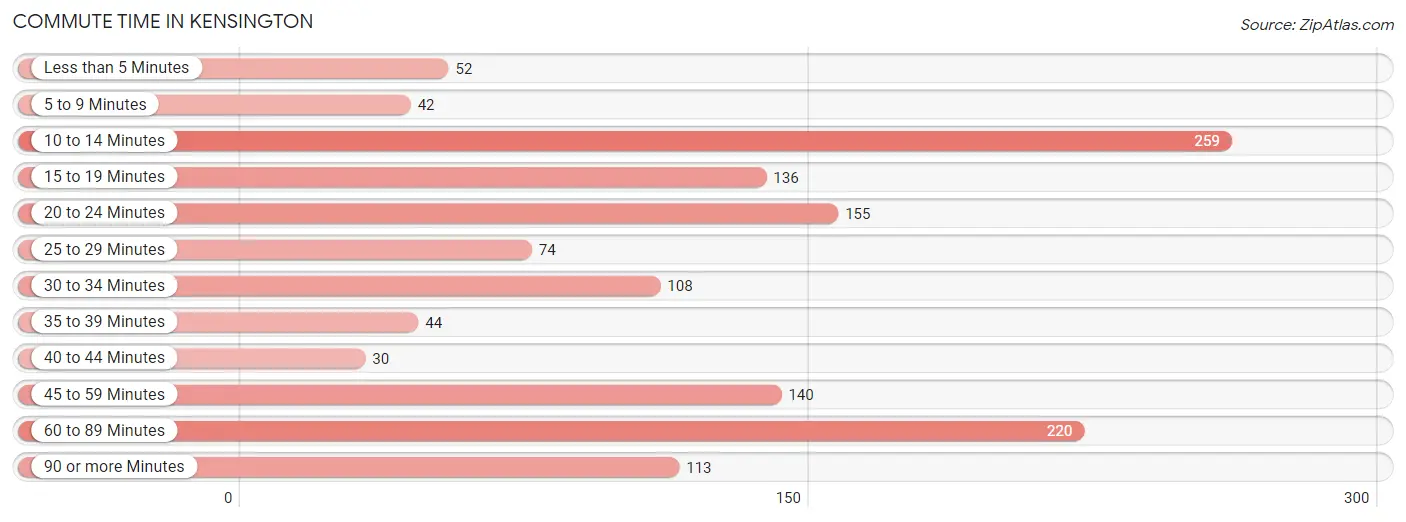
| Commute Time | # Commuters | % Commuters |
| Less than 5 Minutes | 52 | 3.8% |
| 5 to 9 Minutes | 42 | 3.1% |
| 10 to 14 Minutes | 259 | 18.9% |
| 15 to 19 Minutes | 136 | 9.9% |
| 20 to 24 Minutes | 155 | 11.3% |
| 25 to 29 Minutes | 74 | 5.4% |
| 30 to 34 Minutes | 108 | 7.9% |
| 35 to 39 Minutes | 44 | 3.2% |
| 40 to 44 Minutes | 30 | 2.2% |
| 45 to 59 Minutes | 140 | 10.2% |
| 60 to 89 Minutes | 220 | 16.0% |
| 90 or more Minutes | 113 | 8.2% |
Commute Time by Sex in Kensington
The most common commute times in Kensington are 60 to 89 minutes (203 commuters, 23.9%) for males and 10 to 14 minutes (134 commuters, 25.6%) for females.
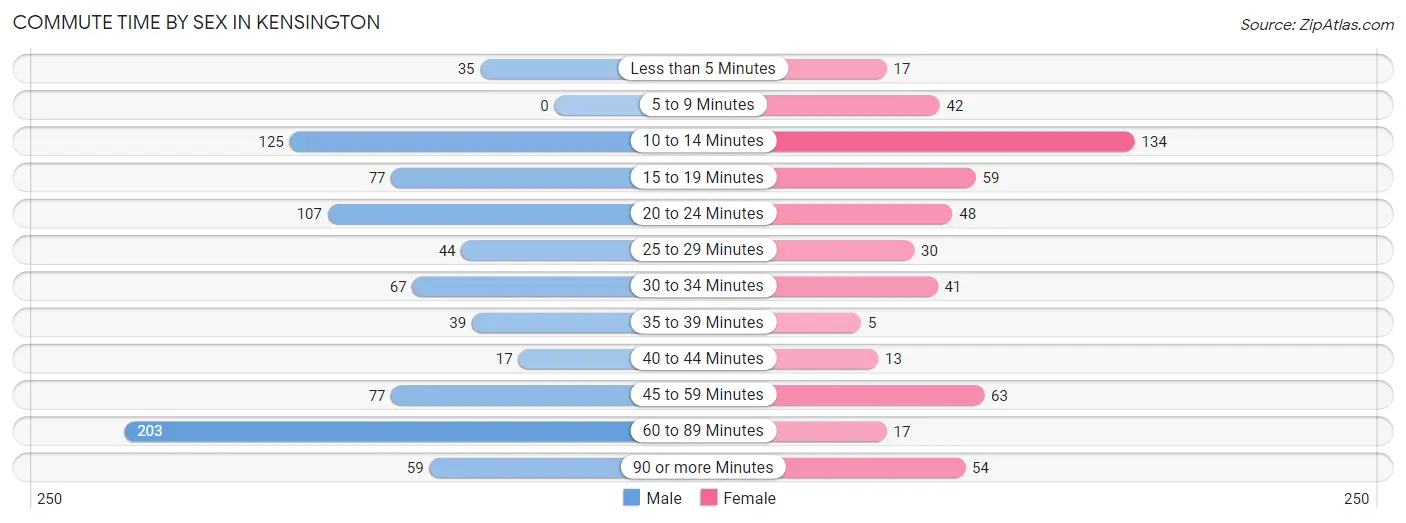
| Commute Time | Male | Female |
| Less than 5 Minutes | 35 (4.1%) | 17 (3.3%) |
| 5 to 9 Minutes | 0 (0.0%) | 42 (8.0%) |
| 10 to 14 Minutes | 125 (14.7%) | 134 (25.6%) |
| 15 to 19 Minutes | 77 (9.1%) | 59 (11.3%) |
| 20 to 24 Minutes | 107 (12.6%) | 48 (9.2%) |
| 25 to 29 Minutes | 44 (5.2%) | 30 (5.7%) |
| 30 to 34 Minutes | 67 (7.9%) | 41 (7.8%) |
| 35 to 39 Minutes | 39 (4.6%) | 5 (1.0%) |
| 40 to 44 Minutes | 17 (2.0%) | 13 (2.5%) |
| 45 to 59 Minutes | 77 (9.1%) | 63 (12.0%) |
| 60 to 89 Minutes | 203 (23.9%) | 17 (3.3%) |
| 90 or more Minutes | 59 (6.9%) | 54 (10.3%) |
Time of Departure to Work by Sex in Kensington
The most frequent times of departure to work in Kensington are 8:00 AM to 8:29 AM (180, 21.2%) for males and 7:30 AM to 7:59 AM (140, 26.8%) for females.
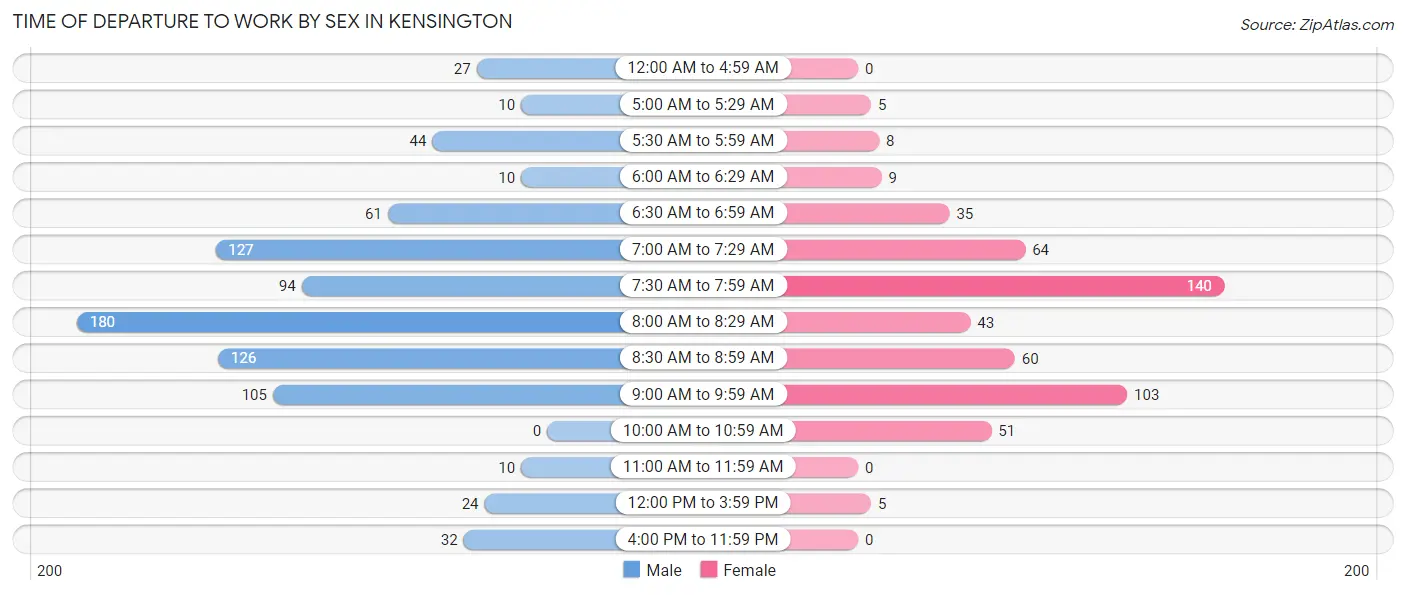
| Time of Departure | Male | Female |
| 12:00 AM to 4:59 AM | 27 (3.2%) | 0 (0.0%) |
| 5:00 AM to 5:29 AM | 10 (1.2%) | 5 (1.0%) |
| 5:30 AM to 5:59 AM | 44 (5.2%) | 8 (1.5%) |
| 6:00 AM to 6:29 AM | 10 (1.2%) | 9 (1.7%) |
| 6:30 AM to 6:59 AM | 61 (7.2%) | 35 (6.7%) |
| 7:00 AM to 7:29 AM | 127 (14.9%) | 64 (12.2%) |
| 7:30 AM to 7:59 AM | 94 (11.1%) | 140 (26.8%) |
| 8:00 AM to 8:29 AM | 180 (21.2%) | 43 (8.2%) |
| 8:30 AM to 8:59 AM | 126 (14.8%) | 60 (11.5%) |
| 9:00 AM to 9:59 AM | 105 (12.3%) | 103 (19.7%) |
| 10:00 AM to 10:59 AM | 0 (0.0%) | 51 (9.8%) |
| 11:00 AM to 11:59 AM | 10 (1.2%) | 0 (0.0%) |
| 12:00 PM to 3:59 PM | 24 (2.8%) | 5 (1.0%) |
| 4:00 PM to 11:59 PM | 32 (3.8%) | 0 (0.0%) |
| Total | 850 (100.0%) | 523 (100.0%) |
Housing Occupancy in Kensington
Occupancy by Ownership in Kensington
Of the total 2,110 dwellings in Kensington, owner-occupied units account for 1,795 (85.1%), while renter-occupied units make up 315 (14.9%).
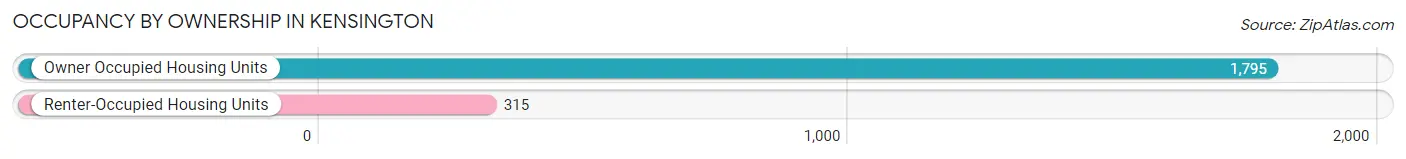
| Occupancy | # Housing Units | % Housing Units |
| Owner Occupied Housing Units | 1,795 | 85.1% |
| Renter-Occupied Housing Units | 315 | 14.9% |
| Total Occupied Housing Units | 2,110 | 100.0% |
Occupancy by Household Size in Kensington
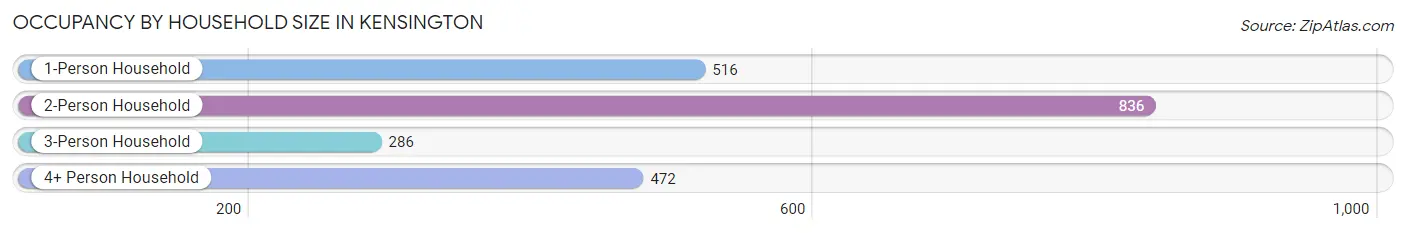
| Household Size | # Housing Units | % Housing Units |
| 1-Person Household | 516 | 24.4% |
| 2-Person Household | 836 | 39.6% |
| 3-Person Household | 286 | 13.6% |
| 4+ Person Household | 472 | 22.4% |
| Total Housing Units | 2,110 | 100.0% |
Occupancy by Ownership by Household Size in Kensington
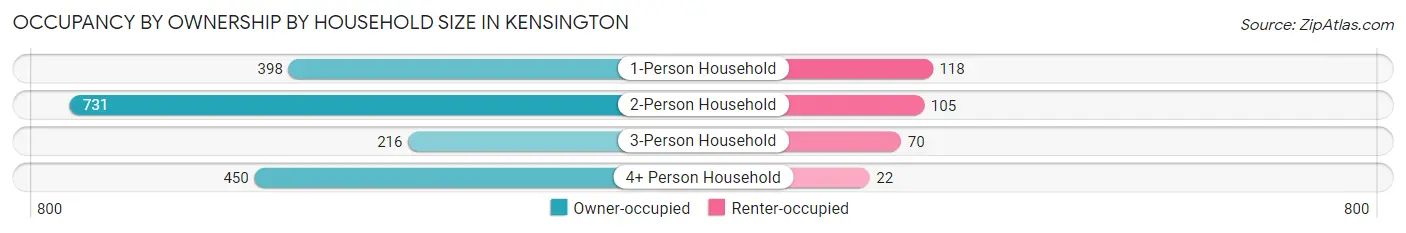
| Household Size | Owner-occupied | Renter-occupied |
| 1-Person Household | 398 (77.1%) | 118 (22.9%) |
| 2-Person Household | 731 (87.4%) | 105 (12.6%) |
| 3-Person Household | 216 (75.5%) | 70 (24.5%) |
| 4+ Person Household | 450 (95.3%) | 22 (4.7%) |
| Total Housing Units | 1,795 (85.1%) | 315 (14.9%) |
Occupancy by Educational Attainment in Kensington
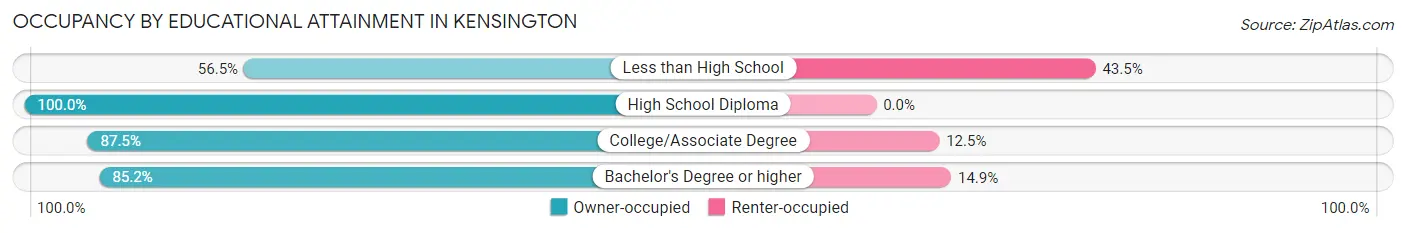
| Household Size | Owner-occupied | Renter-occupied |
| Less than High School | 13 (56.5%) | 10 (43.5%) |
| High School Diploma | 16 (100.0%) | 0 (0.0%) |
| College/Associate Degree | 98 (87.5%) | 14 (12.5%) |
| Bachelor's Degree or higher | 1,668 (85.2%) | 291 (14.8%) |
Occupancy by Age of Householder in Kensington
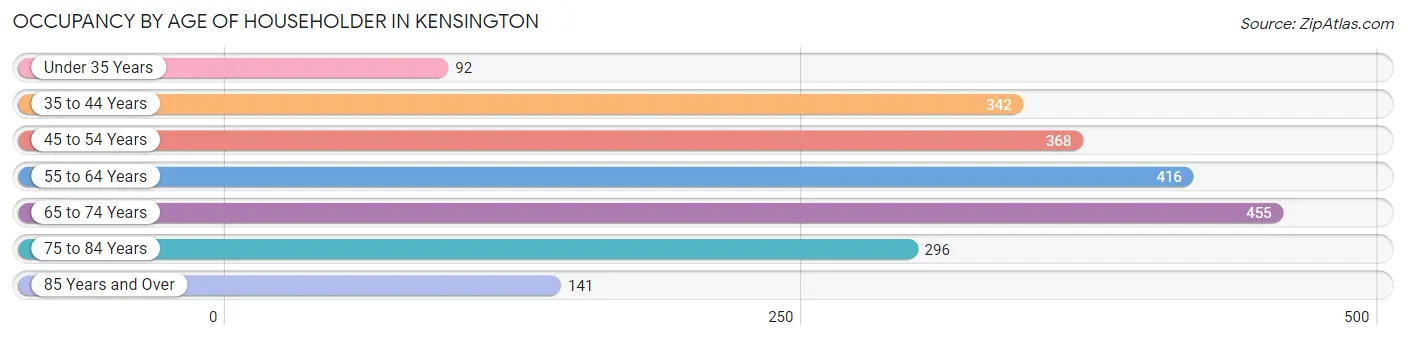
| Age Bracket | # Households | % Households |
| Under 35 Years | 92 | 4.4% |
| 35 to 44 Years | 342 | 16.2% |
| 45 to 54 Years | 368 | 17.4% |
| 55 to 64 Years | 416 | 19.7% |
| 65 to 74 Years | 455 | 21.6% |
| 75 to 84 Years | 296 | 14.0% |
| 85 Years and Over | 141 | 6.7% |
| Total | 2,110 | 100.0% |
Housing Finances in Kensington
Median Income by Occupancy in Kensington
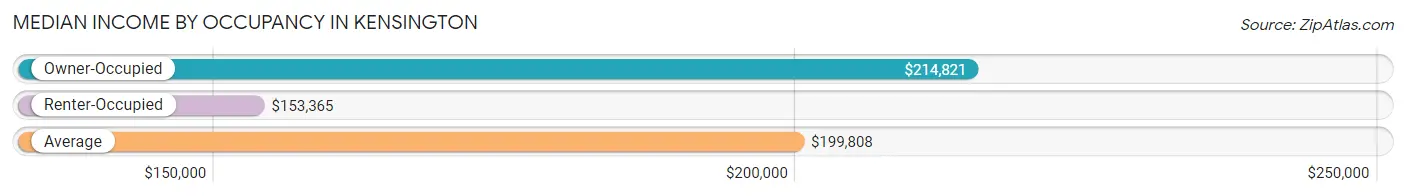
| Occupancy Type | # Households | Median Income |
| Owner-Occupied | 1,795 (85.1%) | $214,821 |
| Renter-Occupied | 315 (14.9%) | $153,365 |
| Average | 2,110 (100.0%) | $199,808 |
Occupancy by Householder Income Bracket in Kensington
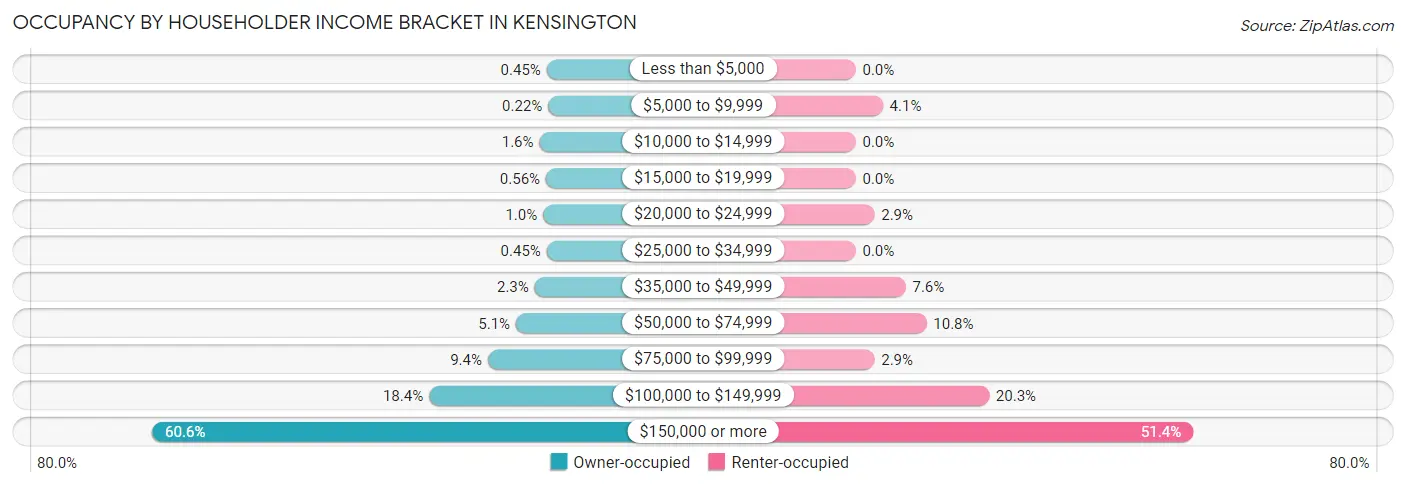
| Income Bracket | Owner-occupied | Renter-occupied |
| Less than $5,000 | 8 (0.4%) | 0 (0.0%) |
| $5,000 to $9,999 | 4 (0.2%) | 13 (4.1%) |
| $10,000 to $14,999 | 28 (1.6%) | 0 (0.0%) |
| $15,000 to $19,999 | 10 (0.6%) | 0 (0.0%) |
| $20,000 to $24,999 | 18 (1.0%) | 9 (2.9%) |
| $25,000 to $34,999 | 8 (0.4%) | 0 (0.0%) |
| $35,000 to $49,999 | 41 (2.3%) | 24 (7.6%) |
| $50,000 to $74,999 | 92 (5.1%) | 34 (10.8%) |
| $75,000 to $99,999 | 169 (9.4%) | 9 (2.9%) |
| $100,000 to $149,999 | 330 (18.4%) | 64 (20.3%) |
| $150,000 or more | 1,087 (60.6%) | 162 (51.4%) |
| Total | 1,795 (100.0%) | 315 (100.0%) |
Monthly Housing Cost Tiers in Kensington
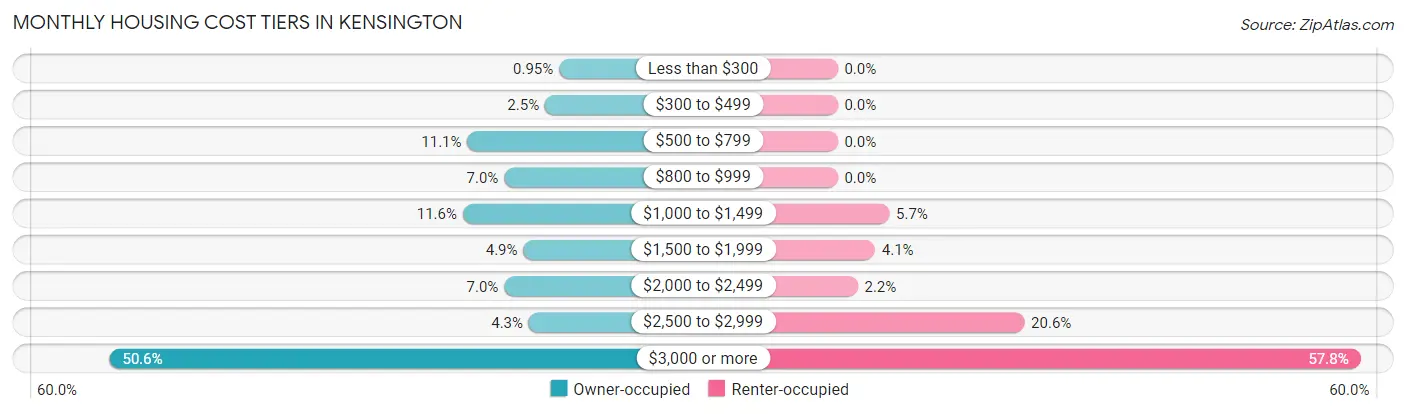
| Monthly Cost | Owner-occupied | Renter-occupied |
| Less than $300 | 17 (0.9%) | 0 (0.0%) |
| $300 to $499 | 45 (2.5%) | 0 (0.0%) |
| $500 to $799 | 199 (11.1%) | 0 (0.0%) |
| $800 to $999 | 126 (7.0%) | 0 (0.0%) |
| $1,000 to $1,499 | 208 (11.6%) | 18 (5.7%) |
| $1,500 to $1,999 | 88 (4.9%) | 13 (4.1%) |
| $2,000 to $2,499 | 126 (7.0%) | 7 (2.2%) |
| $2,500 to $2,999 | 77 (4.3%) | 65 (20.6%) |
| $3,000 or more | 909 (50.6%) | 182 (57.8%) |
| Total | 1,795 (100.0%) | 315 (100.0%) |
Physical Housing Characteristics in Kensington
Housing Structures in Kensington
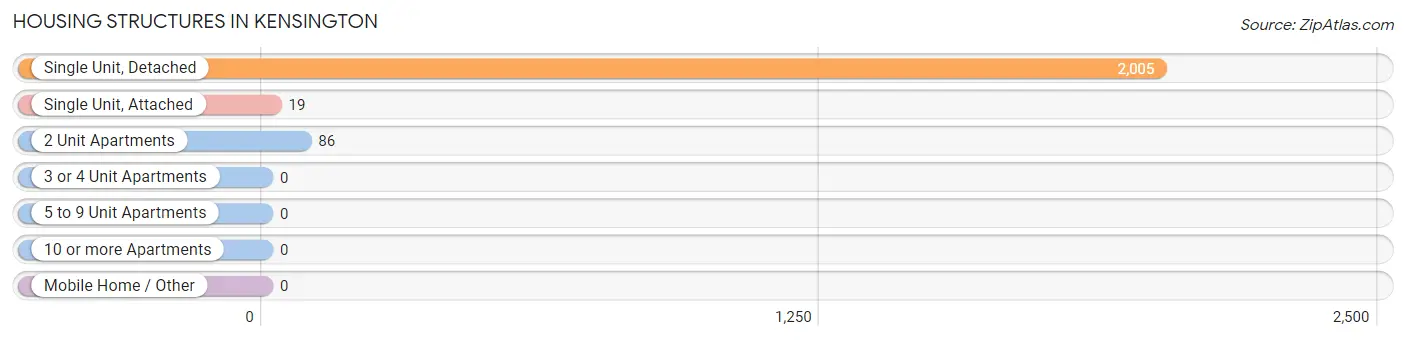
| Structure Type | # Housing Units | % Housing Units |
| Single Unit, Detached | 2,005 | 95.0% |
| Single Unit, Attached | 19 | 0.9% |
| 2 Unit Apartments | 86 | 4.1% |
| 3 or 4 Unit Apartments | 0 | 0.0% |
| 5 to 9 Unit Apartments | 0 | 0.0% |
| 10 or more Apartments | 0 | 0.0% |
| Mobile Home / Other | 0 | 0.0% |
| Total | 2,110 | 100.0% |
Housing Structures by Occupancy in Kensington
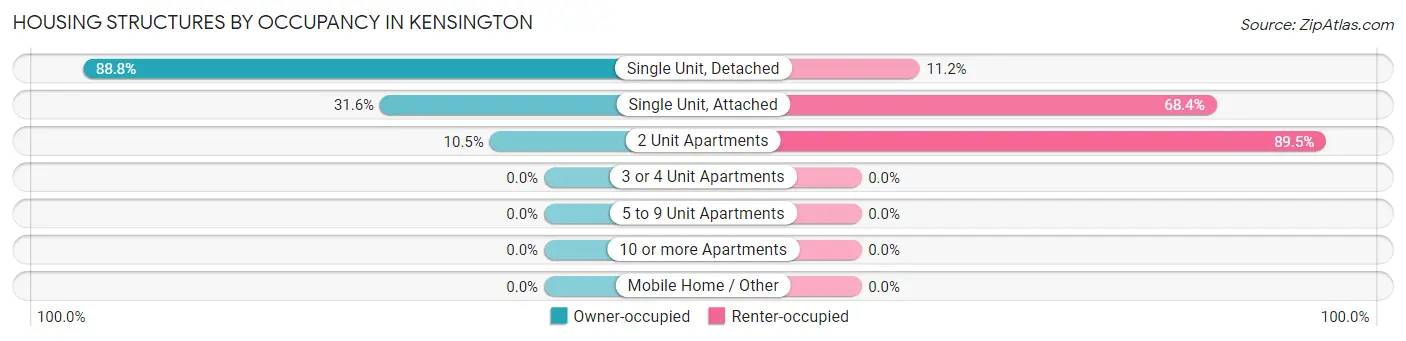
| Structure Type | Owner-occupied | Renter-occupied |
| Single Unit, Detached | 1,780 (88.8%) | 225 (11.2%) |
| Single Unit, Attached | 6 (31.6%) | 13 (68.4%) |
| 2 Unit Apartments | 9 (10.5%) | 77 (89.5%) |
| 3 or 4 Unit Apartments | 0 (0.0%) | 0 (0.0%) |
| 5 to 9 Unit Apartments | 0 (0.0%) | 0 (0.0%) |
| 10 or more Apartments | 0 (0.0%) | 0 (0.0%) |
| Mobile Home / Other | 0 (0.0%) | 0 (0.0%) |
| Total | 1,795 (85.1%) | 315 (14.9%) |
Housing Structures by Number of Rooms in Kensington
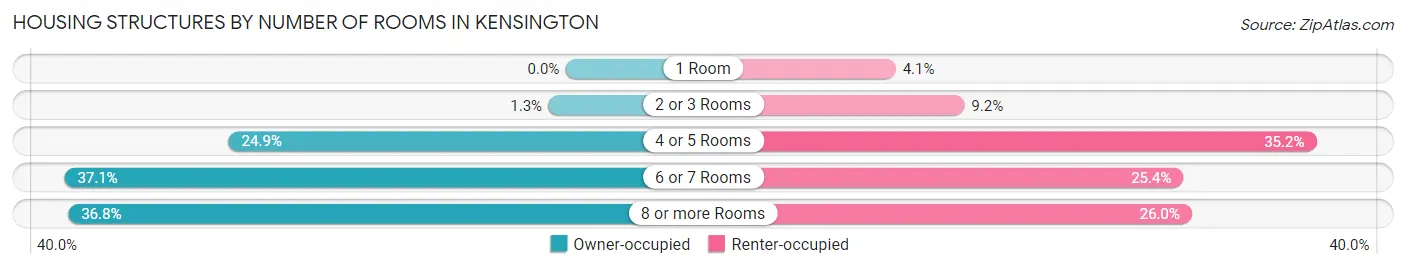
| Number of Rooms | Owner-occupied | Renter-occupied |
| 1 Room | 0 (0.0%) | 13 (4.1%) |
| 2 or 3 Rooms | 23 (1.3%) | 29 (9.2%) |
| 4 or 5 Rooms | 447 (24.9%) | 111 (35.2%) |
| 6 or 7 Rooms | 665 (37.0%) | 80 (25.4%) |
| 8 or more Rooms | 660 (36.8%) | 82 (26.0%) |
| Total | 1,795 (100.0%) | 315 (100.0%) |
Housing Structure by Heating Type in Kensington
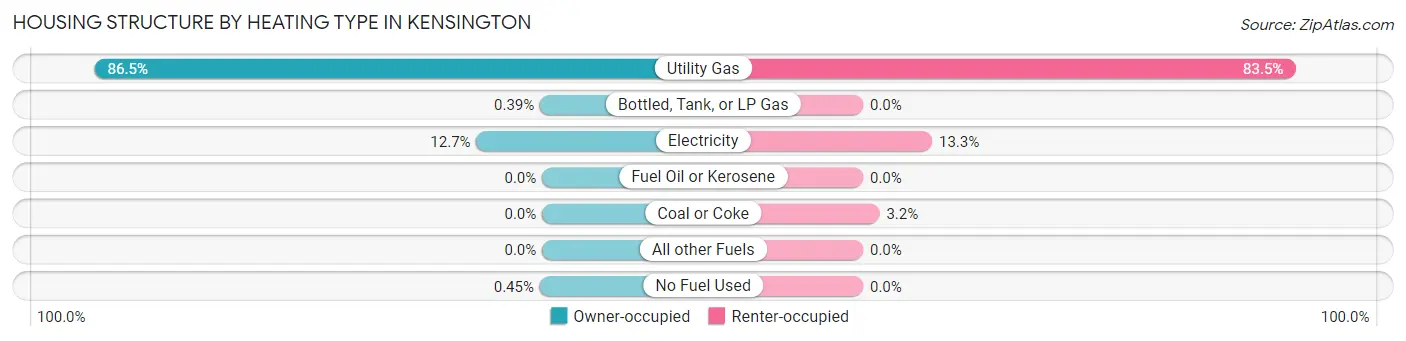
| Heating Type | Owner-occupied | Renter-occupied |
| Utility Gas | 1,552 (86.5%) | 263 (83.5%) |
| Bottled, Tank, or LP Gas | 7 (0.4%) | 0 (0.0%) |
| Electricity | 228 (12.7%) | 42 (13.3%) |
| Fuel Oil or Kerosene | 0 (0.0%) | 0 (0.0%) |
| Coal or Coke | 0 (0.0%) | 10 (3.2%) |
| All other Fuels | 0 (0.0%) | 0 (0.0%) |
| No Fuel Used | 8 (0.4%) | 0 (0.0%) |
| Total | 1,795 (100.0%) | 315 (100.0%) |
Household Vehicle Usage in Kensington
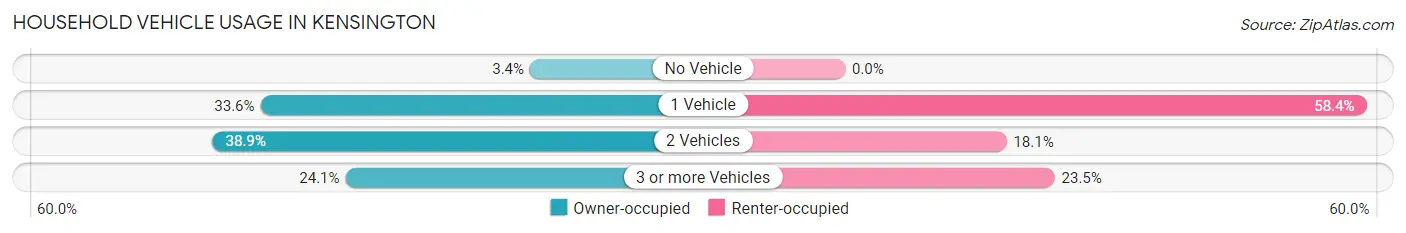
| Vehicles per Household | Owner-occupied | Renter-occupied |
| No Vehicle | 61 (3.4%) | 0 (0.0%) |
| 1 Vehicle | 603 (33.6%) | 184 (58.4%) |
| 2 Vehicles | 699 (38.9%) | 57 (18.1%) |
| 3 or more Vehicles | 432 (24.1%) | 74 (23.5%) |
| Total | 1,795 (100.0%) | 315 (100.0%) |
Real Estate & Mortgages in Kensington
Real Estate and Mortgage Overview in Kensington
| Characteristic | Without Mortgage | With Mortgage |
| Housing Units | 684 | 1,111 |
| Median Property Value | $1,184,500 | $1,411,400 |
| Median Household Income | $114,107 | $890 |
| Monthly Housing Costs | $937 | $909 |
| Real Estate Taxes | $4,660 | $11 |
Property Value by Mortgage Status in Kensington
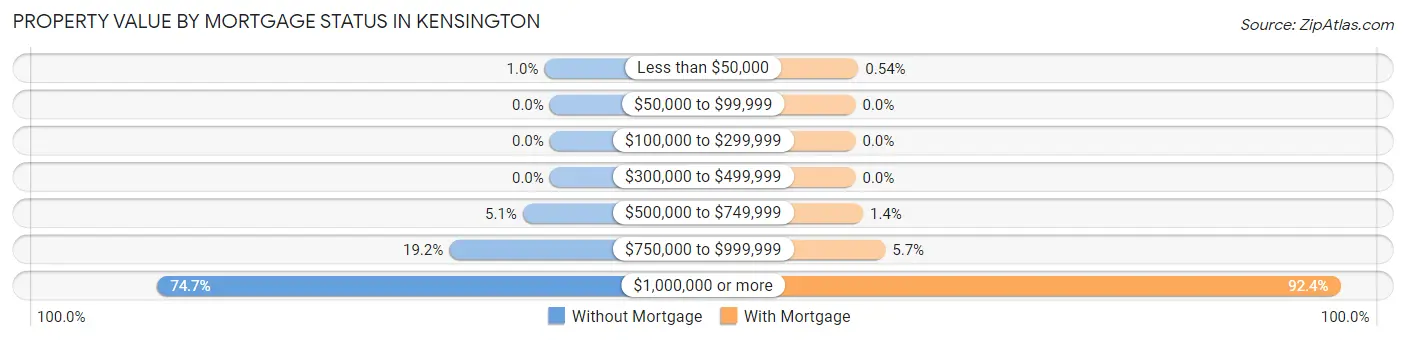
| Property Value | Without Mortgage | With Mortgage |
| Less than $50,000 | 7 (1.0%) | 6 (0.5%) |
| $50,000 to $99,999 | 0 (0.0%) | 0 (0.0%) |
| $100,000 to $299,999 | 0 (0.0%) | 0 (0.0%) |
| $300,000 to $499,999 | 0 (0.0%) | 0 (0.0%) |
| $500,000 to $749,999 | 35 (5.1%) | 16 (1.4%) |
| $750,000 to $999,999 | 131 (19.2%) | 63 (5.7%) |
| $1,000,000 or more | 511 (74.7%) | 1,026 (92.3%) |
| Total | 684 (100.0%) | 1,111 (100.0%) |
Household Income by Mortgage Status in Kensington
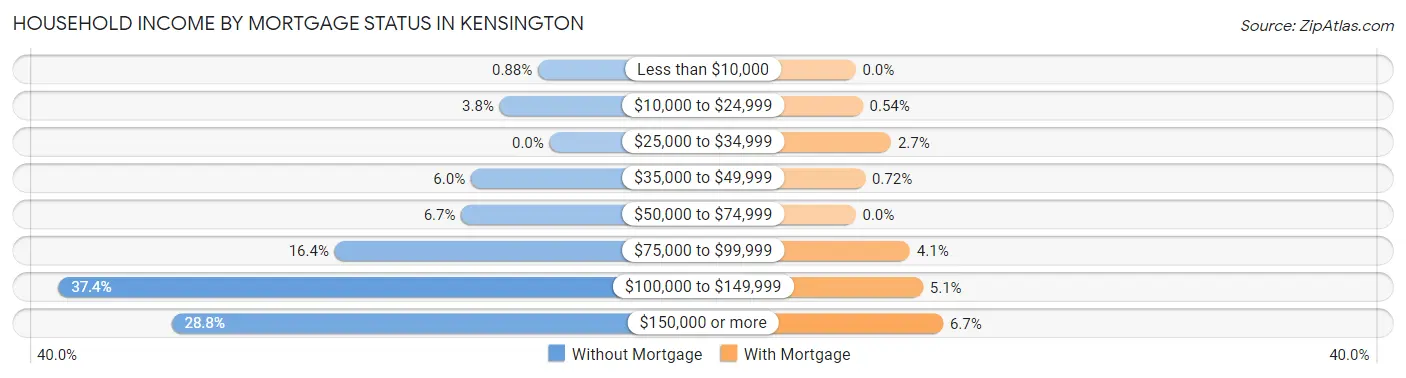
| Household Income | Without Mortgage | With Mortgage |
| Less than $10,000 | 6 (0.9%) | 0 (0.0%) |
| $10,000 to $24,999 | 26 (3.8%) | 6 (0.5%) |
| $25,000 to $34,999 | 0 (0.0%) | 30 (2.7%) |
| $35,000 to $49,999 | 41 (6.0%) | 8 (0.7%) |
| $50,000 to $74,999 | 46 (6.7%) | 0 (0.0%) |
| $75,000 to $99,999 | 112 (16.4%) | 46 (4.1%) |
| $100,000 to $149,999 | 256 (37.4%) | 57 (5.1%) |
| $150,000 or more | 197 (28.8%) | 74 (6.7%) |
| Total | 684 (100.0%) | 1,111 (100.0%) |
Property Value to Household Income Ratio in Kensington
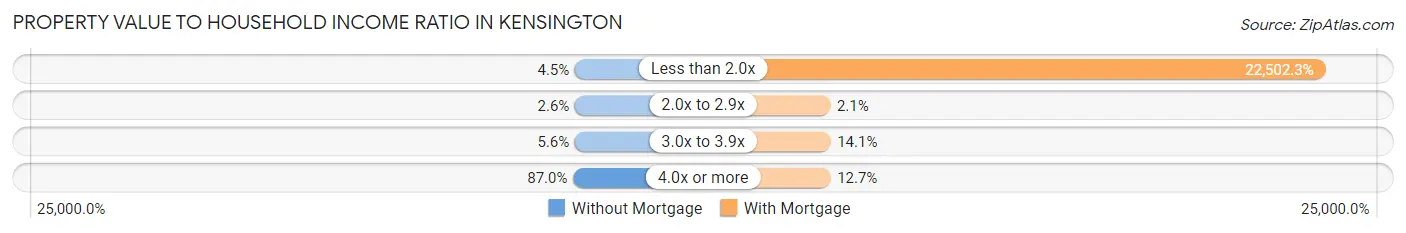
| Value-to-Income Ratio | Without Mortgage | With Mortgage |
| Less than 2.0x | 31 (4.5%) | 250,001 (22,502.3%) |
| 2.0x to 2.9x | 18 (2.6%) | 23 (2.1%) |
| 3.0x to 3.9x | 38 (5.6%) | 157 (14.1%) |
| 4.0x or more | 595 (87.0%) | 141 (12.7%) |
| Total | 684 (100.0%) | 1,111 (100.0%) |
Real Estate Taxes by Mortgage Status in Kensington
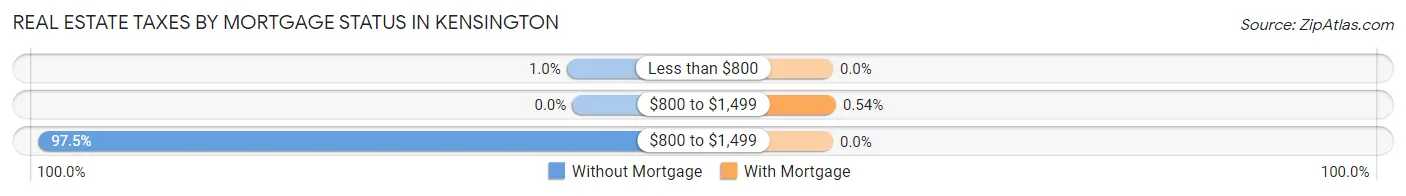
| Property Taxes | Without Mortgage | With Mortgage |
| Less than $800 | 7 (1.0%) | 0 (0.0%) |
| $800 to $1,499 | 0 (0.0%) | 6 (0.5%) |
| $800 to $1,499 | 667 (97.5%) | 0 (0.0%) |
| Total | 684 (100.0%) | 1,111 (100.0%) |
Health & Disability in Kensington
Health Insurance Coverage by Age in Kensington
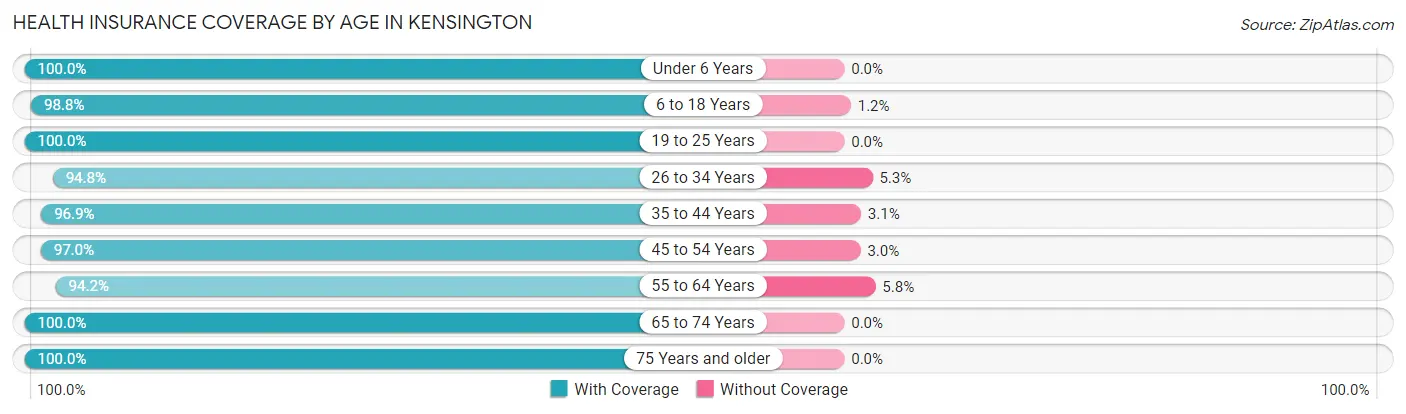
| Age Bracket | With Coverage | Without Coverage |
| Under 6 Years | 283 (100.0%) | 0 (0.0%) |
| 6 to 18 Years | 900 (98.8%) | 11 (1.2%) |
| 19 to 25 Years | 226 (100.0%) | 0 (0.0%) |
| 26 to 34 Years | 343 (94.8%) | 19 (5.2%) |
| 35 to 44 Years | 657 (96.9%) | 21 (3.1%) |
| 45 to 54 Years | 706 (97.0%) | 22 (3.0%) |
| 55 to 64 Years | 763 (94.2%) | 47 (5.8%) |
| 65 to 74 Years | 747 (100.0%) | 0 (0.0%) |
| 75 Years and older | 564 (100.0%) | 0 (0.0%) |
| Total | 5,189 (97.7%) | 120 (2.3%) |
Health Insurance Coverage by Citizenship Status in Kensington
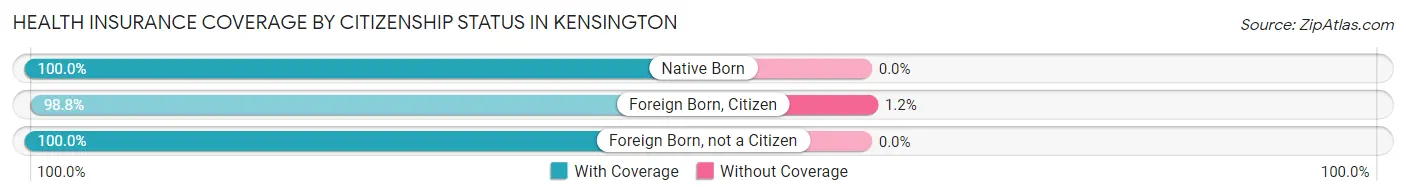
| Citizenship Status | With Coverage | Without Coverage |
| Native Born | 283 (100.0%) | 0 (0.0%) |
| Foreign Born, Citizen | 900 (98.8%) | 11 (1.2%) |
| Foreign Born, not a Citizen | 226 (100.0%) | 0 (0.0%) |
Health Insurance Coverage by Household Income in Kensington
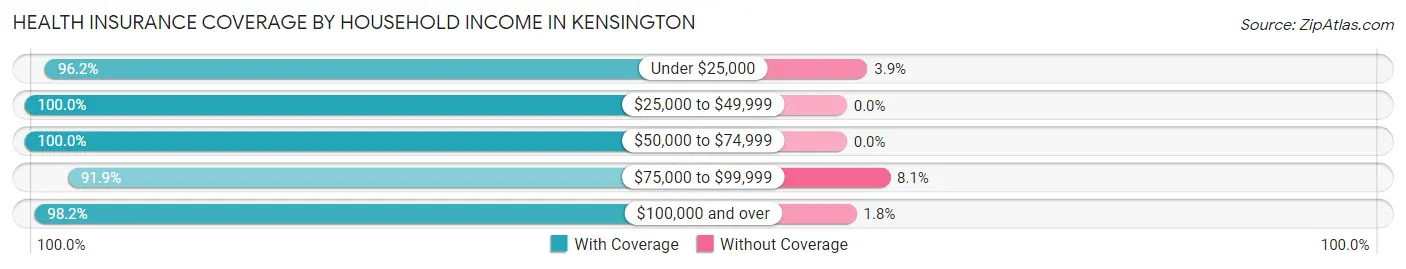
| Household Income | With Coverage | Without Coverage |
| Under $25,000 | 125 (96.2%) | 5 (3.8%) |
| $25,000 to $49,999 | 81 (100.0%) | 0 (0.0%) |
| $50,000 to $74,999 | 184 (100.0%) | 0 (0.0%) |
| $75,000 to $99,999 | 306 (91.9%) | 27 (8.1%) |
| $100,000 and over | 4,483 (98.2%) | 84 (1.8%) |
Public vs Private Health Insurance Coverage by Age in Kensington
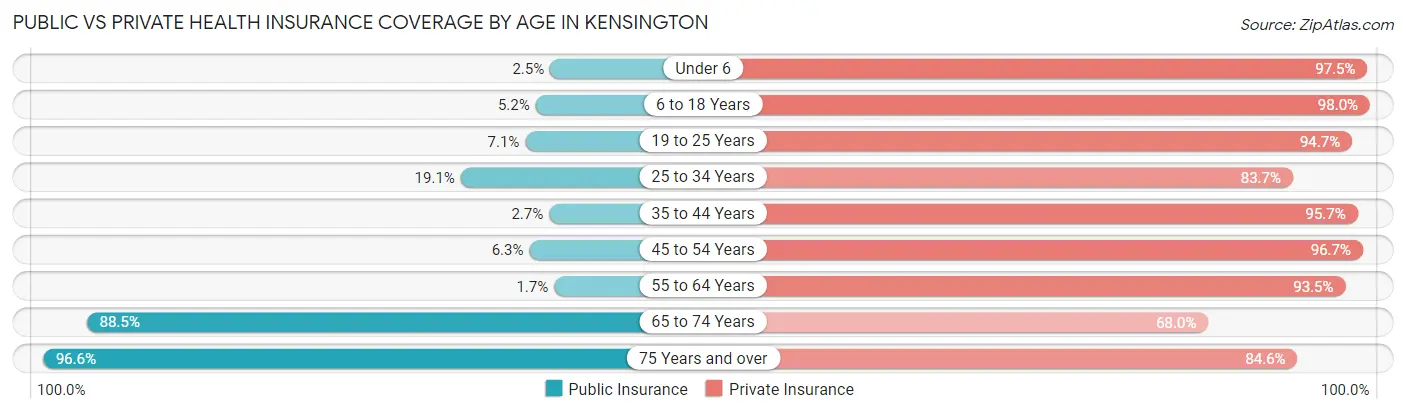
| Age Bracket | Public Insurance | Private Insurance |
| Under 6 | 7 (2.5%) | 276 (97.5%) |
| 6 to 18 Years | 47 (5.2%) | 893 (98.0%) |
| 19 to 25 Years | 16 (7.1%) | 214 (94.7%) |
| 25 to 34 Years | 69 (19.1%) | 303 (83.7%) |
| 35 to 44 Years | 18 (2.6%) | 649 (95.7%) |
| 45 to 54 Years | 46 (6.3%) | 704 (96.7%) |
| 55 to 64 Years | 14 (1.7%) | 757 (93.5%) |
| 65 to 74 Years | 661 (88.5%) | 508 (68.0%) |
| 75 Years and over | 545 (96.6%) | 477 (84.6%) |
| Total | 1,423 (26.8%) | 4,781 (90.0%) |
Disability Status by Sex by Age in Kensington
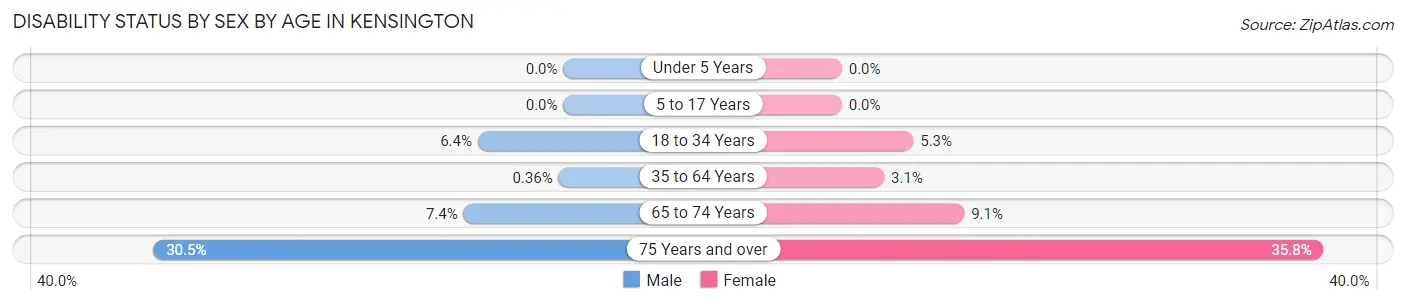
| Age Bracket | Male | Female |
| Under 5 Years | 0 (0.0%) | 0 (0.0%) |
| 5 to 17 Years | 0 (0.0%) | 0 (0.0%) |
| 18 to 34 Years | 23 (6.4%) | 12 (5.3%) |
| 35 to 64 Years | 4 (0.4%) | 35 (3.1%) |
| 65 to 74 Years | 26 (7.4%) | 36 (9.1%) |
| 75 Years and over | 67 (30.4%) | 123 (35.8%) |
Disability Class by Sex by Age in Kensington
Disability Class: Hearing Difficulty
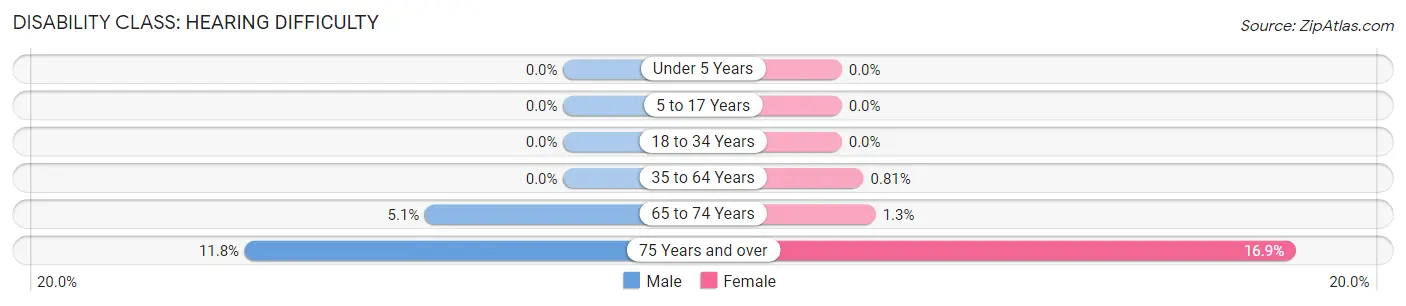
| Age Bracket | Male | Female |
| Under 5 Years | 0 (0.0%) | 0 (0.0%) |
| 5 to 17 Years | 0 (0.0%) | 0 (0.0%) |
| 18 to 34 Years | 0 (0.0%) | 0 (0.0%) |
| 35 to 64 Years | 0 (0.0%) | 9 (0.8%) |
| 65 to 74 Years | 18 (5.1%) | 5 (1.3%) |
| 75 Years and over | 26 (11.8%) | 58 (16.9%) |
Disability Class: Vision Difficulty
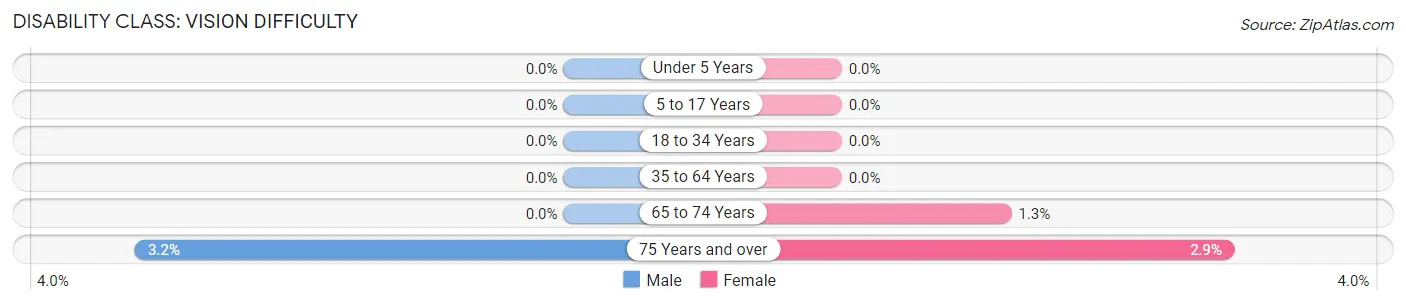
| Age Bracket | Male | Female |
| Under 5 Years | 0 (0.0%) | 0 (0.0%) |
| 5 to 17 Years | 0 (0.0%) | 0 (0.0%) |
| 18 to 34 Years | 0 (0.0%) | 0 (0.0%) |
| 35 to 64 Years | 0 (0.0%) | 0 (0.0%) |
| 65 to 74 Years | 0 (0.0%) | 5 (1.3%) |
| 75 Years and over | 7 (3.2%) | 10 (2.9%) |
Disability Class: Cognitive Difficulty
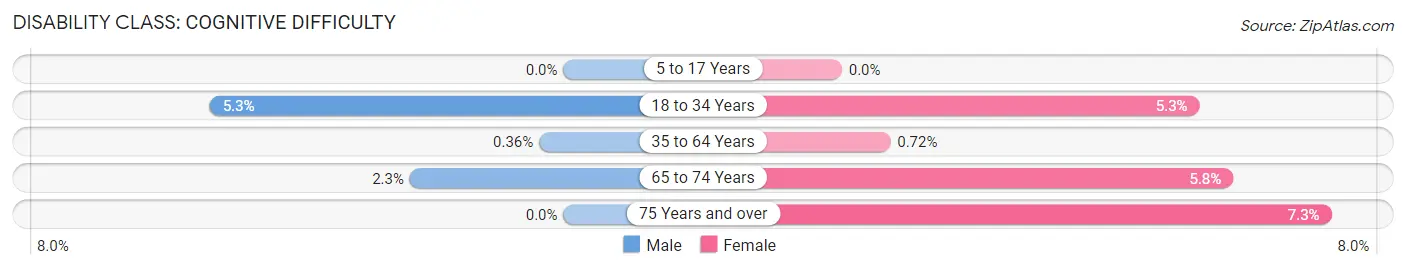
| Age Bracket | Male | Female |
| 5 to 17 Years | 0 (0.0%) | 0 (0.0%) |
| 18 to 34 Years | 19 (5.2%) | 12 (5.3%) |
| 35 to 64 Years | 4 (0.4%) | 8 (0.7%) |
| 65 to 74 Years | 8 (2.3%) | 23 (5.8%) |
| 75 Years and over | 0 (0.0%) | 25 (7.3%) |
Disability Class: Ambulatory Difficulty
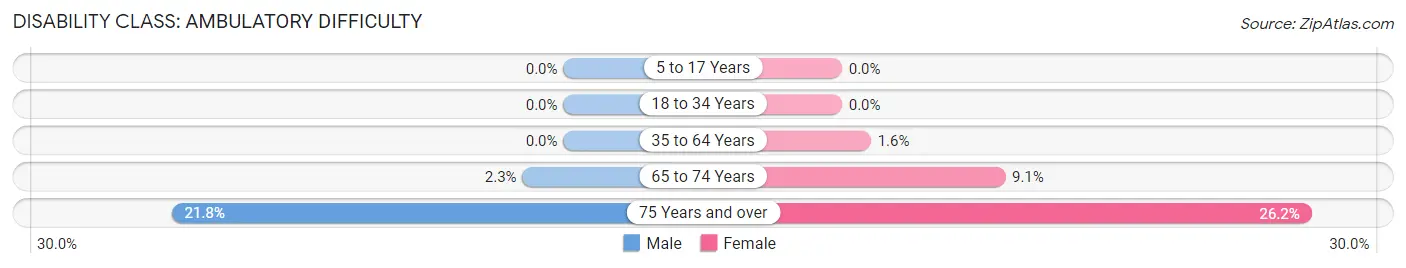
| Age Bracket | Male | Female |
| 5 to 17 Years | 0 (0.0%) | 0 (0.0%) |
| 18 to 34 Years | 0 (0.0%) | 0 (0.0%) |
| 35 to 64 Years | 0 (0.0%) | 18 (1.6%) |
| 65 to 74 Years | 8 (2.3%) | 36 (9.1%) |
| 75 Years and over | 48 (21.8%) | 90 (26.2%) |
Disability Class: Self-Care Difficulty
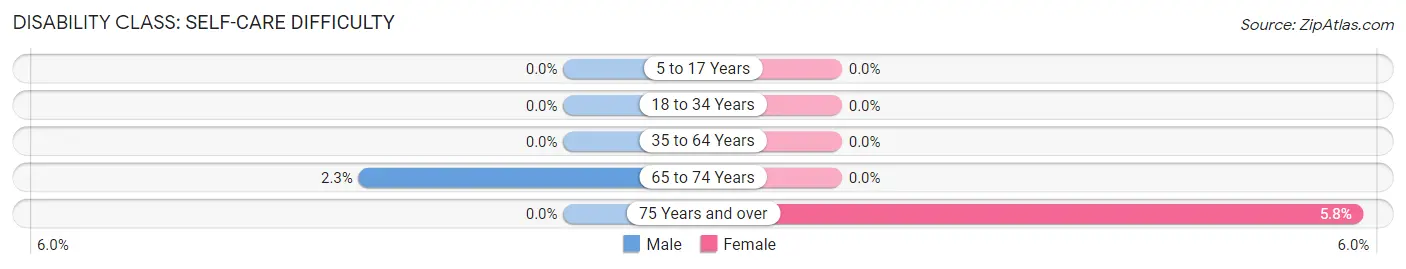
| Age Bracket | Male | Female |
| 5 to 17 Years | 0 (0.0%) | 0 (0.0%) |
| 18 to 34 Years | 0 (0.0%) | 0 (0.0%) |
| 35 to 64 Years | 0 (0.0%) | 0 (0.0%) |
| 65 to 74 Years | 8 (2.3%) | 0 (0.0%) |
| 75 Years and over | 0 (0.0%) | 20 (5.8%) |
Technology Access in Kensington
Computing Device Access in Kensington
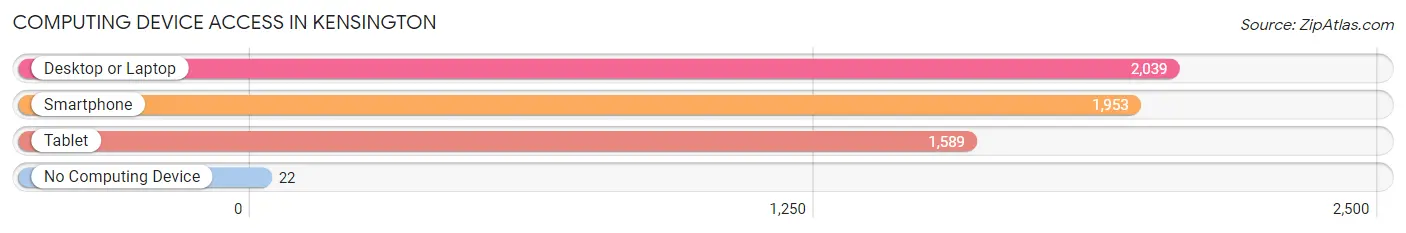
| Device Type | # Households | % Households |
| Desktop or Laptop | 2,039 | 96.6% |
| Smartphone | 1,953 | 92.6% |
| Tablet | 1,589 | 75.3% |
| No Computing Device | 22 | 1.0% |
| Total | 2,110 | 100.0% |
Internet Access in Kensington
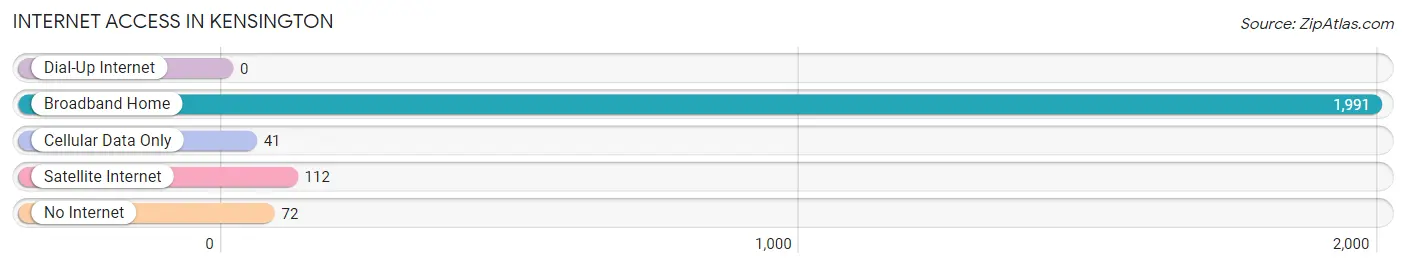
| Internet Type | # Households | % Households |
| Dial-Up Internet | 0 | 0.0% |
| Broadband Home | 1,991 | 94.4% |
| Cellular Data Only | 41 | 1.9% |
| Satellite Internet | 112 | 5.3% |
| No Internet | 72 | 3.4% |
| Total | 2,110 | 100.0% |
Kensington Summary
Kensington is a small, unincorporated community located in Contra Costa County, California. It is situated in the hills of the East Bay, just north of Berkeley and Oakland. The population of Kensington was estimated to be around 2,500 in 2020.
History
Kensington was originally part of the Rancho San Pablo, a Mexican land grant given to Francisco María Castro in 1823. The area was later purchased by the Kensington Land Company in 1872, and the town was named after the company. The town was officially incorporated in 1891, and the first post office was established in 1892.
Kensington was a popular summer resort for wealthy San Franciscans in the late 19th and early 20th centuries. The town was known for its large estates and grand homes, many of which still stand today.
Geography
Kensington is located in the hills of the East Bay, just north of Berkeley and Oakland. It is bordered by El Cerrito to the north, Berkeley to the south, and Albany to the east. The town is situated at an elevation of about 500 feet, and is surrounded by rolling hills and wooded areas.
Kensington is located in the San Francisco Bay Area, and is part of the East Bay region. The town is located in the San Francisco Bay watershed, and is home to several creeks and streams, including Wildcat Creek and San Pablo Creek.
Economy
Kensington is a primarily residential community, and the majority of its residents are employed in the nearby cities of Berkeley and Oakland. The town is home to several small businesses, including restaurants, cafes, and retail stores.
Kensington is also home to several parks and open spaces, including Tilden Regional Park and Wildcat Canyon Regional Park. These parks provide recreational opportunities for residents and visitors alike.
Demographics
Kensington is a diverse community, with a population of around 2,500 in 2020. The town is home to a variety of ethnic and racial groups, including White (63.3%), Asian (17.2%), Hispanic or Latino (13.2%), and African American (3.2%).
The median household income in Kensington is $90,845, and the median home value is $1,072,000. The town has a high rate of homeownership, with nearly 80% of residents owning their homes.
Kensington is served by the Kensington School District, which includes two elementary schools and one middle school. The town is also home to several private schools, including the Kensington Hilltop School and the Kensington School.
Common Questions
What is Per Capita Income in Kensington?
Per Capita income in Kensington is $101,295.
What is the Median Family Income in Kensington?
Median Family Income in Kensington is $250,001.
What is the Median Household income in Kensington?
Median Household Income in Kensington is $199,808.
What is Income or Wage Gap in Kensington?
Income or Wage Gap in Kensington is 37.6%.
Women in Kensington earn 62.4 cents for every dollar earned by a man.
What is Inequality or Gini Index in Kensington?
Inequality or Gini Index in Kensington is 0.43.
What is the Total Population of Kensington?
Total Population of Kensington is 5,309.
What is the Total Male Population of Kensington?
Total Male Population of Kensington is 2,496.
What is the Total Female Population of Kensington?
Total Female Population of Kensington is 2,813.
What is the Ratio of Males per 100 Females in Kensington?
There are 88.73 Males per 100 Females in Kensington.
What is the Ratio of Females per 100 Males in Kensington?
There are 112.70 Females per 100 Males in Kensington.
What is the Median Population Age in Kensington?
Median Population Age in Kensington is 47.9 Years.
What is the Average Family Size in Kensington
Average Family Size in Kensington is 3.0 People.
What is the Average Household Size in Kensington
Average Household Size in Kensington is 2.5 People.
How Large is the Labor Force in Kensington?
There are 2,803 People in the Labor Forcein in Kensington.
What is the Percentage of People in the Labor Force in Kensington?
66.2% of People are in the Labor Force in Kensington.
What is the Unemployment Rate in Kensington?
Unemployment Rate in Kensington is 6.3%.