Rancho Santa Fe, CA Map & Demographics
Rancho Santa Fe Map
Rancho Santa Fe Overview
$117,291
PER CAPITA INCOME
$239,342
AVG FAMILY INCOME
$231,319
AVG HOUSEHOLD INCOME
69.1%
WAGE / INCOME GAP [ % ]
30.9¢/ $1
WAGE / INCOME GAP [ $ ]
0.53
INEQUALITY / GINI INDEX
3,033
TOTAL POPULATION
1,260
MALE POPULATION
1,773
FEMALE POPULATION
71.07
MALES / 100 FEMALES
140.71
FEMALES / 100 MALES
50.1
MEDIAN AGE
3.0
AVG FAMILY SIZE
2.9
AVG HOUSEHOLD SIZE
1,105
LABOR FORCE [ PEOPLE ]
43.7%
PERCENT IN LABOR FORCE
6.3%
UNEMPLOYMENT RATE
Income in Rancho Santa Fe
Income Overview in Rancho Santa Fe
Per Capita Income in Rancho Santa Fe is $117,291, while median incomes of families and households are $239,342 and $231,319 respectively.
| Characteristic | Number | Measure |
| Per Capita Income | 3,033 | $117,291 |
| Median Family Income | 864 | $239,342 |
| Mean Family Income | 864 | $370,478 |
| Median Household Income | 1,061 | $231,319 |
| Mean Household Income | 1,061 | $329,442 |
| Income Deficit | 864 | $0 |
| Wage / Income Gap (%) | 3,033 | 69.09% |
| Wage / Income Gap ($) | 3,033 | 30.91¢ per $1 |
| Gini / Inequality Index | 3,033 | 0.53 |
Earnings by Sex in Rancho Santa Fe
Average Earnings in Rancho Santa Fe are $79,112, $190,385 for men and $58,841 for women, a difference of 69.1%.
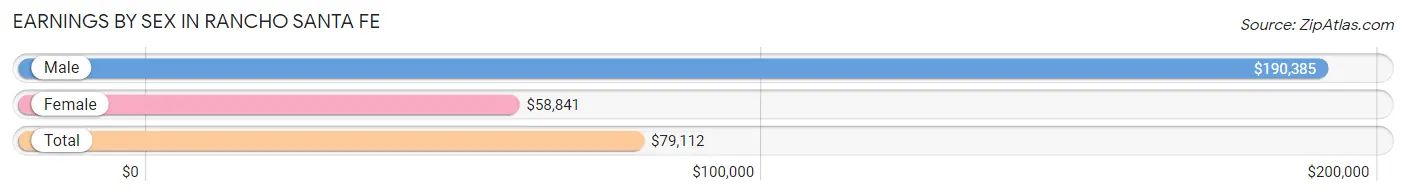
| Sex | Number | Average Earnings |
| Male | 668 (54.8%) | $190,385 |
| Female | 551 (45.2%) | $58,841 |
| Total | 1,219 (100.0%) | $79,112 |
Earnings by Sex by Income Bracket in Rancho Santa Fe
The most common earnings brackets in Rancho Santa Fe are $100,000+ for men (448 | 67.1%) and $55,000 to $64,999 for women (90 | 16.3%).
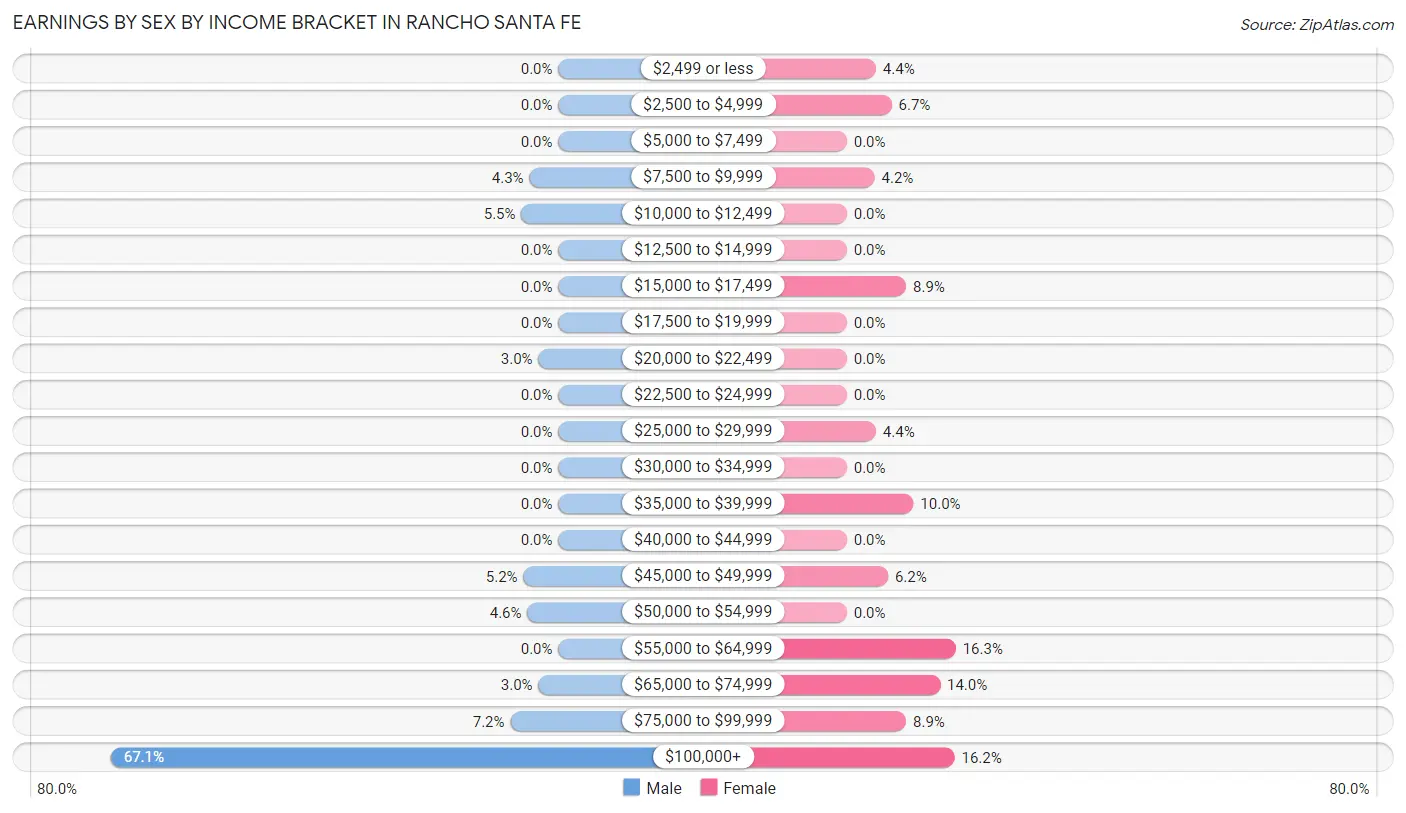
| Income | Male | Female |
| $2,499 or less | 0 (0.0%) | 24 (4.4%) |
| $2,500 to $4,999 | 0 (0.0%) | 37 (6.7%) |
| $5,000 to $7,499 | 0 (0.0%) | 0 (0.0%) |
| $7,500 to $9,999 | 29 (4.3%) | 23 (4.2%) |
| $10,000 to $12,499 | 37 (5.5%) | 0 (0.0%) |
| $12,500 to $14,999 | 0 (0.0%) | 0 (0.0%) |
| $15,000 to $17,499 | 0 (0.0%) | 49 (8.9%) |
| $17,500 to $19,999 | 0 (0.0%) | 0 (0.0%) |
| $20,000 to $22,499 | 20 (3.0%) | 0 (0.0%) |
| $22,500 to $24,999 | 0 (0.0%) | 0 (0.0%) |
| $25,000 to $29,999 | 0 (0.0%) | 24 (4.4%) |
| $30,000 to $34,999 | 0 (0.0%) | 0 (0.0%) |
| $35,000 to $39,999 | 0 (0.0%) | 55 (10.0%) |
| $40,000 to $44,999 | 0 (0.0%) | 0 (0.0%) |
| $45,000 to $49,999 | 35 (5.2%) | 34 (6.2%) |
| $50,000 to $54,999 | 31 (4.6%) | 0 (0.0%) |
| $55,000 to $64,999 | 0 (0.0%) | 90 (16.3%) |
| $65,000 to $74,999 | 20 (3.0%) | 77 (14.0%) |
| $75,000 to $99,999 | 48 (7.2%) | 49 (8.9%) |
| $100,000+ | 448 (67.1%) | 89 (16.2%) |
| Total | 668 (100.0%) | 551 (100.0%) |
Earnings by Sex by Educational Attainment in Rancho Santa Fe
Average earnings in Rancho Santa Fe are $190,385 for men and $59,659 for women, a difference of 68.7%. Men with an educational attainment of bachelor's degree enjoy the highest average annual earnings of $238,000, while those with college or associate's degree education earn the least with $79,306. Women with an educational attainment of bachelor's degree earn the most with the average annual earnings of $68,377, while those with bachelor's degree education have the smallest earnings of $68,377.
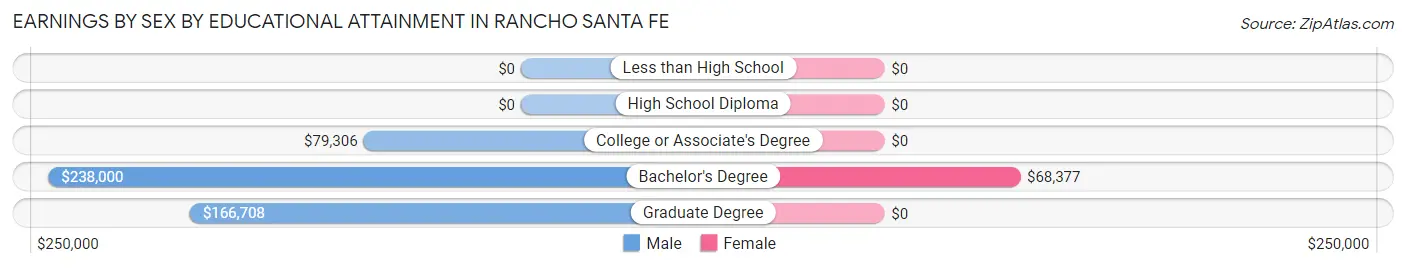
| Educational Attainment | Male Income | Female Income |
| Less than High School | - | - |
| High School Diploma | - | - |
| College or Associate's Degree | $79,306 | $0 |
| Bachelor's Degree | $238,000 | $68,377 |
| Graduate Degree | $166,708 | $0 |
| Total | $190,385 | $59,659 |
Family Income in Rancho Santa Fe
Family Income Brackets in Rancho Santa Fe
According to the Rancho Santa Fe family income data, there are 542 families falling into the $200,000+ income range, which is the most common income bracket and makes up 62.7% of all families.
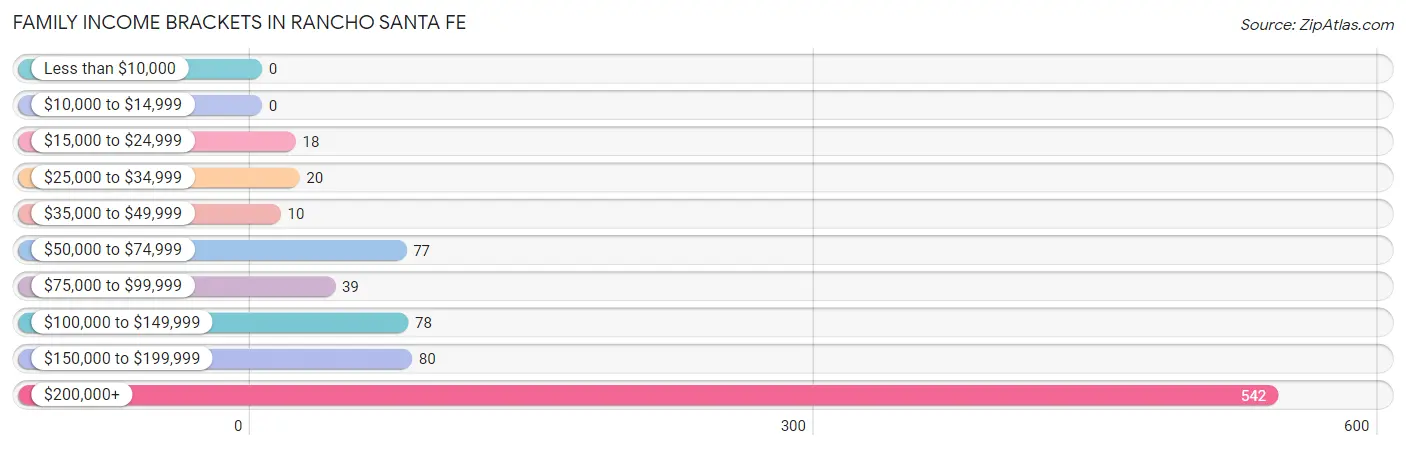
| Income Bracket | # Families | % Families |
| Less than $10,000 | 0 | 0.0% |
| $10,000 to $14,999 | 0 | 0.0% |
| $15,000 to $24,999 | 18 | 2.1% |
| $25,000 to $34,999 | 20 | 2.3% |
| $35,000 to $49,999 | 10 | 1.2% |
| $50,000 to $74,999 | 77 | 8.9% |
| $75,000 to $99,999 | 39 | 4.5% |
| $100,000 to $149,999 | 78 | 9.0% |
| $150,000 to $199,999 | 80 | 9.3% |
| $200,000+ | 542 | 62.7% |
Family Income by Famaliy Size in Rancho Santa Fe
4-person families (196 | 22.7%) account for the highest median family income in Rancho Santa Fe with $250,001 per family, while 2-person families (416 | 48.1%) have the highest median income of $88,928 per family member.
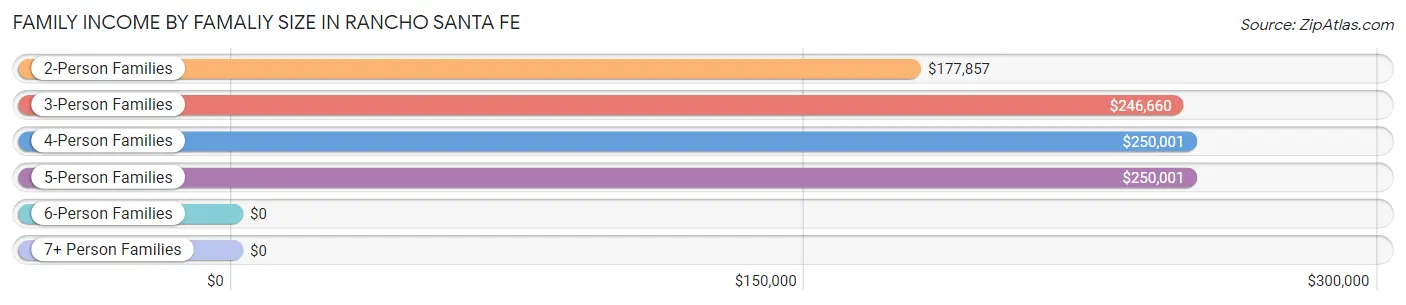
| Income Bracket | # Families | Median Income |
| 2-Person Families | 416 (48.1%) | $177,857 |
| 3-Person Families | 195 (22.6%) | $246,660 |
| 4-Person Families | 196 (22.7%) | $250,001 |
| 5-Person Families | 57 (6.6%) | $250,001 |
| 6-Person Families | 0 (0.0%) | $0 |
| 7+ Person Families | 0 (0.0%) | $0 |
| Total | 864 (100.0%) | $239,342 |
Family Income by Number of Earners in Rancho Santa Fe
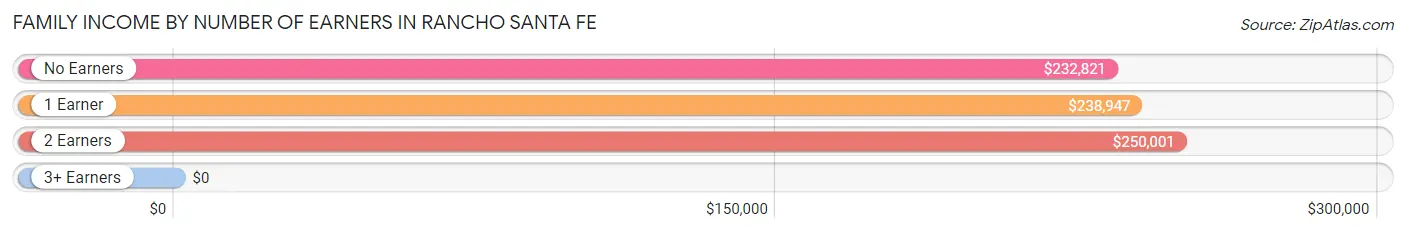
| Number of Earners | # Families | Median Income |
| No Earners | 184 (21.3%) | $232,821 |
| 1 Earner | 416 (48.1%) | $238,947 |
| 2 Earners | 226 (26.2%) | $250,001 |
| 3+ Earners | 38 (4.4%) | $0 |
| Total | 864 (100.0%) | $239,342 |
Household Income in Rancho Santa Fe
Household Income Brackets in Rancho Santa Fe
With 579 households falling in the category, the $200,000+ income range is the most frequent in Rancho Santa Fe, accounting for 54.6% of all households.
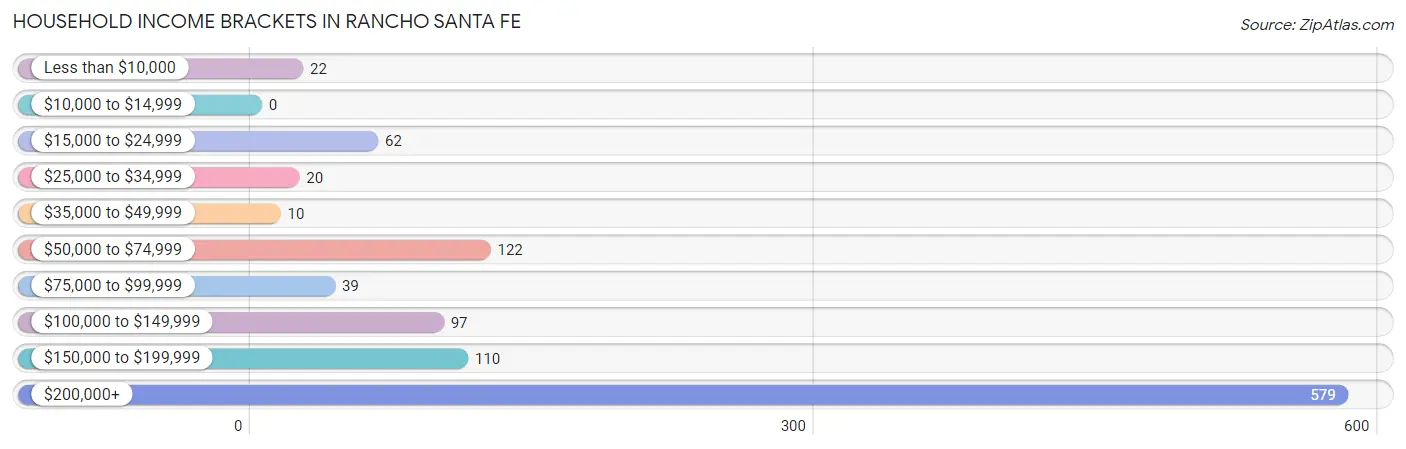
| Income Bracket | # Households | % Households |
| Less than $10,000 | 22 | 2.1% |
| $10,000 to $14,999 | 0 | 0.0% |
| $15,000 to $24,999 | 62 | 5.8% |
| $25,000 to $34,999 | 20 | 1.9% |
| $35,000 to $49,999 | 10 | 0.9% |
| $50,000 to $74,999 | 122 | 11.5% |
| $75,000 to $99,999 | 39 | 3.7% |
| $100,000 to $149,999 | 97 | 9.1% |
| $150,000 to $199,999 | 110 | 10.4% |
| $200,000+ | 579 | 54.6% |
Household Income by Householder Age in Rancho Santa Fe
The median household income in Rancho Santa Fe is $231,319, with the highest median household income of $250,001 found in the 25 to 44 years age bracket for the primary householder. A total of 148 households (14.0%) fall into this category.
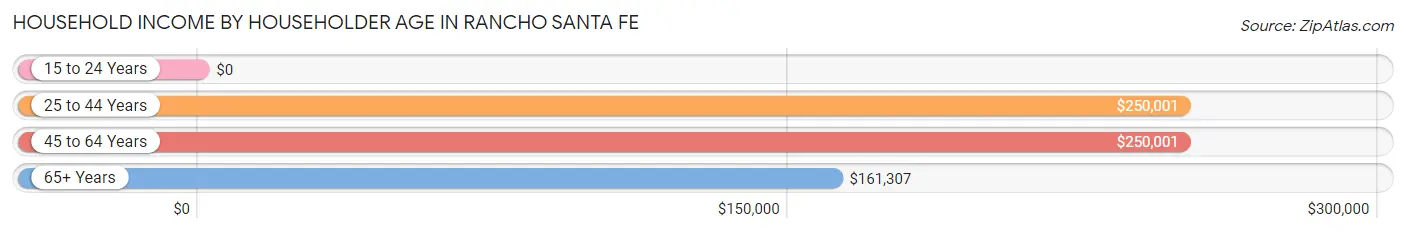
| Income Bracket | # Households | Median Income |
| 15 to 24 Years | 0 (0.0%) | $0 |
| 25 to 44 Years | 148 (14.0%) | $250,001 |
| 45 to 64 Years | 352 (33.2%) | $250,001 |
| 65+ Years | 561 (52.9%) | $161,307 |
| Total | 1,061 (100.0%) | $231,319 |
Poverty in Rancho Santa Fe
Income Below Poverty by Sex and Age in Rancho Santa Fe
With 1.8% poverty level for males and 4.5% for females among the residents of Rancho Santa Fe, 18 to 24 year old males and 16 and 17 year old females are the most vulnerable to poverty, with 22 males (36.7%) and 18 females (31.6%) in their respective age groups living below the poverty level.
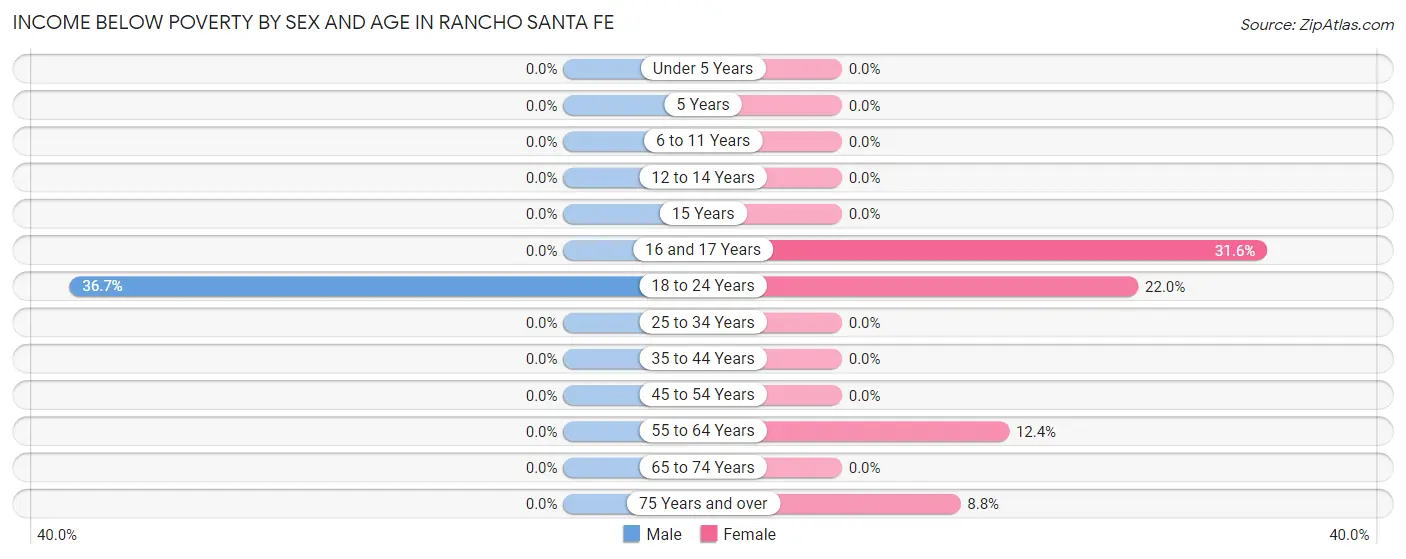
| Age Bracket | Male | Female |
| Under 5 Years | 0 (0.0%) | 0 (0.0%) |
| 5 Years | 0 (0.0%) | 0 (0.0%) |
| 6 to 11 Years | 0 (0.0%) | 0 (0.0%) |
| 12 to 14 Years | 0 (0.0%) | 0 (0.0%) |
| 15 Years | 0 (0.0%) | 0 (0.0%) |
| 16 and 17 Years | 0 (0.0%) | 18 (31.6%) |
| 18 to 24 Years | 22 (36.7%) | 22 (22.0%) |
| 25 to 34 Years | 0 (0.0%) | 0 (0.0%) |
| 35 to 44 Years | 0 (0.0%) | 0 (0.0%) |
| 45 to 54 Years | 0 (0.0%) | 0 (0.0%) |
| 55 to 64 Years | 0 (0.0%) | 18 (12.4%) |
| 65 to 74 Years | 0 (0.0%) | 0 (0.0%) |
| 75 Years and over | 0 (0.0%) | 22 (8.8%) |
| Total | 22 (1.8%) | 80 (4.5%) |
Income Above Poverty by Sex and Age in Rancho Santa Fe
According to the poverty statistics in Rancho Santa Fe, males aged under 5 years and females aged under 5 years are the age groups that are most secure financially, with 100.0% of males and 100.0% of females in these age groups living above the poverty line.
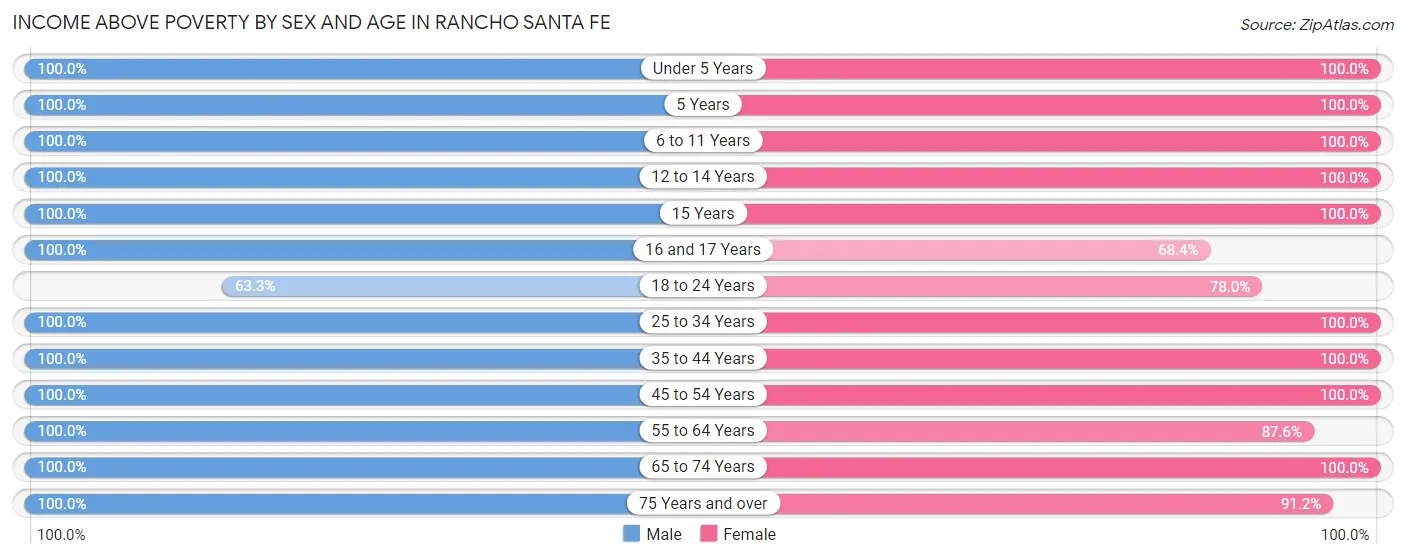
| Age Bracket | Male | Female |
| Under 5 Years | 91 (100.0%) | 46 (100.0%) |
| 5 Years | 21 (100.0%) | 20 (100.0%) |
| 6 to 11 Years | 62 (100.0%) | 114 (100.0%) |
| 12 to 14 Years | 21 (100.0%) | 63 (100.0%) |
| 15 Years | 16 (100.0%) | 18 (100.0%) |
| 16 and 17 Years | 19 (100.0%) | 39 (68.4%) |
| 18 to 24 Years | 38 (63.3%) | 78 (78.0%) |
| 25 to 34 Years | 30 (100.0%) | 167 (100.0%) |
| 35 to 44 Years | 148 (100.0%) | 190 (100.0%) |
| 45 to 54 Years | 240 (100.0%) | 222 (100.0%) |
| 55 to 64 Years | 166 (100.0%) | 127 (87.6%) |
| 65 to 74 Years | 239 (100.0%) | 381 (100.0%) |
| 75 Years and over | 115 (100.0%) | 228 (91.2%) |
| Total | 1,206 (98.2%) | 1,693 (95.5%) |
Income Below Poverty Among Married-Couple Families in Rancho Santa Fe
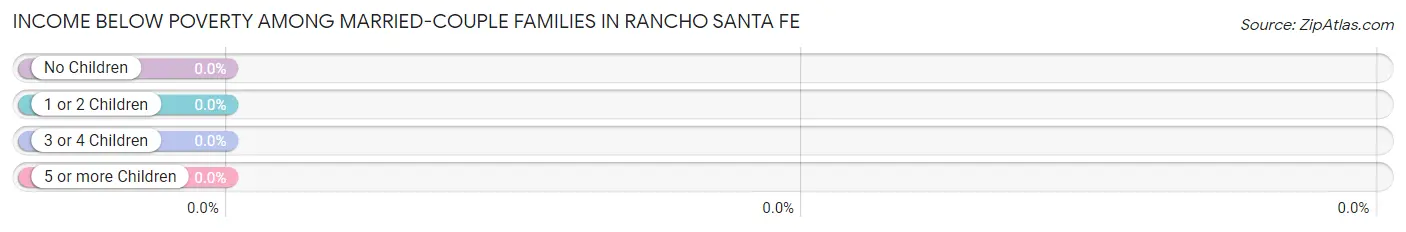
| Children | Above Poverty | Below Poverty |
| No Children | 472 (100.0%) | 0 (0.0%) |
| 1 or 2 Children | 169 (100.0%) | 0 (0.0%) |
| 3 or 4 Children | 41 (100.0%) | 0 (0.0%) |
| 5 or more Children | 0 (0.0%) | 0 (0.0%) |
| Total | 682 (100.0%) | 0 (0.0%) |
Income Below Poverty Among Single-Parent Households in Rancho Santa Fe
| Children | Single Father | Single Mother |
| No Children | 0 (0.0%) | 0 (0.0%) |
| 1 or 2 Children | 0 (0.0%) | 0 (0.0%) |
| 3 or 4 Children | 0 (0.0%) | 0 (0.0%) |
| 5 or more Children | 0 (0.0%) | 0 (0.0%) |
| Total | 0 (0.0%) | 0 (0.0%) |
Income Below Poverty Among Married-Couple vs Single-Parent Households in Rancho Santa Fe
| Children | Married-Couple Families | Single-Parent Households |
| No Children | 0 (0.0%) | 0 (0.0%) |
| 1 or 2 Children | 0 (0.0%) | 0 (0.0%) |
| 3 or 4 Children | 0 (0.0%) | 0 (0.0%) |
| 5 or more Children | 0 (0.0%) | 0 (0.0%) |
| Total | 0 (0.0%) | 0 (0.0%) |
Race in Rancho Santa Fe
The most populous races in Rancho Santa Fe are White / Caucasian (2,614 | 86.2%), Two or more Races (331 | 10.9%), and Hispanic or Latino (304 | 10.0%).
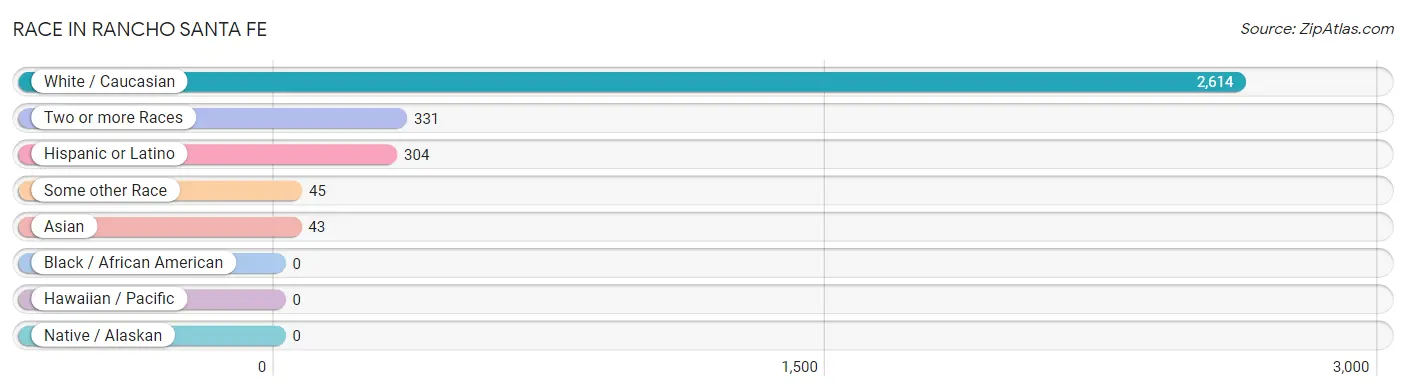
| Race | # Population | % Population |
| Asian | 43 | 1.4% |
| Black / African American | 0 | 0.0% |
| Hawaiian / Pacific | 0 | 0.0% |
| Hispanic or Latino | 304 | 10.0% |
| Native / Alaskan | 0 | 0.0% |
| White / Caucasian | 2,614 | 86.2% |
| Two or more Races | 331 | 10.9% |
| Some other Race | 45 | 1.5% |
| Total | 3,033 | 100.0% |
Ancestry in Rancho Santa Fe
The most populous ancestries reported in Rancho Santa Fe are English (376 | 12.4%), German (314 | 10.3%), Irish (262 | 8.6%), Mexican (219 | 7.2%), and European (162 | 5.3%), together accounting for 43.9% of all Rancho Santa Fe residents.
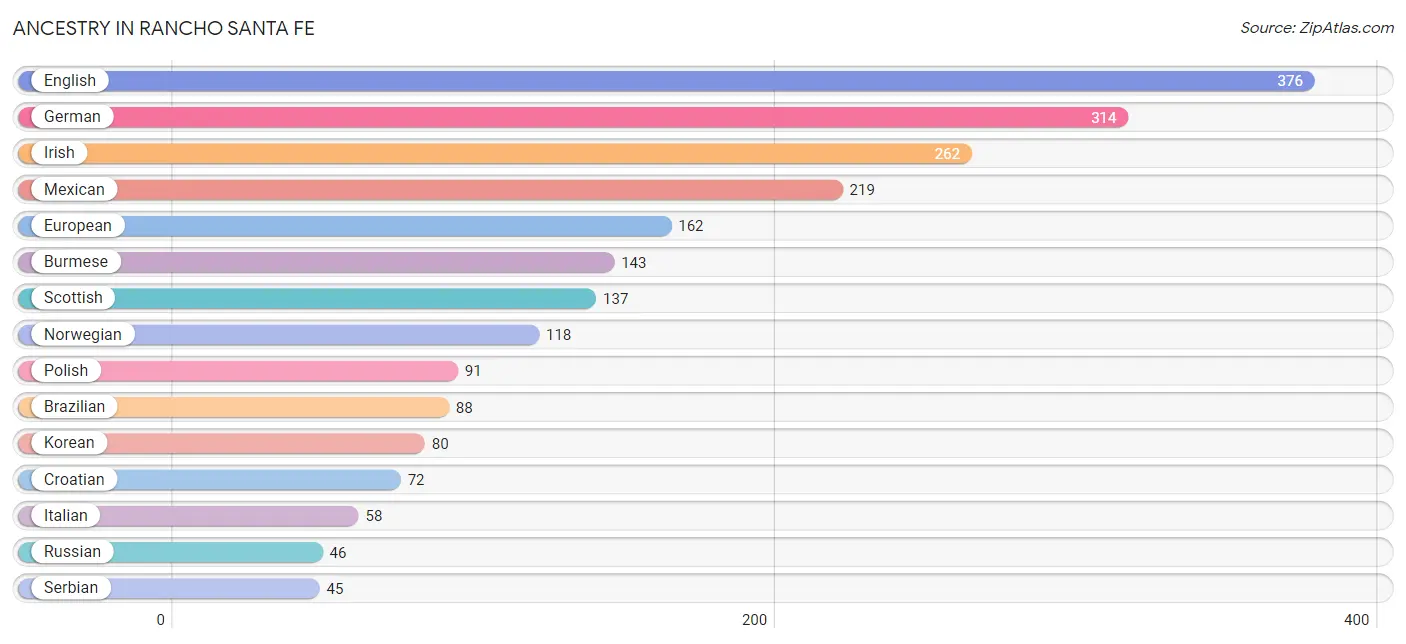
| Ancestry | # Population | % Population |
| Alsatian | 21 | 0.7% |
| American | 19 | 0.6% |
| Arab | 17 | 0.6% |
| Brazilian | 88 | 2.9% |
| British | 39 | 1.3% |
| Burmese | 143 | 4.7% |
| Croatian | 72 | 2.4% |
| Czech | 44 | 1.5% |
| Dominican | 16 | 0.5% |
| Dutch | 20 | 0.7% |
| Eastern European | 19 | 0.6% |
| English | 376 | 12.4% |
| European | 162 | 5.3% |
| French | 19 | 0.6% |
| French Canadian | 18 | 0.6% |
| German | 314 | 10.3% |
| Iranian | 15 | 0.5% |
| Irish | 262 | 8.6% |
| Italian | 58 | 1.9% |
| Korean | 80 | 2.6% |
| Mexican | 219 | 7.2% |
| Norwegian | 118 | 3.9% |
| Polish | 91 | 3.0% |
| Russian | 46 | 1.5% |
| Scotch-Irish | 21 | 0.7% |
| Scottish | 137 | 4.5% |
| Serbian | 45 | 1.5% |
| Spaniard | 20 | 0.7% |
| Swedish | 16 | 0.5% |
| Swiss | 23 | 0.8% |
| Ukrainian | 22 | 0.7% | View All 31 Rows |
Immigrants in Rancho Santa Fe
The most numerous immigrant groups reported in Rancho Santa Fe came from Latin America (107 | 3.5%), Asia (88 | 2.9%), Europe (84 | 2.8%), South America (66 | 2.2%), and Brazil (52 | 1.7%), together accounting for 13.1% of all Rancho Santa Fe residents.
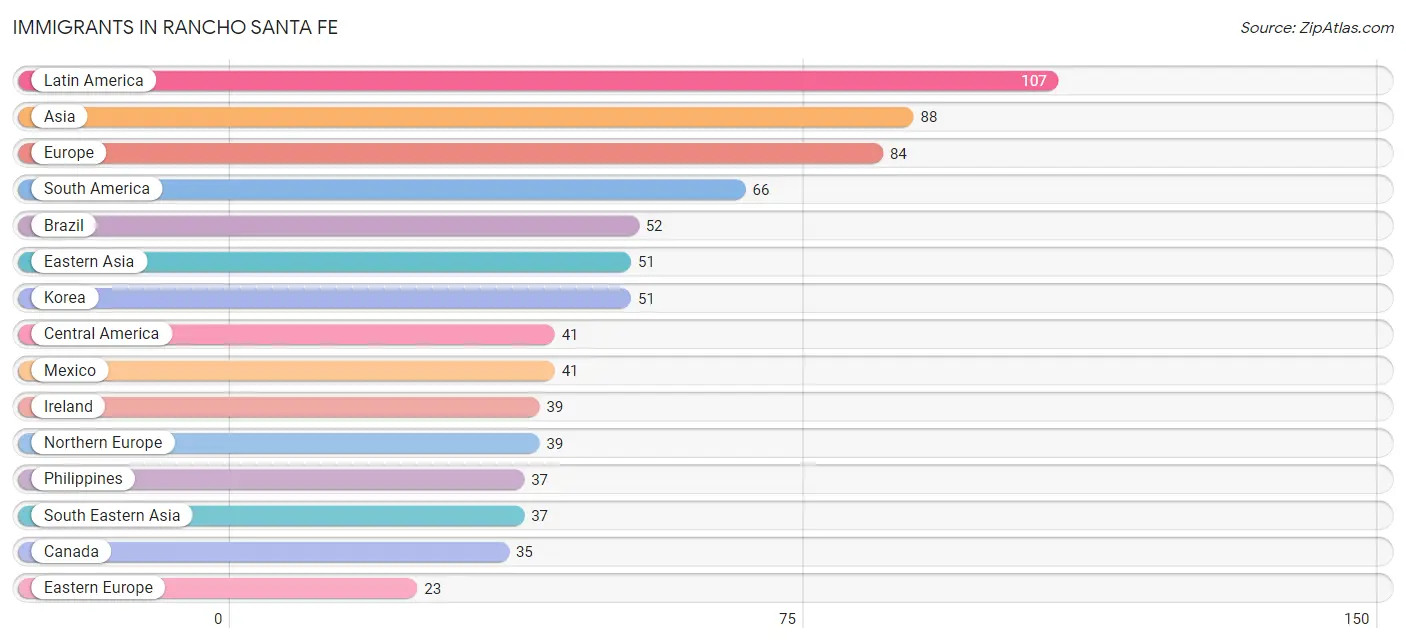
| Immigration Origin | # Population | % Population |
| Asia | 88 | 2.9% |
| Brazil | 52 | 1.7% |
| Canada | 35 | 1.1% |
| Central America | 41 | 1.3% |
| Colombia | 14 | 0.5% |
| Eastern Asia | 51 | 1.7% |
| Eastern Europe | 23 | 0.8% |
| Europe | 84 | 2.8% |
| Germany | 22 | 0.7% |
| Ireland | 39 | 1.3% |
| Korea | 51 | 1.7% |
| Latin America | 107 | 3.5% |
| Mexico | 41 | 1.3% |
| Northern Europe | 39 | 1.3% |
| Philippines | 37 | 1.2% |
| Russia | 23 | 0.8% |
| South America | 66 | 2.2% |
| South Eastern Asia | 37 | 1.2% |
| Western Europe | 22 | 0.7% | View All 19 Rows |
Sex and Age in Rancho Santa Fe
Sex and Age in Rancho Santa Fe
The most populous age groups in Rancho Santa Fe are 65 to 69 Years (145 | 11.5%) for men and 65 to 69 Years (287 | 16.2%) for women.
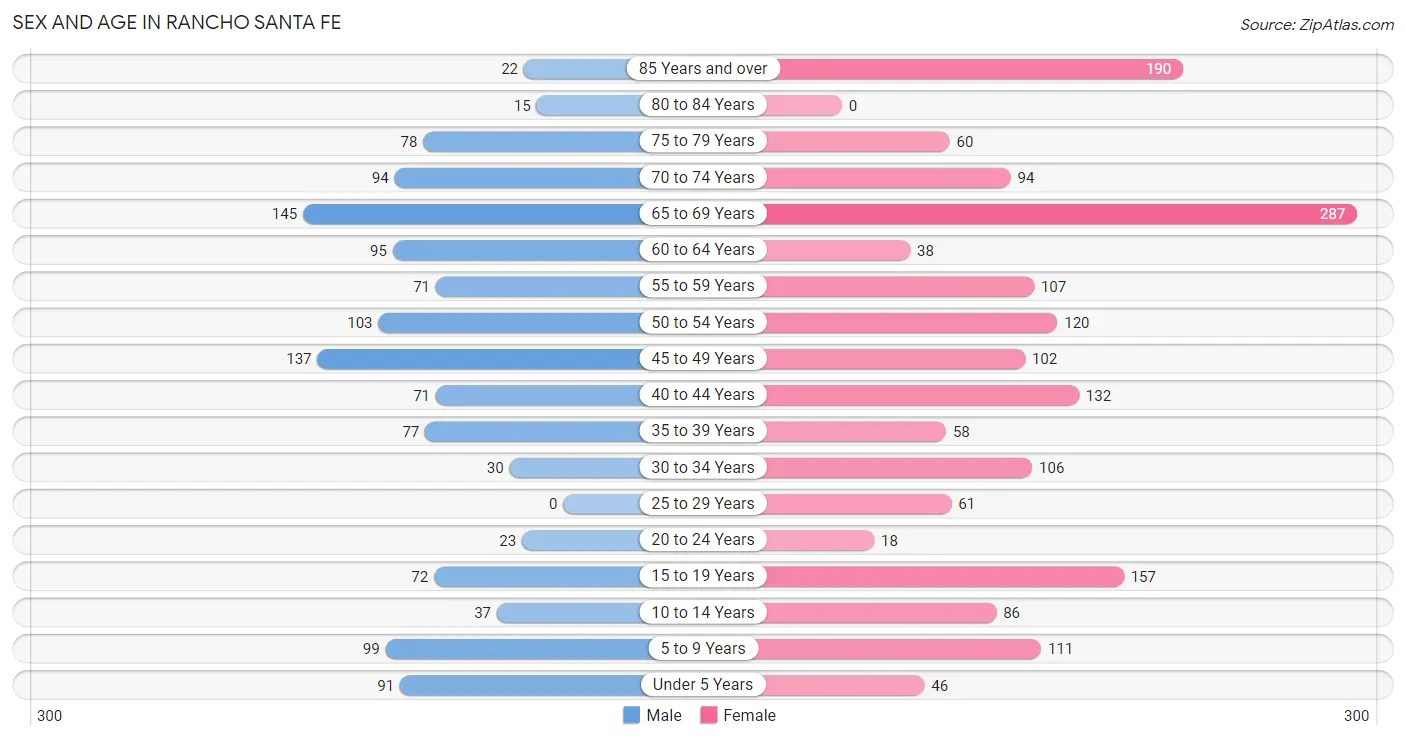
| Age Bracket | Male | Female |
| Under 5 Years | 91 (7.2%) | 46 (2.6%) |
| 5 to 9 Years | 99 (7.9%) | 111 (6.3%) |
| 10 to 14 Years | 37 (2.9%) | 86 (4.9%) |
| 15 to 19 Years | 72 (5.7%) | 157 (8.9%) |
| 20 to 24 Years | 23 (1.8%) | 18 (1.0%) |
| 25 to 29 Years | 0 (0.0%) | 61 (3.4%) |
| 30 to 34 Years | 30 (2.4%) | 106 (6.0%) |
| 35 to 39 Years | 77 (6.1%) | 58 (3.3%) |
| 40 to 44 Years | 71 (5.6%) | 132 (7.4%) |
| 45 to 49 Years | 137 (10.9%) | 102 (5.8%) |
| 50 to 54 Years | 103 (8.2%) | 120 (6.8%) |
| 55 to 59 Years | 71 (5.6%) | 107 (6.0%) |
| 60 to 64 Years | 95 (7.5%) | 38 (2.1%) |
| 65 to 69 Years | 145 (11.5%) | 287 (16.2%) |
| 70 to 74 Years | 94 (7.5%) | 94 (5.3%) |
| 75 to 79 Years | 78 (6.2%) | 60 (3.4%) |
| 80 to 84 Years | 15 (1.2%) | 0 (0.0%) |
| 85 Years and over | 22 (1.8%) | 190 (10.7%) |
| Total | 1,260 (100.0%) | 1,773 (100.0%) |
Families and Households in Rancho Santa Fe
Median Family Size in Rancho Santa Fe
The median family size in Rancho Santa Fe is 2.98 persons per family, with single female/mother families (142 | 16.4%) accounting for the largest median family size of 3.13 persons per family. On the other hand, single male/father families (40 | 4.6%) represent the smallest median family size with 2.00 persons per family.
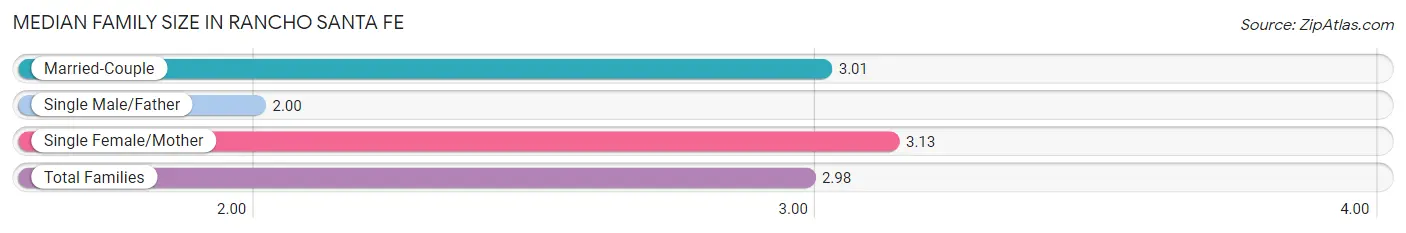
| Family Type | # Families | Family Size |
| Married-Couple | 682 (78.9%) | 3.01 |
| Single Male/Father | 40 (4.6%) | 2.00 |
| Single Female/Mother | 142 (16.4%) | 3.13 |
| Total Families | 864 (100.0%) | 2.98 |
Median Household Size in Rancho Santa Fe
The median household size in Rancho Santa Fe is 2.86 persons per household, with single female/mother households (142 | 13.4%) accounting for the largest median household size of 3.29 persons per household. non-family households (197 | 18.6%) represent the smallest median household size with 1.89 persons per household.
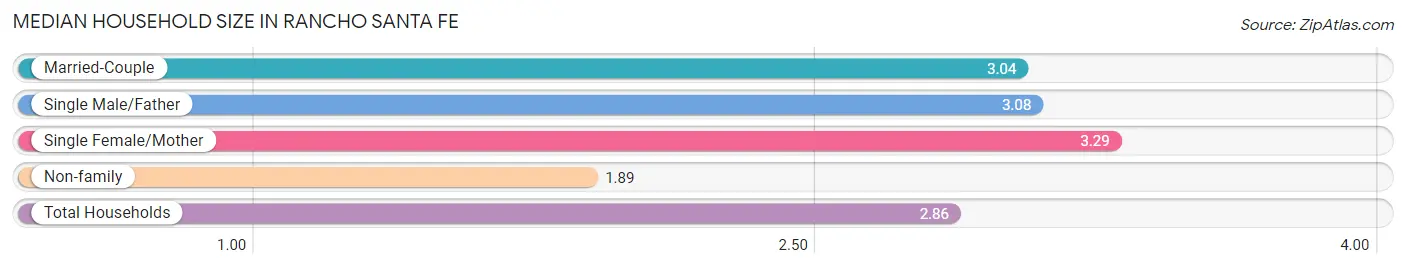
| Household Type | # Households | Household Size |
| Married-Couple | 682 (64.3%) | 3.04 |
| Single Male/Father | 40 (3.8%) | 3.08 |
| Single Female/Mother | 142 (13.4%) | 3.29 |
| Non-family | 197 (18.6%) | 1.89 |
| Total Households | 1,061 (100.0%) | 2.86 |
Household Size by Marriage Status in Rancho Santa Fe
Out of a total of 1,061 households in Rancho Santa Fe, 864 (81.4%) are family households, while 197 (18.6%) are nonfamily households. The most numerous type of family households are 2-person households, comprising 395, and the most common type of nonfamily households are 1-person households, comprising 106.

| Household Size | Family Households | Nonfamily Households |
| 1-Person Households | - | 106 (10.0%) |
| 2-Person Households | 395 (37.2%) | 59 (5.6%) |
| 3-Person Households | 195 (18.4%) | 16 (1.5%) |
| 4-Person Households | 179 (16.9%) | 0 (0.0%) |
| 5-Person Households | 95 (8.9%) | 16 (1.5%) |
| 6-Person Households | 0 (0.0%) | 0 (0.0%) |
| 7+ Person Households | 0 (0.0%) | 0 (0.0%) |
| Total | 864 (81.4%) | 197 (18.6%) |
Female Fertility in Rancho Santa Fe
Fertility by Age in Rancho Santa Fe
| Age Bracket | Women with Births | Births / 1,000 Women |
| 15 to 19 years | 0 (0.0%) | 0.0 |
| 20 to 34 years | 0 (0.0%) | 0.0 |
| 35 to 50 years | 0 (0.0%) | 0.0 |
| Total | 0 (0.0%) | 0.0 |
Fertility by Age by Marriage Status in Rancho Santa Fe
| Age Bracket | Married | Unmarried |
| 15 to 19 years | 0 (0.0%) | 0 (0.0%) |
| 20 to 34 years | 0 (0.0%) | 0 (0.0%) |
| 35 to 50 years | 0 (0.0%) | 0 (0.0%) |
| Total | 0 (0.0%) | 0 (0.0%) |
Fertility by Education in Rancho Santa Fe
| Educational Attainment | Women with Births | Births / 1,000 Women |
| Less than High School | 0 (0.0%) | 0.0 |
| High School Diploma | 0 (0.0%) | 0.0 |
| College or Associate's Degree | 0 (0.0%) | 0.0 |
| Bachelor's Degree | 0 (0.0%) | 0.0 |
| Graduate Degree | 0 (0.0%) | 0.0 |
| Total | 0 (0.0%) | 0.0 |
Fertility by Education by Marriage Status in Rancho Santa Fe
| Educational Attainment | Married | Unmarried |
| Less than High School | 0 (0.0%) | 0 (0.0%) |
| High School Diploma | 0 (0.0%) | 0 (0.0%) |
| College or Associate's Degree | 0 (0.0%) | 0 (0.0%) |
| Bachelor's Degree | 0 (0.0%) | 0 (0.0%) |
| Graduate Degree | 0 (0.0%) | 0 (0.0%) |
| Total | 0 (0.0%) | 0 (0.0%) |
Employment Characteristics in Rancho Santa Fe
Employment by Class of Employer in Rancho Santa Fe
Among the 1,018 employed individuals in Rancho Santa Fe, private company employees (707 | 69.5%), self-employed (incorporated) (177 | 17.4%), and self-employed (not incorporated) (97 | 9.5%) make up the most common classes of employment.
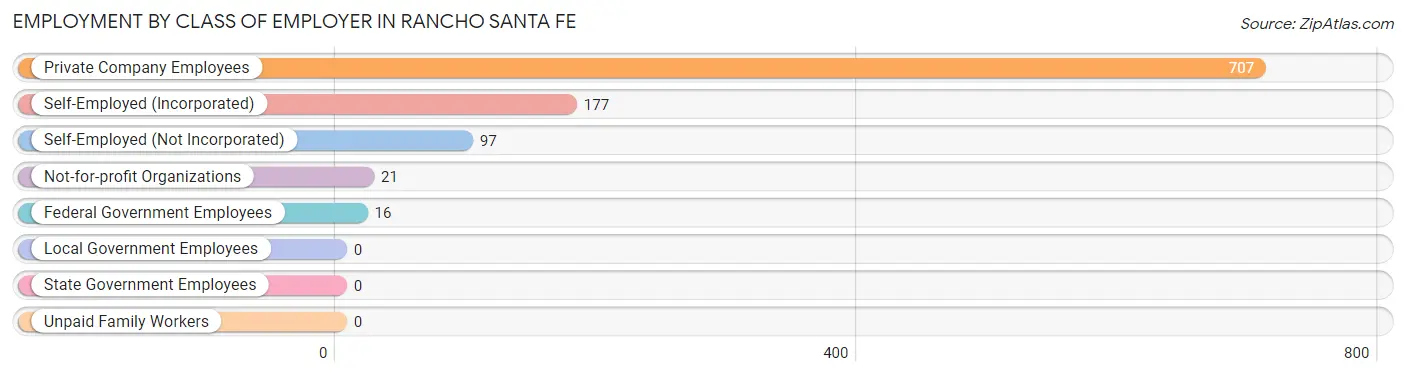
| Employer Class | # Employees | % Employees |
| Private Company Employees | 707 | 69.5% |
| Self-Employed (Incorporated) | 177 | 17.4% |
| Self-Employed (Not Incorporated) | 97 | 9.5% |
| Not-for-profit Organizations | 21 | 2.1% |
| Local Government Employees | 0 | 0.0% |
| State Government Employees | 0 | 0.0% |
| Federal Government Employees | 16 | 1.6% |
| Unpaid Family Workers | 0 | 0.0% |
| Total | 1,018 | 100.0% |
Employment Status by Age in Rancho Santa Fe
According to the labor force statistics for Rancho Santa Fe, out of the total population over 16 years of age (2,529), 43.7% or 1,105 individuals are in the labor force, with 6.3% or 70 of them unemployed. The age group with the highest labor force participation rate is 25 to 29 years, with 100.0% or 61 individuals in the labor force. Within the labor force, the 16 to 19 years age range has the highest percentage of unemployed individuals, with 56.1% or 23 of them being unemployed.
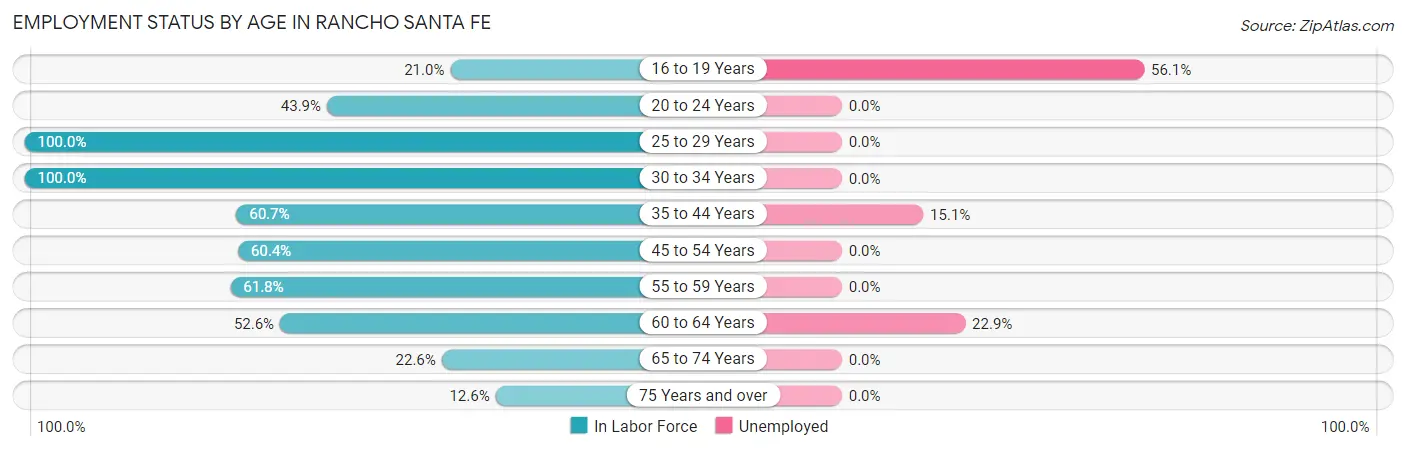
| Age Bracket | In Labor Force | Unemployed |
| 16 to 19 Years | 41 (21.0%) | 23 (56.1%) |
| 20 to 24 Years | 18 (43.9%) | 0 (0.0%) |
| 25 to 29 Years | 61 (100.0%) | 0 (0.0%) |
| 30 to 34 Years | 136 (100.0%) | 0 (0.0%) |
| 35 to 44 Years | 205 (60.7%) | 31 (15.1%) |
| 45 to 54 Years | 279 (60.4%) | 0 (0.0%) |
| 55 to 59 Years | 110 (61.8%) | 0 (0.0%) |
| 60 to 64 Years | 70 (52.6%) | 16 (22.9%) |
| 65 to 74 Years | 140 (22.6%) | 0 (0.0%) |
| 75 Years and over | 46 (12.6%) | 0 (0.0%) |
| Total | 1,105 (43.7%) | 70 (6.3%) |
Employment Status by Educational Attainment in Rancho Santa Fe
According to labor force statistics for Rancho Santa Fe, 65.8% of individuals (861) out of the total population between 25 and 64 years of age (1,308) are in the labor force, with 5.5% or 47 of them being unemployed. The group with the highest labor force participation rate are those with the educational attainment of bachelor's degree or higher, with 70.1% or 705 individuals in the labor force. Within the labor force, individuals with high school diploma education have the highest percentage of unemployment, with 21.1% or 16 of them being unemployed.
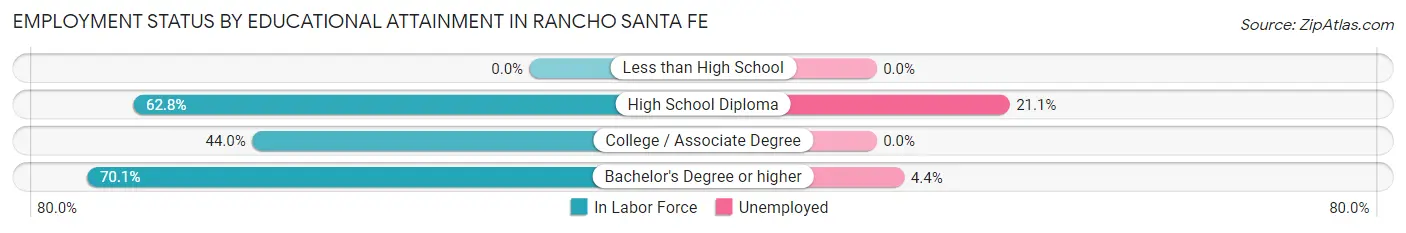
| Educational Attainment | In Labor Force | Unemployed |
| Less than High School | 0 (0.0%) | 0 (0.0%) |
| High School Diploma | 76 (62.8%) | 26 (21.1%) |
| College / Associate Degree | 80 (44.0%) | 0 (0.0%) |
| Bachelor's Degree or higher | 705 (70.1%) | 44 (4.4%) |
| Total | 861 (65.8%) | 72 (5.5%) |
Employment Occupations by Sex in Rancho Santa Fe
Management, Business, Science and Arts Occupations
The most common Management, Business, Science and Arts occupations in Rancho Santa Fe are Management (178 | 17.2%), Community & Social Service (172 | 16.6%), Arts, Media & Entertainment (143 | 13.8%), Business & Financial (139 | 13.4%), and Health Diagnosing & Treating (98 | 9.5%).
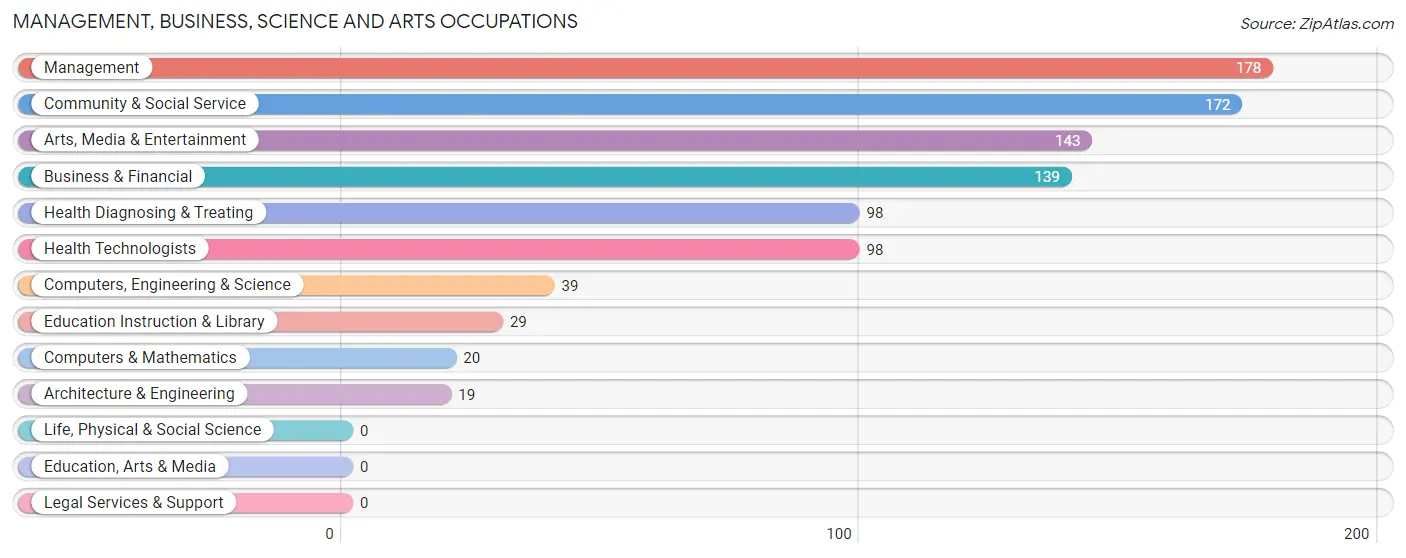
Management, Business, Science and Arts Occupations by Sex
Within the Management, Business, Science and Arts occupations in Rancho Santa Fe, the most male-oriented occupations are Computers, Engineering & Science (100.0%), Computers & Mathematics (100.0%), and Architecture & Engineering (100.0%), while the most female-oriented occupations are Education Instruction & Library (100.0%), Community & Social Service (86.1%), and Arts, Media & Entertainment (83.2%).
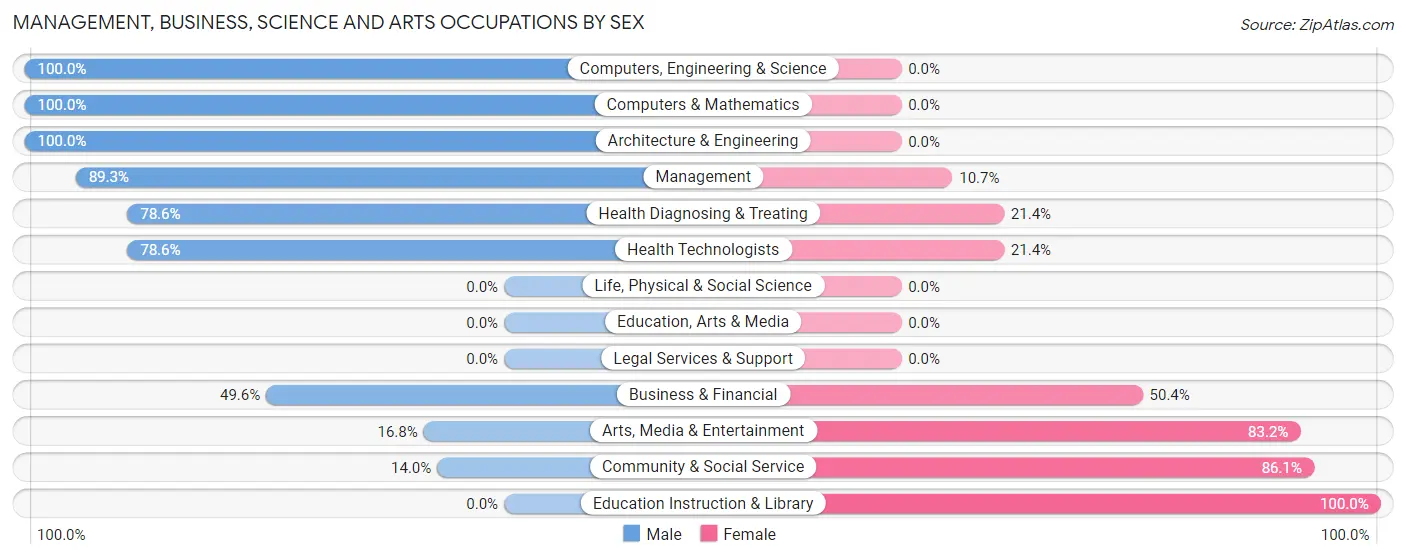
| Occupation | Male | Female |
| Management | 159 (89.3%) | 19 (10.7%) |
| Business & Financial | 69 (49.6%) | 70 (50.4%) |
| Computers, Engineering & Science | 39 (100.0%) | 0 (0.0%) |
| Computers & Mathematics | 20 (100.0%) | 0 (0.0%) |
| Architecture & Engineering | 19 (100.0%) | 0 (0.0%) |
| Life, Physical & Social Science | 0 (0.0%) | 0 (0.0%) |
| Community & Social Service | 24 (14.0%) | 148 (86.1%) |
| Education, Arts & Media | 0 (0.0%) | 0 (0.0%) |
| Legal Services & Support | 0 (0.0%) | 0 (0.0%) |
| Education Instruction & Library | 0 (0.0%) | 29 (100.0%) |
| Arts, Media & Entertainment | 24 (16.8%) | 119 (83.2%) |
| Health Diagnosing & Treating | 77 (78.6%) | 21 (21.4%) |
| Health Technologists | 77 (78.6%) | 21 (21.4%) |
| Total (Category) | 368 (58.8%) | 258 (41.2%) |
| Total (Overall) | 574 (55.4%) | 462 (44.6%) |
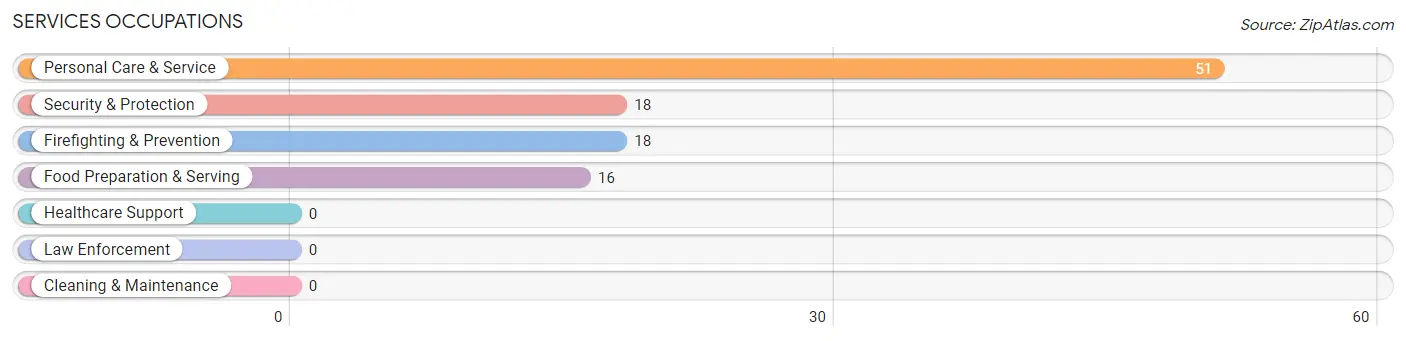
Services Occupations
The most common Services occupations in Rancho Santa Fe are Personal Care & Service (51 | 4.9%), Security & Protection (18 | 1.7%), Firefighting & Prevention (18 | 1.7%), and Food Preparation & Serving (16 | 1.5%).
Services Occupations by Sex
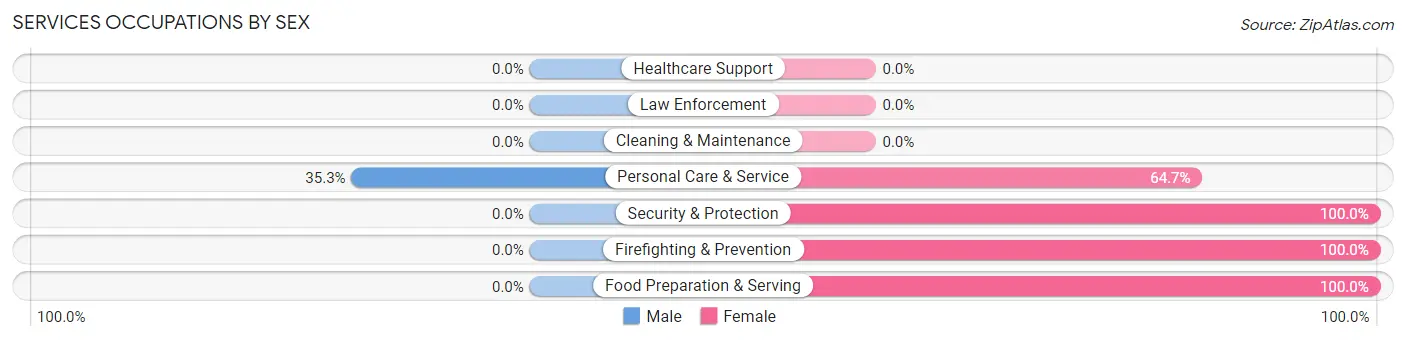
| Occupation | Male | Female |
| Healthcare Support | 0 (0.0%) | 0 (0.0%) |
| Security & Protection | 0 (0.0%) | 18 (100.0%) |
| Firefighting & Prevention | 0 (0.0%) | 18 (100.0%) |
| Law Enforcement | 0 (0.0%) | 0 (0.0%) |
| Food Preparation & Serving | 0 (0.0%) | 16 (100.0%) |
| Cleaning & Maintenance | 0 (0.0%) | 0 (0.0%) |
| Personal Care & Service | 18 (35.3%) | 33 (64.7%) |
| Total (Category) | 18 (21.2%) | 67 (78.8%) |
| Total (Overall) | 574 (55.4%) | 462 (44.6%) |
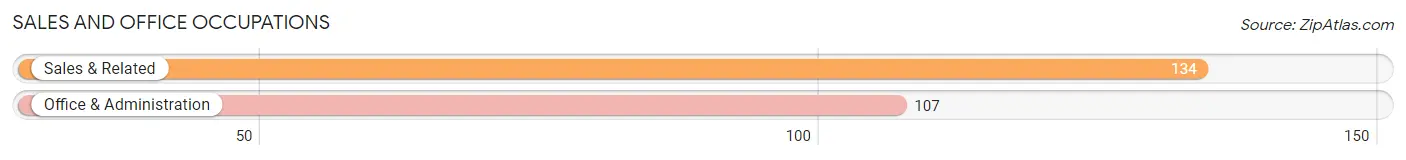
Sales and Office Occupations
The most common Sales and Office occupations in Rancho Santa Fe are Sales & Related (134 | 12.9%), and Office & Administration (107 | 10.3%).
Sales and Office Occupations by Sex
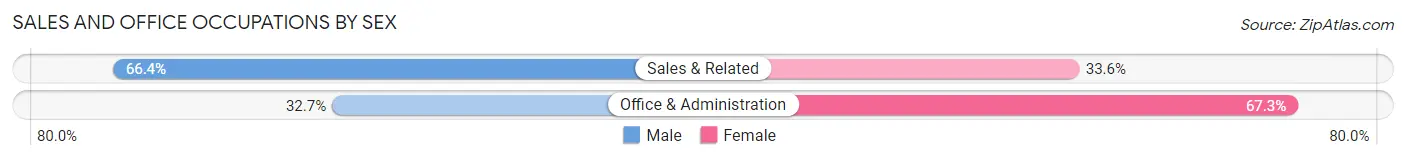
| Occupation | Male | Female |
| Sales & Related | 89 (66.4%) | 45 (33.6%) |
| Office & Administration | 35 (32.7%) | 72 (67.3%) |
| Total (Category) | 124 (51.4%) | 117 (48.5%) |
| Total (Overall) | 574 (55.4%) | 462 (44.6%) |
Natural Resources, Construction and Maintenance Occupations
Natural Resources, Construction and Maintenance Occupations by Sex
| Occupation | Male | Female |
| Farming, Fishing & Forestry | 0 (0.0%) | 0 (0.0%) |
| Construction & Extraction | 0 (0.0%) | 0 (0.0%) |
| Installation, Maintenance & Repair | 0 (0.0%) | 0 (0.0%) |
| Total (Category) | 0 (0.0%) | 0 (0.0%) |
| Total (Overall) | 574 (55.4%) | 462 (44.6%) |
Production, Transportation and Moving Occupations
The most common Production, Transportation and Moving occupations in Rancho Santa Fe are Transportation (64 | 6.2%), and Production (20 | 1.9%).
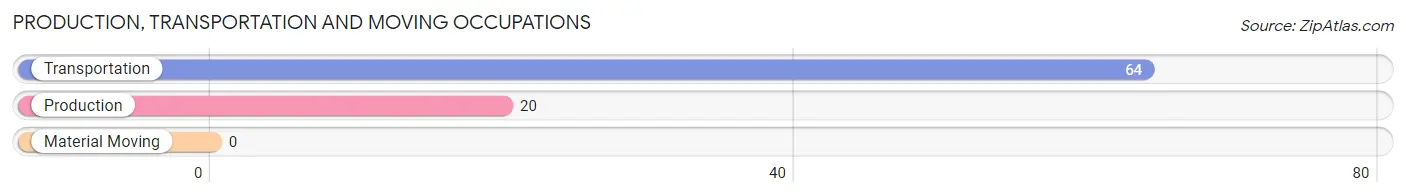
Production, Transportation and Moving Occupations by Sex
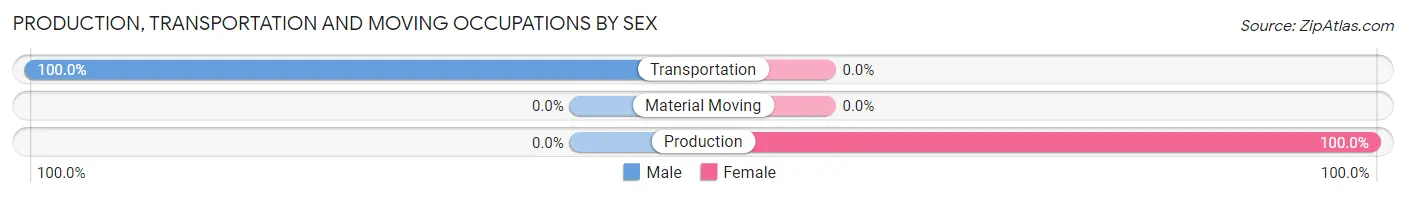
| Occupation | Male | Female |
| Production | 0 (0.0%) | 20 (100.0%) |
| Transportation | 64 (100.0%) | 0 (0.0%) |
| Material Moving | 0 (0.0%) | 0 (0.0%) |
| Total (Category) | 64 (76.2%) | 20 (23.8%) |
| Total (Overall) | 574 (55.4%) | 462 (44.6%) |
Employment Industries by Sex in Rancho Santa Fe
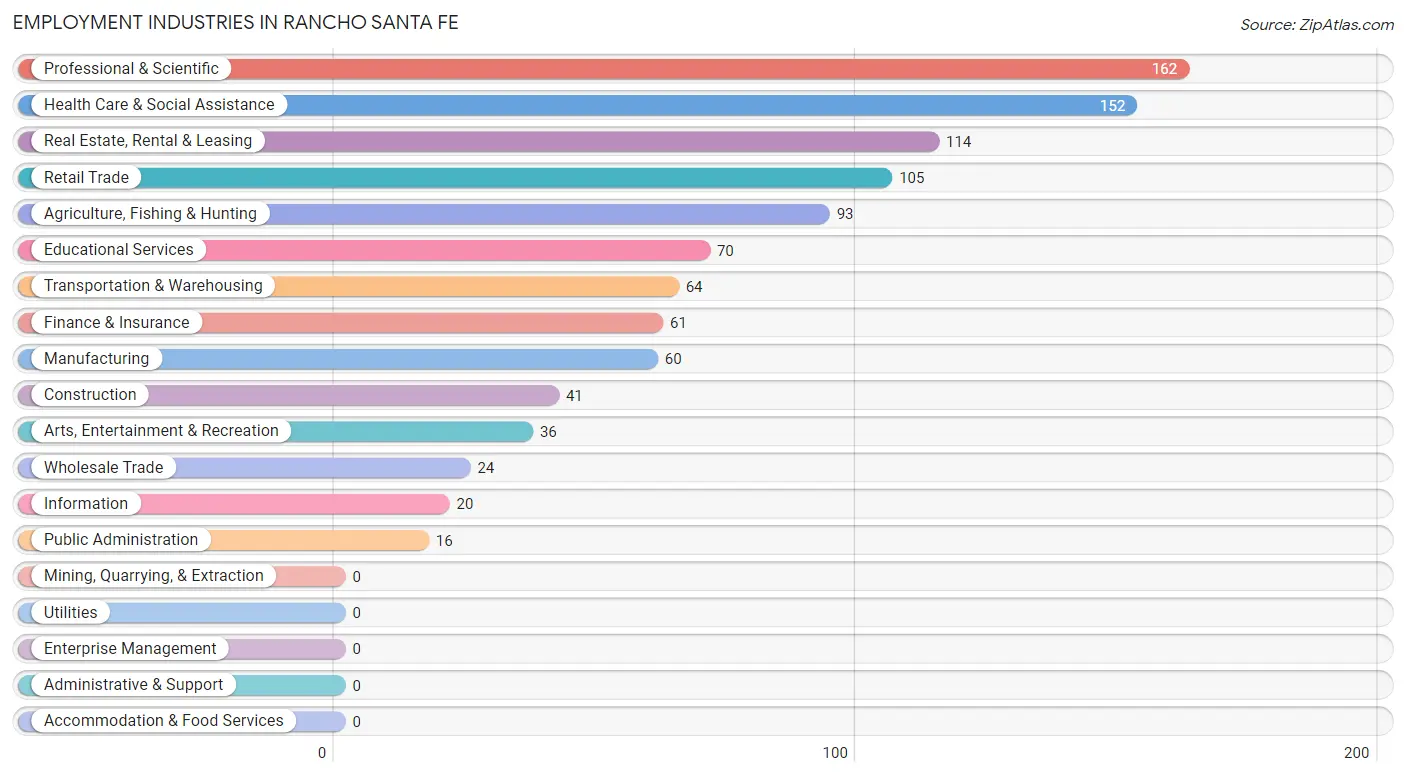
Employment Industries in Rancho Santa Fe
The major employment industries in Rancho Santa Fe include Professional & Scientific (162 | 15.6%), Health Care & Social Assistance (152 | 14.7%), Real Estate, Rental & Leasing (114 | 11.0%), Retail Trade (105 | 10.1%), and Agriculture, Fishing & Hunting (93 | 9.0%).
Employment Industries by Sex in Rancho Santa Fe
The Rancho Santa Fe industries that see more men than women are Construction (100.0%), Wholesale Trade (100.0%), and Transportation & Warehousing (100.0%), whereas the industries that tend to have a higher number of women are Agriculture, Fishing & Hunting (100.0%), Arts, Entertainment & Recreation (100.0%), and Educational Services (65.7%).
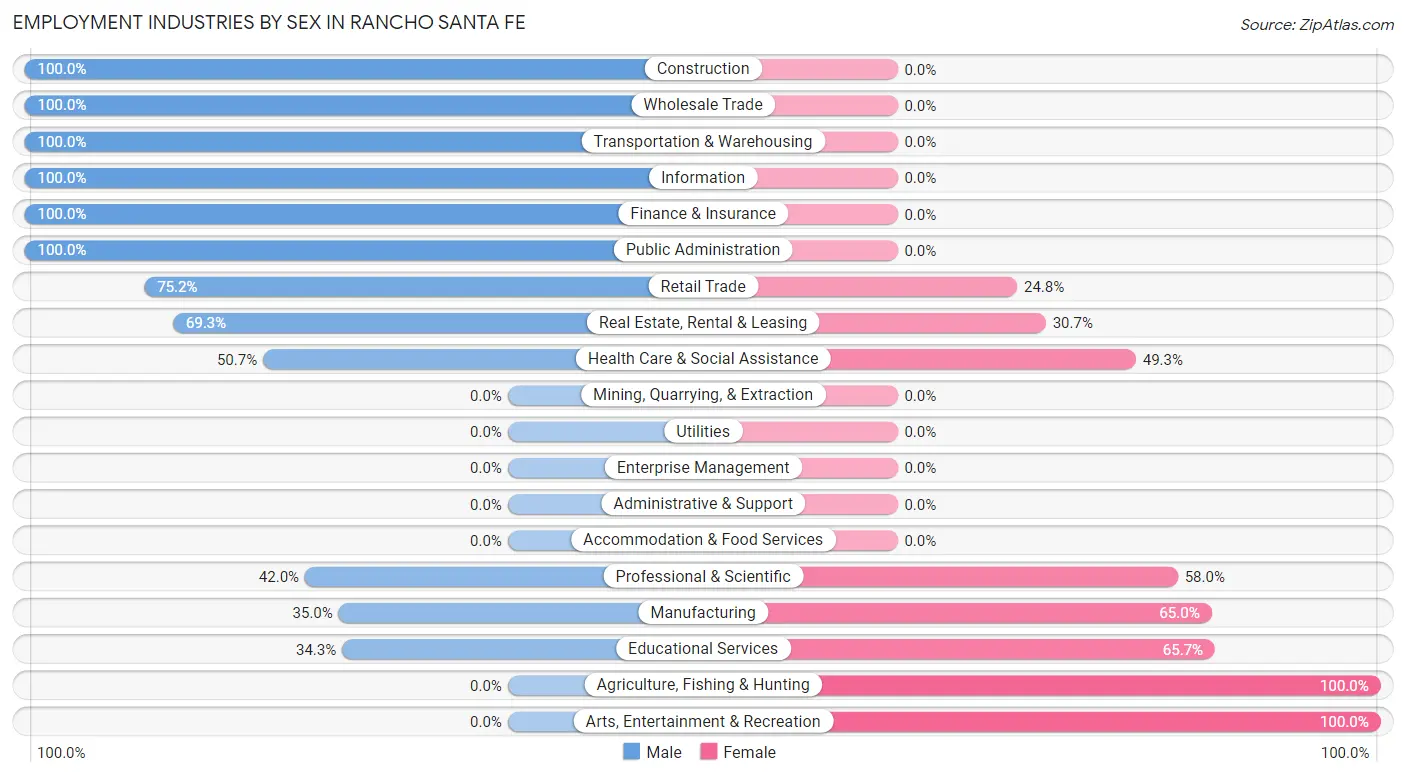
| Industry | Male | Female |
| Agriculture, Fishing & Hunting | 0 (0.0%) | 93 (100.0%) |
| Mining, Quarrying, & Extraction | 0 (0.0%) | 0 (0.0%) |
| Construction | 41 (100.0%) | 0 (0.0%) |
| Manufacturing | 21 (35.0%) | 39 (65.0%) |
| Wholesale Trade | 24 (100.0%) | 0 (0.0%) |
| Retail Trade | 79 (75.2%) | 26 (24.8%) |
| Transportation & Warehousing | 64 (100.0%) | 0 (0.0%) |
| Utilities | 0 (0.0%) | 0 (0.0%) |
| Information | 20 (100.0%) | 0 (0.0%) |
| Finance & Insurance | 61 (100.0%) | 0 (0.0%) |
| Real Estate, Rental & Leasing | 79 (69.3%) | 35 (30.7%) |
| Professional & Scientific | 68 (42.0%) | 94 (58.0%) |
| Enterprise Management | 0 (0.0%) | 0 (0.0%) |
| Administrative & Support | 0 (0.0%) | 0 (0.0%) |
| Educational Services | 24 (34.3%) | 46 (65.7%) |
| Health Care & Social Assistance | 77 (50.7%) | 75 (49.3%) |
| Arts, Entertainment & Recreation | 0 (0.0%) | 36 (100.0%) |
| Accommodation & Food Services | 0 (0.0%) | 0 (0.0%) |
| Public Administration | 16 (100.0%) | 0 (0.0%) |
| Total | 574 (55.4%) | 462 (44.6%) |
Education in Rancho Santa Fe
School Enrollment in Rancho Santa Fe
The most common levels of schooling among the 646 students in Rancho Santa Fe are high school (205 | 31.7%), nursery / preschool (112 | 17.3%), and middle school (103 | 15.9%).
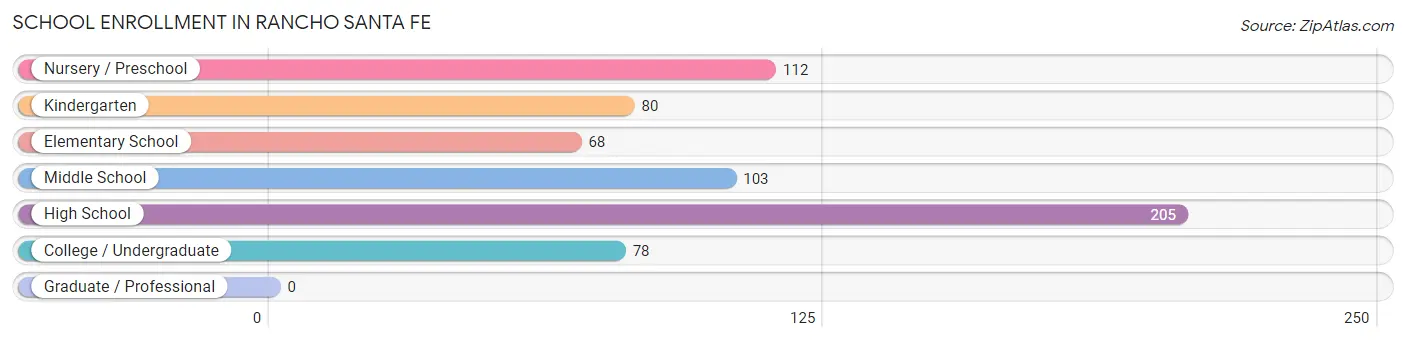
| School Level | # Students | % Students |
| Nursery / Preschool | 112 | 17.3% |
| Kindergarten | 80 | 12.4% |
| Elementary School | 68 | 10.5% |
| Middle School | 103 | 15.9% |
| High School | 205 | 31.7% |
| College / Undergraduate | 78 | 12.1% |
| Graduate / Professional | 0 | 0.0% |
| Total | 646 | 100.0% |
School Enrollment by Age by Funding Source in Rancho Santa Fe
Out of a total of 646 students who are enrolled in schools in Rancho Santa Fe, 354 (54.8%) attend a private institution, while the remaining 292 (45.2%) are enrolled in public schools. The age group of 3 to 4 year olds has the highest likelihood of being enrolled in private schools, with 71 (100.0% in the age bracket) enrolled. Conversely, the age group of 20 to 24 year olds has the lowest likelihood of being enrolled in a private school, with 18 (100.0% in the age bracket) attending a public institution.
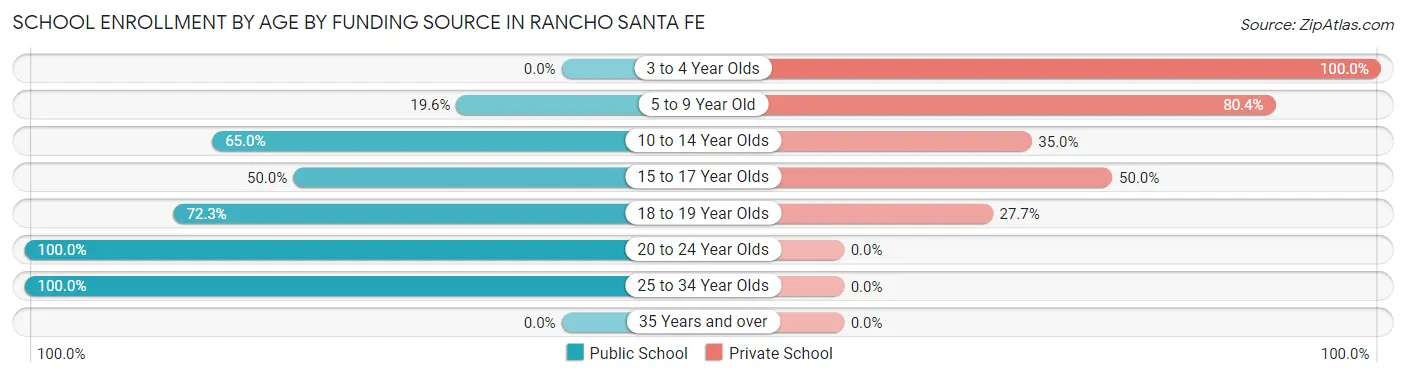
| Age Bracket | Public School | Private School |
| 3 to 4 Year Olds | 0 (0.0%) | 71 (100.0%) |
| 5 to 9 Year Old | 37 (19.6%) | 152 (80.4%) |
| 10 to 14 Year Olds | 80 (65.0%) | 43 (35.0%) |
| 15 to 17 Year Olds | 55 (50.0%) | 55 (50.0%) |
| 18 to 19 Year Olds | 86 (72.3%) | 33 (27.7%) |
| 20 to 24 Year Olds | 18 (100.0%) | 0 (0.0%) |
| 25 to 34 Year Olds | 16 (100.0%) | 0 (0.0%) |
| 35 Years and over | 0 (0.0%) | 0 (0.0%) |
| Total | 292 (45.2%) | 354 (54.8%) |
Educational Attainment by Field of Study in Rancho Santa Fe
Business (393 | 23.0%), social sciences (384 | 22.4%), communications (167 | 9.8%), education (139 | 8.1%), and bio, nature & agricultural (122 | 7.1%) are the most common fields of study among 1,712 individuals in Rancho Santa Fe who have obtained a bachelor's degree or higher.
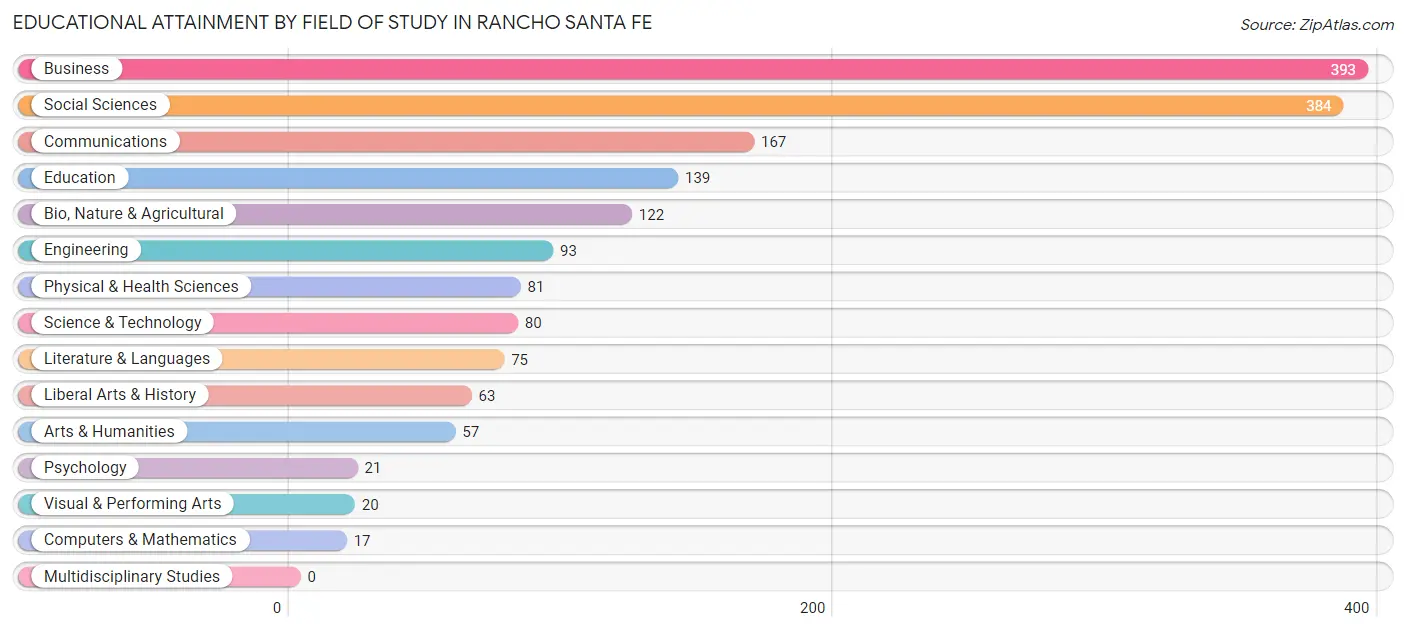
| Field of Study | # Graduates | % Graduates |
| Computers & Mathematics | 17 | 1.0% |
| Bio, Nature & Agricultural | 122 | 7.1% |
| Physical & Health Sciences | 81 | 4.7% |
| Psychology | 21 | 1.2% |
| Social Sciences | 384 | 22.4% |
| Engineering | 93 | 5.4% |
| Multidisciplinary Studies | 0 | 0.0% |
| Science & Technology | 80 | 4.7% |
| Business | 393 | 23.0% |
| Education | 139 | 8.1% |
| Literature & Languages | 75 | 4.4% |
| Liberal Arts & History | 63 | 3.7% |
| Visual & Performing Arts | 20 | 1.2% |
| Communications | 167 | 9.8% |
| Arts & Humanities | 57 | 3.3% |
| Total | 1,712 | 100.0% |
Transportation & Commute in Rancho Santa Fe
Vehicle Availability by Sex in Rancho Santa Fe
The most prevalent vehicle ownership categories in Rancho Santa Fe are males with 2 vehicles (211, accounting for 36.8%) and females with 2 vehicles (244, making up 47.5%).
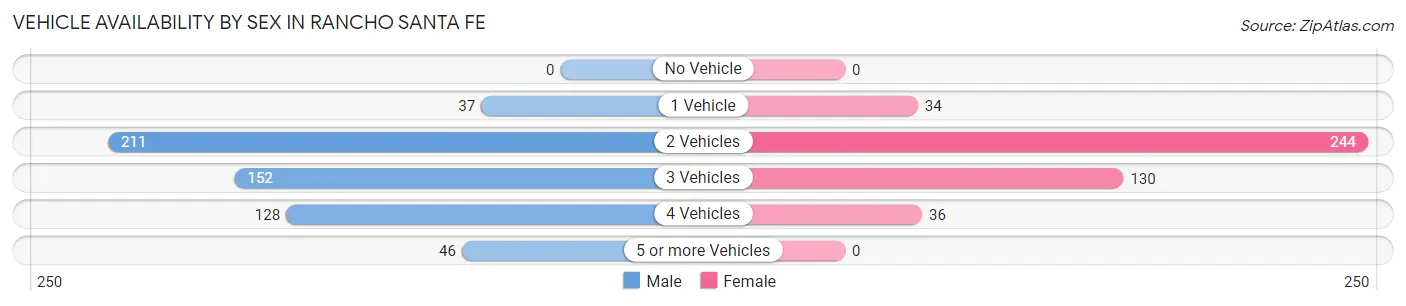
| Vehicles Available | Male | Female |
| No Vehicle | 0 (0.0%) | 0 (0.0%) |
| 1 Vehicle | 37 (6.5%) | 34 (7.7%) |
| 2 Vehicles | 211 (36.8%) | 244 (54.9%) |
| 3 Vehicles | 152 (26.5%) | 130 (29.3%) |
| 4 Vehicles | 128 (22.3%) | 36 (8.1%) |
| 5 or more Vehicles | 46 (8.0%) | 0 (0.0%) |
| Total | 574 (100.0%) | 444 (100.0%) |
Commute Time in Rancho Santa Fe
The most frequently occuring commute durations in Rancho Santa Fe are 25 to 29 minutes (181 commuters, 22.7%), 20 to 24 minutes (128 commuters, 16.0%), and 30 to 34 minutes (105 commuters, 13.2%).
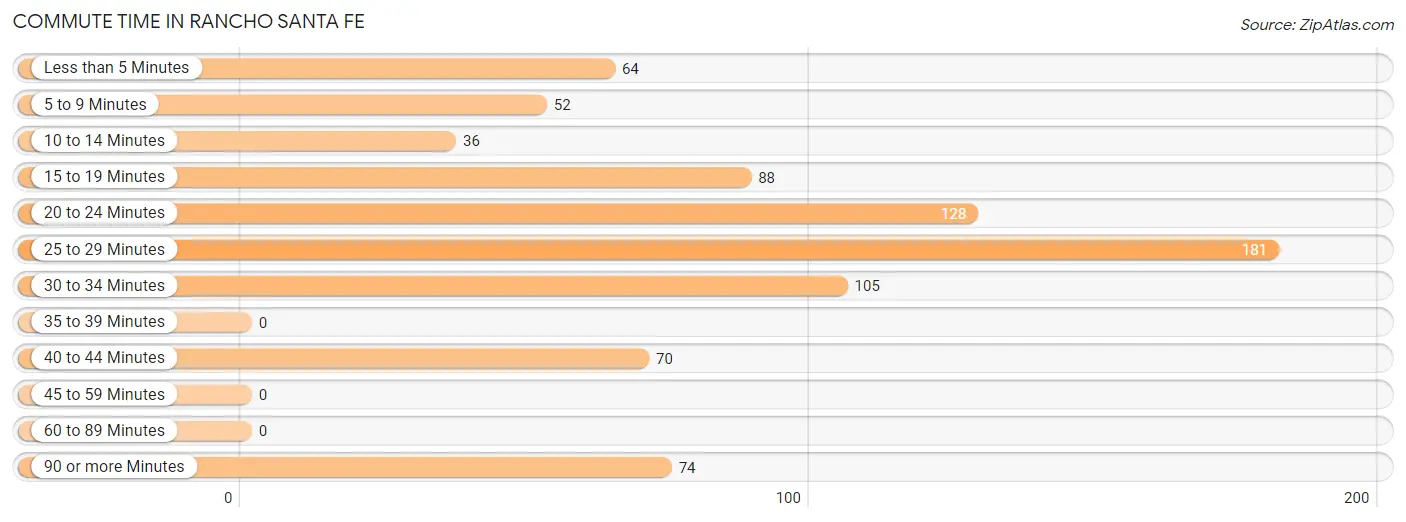
| Commute Time | # Commuters | % Commuters |
| Less than 5 Minutes | 64 | 8.0% |
| 5 to 9 Minutes | 52 | 6.5% |
| 10 to 14 Minutes | 36 | 4.5% |
| 15 to 19 Minutes | 88 | 11.0% |
| 20 to 24 Minutes | 128 | 16.0% |
| 25 to 29 Minutes | 181 | 22.7% |
| 30 to 34 Minutes | 105 | 13.2% |
| 35 to 39 Minutes | 0 | 0.0% |
| 40 to 44 Minutes | 70 | 8.8% |
| 45 to 59 Minutes | 0 | 0.0% |
| 60 to 89 Minutes | 0 | 0.0% |
| 90 or more Minutes | 74 | 9.3% |
Commute Time by Sex in Rancho Santa Fe
The most common commute times in Rancho Santa Fe are 25 to 29 minutes (104 commuters, 20.8%) for males and 25 to 29 minutes (77 commuters, 25.9%) for females.
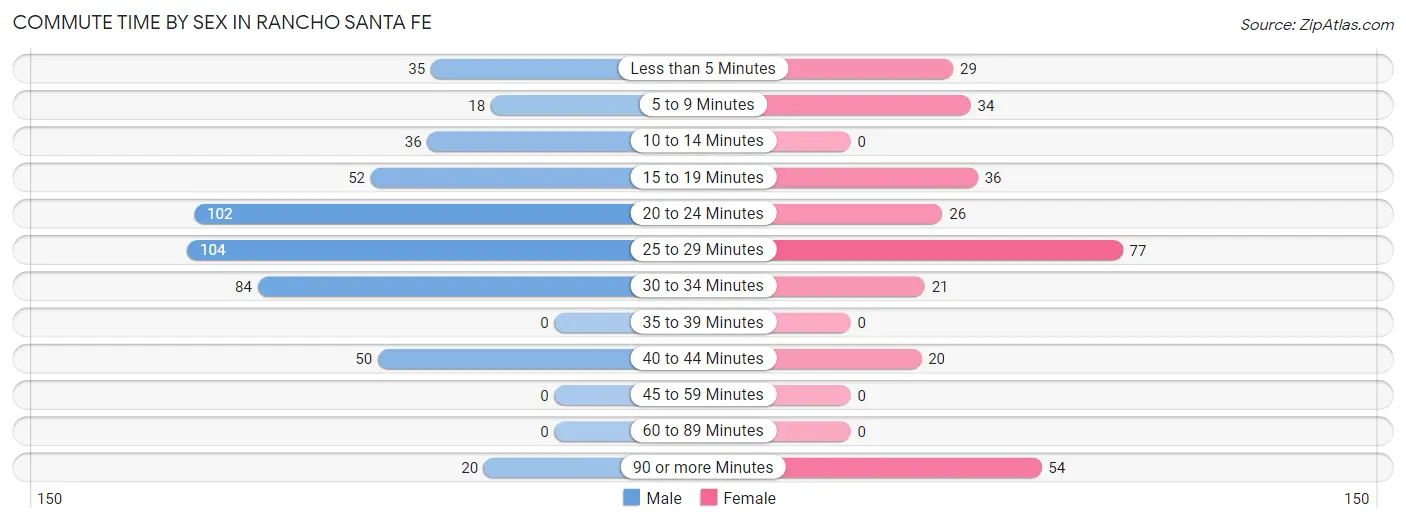
| Commute Time | Male | Female |
| Less than 5 Minutes | 35 (7.0%) | 29 (9.8%) |
| 5 to 9 Minutes | 18 (3.6%) | 34 (11.5%) |
| 10 to 14 Minutes | 36 (7.2%) | 0 (0.0%) |
| 15 to 19 Minutes | 52 (10.4%) | 36 (12.1%) |
| 20 to 24 Minutes | 102 (20.4%) | 26 (8.7%) |
| 25 to 29 Minutes | 104 (20.8%) | 77 (25.9%) |
| 30 to 34 Minutes | 84 (16.8%) | 21 (7.1%) |
| 35 to 39 Minutes | 0 (0.0%) | 0 (0.0%) |
| 40 to 44 Minutes | 50 (10.0%) | 20 (6.7%) |
| 45 to 59 Minutes | 0 (0.0%) | 0 (0.0%) |
| 60 to 89 Minutes | 0 (0.0%) | 0 (0.0%) |
| 90 or more Minutes | 20 (4.0%) | 54 (18.2%) |
Time of Departure to Work by Sex in Rancho Santa Fe
The most frequent times of departure to work in Rancho Santa Fe are 8:00 AM to 8:29 AM (99, 19.8%) for males and 8:00 AM to 8:29 AM (81, 27.3%) for females.
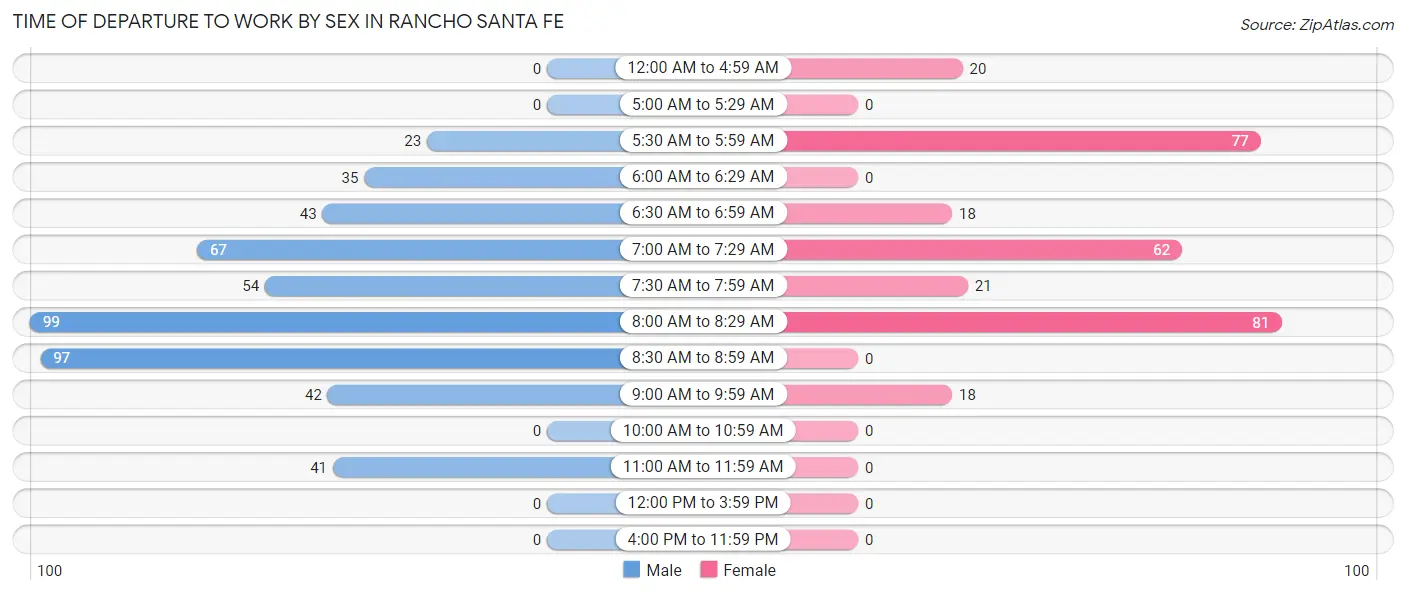
| Time of Departure | Male | Female |
| 12:00 AM to 4:59 AM | 0 (0.0%) | 20 (6.7%) |
| 5:00 AM to 5:29 AM | 0 (0.0%) | 0 (0.0%) |
| 5:30 AM to 5:59 AM | 23 (4.6%) | 77 (25.9%) |
| 6:00 AM to 6:29 AM | 35 (7.0%) | 0 (0.0%) |
| 6:30 AM to 6:59 AM | 43 (8.6%) | 18 (6.1%) |
| 7:00 AM to 7:29 AM | 67 (13.4%) | 62 (20.9%) |
| 7:30 AM to 7:59 AM | 54 (10.8%) | 21 (7.1%) |
| 8:00 AM to 8:29 AM | 99 (19.8%) | 81 (27.3%) |
| 8:30 AM to 8:59 AM | 97 (19.4%) | 0 (0.0%) |
| 9:00 AM to 9:59 AM | 42 (8.4%) | 18 (6.1%) |
| 10:00 AM to 10:59 AM | 0 (0.0%) | 0 (0.0%) |
| 11:00 AM to 11:59 AM | 41 (8.2%) | 0 (0.0%) |
| 12:00 PM to 3:59 PM | 0 (0.0%) | 0 (0.0%) |
| 4:00 PM to 11:59 PM | 0 (0.0%) | 0 (0.0%) |
| Total | 501 (100.0%) | 297 (100.0%) |
Housing Occupancy in Rancho Santa Fe
Occupancy by Ownership in Rancho Santa Fe
Of the total 1,061 dwellings in Rancho Santa Fe, owner-occupied units account for 905 (85.3%), while renter-occupied units make up 156 (14.7%).
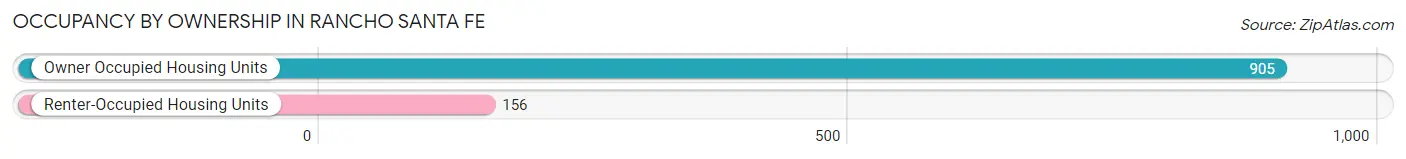
| Occupancy | # Housing Units | % Housing Units |
| Owner Occupied Housing Units | 905 | 85.3% |
| Renter-Occupied Housing Units | 156 | 14.7% |
| Total Occupied Housing Units | 1,061 | 100.0% |
Occupancy by Household Size in Rancho Santa Fe
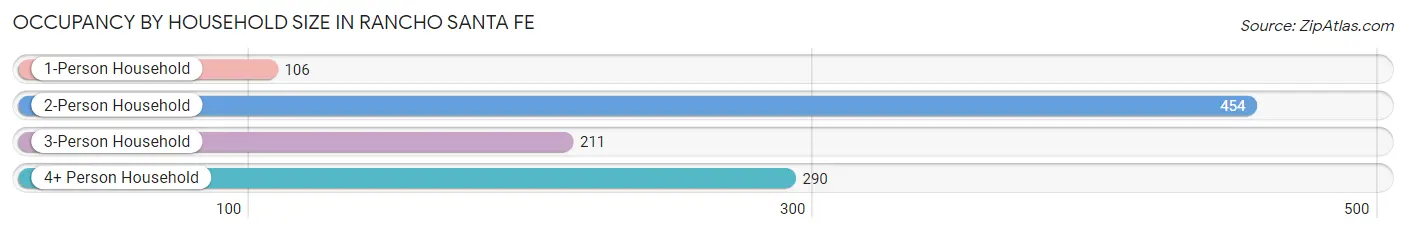
| Household Size | # Housing Units | % Housing Units |
| 1-Person Household | 106 | 10.0% |
| 2-Person Household | 454 | 42.8% |
| 3-Person Household | 211 | 19.9% |
| 4+ Person Household | 290 | 27.3% |
| Total Housing Units | 1,061 | 100.0% |
Occupancy by Ownership by Household Size in Rancho Santa Fe
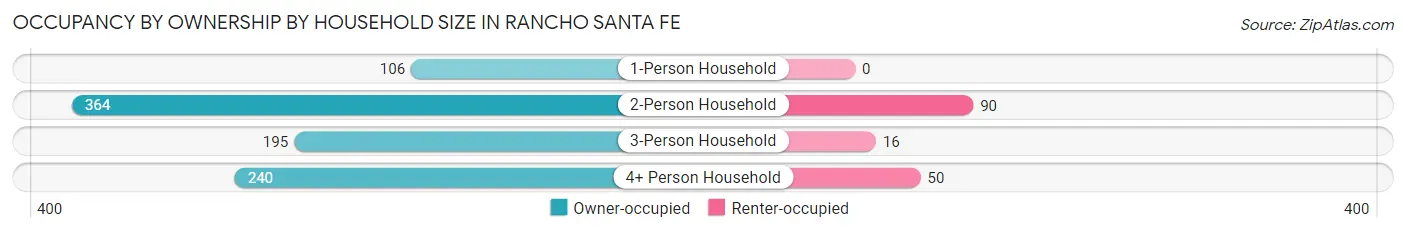
| Household Size | Owner-occupied | Renter-occupied |
| 1-Person Household | 106 (100.0%) | 0 (0.0%) |
| 2-Person Household | 364 (80.2%) | 90 (19.8%) |
| 3-Person Household | 195 (92.4%) | 16 (7.6%) |
| 4+ Person Household | 240 (82.8%) | 50 (17.2%) |
| Total Housing Units | 905 (85.3%) | 156 (14.7%) |
Occupancy by Educational Attainment in Rancho Santa Fe
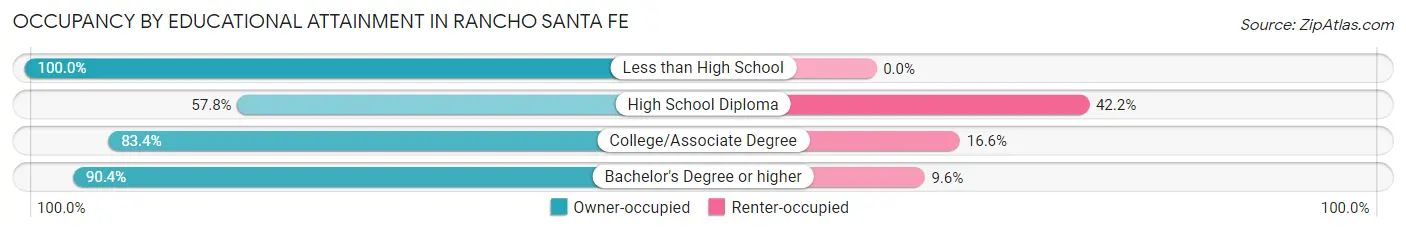
| Household Size | Owner-occupied | Renter-occupied |
| Less than High School | 22 (100.0%) | 0 (0.0%) |
| High School Diploma | 74 (57.8%) | 54 (42.2%) |
| College/Associate Degree | 176 (83.4%) | 35 (16.6%) |
| Bachelor's Degree or higher | 633 (90.4%) | 67 (9.6%) |
Occupancy by Age of Householder in Rancho Santa Fe
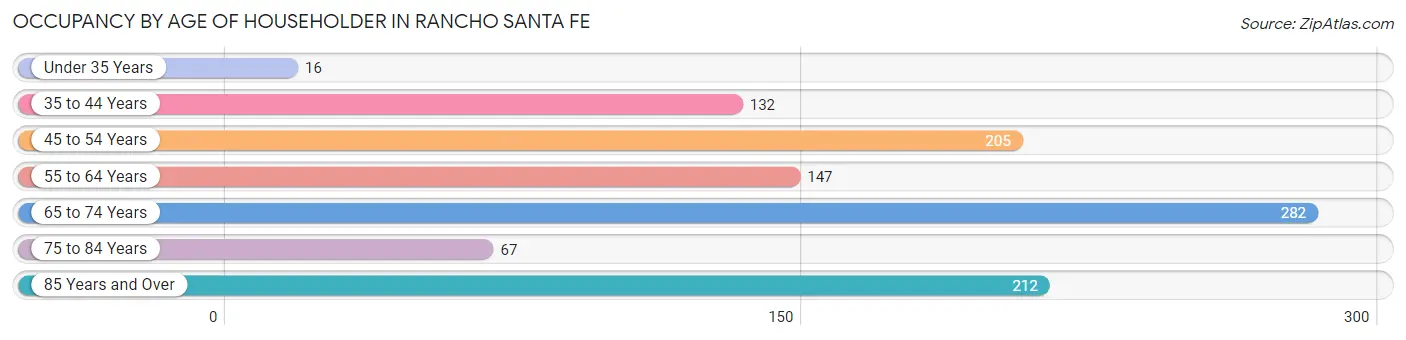
| Age Bracket | # Households | % Households |
| Under 35 Years | 16 | 1.5% |
| 35 to 44 Years | 132 | 12.4% |
| 45 to 54 Years | 205 | 19.3% |
| 55 to 64 Years | 147 | 13.9% |
| 65 to 74 Years | 282 | 26.6% |
| 75 to 84 Years | 67 | 6.3% |
| 85 Years and Over | 212 | 20.0% |
| Total | 1,061 | 100.0% |
Housing Finances in Rancho Santa Fe
Median Income by Occupancy in Rancho Santa Fe
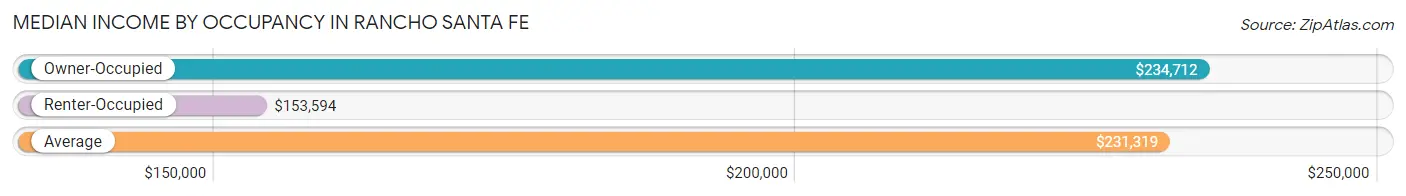
| Occupancy Type | # Households | Median Income |
| Owner-Occupied | 905 (85.3%) | $234,712 |
| Renter-Occupied | 156 (14.7%) | $153,594 |
| Average | 1,061 (100.0%) | $231,319 |
Occupancy by Householder Income Bracket in Rancho Santa Fe
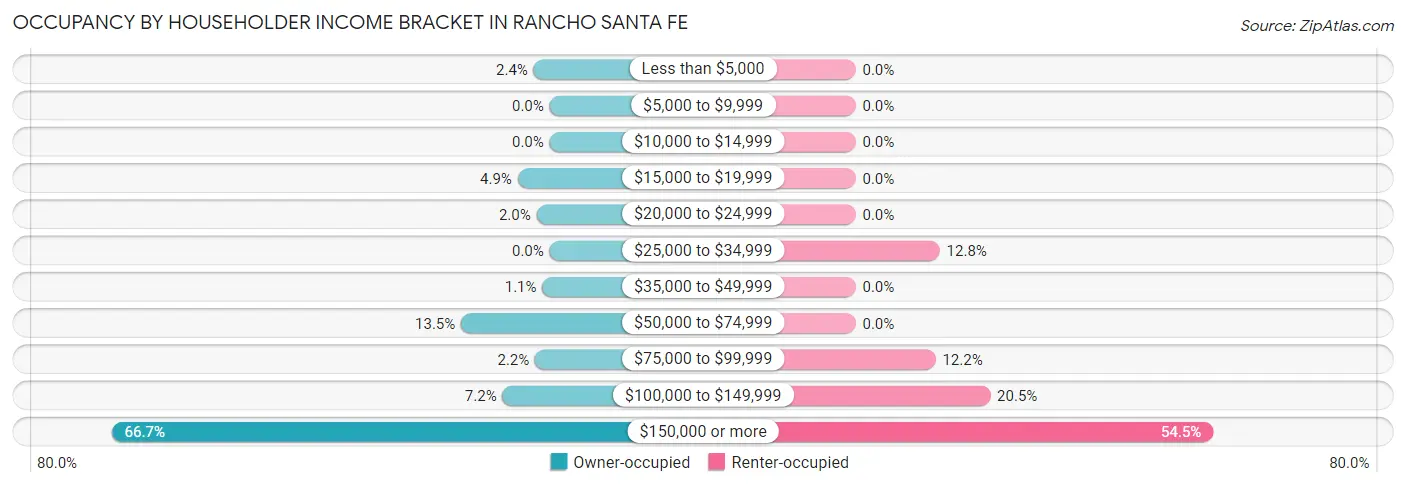
| Income Bracket | Owner-occupied | Renter-occupied |
| Less than $5,000 | 22 (2.4%) | 0 (0.0%) |
| $5,000 to $9,999 | 0 (0.0%) | 0 (0.0%) |
| $10,000 to $14,999 | 0 (0.0%) | 0 (0.0%) |
| $15,000 to $19,999 | 44 (4.9%) | 0 (0.0%) |
| $20,000 to $24,999 | 18 (2.0%) | 0 (0.0%) |
| $25,000 to $34,999 | 0 (0.0%) | 20 (12.8%) |
| $35,000 to $49,999 | 10 (1.1%) | 0 (0.0%) |
| $50,000 to $74,999 | 122 (13.5%) | 0 (0.0%) |
| $75,000 to $99,999 | 20 (2.2%) | 19 (12.2%) |
| $100,000 to $149,999 | 65 (7.2%) | 32 (20.5%) |
| $150,000 or more | 604 (66.7%) | 85 (54.5%) |
| Total | 905 (100.0%) | 156 (100.0%) |
Monthly Housing Cost Tiers in Rancho Santa Fe
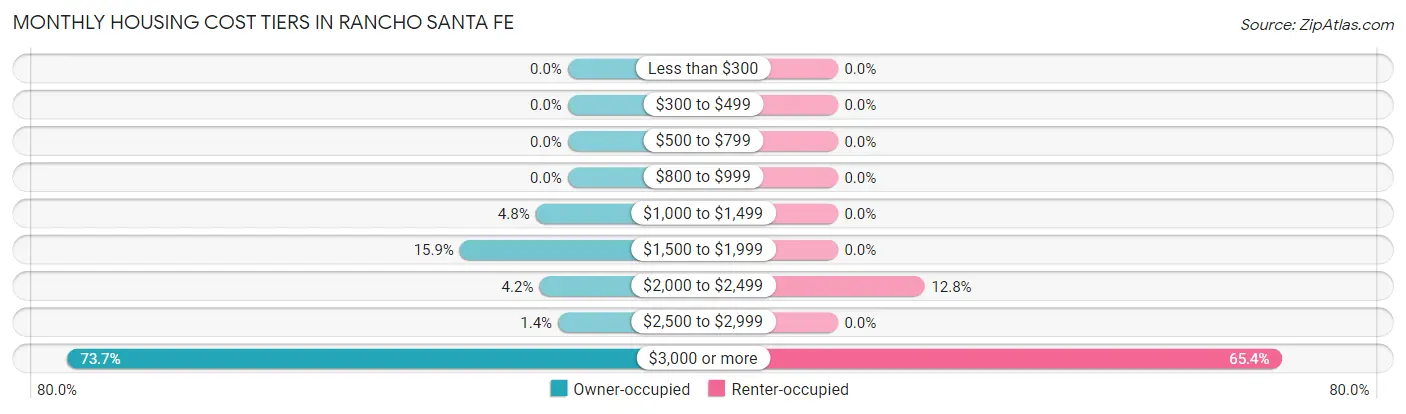
| Monthly Cost | Owner-occupied | Renter-occupied |
| Less than $300 | 0 (0.0%) | 0 (0.0%) |
| $300 to $499 | 0 (0.0%) | 0 (0.0%) |
| $500 to $799 | 0 (0.0%) | 0 (0.0%) |
| $800 to $999 | 0 (0.0%) | 0 (0.0%) |
| $1,000 to $1,499 | 43 (4.8%) | 0 (0.0%) |
| $1,500 to $1,999 | 144 (15.9%) | 0 (0.0%) |
| $2,000 to $2,499 | 38 (4.2%) | 20 (12.8%) |
| $2,500 to $2,999 | 13 (1.4%) | 0 (0.0%) |
| $3,000 or more | 667 (73.7%) | 102 (65.4%) |
| Total | 905 (100.0%) | 156 (100.0%) |
Physical Housing Characteristics in Rancho Santa Fe
Housing Structures in Rancho Santa Fe
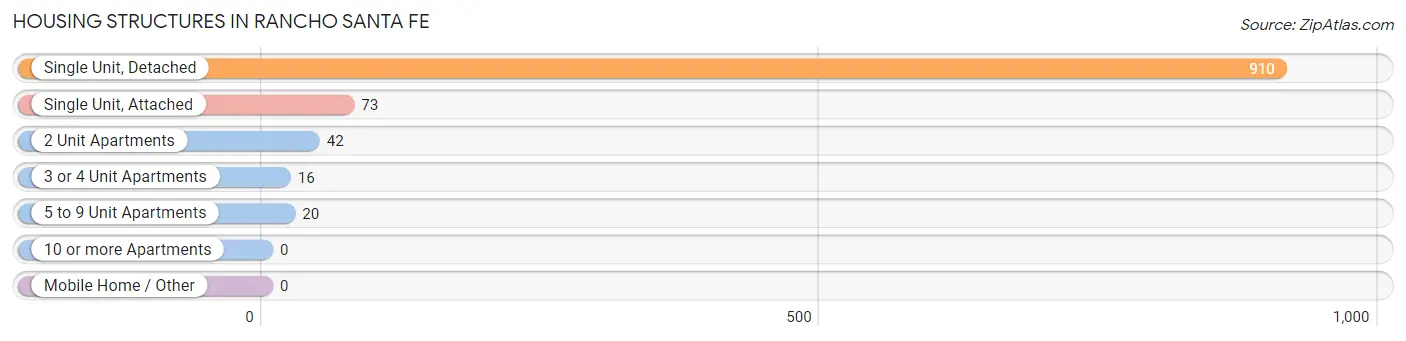
| Structure Type | # Housing Units | % Housing Units |
| Single Unit, Detached | 910 | 85.8% |
| Single Unit, Attached | 73 | 6.9% |
| 2 Unit Apartments | 42 | 4.0% |
| 3 or 4 Unit Apartments | 16 | 1.5% |
| 5 to 9 Unit Apartments | 20 | 1.9% |
| 10 or more Apartments | 0 | 0.0% |
| Mobile Home / Other | 0 | 0.0% |
| Total | 1,061 | 100.0% |
Housing Structures by Occupancy in Rancho Santa Fe
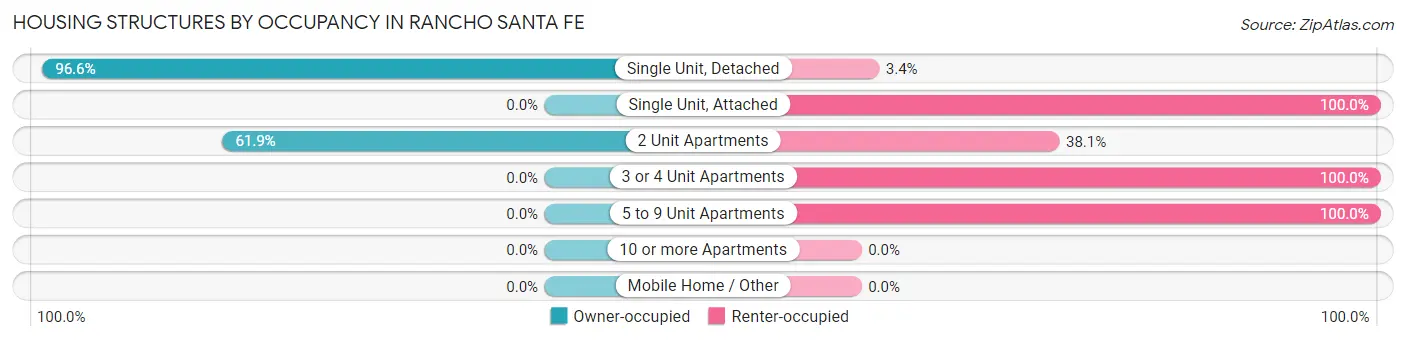
| Structure Type | Owner-occupied | Renter-occupied |
| Single Unit, Detached | 879 (96.6%) | 31 (3.4%) |
| Single Unit, Attached | 0 (0.0%) | 73 (100.0%) |
| 2 Unit Apartments | 26 (61.9%) | 16 (38.1%) |
| 3 or 4 Unit Apartments | 0 (0.0%) | 16 (100.0%) |
| 5 to 9 Unit Apartments | 0 (0.0%) | 20 (100.0%) |
| 10 or more Apartments | 0 (0.0%) | 0 (0.0%) |
| Mobile Home / Other | 0 (0.0%) | 0 (0.0%) |
| Total | 905 (85.3%) | 156 (14.7%) |
Housing Structures by Number of Rooms in Rancho Santa Fe
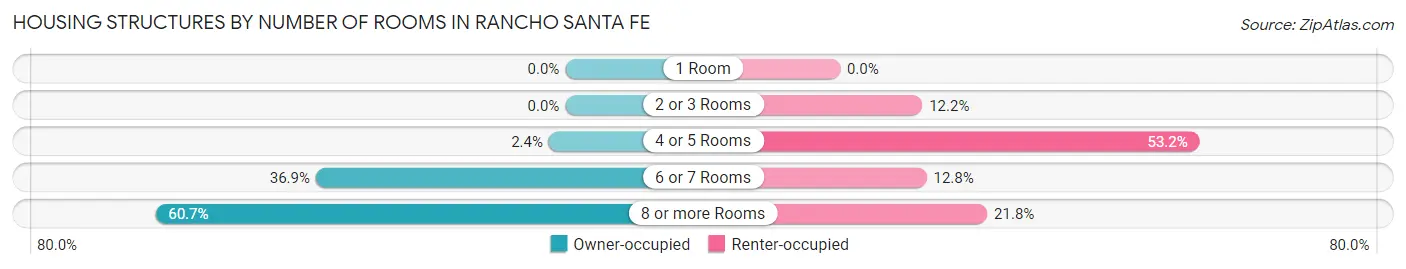
| Number of Rooms | Owner-occupied | Renter-occupied |
| 1 Room | 0 (0.0%) | 0 (0.0%) |
| 2 or 3 Rooms | 0 (0.0%) | 19 (12.2%) |
| 4 or 5 Rooms | 22 (2.4%) | 83 (53.2%) |
| 6 or 7 Rooms | 334 (36.9%) | 20 (12.8%) |
| 8 or more Rooms | 549 (60.7%) | 34 (21.8%) |
| Total | 905 (100.0%) | 156 (100.0%) |
Housing Structure by Heating Type in Rancho Santa Fe
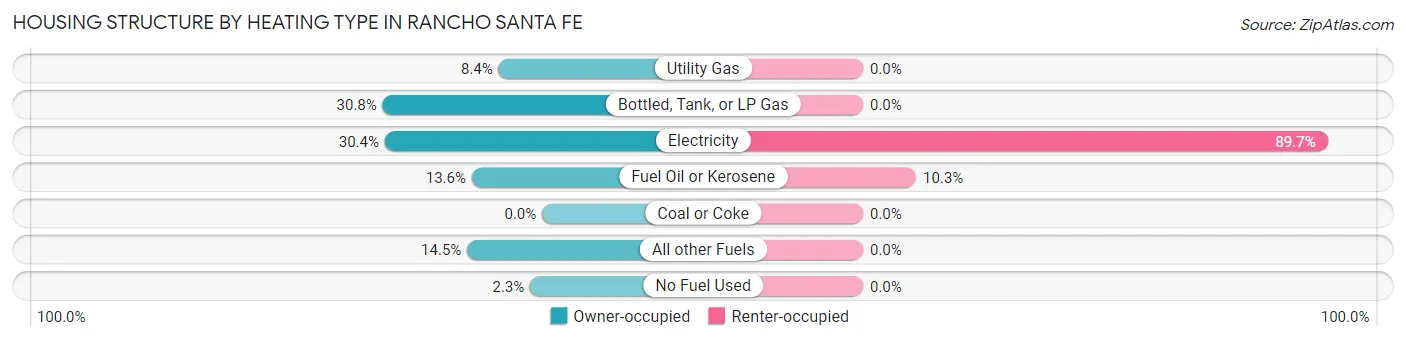
| Heating Type | Owner-occupied | Renter-occupied |
| Utility Gas | 76 (8.4%) | 0 (0.0%) |
| Bottled, Tank, or LP Gas | 279 (30.8%) | 0 (0.0%) |
| Electricity | 275 (30.4%) | 140 (89.7%) |
| Fuel Oil or Kerosene | 123 (13.6%) | 16 (10.3%) |
| Coal or Coke | 0 (0.0%) | 0 (0.0%) |
| All other Fuels | 131 (14.5%) | 0 (0.0%) |
| No Fuel Used | 21 (2.3%) | 0 (0.0%) |
| Total | 905 (100.0%) | 156 (100.0%) |
Household Vehicle Usage in Rancho Santa Fe
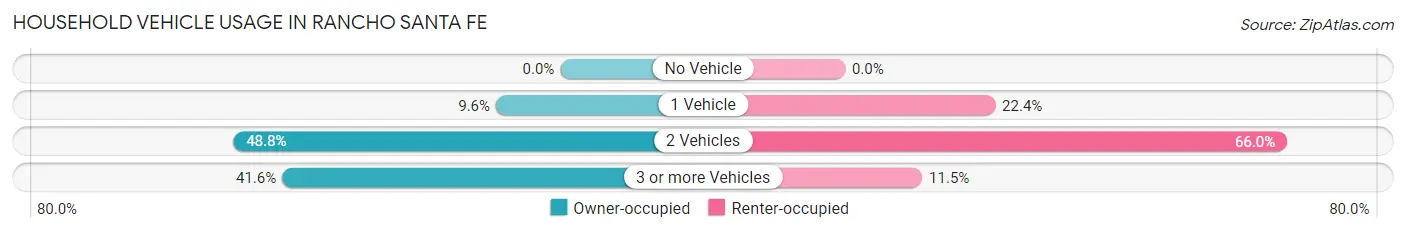
| Vehicles per Household | Owner-occupied | Renter-occupied |
| No Vehicle | 0 (0.0%) | 0 (0.0%) |
| 1 Vehicle | 87 (9.6%) | 35 (22.4%) |
| 2 Vehicles | 442 (48.8%) | 103 (66.0%) |
| 3 or more Vehicles | 376 (41.5%) | 18 (11.5%) |
| Total | 905 (100.0%) | 156 (100.0%) |
Real Estate & Mortgages in Rancho Santa Fe
Real Estate and Mortgage Overview in Rancho Santa Fe
| Characteristic | Without Mortgage | With Mortgage |
| Housing Units | 323 | 582 |
| Median Property Value | $2,000,001 | $2,000,001 |
| Median Household Income | - | - |
| Monthly Housing Costs | $1,501 | $541 |
| Real Estate Taxes | $10,001 | $19 |
Property Value by Mortgage Status in Rancho Santa Fe
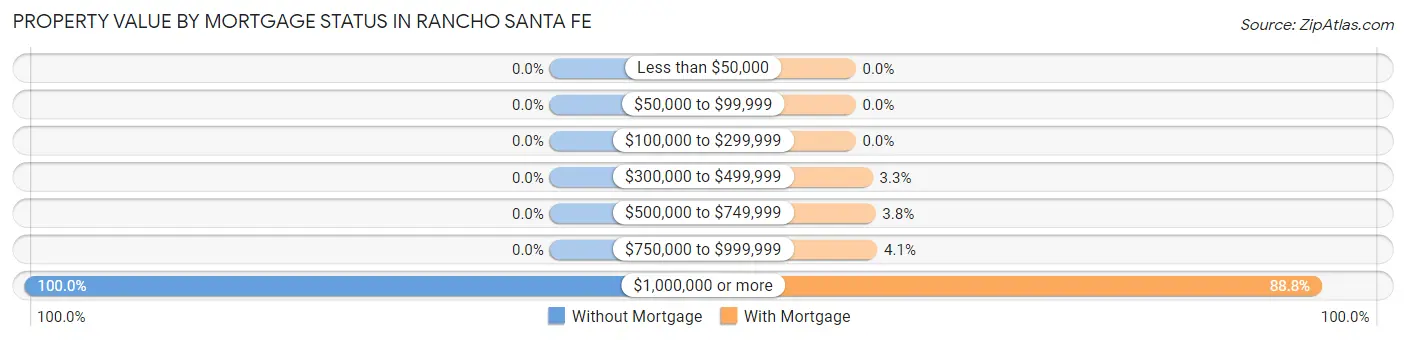
| Property Value | Without Mortgage | With Mortgage |
| Less than $50,000 | 0 (0.0%) | 0 (0.0%) |
| $50,000 to $99,999 | 0 (0.0%) | 0 (0.0%) |
| $100,000 to $299,999 | 0 (0.0%) | 0 (0.0%) |
| $300,000 to $499,999 | 0 (0.0%) | 19 (3.3%) |
| $500,000 to $749,999 | 0 (0.0%) | 22 (3.8%) |
| $750,000 to $999,999 | 0 (0.0%) | 24 (4.1%) |
| $1,000,000 or more | 323 (100.0%) | 517 (88.8%) |
| Total | 323 (100.0%) | 582 (100.0%) |
Household Income by Mortgage Status in Rancho Santa Fe
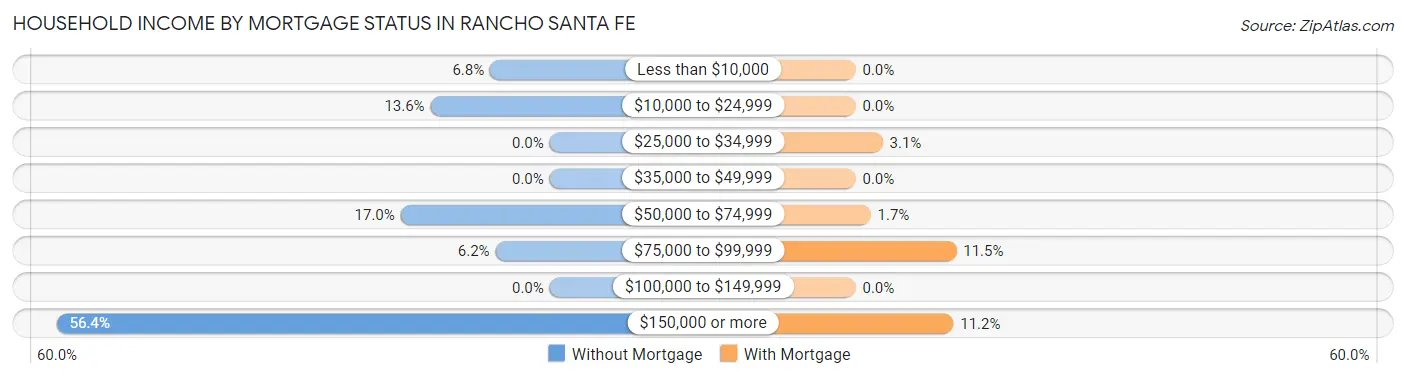
| Household Income | Without Mortgage | With Mortgage |
| Less than $10,000 | 22 (6.8%) | 0 (0.0%) |
| $10,000 to $24,999 | 44 (13.6%) | 0 (0.0%) |
| $25,000 to $34,999 | 0 (0.0%) | 18 (3.1%) |
| $35,000 to $49,999 | 0 (0.0%) | 0 (0.0%) |
| $50,000 to $74,999 | 55 (17.0%) | 10 (1.7%) |
| $75,000 to $99,999 | 20 (6.2%) | 67 (11.5%) |
| $100,000 to $149,999 | 0 (0.0%) | 0 (0.0%) |
| $150,000 or more | 182 (56.4%) | 65 (11.2%) |
| Total | 323 (100.0%) | 582 (100.0%) |
Property Value to Household Income Ratio in Rancho Santa Fe
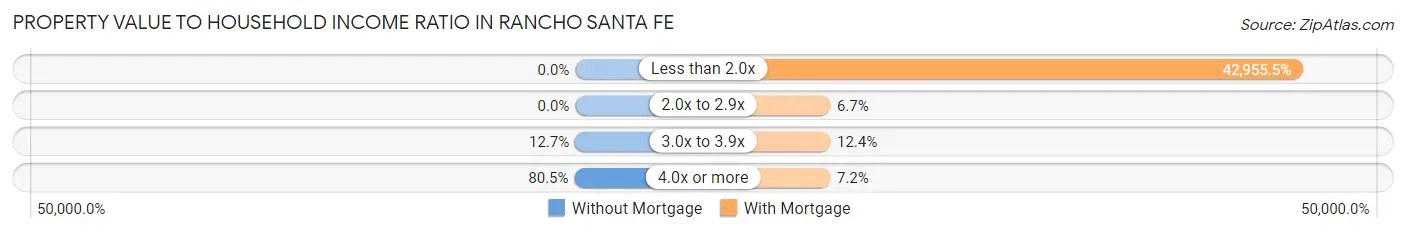
| Value-to-Income Ratio | Without Mortgage | With Mortgage |
| Less than 2.0x | 0 (0.0%) | 250,001 (42,955.5%) |
| 2.0x to 2.9x | 0 (0.0%) | 39 (6.7%) |
| 3.0x to 3.9x | 41 (12.7%) | 72 (12.4%) |
| 4.0x or more | 260 (80.5%) | 42 (7.2%) |
| Total | 323 (100.0%) | 582 (100.0%) |
Real Estate Taxes by Mortgage Status in Rancho Santa Fe
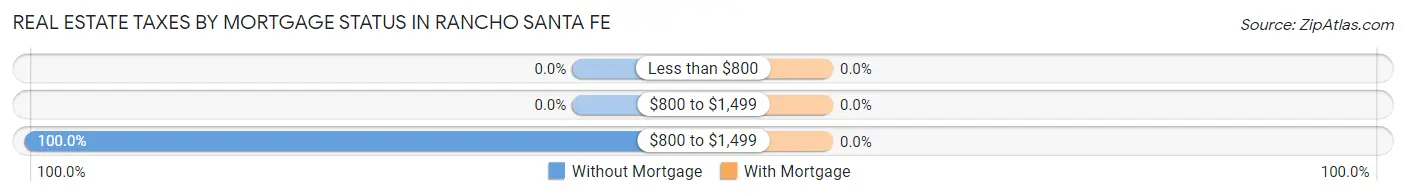
| Property Taxes | Without Mortgage | With Mortgage |
| Less than $800 | 0 (0.0%) | 0 (0.0%) |
| $800 to $1,499 | 0 (0.0%) | 0 (0.0%) |
| $800 to $1,499 | 323 (100.0%) | 0 (0.0%) |
| Total | 323 (100.0%) | 582 (100.0%) |
Health & Disability in Rancho Santa Fe
Health Insurance Coverage by Age in Rancho Santa Fe
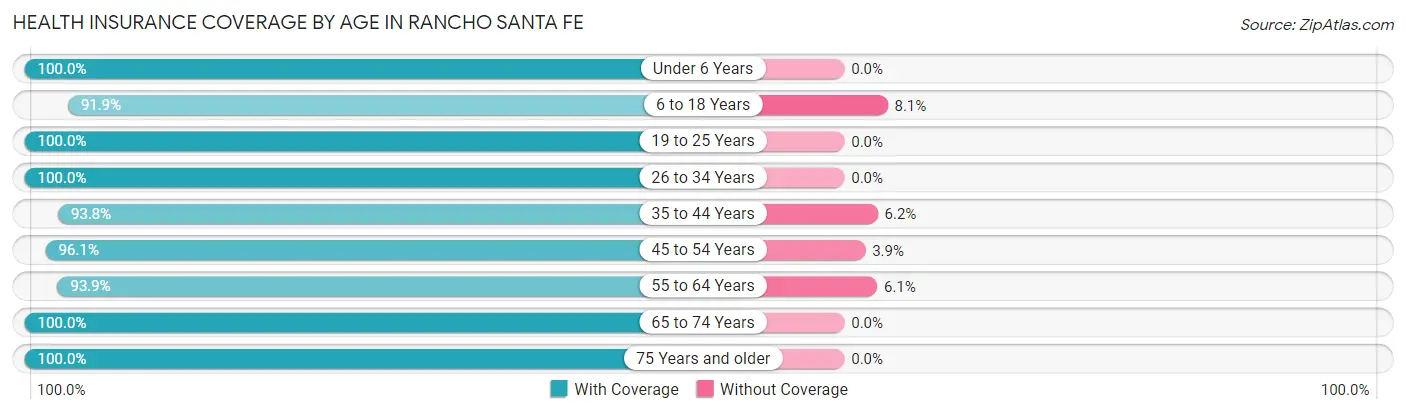
| Age Bracket | With Coverage | Without Coverage |
| Under 6 Years | 178 (100.0%) | 0 (0.0%) |
| 6 to 18 Years | 479 (91.9%) | 42 (8.1%) |
| 19 to 25 Years | 60 (100.0%) | 0 (0.0%) |
| 26 to 34 Years | 178 (100.0%) | 0 (0.0%) |
| 35 to 44 Years | 317 (93.8%) | 21 (6.2%) |
| 45 to 54 Years | 444 (96.1%) | 18 (3.9%) |
| 55 to 64 Years | 292 (93.9%) | 19 (6.1%) |
| 65 to 74 Years | 620 (100.0%) | 0 (0.0%) |
| 75 Years and older | 365 (100.0%) | 0 (0.0%) |
| Total | 2,933 (96.7%) | 100 (3.3%) |
Health Insurance Coverage by Citizenship Status in Rancho Santa Fe
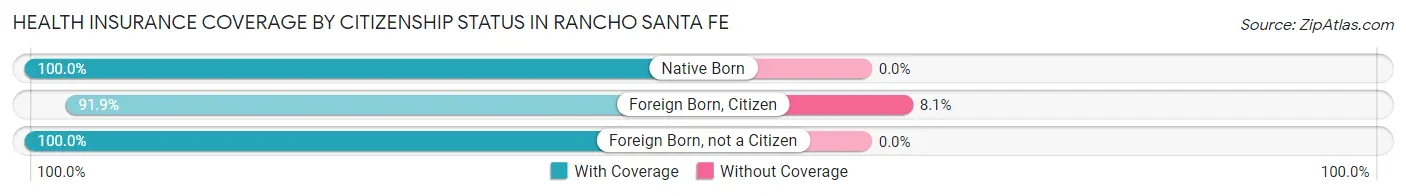
| Citizenship Status | With Coverage | Without Coverage |
| Native Born | 178 (100.0%) | 0 (0.0%) |
| Foreign Born, Citizen | 479 (91.9%) | 42 (8.1%) |
| Foreign Born, not a Citizen | 60 (100.0%) | 0 (0.0%) |
Health Insurance Coverage by Household Income in Rancho Santa Fe
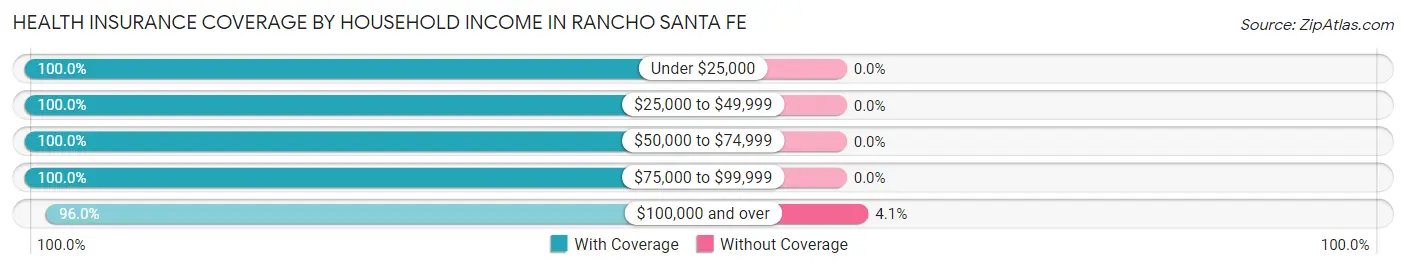
| Household Income | With Coverage | Without Coverage |
| Under $25,000 | 101 (100.0%) | 0 (0.0%) |
| $25,000 to $49,999 | 64 (100.0%) | 0 (0.0%) |
| $50,000 to $74,999 | 255 (100.0%) | 0 (0.0%) |
| $75,000 to $99,999 | 145 (100.0%) | 0 (0.0%) |
| $100,000 and over | 2,368 (96.0%) | 100 (4.1%) |
Public vs Private Health Insurance Coverage by Age in Rancho Santa Fe
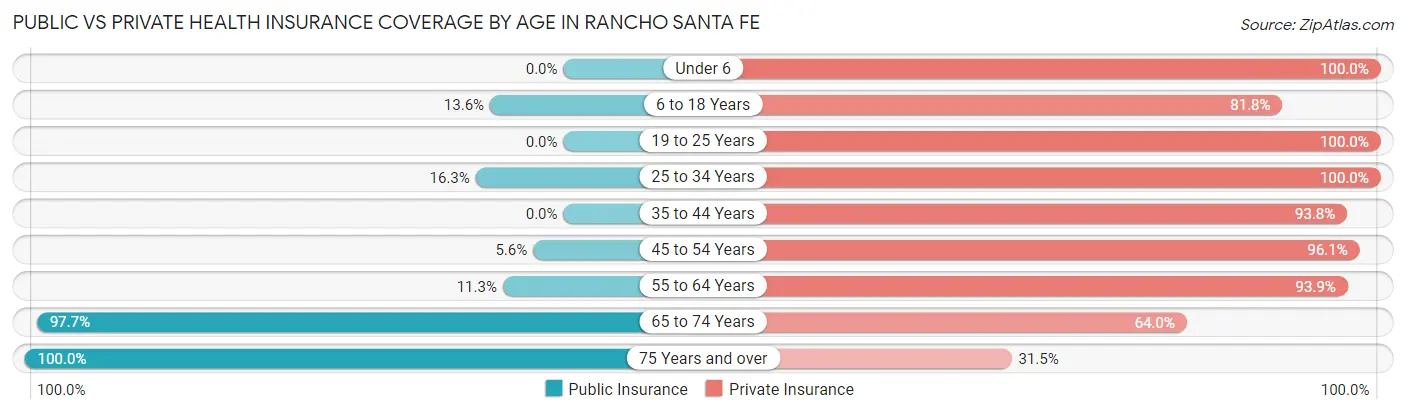
| Age Bracket | Public Insurance | Private Insurance |
| Under 6 | 0 (0.0%) | 178 (100.0%) |
| 6 to 18 Years | 71 (13.6%) | 426 (81.8%) |
| 19 to 25 Years | 0 (0.0%) | 60 (100.0%) |
| 25 to 34 Years | 29 (16.3%) | 178 (100.0%) |
| 35 to 44 Years | 0 (0.0%) | 317 (93.8%) |
| 45 to 54 Years | 26 (5.6%) | 444 (96.1%) |
| 55 to 64 Years | 35 (11.3%) | 292 (93.9%) |
| 65 to 74 Years | 606 (97.7%) | 397 (64.0%) |
| 75 Years and over | 365 (100.0%) | 115 (31.5%) |
| Total | 1,132 (37.3%) | 2,407 (79.4%) |
Disability Status by Sex by Age in Rancho Santa Fe
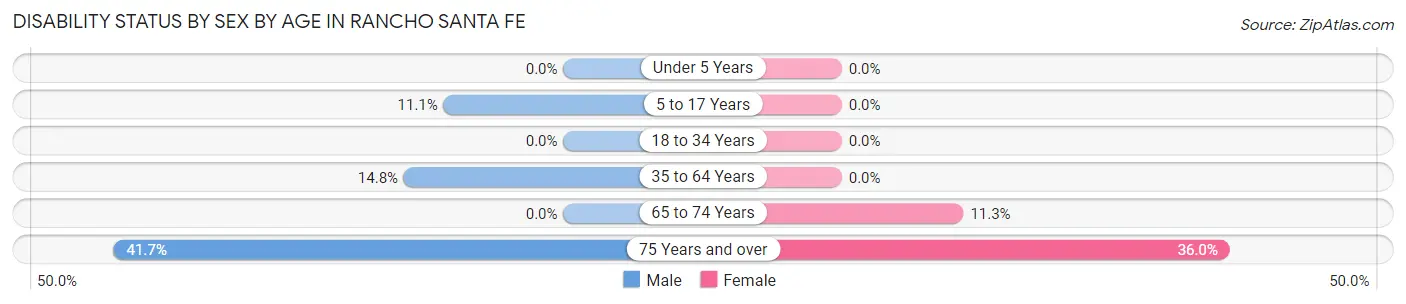
| Age Bracket | Male | Female |
| Under 5 Years | 0 (0.0%) | 0 (0.0%) |
| 5 to 17 Years | 19 (11.1%) | 0 (0.0%) |
| 18 to 34 Years | 0 (0.0%) | 0 (0.0%) |
| 35 to 64 Years | 82 (14.8%) | 0 (0.0%) |
| 65 to 74 Years | 0 (0.0%) | 43 (11.3%) |
| 75 Years and over | 48 (41.7%) | 90 (36.0%) |
Disability Class by Sex by Age in Rancho Santa Fe
Disability Class: Hearing Difficulty
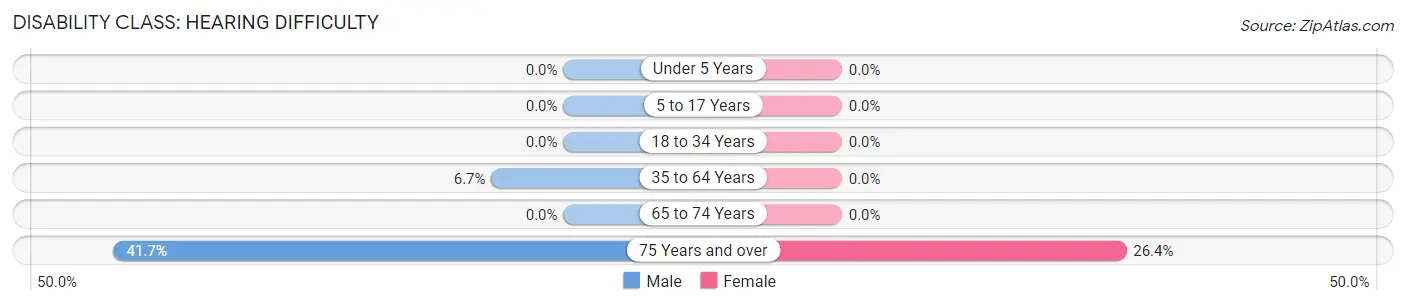
| Age Bracket | Male | Female |
| Under 5 Years | 0 (0.0%) | 0 (0.0%) |
| 5 to 17 Years | 0 (0.0%) | 0 (0.0%) |
| 18 to 34 Years | 0 (0.0%) | 0 (0.0%) |
| 35 to 64 Years | 37 (6.7%) | 0 (0.0%) |
| 65 to 74 Years | 0 (0.0%) | 0 (0.0%) |
| 75 Years and over | 48 (41.7%) | 66 (26.4%) |
Disability Class: Vision Difficulty
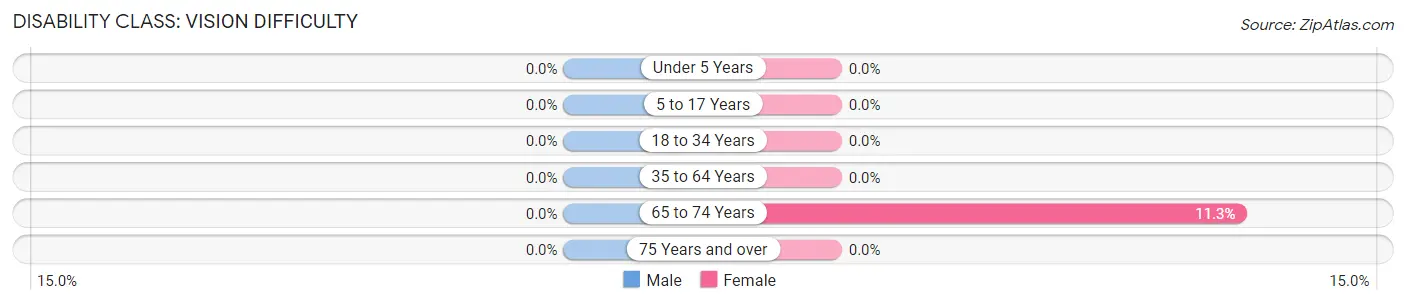
| Age Bracket | Male | Female |
| Under 5 Years | 0 (0.0%) | 0 (0.0%) |
| 5 to 17 Years | 0 (0.0%) | 0 (0.0%) |
| 18 to 34 Years | 0 (0.0%) | 0 (0.0%) |
| 35 to 64 Years | 0 (0.0%) | 0 (0.0%) |
| 65 to 74 Years | 0 (0.0%) | 43 (11.3%) |
| 75 Years and over | 0 (0.0%) | 0 (0.0%) |
Disability Class: Cognitive Difficulty
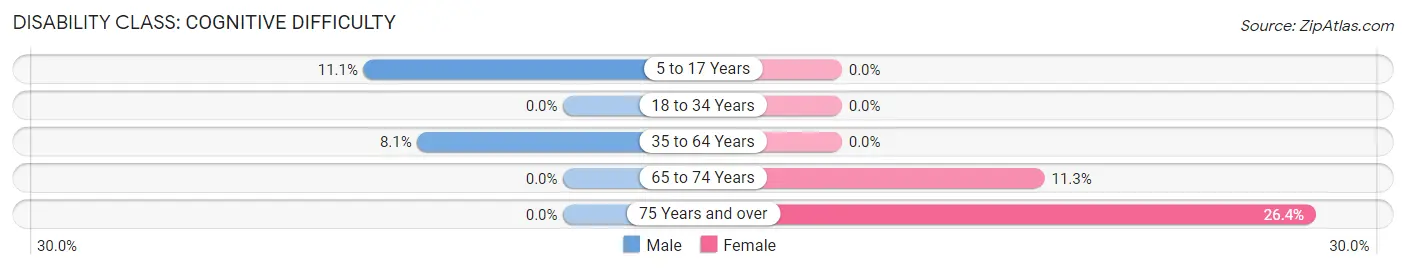
| Age Bracket | Male | Female |
| 5 to 17 Years | 19 (11.1%) | 0 (0.0%) |
| 18 to 34 Years | 0 (0.0%) | 0 (0.0%) |
| 35 to 64 Years | 45 (8.1%) | 0 (0.0%) |
| 65 to 74 Years | 0 (0.0%) | 43 (11.3%) |
| 75 Years and over | 0 (0.0%) | 66 (26.4%) |
Disability Class: Ambulatory Difficulty
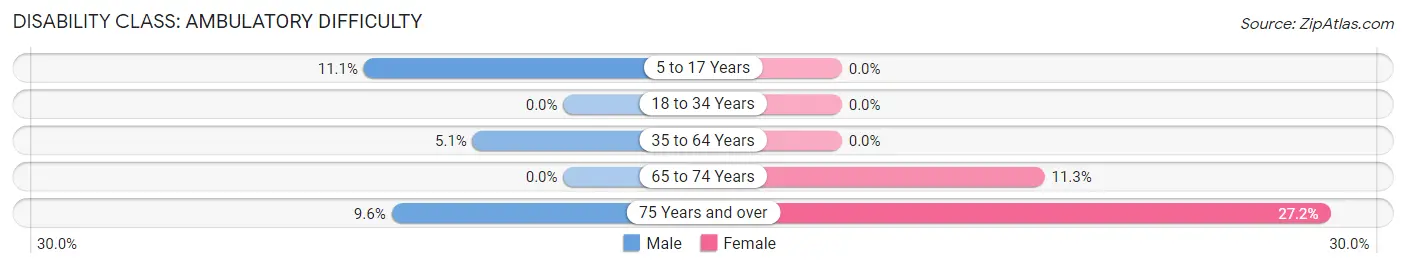
| Age Bracket | Male | Female |
| 5 to 17 Years | 19 (11.1%) | 0 (0.0%) |
| 18 to 34 Years | 0 (0.0%) | 0 (0.0%) |
| 35 to 64 Years | 28 (5.1%) | 0 (0.0%) |
| 65 to 74 Years | 0 (0.0%) | 43 (11.3%) |
| 75 Years and over | 11 (9.6%) | 68 (27.2%) |
Disability Class: Self-Care Difficulty
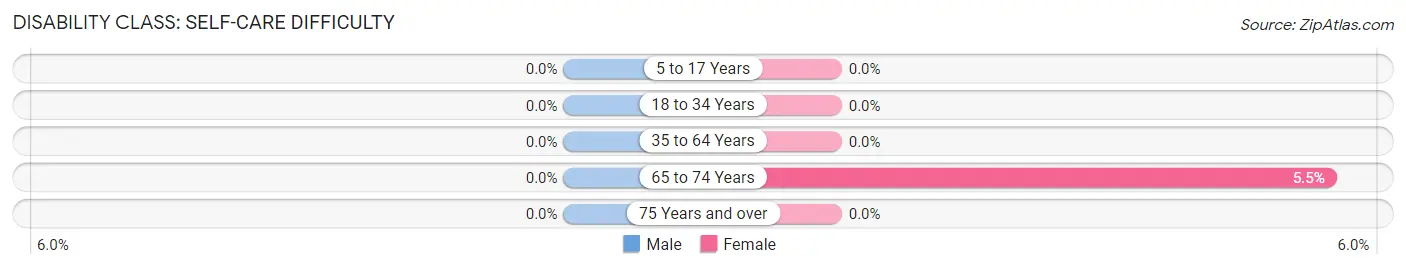
| Age Bracket | Male | Female |
| 5 to 17 Years | 0 (0.0%) | 0 (0.0%) |
| 18 to 34 Years | 0 (0.0%) | 0 (0.0%) |
| 35 to 64 Years | 0 (0.0%) | 0 (0.0%) |
| 65 to 74 Years | 0 (0.0%) | 21 (5.5%) |
| 75 Years and over | 0 (0.0%) | 0 (0.0%) |
Technology Access in Rancho Santa Fe
Computing Device Access in Rancho Santa Fe
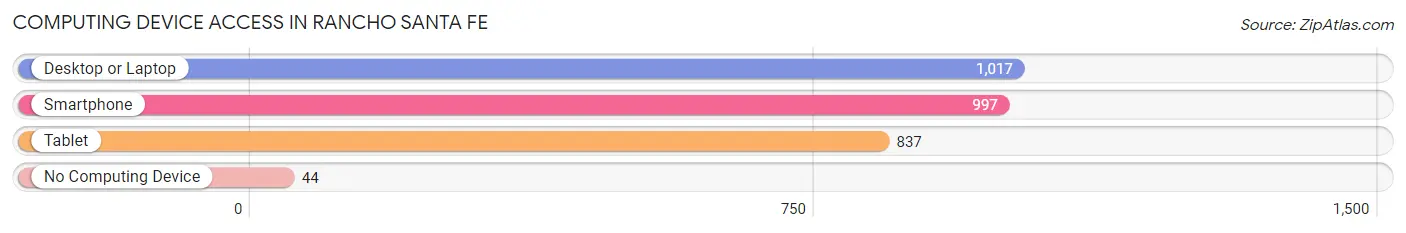
| Device Type | # Households | % Households |
| Desktop or Laptop | 1,017 | 95.9% |
| Smartphone | 997 | 94.0% |
| Tablet | 837 | 78.9% |
| No Computing Device | 44 | 4.2% |
| Total | 1,061 | 100.0% |
Internet Access in Rancho Santa Fe
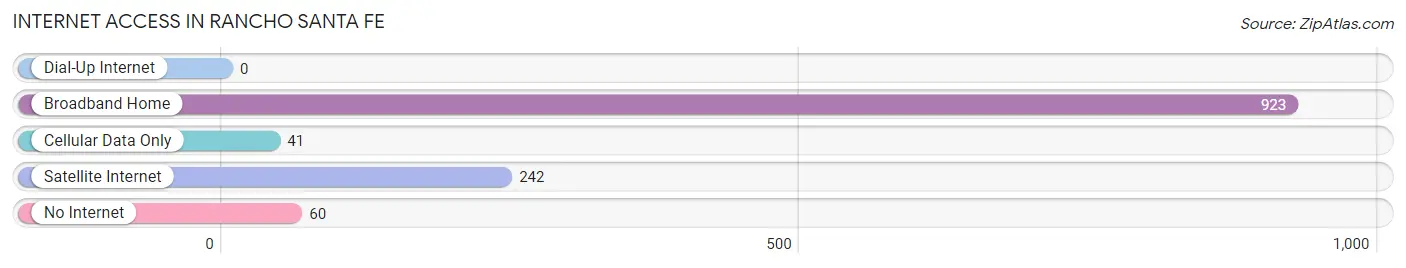
| Internet Type | # Households | % Households |
| Dial-Up Internet | 0 | 0.0% |
| Broadband Home | 923 | 87.0% |
| Cellular Data Only | 41 | 3.9% |
| Satellite Internet | 242 | 22.8% |
| No Internet | 60 | 5.7% |
| Total | 1,061 | 100.0% |
Rancho Santa Fe Summary
Rancho Santa Fe is a small, affluent community located in San Diego County, California. It is situated in the foothills of the Santa Ana Mountains, approximately 25 miles north of downtown San Diego. The community is known for its rural atmosphere, rolling hills, and lush vegetation. It is home to some of the most expensive real estate in the United States, and is one of the wealthiest communities in the country.
History
Rancho Santa Fe was originally part of a large Spanish land grant known as Rancho San Dieguito. The land was granted to Juan Maria Osuna in 1845, and was later divided among his sons. In 1906, the area was purchased by the Santa Fe Land Improvement Company, which developed the area into a rural residential community. The company was responsible for the construction of the iconic Rancho Santa Fe Inn, which opened in 1922.
The community was incorporated in 1928, and the first mayor was elected in 1929. The town was designed to be a rural residential community, and the original plan included a golf course, tennis courts, and a polo field. The community was also home to a number of prominent residents, including actor Douglas Fairbanks, Jr., and aviator Charles Lindbergh.
Geography
Rancho Santa Fe is located in the foothills of the Santa Ana Mountains, approximately 25 miles north of downtown San Diego. The community is situated at an elevation of approximately 500 feet above sea level. The area is characterized by rolling hills, lush vegetation, and a rural atmosphere.
The climate in Rancho Santa Fe is mild and temperate, with temperatures ranging from the mid-50s to the mid-80s throughout the year. The area receives an average of 12 inches of rain per year, and is generally sunny and dry.
Economy
Rancho Santa Fe is an affluent community, and the local economy is largely driven by real estate and tourism. The area is home to some of the most expensive real estate in the United States, and is one of the wealthiest communities in the country.
The community is also home to a number of businesses, including restaurants, retail stores, and professional services. The local economy is also supported by the nearby Torrey Pines Golf Course, which attracts visitors from around the world.
Demographics
As of the 2010 census, the population of Rancho Santa Fe was 3,117. The population is predominantly white (90.2%), with a small percentage of Hispanic or Latino residents (4.3%). The median household income is $150,000, and the median home value is $1.7 million.
Conclusion
Rancho Santa Fe is a small, affluent community located in San Diego County, California. It is situated in the foothills of the Santa Ana Mountains, approximately 25 miles north of downtown San Diego. The community is known for its rural atmosphere, rolling hills, and lush vegetation. It is home to some of the most expensive real estate in the United States, and is one of the wealthiest communities in the country. The local economy is largely driven by real estate and tourism, and the population is predominantly white.
Common Questions
What is Per Capita Income in Rancho Santa Fe?
Per Capita income in Rancho Santa Fe is $117,291.
What is the Median Family Income in Rancho Santa Fe?
Median Family Income in Rancho Santa Fe is $239,342.
What is the Median Household income in Rancho Santa Fe?
Median Household Income in Rancho Santa Fe is $231,319.
What is Income or Wage Gap in Rancho Santa Fe?
Income or Wage Gap in Rancho Santa Fe is 69.1%.
Women in Rancho Santa Fe earn 30.9 cents for every dollar earned by a man.
What is Inequality or Gini Index in Rancho Santa Fe?
Inequality or Gini Index in Rancho Santa Fe is 0.53.
What is the Total Population of Rancho Santa Fe?
Total Population of Rancho Santa Fe is 3,033.
What is the Total Male Population of Rancho Santa Fe?
Total Male Population of Rancho Santa Fe is 1,260.
What is the Total Female Population of Rancho Santa Fe?
Total Female Population of Rancho Santa Fe is 1,773.
What is the Ratio of Males per 100 Females in Rancho Santa Fe?
There are 71.07 Males per 100 Females in Rancho Santa Fe.
What is the Ratio of Females per 100 Males in Rancho Santa Fe?
There are 140.71 Females per 100 Males in Rancho Santa Fe.
What is the Median Population Age in Rancho Santa Fe?
Median Population Age in Rancho Santa Fe is 50.1 Years.
What is the Average Family Size in Rancho Santa Fe
Average Family Size in Rancho Santa Fe is 3.0 People.
What is the Average Household Size in Rancho Santa Fe
Average Household Size in Rancho Santa Fe is 2.9 People.
How Large is the Labor Force in Rancho Santa Fe?
There are 1,105 People in the Labor Forcein in Rancho Santa Fe.
What is the Percentage of People in the Labor Force in Rancho Santa Fe?
43.7% of People are in the Labor Force in Rancho Santa Fe.
What is the Unemployment Rate in Rancho Santa Fe?
Unemployment Rate in Rancho Santa Fe is 6.3%.