Hockessin, DE Map & Demographics
Hockessin Map
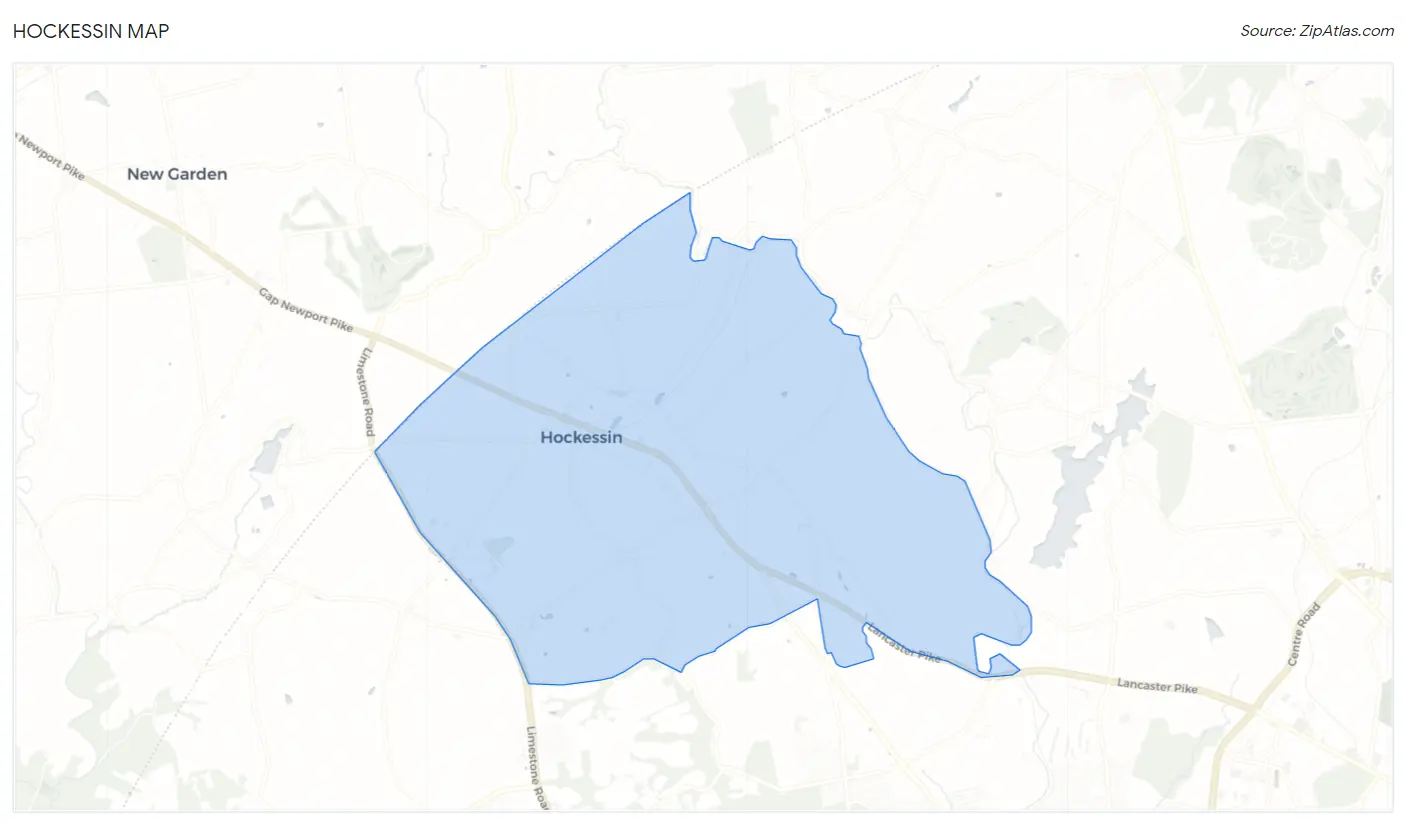
Hockessin Overview
$74,299
PER CAPITA INCOME
$182,608
AVG FAMILY INCOME
$164,848
AVG HOUSEHOLD INCOME
36.9%
WAGE / INCOME GAP [ % ]
63.1¢/ $1
WAGE / INCOME GAP [ $ ]
$9,947
FAMILY INCOME DEFICIT
0.42
INEQUALITY / GINI INDEX
13,878
TOTAL POPULATION
6,504
MALE POPULATION
7,374
FEMALE POPULATION
88.20
MALES / 100 FEMALES
113.38
FEMALES / 100 MALES
45.1
MEDIAN AGE
3.0
AVG FAMILY SIZE
2.7
AVG HOUSEHOLD SIZE
6,748
LABOR FORCE [ PEOPLE ]
61.8%
PERCENT IN LABOR FORCE
4.6%
UNEMPLOYMENT RATE
Hockessin Zip Codes
Hockessin Area Codes
Income in Hockessin
Income Overview in Hockessin
Per Capita Income in Hockessin is $74,299, while median incomes of families and households are $182,608 and $164,848 respectively.
| Characteristic | Number | Measure |
| Per Capita Income | 13,878 | $74,299 |
| Median Family Income | 4,075 | $182,608 |
| Mean Family Income | 4,075 | $218,359 |
| Median Household Income | 4,937 | $164,848 |
| Mean Household Income | 4,937 | $205,857 |
| Income Deficit | 4,075 | $9,947 |
| Wage / Income Gap (%) | 13,878 | 36.88% |
| Wage / Income Gap ($) | 13,878 | 63.12¢ per $1 |
| Gini / Inequality Index | 13,878 | 0.42 |
Earnings by Sex in Hockessin
Average Earnings in Hockessin are $84,827, $106,875 for men and $67,456 for women, a difference of 36.9%.
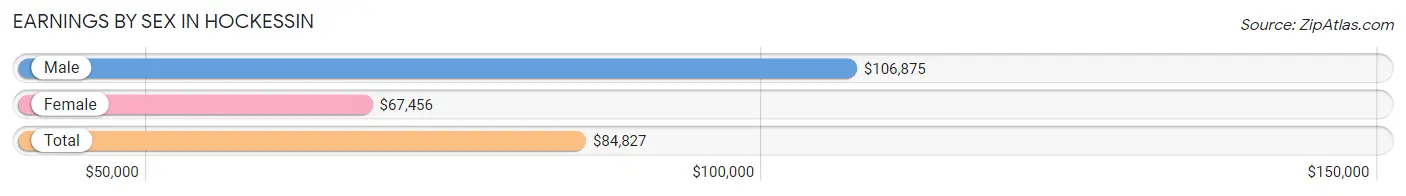
| Sex | Number | Average Earnings |
| Male | 3,400 (48.7%) | $106,875 |
| Female | 3,581 (51.3%) | $67,456 |
| Total | 6,981 (100.0%) | $84,827 |
Earnings by Sex by Income Bracket in Hockessin
The most common earnings brackets in Hockessin are $100,000+ for men (1,822 | 53.6%) and $100,000+ for women (1,152 | 32.2%).
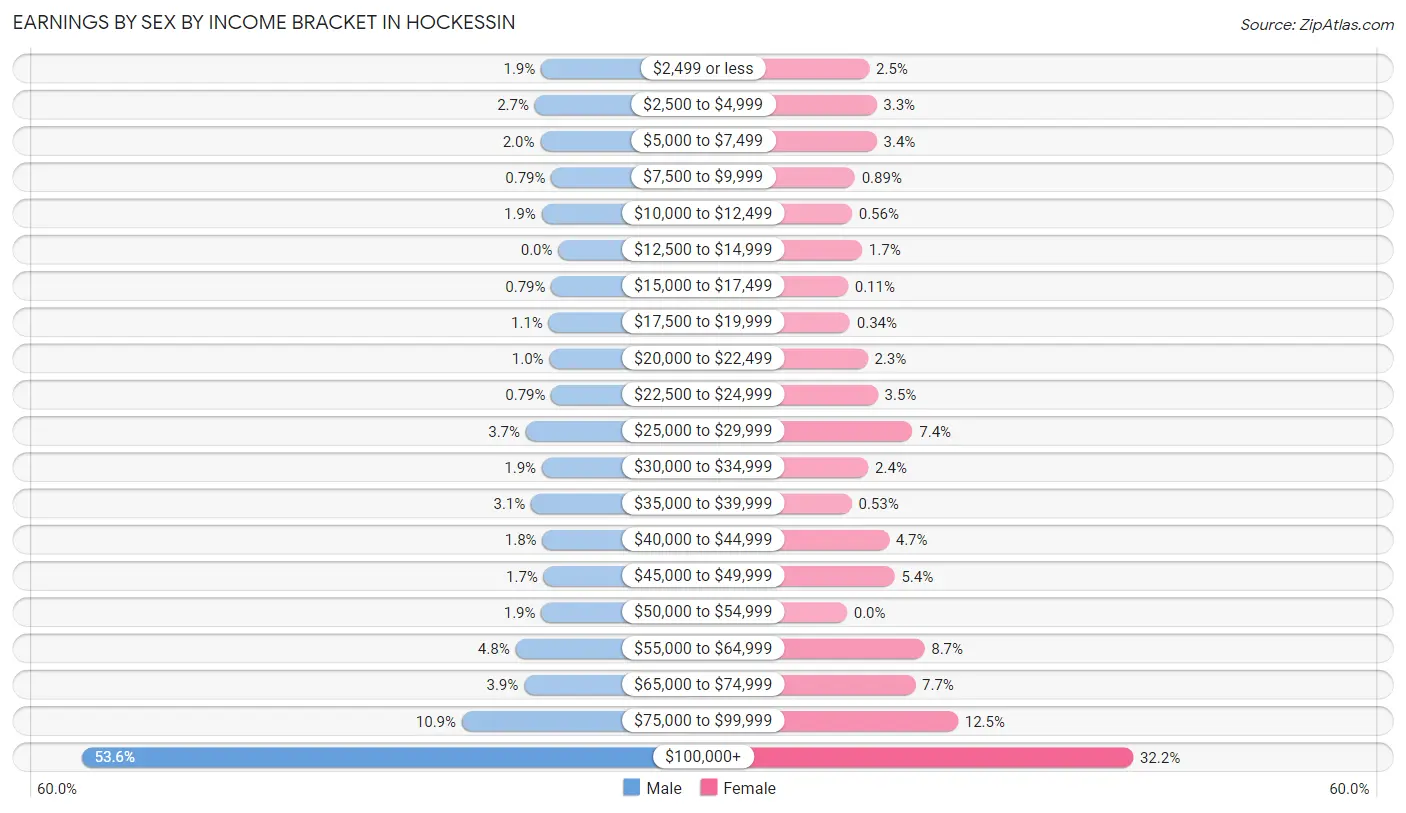
| Income | Male | Female |
| $2,499 or less | 66 (1.9%) | 90 (2.5%) |
| $2,500 to $4,999 | 90 (2.6%) | 119 (3.3%) |
| $5,000 to $7,499 | 69 (2.0%) | 120 (3.4%) |
| $7,500 to $9,999 | 27 (0.8%) | 32 (0.9%) |
| $10,000 to $12,499 | 64 (1.9%) | 20 (0.6%) |
| $12,500 to $14,999 | 0 (0.0%) | 61 (1.7%) |
| $15,000 to $17,499 | 27 (0.8%) | 4 (0.1%) |
| $17,500 to $19,999 | 37 (1.1%) | 12 (0.3%) |
| $20,000 to $22,499 | 34 (1.0%) | 83 (2.3%) |
| $22,500 to $24,999 | 27 (0.8%) | 124 (3.5%) |
| $25,000 to $29,999 | 124 (3.6%) | 264 (7.4%) |
| $30,000 to $34,999 | 63 (1.8%) | 86 (2.4%) |
| $35,000 to $39,999 | 104 (3.1%) | 19 (0.5%) |
| $40,000 to $44,999 | 61 (1.8%) | 169 (4.7%) |
| $45,000 to $49,999 | 56 (1.7%) | 192 (5.4%) |
| $50,000 to $54,999 | 65 (1.9%) | 0 (0.0%) |
| $55,000 to $64,999 | 164 (4.8%) | 312 (8.7%) |
| $65,000 to $74,999 | 131 (3.8%) | 275 (7.7%) |
| $75,000 to $99,999 | 369 (10.8%) | 447 (12.5%) |
| $100,000+ | 1,822 (53.6%) | 1,152 (32.2%) |
| Total | 3,400 (100.0%) | 3,581 (100.0%) |
Earnings by Sex by Educational Attainment in Hockessin
Average earnings in Hockessin are $110,352 for men and $74,702 for women, a difference of 32.3%. Men with an educational attainment of bachelor's degree enjoy the highest average annual earnings of $132,039, while those with less than high school education earn the least with $35,673. Women with an educational attainment of graduate degree earn the most with the average annual earnings of $99,241, while those with college or associate's degree education have the smallest earnings of $46,462.
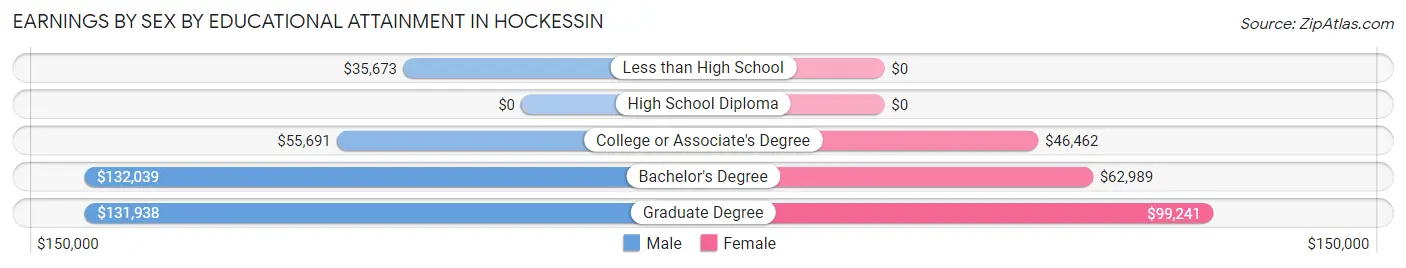
| Educational Attainment | Male Income | Female Income |
| Less than High School | $35,673 | $0 |
| High School Diploma | - | - |
| College or Associate's Degree | $55,691 | $46,462 |
| Bachelor's Degree | $132,039 | $62,989 |
| Graduate Degree | $131,938 | $99,241 |
| Total | $110,352 | $74,702 |
Family Income in Hockessin
Family Income Brackets in Hockessin
According to the Hockessin family income data, there are 1,850 families falling into the $200,000+ income range, which is the most common income bracket and makes up 45.4% of all families. Conversely, the $35,000 to $49,999 income bracket is the least frequent group with only 20 families (0.5%) belonging to this category.
| Income Bracket | # Families | % Families |
| Less than $10,000 | 49 | 1.2% |
| $10,000 to $14,999 | 24 | 0.6% |
| $15,000 to $24,999 | 29 | 0.7% |
| $25,000 to $34,999 | 73 | 1.8% |
| $35,000 to $49,999 | 20 | 0.5% |
| $50,000 to $74,999 | 469 | 11.5% |
| $75,000 to $99,999 | 342 | 8.4% |
| $100,000 to $149,999 | 611 | 15.0% |
| $150,000 to $199,999 | 603 | 14.8% |
| $200,000+ | 1,850 | 45.4% |
Family Income by Famaliy Size in Hockessin
4-person families (788 | 19.3%) account for the highest median family income in Hockessin with $250,001 per family, while 3-person families (1,003 | 24.6%) have the highest median income of $64,375 per family member.
| Income Bracket | # Families | Median Income |
| 2-Person Families | 1,822 (44.7%) | $112,769 |
| 3-Person Families | 1,003 (24.6%) | $193,125 |
| 4-Person Families | 788 (19.3%) | $250,001 |
| 5-Person Families | 334 (8.2%) | $250,001 |
| 6-Person Families | 128 (3.1%) | $0 |
| 7+ Person Families | 0 (0.0%) | $0 |
| Total | 4,075 (100.0%) | $182,608 |
Family Income by Number of Earners in Hockessin
The median family income in Hockessin is $182,608, with families comprising 3+ earners (460) having the highest median family income of $250,001, while families with no earners (616) have the lowest median family income of $93,929, accounting for 11.3% and 15.1% of families, respectively.
| Number of Earners | # Families | Median Income |
| No Earners | 616 (15.1%) | $93,929 |
| 1 Earner | 968 (23.7%) | $103,771 |
| 2 Earners | 2,031 (49.8%) | $225,208 |
| 3+ Earners | 460 (11.3%) | $250,001 |
| Total | 4,075 (100.0%) | $182,608 |
Household Income in Hockessin
Household Income Brackets in Hockessin
With 1,945 households falling in the category, the $200,000+ income range is the most frequent in Hockessin, accounting for 39.4% of all households. In contrast, only 49 households (1.0%) fall into the $10,000 to $14,999 income bracket, making it the least populous group.
| Income Bracket | # Households | % Households |
| Less than $10,000 | 89 | 1.8% |
| $10,000 to $14,999 | 49 | 1.0% |
| $15,000 to $24,999 | 79 | 1.6% |
| $25,000 to $34,999 | 123 | 2.5% |
| $35,000 to $49,999 | 217 | 4.4% |
| $50,000 to $74,999 | 509 | 10.3% |
| $75,000 to $99,999 | 365 | 7.4% |
| $100,000 to $149,999 | 839 | 17.0% |
| $150,000 to $199,999 | 726 | 14.7% |
| $200,000+ | 1,945 | 39.4% |
Household Income by Householder Age in Hockessin
The median household income in Hockessin is $164,848, with the highest median household income of $247,853 found in the 25 to 44 years age bracket for the primary householder. A total of 1,227 households (24.8%) fall into this category.
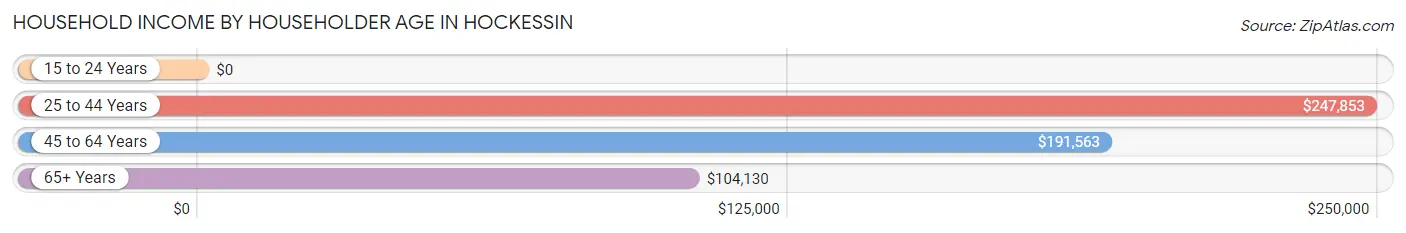
| Income Bracket | # Households | Median Income |
| 15 to 24 Years | 0 (0.0%) | $0 |
| 25 to 44 Years | 1,227 (24.8%) | $247,853 |
| 45 to 64 Years | 1,924 (39.0%) | $191,563 |
| 65+ Years | 1,786 (36.2%) | $104,130 |
| Total | 4,937 (100.0%) | $164,848 |
Poverty in Hockessin
Income Below Poverty by Sex and Age in Hockessin
With 1.8% poverty level for males and 1.9% for females among the residents of Hockessin, 55 to 64 year old males and under 5 year old females are the most vulnerable to poverty, with 68 males (7.7%) and 36 females (7.0%) in their respective age groups living below the poverty level.
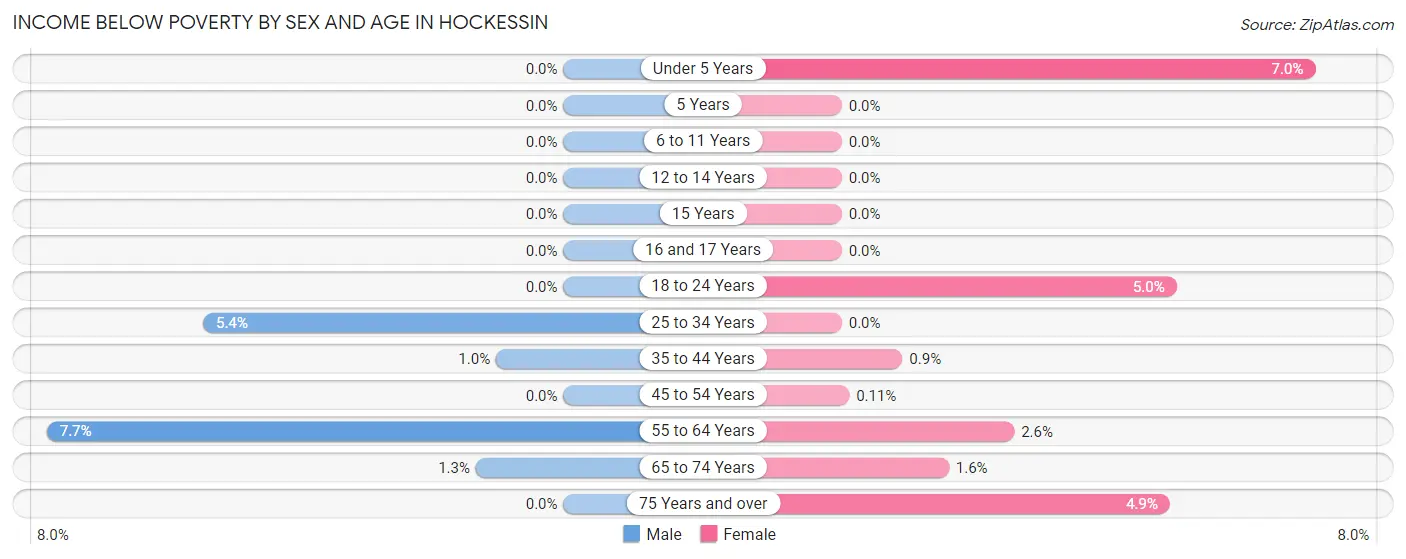
| Age Bracket | Male | Female |
| Under 5 Years | 0 (0.0%) | 36 (7.0%) |
| 5 Years | 0 (0.0%) | 0 (0.0%) |
| 6 to 11 Years | 0 (0.0%) | 0 (0.0%) |
| 12 to 14 Years | 0 (0.0%) | 0 (0.0%) |
| 15 Years | 0 (0.0%) | 0 (0.0%) |
| 16 and 17 Years | 0 (0.0%) | 0 (0.0%) |
| 18 to 24 Years | 0 (0.0%) | 22 (5.0%) |
| 25 to 34 Years | 27 (5.3%) | 0 (0.0%) |
| 35 to 44 Years | 9 (1.0%) | 9 (0.9%) |
| 45 to 54 Years | 0 (0.0%) | 1 (0.1%) |
| 55 to 64 Years | 68 (7.7%) | 24 (2.6%) |
| 65 to 74 Years | 13 (1.3%) | 14 (1.6%) |
| 75 Years and over | 0 (0.0%) | 28 (4.9%) |
| Total | 117 (1.8%) | 134 (1.9%) |
Income Above Poverty by Sex and Age in Hockessin
According to the poverty statistics in Hockessin, males aged under 5 years and females aged 5 years are the age groups that are most secure financially, with 100.0% of males and 100.0% of females in these age groups living above the poverty line.
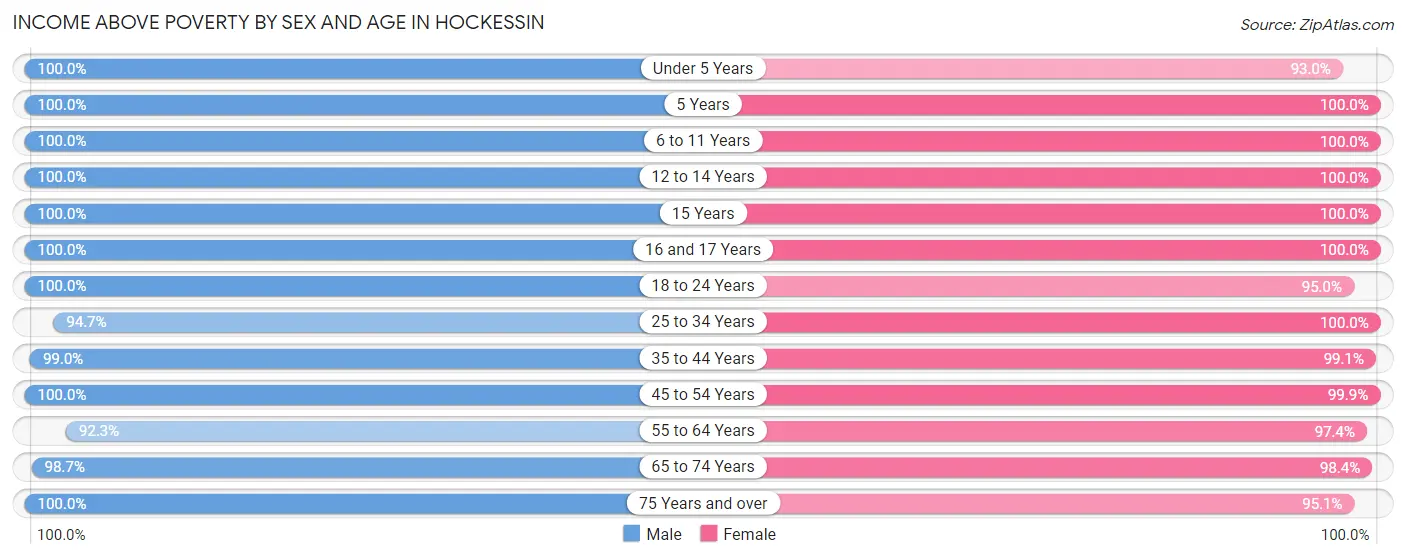
| Age Bracket | Male | Female |
| Under 5 Years | 419 (100.0%) | 476 (93.0%) |
| 5 Years | 84 (100.0%) | 7 (100.0%) |
| 6 to 11 Years | 386 (100.0%) | 666 (100.0%) |
| 12 to 14 Years | 349 (100.0%) | 291 (100.0%) |
| 15 Years | 100 (100.0%) | 145 (100.0%) |
| 16 and 17 Years | 123 (100.0%) | 180 (100.0%) |
| 18 to 24 Years | 242 (100.0%) | 421 (95.0%) |
| 25 to 34 Years | 478 (94.7%) | 568 (100.0%) |
| 35 to 44 Years | 891 (99.0%) | 990 (99.1%) |
| 45 to 54 Years | 901 (100.0%) | 936 (99.9%) |
| 55 to 64 Years | 818 (92.3%) | 914 (97.4%) |
| 65 to 74 Years | 990 (98.7%) | 864 (98.4%) |
| 75 Years and over | 502 (100.0%) | 547 (95.1%) |
| Total | 6,283 (98.2%) | 7,005 (98.1%) |
Income Below Poverty Among Married-Couple Families in Hockessin
The poverty statistics for married-couple families in Hockessin show that 2.0% or 73 of the total 3,574 families live below the poverty line. Families with 1 or 2 children have the highest poverty rate of 2.8%, comprising of 36 families. On the other hand, families with 3 or 4 children have the lowest poverty rate of 0.0%, which includes 0 families.
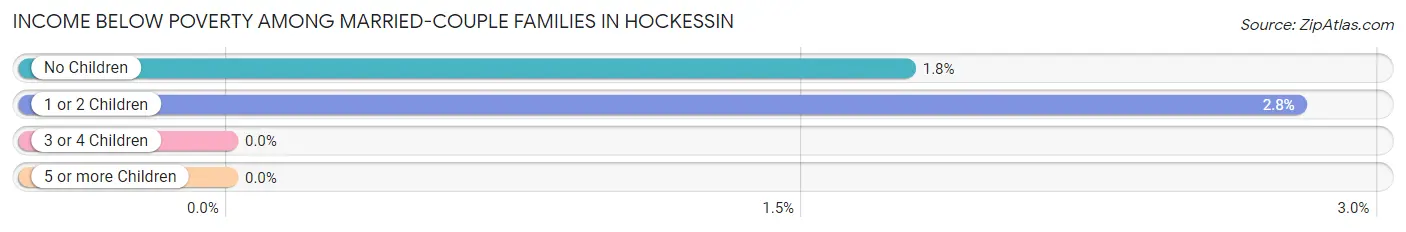
| Children | Above Poverty | Below Poverty |
| No Children | 2,057 (98.2%) | 37 (1.8%) |
| 1 or 2 Children | 1,254 (97.2%) | 36 (2.8%) |
| 3 or 4 Children | 190 (100.0%) | 0 (0.0%) |
| 5 or more Children | 0 (0.0%) | 0 (0.0%) |
| Total | 3,501 (98.0%) | 73 (2.0%) |
Income Below Poverty Among Single-Parent Households in Hockessin
| Children | Single Father | Single Mother |
| No Children | 0 (0.0%) | 0 (0.0%) |
| 1 or 2 Children | 0 (0.0%) | 0 (0.0%) |
| 3 or 4 Children | 0 (0.0%) | 0 (0.0%) |
| 5 or more Children | 0 (0.0%) | 0 (0.0%) |
| Total | 0 (0.0%) | 0 (0.0%) |
Income Below Poverty Among Married-Couple vs Single-Parent Households in Hockessin
| Children | Married-Couple Families | Single-Parent Households |
| No Children | 37 (1.8%) | 0 (0.0%) |
| 1 or 2 Children | 36 (2.8%) | 0 (0.0%) |
| 3 or 4 Children | 0 (0.0%) | 0 (0.0%) |
| 5 or more Children | 0 (0.0%) | 0 (0.0%) |
| Total | 73 (2.0%) | 0 (0.0%) |
Race in Hockessin
The most populous races in Hockessin are White / Caucasian (11,602 | 83.6%), Asian (1,211 | 8.7%), and Two or more Races (752 | 5.4%).
| Race | # Population | % Population |
| Asian | 1,211 | 8.7% |
| Black / African American | 245 | 1.8% |
| Hawaiian / Pacific | 0 | 0.0% |
| Hispanic or Latino | 414 | 3.0% |
| Native / Alaskan | 0 | 0.0% |
| White / Caucasian | 11,602 | 83.6% |
| Two or more Races | 752 | 5.4% |
| Some other Race | 68 | 0.5% |
| Total | 13,878 | 100.0% |
Ancestry in Hockessin
The most populous ancestries reported in Hockessin are Irish (2,721 | 19.6%), Italian (2,697 | 19.4%), English (2,328 | 16.8%), German (1,636 | 11.8%), and Polish (1,206 | 8.7%), together accounting for 76.3% of all Hockessin residents.
| Ancestry | # Population | % Population |
| African | 89 | 0.6% |
| American | 409 | 2.9% |
| Arab | 52 | 0.4% |
| Australian | 12 | 0.1% |
| Austrian | 28 | 0.2% |
| Bhutanese | 140 | 1.0% |
| Blackfeet | 4 | 0.0% |
| Brazilian | 32 | 0.2% |
| British | 242 | 1.7% |
| Central American | 62 | 0.4% |
| Colombian | 243 | 1.8% |
| Croatian | 10 | 0.1% |
| Cuban | 59 | 0.4% |
| Czech | 88 | 0.6% |
| Czechoslovakian | 15 | 0.1% |
| Danish | 27 | 0.2% |
| Dutch | 73 | 0.5% |
| Eastern European | 110 | 0.8% |
| English | 2,328 | 16.8% |
| European | 289 | 2.1% |
| French | 303 | 2.2% |
| French Canadian | 59 | 0.4% |
| German | 1,636 | 11.8% |
| Greek | 117 | 0.8% |
| Guatemalan | 22 | 0.2% |
| Honduran | 40 | 0.3% |
| Hungarian | 81 | 0.6% |
| Indian (Asian) | 755 | 5.4% |
| Indonesian | 8 | 0.1% |
| Irish | 2,721 | 19.6% |
| Italian | 2,697 | 19.4% |
| Korean | 92 | 0.7% |
| Lithuanian | 45 | 0.3% |
| Moroccan | 52 | 0.4% |
| Norwegian | 178 | 1.3% |
| Pennsylvania German | 36 | 0.3% |
| Polish | 1,206 | 8.7% |
| Portuguese | 57 | 0.4% |
| Puerto Rican | 23 | 0.2% |
| Russian | 106 | 0.8% |
| Scandinavian | 85 | 0.6% |
| Scotch-Irish | 37 | 0.3% |
| Scottish | 203 | 1.5% |
| Slavic | 10 | 0.1% |
| Slovak | 9 | 0.1% |
| South American | 243 | 1.8% |
| Spaniard | 6 | 0.0% |
| Spanish | 13 | 0.1% |
| Subsaharan African | 105 | 0.8% |
| Swedish | 75 | 0.5% |
| Swiss | 13 | 0.1% |
| Thai | 452 | 3.3% |
| Turkish | 61 | 0.4% |
| Ukrainian | 188 | 1.3% |
| Welsh | 153 | 1.1% | View All 55 Rows |
Immigrants in Hockessin
The most numerous immigrant groups reported in Hockessin came from Asia (798 | 5.8%), Eastern Asia (444 | 3.2%), China (426 | 3.1%), India (320 | 2.3%), and South Central Asia (320 | 2.3%), together accounting for 16.6% of all Hockessin residents.
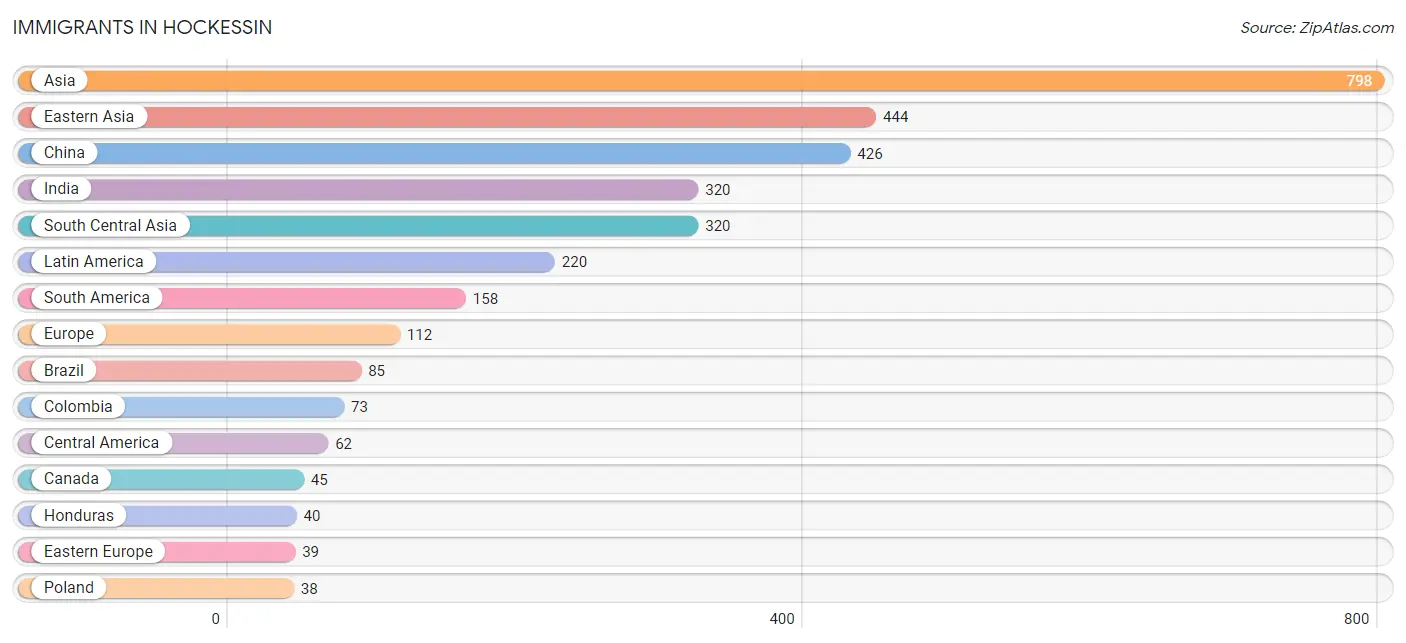
| Immigration Origin | # Population | % Population |
| Africa | 16 | 0.1% |
| Asia | 798 | 5.8% |
| Brazil | 85 | 0.6% |
| Canada | 45 | 0.3% |
| Central America | 62 | 0.4% |
| China | 426 | 3.1% |
| Colombia | 73 | 0.5% |
| Eastern Asia | 444 | 3.2% |
| Eastern Europe | 39 | 0.3% |
| England | 18 | 0.1% |
| Europe | 112 | 0.8% |
| Germany | 18 | 0.1% |
| Guatemala | 22 | 0.2% |
| Honduras | 40 | 0.3% |
| Hong Kong | 12 | 0.1% |
| India | 320 | 2.3% |
| Italy | 8 | 0.1% |
| Japan | 18 | 0.1% |
| Latin America | 220 | 1.6% |
| Latvia | 1 | 0.0% |
| Morocco | 16 | 0.1% |
| Netherlands | 11 | 0.1% |
| Northern Africa | 16 | 0.1% |
| Northern Europe | 36 | 0.3% |
| Poland | 38 | 0.3% |
| Scotland | 4 | 0.0% |
| Singapore | 12 | 0.1% |
| South America | 158 | 1.1% |
| South Central Asia | 320 | 2.3% |
| South Eastern Asia | 20 | 0.1% |
| Southern Europe | 8 | 0.1% |
| Sweden | 14 | 0.1% |
| Taiwan | 26 | 0.2% |
| Turkey | 14 | 0.1% |
| Western Asia | 14 | 0.1% |
| Western Europe | 29 | 0.2% | View All 36 Rows |
Sex and Age in Hockessin
Sex and Age in Hockessin
The most populous age groups in Hockessin are 65 to 69 Years (563 | 8.7%) for men and 65 to 69 Years (633 | 8.6%) for women.
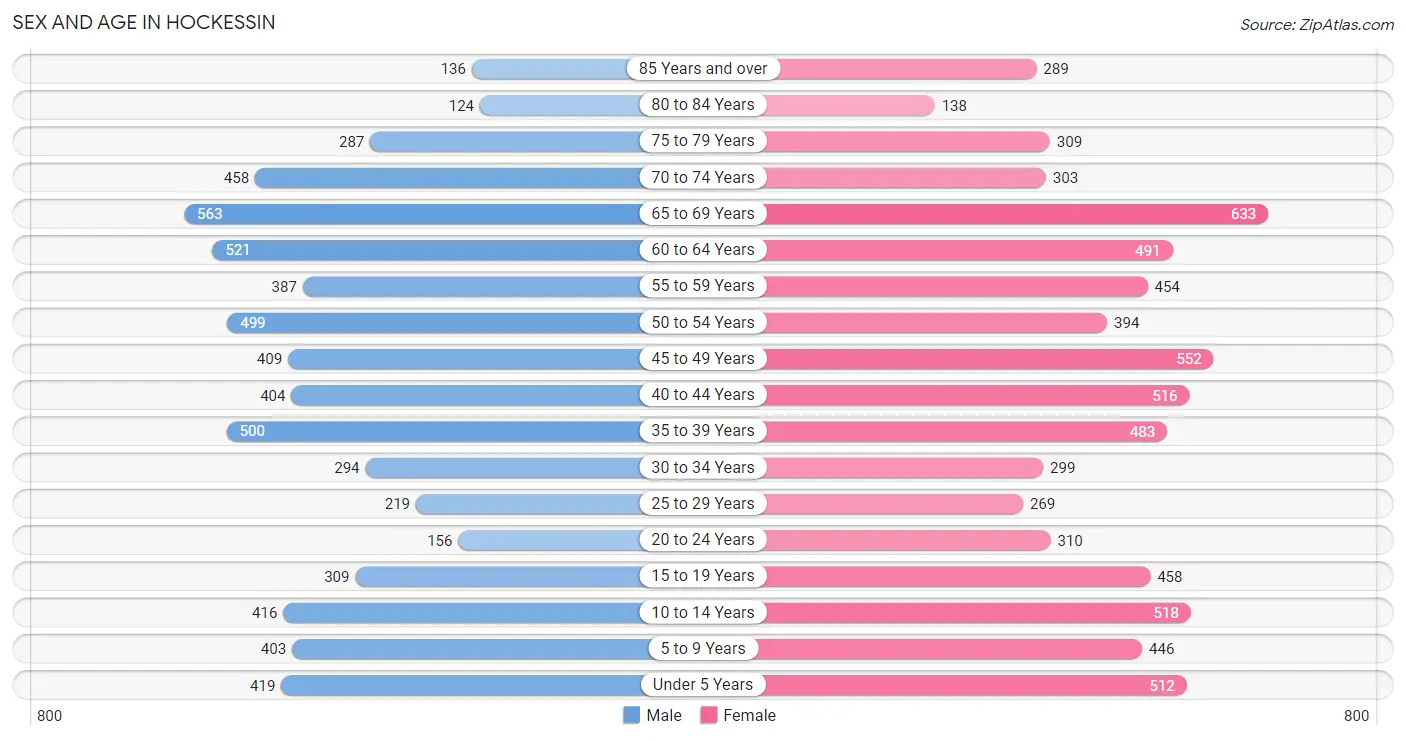
| Age Bracket | Male | Female |
| Under 5 Years | 419 (6.4%) | 512 (6.9%) |
| 5 to 9 Years | 403 (6.2%) | 446 (6.0%) |
| 10 to 14 Years | 416 (6.4%) | 518 (7.0%) |
| 15 to 19 Years | 309 (4.8%) | 458 (6.2%) |
| 20 to 24 Years | 156 (2.4%) | 310 (4.2%) |
| 25 to 29 Years | 219 (3.4%) | 269 (3.6%) |
| 30 to 34 Years | 294 (4.5%) | 299 (4.1%) |
| 35 to 39 Years | 500 (7.7%) | 483 (6.6%) |
| 40 to 44 Years | 404 (6.2%) | 516 (7.0%) |
| 45 to 49 Years | 409 (6.3%) | 552 (7.5%) |
| 50 to 54 Years | 499 (7.7%) | 394 (5.3%) |
| 55 to 59 Years | 387 (5.9%) | 454 (6.2%) |
| 60 to 64 Years | 521 (8.0%) | 491 (6.7%) |
| 65 to 69 Years | 563 (8.7%) | 633 (8.6%) |
| 70 to 74 Years | 458 (7.0%) | 303 (4.1%) |
| 75 to 79 Years | 287 (4.4%) | 309 (4.2%) |
| 80 to 84 Years | 124 (1.9%) | 138 (1.9%) |
| 85 Years and over | 136 (2.1%) | 289 (3.9%) |
| Total | 6,504 (100.0%) | 7,374 (100.0%) |
Families and Households in Hockessin
Median Family Size in Hockessin
The median family size in Hockessin is 3.02 persons per family, with single female/mother families (345 | 8.5%) accounting for the largest median family size of 3.06 persons per family. On the other hand, single male/father families (156 | 3.8%) represent the smallest median family size with 2.21 persons per family.
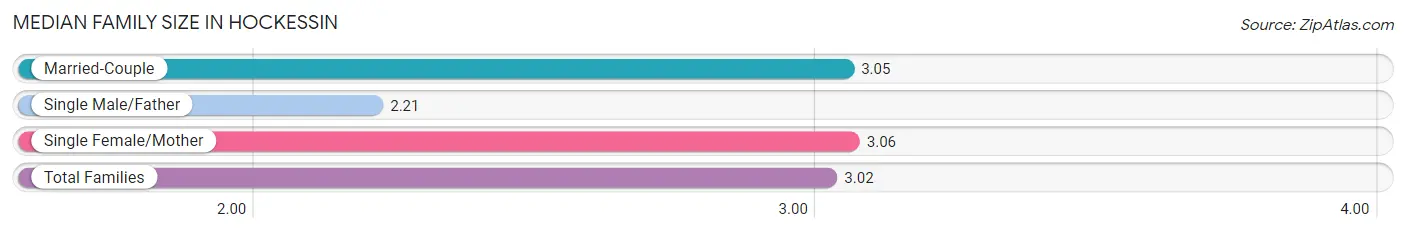
| Family Type | # Families | Family Size |
| Married-Couple | 3,574 (87.7%) | 3.05 |
| Single Male/Father | 156 (3.8%) | 2.21 |
| Single Female/Mother | 345 (8.5%) | 3.06 |
| Total Families | 4,075 (100.0%) | 3.02 |
Median Household Size in Hockessin
The median household size in Hockessin is 2.74 persons per household, with single female/mother households (345 | 7.0%) accounting for the largest median household size of 3.47 persons per household. non-family households (862 | 17.5%) represent the smallest median household size with 1.18 persons per household.
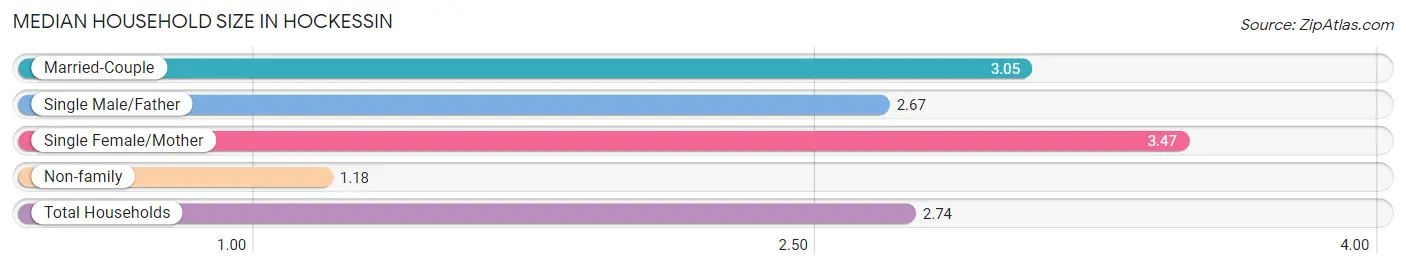
| Household Type | # Households | Household Size |
| Married-Couple | 3,574 (72.4%) | 3.05 |
| Single Male/Father | 156 (3.2%) | 2.67 |
| Single Female/Mother | 345 (7.0%) | 3.47 |
| Non-family | 862 (17.5%) | 1.18 |
| Total Households | 4,937 (100.0%) | 2.74 |
Household Size by Marriage Status in Hockessin
Out of a total of 4,937 households in Hockessin, 4,075 (82.5%) are family households, while 862 (17.5%) are nonfamily households. The most numerous type of family households are 2-person households, comprising 1,729, and the most common type of nonfamily households are 1-person households, comprising 748.
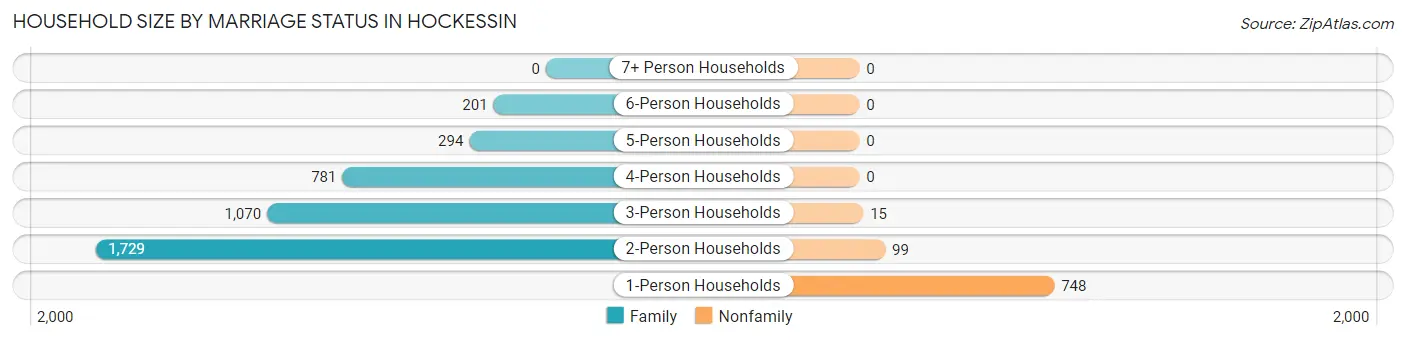
| Household Size | Family Households | Nonfamily Households |
| 1-Person Households | - | 748 (15.1%) |
| 2-Person Households | 1,729 (35.0%) | 99 (2.0%) |
| 3-Person Households | 1,070 (21.7%) | 15 (0.3%) |
| 4-Person Households | 781 (15.8%) | 0 (0.0%) |
| 5-Person Households | 294 (6.0%) | 0 (0.0%) |
| 6-Person Households | 201 (4.1%) | 0 (0.0%) |
| 7+ Person Households | 0 (0.0%) | 0 (0.0%) |
| Total | 4,075 (82.5%) | 862 (17.5%) |
Female Fertility in Hockessin
Fertility by Age in Hockessin
Average fertility rate in Hockessin is 44.0 births per 1,000 women. Women in the age bracket of 20 to 34 years have the highest fertility rate with 118.0 births per 1,000 women. Women in the age bracket of 20 to 34 years acount for 78.8% of all women with births.
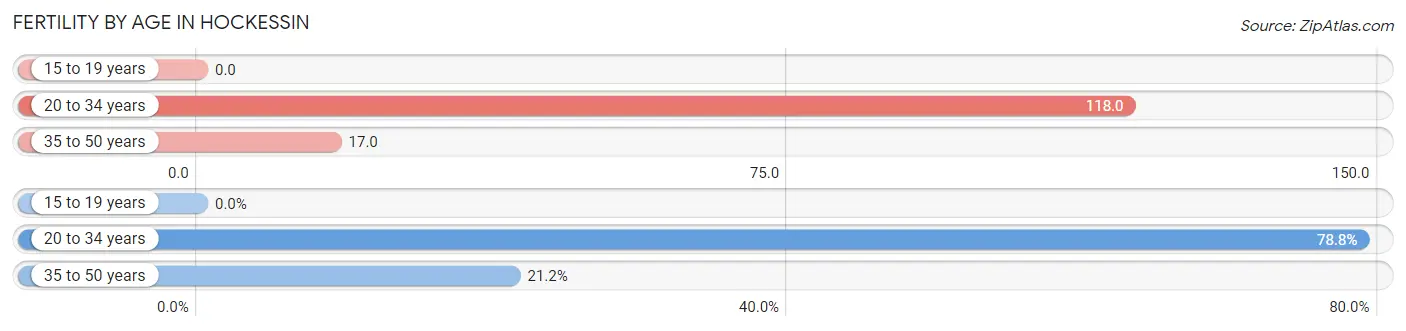
| Age Bracket | Women with Births | Births / 1,000 Women |
| 15 to 19 years | 0 (0.0%) | 0.0 |
| 20 to 34 years | 104 (78.8%) | 118.0 |
| 35 to 50 years | 28 (21.2%) | 17.0 |
| Total | 132 (100.0%) | 44.0 |
Fertility by Age by Marriage Status in Hockessin
70.5% of women with births (132) in Hockessin are married. The highest percentage of unmarried women with births falls into 20 to 34 years age bracket with 37.5% of them unmarried at the time of birth, while the lowest percentage of unmarried women with births belong to 35 to 50 years age bracket with 0.0% of them unmarried.
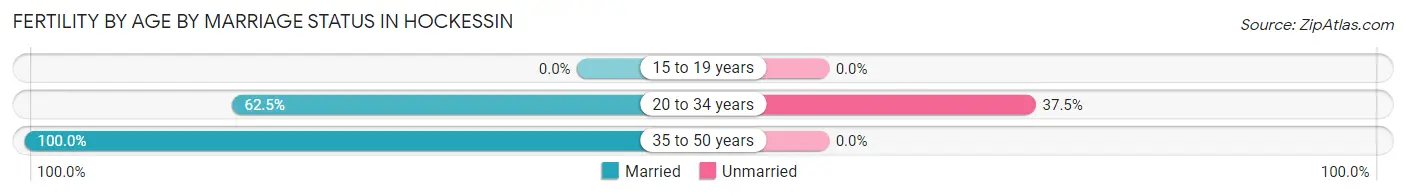
| Age Bracket | Married | Unmarried |
| 15 to 19 years | 0 (0.0%) | 0 (0.0%) |
| 20 to 34 years | 65 (62.5%) | 39 (37.5%) |
| 35 to 50 years | 28 (100.0%) | 0 (0.0%) |
| Total | 93 (70.5%) | 39 (29.5%) |
Fertility by Education in Hockessin
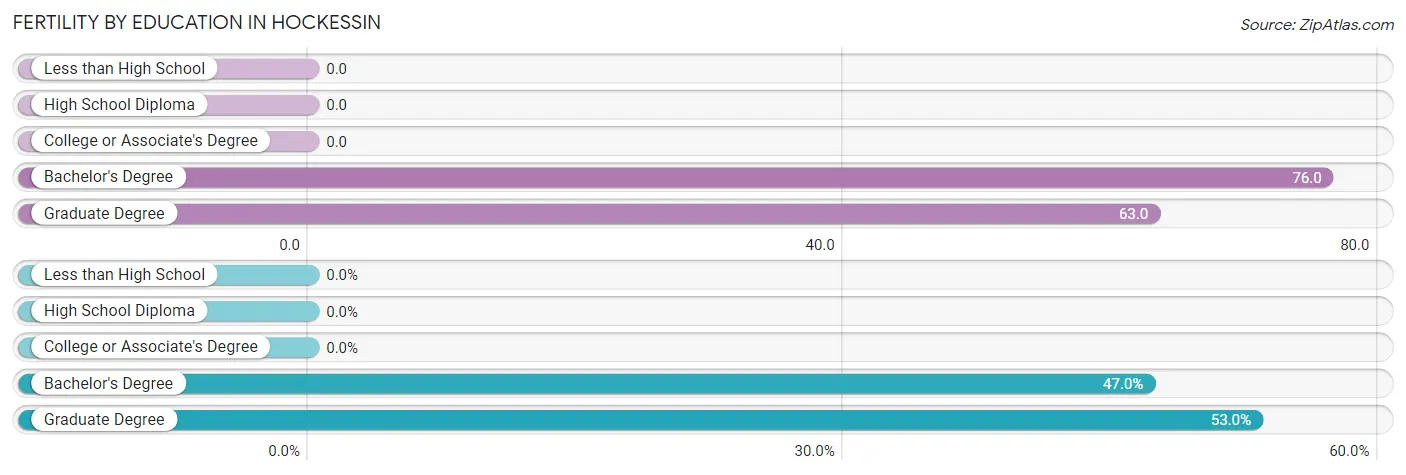
| Educational Attainment | Women with Births | Births / 1,000 Women |
| Less than High School | 0 (0.0%) | 0.0 |
| High School Diploma | 0 (0.0%) | 0.0 |
| College or Associate's Degree | 0 (0.0%) | 0.0 |
| Bachelor's Degree | 62 (47.0%) | 76.0 |
| Graduate Degree | 70 (53.0%) | 63.0 |
| Total | 132 (100.0%) | 44.0 |
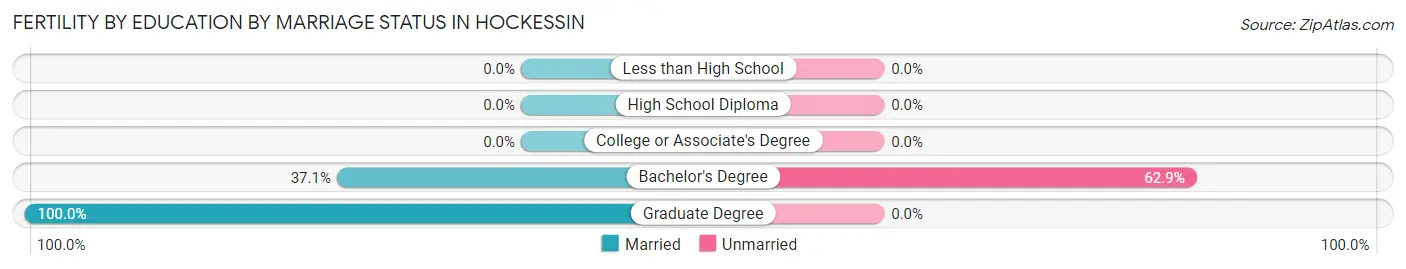
Fertility by Education by Marriage Status in Hockessin
29.5% of women with births in Hockessin are unmarried. Women with the educational attainment of graduate degree are most likely to be married with 100.0% of them married at childbirth, while women with the educational attainment of bachelor's degree are least likely to be married with 62.9% of them unmarried at childbirth.
| Educational Attainment | Married | Unmarried |
| Less than High School | 0 (0.0%) | 0 (0.0%) |
| High School Diploma | 0 (0.0%) | 0 (0.0%) |
| College or Associate's Degree | 0 (0.0%) | 0 (0.0%) |
| Bachelor's Degree | 23 (37.1%) | 39 (62.9%) |
| Graduate Degree | 70 (100.0%) | 0 (0.0%) |
| Total | 93 (70.5%) | 39 (29.5%) |
Employment Characteristics in Hockessin
Employment by Class of Employer in Hockessin
Among the 6,354 employed individuals in Hockessin, private company employees (3,821 | 60.1%), not-for-profit organizations (653 | 10.3%), and local government employees (518 | 8.2%) make up the most common classes of employment.
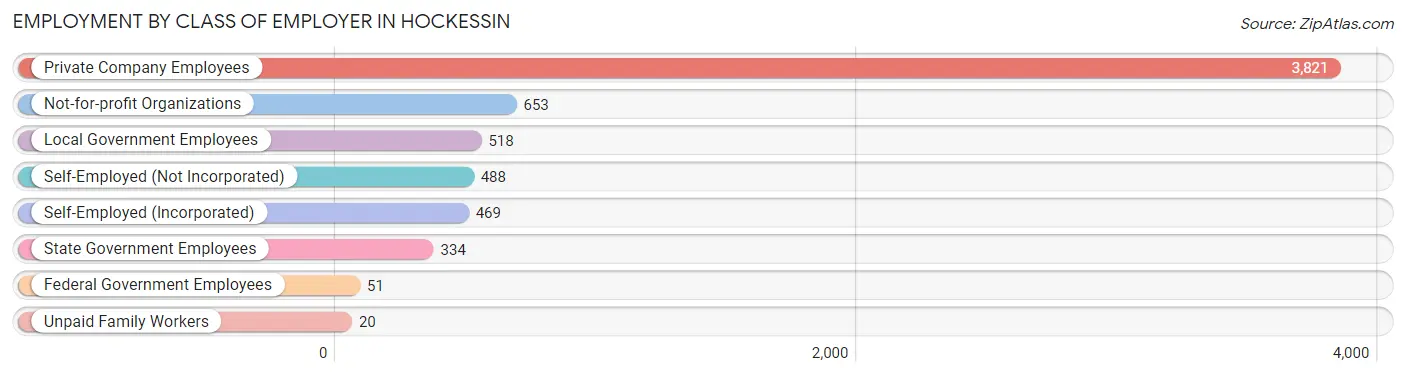
| Employer Class | # Employees | % Employees |
| Private Company Employees | 3,821 | 60.1% |
| Self-Employed (Incorporated) | 469 | 7.4% |
| Self-Employed (Not Incorporated) | 488 | 7.7% |
| Not-for-profit Organizations | 653 | 10.3% |
| Local Government Employees | 518 | 8.2% |
| State Government Employees | 334 | 5.3% |
| Federal Government Employees | 51 | 0.8% |
| Unpaid Family Workers | 20 | 0.3% |
| Total | 6,354 | 100.0% |
Employment Status by Age in Hockessin
According to the labor force statistics for Hockessin, out of the total population over 16 years of age (10,919), 61.8% or 6,748 individuals are in the labor force, with 4.6% or 310 of them unemployed. The age group with the highest labor force participation rate is 35 to 44 years, with 98.4% or 1,873 individuals in the labor force. Within the labor force, the 25 to 29 years age range has the highest percentage of unemployed individuals, with 20.8% or 91 of them being unemployed.
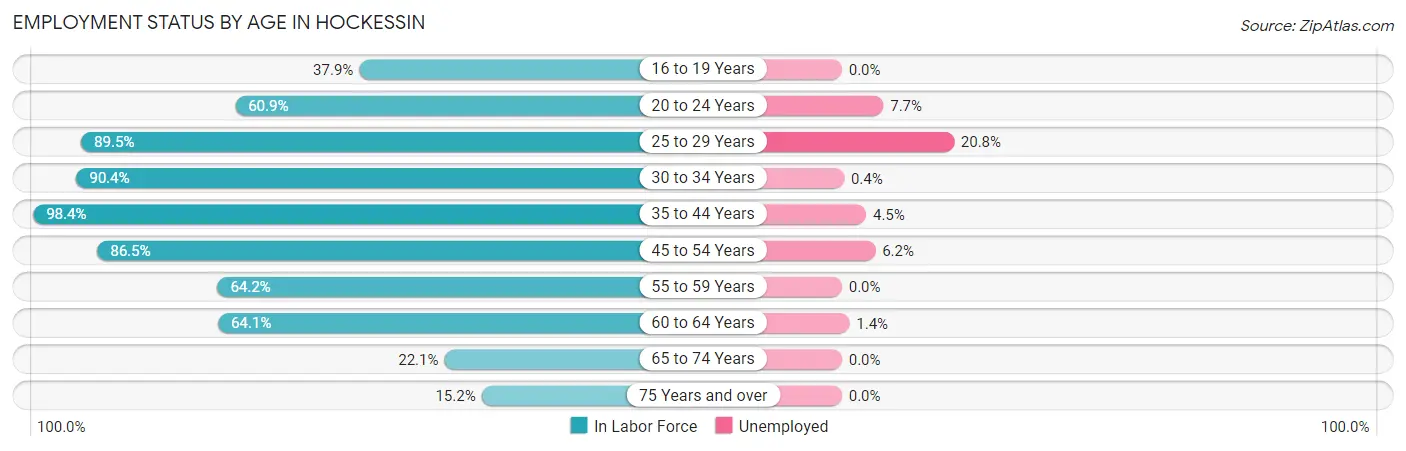
| Age Bracket | In Labor Force | Unemployed |
| 16 to 19 Years | 198 (37.9%) | 0 (0.0%) |
| 20 to 24 Years | 284 (60.9%) | 22 (7.7%) |
| 25 to 29 Years | 437 (89.5%) | 91 (20.8%) |
| 30 to 34 Years | 536 (90.4%) | 2 (0.4%) |
| 35 to 44 Years | 1,873 (98.4%) | 84 (4.5%) |
| 45 to 54 Years | 1,604 (86.5%) | 99 (6.2%) |
| 55 to 59 Years | 540 (64.2%) | 0 (0.0%) |
| 60 to 64 Years | 649 (64.1%) | 9 (1.4%) |
| 65 to 74 Years | 432 (22.1%) | 0 (0.0%) |
| 75 Years and over | 195 (15.2%) | 0 (0.0%) |
| Total | 6,748 (61.8%) | 310 (4.6%) |
Employment Status by Educational Attainment in Hockessin
According to labor force statistics for Hockessin, 84.3% of individuals (5,641) out of the total population between 25 and 64 years of age (6,691) are in the labor force, with 5.1% or 288 of them being unemployed. The group with the highest labor force participation rate are those with the educational attainment of bachelor's degree or higher, with 89.4% or 4,428 individuals in the labor force. Within the labor force, individuals with high school diploma education have the highest percentage of unemployment, with 8.3% or 32 of them being unemployed.
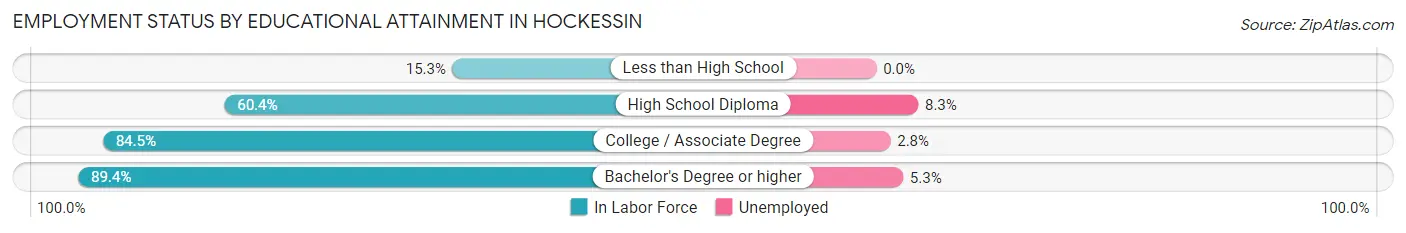
| Educational Attainment | In Labor Force | Unemployed |
| Less than High School | 23 (15.3%) | 0 (0.0%) |
| High School Diploma | 384 (60.4%) | 53 (8.3%) |
| College / Associate Degree | 804 (84.5%) | 27 (2.8%) |
| Bachelor's Degree or higher | 4,428 (89.4%) | 263 (5.3%) |
| Total | 5,641 (84.3%) | 341 (5.1%) |
Employment Occupations by Sex in Hockessin
Management, Business, Science and Arts Occupations
The most common Management, Business, Science and Arts occupations in Hockessin are Management (1,574 | 24.5%), Community & Social Service (1,224 | 19.1%), Computers, Engineering & Science (785 | 12.2%), Business & Financial (664 | 10.4%), and Education Instruction & Library (430 | 6.7%).
Management, Business, Science and Arts Occupations by Sex
Within the Management, Business, Science and Arts occupations in Hockessin, the most male-oriented occupations are Architecture & Engineering (100.0%), Computers, Engineering & Science (71.1%), and Life, Physical & Social Science (69.6%), while the most female-oriented occupations are Legal Services & Support (84.3%), Health Technologists (80.7%), and Health Diagnosing & Treating (80.6%).
| Occupation | Male | Female |
| Management | 879 (55.8%) | 695 (44.2%) |
| Business & Financial | 396 (59.6%) | 268 (40.4%) |
| Computers, Engineering & Science | 558 (71.1%) | 227 (28.9%) |
| Computers & Mathematics | 265 (64.8%) | 144 (35.2%) |
| Architecture & Engineering | 103 (100.0%) | 0 (0.0%) |
| Life, Physical & Social Science | 190 (69.6%) | 83 (30.4%) |
| Community & Social Service | 329 (26.9%) | 895 (73.1%) |
| Education, Arts & Media | 52 (27.2%) | 139 (72.8%) |
| Legal Services & Support | 54 (15.7%) | 290 (84.3%) |
| Education Instruction & Library | 95 (22.1%) | 335 (77.9%) |
| Arts, Media & Entertainment | 128 (49.4%) | 131 (50.6%) |
| Health Diagnosing & Treating | 79 (19.4%) | 328 (80.6%) |
| Health Technologists | 70 (19.3%) | 292 (80.7%) |
| Total (Category) | 2,241 (48.1%) | 2,413 (51.8%) |
| Total (Overall) | 3,080 (48.0%) | 3,331 (52.0%) |
Services Occupations
The most common Services occupations in Hockessin are Food Preparation & Serving (115 | 1.8%), Security & Protection (108 | 1.7%), Personal Care & Service (105 | 1.6%), Law Enforcement (103 | 1.6%), and Healthcare Support (48 | 0.7%).
Services Occupations by Sex
Within the Services occupations in Hockessin, the most male-oriented occupations are Firefighting & Prevention (100.0%), Cleaning & Maintenance (100.0%), and Security & Protection (93.5%), while the most female-oriented occupations are Personal Care & Service (73.3%), Healthcare Support (72.9%), and Food Preparation & Serving (45.2%).
| Occupation | Male | Female |
| Healthcare Support | 13 (27.1%) | 35 (72.9%) |
| Security & Protection | 101 (93.5%) | 7 (6.5%) |
| Firefighting & Prevention | 5 (100.0%) | 0 (0.0%) |
| Law Enforcement | 96 (93.2%) | 7 (6.8%) |
| Food Preparation & Serving | 63 (54.8%) | 52 (45.2%) |
| Cleaning & Maintenance | 13 (100.0%) | 0 (0.0%) |
| Personal Care & Service | 28 (26.7%) | 77 (73.3%) |
| Total (Category) | 218 (56.0%) | 171 (44.0%) |
| Total (Overall) | 3,080 (48.0%) | 3,331 (52.0%) |
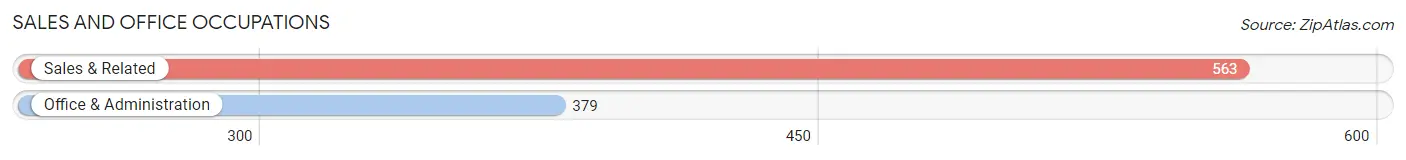
Sales and Office Occupations
The most common Sales and Office occupations in Hockessin are Sales & Related (563 | 8.8%), and Office & Administration (379 | 5.9%).
Sales and Office Occupations by Sex
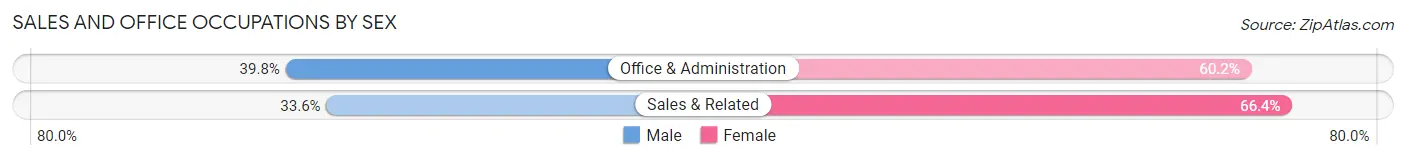
| Occupation | Male | Female |
| Sales & Related | 189 (33.6%) | 374 (66.4%) |
| Office & Administration | 151 (39.8%) | 228 (60.2%) |
| Total (Category) | 340 (36.1%) | 602 (63.9%) |
| Total (Overall) | 3,080 (48.0%) | 3,331 (52.0%) |
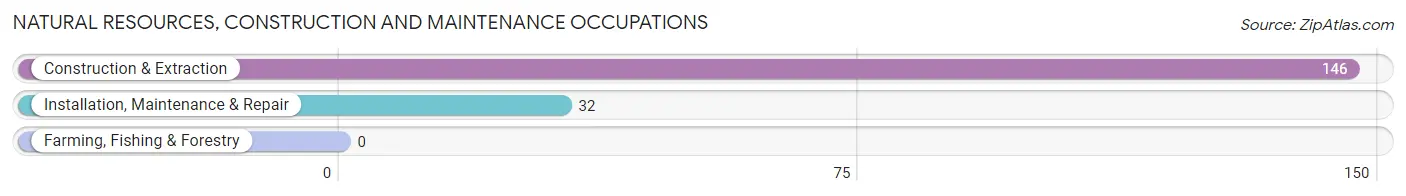
Natural Resources, Construction and Maintenance Occupations
The most common Natural Resources, Construction and Maintenance occupations in Hockessin are Construction & Extraction (146 | 2.3%), and Installation, Maintenance & Repair (32 | 0.5%).
Natural Resources, Construction and Maintenance Occupations by Sex
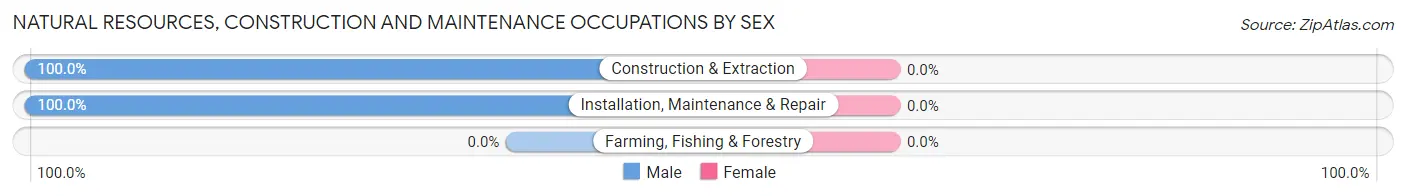
| Occupation | Male | Female |
| Farming, Fishing & Forestry | 0 (0.0%) | 0 (0.0%) |
| Construction & Extraction | 146 (100.0%) | 0 (0.0%) |
| Installation, Maintenance & Repair | 32 (100.0%) | 0 (0.0%) |
| Total (Category) | 178 (100.0%) | 0 (0.0%) |
| Total (Overall) | 3,080 (48.0%) | 3,331 (52.0%) |
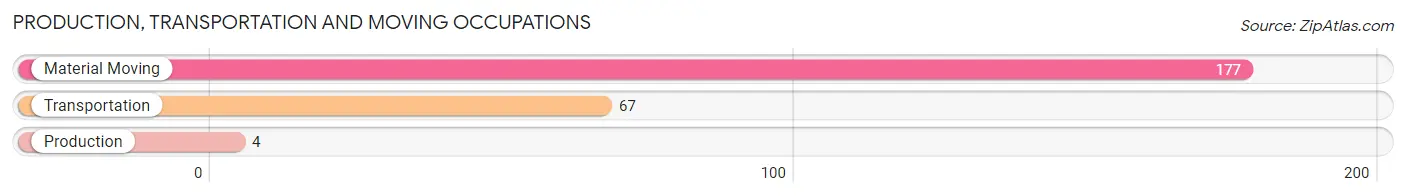
Production, Transportation and Moving Occupations
The most common Production, Transportation and Moving occupations in Hockessin are Material Moving (177 | 2.8%), Transportation (67 | 1.1%), and Production (4 | 0.1%).
Production, Transportation and Moving Occupations by Sex
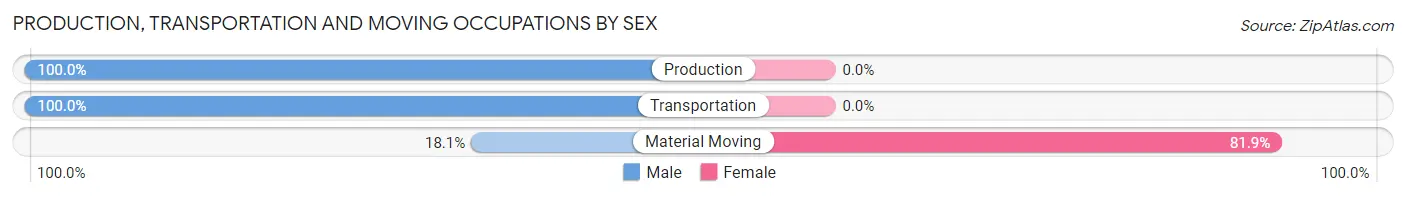
| Occupation | Male | Female |
| Production | 4 (100.0%) | 0 (0.0%) |
| Transportation | 67 (100.0%) | 0 (0.0%) |
| Material Moving | 32 (18.1%) | 145 (81.9%) |
| Total (Category) | 103 (41.5%) | 145 (58.5%) |
| Total (Overall) | 3,080 (48.0%) | 3,331 (52.0%) |
Employment Industries by Sex in Hockessin
Employment Industries in Hockessin
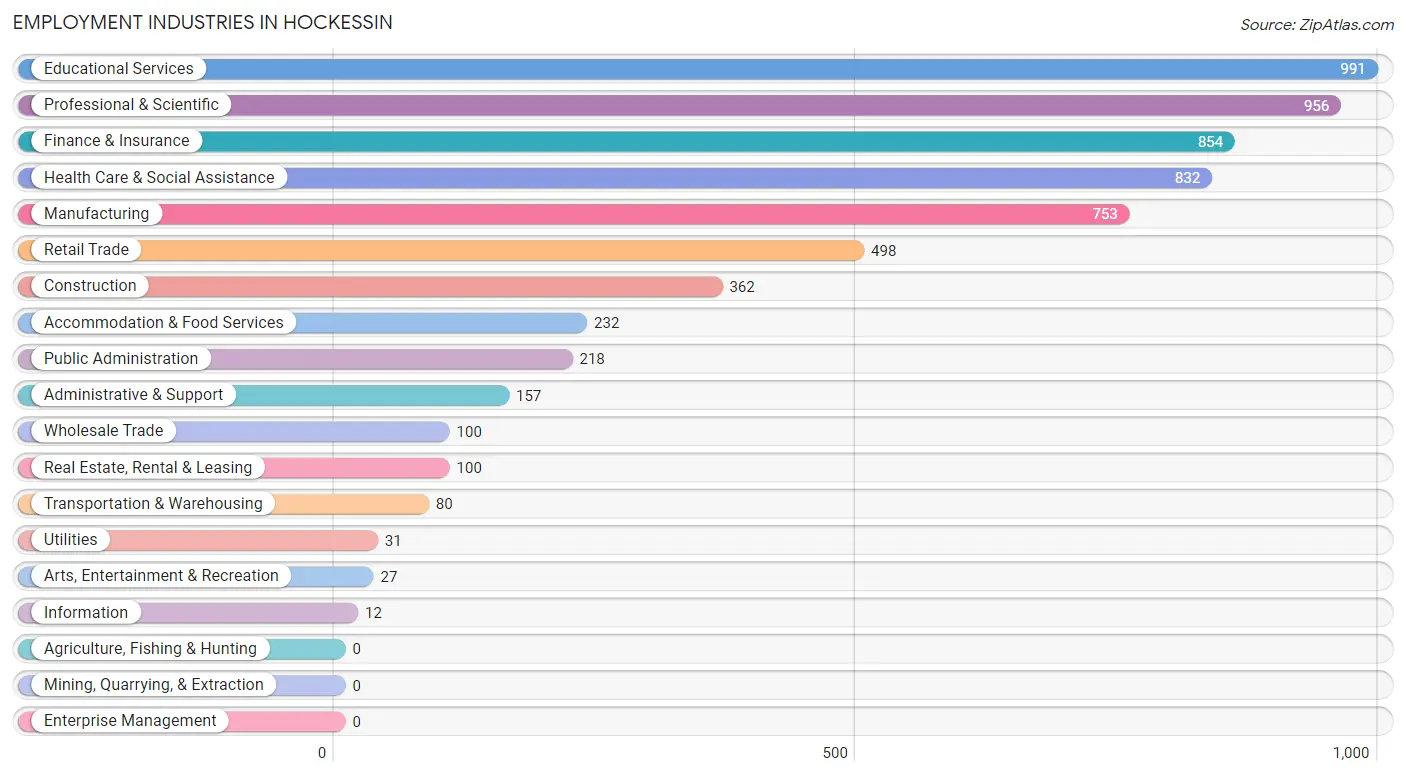
The major employment industries in Hockessin include Educational Services (991 | 15.5%), Professional & Scientific (956 | 14.9%), Finance & Insurance (854 | 13.3%), Health Care & Social Assistance (832 | 13.0%), and Manufacturing (753 | 11.7%).
Employment Industries by Sex in Hockessin
The Hockessin industries that see more men than women are Information (100.0%), Wholesale Trade (82.0%), and Arts, Entertainment & Recreation (81.5%), whereas the industries that tend to have a higher number of women are Administrative & Support (91.7%), Educational Services (79.4%), and Health Care & Social Assistance (74.0%).
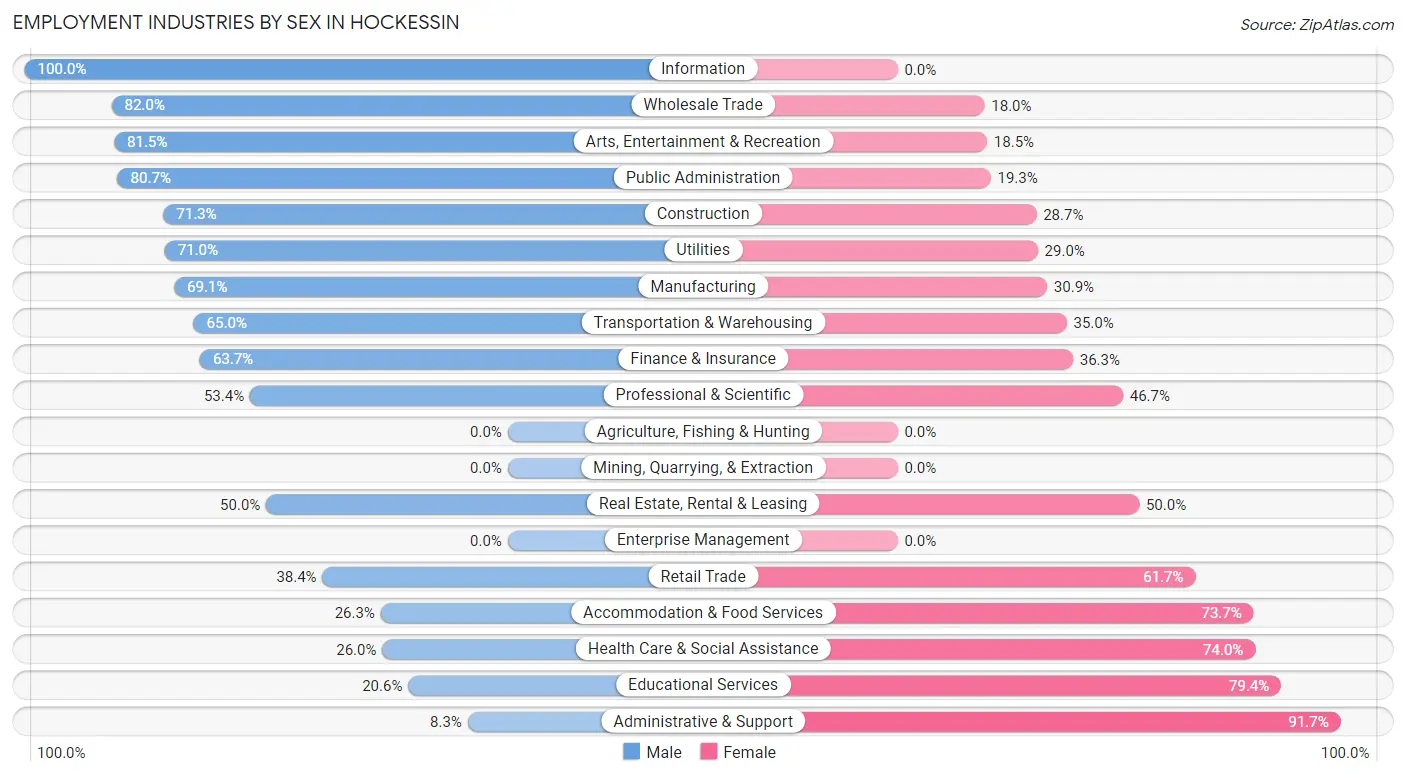
| Industry | Male | Female |
| Agriculture, Fishing & Hunting | 0 (0.0%) | 0 (0.0%) |
| Mining, Quarrying, & Extraction | 0 (0.0%) | 0 (0.0%) |
| Construction | 258 (71.3%) | 104 (28.7%) |
| Manufacturing | 520 (69.1%) | 233 (30.9%) |
| Wholesale Trade | 82 (82.0%) | 18 (18.0%) |
| Retail Trade | 191 (38.4%) | 307 (61.7%) |
| Transportation & Warehousing | 52 (65.0%) | 28 (35.0%) |
| Utilities | 22 (71.0%) | 9 (29.0%) |
| Information | 12 (100.0%) | 0 (0.0%) |
| Finance & Insurance | 544 (63.7%) | 310 (36.3%) |
| Real Estate, Rental & Leasing | 50 (50.0%) | 50 (50.0%) |
| Professional & Scientific | 510 (53.3%) | 446 (46.7%) |
| Enterprise Management | 0 (0.0%) | 0 (0.0%) |
| Administrative & Support | 13 (8.3%) | 144 (91.7%) |
| Educational Services | 204 (20.6%) | 787 (79.4%) |
| Health Care & Social Assistance | 216 (26.0%) | 616 (74.0%) |
| Arts, Entertainment & Recreation | 22 (81.5%) | 5 (18.5%) |
| Accommodation & Food Services | 61 (26.3%) | 171 (73.7%) |
| Public Administration | 176 (80.7%) | 42 (19.3%) |
| Total | 3,080 (48.0%) | 3,331 (52.0%) |
Education in Hockessin
School Enrollment in Hockessin
The most common levels of schooling among the 3,836 students in Hockessin are high school (826 | 21.5%), middle school (703 | 18.3%), and elementary school (678 | 17.7%).
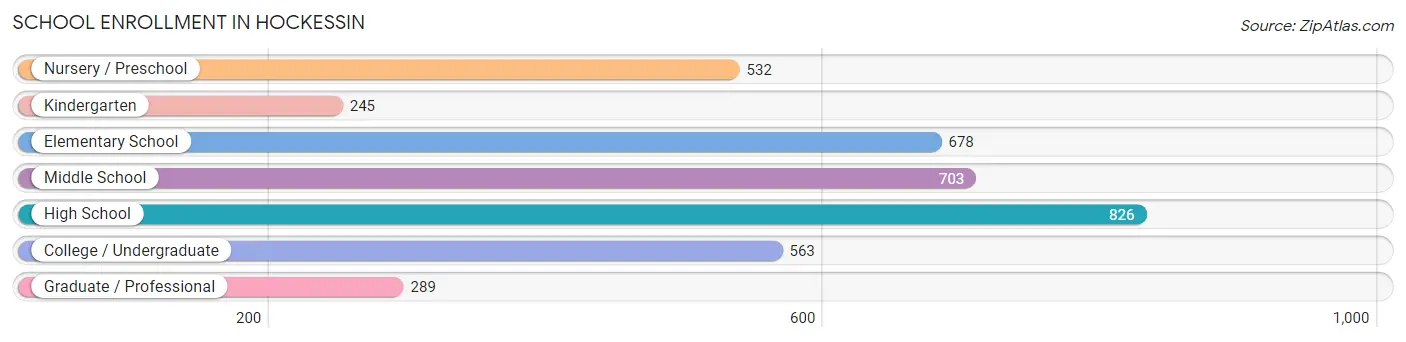
| School Level | # Students | % Students |
| Nursery / Preschool | 532 | 13.9% |
| Kindergarten | 245 | 6.4% |
| Elementary School | 678 | 17.7% |
| Middle School | 703 | 18.3% |
| High School | 826 | 21.5% |
| College / Undergraduate | 563 | 14.7% |
| Graduate / Professional | 289 | 7.5% |
| Total | 3,836 | 100.0% |
School Enrollment by Age by Funding Source in Hockessin
Out of a total of 3,836 students who are enrolled in schools in Hockessin, 1,454 (37.9%) attend a private institution, while the remaining 2,382 (62.1%) are enrolled in public schools. The age group of 3 to 4 year olds has the highest likelihood of being enrolled in private schools, with 413 (77.6% in the age bracket) enrolled. Conversely, the age group of 20 to 24 year olds has the lowest likelihood of being enrolled in a private school, with 291 (83.1% in the age bracket) attending a public institution.
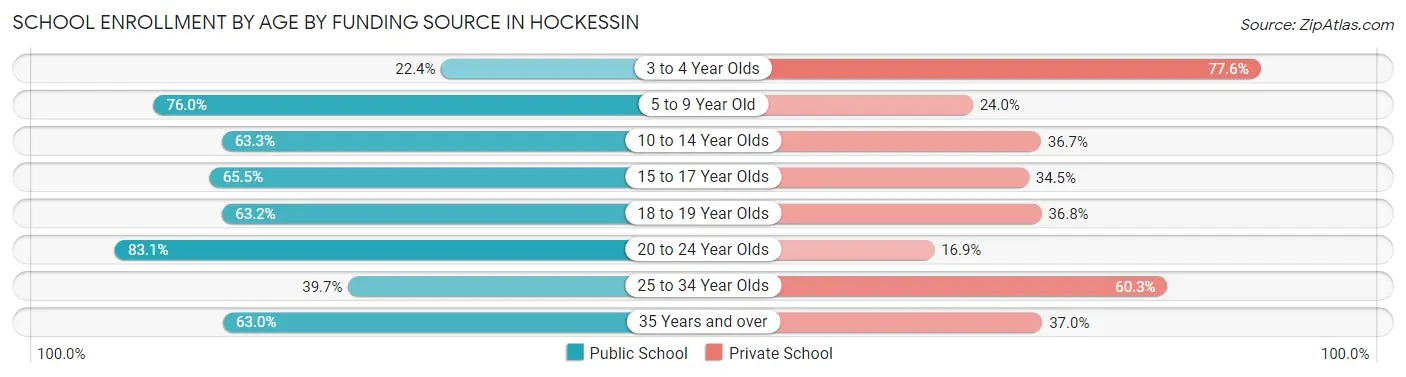
| Age Bracket | Public School | Private School |
| 3 to 4 Year Olds | 119 (22.4%) | 413 (77.6%) |
| 5 to 9 Year Old | 645 (76.0%) | 204 (24.0%) |
| 10 to 14 Year Olds | 591 (63.3%) | 343 (36.7%) |
| 15 to 17 Year Olds | 359 (65.5%) | 189 (34.5%) |
| 18 to 19 Year Olds | 108 (63.2%) | 63 (36.8%) |
| 20 to 24 Year Olds | 291 (83.1%) | 59 (16.9%) |
| 25 to 34 Year Olds | 27 (39.7%) | 41 (60.3%) |
| 35 Years and over | 242 (63.0%) | 142 (37.0%) |
| Total | 2,382 (62.1%) | 1,454 (37.9%) |
Educational Attainment by Field of Study in Hockessin
Business (1,272 | 16.7%), education (981 | 12.9%), engineering (928 | 12.2%), physical & health sciences (808 | 10.6%), and liberal arts & history (580 | 7.6%) are the most common fields of study among 7,631 individuals in Hockessin who have obtained a bachelor's degree or higher.
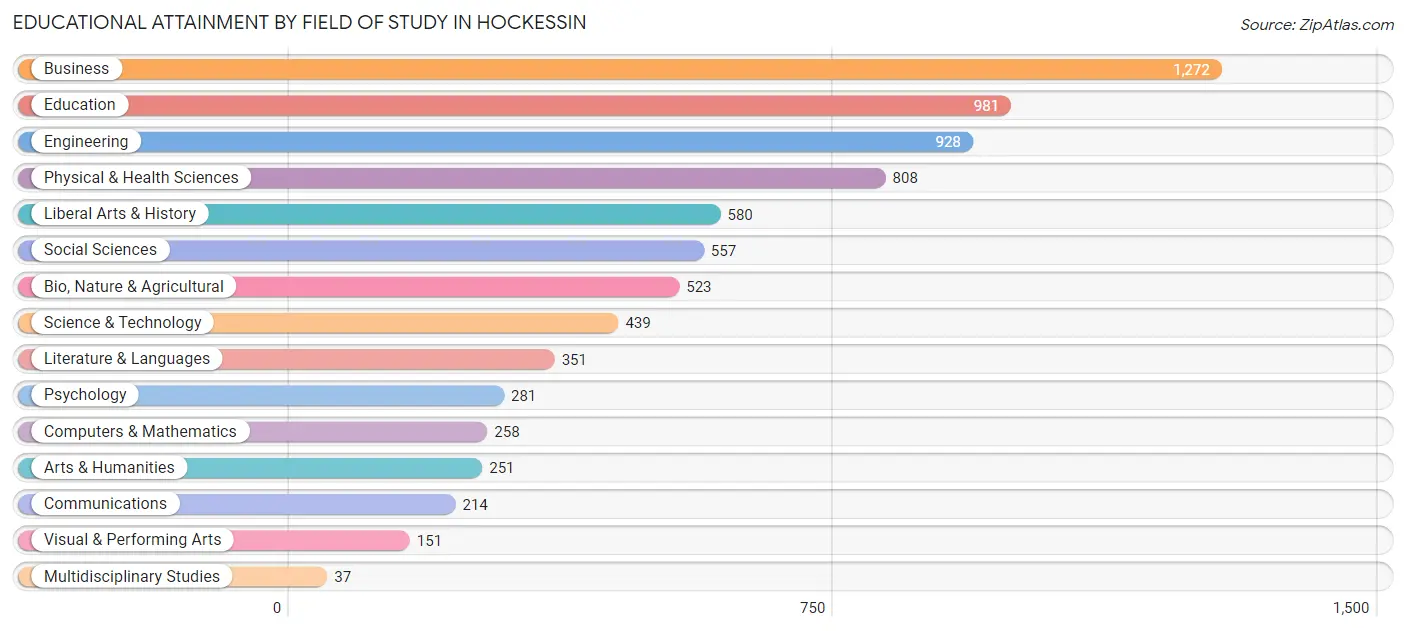
| Field of Study | # Graduates | % Graduates |
| Computers & Mathematics | 258 | 3.4% |
| Bio, Nature & Agricultural | 523 | 6.9% |
| Physical & Health Sciences | 808 | 10.6% |
| Psychology | 281 | 3.7% |
| Social Sciences | 557 | 7.3% |
| Engineering | 928 | 12.2% |
| Multidisciplinary Studies | 37 | 0.5% |
| Science & Technology | 439 | 5.8% |
| Business | 1,272 | 16.7% |
| Education | 981 | 12.9% |
| Literature & Languages | 351 | 4.6% |
| Liberal Arts & History | 580 | 7.6% |
| Visual & Performing Arts | 151 | 2.0% |
| Communications | 214 | 2.8% |
| Arts & Humanities | 251 | 3.3% |
| Total | 7,631 | 100.0% |
Transportation & Commute in Hockessin
Vehicle Availability by Sex in Hockessin
The most prevalent vehicle ownership categories in Hockessin are males with 2 vehicles (1,855, accounting for 60.0%) and females with 2 vehicles (1,659, making up 56.9%).
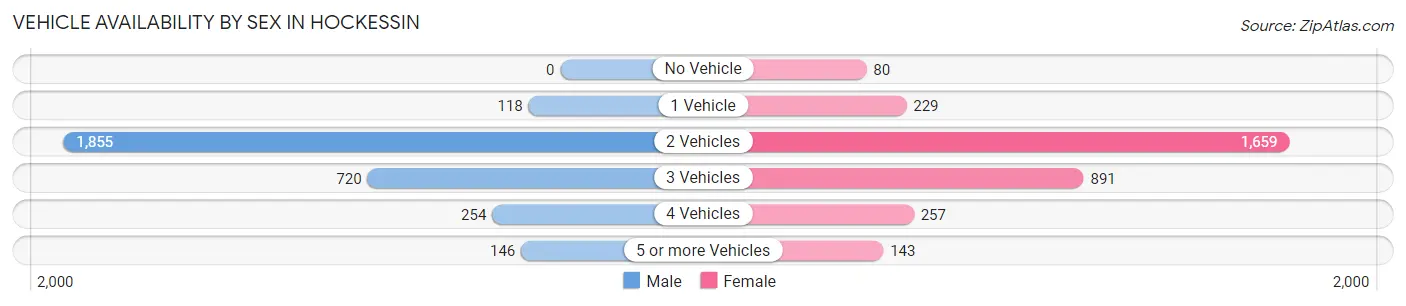
| Vehicles Available | Male | Female |
| No Vehicle | 0 (0.0%) | 80 (2.5%) |
| 1 Vehicle | 118 (3.8%) | 229 (7.0%) |
| 2 Vehicles | 1,855 (60.0%) | 1,659 (50.9%) |
| 3 Vehicles | 720 (23.3%) | 891 (27.3%) |
| 4 Vehicles | 254 (8.2%) | 257 (7.9%) |
| 5 or more Vehicles | 146 (4.7%) | 143 (4.4%) |
| Total | 3,093 (100.0%) | 3,259 (100.0%) |
Commute Time in Hockessin
The most frequently occuring commute durations in Hockessin are 20 to 24 minutes (1,307 commuters, 26.1%), 30 to 34 minutes (930 commuters, 18.5%), and 25 to 29 minutes (698 commuters, 13.9%).
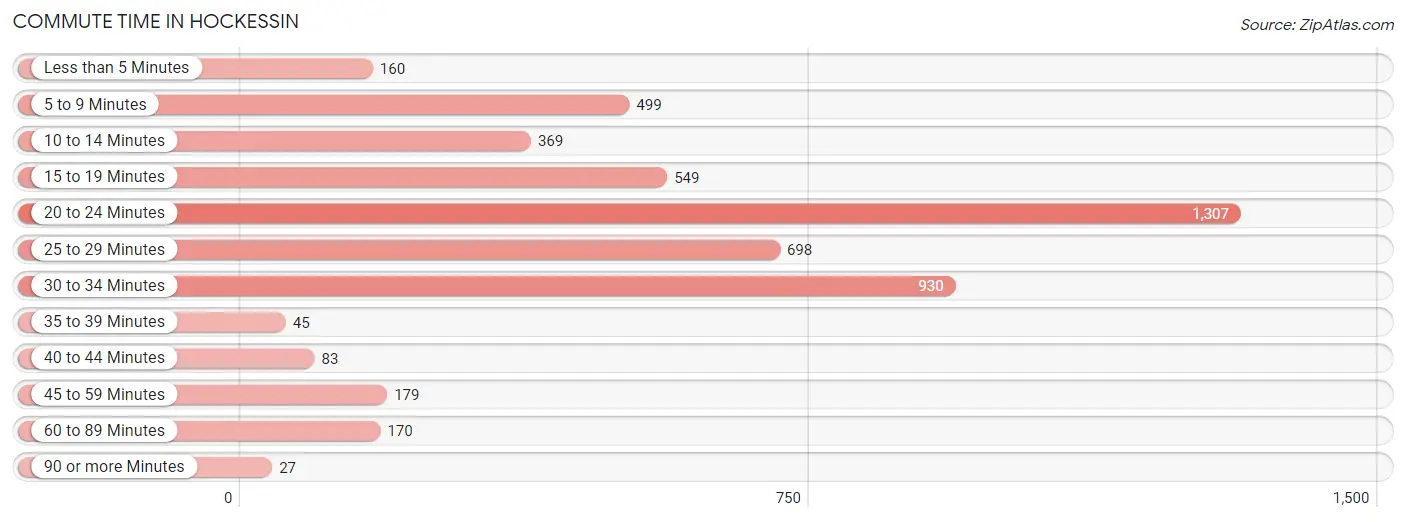
| Commute Time | # Commuters | % Commuters |
| Less than 5 Minutes | 160 | 3.2% |
| 5 to 9 Minutes | 499 | 10.0% |
| 10 to 14 Minutes | 369 | 7.4% |
| 15 to 19 Minutes | 549 | 10.9% |
| 20 to 24 Minutes | 1,307 | 26.1% |
| 25 to 29 Minutes | 698 | 13.9% |
| 30 to 34 Minutes | 930 | 18.5% |
| 35 to 39 Minutes | 45 | 0.9% |
| 40 to 44 Minutes | 83 | 1.7% |
| 45 to 59 Minutes | 179 | 3.6% |
| 60 to 89 Minutes | 170 | 3.4% |
| 90 or more Minutes | 27 | 0.5% |
Commute Time by Sex in Hockessin
The most common commute times in Hockessin are 20 to 24 minutes (560 commuters, 23.3%) for males and 20 to 24 minutes (747 commuters, 28.6%) for females.
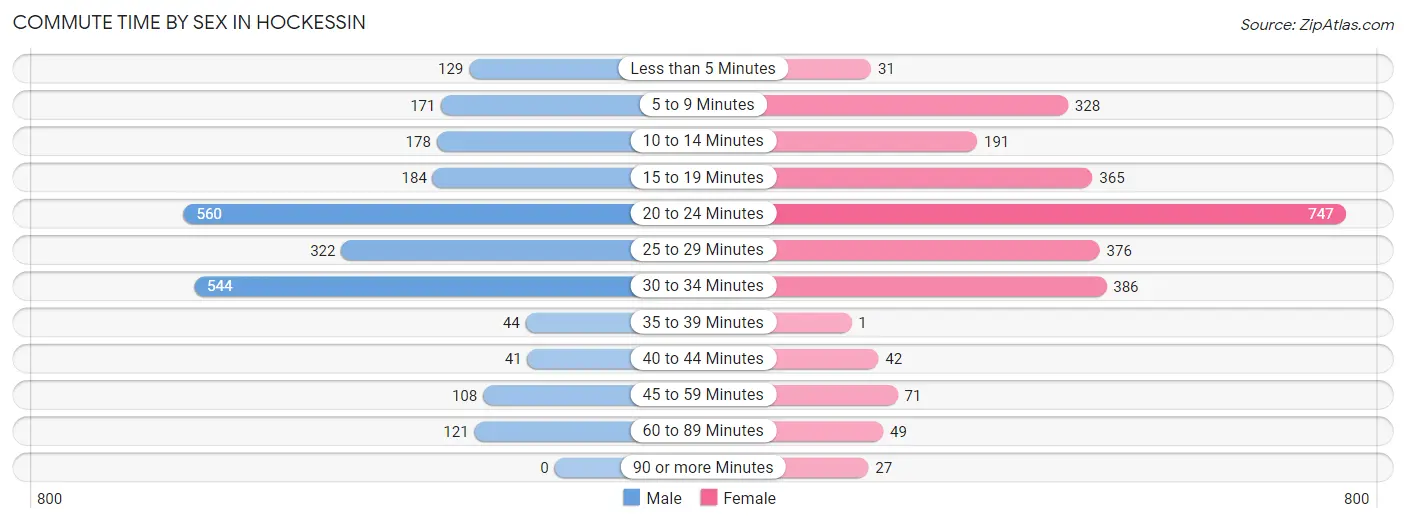
| Commute Time | Male | Female |
| Less than 5 Minutes | 129 (5.4%) | 31 (1.2%) |
| 5 to 9 Minutes | 171 (7.1%) | 328 (12.6%) |
| 10 to 14 Minutes | 178 (7.4%) | 191 (7.3%) |
| 15 to 19 Minutes | 184 (7.7%) | 365 (14.0%) |
| 20 to 24 Minutes | 560 (23.3%) | 747 (28.6%) |
| 25 to 29 Minutes | 322 (13.4%) | 376 (14.4%) |
| 30 to 34 Minutes | 544 (22.7%) | 386 (14.8%) |
| 35 to 39 Minutes | 44 (1.8%) | 1 (0.0%) |
| 40 to 44 Minutes | 41 (1.7%) | 42 (1.6%) |
| 45 to 59 Minutes | 108 (4.5%) | 71 (2.7%) |
| 60 to 89 Minutes | 121 (5.0%) | 49 (1.9%) |
| 90 or more Minutes | 0 (0.0%) | 27 (1.0%) |
Time of Departure to Work by Sex in Hockessin
The most frequent times of departure to work in Hockessin are 7:00 AM to 7:29 AM (586, 24.4%) for males and 7:30 AM to 7:59 AM (558, 21.3%) for females.
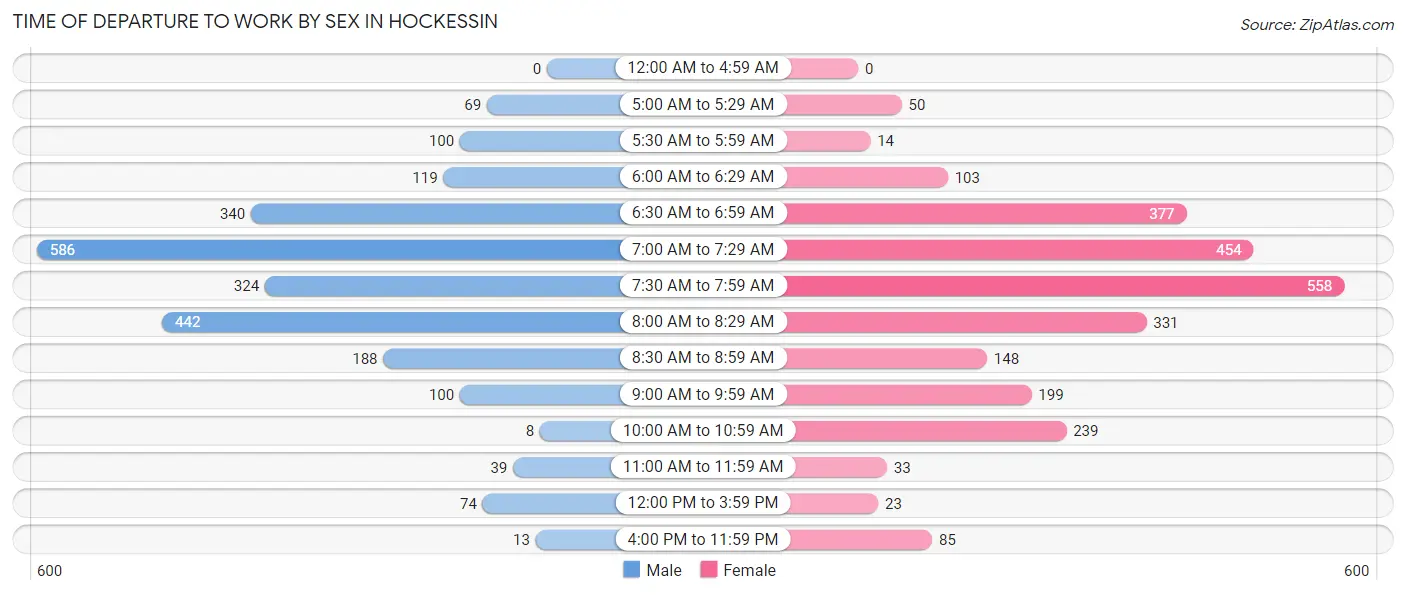
| Time of Departure | Male | Female |
| 12:00 AM to 4:59 AM | 0 (0.0%) | 0 (0.0%) |
| 5:00 AM to 5:29 AM | 69 (2.9%) | 50 (1.9%) |
| 5:30 AM to 5:59 AM | 100 (4.2%) | 14 (0.5%) |
| 6:00 AM to 6:29 AM | 119 (5.0%) | 103 (3.9%) |
| 6:30 AM to 6:59 AM | 340 (14.1%) | 377 (14.4%) |
| 7:00 AM to 7:29 AM | 586 (24.4%) | 454 (17.4%) |
| 7:30 AM to 7:59 AM | 324 (13.5%) | 558 (21.3%) |
| 8:00 AM to 8:29 AM | 442 (18.4%) | 331 (12.7%) |
| 8:30 AM to 8:59 AM | 188 (7.8%) | 148 (5.7%) |
| 9:00 AM to 9:59 AM | 100 (4.2%) | 199 (7.6%) |
| 10:00 AM to 10:59 AM | 8 (0.3%) | 239 (9.1%) |
| 11:00 AM to 11:59 AM | 39 (1.6%) | 33 (1.3%) |
| 12:00 PM to 3:59 PM | 74 (3.1%) | 23 (0.9%) |
| 4:00 PM to 11:59 PM | 13 (0.5%) | 85 (3.3%) |
| Total | 2,402 (100.0%) | 2,614 (100.0%) |
Housing Occupancy in Hockessin
Occupancy by Ownership in Hockessin
Of the total 4,937 dwellings in Hockessin, owner-occupied units account for 4,508 (91.3%), while renter-occupied units make up 429 (8.7%).
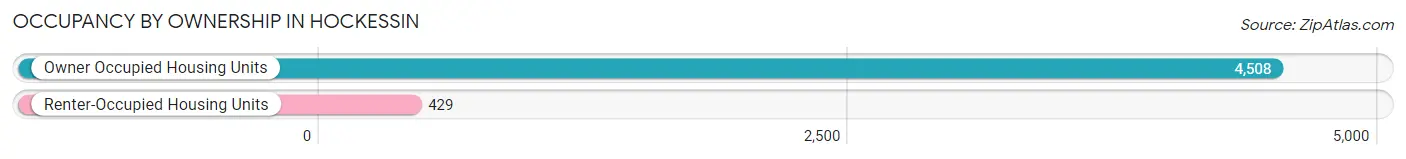
| Occupancy | # Housing Units | % Housing Units |
| Owner Occupied Housing Units | 4,508 | 91.3% |
| Renter-Occupied Housing Units | 429 | 8.7% |
| Total Occupied Housing Units | 4,937 | 100.0% |
Occupancy by Household Size in Hockessin
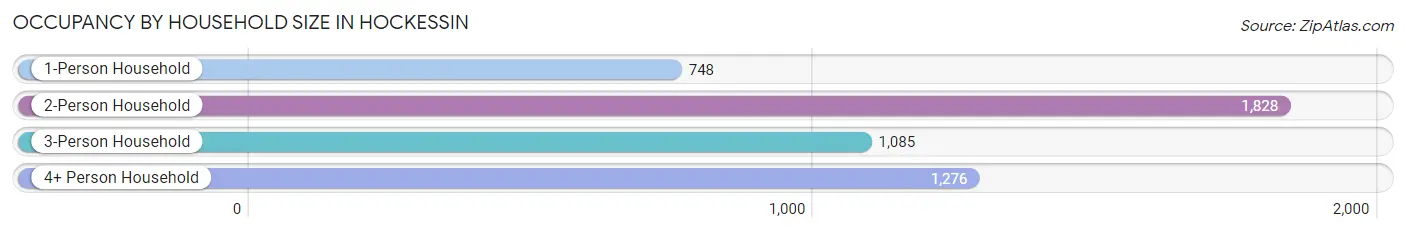
| Household Size | # Housing Units | % Housing Units |
| 1-Person Household | 748 | 15.1% |
| 2-Person Household | 1,828 | 37.0% |
| 3-Person Household | 1,085 | 22.0% |
| 4+ Person Household | 1,276 | 25.9% |
| Total Housing Units | 4,937 | 100.0% |
Occupancy by Ownership by Household Size in Hockessin
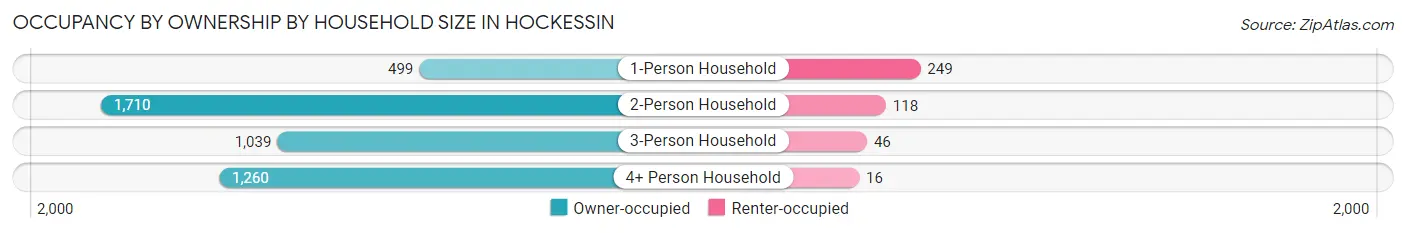
| Household Size | Owner-occupied | Renter-occupied |
| 1-Person Household | 499 (66.7%) | 249 (33.3%) |
| 2-Person Household | 1,710 (93.5%) | 118 (6.5%) |
| 3-Person Household | 1,039 (95.8%) | 46 (4.2%) |
| 4+ Person Household | 1,260 (98.8%) | 16 (1.3%) |
| Total Housing Units | 4,508 (91.3%) | 429 (8.7%) |
Occupancy by Educational Attainment in Hockessin
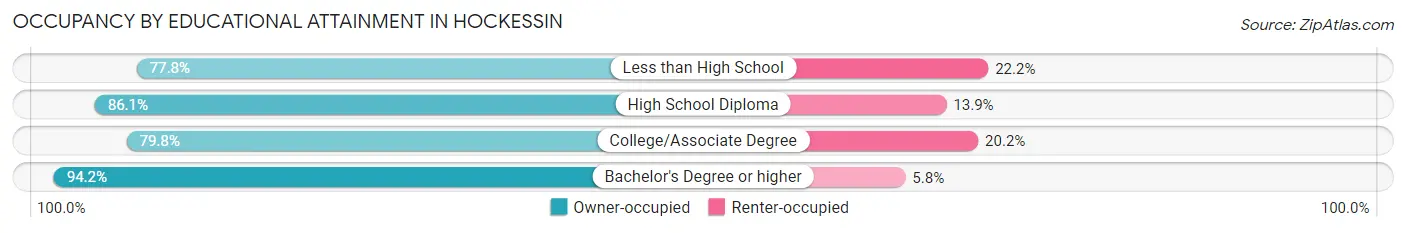
| Household Size | Owner-occupied | Renter-occupied |
| Less than High School | 28 (77.8%) | 8 (22.2%) |
| High School Diploma | 315 (86.1%) | 51 (13.9%) |
| College/Associate Degree | 592 (79.8%) | 150 (20.2%) |
| Bachelor's Degree or higher | 3,573 (94.2%) | 220 (5.8%) |
Occupancy by Age of Householder in Hockessin
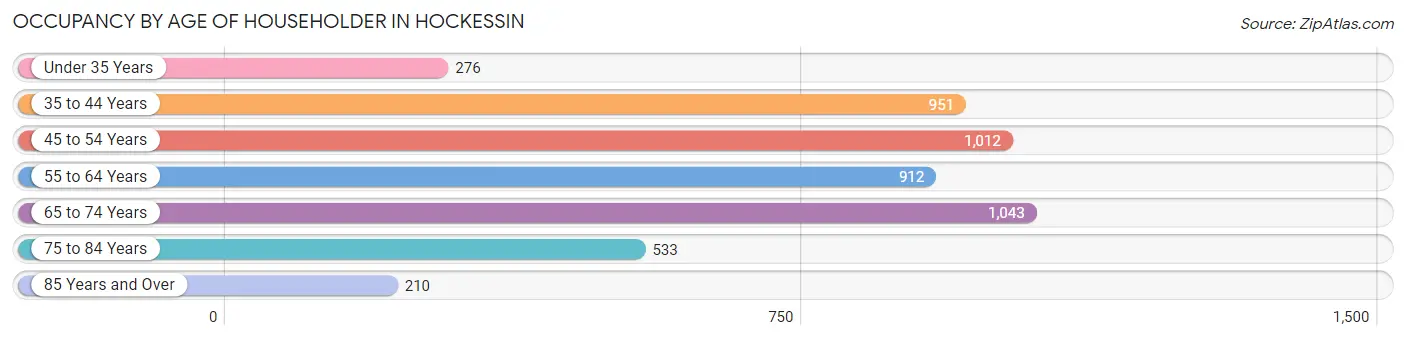
| Age Bracket | # Households | % Households |
| Under 35 Years | 276 | 5.6% |
| 35 to 44 Years | 951 | 19.3% |
| 45 to 54 Years | 1,012 | 20.5% |
| 55 to 64 Years | 912 | 18.5% |
| 65 to 74 Years | 1,043 | 21.1% |
| 75 to 84 Years | 533 | 10.8% |
| 85 Years and Over | 210 | 4.3% |
| Total | 4,937 | 100.0% |
Housing Finances in Hockessin
Median Income by Occupancy in Hockessin
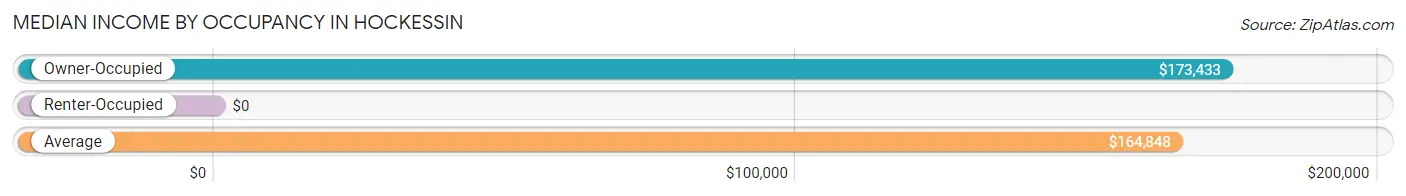
| Occupancy Type | # Households | Median Income |
| Owner-Occupied | 4,508 (91.3%) | $173,433 |
| Renter-Occupied | 429 (8.7%) | $0 |
| Average | 4,937 (100.0%) | $164,848 |
Occupancy by Householder Income Bracket in Hockessin
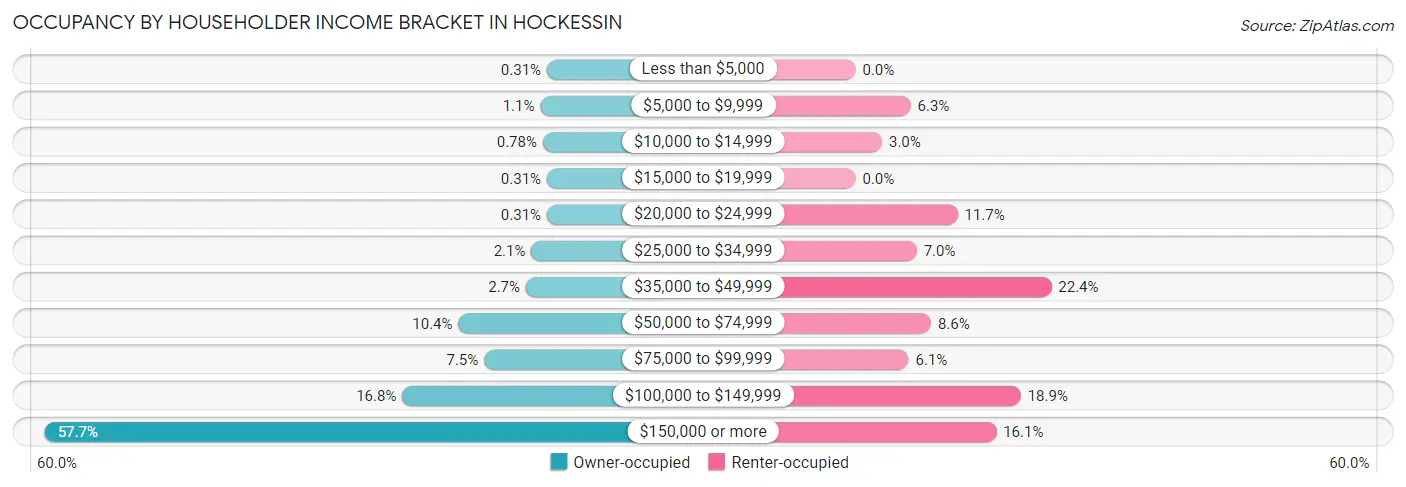
| Income Bracket | Owner-occupied | Renter-occupied |
| Less than $5,000 | 14 (0.3%) | 0 (0.0%) |
| $5,000 to $9,999 | 48 (1.1%) | 27 (6.3%) |
| $10,000 to $14,999 | 35 (0.8%) | 13 (3.0%) |
| $15,000 to $19,999 | 14 (0.3%) | 0 (0.0%) |
| $20,000 to $24,999 | 14 (0.3%) | 50 (11.7%) |
| $25,000 to $34,999 | 94 (2.1%) | 30 (7.0%) |
| $35,000 to $49,999 | 122 (2.7%) | 96 (22.4%) |
| $50,000 to $74,999 | 470 (10.4%) | 37 (8.6%) |
| $75,000 to $99,999 | 337 (7.5%) | 26 (6.1%) |
| $100,000 to $149,999 | 759 (16.8%) | 81 (18.9%) |
| $150,000 or more | 2,601 (57.7%) | 69 (16.1%) |
| Total | 4,508 (100.0%) | 429 (100.0%) |
Monthly Housing Cost Tiers in Hockessin
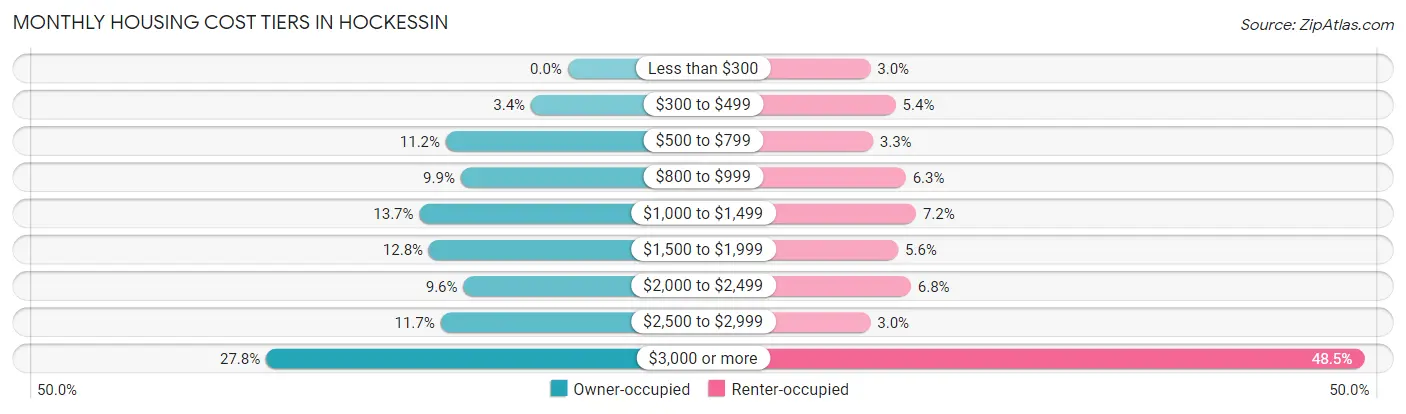
| Monthly Cost | Owner-occupied | Renter-occupied |
| Less than $300 | 0 (0.0%) | 13 (3.0%) |
| $300 to $499 | 153 (3.4%) | 23 (5.4%) |
| $500 to $799 | 506 (11.2%) | 14 (3.3%) |
| $800 to $999 | 444 (9.9%) | 27 (6.3%) |
| $1,000 to $1,499 | 616 (13.7%) | 31 (7.2%) |
| $1,500 to $1,999 | 576 (12.8%) | 24 (5.6%) |
| $2,000 to $2,499 | 433 (9.6%) | 29 (6.8%) |
| $2,500 to $2,999 | 528 (11.7%) | 13 (3.0%) |
| $3,000 or more | 1,252 (27.8%) | 208 (48.5%) |
| Total | 4,508 (100.0%) | 429 (100.0%) |
Physical Housing Characteristics in Hockessin
Housing Structures in Hockessin
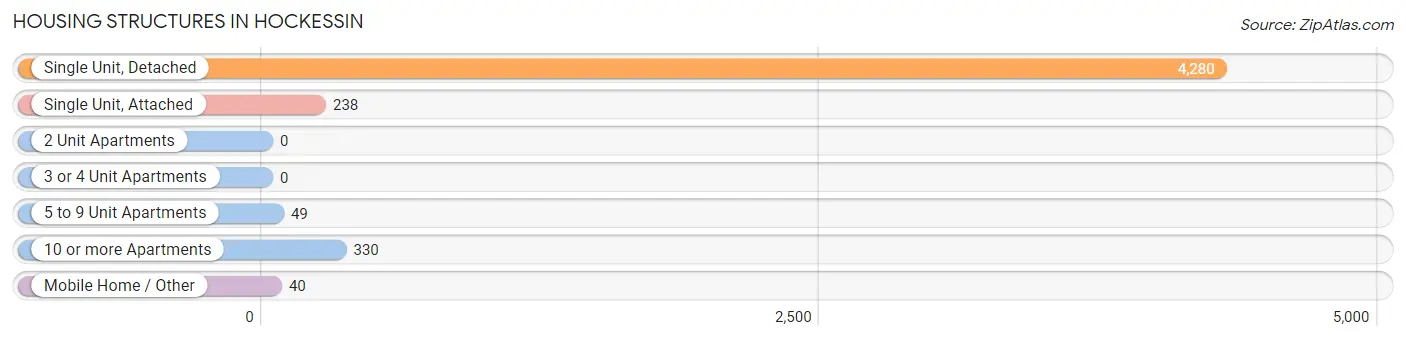
| Structure Type | # Housing Units | % Housing Units |
| Single Unit, Detached | 4,280 | 86.7% |
| Single Unit, Attached | 238 | 4.8% |
| 2 Unit Apartments | 0 | 0.0% |
| 3 or 4 Unit Apartments | 0 | 0.0% |
| 5 to 9 Unit Apartments | 49 | 1.0% |
| 10 or more Apartments | 330 | 6.7% |
| Mobile Home / Other | 40 | 0.8% |
| Total | 4,937 | 100.0% |
Housing Structures by Occupancy in Hockessin
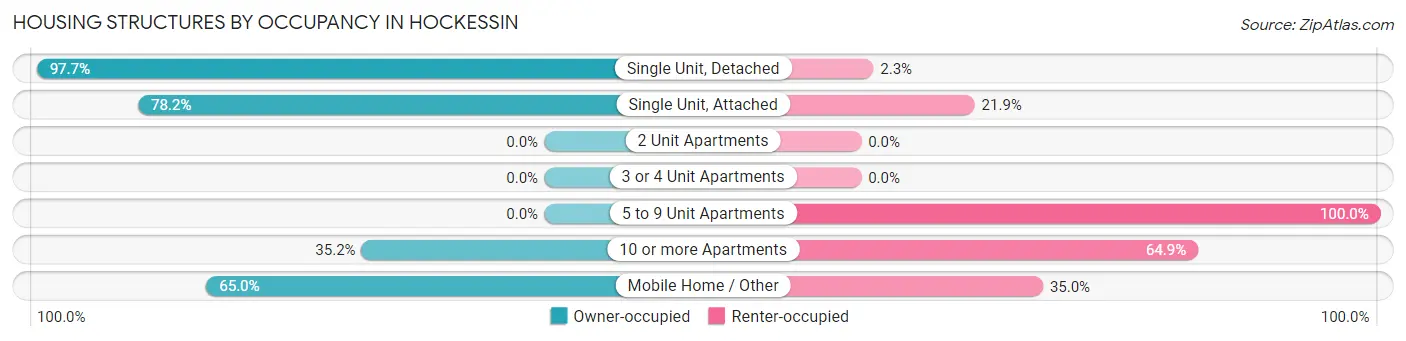
| Structure Type | Owner-occupied | Renter-occupied |
| Single Unit, Detached | 4,180 (97.7%) | 100 (2.3%) |
| Single Unit, Attached | 186 (78.1%) | 52 (21.8%) |
| 2 Unit Apartments | 0 (0.0%) | 0 (0.0%) |
| 3 or 4 Unit Apartments | 0 (0.0%) | 0 (0.0%) |
| 5 to 9 Unit Apartments | 0 (0.0%) | 49 (100.0%) |
| 10 or more Apartments | 116 (35.1%) | 214 (64.8%) |
| Mobile Home / Other | 26 (65.0%) | 14 (35.0%) |
| Total | 4,508 (91.3%) | 429 (8.7%) |
Housing Structures by Number of Rooms in Hockessin
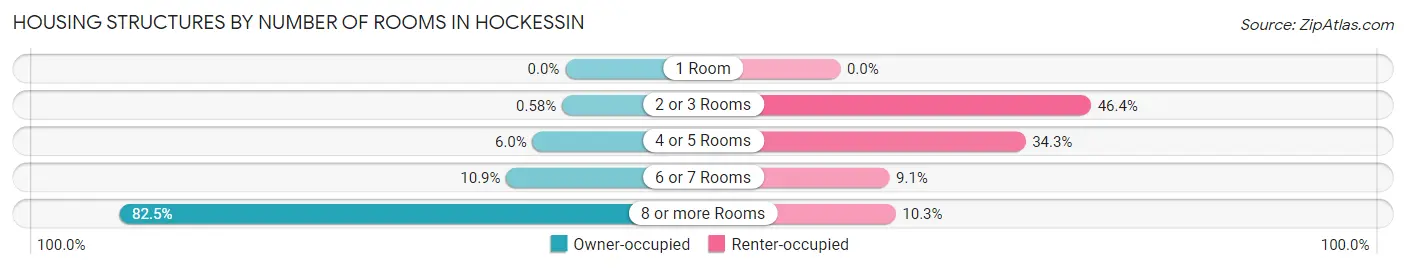
| Number of Rooms | Owner-occupied | Renter-occupied |
| 1 Room | 0 (0.0%) | 0 (0.0%) |
| 2 or 3 Rooms | 26 (0.6%) | 199 (46.4%) |
| 4 or 5 Rooms | 272 (6.0%) | 147 (34.3%) |
| 6 or 7 Rooms | 491 (10.9%) | 39 (9.1%) |
| 8 or more Rooms | 3,719 (82.5%) | 44 (10.3%) |
| Total | 4,508 (100.0%) | 429 (100.0%) |
Housing Structure by Heating Type in Hockessin
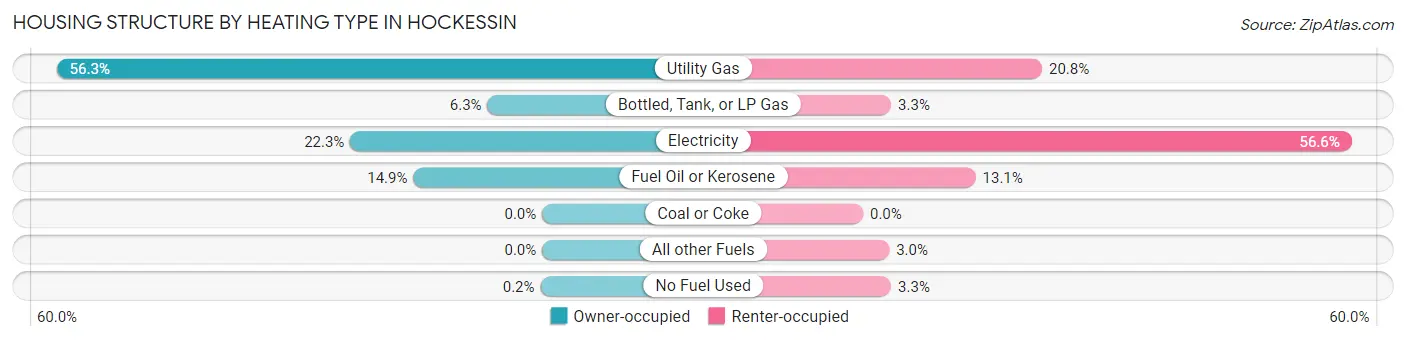
| Heating Type | Owner-occupied | Renter-occupied |
| Utility Gas | 2,537 (56.3%) | 89 (20.7%) |
| Bottled, Tank, or LP Gas | 286 (6.3%) | 14 (3.3%) |
| Electricity | 1,003 (22.3%) | 243 (56.6%) |
| Fuel Oil or Kerosene | 673 (14.9%) | 56 (13.1%) |
| Coal or Coke | 0 (0.0%) | 0 (0.0%) |
| All other Fuels | 0 (0.0%) | 13 (3.0%) |
| No Fuel Used | 9 (0.2%) | 14 (3.3%) |
| Total | 4,508 (100.0%) | 429 (100.0%) |
Household Vehicle Usage in Hockessin
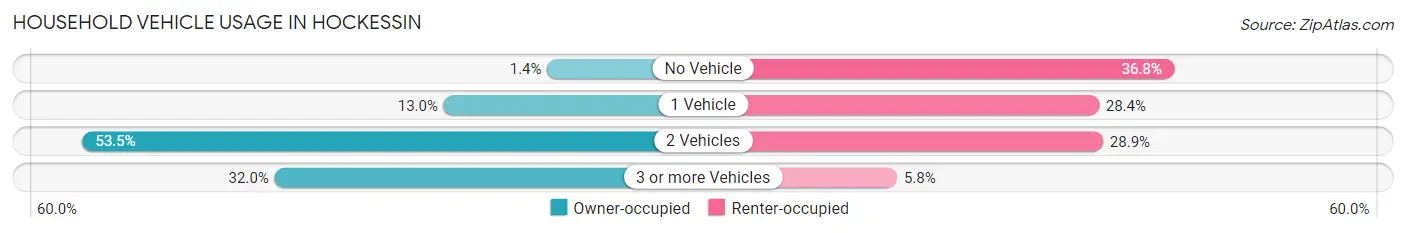
| Vehicles per Household | Owner-occupied | Renter-occupied |
| No Vehicle | 65 (1.4%) | 158 (36.8%) |
| 1 Vehicle | 588 (13.0%) | 122 (28.4%) |
| 2 Vehicles | 2,413 (53.5%) | 124 (28.9%) |
| 3 or more Vehicles | 1,442 (32.0%) | 25 (5.8%) |
| Total | 4,508 (100.0%) | 429 (100.0%) |
Real Estate & Mortgages in Hockessin
Real Estate and Mortgage Overview in Hockessin
| Characteristic | Without Mortgage | With Mortgage |
| Housing Units | 1,550 | 2,958 |
| Median Property Value | $493,400 | $564,600 |
| Median Household Income | $129,781 | $1,877 |
| Monthly Housing Costs | $854 | $1,252 |
| Real Estate Taxes | $4,691 | $0 |
Property Value by Mortgage Status in Hockessin
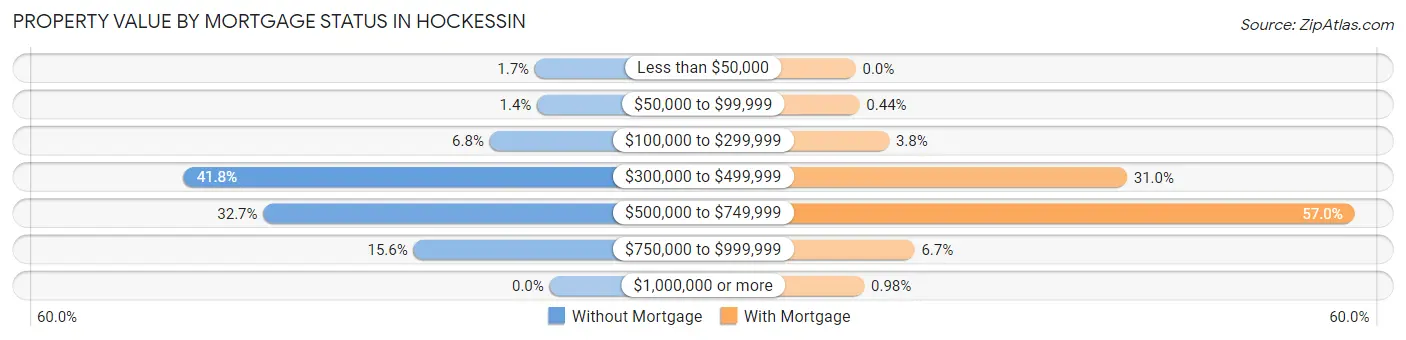
| Property Value | Without Mortgage | With Mortgage |
| Less than $50,000 | 26 (1.7%) | 0 (0.0%) |
| $50,000 to $99,999 | 22 (1.4%) | 13 (0.4%) |
| $100,000 to $299,999 | 106 (6.8%) | 113 (3.8%) |
| $300,000 to $499,999 | 648 (41.8%) | 917 (31.0%) |
| $500,000 to $749,999 | 507 (32.7%) | 1,687 (57.0%) |
| $750,000 to $999,999 | 241 (15.5%) | 199 (6.7%) |
| $1,000,000 or more | 0 (0.0%) | 29 (1.0%) |
| Total | 1,550 (100.0%) | 2,958 (100.0%) |
Household Income by Mortgage Status in Hockessin
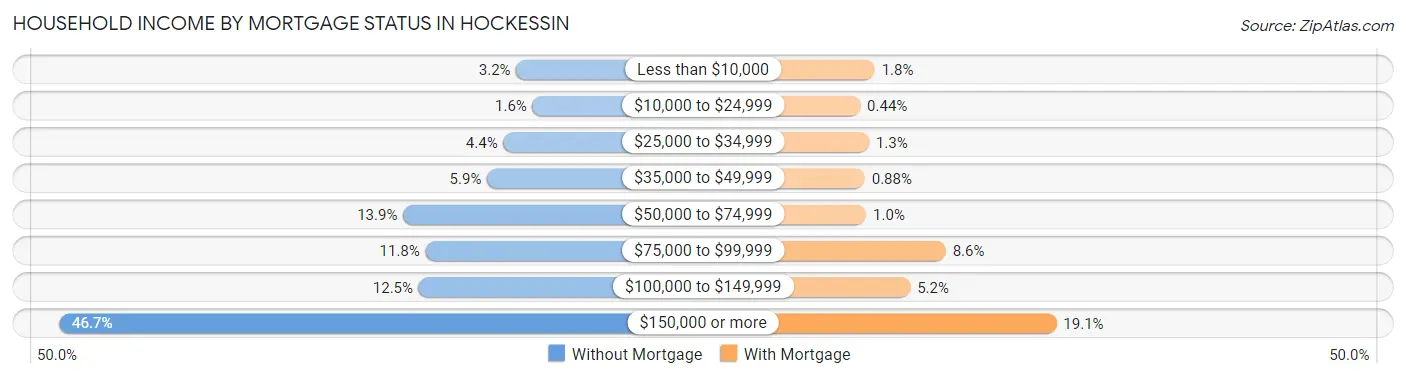
| Household Income | Without Mortgage | With Mortgage |
| Less than $10,000 | 49 (3.2%) | 54 (1.8%) |
| $10,000 to $24,999 | 25 (1.6%) | 13 (0.4%) |
| $25,000 to $34,999 | 68 (4.4%) | 38 (1.3%) |
| $35,000 to $49,999 | 92 (5.9%) | 26 (0.9%) |
| $50,000 to $74,999 | 216 (13.9%) | 30 (1.0%) |
| $75,000 to $99,999 | 183 (11.8%) | 254 (8.6%) |
| $100,000 to $149,999 | 193 (12.4%) | 154 (5.2%) |
| $150,000 or more | 724 (46.7%) | 566 (19.1%) |
| Total | 1,550 (100.0%) | 2,958 (100.0%) |
Property Value to Household Income Ratio in Hockessin
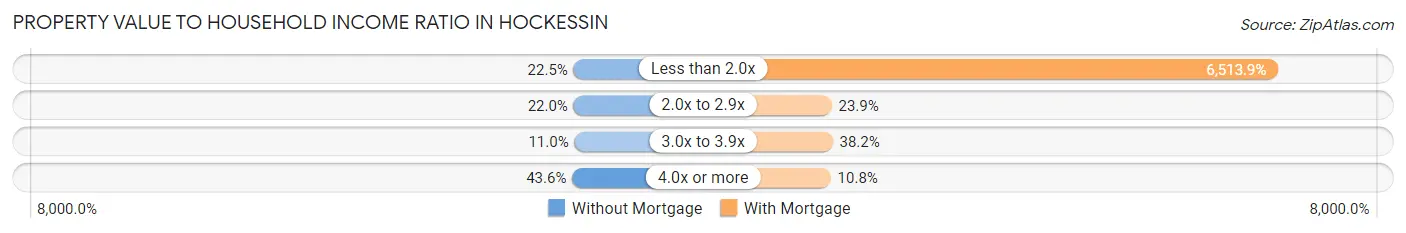
| Value-to-Income Ratio | Without Mortgage | With Mortgage |
| Less than 2.0x | 348 (22.5%) | 192,682 (6,513.9%) |
| 2.0x to 2.9x | 341 (22.0%) | 708 (23.9%) |
| 3.0x to 3.9x | 171 (11.0%) | 1,130 (38.2%) |
| 4.0x or more | 676 (43.6%) | 318 (10.7%) |
| Total | 1,550 (100.0%) | 2,958 (100.0%) |
Real Estate Taxes by Mortgage Status in Hockessin
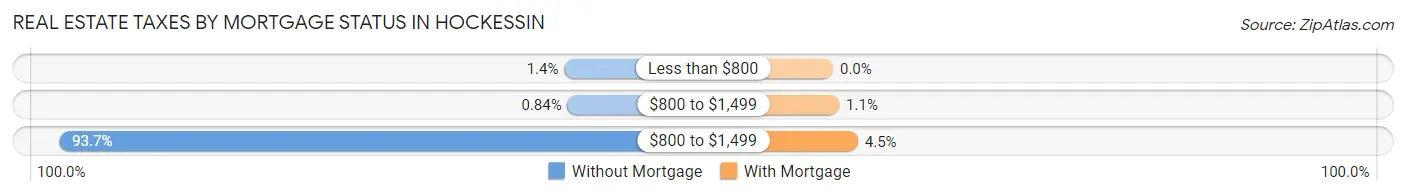
| Property Taxes | Without Mortgage | With Mortgage |
| Less than $800 | 22 (1.4%) | 0 (0.0%) |
| $800 to $1,499 | 13 (0.8%) | 33 (1.1%) |
| $800 to $1,499 | 1,452 (93.7%) | 134 (4.5%) |
| Total | 1,550 (100.0%) | 2,958 (100.0%) |
Health & Disability in Hockessin
Health Insurance Coverage by Age in Hockessin
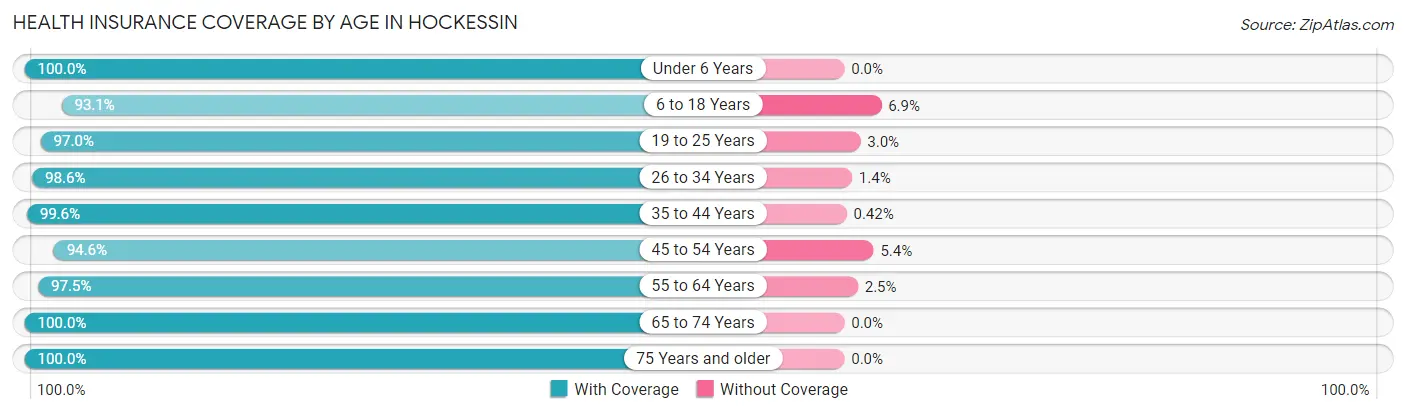
| Age Bracket | With Coverage | Without Coverage |
| Under 6 Years | 1,022 (100.0%) | 0 (0.0%) |
| 6 to 18 Years | 2,218 (93.1%) | 164 (6.9%) |
| 19 to 25 Years | 585 (97.0%) | 18 (3.0%) |
| 26 to 34 Years | 970 (98.6%) | 14 (1.4%) |
| 35 to 44 Years | 1,891 (99.6%) | 8 (0.4%) |
| 45 to 54 Years | 1,738 (94.6%) | 100 (5.4%) |
| 55 to 64 Years | 1,778 (97.5%) | 46 (2.5%) |
| 65 to 74 Years | 1,881 (100.0%) | 0 (0.0%) |
| 75 Years and older | 1,077 (100.0%) | 0 (0.0%) |
| Total | 13,160 (97.4%) | 350 (2.6%) |
Health Insurance Coverage by Citizenship Status in Hockessin
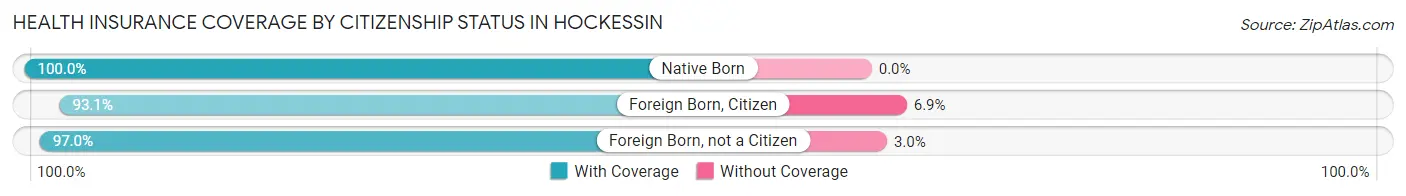
| Citizenship Status | With Coverage | Without Coverage |
| Native Born | 1,022 (100.0%) | 0 (0.0%) |
| Foreign Born, Citizen | 2,218 (93.1%) | 164 (6.9%) |
| Foreign Born, not a Citizen | 585 (97.0%) | 18 (3.0%) |
Health Insurance Coverage by Household Income in Hockessin
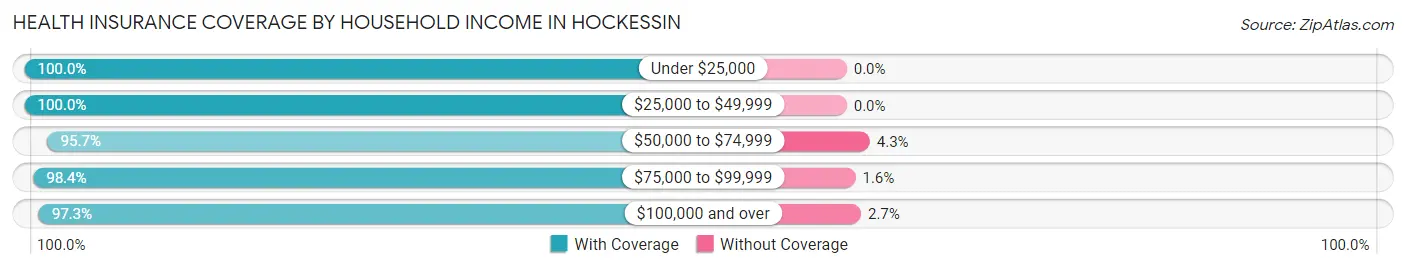
| Household Income | With Coverage | Without Coverage |
| Under $25,000 | 352 (100.0%) | 0 (0.0%) |
| $25,000 to $49,999 | 437 (100.0%) | 0 (0.0%) |
| $50,000 to $74,999 | 1,020 (95.7%) | 46 (4.3%) |
| $75,000 to $99,999 | 781 (98.4%) | 13 (1.6%) |
| $100,000 and over | 10,562 (97.3%) | 290 (2.7%) |
Public vs Private Health Insurance Coverage by Age in Hockessin
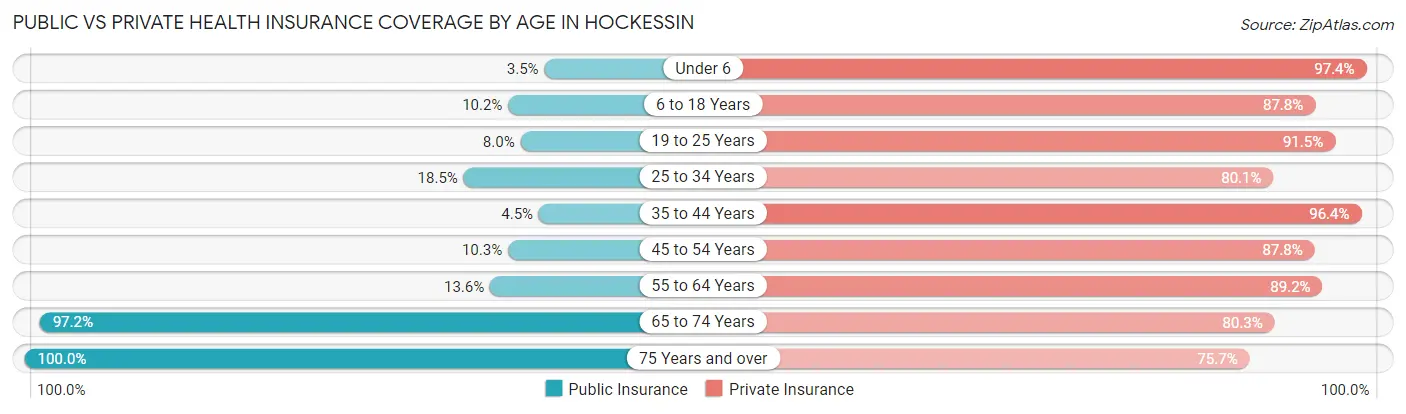
| Age Bracket | Public Insurance | Private Insurance |
| Under 6 | 36 (3.5%) | 995 (97.4%) |
| 6 to 18 Years | 244 (10.2%) | 2,092 (87.8%) |
| 19 to 25 Years | 48 (8.0%) | 552 (91.5%) |
| 25 to 34 Years | 182 (18.5%) | 788 (80.1%) |
| 35 to 44 Years | 86 (4.5%) | 1,831 (96.4%) |
| 45 to 54 Years | 189 (10.3%) | 1,613 (87.8%) |
| 55 to 64 Years | 248 (13.6%) | 1,627 (89.2%) |
| 65 to 74 Years | 1,828 (97.2%) | 1,511 (80.3%) |
| 75 Years and over | 1,077 (100.0%) | 815 (75.7%) |
| Total | 3,938 (29.1%) | 11,824 (87.5%) |
Disability Status by Sex by Age in Hockessin
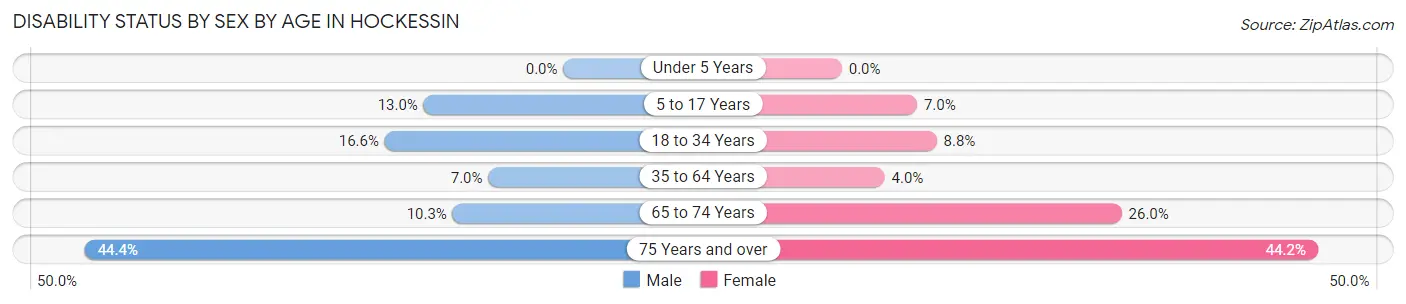
| Age Bracket | Male | Female |
| Under 5 Years | 0 (0.0%) | 0 (0.0%) |
| 5 to 17 Years | 135 (13.0%) | 90 (7.0%) |
| 18 to 34 Years | 119 (16.6%) | 89 (8.8%) |
| 35 to 64 Years | 187 (7.0%) | 114 (4.0%) |
| 65 to 74 Years | 103 (10.3%) | 228 (26.0%) |
| 75 Years and over | 223 (44.4%) | 254 (44.2%) |
Disability Class by Sex by Age in Hockessin
Disability Class: Hearing Difficulty
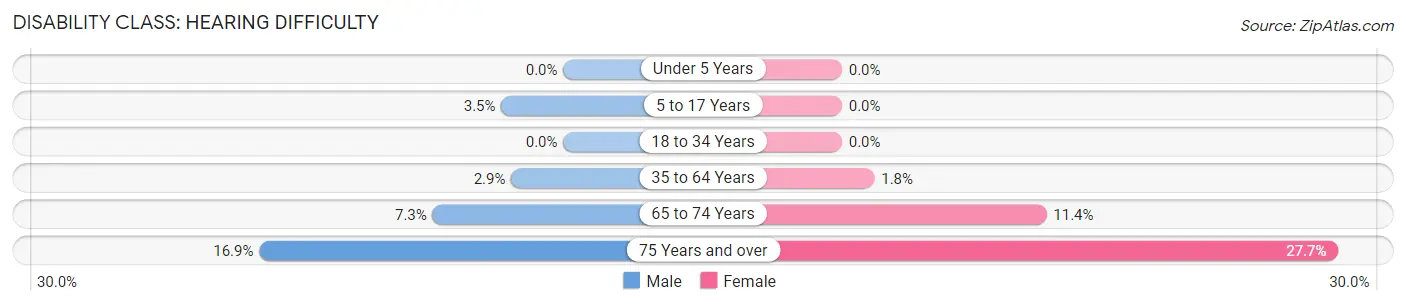
| Age Bracket | Male | Female |
| Under 5 Years | 0 (0.0%) | 0 (0.0%) |
| 5 to 17 Years | 36 (3.5%) | 0 (0.0%) |
| 18 to 34 Years | 0 (0.0%) | 0 (0.0%) |
| 35 to 64 Years | 78 (2.9%) | 52 (1.8%) |
| 65 to 74 Years | 73 (7.3%) | 100 (11.4%) |
| 75 Years and over | 85 (16.9%) | 159 (27.7%) |
Disability Class: Vision Difficulty
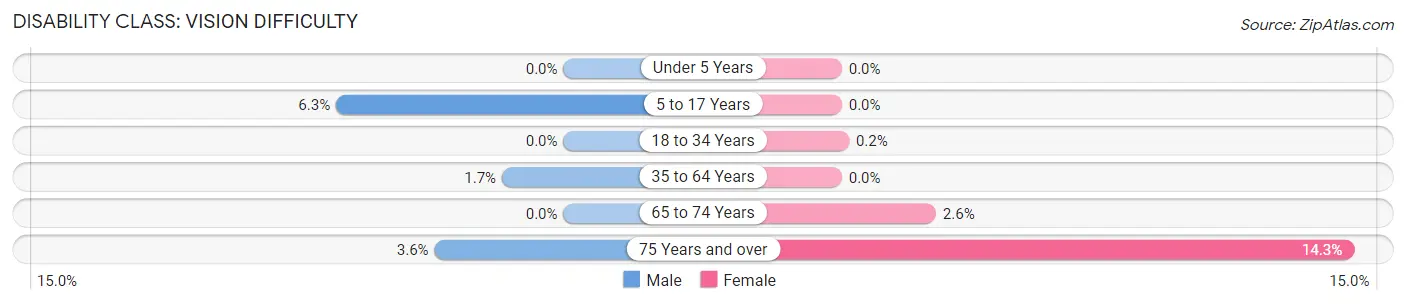
| Age Bracket | Male | Female |
| Under 5 Years | 0 (0.0%) | 0 (0.0%) |
| 5 to 17 Years | 66 (6.3%) | 0 (0.0%) |
| 18 to 34 Years | 0 (0.0%) | 2 (0.2%) |
| 35 to 64 Years | 46 (1.7%) | 0 (0.0%) |
| 65 to 74 Years | 0 (0.0%) | 23 (2.6%) |
| 75 Years and over | 18 (3.6%) | 82 (14.3%) |
Disability Class: Cognitive Difficulty
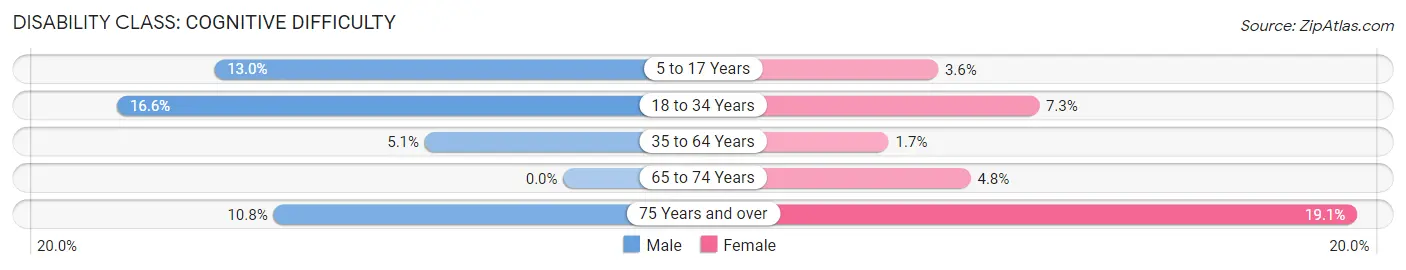
| Age Bracket | Male | Female |
| 5 to 17 Years | 135 (13.0%) | 46 (3.6%) |
| 18 to 34 Years | 119 (16.6%) | 74 (7.3%) |
| 35 to 64 Years | 138 (5.1%) | 50 (1.7%) |
| 65 to 74 Years | 0 (0.0%) | 42 (4.8%) |
| 75 Years and over | 54 (10.8%) | 110 (19.1%) |
Disability Class: Ambulatory Difficulty
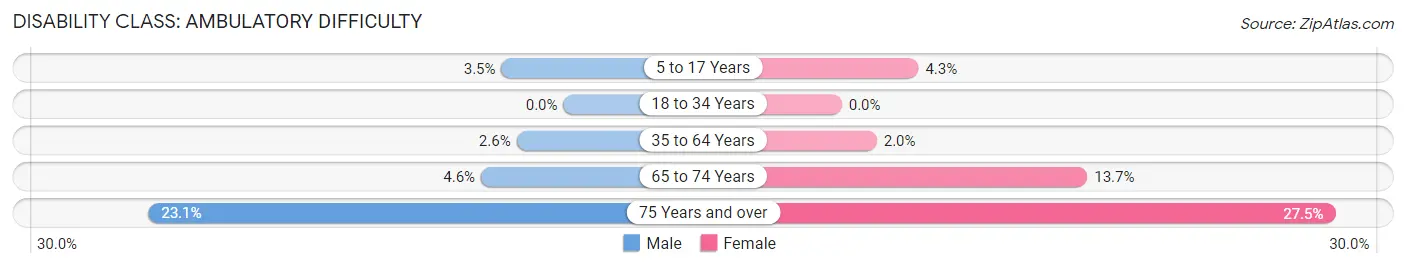
| Age Bracket | Male | Female |
| 5 to 17 Years | 36 (3.5%) | 55 (4.3%) |
| 18 to 34 Years | 0 (0.0%) | 0 (0.0%) |
| 35 to 64 Years | 70 (2.6%) | 56 (1.9%) |
| 65 to 74 Years | 46 (4.6%) | 120 (13.7%) |
| 75 Years and over | 116 (23.1%) | 158 (27.5%) |
Disability Class: Self-Care Difficulty
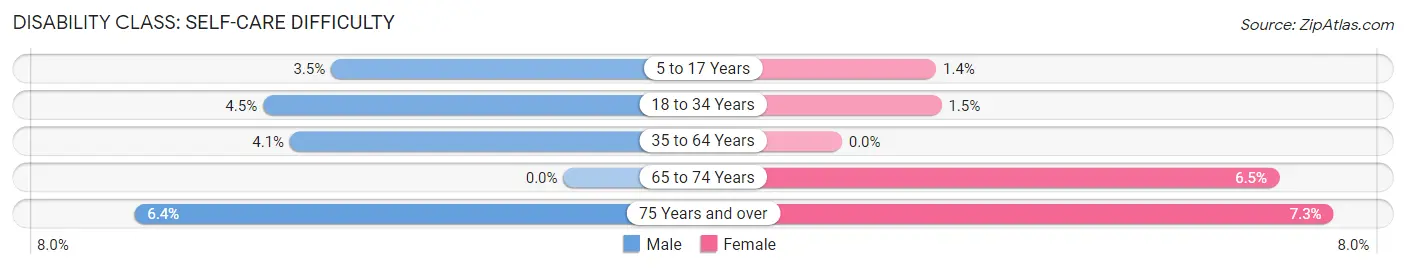
| Age Bracket | Male | Female |
| 5 to 17 Years | 36 (3.5%) | 18 (1.4%) |
| 18 to 34 Years | 32 (4.5%) | 15 (1.5%) |
| 35 to 64 Years | 109 (4.1%) | 0 (0.0%) |
| 65 to 74 Years | 0 (0.0%) | 57 (6.5%) |
| 75 Years and over | 32 (6.4%) | 42 (7.3%) |
Technology Access in Hockessin
Computing Device Access in Hockessin
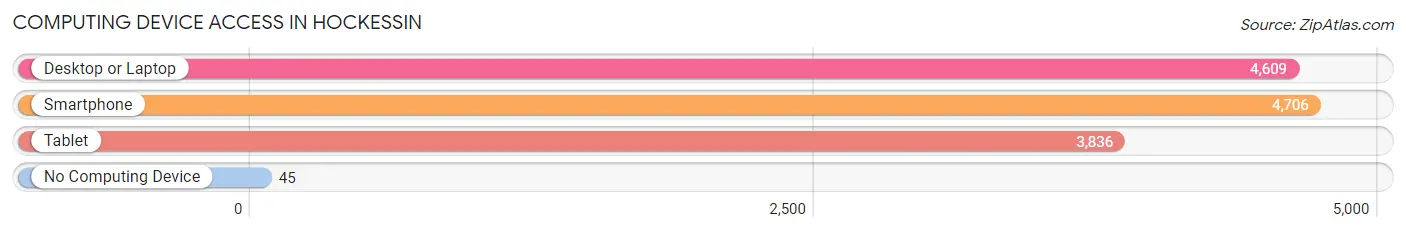
| Device Type | # Households | % Households |
| Desktop or Laptop | 4,609 | 93.4% |
| Smartphone | 4,706 | 95.3% |
| Tablet | 3,836 | 77.7% |
| No Computing Device | 45 | 0.9% |
| Total | 4,937 | 100.0% |
Internet Access in Hockessin
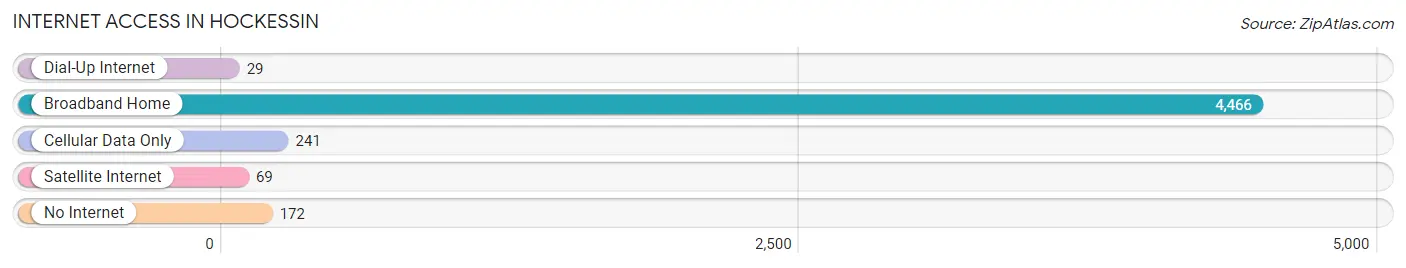
| Internet Type | # Households | % Households |
| Dial-Up Internet | 29 | 0.6% |
| Broadband Home | 4,466 | 90.5% |
| Cellular Data Only | 241 | 4.9% |
| Satellite Internet | 69 | 1.4% |
| No Internet | 172 | 3.5% |
| Total | 4,937 | 100.0% |
Hockessin Summary
Hockessin is a small unincorporated community located in New Castle County, Delaware. It is situated in the northern part of the state, approximately 15 miles southwest of Wilmington. The community is bordered by the Red Clay Creek to the north, the Brandywine Creek to the east, and the White Clay Creek to the south.
History
Hockessin was first settled in the late 17th century by Dutch and Swedish immigrants. The area was originally known as "Hockessin Corner" and was part of a larger tract of land known as "Hockessin Hundred". The name "Hockessin" is derived from the Lenape Indian word "Hockessink", which means "place of the hogs".
The area was primarily agricultural until the early 20th century, when it began to develop into a suburban community. The first post office was established in 1883, and the first school was built in 1885. The community was officially incorporated in 1921.
Geography
Hockessin is located in northern New Castle County, Delaware. It is situated in the Piedmont region of the state, approximately 15 miles southwest of Wilmington. The community is bordered by the Red Clay Creek to the north, the Brandywine Creek to the east, and the White Clay Creek to the south.
The terrain of Hockessin is mostly flat, with some rolling hills. The climate is humid subtropical, with hot, humid summers and mild winters.
Economy
The economy of Hockessin is largely based on the service industry. The community is home to a variety of retail stores, restaurants, and other businesses. It is also home to several corporate offices, including those of AstraZeneca, DuPont, and JPMorgan Chase.
Demographics
As of the 2010 census, the population of Hockessin was 8,541. The racial makeup of the community was 87.3% White, 6.2% African American, 0.7% Native American, 2.3% Asian, and 3.5% from other races. The median household income was $90,945, and the median family income was $103,945.
Hockessin is served by the Red Clay Consolidated School District. The community is home to several private schools, including the Hockessin Montessori School and the Hockessin Christian Academy.
Common Questions
What is Per Capita Income in Hockessin?
Per Capita income in Hockessin is $74,299.
What is the Median Family Income in Hockessin?
Median Family Income in Hockessin is $182,608.
What is the Median Household income in Hockessin?
Median Household Income in Hockessin is $164,848.
What is Income or Wage Gap in Hockessin?
Income or Wage Gap in Hockessin is 36.9%.
Women in Hockessin earn 63.1 cents for every dollar earned by a man.
What is Family Income Deficit in Hockessin?
Family Income Deficit in Hockessin is $9,947.
Families that are below poverty line in Hockessin earn $9,947 less on average than the poverty threshold level.
What is Inequality or Gini Index in Hockessin?
Inequality or Gini Index in Hockessin is 0.42.
What is the Total Population of Hockessin?
Total Population of Hockessin is 13,878.
What is the Total Male Population of Hockessin?
Total Male Population of Hockessin is 6,504.
What is the Total Female Population of Hockessin?
Total Female Population of Hockessin is 7,374.
What is the Ratio of Males per 100 Females in Hockessin?
There are 88.20 Males per 100 Females in Hockessin.
What is the Ratio of Females per 100 Males in Hockessin?
There are 113.38 Females per 100 Males in Hockessin.
What is the Median Population Age in Hockessin?
Median Population Age in Hockessin is 45.1 Years.
What is the Average Family Size in Hockessin
Average Family Size in Hockessin is 3.0 People.
What is the Average Household Size in Hockessin
Average Household Size in Hockessin is 2.7 People.
How Large is the Labor Force in Hockessin?
There are 6,748 People in the Labor Forcein in Hockessin.
What is the Percentage of People in the Labor Force in Hockessin?
61.8% of People are in the Labor Force in Hockessin.
What is the Unemployment Rate in Hockessin?
Unemployment Rate in Hockessin is 4.6%.