Olympia Fields, IL Map & Demographics
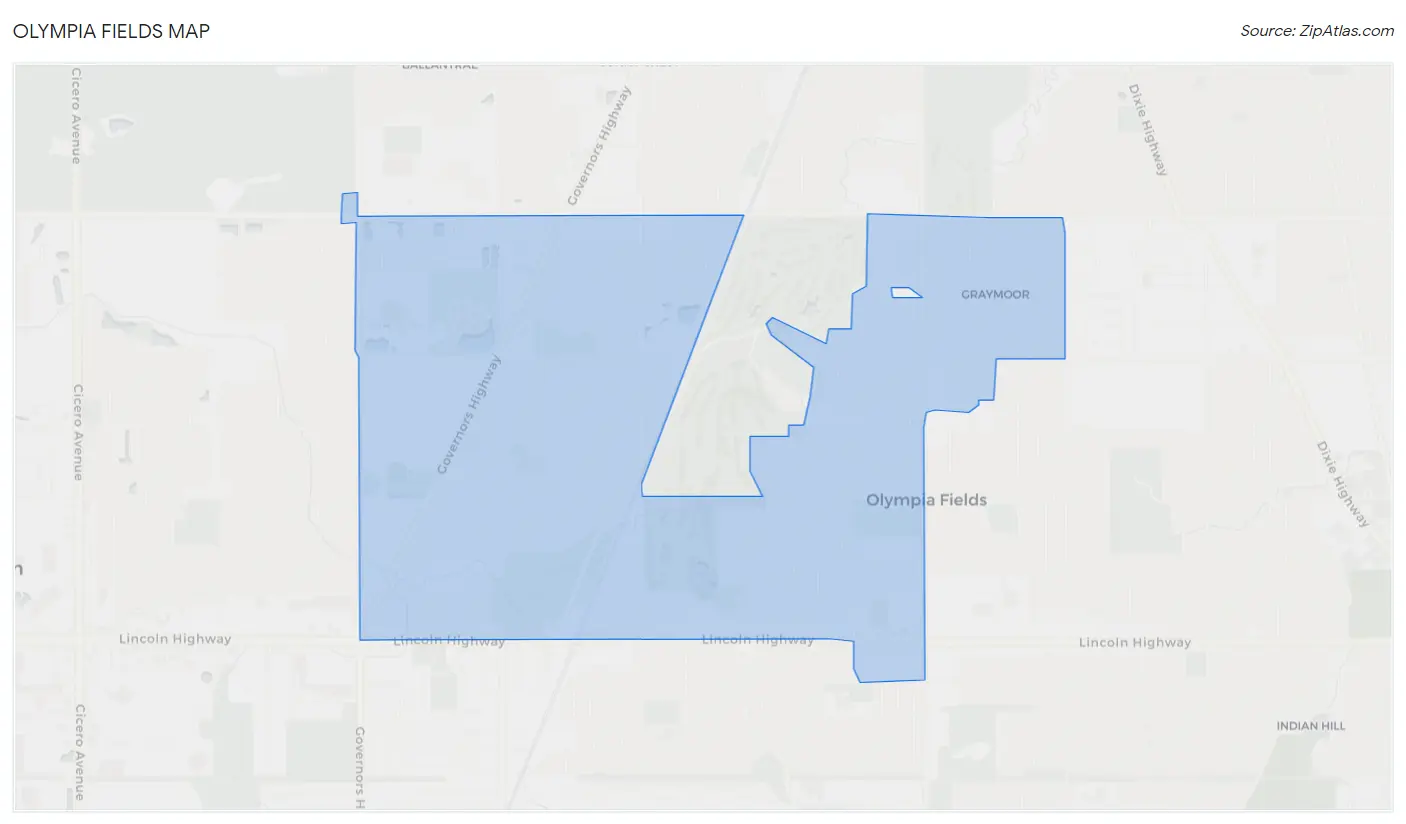
Olympia Fields Map
Olympia Fields Overview
$46,185
PER CAPITA INCOME
$118,381
AVG FAMILY INCOME
$98,659
AVG HOUSEHOLD INCOME
0.2%
WAGE / INCOME GAP [ % ]
99.8¢/ $1
WAGE / INCOME GAP [ $ ]
0.47
INEQUALITY / GINI INDEX
4,922
TOTAL POPULATION
2,122
MALE POPULATION
2,800
FEMALE POPULATION
75.79
MALES / 100 FEMALES
131.95
FEMALES / 100 MALES
40.8
MEDIAN AGE
3.4
AVG FAMILY SIZE
2.6
AVG HOUSEHOLD SIZE
2,328
LABOR FORCE [ PEOPLE ]
59.0%
PERCENT IN LABOR FORCE
10.5%
UNEMPLOYMENT RATE
Olympia Fields Zip Codes
Olympia Fields Area Codes
Income in Olympia Fields
Income Overview in Olympia Fields
Per Capita Income in Olympia Fields is $46,185, while median incomes of families and households are $118,381 and $98,659 respectively.
| Characteristic | Number | Measure |
| Per Capita Income | 4,922 | $46,185 |
| Median Family Income | 1,144 | $118,381 |
| Mean Family Income | 1,144 | $134,082 |
| Median Household Income | 1,856 | $98,659 |
| Mean Household Income | 1,856 | $117,703 |
| Income Deficit | 1,144 | $0 |
| Wage / Income Gap (%) | 4,922 | 0.17% |
| Wage / Income Gap ($) | 4,922 | 99.83¢ per $1 |
| Gini / Inequality Index | 4,922 | 0.47 |
Earnings by Sex in Olympia Fields
Average Earnings in Olympia Fields are $39,625, $39,593 for men and $39,662 for women, a difference of 0.2%.
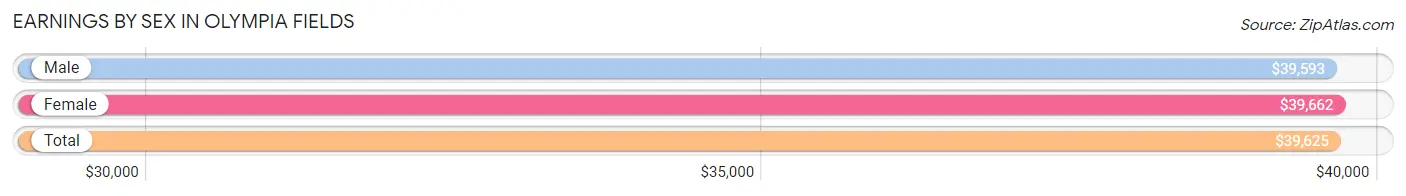
| Sex | Number | Average Earnings |
| Male | 1,200 (51.3%) | $39,593 |
| Female | 1,140 (48.7%) | $39,662 |
| Total | 2,340 (100.0%) | $39,625 |
Earnings by Sex by Income Bracket in Olympia Fields
The most common earnings brackets in Olympia Fields are $100,000+ for men (231 | 19.3%) and $100,000+ for women (205 | 18.0%).
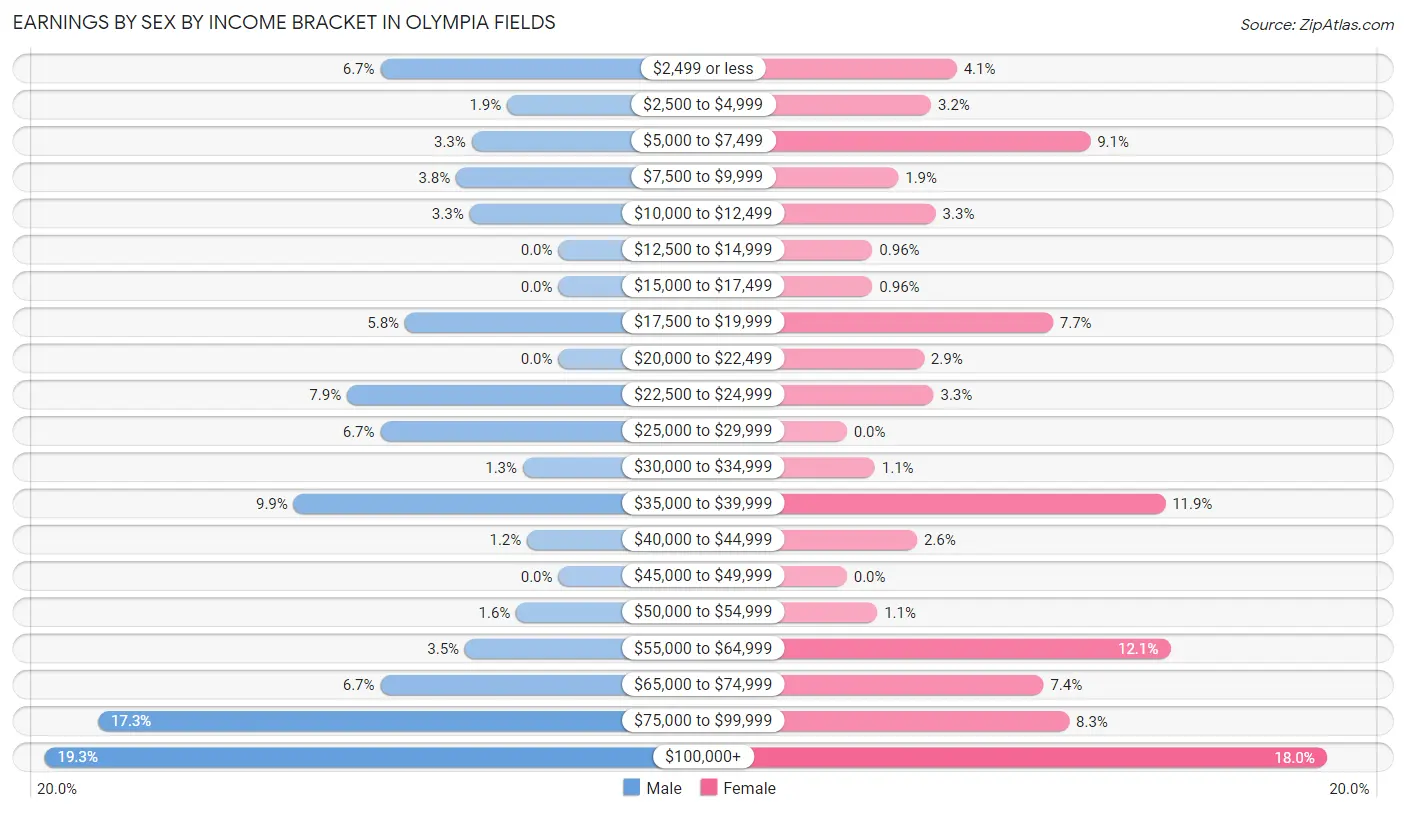
| Income | Male | Female |
| $2,499 or less | 80 (6.7%) | 47 (4.1%) |
| $2,500 to $4,999 | 23 (1.9%) | 36 (3.2%) |
| $5,000 to $7,499 | 39 (3.3%) | 104 (9.1%) |
| $7,500 to $9,999 | 46 (3.8%) | 22 (1.9%) |
| $10,000 to $12,499 | 40 (3.3%) | 38 (3.3%) |
| $12,500 to $14,999 | 0 (0.0%) | 11 (1.0%) |
| $15,000 to $17,499 | 0 (0.0%) | 11 (1.0%) |
| $17,500 to $19,999 | 69 (5.8%) | 88 (7.7%) |
| $20,000 to $22,499 | 0 (0.0%) | 33 (2.9%) |
| $22,500 to $24,999 | 95 (7.9%) | 37 (3.3%) |
| $25,000 to $29,999 | 80 (6.7%) | 0 (0.0%) |
| $30,000 to $34,999 | 16 (1.3%) | 12 (1.1%) |
| $35,000 to $39,999 | 119 (9.9%) | 136 (11.9%) |
| $40,000 to $44,999 | 14 (1.2%) | 30 (2.6%) |
| $45,000 to $49,999 | 0 (0.0%) | 0 (0.0%) |
| $50,000 to $54,999 | 19 (1.6%) | 13 (1.1%) |
| $55,000 to $64,999 | 42 (3.5%) | 138 (12.1%) |
| $65,000 to $74,999 | 80 (6.7%) | 84 (7.4%) |
| $75,000 to $99,999 | 207 (17.2%) | 95 (8.3%) |
| $100,000+ | 231 (19.3%) | 205 (18.0%) |
| Total | 1,200 (100.0%) | 1,140 (100.0%) |
Earnings by Sex by Educational Attainment in Olympia Fields
Average earnings in Olympia Fields are $74,893 for men and $57,714 for women, a difference of 22.9%. Men with an educational attainment of bachelor's degree enjoy the highest average annual earnings of $101,224, while those with less than high school education earn the least with $18,821. Women with an educational attainment of bachelor's degree earn the most with the average annual earnings of $66,836, while those with college or associate's degree education have the smallest earnings of $39,966.
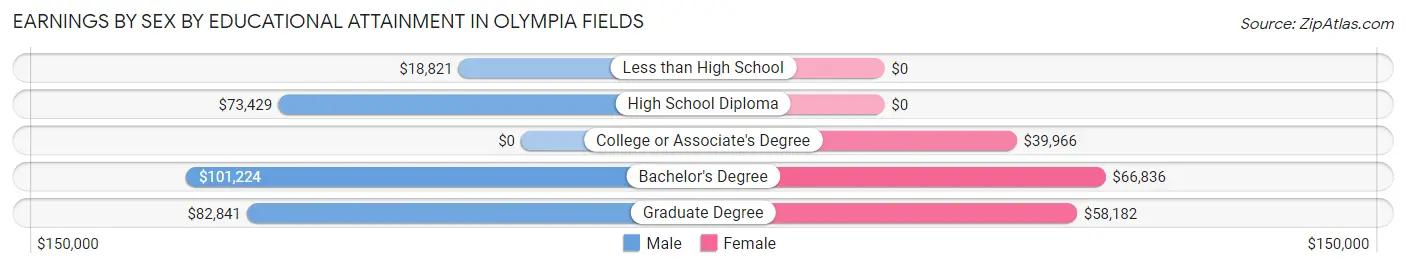
| Educational Attainment | Male Income | Female Income |
| Less than High School | $18,821 | $0 |
| High School Diploma | $73,429 | $0 |
| College or Associate's Degree | - | - |
| Bachelor's Degree | $101,224 | $66,836 |
| Graduate Degree | $82,841 | $58,182 |
| Total | $74,893 | $57,714 |
Family Income in Olympia Fields
Family Income Brackets in Olympia Fields
According to the Olympia Fields family income data, there are 359 families falling into the $100,000 to $149,999 income range, which is the most common income bracket and makes up 31.4% of all families.
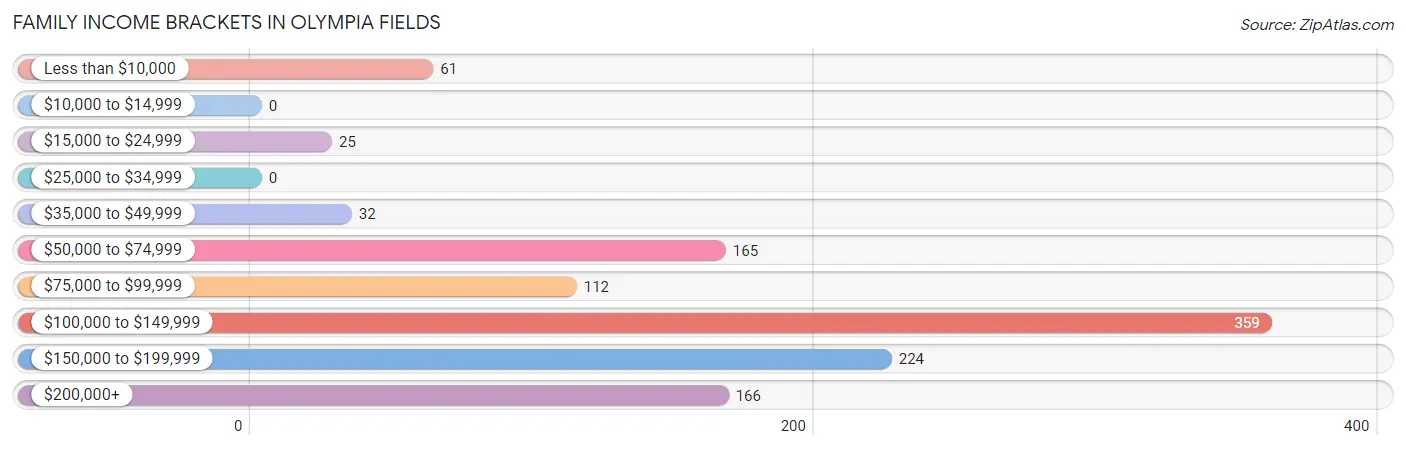
| Income Bracket | # Families | % Families |
| Less than $10,000 | 61 | 5.3% |
| $10,000 to $14,999 | 0 | 0.0% |
| $15,000 to $24,999 | 25 | 2.2% |
| $25,000 to $34,999 | 0 | 0.0% |
| $35,000 to $49,999 | 32 | 2.8% |
| $50,000 to $74,999 | 165 | 14.4% |
| $75,000 to $99,999 | 112 | 9.8% |
| $100,000 to $149,999 | 359 | 31.4% |
| $150,000 to $199,999 | 224 | 19.6% |
| $200,000+ | 166 | 14.5% |
Family Income by Famaliy Size in Olympia Fields
3-person families (140 | 12.2%) account for the highest median family income in Olympia Fields with $139,821 per family, while 2-person families (579 | 50.6%) have the highest median income of $58,768 per family member.
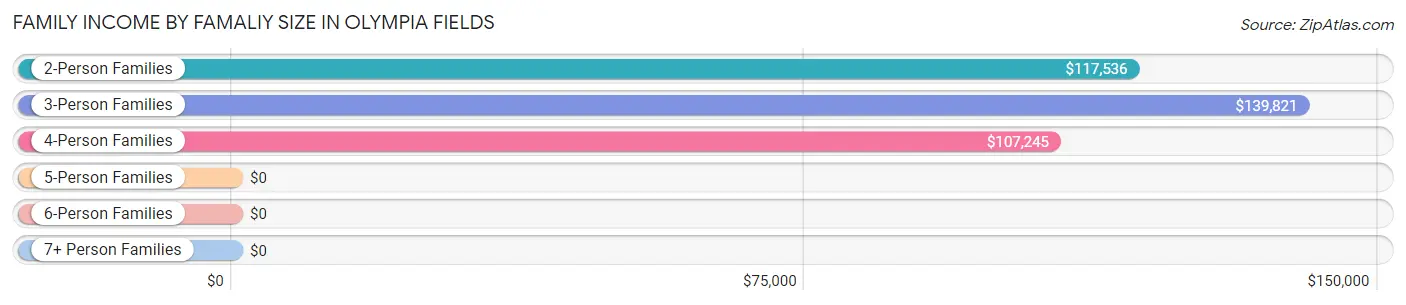
| Income Bracket | # Families | Median Income |
| 2-Person Families | 579 (50.6%) | $117,536 |
| 3-Person Families | 140 (12.2%) | $139,821 |
| 4-Person Families | 294 (25.7%) | $107,245 |
| 5-Person Families | 54 (4.7%) | $0 |
| 6-Person Families | 51 (4.5%) | $0 |
| 7+ Person Families | 26 (2.3%) | $0 |
| Total | 1,144 (100.0%) | $118,381 |
Family Income by Number of Earners in Olympia Fields
The median family income in Olympia Fields is $118,381, with families comprising 3+ earners (184) having the highest median family income of $184,545, while families with no earners (195) have the lowest median family income of $75,189, accounting for 16.1% and 17.1% of families, respectively.
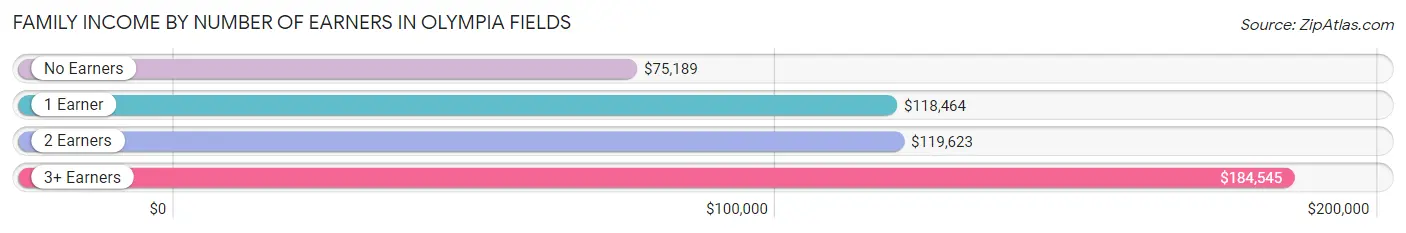
| Number of Earners | # Families | Median Income |
| No Earners | 195 (17.1%) | $75,189 |
| 1 Earner | 347 (30.3%) | $118,464 |
| 2 Earners | 418 (36.5%) | $119,623 |
| 3+ Earners | 184 (16.1%) | $184,545 |
| Total | 1,144 (100.0%) | $118,381 |
Household Income in Olympia Fields
Household Income Brackets in Olympia Fields
With 373 households falling in the category, the $100,000 to $149,999 income range is the most frequent in Olympia Fields, accounting for 20.1% of all households. In contrast, only 11 households (0.6%) fall into the $25,000 to $34,999 income bracket, making it the least populous group.
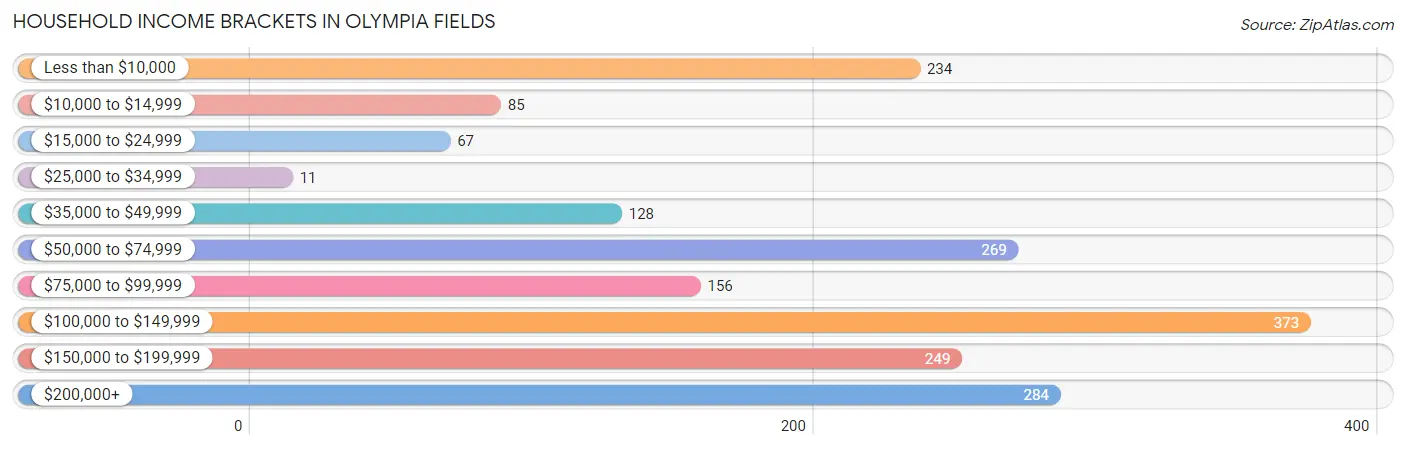
| Income Bracket | # Households | % Households |
| Less than $10,000 | 234 | 12.6% |
| $10,000 to $14,999 | 85 | 4.6% |
| $15,000 to $24,999 | 67 | 3.6% |
| $25,000 to $34,999 | 11 | 0.6% |
| $35,000 to $49,999 | 128 | 6.9% |
| $50,000 to $74,999 | 269 | 14.5% |
| $75,000 to $99,999 | 156 | 8.4% |
| $100,000 to $149,999 | 373 | 20.1% |
| $150,000 to $199,999 | 249 | 13.4% |
| $200,000+ | 284 | 15.3% |
Household Income by Householder Age in Olympia Fields
The median household income in Olympia Fields is $98,659, with the highest median household income of $119,618 found in the 45 to 64 years age bracket for the primary householder. A total of 537 households (28.9%) fall into this category. Meanwhile, the 15 to 24 years age bracket for the primary householder has the lowest median household income of $0, with 27 households (1.5%) in this group.
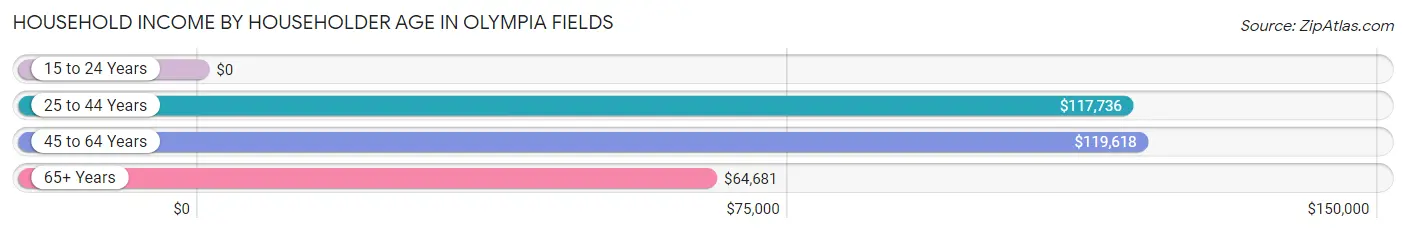
| Income Bracket | # Households | Median Income |
| 15 to 24 Years | 27 (1.5%) | $0 |
| 25 to 44 Years | 356 (19.2%) | $117,736 |
| 45 to 64 Years | 537 (28.9%) | $119,618 |
| 65+ Years | 936 (50.4%) | $64,681 |
| Total | 1,856 (100.0%) | $98,659 |
Poverty in Olympia Fields
Income Below Poverty by Sex and Age in Olympia Fields
With 9.7% poverty level for males and 14.8% for females among the residents of Olympia Fields, 15 year old males and 12 to 14 year old females are the most vulnerable to poverty, with 26 males (48.1%) and 57 females (67.1%) in their respective age groups living below the poverty level.
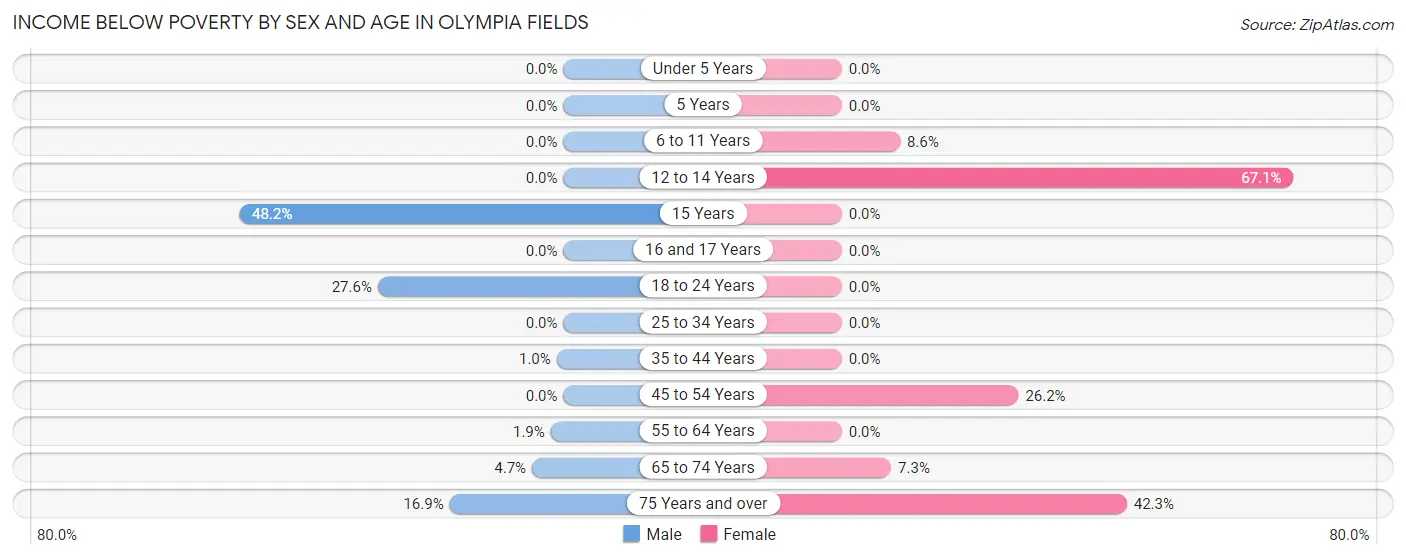
| Age Bracket | Male | Female |
| Under 5 Years | 0 (0.0%) | 0 (0.0%) |
| 5 Years | 0 (0.0%) | 0 (0.0%) |
| 6 to 11 Years | 0 (0.0%) | 21 (8.6%) |
| 12 to 14 Years | 0 (0.0%) | 57 (67.1%) |
| 15 Years | 26 (48.1%) | 0 (0.0%) |
| 16 and 17 Years | 0 (0.0%) | 0 (0.0%) |
| 18 to 24 Years | 113 (27.6%) | 0 (0.0%) |
| 25 to 34 Years | 0 (0.0%) | 0 (0.0%) |
| 35 to 44 Years | 2 (1.0%) | 0 (0.0%) |
| 45 to 54 Years | 0 (0.0%) | 96 (26.2%) |
| 55 to 64 Years | 4 (1.9%) | 0 (0.0%) |
| 65 to 74 Years | 12 (4.7%) | 20 (7.3%) |
| 75 Years and over | 46 (16.9%) | 212 (42.3%) |
| Total | 203 (9.7%) | 406 (14.8%) |
Income Above Poverty by Sex and Age in Olympia Fields
According to the poverty statistics in Olympia Fields, males aged 5 years and females aged under 5 years are the age groups that are most secure financially, with 100.0% of males and 100.0% of females in these age groups living above the poverty line.
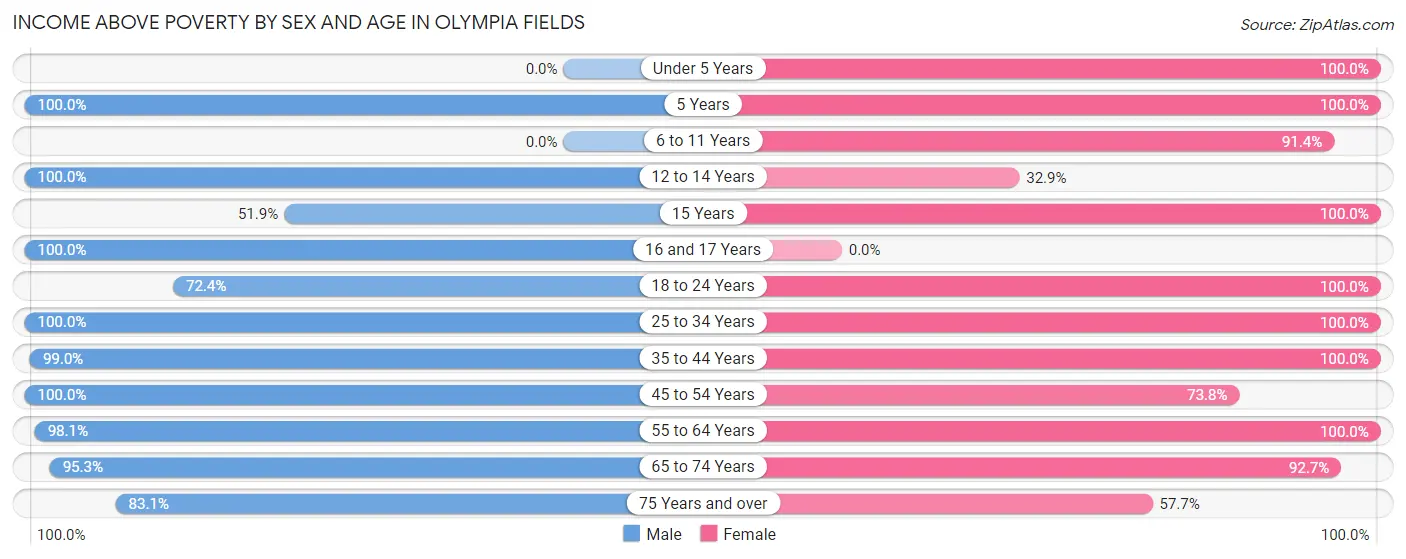
| Age Bracket | Male | Female |
| Under 5 Years | 0 (0.0%) | 211 (100.0%) |
| 5 Years | 15 (100.0%) | 77 (100.0%) |
| 6 to 11 Years | 0 (0.0%) | 222 (91.4%) |
| 12 to 14 Years | 242 (100.0%) | 28 (32.9%) |
| 15 Years | 28 (51.8%) | 22 (100.0%) |
| 16 and 17 Years | 68 (100.0%) | 0 (0.0%) |
| 18 to 24 Years | 297 (72.4%) | 219 (100.0%) |
| 25 to 34 Years | 209 (100.0%) | 204 (100.0%) |
| 35 to 44 Years | 199 (99.0%) | 292 (100.0%) |
| 45 to 54 Years | 153 (100.0%) | 270 (73.8%) |
| 55 to 64 Years | 208 (98.1%) | 251 (100.0%) |
| 65 to 74 Years | 245 (95.3%) | 253 (92.7%) |
| 75 Years and over | 226 (83.1%) | 289 (57.7%) |
| Total | 1,890 (90.3%) | 2,338 (85.2%) |
Income Below Poverty Among Married-Couple Families in Olympia Fields
The poverty statistics for married-couple families in Olympia Fields show that 5.5% or 45 of the total 819 families live below the poverty line. Families with no children have the highest poverty rate of 9.2%, comprising of 45 families. On the other hand, families with 1 or 2 children have the lowest poverty rate of 0.0%, which includes 0 families.
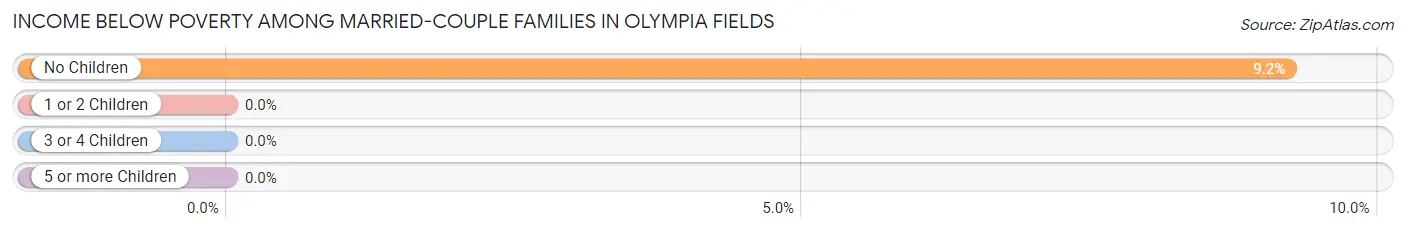
| Children | Above Poverty | Below Poverty |
| No Children | 443 (90.8%) | 45 (9.2%) |
| 1 or 2 Children | 305 (100.0%) | 0 (0.0%) |
| 3 or 4 Children | 26 (100.0%) | 0 (0.0%) |
| 5 or more Children | 0 (0.0%) | 0 (0.0%) |
| Total | 774 (94.5%) | 45 (5.5%) |
Income Below Poverty Among Single-Parent Households in Olympia Fields
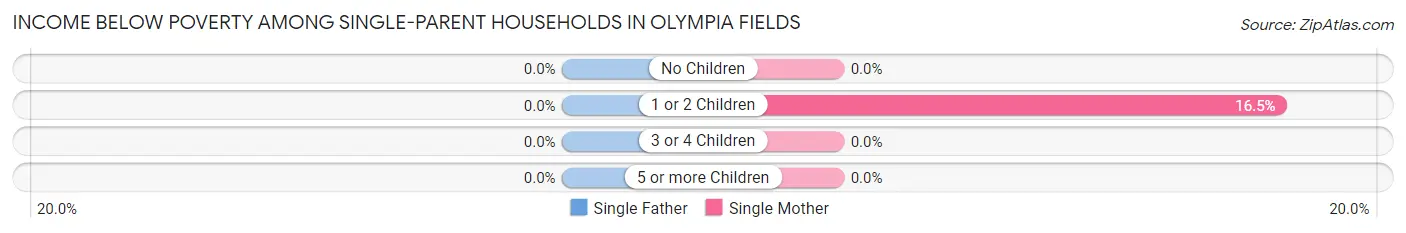
| Children | Single Father | Single Mother |
| No Children | 0 (0.0%) | 0 (0.0%) |
| 1 or 2 Children | 0 (0.0%) | 41 (16.5%) |
| 3 or 4 Children | 0 (0.0%) | 0 (0.0%) |
| 5 or more Children | 0 (0.0%) | 0 (0.0%) |
| Total | 0 (0.0%) | 41 (12.7%) |
Income Below Poverty Among Married-Couple vs Single-Parent Households in Olympia Fields
The poverty data for Olympia Fields shows that 45 of the married-couple family households (5.5%) and 41 of the single-parent households (12.6%) are living below the poverty level. Within the married-couple family households, those with no children have the highest poverty rate, with 45 households (9.2%) falling below the poverty line. Among the single-parent households, those with 1 or 2 children have the highest poverty rate, with 41 household (16.5%) living below poverty.
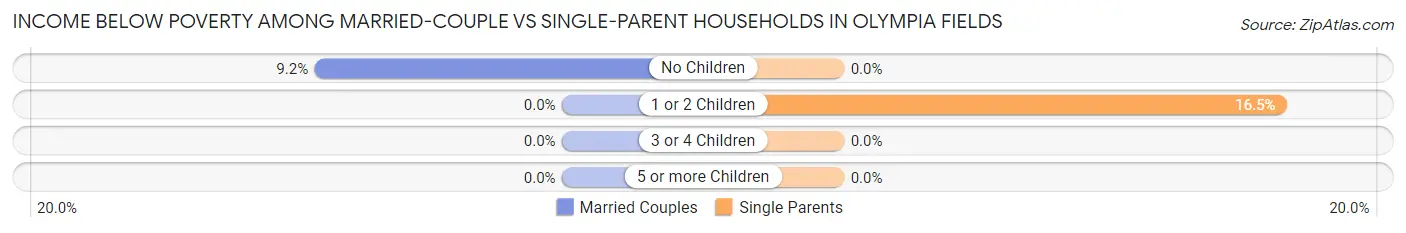
| Children | Married-Couple Families | Single-Parent Households |
| No Children | 45 (9.2%) | 0 (0.0%) |
| 1 or 2 Children | 0 (0.0%) | 41 (16.5%) |
| 3 or 4 Children | 0 (0.0%) | 0 (0.0%) |
| 5 or more Children | 0 (0.0%) | 0 (0.0%) |
| Total | 45 (5.5%) | 41 (12.6%) |
Race in Olympia Fields
The most populous races in Olympia Fields are Black / African American (3,899 | 79.2%), White / Caucasian (770 | 15.6%), and Asian (159 | 3.2%).
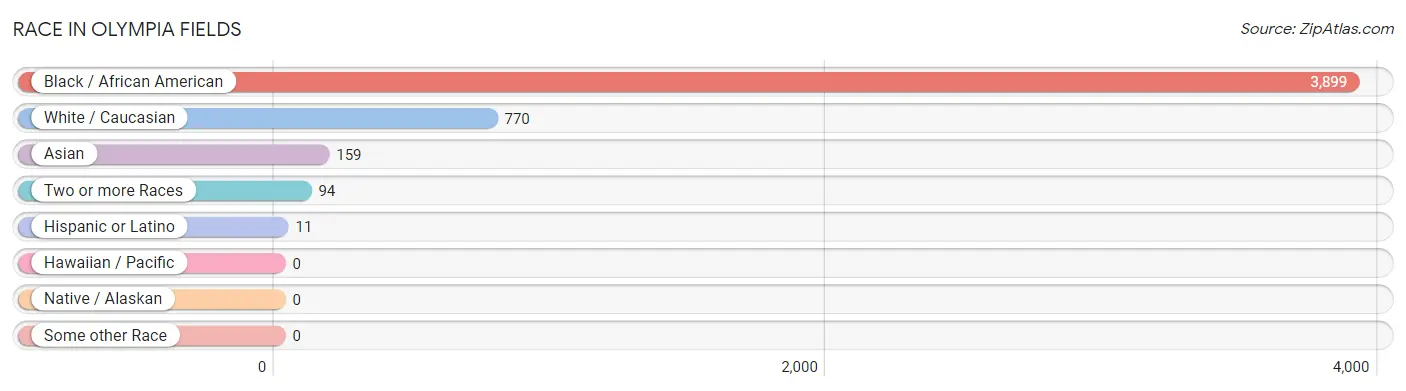
| Race | # Population | % Population |
| Asian | 159 | 3.2% |
| Black / African American | 3,899 | 79.2% |
| Hawaiian / Pacific | 0 | 0.0% |
| Hispanic or Latino | 11 | 0.2% |
| Native / Alaskan | 0 | 0.0% |
| White / Caucasian | 770 | 15.6% |
| Two or more Races | 94 | 1.9% |
| Some other Race | 0 | 0.0% |
| Total | 4,922 | 100.0% |
Ancestry in Olympia Fields
The most populous ancestries reported in Olympia Fields are German (223 | 4.5%), Irish (200 | 4.1%), English (155 | 3.2%), Subsaharan African (135 | 2.7%), and American (132 | 2.7%), together accounting for 17.2% of all Olympia Fields residents.
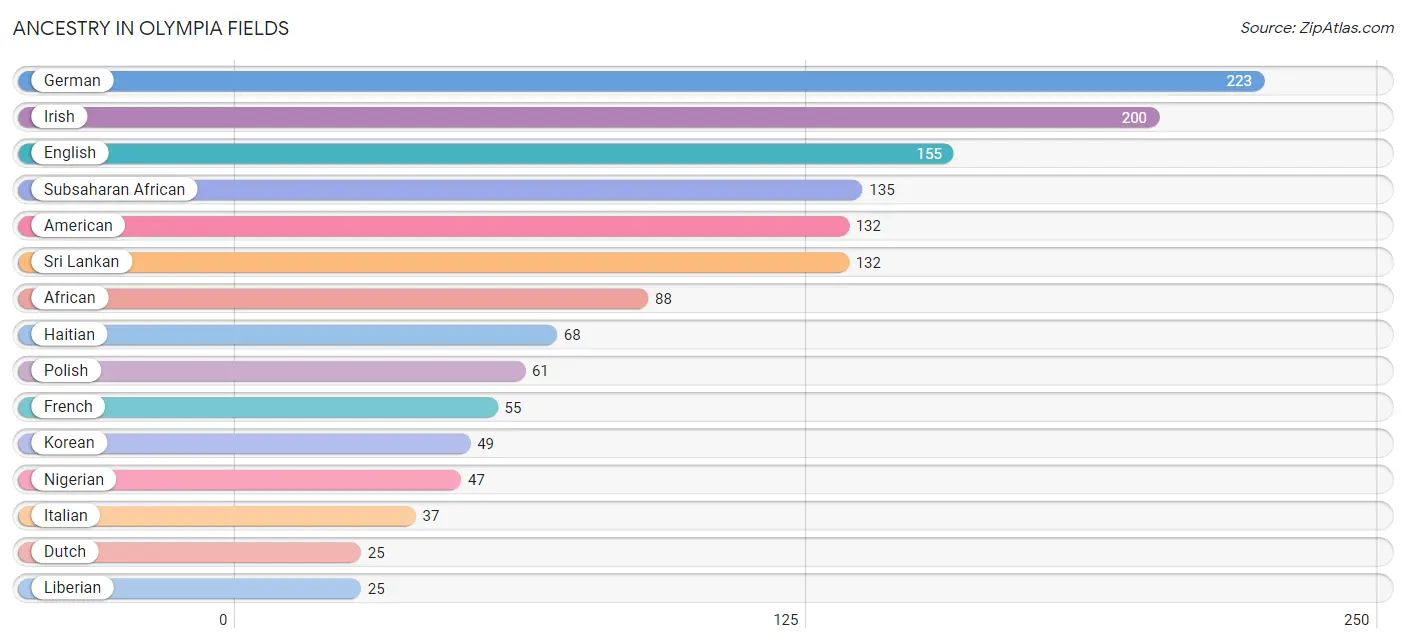
| Ancestry | # Population | % Population |
| African | 88 | 1.8% |
| American | 132 | 2.7% |
| Apache | 9 | 0.2% |
| Brazilian | 10 | 0.2% |
| Croatian | 2 | 0.0% |
| Dutch | 25 | 0.5% |
| English | 155 | 3.2% |
| French | 55 | 1.1% |
| German | 223 | 4.5% |
| Haitian | 68 | 1.4% |
| Hungarian | 8 | 0.2% |
| Irish | 200 | 4.1% |
| Italian | 37 | 0.7% |
| Korean | 49 | 1.0% |
| Liberian | 25 | 0.5% |
| Lithuanian | 11 | 0.2% |
| Maltese | 1 | 0.0% |
| Mexican | 2 | 0.0% |
| Nigerian | 47 | 0.9% |
| Norwegian | 2 | 0.0% |
| Polish | 61 | 1.2% |
| Russian | 8 | 0.2% |
| Scottish | 23 | 0.5% |
| Spaniard | 9 | 0.2% |
| Sri Lankan | 132 | 2.7% |
| Subsaharan African | 135 | 2.7% |
| Swedish | 6 | 0.1% |
| Ugandan | 9 | 0.2% |
| Ukrainian | 11 | 0.2% | View All 29 Rows |
Immigrants in Olympia Fields
The most numerous immigrant groups reported in Olympia Fields came from Asia (132 | 2.7%), South Eastern Asia (67 | 1.4%), Vietnam (67 | 1.4%), India (65 | 1.3%), and South Central Asia (65 | 1.3%), together accounting for 8.0% of all Olympia Fields residents.
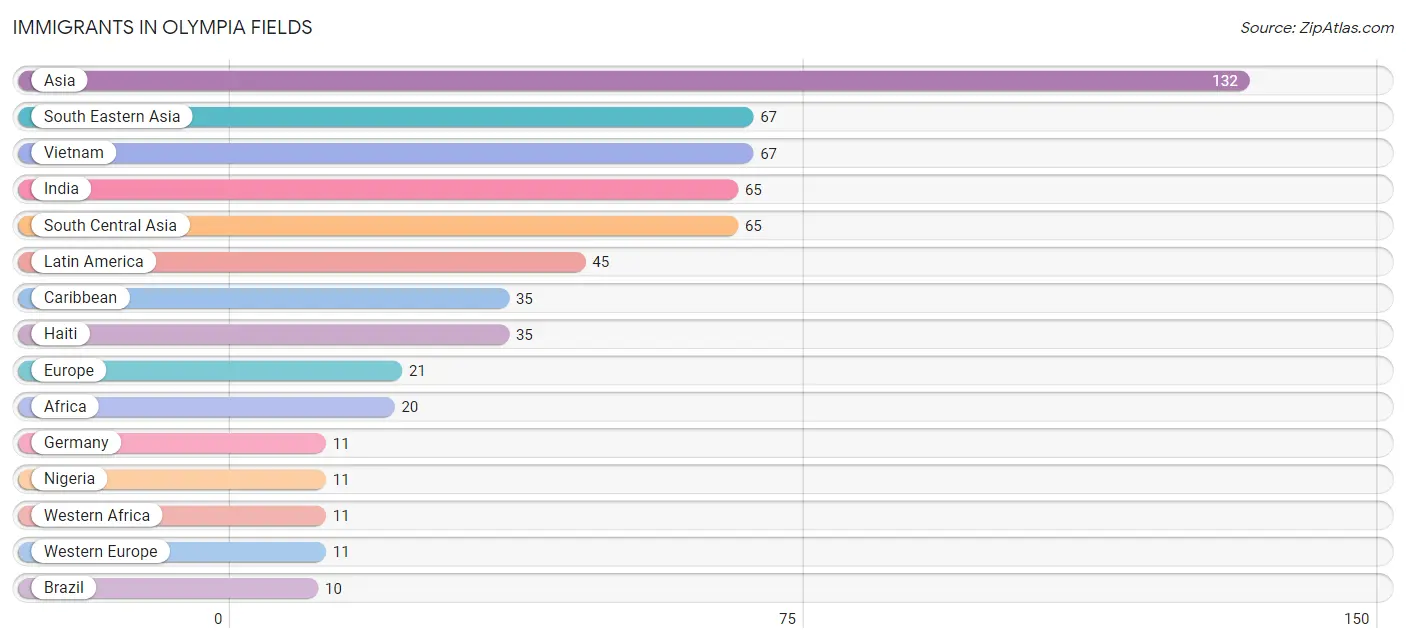
| Immigration Origin | # Population | % Population |
| Africa | 20 | 0.4% |
| Asia | 132 | 2.7% |
| Brazil | 10 | 0.2% |
| Canada | 5 | 0.1% |
| Caribbean | 35 | 0.7% |
| Croatia | 2 | 0.0% |
| Eastern Africa | 9 | 0.2% |
| Eastern Europe | 10 | 0.2% |
| Europe | 21 | 0.4% |
| Germany | 11 | 0.2% |
| Haiti | 35 | 0.7% |
| India | 65 | 1.3% |
| Latin America | 45 | 0.9% |
| Lithuania | 8 | 0.2% |
| Nigeria | 11 | 0.2% |
| South America | 10 | 0.2% |
| South Central Asia | 65 | 1.3% |
| South Eastern Asia | 67 | 1.4% |
| Uganda | 9 | 0.2% |
| Vietnam | 67 | 1.4% |
| Western Africa | 11 | 0.2% |
| Western Europe | 11 | 0.2% | View All 22 Rows |
Sex and Age in Olympia Fields
Sex and Age in Olympia Fields
The most populous age groups in Olympia Fields are 20 to 24 Years (280 | 13.2%) for men and 75 to 79 Years (257 | 9.2%) for women.
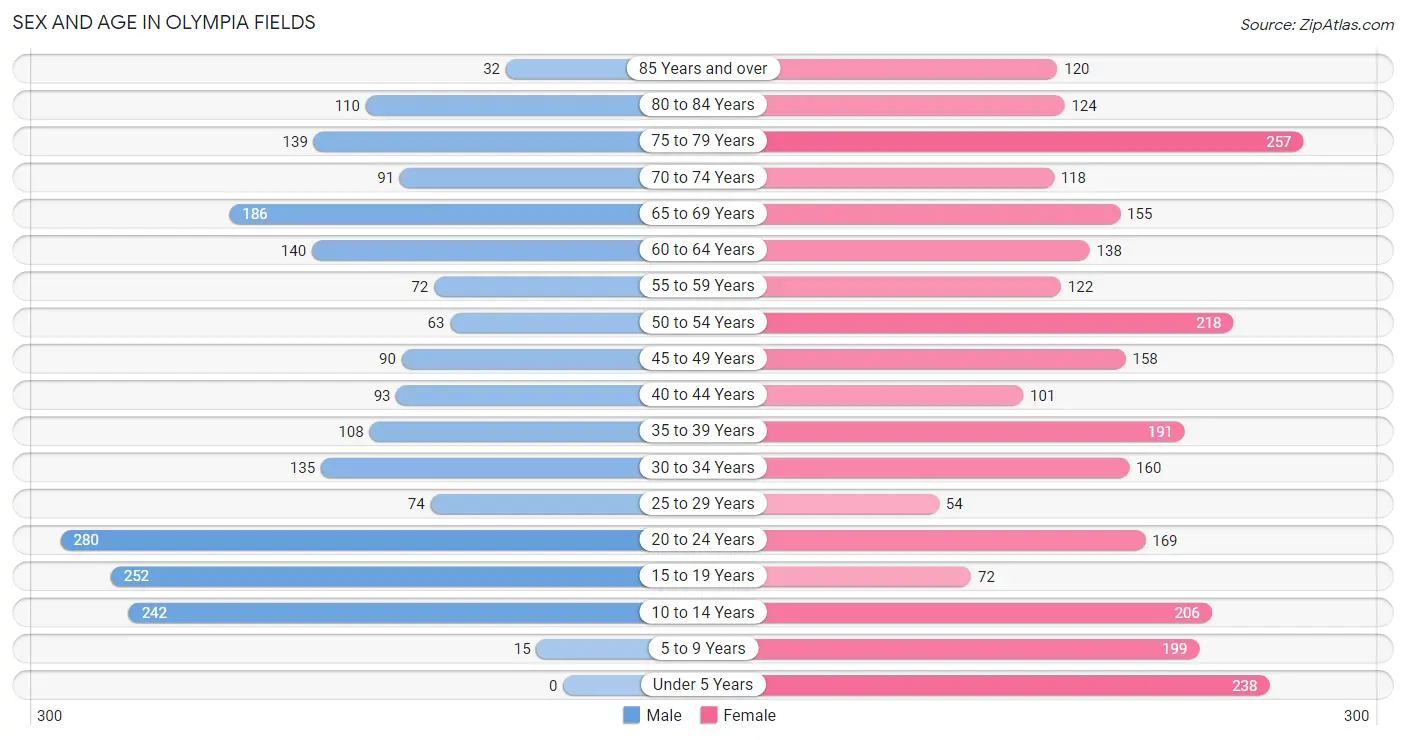
| Age Bracket | Male | Female |
| Under 5 Years | 0 (0.0%) | 238 (8.5%) |
| 5 to 9 Years | 15 (0.7%) | 199 (7.1%) |
| 10 to 14 Years | 242 (11.4%) | 206 (7.4%) |
| 15 to 19 Years | 252 (11.9%) | 72 (2.6%) |
| 20 to 24 Years | 280 (13.2%) | 169 (6.0%) |
| 25 to 29 Years | 74 (3.5%) | 54 (1.9%) |
| 30 to 34 Years | 135 (6.4%) | 160 (5.7%) |
| 35 to 39 Years | 108 (5.1%) | 191 (6.8%) |
| 40 to 44 Years | 93 (4.4%) | 101 (3.6%) |
| 45 to 49 Years | 90 (4.2%) | 158 (5.6%) |
| 50 to 54 Years | 63 (3.0%) | 218 (7.8%) |
| 55 to 59 Years | 72 (3.4%) | 122 (4.4%) |
| 60 to 64 Years | 140 (6.6%) | 138 (4.9%) |
| 65 to 69 Years | 186 (8.8%) | 155 (5.5%) |
| 70 to 74 Years | 91 (4.3%) | 118 (4.2%) |
| 75 to 79 Years | 139 (6.6%) | 257 (9.2%) |
| 80 to 84 Years | 110 (5.2%) | 124 (4.4%) |
| 85 Years and over | 32 (1.5%) | 120 (4.3%) |
| Total | 2,122 (100.0%) | 2,800 (100.0%) |
Families and Households in Olympia Fields
Median Family Size in Olympia Fields
The median family size in Olympia Fields is 3.35 persons per family, with single female/mother families (322 | 28.1%) accounting for the largest median family size of 3.71 persons per family. On the other hand, married-couple families (819 | 71.6%) represent the smallest median family size with 3.20 persons per family.
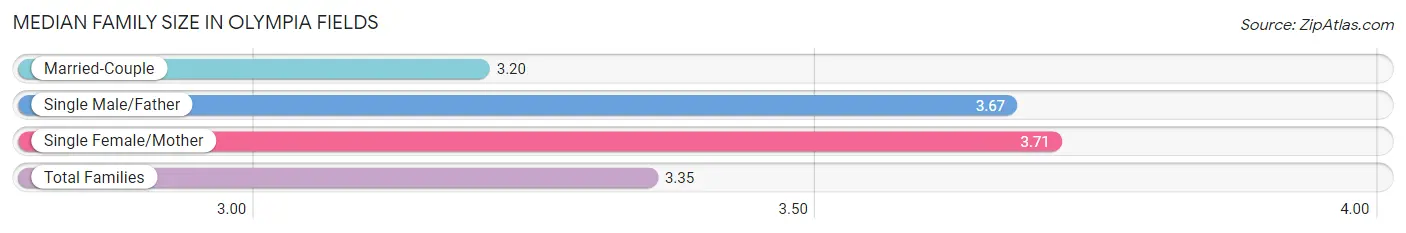
| Family Type | # Families | Family Size |
| Married-Couple | 819 (71.6%) | 3.20 |
| Single Male/Father | 3 (0.3%) | 3.67 |
| Single Female/Mother | 322 (28.1%) | 3.71 |
| Total Families | 1,144 (100.0%) | 3.35 |
Median Household Size in Olympia Fields
The median household size in Olympia Fields is 2.60 persons per household, with single female/mother households (322 | 17.3%) accounting for the largest median household size of 4.27 persons per household. non-family households (712 | 38.4%) represent the smallest median household size with 1.06 persons per household.
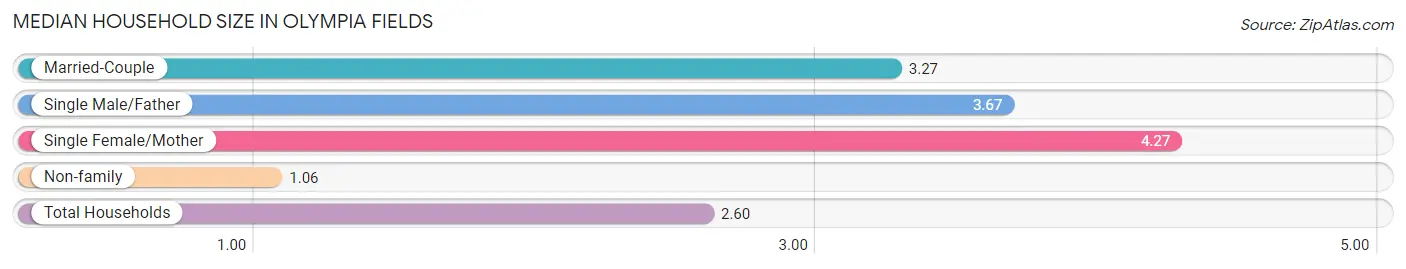
| Household Type | # Households | Household Size |
| Married-Couple | 819 (44.1%) | 3.27 |
| Single Male/Father | 3 (0.2%) | 3.67 |
| Single Female/Mother | 322 (17.3%) | 4.27 |
| Non-family | 712 (38.4%) | 1.06 |
| Total Households | 1,856 (100.0%) | 2.60 |
Household Size by Marriage Status in Olympia Fields
Out of a total of 1,856 households in Olympia Fields, 1,144 (61.6%) are family households, while 712 (38.4%) are nonfamily households. The most numerous type of family households are 2-person households, comprising 489, and the most common type of nonfamily households are 1-person households, comprising 678.
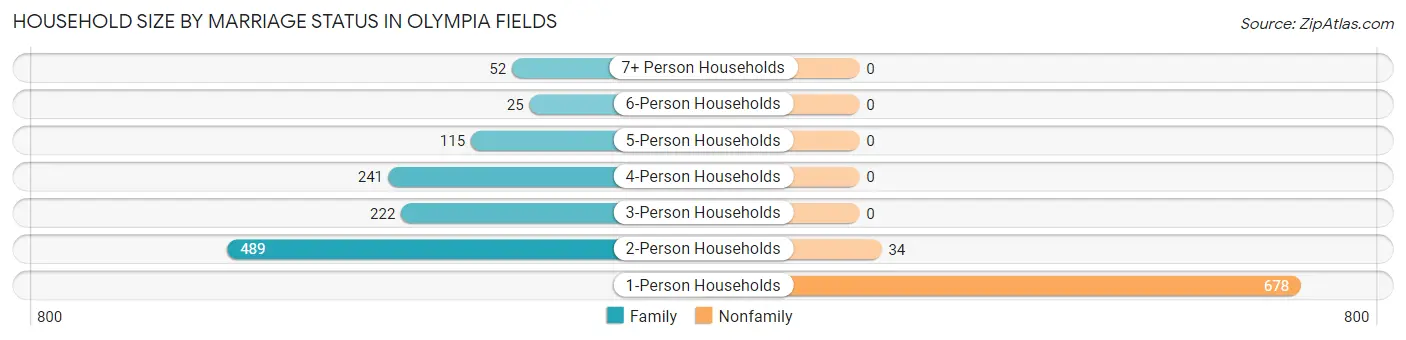
| Household Size | Family Households | Nonfamily Households |
| 1-Person Households | - | 678 (36.5%) |
| 2-Person Households | 489 (26.4%) | 34 (1.8%) |
| 3-Person Households | 222 (12.0%) | 0 (0.0%) |
| 4-Person Households | 241 (13.0%) | 0 (0.0%) |
| 5-Person Households | 115 (6.2%) | 0 (0.0%) |
| 6-Person Households | 25 (1.3%) | 0 (0.0%) |
| 7+ Person Households | 52 (2.8%) | 0 (0.0%) |
| Total | 1,144 (61.6%) | 712 (38.4%) |
Female Fertility in Olympia Fields
Fertility by Age in Olympia Fields
Average fertility rate in Olympia Fields is 67.0 births per 1,000 women. Women in the age bracket of 20 to 34 years have the highest fertility rate with 175.0 births per 1,000 women. Women in the age bracket of 20 to 34 years acount for 100.0% of all women with births.
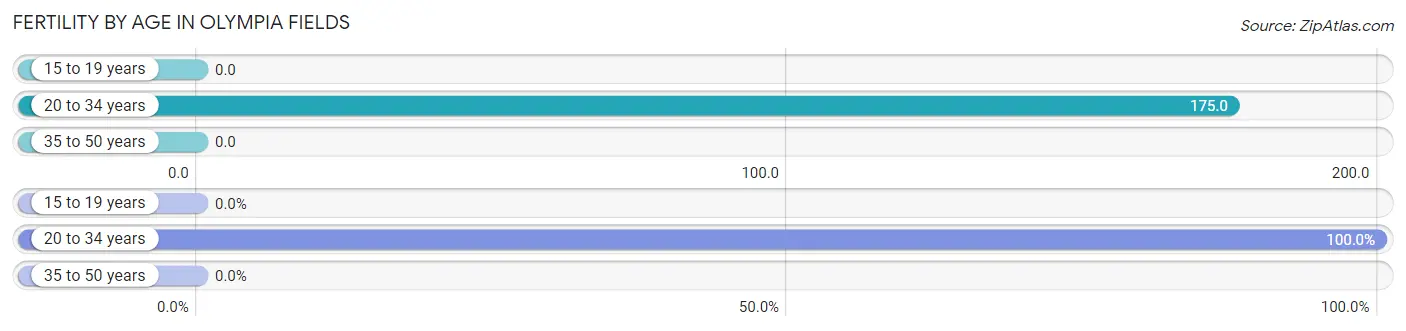
| Age Bracket | Women with Births | Births / 1,000 Women |
| 15 to 19 years | 0 (0.0%) | 0.0 |
| 20 to 34 years | 67 (100.0%) | 175.0 |
| 35 to 50 years | 0 (0.0%) | 0.0 |
| Total | 67 (100.0%) | 67.0 |
Fertility by Age by Marriage Status in Olympia Fields
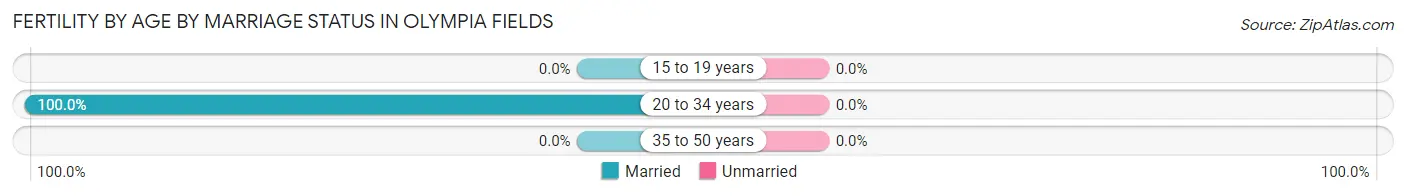
| Age Bracket | Married | Unmarried |
| 15 to 19 years | 0 (0.0%) | 0 (0.0%) |
| 20 to 34 years | 67 (100.0%) | 0 (0.0%) |
| 35 to 50 years | 0 (0.0%) | 0 (0.0%) |
| Total | 67 (100.0%) | 0 (0.0%) |
Fertility by Education in Olympia Fields
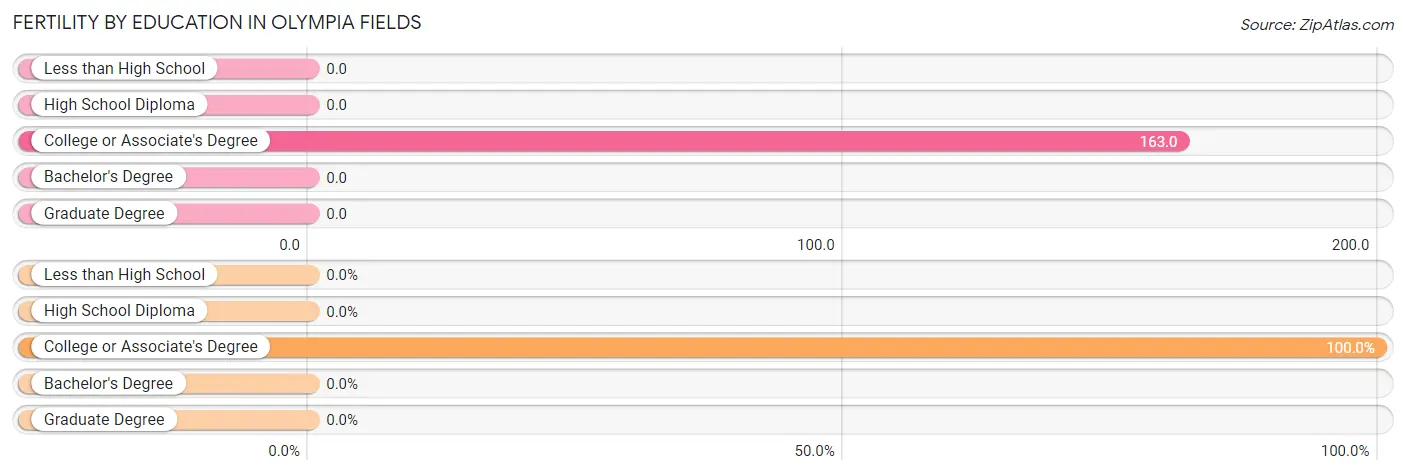
| Educational Attainment | Women with Births | Births / 1,000 Women |
| Less than High School | 0 (0.0%) | 0.0 |
| High School Diploma | 0 (0.0%) | 0.0 |
| College or Associate's Degree | 67 (100.0%) | 163.0 |
| Bachelor's Degree | 0 (0.0%) | 0.0 |
| Graduate Degree | 0 (0.0%) | 0.0 |
| Total | 67 (100.0%) | 67.0 |
Fertility by Education by Marriage Status in Olympia Fields
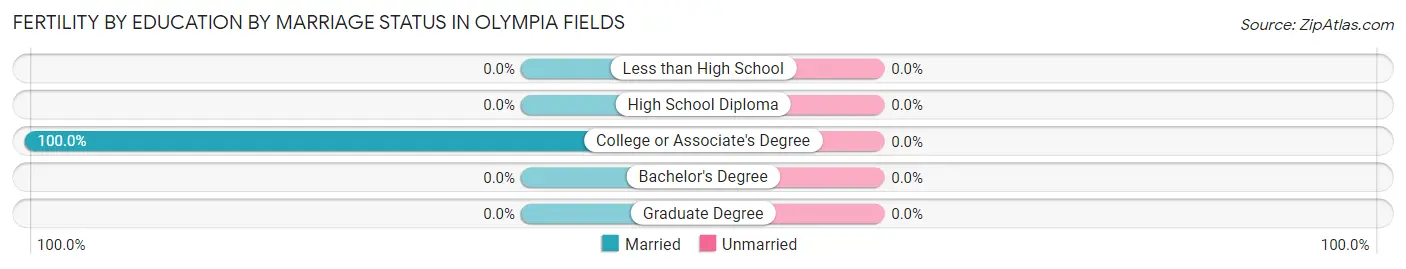
| Educational Attainment | Married | Unmarried |
| Less than High School | 0 (0.0%) | 0 (0.0%) |
| High School Diploma | 0 (0.0%) | 0 (0.0%) |
| College or Associate's Degree | 67 (100.0%) | 0 (0.0%) |
| Bachelor's Degree | 0 (0.0%) | 0 (0.0%) |
| Graduate Degree | 0 (0.0%) | 0 (0.0%) |
| Total | 67 (100.0%) | 0 (0.0%) |
Employment Characteristics in Olympia Fields
Employment by Class of Employer in Olympia Fields
Among the 1,985 employed individuals in Olympia Fields, private company employees (1,062 | 53.5%), not-for-profit organizations (300 | 15.1%), and state government employees (231 | 11.6%) make up the most common classes of employment.
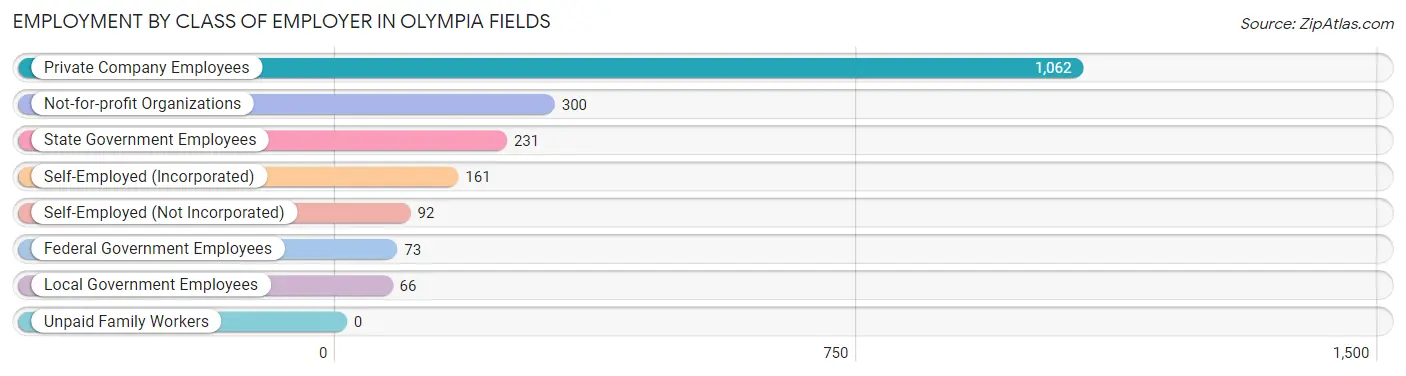
| Employer Class | # Employees | % Employees |
| Private Company Employees | 1,062 | 53.5% |
| Self-Employed (Incorporated) | 161 | 8.1% |
| Self-Employed (Not Incorporated) | 92 | 4.6% |
| Not-for-profit Organizations | 300 | 15.1% |
| Local Government Employees | 66 | 3.3% |
| State Government Employees | 231 | 11.6% |
| Federal Government Employees | 73 | 3.7% |
| Unpaid Family Workers | 0 | 0.0% |
| Total | 1,985 | 100.0% |
Employment Status by Age in Olympia Fields
According to the labor force statistics for Olympia Fields, out of the total population over 16 years of age (3,946), 59.0% or 2,328 individuals are in the labor force, with 10.5% or 244 of them unemployed. The age group with the highest labor force participation rate is 35 to 44 years, with 93.1% or 459 individuals in the labor force. Within the labor force, the 20 to 24 years age range has the highest percentage of unemployed individuals, with 37.5% or 136 of them being unemployed.
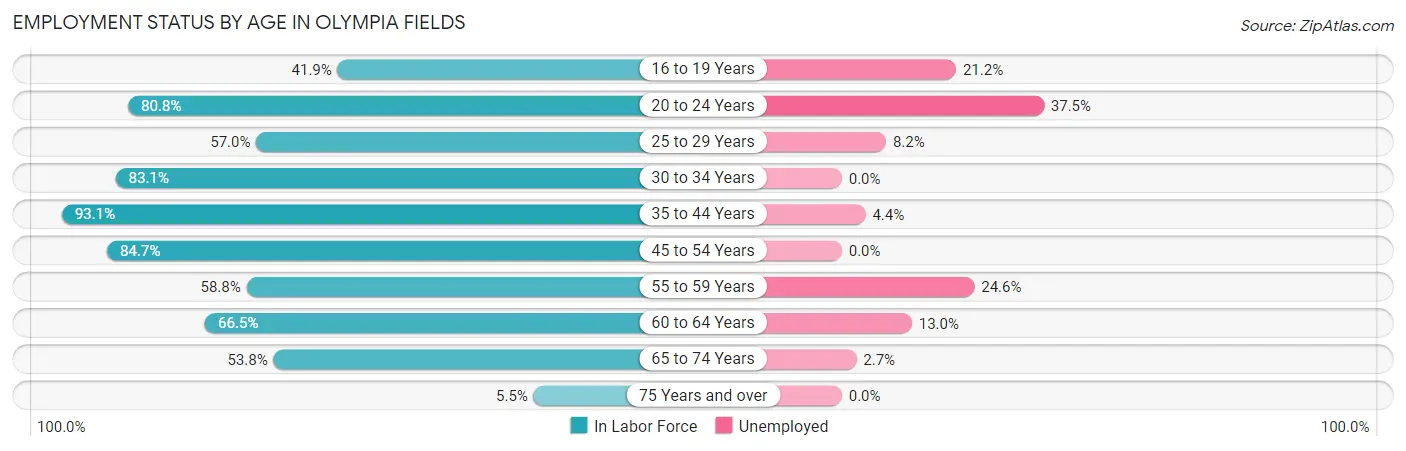
| Age Bracket | In Labor Force | Unemployed |
| 16 to 19 Years | 104 (41.9%) | 22 (21.2%) |
| 20 to 24 Years | 363 (80.8%) | 136 (37.5%) |
| 25 to 29 Years | 73 (57.0%) | 6 (8.2%) |
| 30 to 34 Years | 245 (83.1%) | 0 (0.0%) |
| 35 to 44 Years | 459 (93.1%) | 20 (4.4%) |
| 45 to 54 Years | 448 (84.7%) | 0 (0.0%) |
| 55 to 59 Years | 114 (58.8%) | 28 (24.6%) |
| 60 to 64 Years | 185 (66.5%) | 24 (13.0%) |
| 65 to 74 Years | 296 (53.8%) | 8 (2.7%) |
| 75 Years and over | 43 (5.5%) | 0 (0.0%) |
| Total | 2,328 (59.0%) | 244 (10.5%) |
Employment Status by Educational Attainment in Olympia Fields
According to labor force statistics for Olympia Fields, 79.5% of individuals (1,524) out of the total population between 25 and 64 years of age (1,917) are in the labor force, with 5.1% or 78 of them being unemployed. The group with the highest labor force participation rate are those with the educational attainment of bachelor's degree or higher, with 88.0% or 635 individuals in the labor force. Within the labor force, individuals with less than high school education have the highest percentage of unemployment, with 10.2% or 11 of them being unemployed.
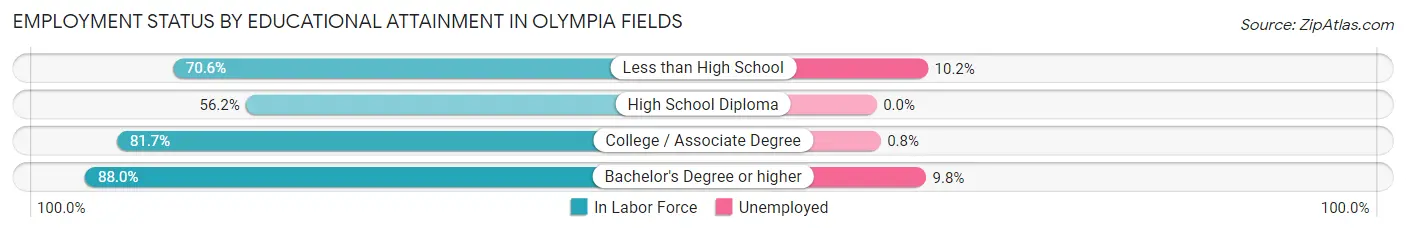
| Educational Attainment | In Labor Force | Unemployed |
| Less than High School | 108 (70.6%) | 16 (10.2%) |
| High School Diploma | 155 (56.2%) | 0 (0.0%) |
| College / Associate Degree | 626 (81.7%) | 6 (0.8%) |
| Bachelor's Degree or higher | 635 (88.0%) | 71 (9.8%) |
| Total | 1,524 (79.5%) | 98 (5.1%) |
Employment Occupations by Sex in Olympia Fields
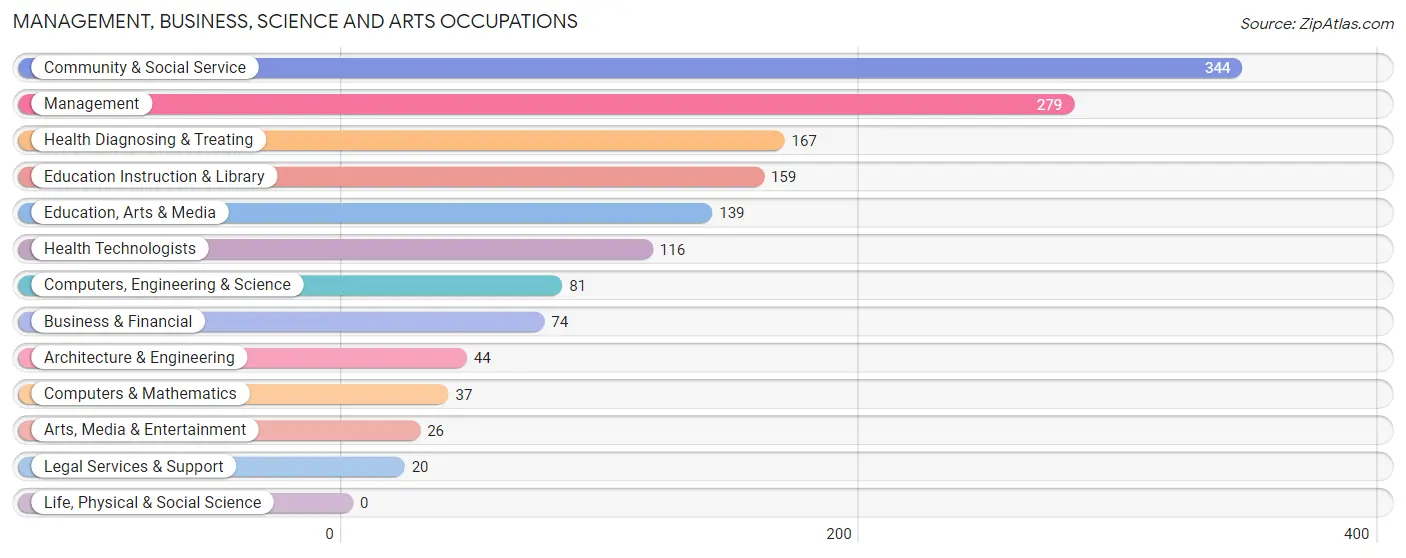
Management, Business, Science and Arts Occupations
The most common Management, Business, Science and Arts occupations in Olympia Fields are Community & Social Service (344 | 16.5%), Management (279 | 13.4%), Health Diagnosing & Treating (167 | 8.0%), Education Instruction & Library (159 | 7.6%), and Education, Arts & Media (139 | 6.7%).
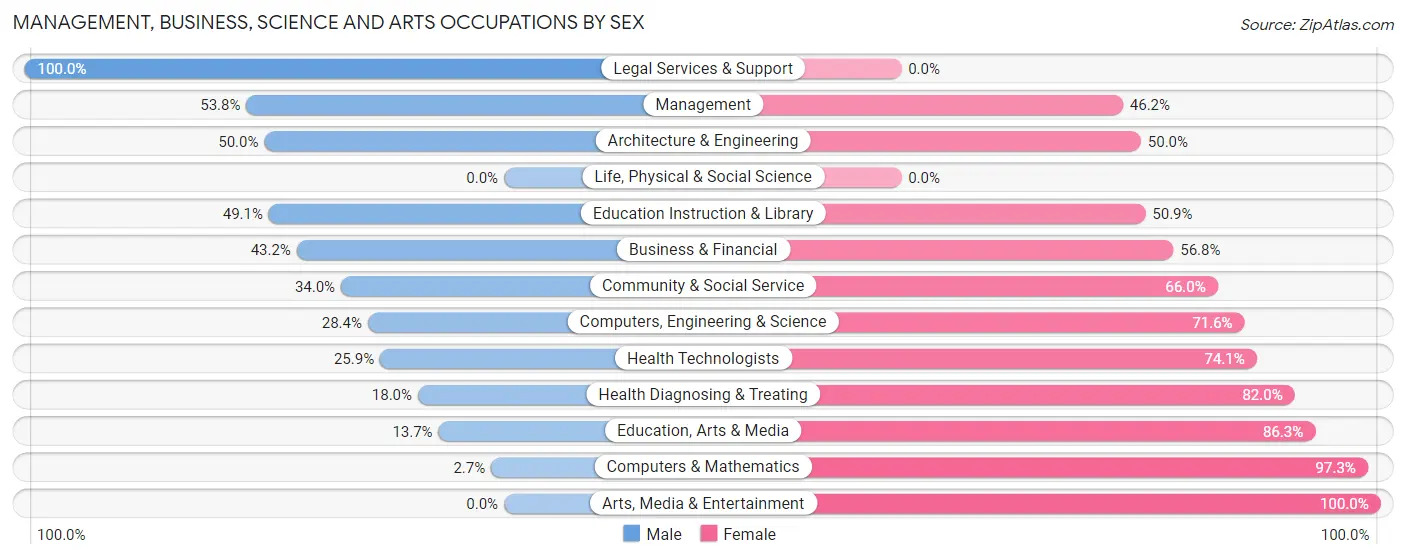
Management, Business, Science and Arts Occupations by Sex
Within the Management, Business, Science and Arts occupations in Olympia Fields, the most male-oriented occupations are Legal Services & Support (100.0%), Management (53.8%), and Architecture & Engineering (50.0%), while the most female-oriented occupations are Arts, Media & Entertainment (100.0%), Computers & Mathematics (97.3%), and Education, Arts & Media (86.3%).
| Occupation | Male | Female |
| Management | 150 (53.8%) | 129 (46.2%) |
| Business & Financial | 32 (43.2%) | 42 (56.8%) |
| Computers, Engineering & Science | 23 (28.4%) | 58 (71.6%) |
| Computers & Mathematics | 1 (2.7%) | 36 (97.3%) |
| Architecture & Engineering | 22 (50.0%) | 22 (50.0%) |
| Life, Physical & Social Science | 0 (0.0%) | 0 (0.0%) |
| Community & Social Service | 117 (34.0%) | 227 (66.0%) |
| Education, Arts & Media | 19 (13.7%) | 120 (86.3%) |
| Legal Services & Support | 20 (100.0%) | 0 (0.0%) |
| Education Instruction & Library | 78 (49.1%) | 81 (50.9%) |
| Arts, Media & Entertainment | 0 (0.0%) | 26 (100.0%) |
| Health Diagnosing & Treating | 30 (18.0%) | 137 (82.0%) |
| Health Technologists | 30 (25.9%) | 86 (74.1%) |
| Total (Category) | 352 (37.2%) | 593 (62.7%) |
| Total (Overall) | 988 (47.4%) | 1,098 (52.6%) |
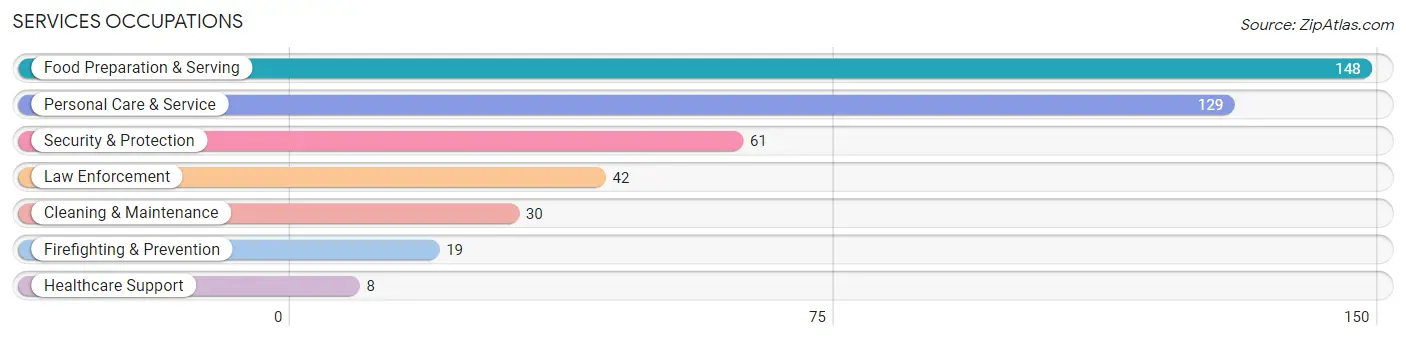
Services Occupations
The most common Services occupations in Olympia Fields are Food Preparation & Serving (148 | 7.1%), Personal Care & Service (129 | 6.2%), Security & Protection (61 | 2.9%), Law Enforcement (42 | 2.0%), and Cleaning & Maintenance (30 | 1.4%).
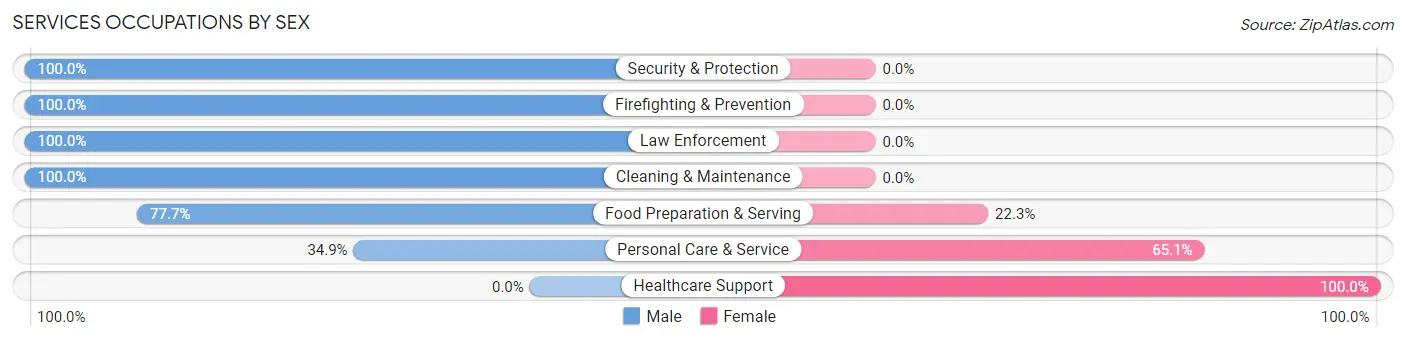
Services Occupations by Sex
Within the Services occupations in Olympia Fields, the most male-oriented occupations are Security & Protection (100.0%), Firefighting & Prevention (100.0%), and Law Enforcement (100.0%), while the most female-oriented occupations are Healthcare Support (100.0%), Personal Care & Service (65.1%), and Food Preparation & Serving (22.3%).
| Occupation | Male | Female |
| Healthcare Support | 0 (0.0%) | 8 (100.0%) |
| Security & Protection | 61 (100.0%) | 0 (0.0%) |
| Firefighting & Prevention | 19 (100.0%) | 0 (0.0%) |
| Law Enforcement | 42 (100.0%) | 0 (0.0%) |
| Food Preparation & Serving | 115 (77.7%) | 33 (22.3%) |
| Cleaning & Maintenance | 30 (100.0%) | 0 (0.0%) |
| Personal Care & Service | 45 (34.9%) | 84 (65.1%) |
| Total (Category) | 251 (66.8%) | 125 (33.2%) |
| Total (Overall) | 988 (47.4%) | 1,098 (52.6%) |
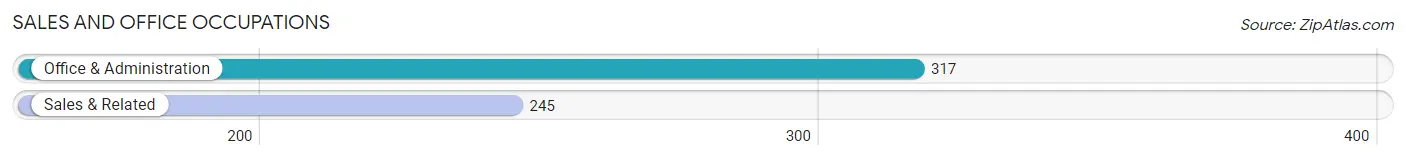
Sales and Office Occupations
The most common Sales and Office occupations in Olympia Fields are Office & Administration (317 | 15.2%), and Sales & Related (245 | 11.7%).
Sales and Office Occupations by Sex
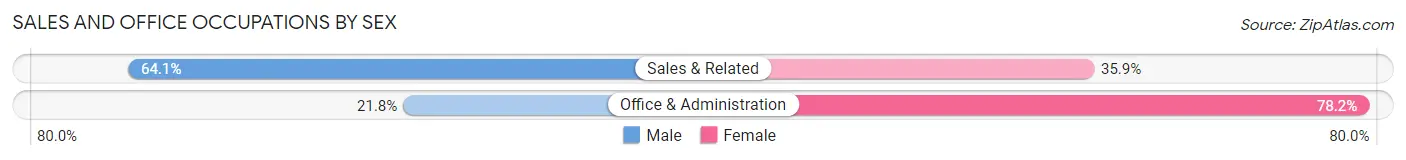
| Occupation | Male | Female |
| Sales & Related | 157 (64.1%) | 88 (35.9%) |
| Office & Administration | 69 (21.8%) | 248 (78.2%) |
| Total (Category) | 226 (40.2%) | 336 (59.8%) |
| Total (Overall) | 988 (47.4%) | 1,098 (52.6%) |
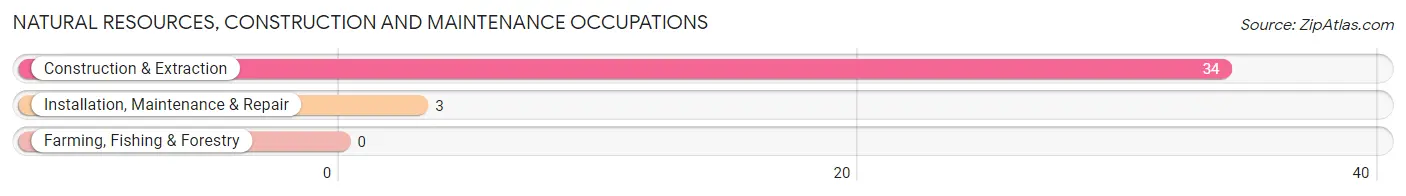
Natural Resources, Construction and Maintenance Occupations
The most common Natural Resources, Construction and Maintenance occupations in Olympia Fields are Construction & Extraction (34 | 1.6%), and Installation, Maintenance & Repair (3 | 0.1%).
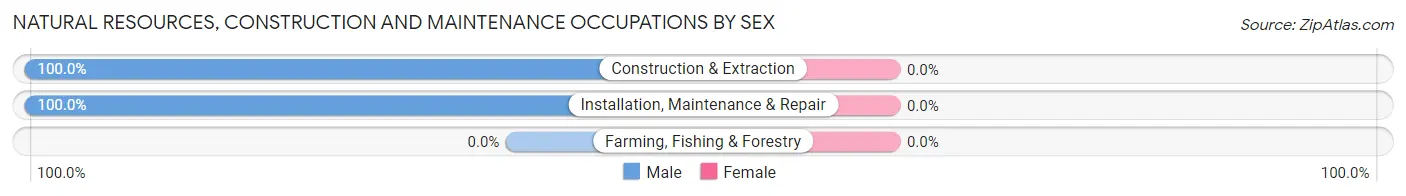
Natural Resources, Construction and Maintenance Occupations by Sex
| Occupation | Male | Female |
| Farming, Fishing & Forestry | 0 (0.0%) | 0 (0.0%) |
| Construction & Extraction | 34 (100.0%) | 0 (0.0%) |
| Installation, Maintenance & Repair | 3 (100.0%) | 0 (0.0%) |
| Total (Category) | 37 (100.0%) | 0 (0.0%) |
| Total (Overall) | 988 (47.4%) | 1,098 (52.6%) |
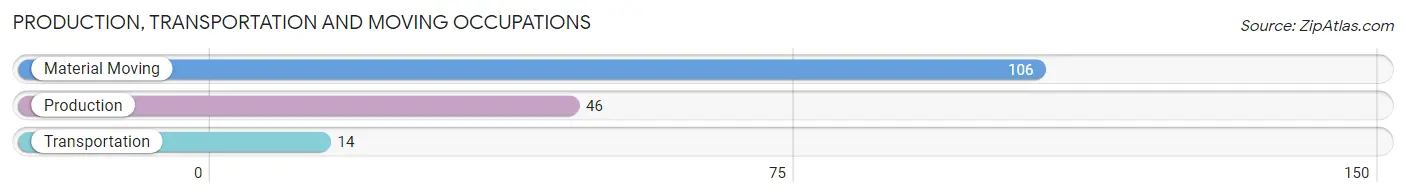
Production, Transportation and Moving Occupations
The most common Production, Transportation and Moving occupations in Olympia Fields are Material Moving (106 | 5.1%), Production (46 | 2.2%), and Transportation (14 | 0.7%).
Production, Transportation and Moving Occupations by Sex
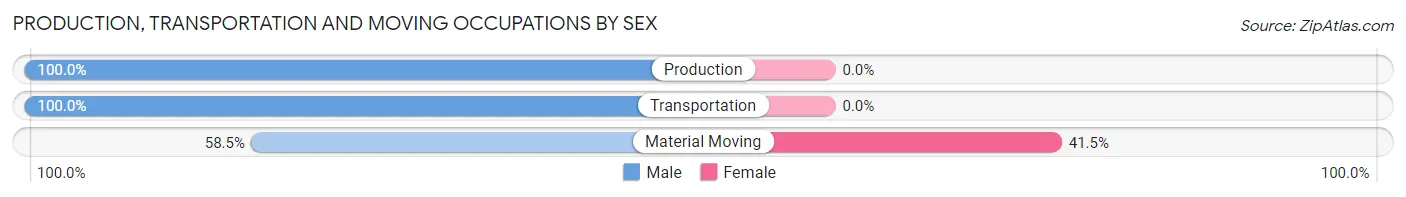
| Occupation | Male | Female |
| Production | 46 (100.0%) | 0 (0.0%) |
| Transportation | 14 (100.0%) | 0 (0.0%) |
| Material Moving | 62 (58.5%) | 44 (41.5%) |
| Total (Category) | 122 (73.5%) | 44 (26.5%) |
| Total (Overall) | 988 (47.4%) | 1,098 (52.6%) |
Employment Industries by Sex in Olympia Fields
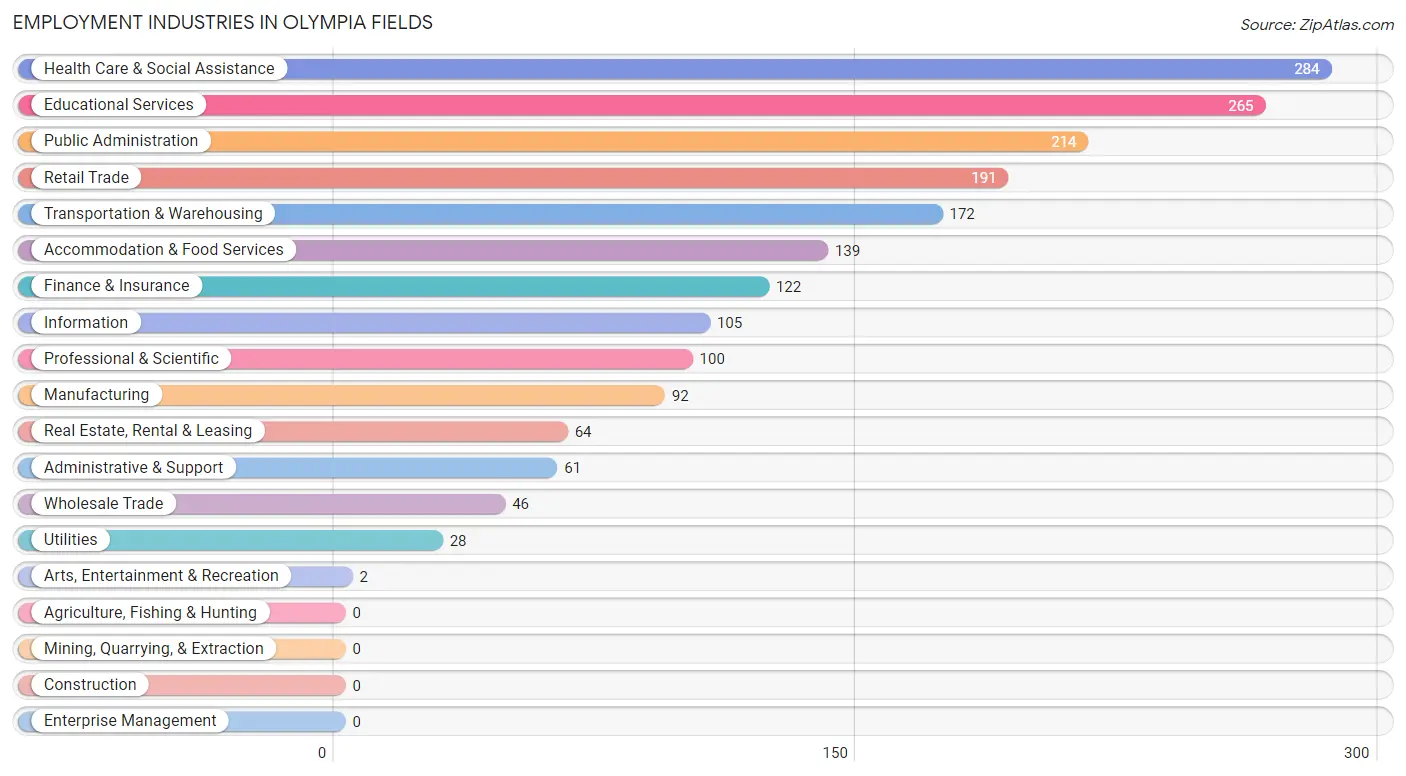
Employment Industries in Olympia Fields
The major employment industries in Olympia Fields include Health Care & Social Assistance (284 | 13.6%), Educational Services (265 | 12.7%), Public Administration (214 | 10.3%), Retail Trade (191 | 9.2%), and Transportation & Warehousing (172 | 8.3%).
Employment Industries by Sex in Olympia Fields
The Olympia Fields industries that see more men than women are Arts, Entertainment & Recreation (100.0%), Accommodation & Food Services (97.1%), and Real Estate, Rental & Leasing (93.8%), whereas the industries that tend to have a higher number of women are Utilities (100.0%), Health Care & Social Assistance (83.5%), and Retail Trade (73.8%).
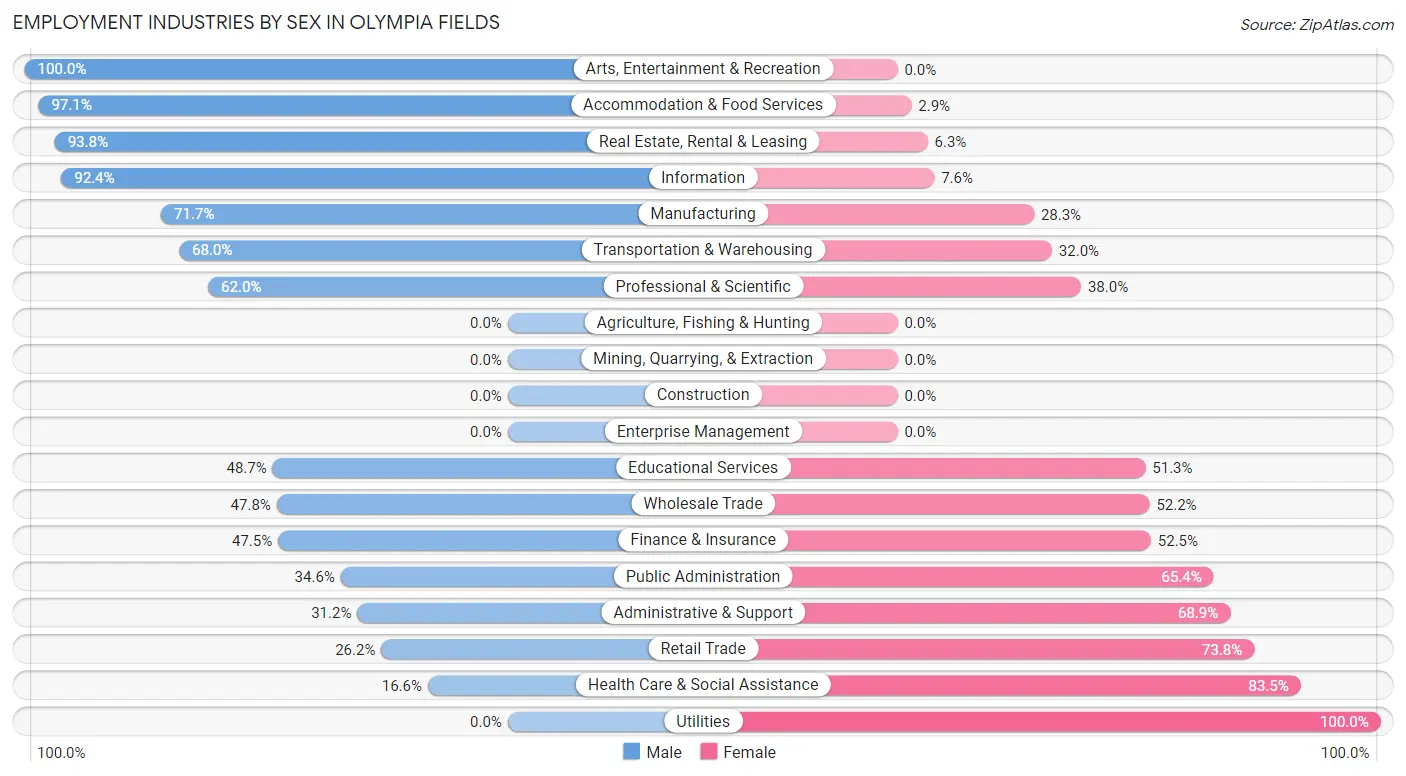
| Industry | Male | Female |
| Agriculture, Fishing & Hunting | 0 (0.0%) | 0 (0.0%) |
| Mining, Quarrying, & Extraction | 0 (0.0%) | 0 (0.0%) |
| Construction | 0 (0.0%) | 0 (0.0%) |
| Manufacturing | 66 (71.7%) | 26 (28.3%) |
| Wholesale Trade | 22 (47.8%) | 24 (52.2%) |
| Retail Trade | 50 (26.2%) | 141 (73.8%) |
| Transportation & Warehousing | 117 (68.0%) | 55 (32.0%) |
| Utilities | 0 (0.0%) | 28 (100.0%) |
| Information | 97 (92.4%) | 8 (7.6%) |
| Finance & Insurance | 58 (47.5%) | 64 (52.5%) |
| Real Estate, Rental & Leasing | 60 (93.8%) | 4 (6.2%) |
| Professional & Scientific | 62 (62.0%) | 38 (38.0%) |
| Enterprise Management | 0 (0.0%) | 0 (0.0%) |
| Administrative & Support | 19 (31.1%) | 42 (68.9%) |
| Educational Services | 129 (48.7%) | 136 (51.3%) |
| Health Care & Social Assistance | 47 (16.6%) | 237 (83.5%) |
| Arts, Entertainment & Recreation | 2 (100.0%) | 0 (0.0%) |
| Accommodation & Food Services | 135 (97.1%) | 4 (2.9%) |
| Public Administration | 74 (34.6%) | 140 (65.4%) |
| Total | 988 (47.4%) | 1,098 (52.6%) |
Education in Olympia Fields
School Enrollment in Olympia Fields
The most common levels of schooling among the 1,145 students in Olympia Fields are college / undergraduate (289 | 25.2%), middle school (254 | 22.2%), and high school (222 | 19.4%).
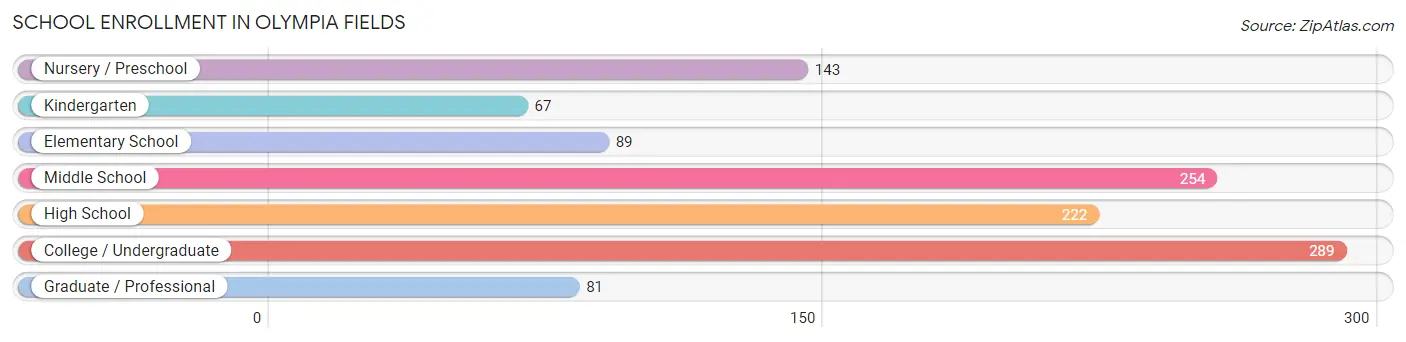
| School Level | # Students | % Students |
| Nursery / Preschool | 143 | 12.5% |
| Kindergarten | 67 | 5.9% |
| Elementary School | 89 | 7.8% |
| Middle School | 254 | 22.2% |
| High School | 222 | 19.4% |
| College / Undergraduate | 289 | 25.2% |
| Graduate / Professional | 81 | 7.1% |
| Total | 1,145 | 100.0% |
School Enrollment by Age by Funding Source in Olympia Fields
Out of a total of 1,145 students who are enrolled in schools in Olympia Fields, 321 (28.0%) attend a private institution, while the remaining 824 (72.0%) are enrolled in public schools. The age group of 25 to 34 year olds has the highest likelihood of being enrolled in private schools, with 32 (71.1% in the age bracket) enrolled. Conversely, the age group of 15 to 17 year olds has the lowest likelihood of being enrolled in a private school, with 144 (100.0% in the age bracket) attending a public institution.
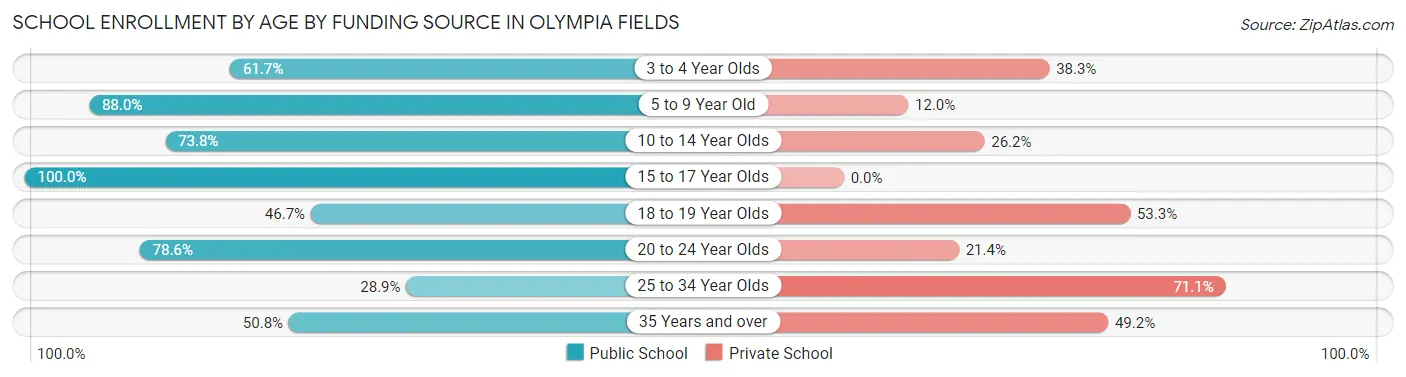
| Age Bracket | Public School | Private School |
| 3 to 4 Year Olds | 79 (61.7%) | 49 (38.3%) |
| 5 to 9 Year Old | 110 (88.0%) | 15 (12.0%) |
| 10 to 14 Year Olds | 279 (73.8%) | 99 (26.2%) |
| 15 to 17 Year Olds | 144 (100.0%) | 0 (0.0%) |
| 18 to 19 Year Olds | 56 (46.7%) | 64 (53.3%) |
| 20 to 24 Year Olds | 110 (78.6%) | 30 (21.4%) |
| 25 to 34 Year Olds | 13 (28.9%) | 32 (71.1%) |
| 35 Years and over | 33 (50.8%) | 32 (49.2%) |
| Total | 824 (72.0%) | 321 (28.0%) |
Educational Attainment by Field of Study in Olympia Fields
Business (426 | 28.8%), education (308 | 20.8%), science & technology (163 | 11.0%), psychology (103 | 7.0%), and computers & mathematics (92 | 6.2%) are the most common fields of study among 1,479 individuals in Olympia Fields who have obtained a bachelor's degree or higher.
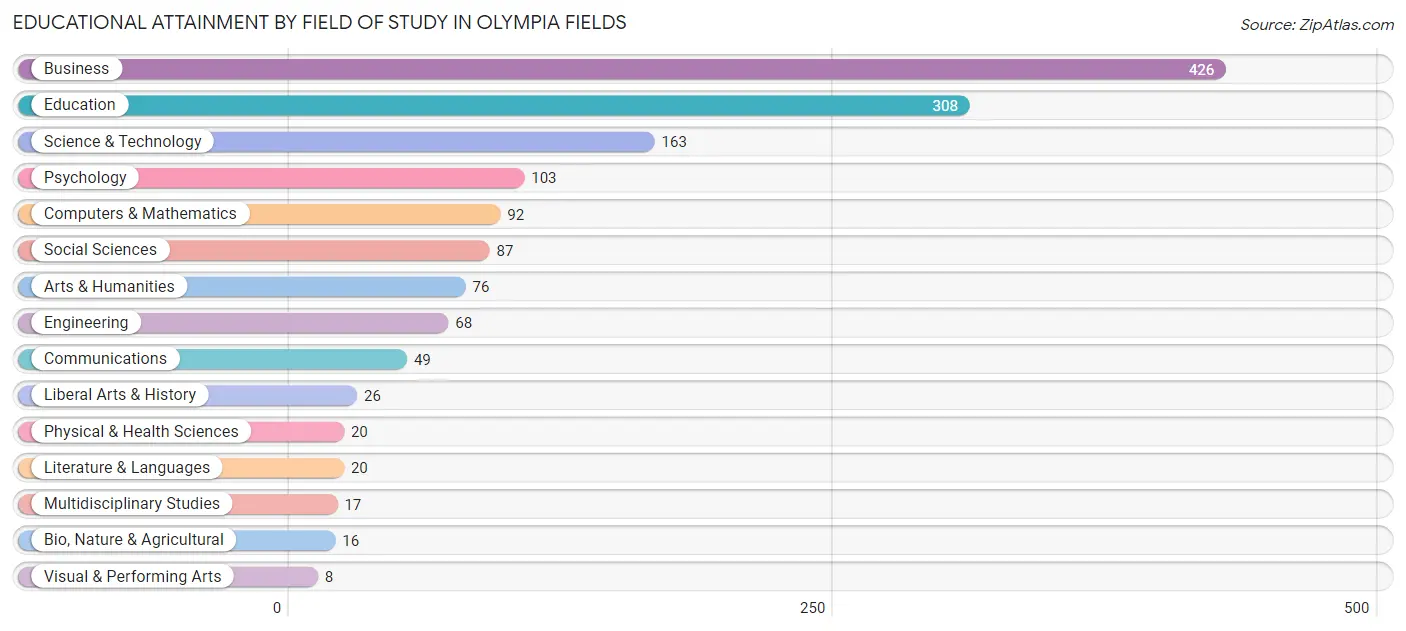
| Field of Study | # Graduates | % Graduates |
| Computers & Mathematics | 92 | 6.2% |
| Bio, Nature & Agricultural | 16 | 1.1% |
| Physical & Health Sciences | 20 | 1.3% |
| Psychology | 103 | 7.0% |
| Social Sciences | 87 | 5.9% |
| Engineering | 68 | 4.6% |
| Multidisciplinary Studies | 17 | 1.1% |
| Science & Technology | 163 | 11.0% |
| Business | 426 | 28.8% |
| Education | 308 | 20.8% |
| Literature & Languages | 20 | 1.3% |
| Liberal Arts & History | 26 | 1.8% |
| Visual & Performing Arts | 8 | 0.5% |
| Communications | 49 | 3.3% |
| Arts & Humanities | 76 | 5.1% |
| Total | 1,479 | 100.0% |
Transportation & Commute in Olympia Fields
Vehicle Availability by Sex in Olympia Fields
The most prevalent vehicle ownership categories in Olympia Fields are males with 2 vehicles (627, accounting for 70.7%) and females with 2 vehicles (545, making up 58.5%).
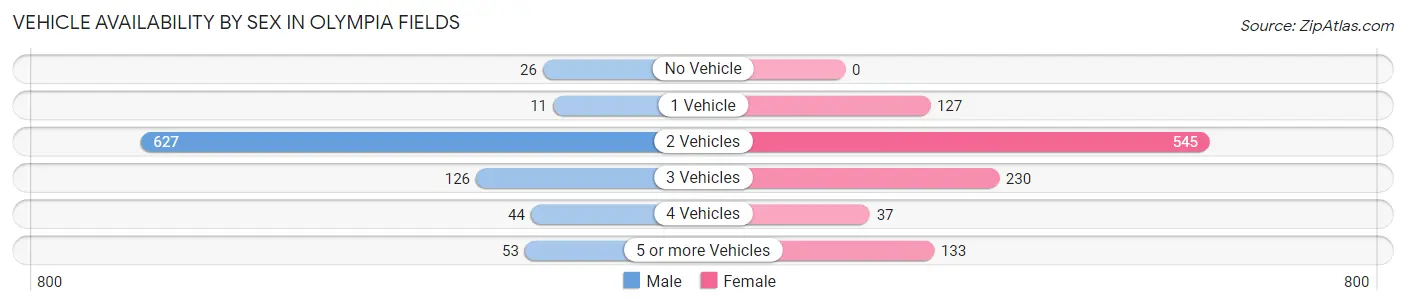
| Vehicles Available | Male | Female |
| No Vehicle | 26 (2.9%) | 0 (0.0%) |
| 1 Vehicle | 11 (1.2%) | 127 (11.8%) |
| 2 Vehicles | 627 (70.7%) | 545 (50.8%) |
| 3 Vehicles | 126 (14.2%) | 230 (21.5%) |
| 4 Vehicles | 44 (5.0%) | 37 (3.5%) |
| 5 or more Vehicles | 53 (6.0%) | 133 (12.4%) |
| Total | 887 (100.0%) | 1,072 (100.0%) |
Commute Time in Olympia Fields
The most frequently occuring commute durations in Olympia Fields are 60 to 89 minutes (272 commuters, 15.7%), 30 to 34 minutes (244 commuters, 14.1%), and 15 to 19 minutes (206 commuters, 11.9%).
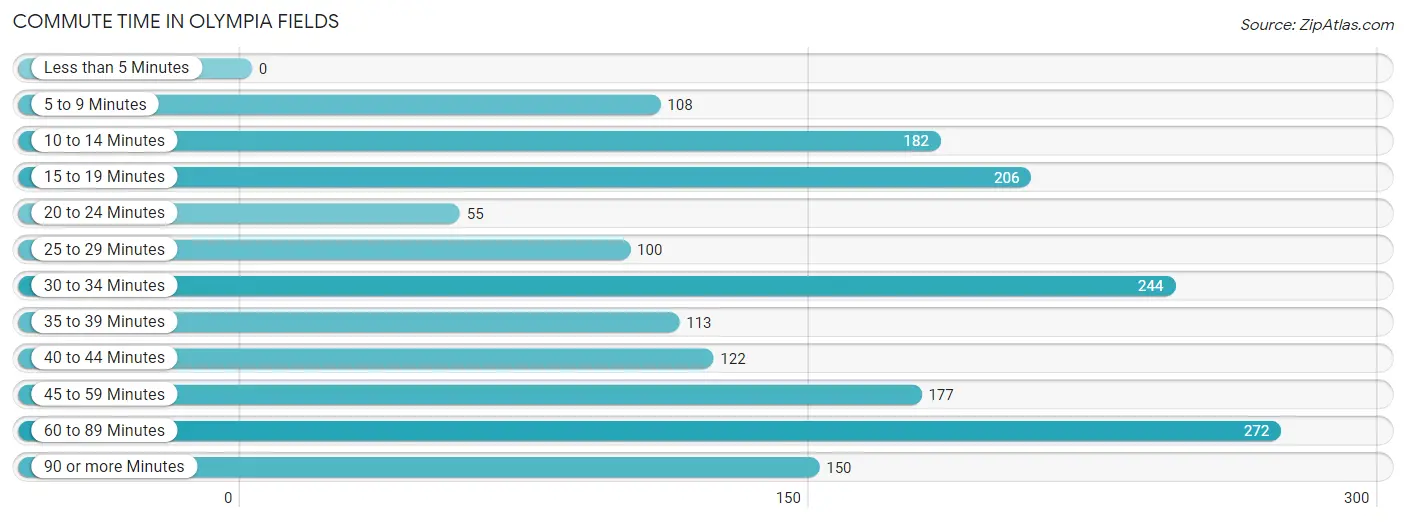
| Commute Time | # Commuters | % Commuters |
| Less than 5 Minutes | 0 | 0.0% |
| 5 to 9 Minutes | 108 | 6.2% |
| 10 to 14 Minutes | 182 | 10.5% |
| 15 to 19 Minutes | 206 | 11.9% |
| 20 to 24 Minutes | 55 | 3.2% |
| 25 to 29 Minutes | 100 | 5.8% |
| 30 to 34 Minutes | 244 | 14.1% |
| 35 to 39 Minutes | 113 | 6.5% |
| 40 to 44 Minutes | 122 | 7.1% |
| 45 to 59 Minutes | 177 | 10.2% |
| 60 to 89 Minutes | 272 | 15.7% |
| 90 or more Minutes | 150 | 8.7% |
Commute Time by Sex in Olympia Fields
The most common commute times in Olympia Fields are 60 to 89 minutes (161 commuters, 19.1%) for males and 15 to 19 minutes (141 commuters, 15.9%) for females.
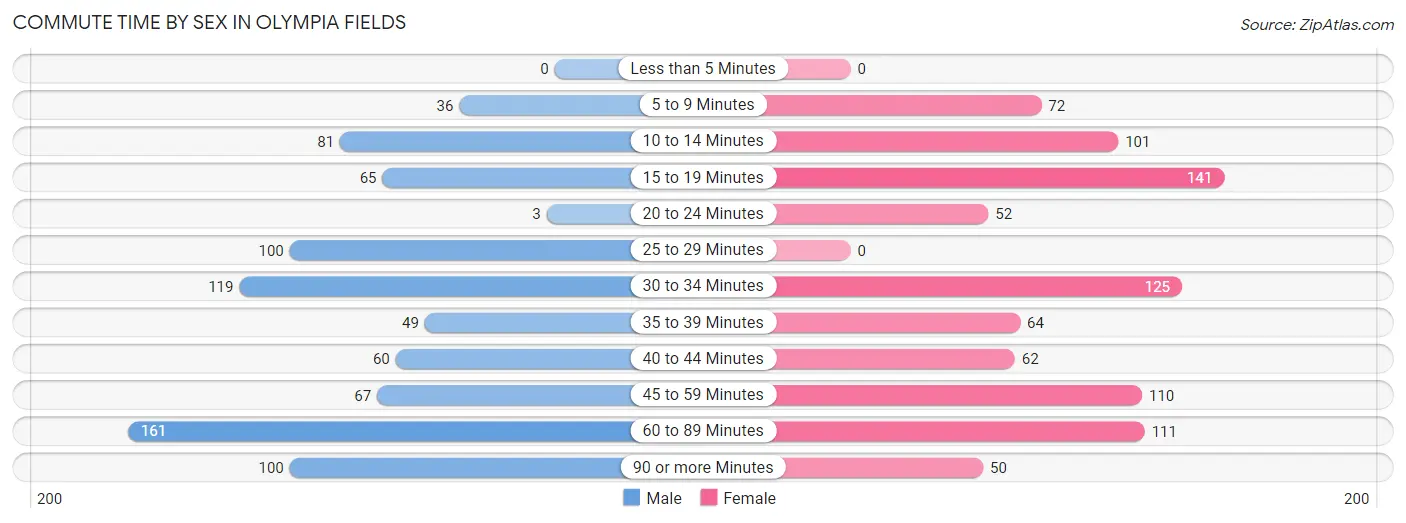
| Commute Time | Male | Female |
| Less than 5 Minutes | 0 (0.0%) | 0 (0.0%) |
| 5 to 9 Minutes | 36 (4.3%) | 72 (8.1%) |
| 10 to 14 Minutes | 81 (9.6%) | 101 (11.4%) |
| 15 to 19 Minutes | 65 (7.7%) | 141 (15.9%) |
| 20 to 24 Minutes | 3 (0.4%) | 52 (5.9%) |
| 25 to 29 Minutes | 100 (11.9%) | 0 (0.0%) |
| 30 to 34 Minutes | 119 (14.1%) | 125 (14.1%) |
| 35 to 39 Minutes | 49 (5.8%) | 64 (7.2%) |
| 40 to 44 Minutes | 60 (7.1%) | 62 (7.0%) |
| 45 to 59 Minutes | 67 (8.0%) | 110 (12.4%) |
| 60 to 89 Minutes | 161 (19.1%) | 111 (12.5%) |
| 90 or more Minutes | 100 (11.9%) | 50 (5.6%) |
Time of Departure to Work by Sex in Olympia Fields
The most frequent times of departure to work in Olympia Fields are 8:30 AM to 8:59 AM (218, 25.9%) for males and 7:00 AM to 7:29 AM (152, 17.1%) for females.
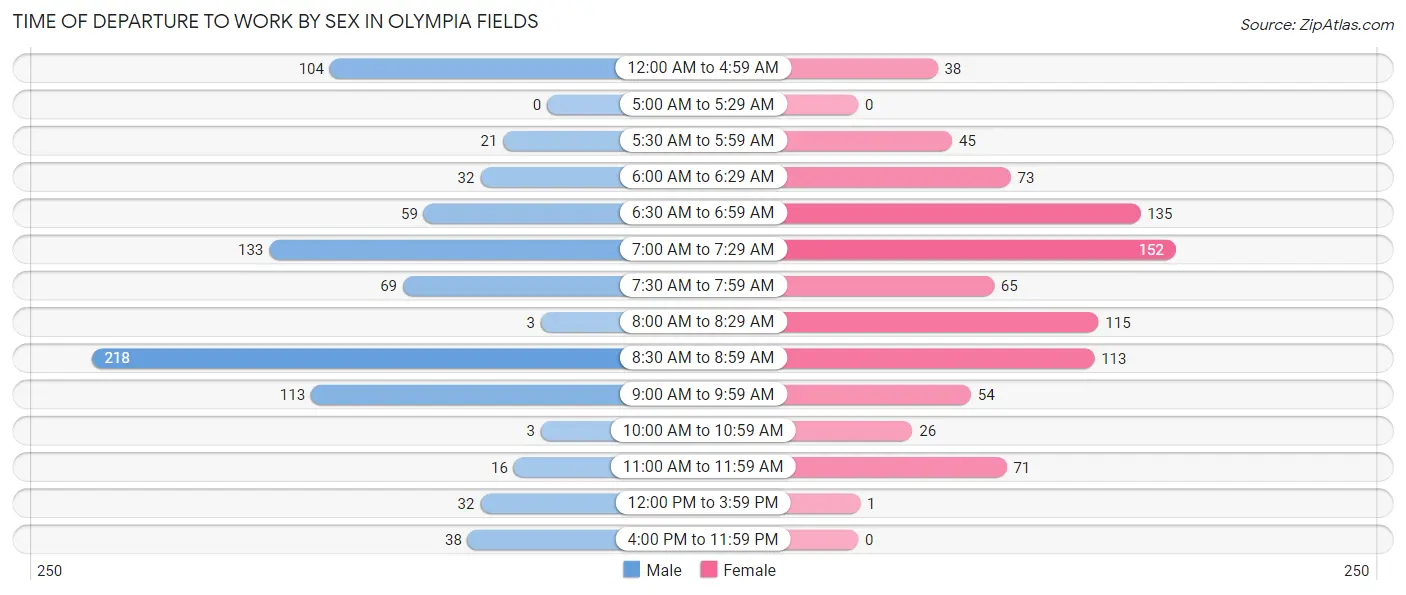
| Time of Departure | Male | Female |
| 12:00 AM to 4:59 AM | 104 (12.4%) | 38 (4.3%) |
| 5:00 AM to 5:29 AM | 0 (0.0%) | 0 (0.0%) |
| 5:30 AM to 5:59 AM | 21 (2.5%) | 45 (5.1%) |
| 6:00 AM to 6:29 AM | 32 (3.8%) | 73 (8.2%) |
| 6:30 AM to 6:59 AM | 59 (7.0%) | 135 (15.2%) |
| 7:00 AM to 7:29 AM | 133 (15.8%) | 152 (17.1%) |
| 7:30 AM to 7:59 AM | 69 (8.2%) | 65 (7.3%) |
| 8:00 AM to 8:29 AM | 3 (0.4%) | 115 (13.0%) |
| 8:30 AM to 8:59 AM | 218 (25.9%) | 113 (12.7%) |
| 9:00 AM to 9:59 AM | 113 (13.4%) | 54 (6.1%) |
| 10:00 AM to 10:59 AM | 3 (0.4%) | 26 (2.9%) |
| 11:00 AM to 11:59 AM | 16 (1.9%) | 71 (8.0%) |
| 12:00 PM to 3:59 PM | 32 (3.8%) | 1 (0.1%) |
| 4:00 PM to 11:59 PM | 38 (4.5%) | 0 (0.0%) |
| Total | 841 (100.0%) | 888 (100.0%) |
Housing Occupancy in Olympia Fields
Occupancy by Ownership in Olympia Fields
Of the total 1,856 dwellings in Olympia Fields, owner-occupied units account for 1,615 (87.0%), while renter-occupied units make up 241 (13.0%).
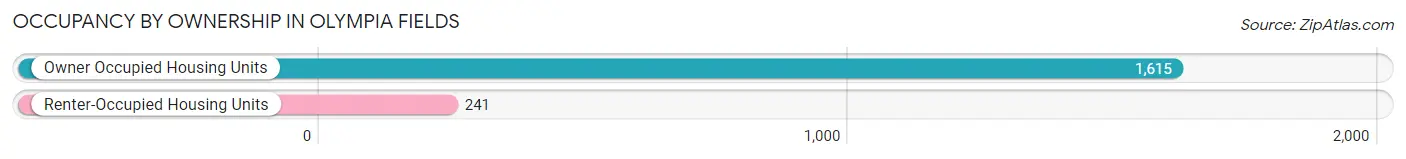
| Occupancy | # Housing Units | % Housing Units |
| Owner Occupied Housing Units | 1,615 | 87.0% |
| Renter-Occupied Housing Units | 241 | 13.0% |
| Total Occupied Housing Units | 1,856 | 100.0% |
Occupancy by Household Size in Olympia Fields
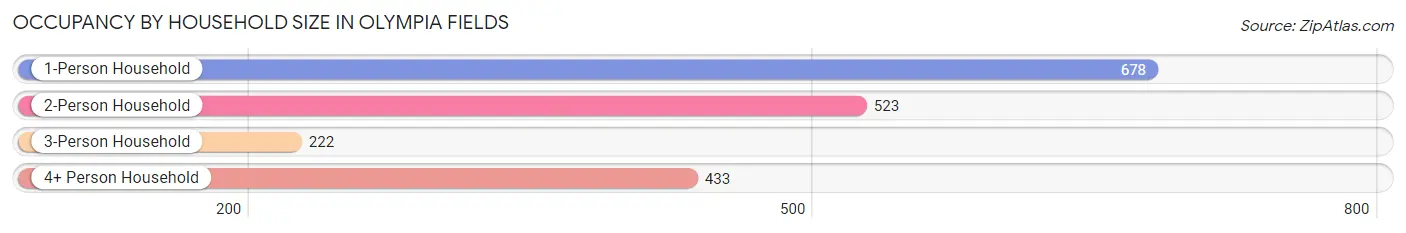
| Household Size | # Housing Units | % Housing Units |
| 1-Person Household | 678 | 36.5% |
| 2-Person Household | 523 | 28.2% |
| 3-Person Household | 222 | 12.0% |
| 4+ Person Household | 433 | 23.3% |
| Total Housing Units | 1,856 | 100.0% |
Occupancy by Ownership by Household Size in Olympia Fields
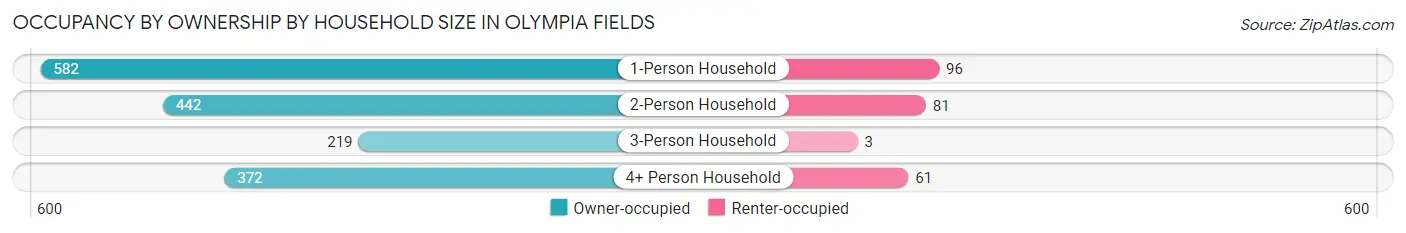
| Household Size | Owner-occupied | Renter-occupied |
| 1-Person Household | 582 (85.8%) | 96 (14.2%) |
| 2-Person Household | 442 (84.5%) | 81 (15.5%) |
| 3-Person Household | 219 (98.7%) | 3 (1.3%) |
| 4+ Person Household | 372 (85.9%) | 61 (14.1%) |
| Total Housing Units | 1,615 (87.0%) | 241 (13.0%) |
Occupancy by Educational Attainment in Olympia Fields
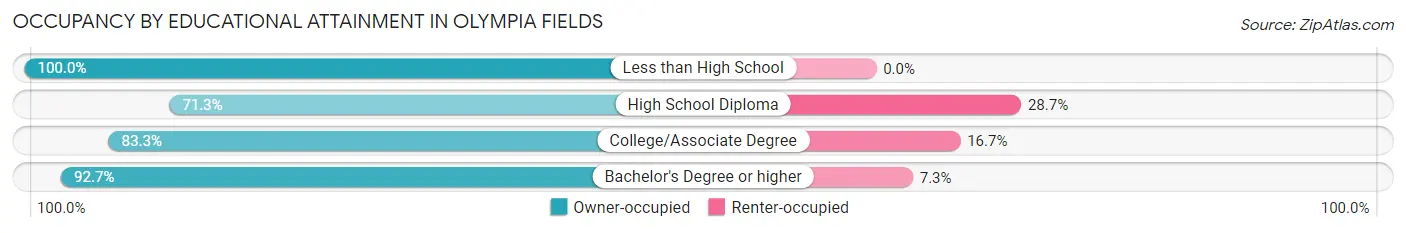
| Household Size | Owner-occupied | Renter-occupied |
| Less than High School | 35 (100.0%) | 0 (0.0%) |
| High School Diploma | 144 (71.3%) | 58 (28.7%) |
| College/Associate Degree | 580 (83.3%) | 116 (16.7%) |
| Bachelor's Degree or higher | 856 (92.7%) | 67 (7.3%) |
Occupancy by Age of Householder in Olympia Fields
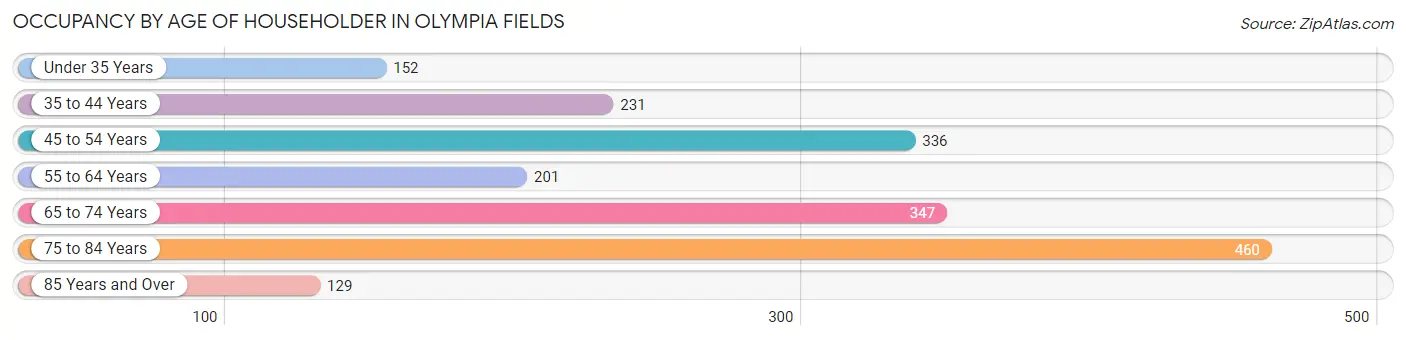
| Age Bracket | # Households | % Households |
| Under 35 Years | 152 | 8.2% |
| 35 to 44 Years | 231 | 12.4% |
| 45 to 54 Years | 336 | 18.1% |
| 55 to 64 Years | 201 | 10.8% |
| 65 to 74 Years | 347 | 18.7% |
| 75 to 84 Years | 460 | 24.8% |
| 85 Years and Over | 129 | 7.0% |
| Total | 1,856 | 100.0% |
Housing Finances in Olympia Fields
Median Income by Occupancy in Olympia Fields
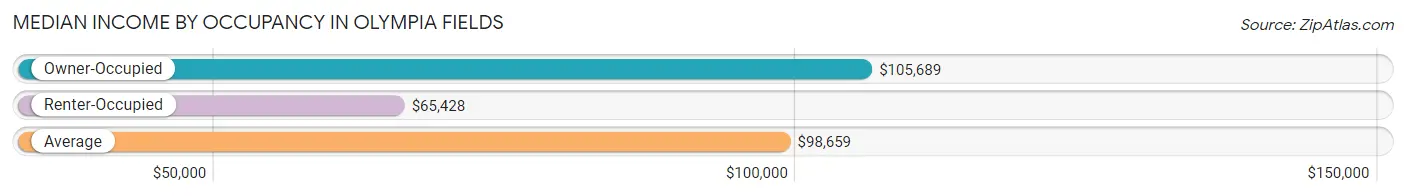
| Occupancy Type | # Households | Median Income |
| Owner-Occupied | 1,615 (87.0%) | $105,689 |
| Renter-Occupied | 241 (13.0%) | $65,428 |
| Average | 1,856 (100.0%) | $98,659 |
Occupancy by Householder Income Bracket in Olympia Fields
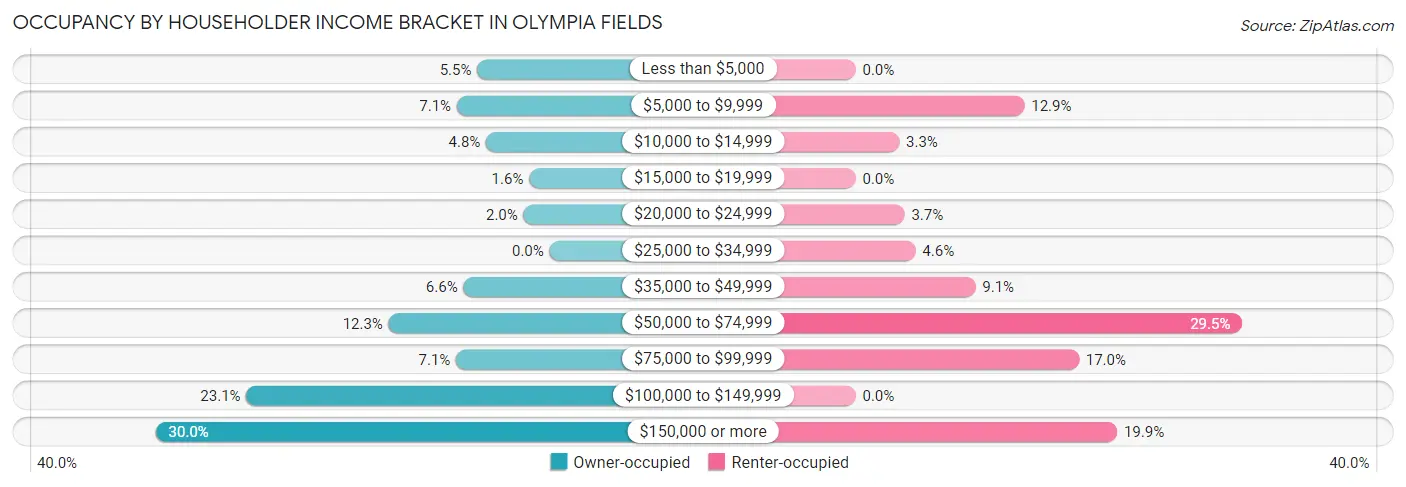
| Income Bracket | Owner-occupied | Renter-occupied |
| Less than $5,000 | 89 (5.5%) | 0 (0.0%) |
| $5,000 to $9,999 | 114 (7.1%) | 31 (12.9%) |
| $10,000 to $14,999 | 78 (4.8%) | 8 (3.3%) |
| $15,000 to $19,999 | 25 (1.5%) | 0 (0.0%) |
| $20,000 to $24,999 | 32 (2.0%) | 9 (3.7%) |
| $25,000 to $34,999 | 0 (0.0%) | 11 (4.6%) |
| $35,000 to $49,999 | 106 (6.6%) | 22 (9.1%) |
| $50,000 to $74,999 | 198 (12.3%) | 71 (29.5%) |
| $75,000 to $99,999 | 115 (7.1%) | 41 (17.0%) |
| $100,000 to $149,999 | 373 (23.1%) | 0 (0.0%) |
| $150,000 or more | 485 (30.0%) | 48 (19.9%) |
| Total | 1,615 (100.0%) | 241 (100.0%) |
Monthly Housing Cost Tiers in Olympia Fields
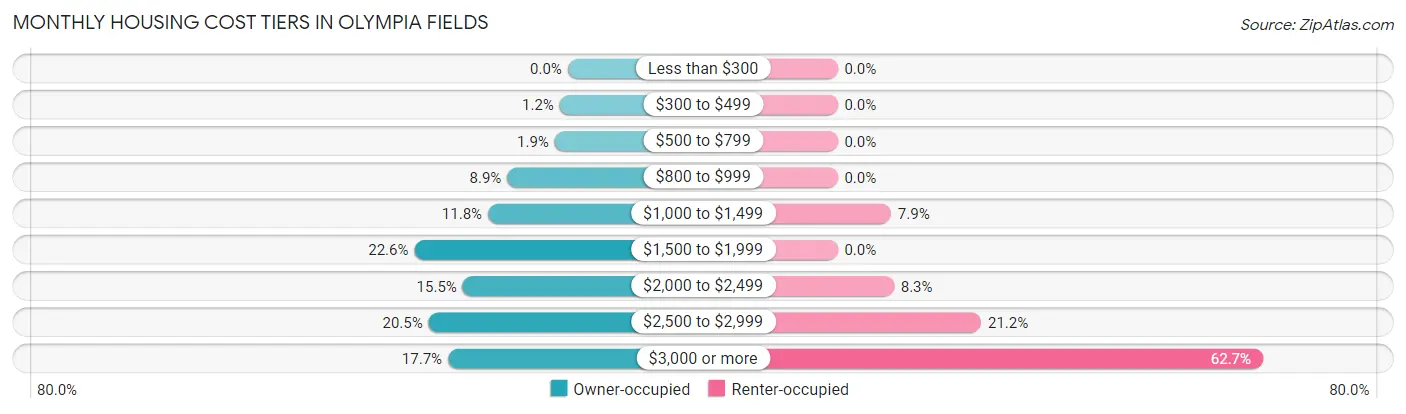
| Monthly Cost | Owner-occupied | Renter-occupied |
| Less than $300 | 0 (0.0%) | 0 (0.0%) |
| $300 to $499 | 19 (1.2%) | 0 (0.0%) |
| $500 to $799 | 31 (1.9%) | 0 (0.0%) |
| $800 to $999 | 144 (8.9%) | 0 (0.0%) |
| $1,000 to $1,499 | 190 (11.8%) | 19 (7.9%) |
| $1,500 to $1,999 | 365 (22.6%) | 0 (0.0%) |
| $2,000 to $2,499 | 250 (15.5%) | 20 (8.3%) |
| $2,500 to $2,999 | 331 (20.5%) | 51 (21.2%) |
| $3,000 or more | 285 (17.6%) | 151 (62.7%) |
| Total | 1,615 (100.0%) | 241 (100.0%) |
Physical Housing Characteristics in Olympia Fields
Housing Structures in Olympia Fields
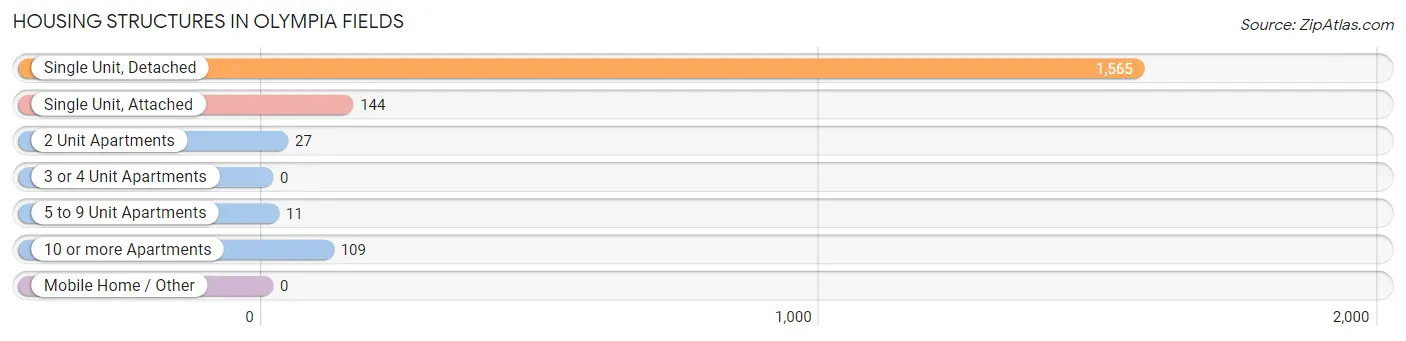
| Structure Type | # Housing Units | % Housing Units |
| Single Unit, Detached | 1,565 | 84.3% |
| Single Unit, Attached | 144 | 7.8% |
| 2 Unit Apartments | 27 | 1.5% |
| 3 or 4 Unit Apartments | 0 | 0.0% |
| 5 to 9 Unit Apartments | 11 | 0.6% |
| 10 or more Apartments | 109 | 5.9% |
| Mobile Home / Other | 0 | 0.0% |
| Total | 1,856 | 100.0% |
Housing Structures by Occupancy in Olympia Fields
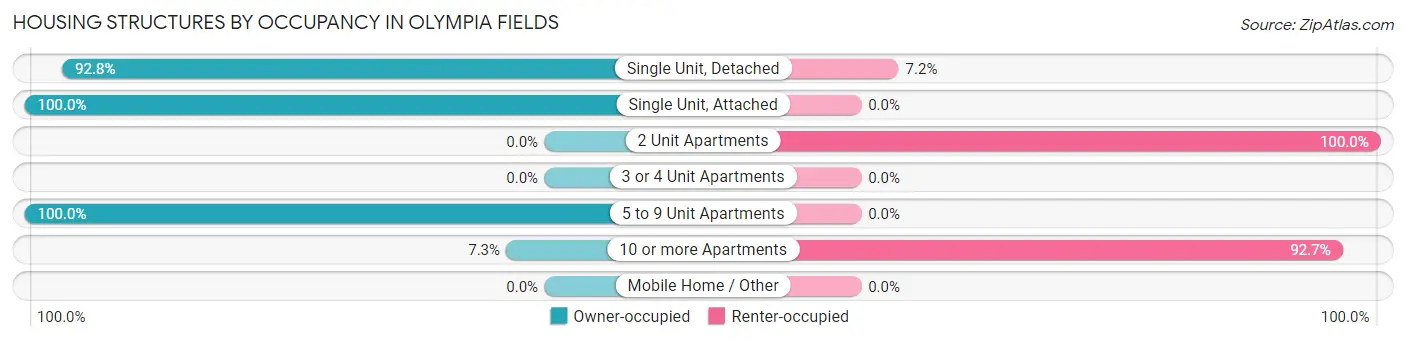
| Structure Type | Owner-occupied | Renter-occupied |
| Single Unit, Detached | 1,452 (92.8%) | 113 (7.2%) |
| Single Unit, Attached | 144 (100.0%) | 0 (0.0%) |
| 2 Unit Apartments | 0 (0.0%) | 27 (100.0%) |
| 3 or 4 Unit Apartments | 0 (0.0%) | 0 (0.0%) |
| 5 to 9 Unit Apartments | 11 (100.0%) | 0 (0.0%) |
| 10 or more Apartments | 8 (7.3%) | 101 (92.7%) |
| Mobile Home / Other | 0 (0.0%) | 0 (0.0%) |
| Total | 1,615 (87.0%) | 241 (13.0%) |
Housing Structures by Number of Rooms in Olympia Fields
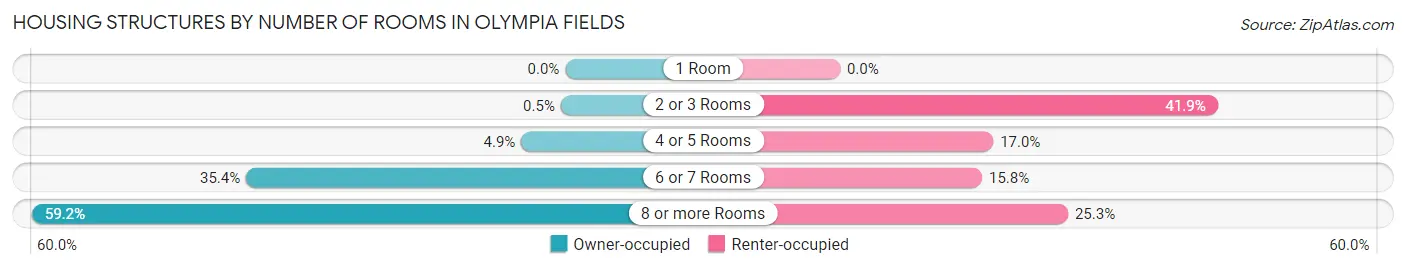
| Number of Rooms | Owner-occupied | Renter-occupied |
| 1 Room | 0 (0.0%) | 0 (0.0%) |
| 2 or 3 Rooms | 8 (0.5%) | 101 (41.9%) |
| 4 or 5 Rooms | 79 (4.9%) | 41 (17.0%) |
| 6 or 7 Rooms | 572 (35.4%) | 38 (15.8%) |
| 8 or more Rooms | 956 (59.2%) | 61 (25.3%) |
| Total | 1,615 (100.0%) | 241 (100.0%) |
Housing Structure by Heating Type in Olympia Fields
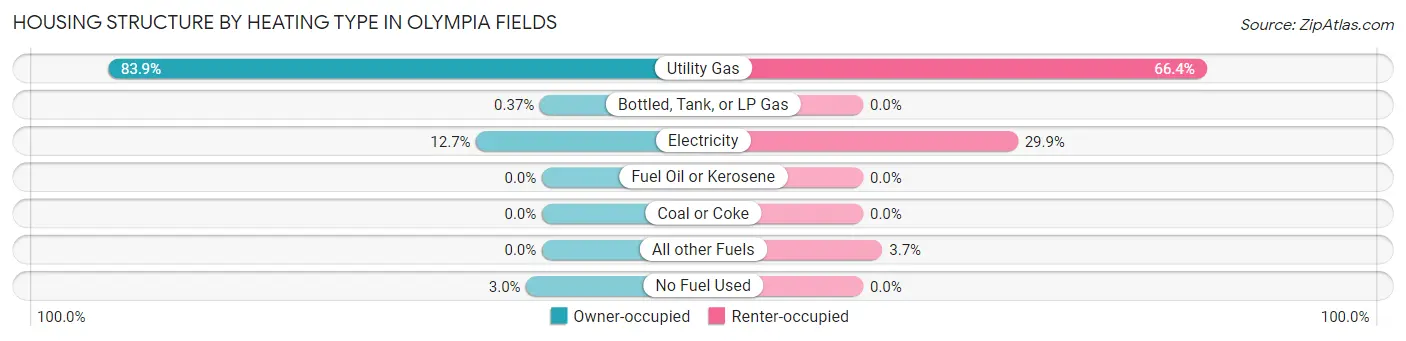
| Heating Type | Owner-occupied | Renter-occupied |
| Utility Gas | 1,355 (83.9%) | 160 (66.4%) |
| Bottled, Tank, or LP Gas | 6 (0.4%) | 0 (0.0%) |
| Electricity | 205 (12.7%) | 72 (29.9%) |
| Fuel Oil or Kerosene | 0 (0.0%) | 0 (0.0%) |
| Coal or Coke | 0 (0.0%) | 0 (0.0%) |
| All other Fuels | 0 (0.0%) | 9 (3.7%) |
| No Fuel Used | 49 (3.0%) | 0 (0.0%) |
| Total | 1,615 (100.0%) | 241 (100.0%) |
Household Vehicle Usage in Olympia Fields
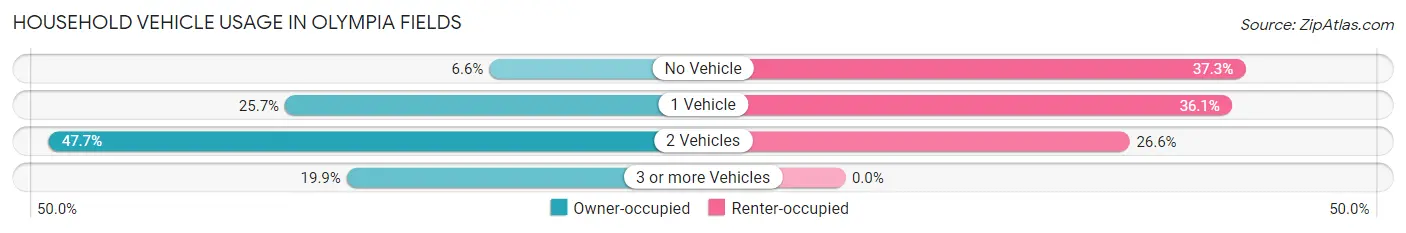
| Vehicles per Household | Owner-occupied | Renter-occupied |
| No Vehicle | 107 (6.6%) | 90 (37.3%) |
| 1 Vehicle | 415 (25.7%) | 87 (36.1%) |
| 2 Vehicles | 771 (47.7%) | 64 (26.6%) |
| 3 or more Vehicles | 322 (19.9%) | 0 (0.0%) |
| Total | 1,615 (100.0%) | 241 (100.0%) |
Real Estate & Mortgages in Olympia Fields
Real Estate and Mortgage Overview in Olympia Fields
| Characteristic | Without Mortgage | With Mortgage |
| Housing Units | 373 | 1,242 |
| Median Property Value | $282,600 | $271,900 |
| Median Household Income | $70,515 | $442 |
| Monthly Housing Costs | $1,066 | $285 |
| Real Estate Taxes | $9,200 | $82 |
Property Value by Mortgage Status in Olympia Fields
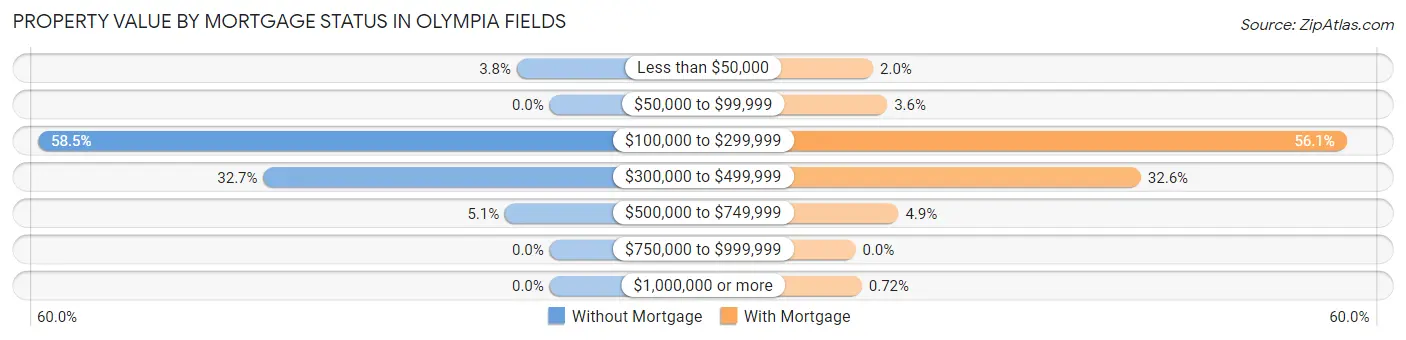
| Property Value | Without Mortgage | With Mortgage |
| Less than $50,000 | 14 (3.7%) | 25 (2.0%) |
| $50,000 to $99,999 | 0 (0.0%) | 45 (3.6%) |
| $100,000 to $299,999 | 218 (58.5%) | 697 (56.1%) |
| $300,000 to $499,999 | 122 (32.7%) | 405 (32.6%) |
| $500,000 to $749,999 | 19 (5.1%) | 61 (4.9%) |
| $750,000 to $999,999 | 0 (0.0%) | 0 (0.0%) |
| $1,000,000 or more | 0 (0.0%) | 9 (0.7%) |
| Total | 373 (100.0%) | 1,242 (100.0%) |
Household Income by Mortgage Status in Olympia Fields
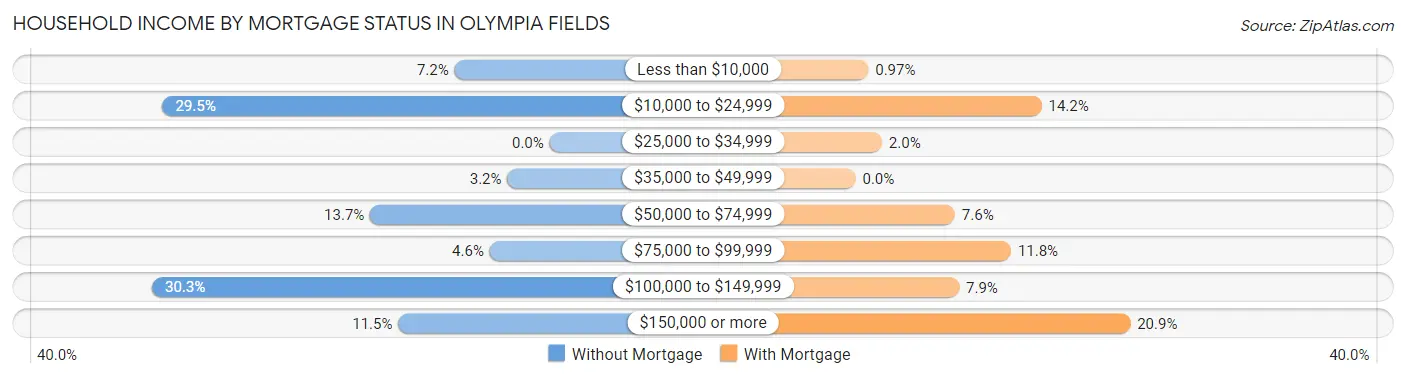
| Household Income | Without Mortgage | With Mortgage |
| Less than $10,000 | 27 (7.2%) | 12 (1.0%) |
| $10,000 to $24,999 | 110 (29.5%) | 176 (14.2%) |
| $25,000 to $34,999 | 0 (0.0%) | 25 (2.0%) |
| $35,000 to $49,999 | 12 (3.2%) | 0 (0.0%) |
| $50,000 to $74,999 | 51 (13.7%) | 94 (7.6%) |
| $75,000 to $99,999 | 17 (4.6%) | 147 (11.8%) |
| $100,000 to $149,999 | 113 (30.3%) | 98 (7.9%) |
| $150,000 or more | 43 (11.5%) | 260 (20.9%) |
| Total | 373 (100.0%) | 1,242 (100.0%) |
Property Value to Household Income Ratio in Olympia Fields
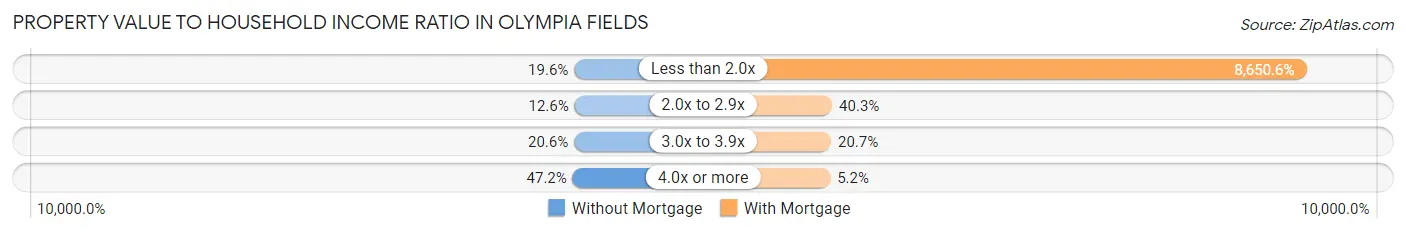
| Value-to-Income Ratio | Without Mortgage | With Mortgage |
| Less than 2.0x | 73 (19.6%) | 107,440 (8,650.6%) |
| 2.0x to 2.9x | 47 (12.6%) | 501 (40.3%) |
| 3.0x to 3.9x | 77 (20.6%) | 257 (20.7%) |
| 4.0x or more | 176 (47.2%) | 64 (5.1%) |
| Total | 373 (100.0%) | 1,242 (100.0%) |
Real Estate Taxes by Mortgage Status in Olympia Fields
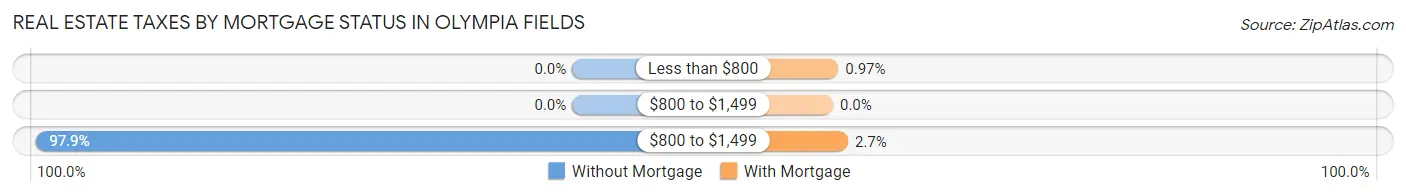
| Property Taxes | Without Mortgage | With Mortgage |
| Less than $800 | 0 (0.0%) | 12 (1.0%) |
| $800 to $1,499 | 0 (0.0%) | 0 (0.0%) |
| $800 to $1,499 | 365 (97.9%) | 34 (2.7%) |
| Total | 373 (100.0%) | 1,242 (100.0%) |
Health & Disability in Olympia Fields
Health Insurance Coverage by Age in Olympia Fields
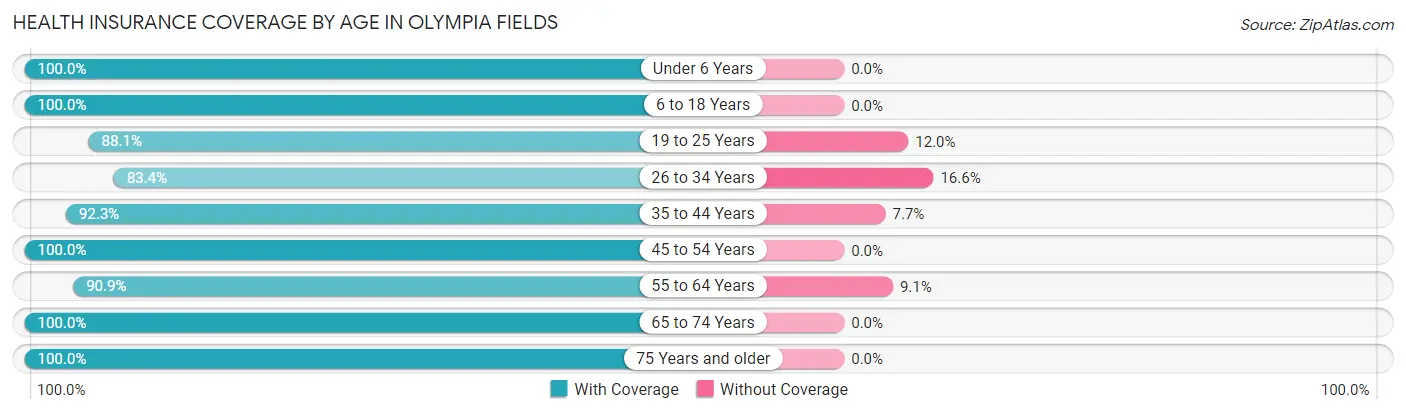
| Age Bracket | With Coverage | Without Coverage |
| Under 6 Years | 330 (100.0%) | 0 (0.0%) |
| 6 to 18 Years | 828 (100.0%) | 0 (0.0%) |
| 19 to 25 Years | 457 (88.0%) | 62 (11.9%) |
| 26 to 34 Years | 341 (83.4%) | 68 (16.6%) |
| 35 to 44 Years | 455 (92.3%) | 38 (7.7%) |
| 45 to 54 Years | 519 (100.0%) | 0 (0.0%) |
| 55 to 64 Years | 421 (90.9%) | 42 (9.1%) |
| 65 to 74 Years | 530 (100.0%) | 0 (0.0%) |
| 75 Years and older | 773 (100.0%) | 0 (0.0%) |
| Total | 4,654 (95.7%) | 210 (4.3%) |
Health Insurance Coverage by Citizenship Status in Olympia Fields
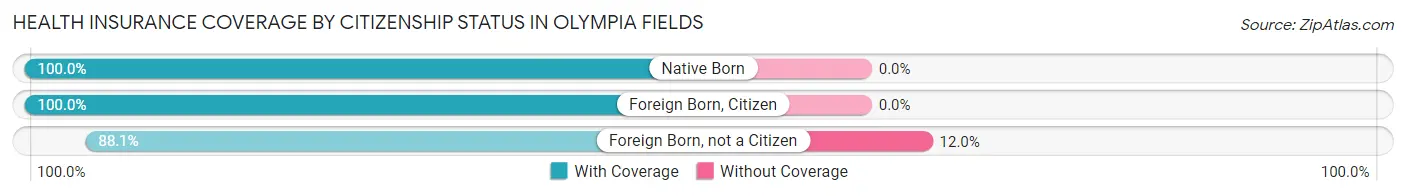
| Citizenship Status | With Coverage | Without Coverage |
| Native Born | 330 (100.0%) | 0 (0.0%) |
| Foreign Born, Citizen | 828 (100.0%) | 0 (0.0%) |
| Foreign Born, not a Citizen | 457 (88.0%) | 62 (11.9%) |
Health Insurance Coverage by Household Income in Olympia Fields
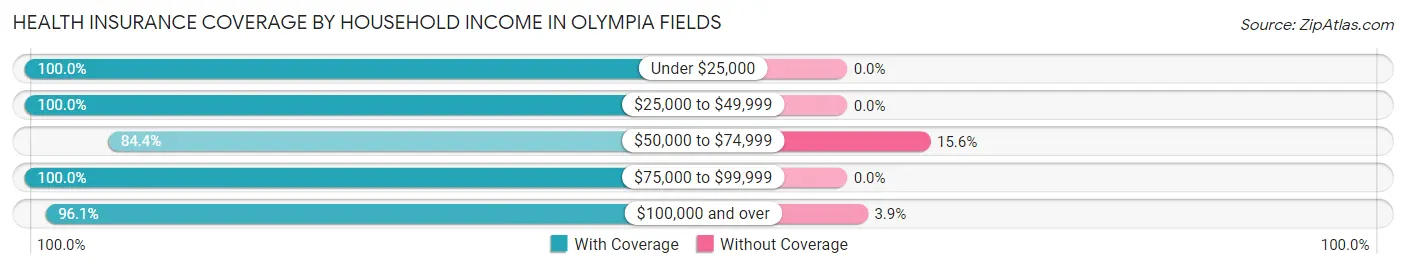
| Household Income | With Coverage | Without Coverage |
| Under $25,000 | 583 (100.0%) | 0 (0.0%) |
| $25,000 to $49,999 | 220 (100.0%) | 0 (0.0%) |
| $50,000 to $74,999 | 482 (84.4%) | 89 (15.6%) |
| $75,000 to $99,999 | 391 (100.0%) | 0 (0.0%) |
| $100,000 and over | 2,934 (96.1%) | 118 (3.9%) |
Public vs Private Health Insurance Coverage by Age in Olympia Fields
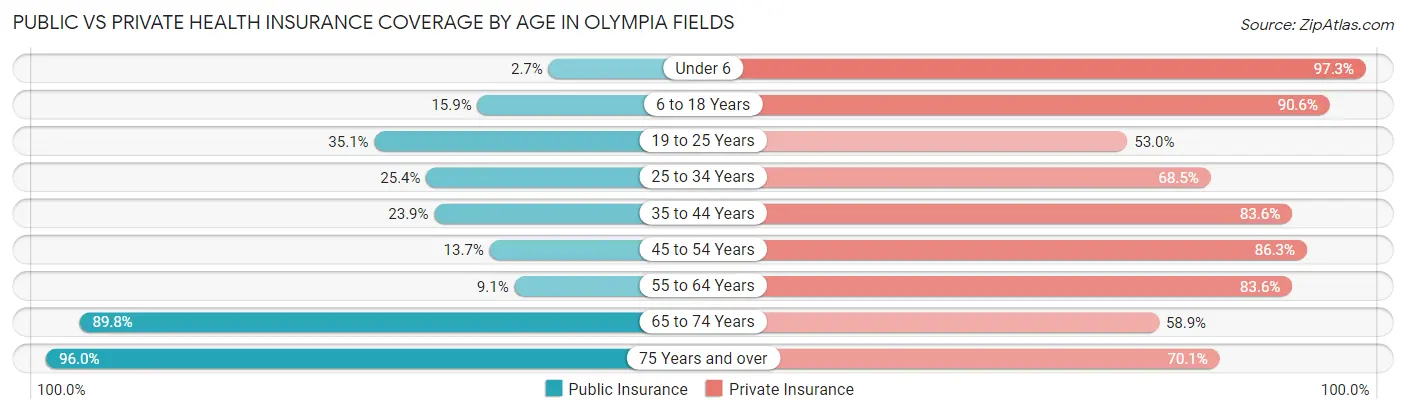
| Age Bracket | Public Insurance | Private Insurance |
| Under 6 | 9 (2.7%) | 321 (97.3%) |
| 6 to 18 Years | 132 (15.9%) | 750 (90.6%) |
| 19 to 25 Years | 182 (35.1%) | 275 (53.0%) |
| 25 to 34 Years | 104 (25.4%) | 280 (68.5%) |
| 35 to 44 Years | 118 (23.9%) | 412 (83.6%) |
| 45 to 54 Years | 71 (13.7%) | 448 (86.3%) |
| 55 to 64 Years | 42 (9.1%) | 387 (83.6%) |
| 65 to 74 Years | 476 (89.8%) | 312 (58.9%) |
| 75 Years and over | 742 (96.0%) | 542 (70.1%) |
| Total | 1,876 (38.6%) | 3,727 (76.6%) |
Disability Status by Sex by Age in Olympia Fields
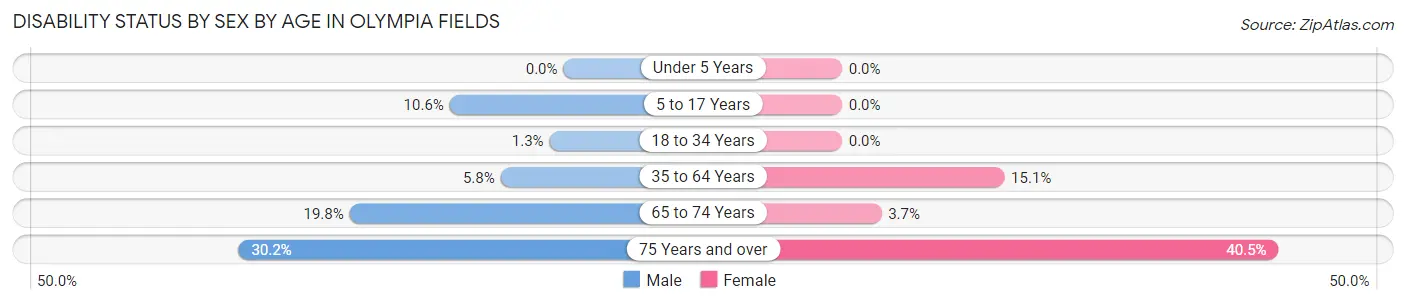
| Age Bracket | Male | Female |
| Under 5 Years | 0 (0.0%) | 0 (0.0%) |
| 5 to 17 Years | 40 (10.5%) | 0 (0.0%) |
| 18 to 34 Years | 8 (1.3%) | 0 (0.0%) |
| 35 to 64 Years | 33 (5.8%) | 137 (15.1%) |
| 65 to 74 Years | 51 (19.8%) | 10 (3.7%) |
| 75 Years and over | 82 (30.1%) | 203 (40.5%) |
Disability Class by Sex by Age in Olympia Fields
Disability Class: Hearing Difficulty
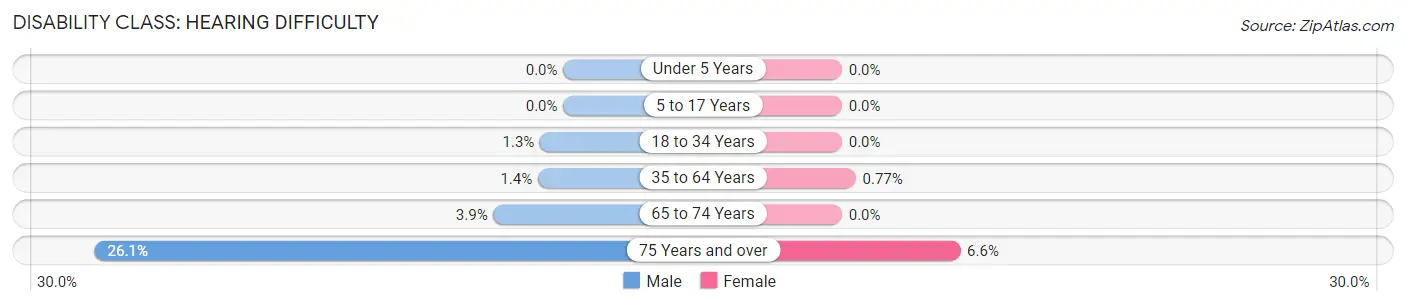
| Age Bracket | Male | Female |
| Under 5 Years | 0 (0.0%) | 0 (0.0%) |
| 5 to 17 Years | 0 (0.0%) | 0 (0.0%) |
| 18 to 34 Years | 8 (1.3%) | 0 (0.0%) |
| 35 to 64 Years | 8 (1.4%) | 7 (0.8%) |
| 65 to 74 Years | 10 (3.9%) | 0 (0.0%) |
| 75 Years and over | 71 (26.1%) | 33 (6.6%) |
Disability Class: Vision Difficulty
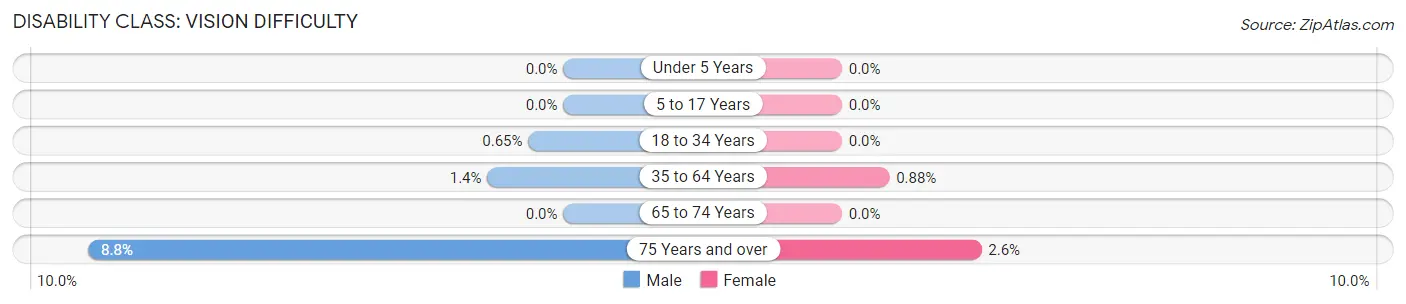
| Age Bracket | Male | Female |
| Under 5 Years | 0 (0.0%) | 0 (0.0%) |
| 5 to 17 Years | 0 (0.0%) | 0 (0.0%) |
| 18 to 34 Years | 4 (0.6%) | 0 (0.0%) |
| 35 to 64 Years | 8 (1.4%) | 8 (0.9%) |
| 65 to 74 Years | 0 (0.0%) | 0 (0.0%) |
| 75 Years and over | 24 (8.8%) | 13 (2.6%) |
Disability Class: Cognitive Difficulty
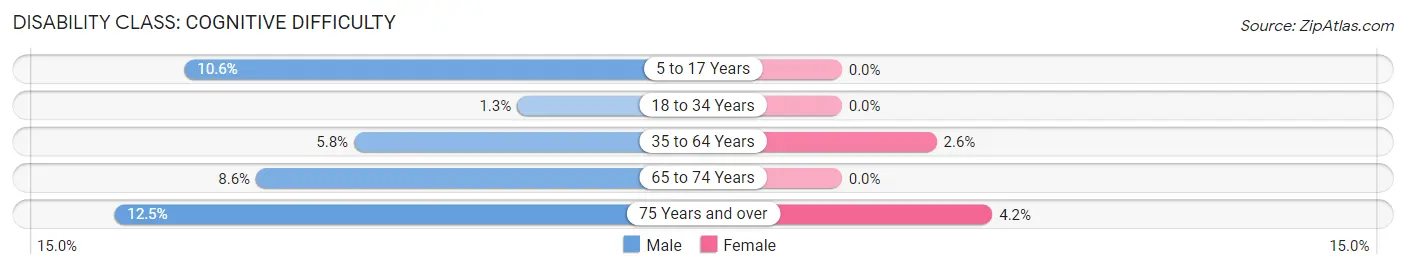
| Age Bracket | Male | Female |
| 5 to 17 Years | 40 (10.5%) | 0 (0.0%) |
| 18 to 34 Years | 8 (1.3%) | 0 (0.0%) |
| 35 to 64 Years | 33 (5.8%) | 24 (2.6%) |
| 65 to 74 Years | 22 (8.6%) | 0 (0.0%) |
| 75 Years and over | 34 (12.5%) | 21 (4.2%) |
Disability Class: Ambulatory Difficulty
| Age Bracket | Male | Female |
| 5 to 17 Years | 0 (0.0%) | 0 (0.0%) |
| 18 to 34 Years | 8 (1.3%) | 0 (0.0%) |
| 35 to 64 Years | 17 (3.0%) | 26 (2.9%) |
| 65 to 74 Years | 41 (16.0%) | 10 (3.7%) |
| 75 Years and over | 64 (23.5%) | 62 (12.4%) |
Disability Class: Self-Care Difficulty
| Age Bracket | Male | Female |
| 5 to 17 Years | 0 (0.0%) | 0 (0.0%) |
| 18 to 34 Years | 8 (1.3%) | 0 (0.0%) |
| 35 to 64 Years | 0 (0.0%) | 19 (2.1%) |
| 65 to 74 Years | 22 (8.6%) | 0 (0.0%) |
| 75 Years and over | 44 (16.2%) | 32 (6.4%) |
Technology Access in Olympia Fields
Computing Device Access in Olympia Fields
| Device Type | # Households | % Households |
| Desktop or Laptop | 1,655 | 89.2% |
| Smartphone | 1,521 | 82.0% |
| Tablet | 1,295 | 69.8% |
| No Computing Device | 140 | 7.5% |
| Total | 1,856 | 100.0% |
Internet Access in Olympia Fields
| Internet Type | # Households | % Households |
| Dial-Up Internet | 10 | 0.5% |
| Broadband Home | 1,503 | 81.0% |
| Cellular Data Only | 84 | 4.5% |
| Satellite Internet | 201 | 10.8% |
| No Internet | 192 | 10.3% |
| Total | 1,856 | 100.0% |
Olympia Fields Summary
Olympia Fields is a village located in Cook County, Illinois, United States. The population was 4,988 at the 2010 census. Olympia Fields is a suburb of Chicago and is located about 25 miles south of the city's downtown.
History
The area that is now Olympia Fields was first settled in the 1830s by German immigrants. The village was incorporated in 1914 and was named after the ancient Greek city of Olympia. The village was originally a farming community, but in the early 20th century, it began to develop into a residential suburb of Chicago.
In the 1920s, the village was home to the Olympia Fields Country Club, which hosted the U.S. Open golf tournament in 1925 and 1961. The tournament was won by Bobby Jones and Jack Nicklaus, respectively.
Geography
Olympia Fields is located at 41°35'17" North, 87°41'17" West (41.588, -87.688). According to the 2010 census, the village has a total area of 2.7 square miles, all land.
Economy
Olympia Fields is primarily a residential community, but it does have some commercial and industrial businesses. The village is home to several large employers, including the Olympia Fields Country Club, the Olympia Fields Park District, and the Olympia Fields Public Library.
Demographics
As of the 2010 census, there were 4,988 people, 1,845 households, and 1,323 families residing in the village. The population density was 1,845.2 people per square mile. The racial makeup of the village was 68.2% White, 24.2% African American, 0.2% Native American, 2.2% Asian, 0.1% Pacific Islander, 3.2% from other races, and 1.9% from two or more races. Hispanic or Latino of any race were 6.7% of the population.
The median income for a household in the village was $76,944, and the median income for a family was $90,917. Males had a median income of $60,938 versus $41,964 for females. The per capita income for the village was $33,945. About 3.2% of families and 4.3% of the population were below the poverty line, including 5.2% of those under age 18 and 4.2% of those age 65 or over.
Common Questions
What is Per Capita Income in Olympia Fields?
Per Capita income in Olympia Fields is $46,185.
What is the Median Family Income in Olympia Fields?
Median Family Income in Olympia Fields is $118,381.
What is the Median Household income in Olympia Fields?
Median Household Income in Olympia Fields is $98,659.
What is Income or Wage Gap in Olympia Fields?
Income or Wage Gap in Olympia Fields is 0.2%.
Women in Olympia Fields earn 99.8 cents for every dollar earned by a man.
What is Inequality or Gini Index in Olympia Fields?
Inequality or Gini Index in Olympia Fields is 0.47.
What is the Total Population of Olympia Fields?
Total Population of Olympia Fields is 4,922.
What is the Total Male Population of Olympia Fields?
Total Male Population of Olympia Fields is 2,122.
What is the Total Female Population of Olympia Fields?
Total Female Population of Olympia Fields is 2,800.
What is the Ratio of Males per 100 Females in Olympia Fields?
There are 75.79 Males per 100 Females in Olympia Fields.
What is the Ratio of Females per 100 Males in Olympia Fields?
There are 131.95 Females per 100 Males in Olympia Fields.
What is the Median Population Age in Olympia Fields?
Median Population Age in Olympia Fields is 40.8 Years.
What is the Average Family Size in Olympia Fields
Average Family Size in Olympia Fields is 3.4 People.
What is the Average Household Size in Olympia Fields
Average Household Size in Olympia Fields is 2.6 People.
How Large is the Labor Force in Olympia Fields?
There are 2,328 People in the Labor Forcein in Olympia Fields.
What is the Percentage of People in the Labor Force in Olympia Fields?
59.0% of People are in the Labor Force in Olympia Fields.
What is the Unemployment Rate in Olympia Fields?
Unemployment Rate in Olympia Fields is 10.5%.