Aptos Hills Larkin Valley, CA Map & Demographics
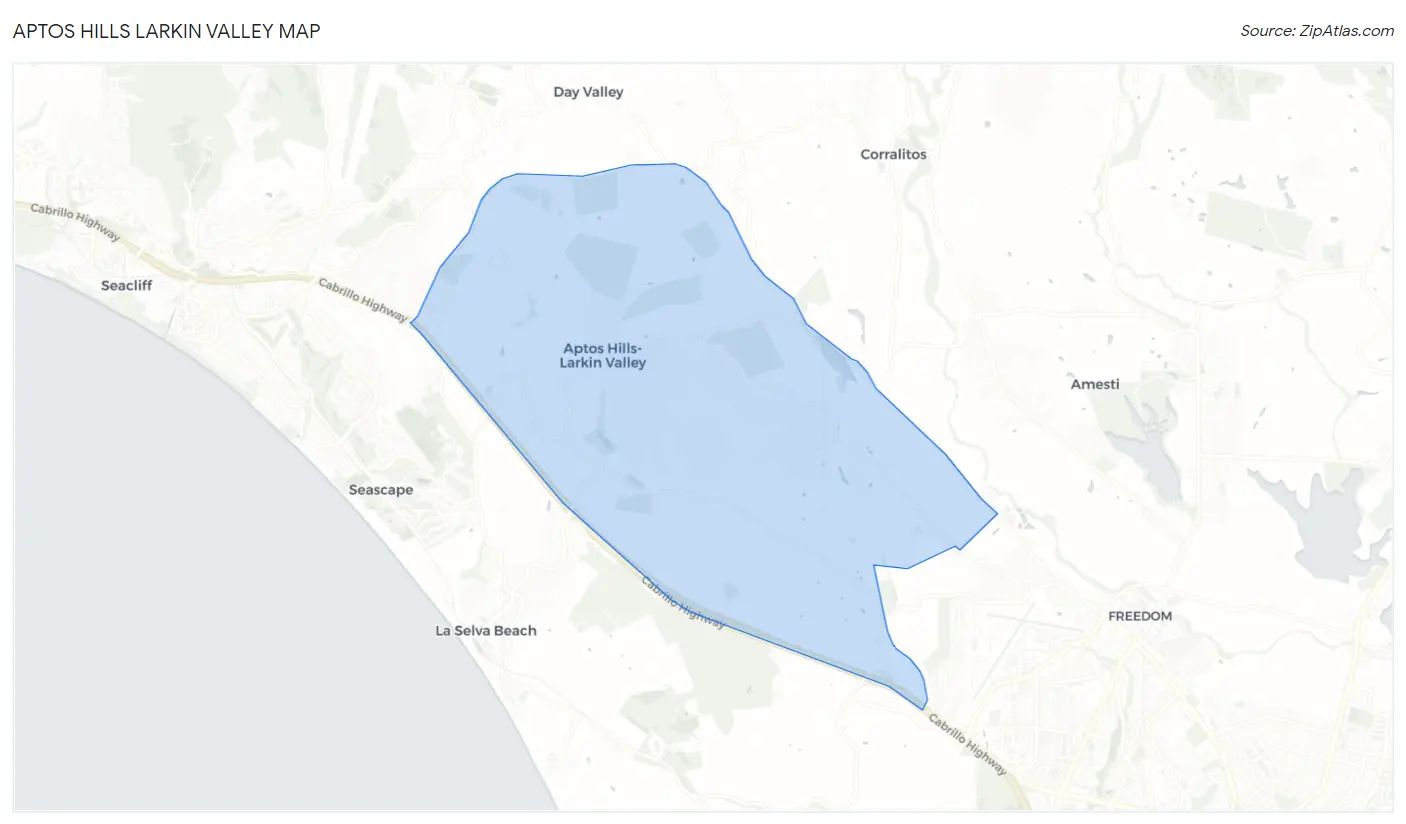
Aptos Hills Larkin Valley Map
Aptos Hills Larkin Valley Overview
$73,493
PER CAPITA INCOME
$150,833
AVG FAMILY INCOME
$151,000
AVG HOUSEHOLD INCOME
32.3%
WAGE / INCOME GAP [ % ]
67.7¢/ $1
WAGE / INCOME GAP [ $ ]
0.36
INEQUALITY / GINI INDEX
1,746
TOTAL POPULATION
893
MALE POPULATION
853
FEMALE POPULATION
104.69
MALES / 100 FEMALES
95.52
FEMALES / 100 MALES
60.8
MEDIAN AGE
2.6
AVG FAMILY SIZE
2.6
AVG HOUSEHOLD SIZE
895
LABOR FORCE [ PEOPLE ]
57.0%
PERCENT IN LABOR FORCE
2.1%
UNEMPLOYMENT RATE
Income in Aptos Hills Larkin Valley
Income Overview in Aptos Hills Larkin Valley
Per Capita Income in Aptos Hills Larkin Valley is $73,493, while median incomes of families and households are $150,833 and $151,000 respectively.
| Characteristic | Number | Measure |
| Per Capita Income | 1,746 | $73,493 |
| Median Family Income | 584 | $150,833 |
| Mean Family Income | 584 | $201,828 |
| Median Household Income | 664 | $151,000 |
| Mean Household Income | 664 | $199,356 |
| Income Deficit | 584 | $0 |
| Wage / Income Gap (%) | 1,746 | 32.35% |
| Wage / Income Gap ($) | 1,746 | 67.65¢ per $1 |
| Gini / Inequality Index | 1,746 | 0.36 |
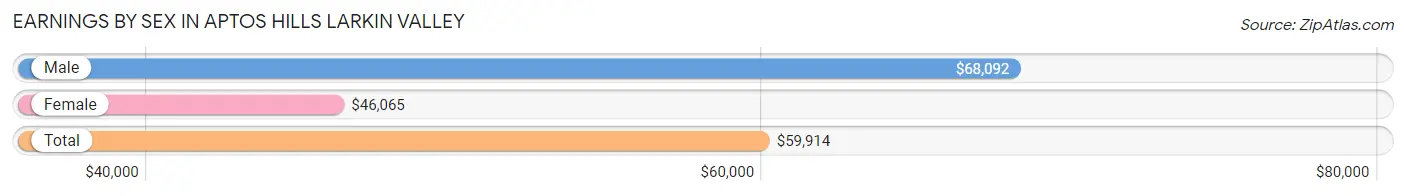
Earnings by Sex in Aptos Hills Larkin Valley
Average Earnings in Aptos Hills Larkin Valley are $59,914, $68,092 for men and $46,065 for women, a difference of 32.4%.
| Sex | Number | Average Earnings |
| Male | 551 (53.9%) | $68,092 |
| Female | 471 (46.1%) | $46,065 |
| Total | 1,022 (100.0%) | $59,914 |
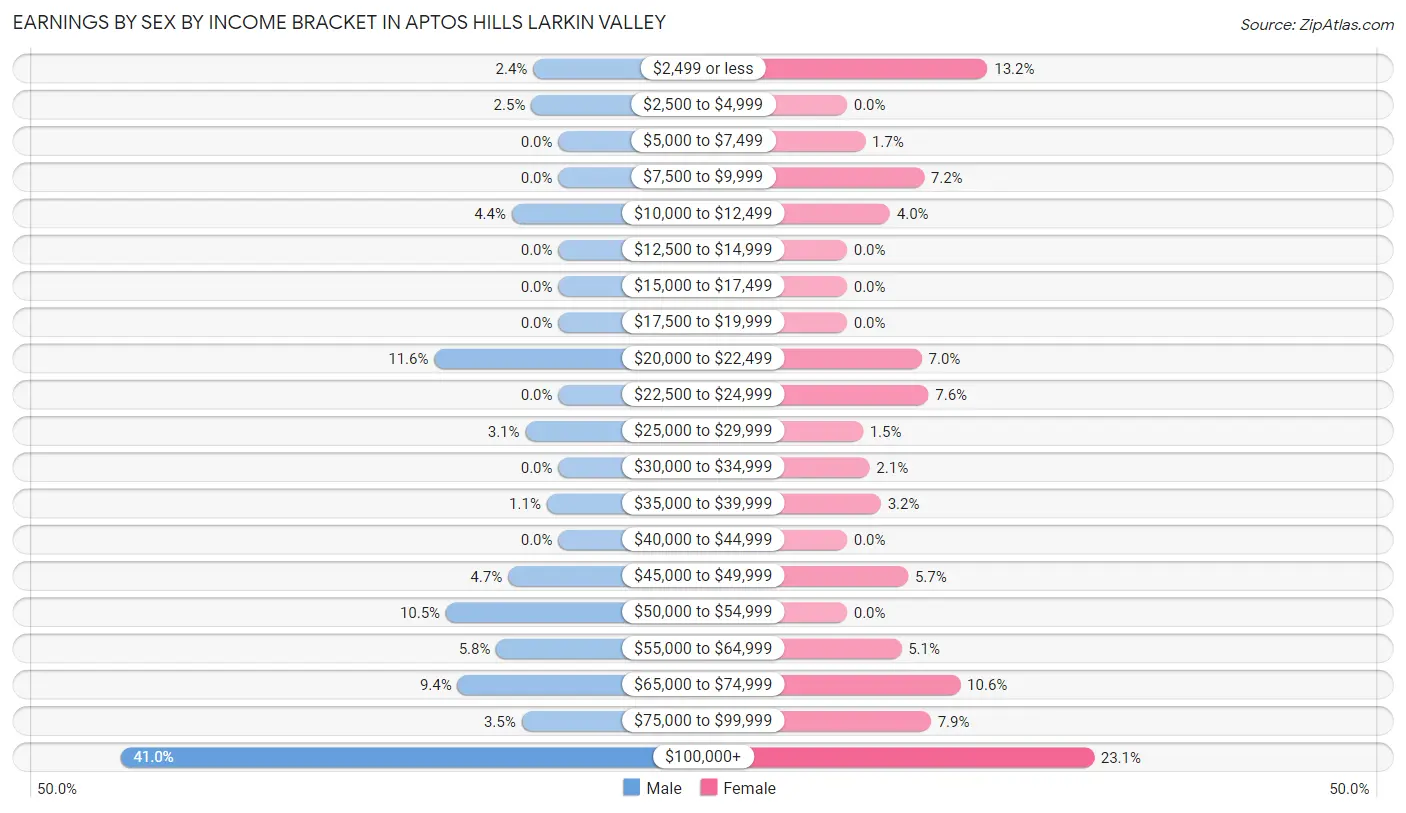
Earnings by Sex by Income Bracket in Aptos Hills Larkin Valley
The most common earnings brackets in Aptos Hills Larkin Valley are $100,000+ for men (226 | 41.0%) and $100,000+ for women (109 | 23.1%).
| Income | Male | Female |
| $2,499 or less | 13 (2.4%) | 62 (13.2%) |
| $2,500 to $4,999 | 14 (2.5%) | 0 (0.0%) |
| $5,000 to $7,499 | 0 (0.0%) | 8 (1.7%) |
| $7,500 to $9,999 | 0 (0.0%) | 34 (7.2%) |
| $10,000 to $12,499 | 24 (4.4%) | 19 (4.0%) |
| $12,500 to $14,999 | 0 (0.0%) | 0 (0.0%) |
| $15,000 to $17,499 | 0 (0.0%) | 0 (0.0%) |
| $17,500 to $19,999 | 0 (0.0%) | 0 (0.0%) |
| $20,000 to $22,499 | 64 (11.6%) | 33 (7.0%) |
| $22,500 to $24,999 | 0 (0.0%) | 36 (7.6%) |
| $25,000 to $29,999 | 17 (3.1%) | 7 (1.5%) |
| $30,000 to $34,999 | 0 (0.0%) | 10 (2.1%) |
| $35,000 to $39,999 | 6 (1.1%) | 15 (3.2%) |
| $40,000 to $44,999 | 0 (0.0%) | 0 (0.0%) |
| $45,000 to $49,999 | 26 (4.7%) | 27 (5.7%) |
| $50,000 to $54,999 | 58 (10.5%) | 0 (0.0%) |
| $55,000 to $64,999 | 32 (5.8%) | 24 (5.1%) |
| $65,000 to $74,999 | 52 (9.4%) | 50 (10.6%) |
| $75,000 to $99,999 | 19 (3.5%) | 37 (7.9%) |
| $100,000+ | 226 (41.0%) | 109 (23.1%) |
| Total | 551 (100.0%) | 471 (100.0%) |
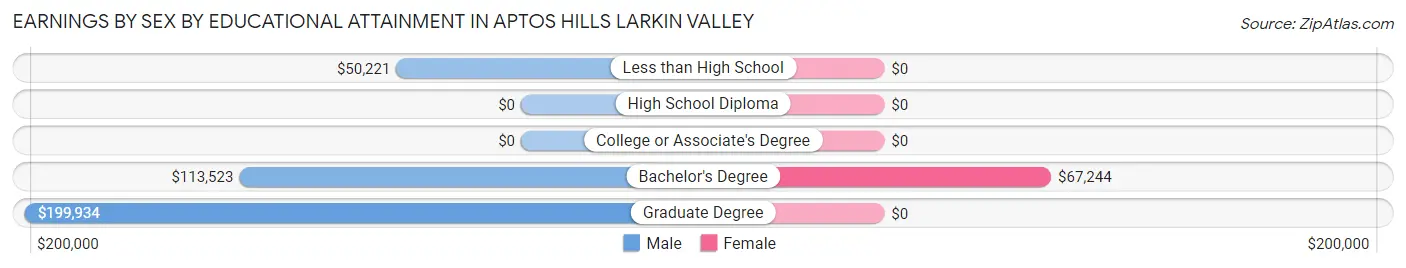
Earnings by Sex by Educational Attainment in Aptos Hills Larkin Valley
Average earnings in Aptos Hills Larkin Valley are $69,671 for men and $46,065 for women, a difference of 33.9%. Men with an educational attainment of graduate degree enjoy the highest average annual earnings of $199,934, while those with less than high school education earn the least with $50,221. Women with an educational attainment of bachelor's degree earn the most with the average annual earnings of $67,244, while those with bachelor's degree education have the smallest earnings of $67,244.
| Educational Attainment | Male Income | Female Income |
| Less than High School | $50,221 | $0 |
| High School Diploma | - | - |
| College or Associate's Degree | - | - |
| Bachelor's Degree | $113,523 | $67,244 |
| Graduate Degree | $199,934 | $0 |
| Total | $69,671 | $46,065 |
Family Income in Aptos Hills Larkin Valley
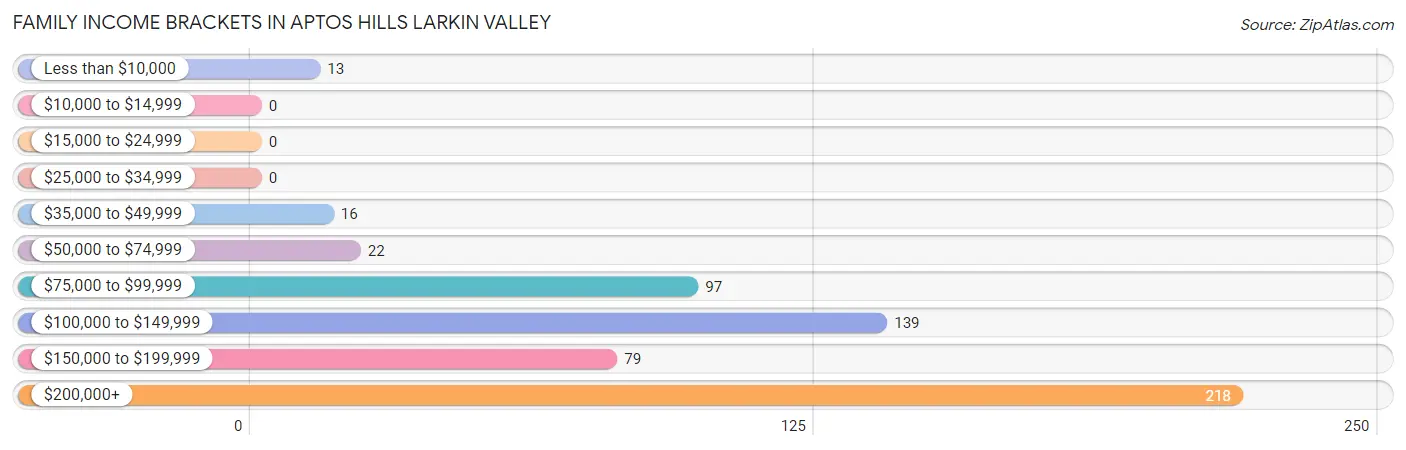
Family Income Brackets in Aptos Hills Larkin Valley
According to the Aptos Hills Larkin Valley family income data, there are 218 families falling into the $200,000+ income range, which is the most common income bracket and makes up 37.3% of all families.
| Income Bracket | # Families | % Families |
| Less than $10,000 | 13 | 2.2% |
| $10,000 to $14,999 | 0 | 0.0% |
| $15,000 to $24,999 | 0 | 0.0% |
| $25,000 to $34,999 | 0 | 0.0% |
| $35,000 to $49,999 | 16 | 2.7% |
| $50,000 to $74,999 | 22 | 3.8% |
| $75,000 to $99,999 | 97 | 16.6% |
| $100,000 to $149,999 | 139 | 23.8% |
| $150,000 to $199,999 | 79 | 13.5% |
| $200,000+ | 218 | 37.3% |
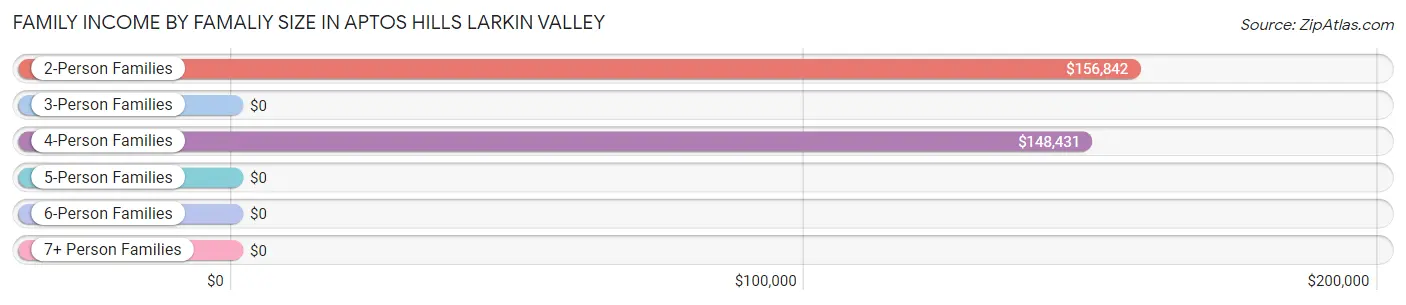
Family Income by Famaliy Size in Aptos Hills Larkin Valley
2-person families (300 | 51.4%) account for the highest median family income in Aptos Hills Larkin Valley with $156,842 per family, while 2-person families (300 | 51.4%) have the highest median income of $78,421 per family member.
| Income Bracket | # Families | Median Income |
| 2-Person Families | 300 (51.4%) | $156,842 |
| 3-Person Families | 162 (27.7%) | $0 |
| 4-Person Families | 103 (17.6%) | $148,431 |
| 5-Person Families | 11 (1.9%) | $0 |
| 6-Person Families | 8 (1.4%) | $0 |
| 7+ Person Families | 0 (0.0%) | $0 |
| Total | 584 (100.0%) | $150,833 |
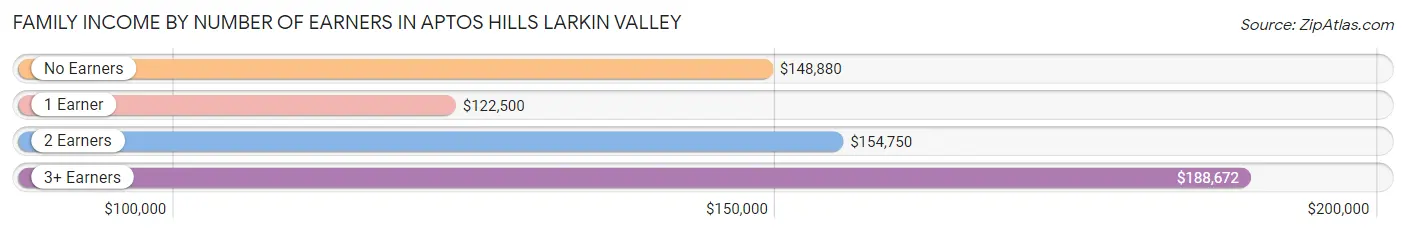
Family Income by Number of Earners in Aptos Hills Larkin Valley
The median family income in Aptos Hills Larkin Valley is $150,833, with families comprising 3+ earners (61) having the highest median family income of $188,672, while families with 1 earner (148) have the lowest median family income of $122,500, accounting for 10.4% and 25.3% of families, respectively.
| Number of Earners | # Families | Median Income |
| No Earners | 81 (13.9%) | $148,880 |
| 1 Earner | 148 (25.3%) | $122,500 |
| 2 Earners | 294 (50.3%) | $154,750 |
| 3+ Earners | 61 (10.4%) | $188,672 |
| Total | 584 (100.0%) | $150,833 |
Household Income in Aptos Hills Larkin Valley
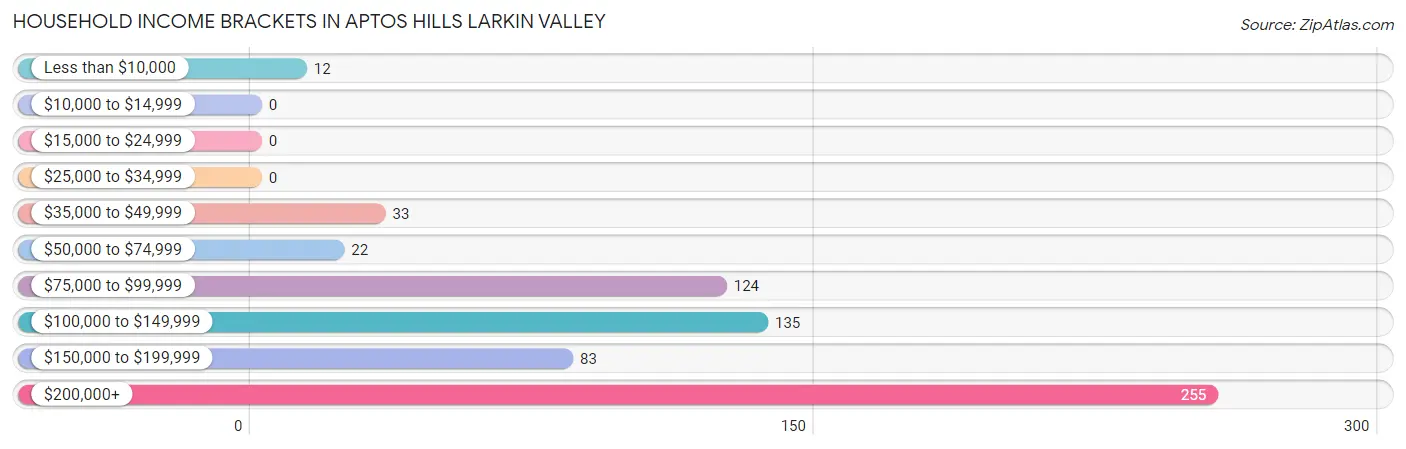
Household Income Brackets in Aptos Hills Larkin Valley
With 255 households falling in the category, the $200,000+ income range is the most frequent in Aptos Hills Larkin Valley, accounting for 38.4% of all households.
| Income Bracket | # Households | % Households |
| Less than $10,000 | 12 | 1.8% |
| $10,000 to $14,999 | 0 | 0.0% |
| $15,000 to $24,999 | 0 | 0.0% |
| $25,000 to $34,999 | 0 | 0.0% |
| $35,000 to $49,999 | 33 | 5.0% |
| $50,000 to $74,999 | 22 | 3.3% |
| $75,000 to $99,999 | 124 | 18.7% |
| $100,000 to $149,999 | 135 | 20.3% |
| $150,000 to $199,999 | 83 | 12.5% |
| $200,000+ | 255 | 38.4% |
Household Income by Householder Age in Aptos Hills Larkin Valley
The median household income in Aptos Hills Larkin Valley is $151,000, with the highest median household income of $173,636 found in the 45 to 64 years age bracket for the primary householder. A total of 196 households (29.5%) fall into this category.
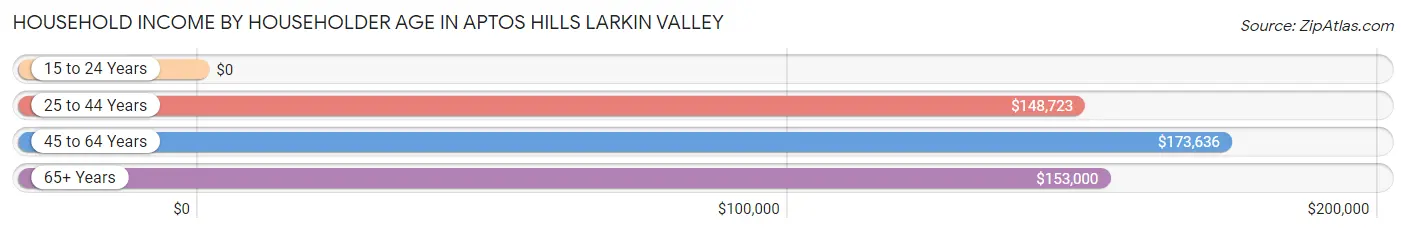
| Income Bracket | # Households | Median Income |
| 15 to 24 Years | 0 (0.0%) | $0 |
| 25 to 44 Years | 70 (10.5%) | $148,723 |
| 45 to 64 Years | 196 (29.5%) | $173,636 |
| 65+ Years | 398 (59.9%) | $153,000 |
| Total | 664 (100.0%) | $151,000 |
Poverty in Aptos Hills Larkin Valley
Income Below Poverty by Sex and Age in Aptos Hills Larkin Valley
With 3.9% poverty level for males and 4.1% for females among the residents of Aptos Hills Larkin Valley, 45 to 54 year old males and 25 to 34 year old females are the most vulnerable to poverty, with 14 males (15.6%) and 12 females (20.3%) in their respective age groups living below the poverty level.
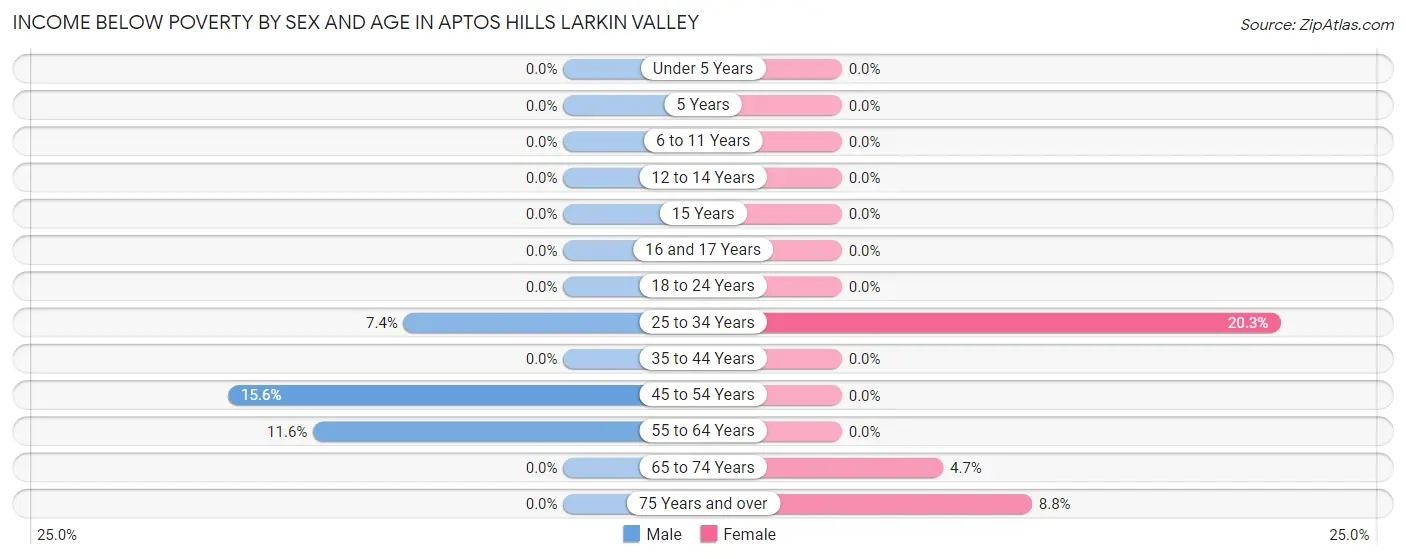
| Age Bracket | Male | Female |
| Under 5 Years | 0 (0.0%) | 0 (0.0%) |
| 5 Years | 0 (0.0%) | 0 (0.0%) |
| 6 to 11 Years | 0 (0.0%) | 0 (0.0%) |
| 12 to 14 Years | 0 (0.0%) | 0 (0.0%) |
| 15 Years | 0 (0.0%) | 0 (0.0%) |
| 16 and 17 Years | 0 (0.0%) | 0 (0.0%) |
| 18 to 24 Years | 0 (0.0%) | 0 (0.0%) |
| 25 to 34 Years | 8 (7.4%) | 12 (20.3%) |
| 35 to 44 Years | 0 (0.0%) | 0 (0.0%) |
| 45 to 54 Years | 14 (15.6%) | 0 (0.0%) |
| 55 to 64 Years | 13 (11.6%) | 0 (0.0%) |
| 65 to 74 Years | 0 (0.0%) | 11 (4.7%) |
| 75 Years and over | 0 (0.0%) | 12 (8.8%) |
| Total | 35 (3.9%) | 35 (4.1%) |
Income Above Poverty by Sex and Age in Aptos Hills Larkin Valley
According to the poverty statistics in Aptos Hills Larkin Valley, males aged under 5 years and females aged under 5 years are the age groups that are most secure financially, with 100.0% of males and 100.0% of females in these age groups living above the poverty line.
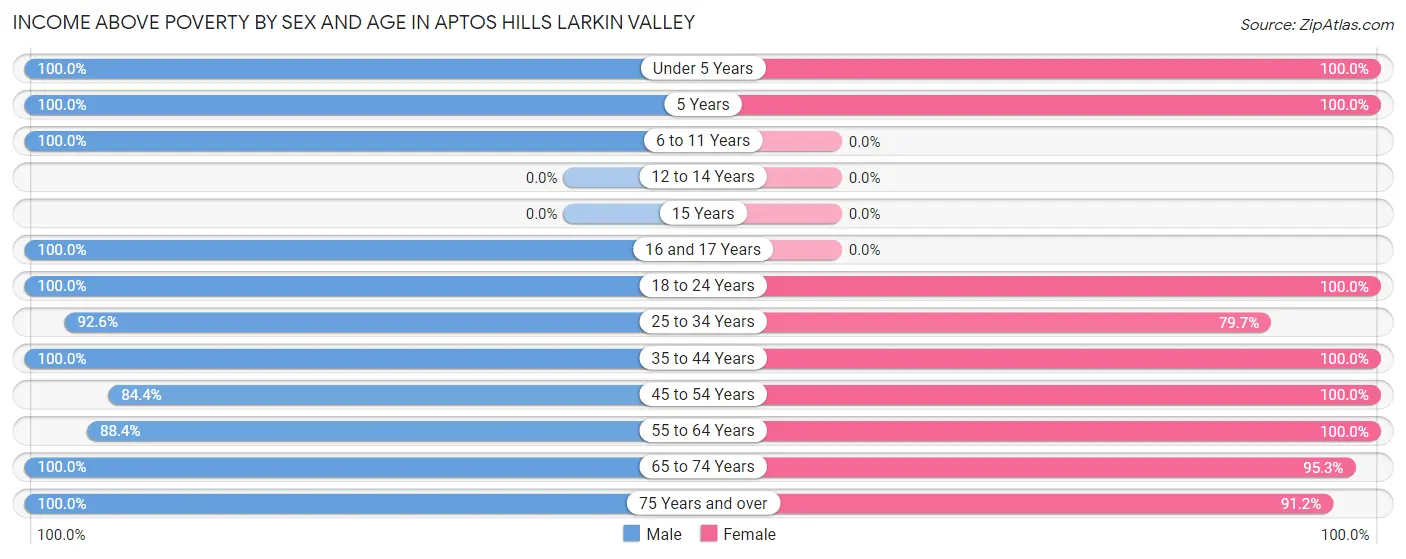
| Age Bracket | Male | Female |
| Under 5 Years | 65 (100.0%) | 27 (100.0%) |
| 5 Years | 11 (100.0%) | 52 (100.0%) |
| 6 to 11 Years | 20 (100.0%) | 0 (0.0%) |
| 12 to 14 Years | 0 (0.0%) | 0 (0.0%) |
| 15 Years | 0 (0.0%) | 0 (0.0%) |
| 16 and 17 Years | 15 (100.0%) | 0 (0.0%) |
| 18 to 24 Years | 42 (100.0%) | 12 (100.0%) |
| 25 to 34 Years | 100 (92.6%) | 47 (79.7%) |
| 35 to 44 Years | 69 (100.0%) | 77 (100.0%) |
| 45 to 54 Years | 76 (84.4%) | 90 (100.0%) |
| 55 to 64 Years | 99 (88.4%) | 166 (100.0%) |
| 65 to 74 Years | 288 (100.0%) | 223 (95.3%) |
| 75 Years and over | 73 (100.0%) | 124 (91.2%) |
| Total | 858 (96.1%) | 818 (95.9%) |
Income Below Poverty Among Married-Couple Families in Aptos Hills Larkin Valley
The poverty statistics for married-couple families in Aptos Hills Larkin Valley show that 2.4% or 13 of the total 547 families live below the poverty line. Families with no children have the highest poverty rate of 2.9%, comprising of 13 families. On the other hand, families with 1 or 2 children have the lowest poverty rate of 0.0%, which includes 0 families.
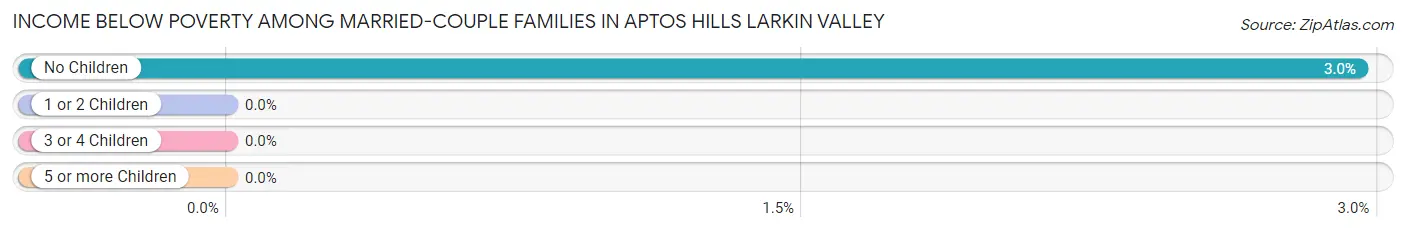
| Children | Above Poverty | Below Poverty |
| No Children | 428 (97.1%) | 13 (2.9%) |
| 1 or 2 Children | 106 (100.0%) | 0 (0.0%) |
| 3 or 4 Children | 0 (0.0%) | 0 (0.0%) |
| 5 or more Children | 0 (0.0%) | 0 (0.0%) |
| Total | 534 (97.6%) | 13 (2.4%) |
Income Below Poverty Among Single-Parent Households in Aptos Hills Larkin Valley
| Children | Single Father | Single Mother |
| No Children | 0 (0.0%) | 0 (0.0%) |
| 1 or 2 Children | 0 (0.0%) | 0 (0.0%) |
| 3 or 4 Children | 0 (0.0%) | 0 (0.0%) |
| 5 or more Children | 0 (0.0%) | 0 (0.0%) |
| Total | 0 (0.0%) | 0 (0.0%) |
Income Below Poverty Among Married-Couple vs Single-Parent Households in Aptos Hills Larkin Valley
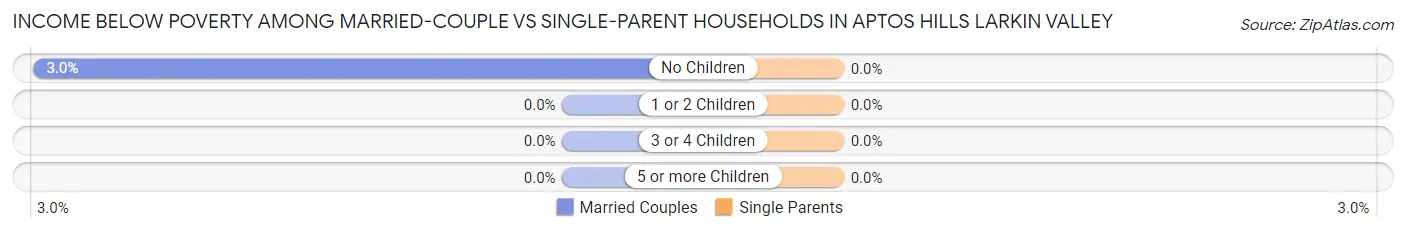
| Children | Married-Couple Families | Single-Parent Households |
| No Children | 13 (2.9%) | 0 (0.0%) |
| 1 or 2 Children | 0 (0.0%) | 0 (0.0%) |
| 3 or 4 Children | 0 (0.0%) | 0 (0.0%) |
| 5 or more Children | 0 (0.0%) | 0 (0.0%) |
| Total | 13 (2.4%) | 0 (0.0%) |
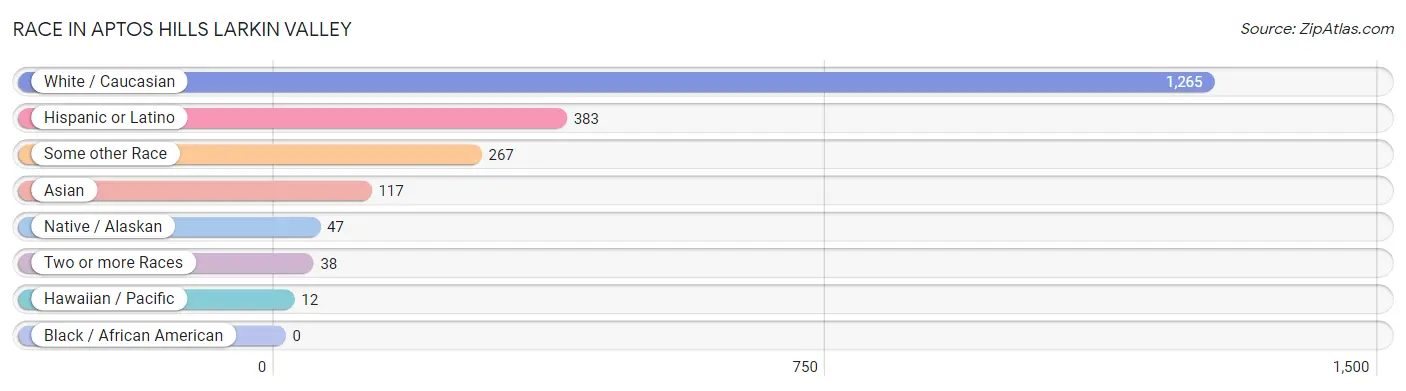
Race in Aptos Hills Larkin Valley
The most populous races in Aptos Hills Larkin Valley are White / Caucasian (1,265 | 72.5%), Hispanic or Latino (383 | 21.9%), and Some other Race (267 | 15.3%).
| Race | # Population | % Population |
| Asian | 117 | 6.7% |
| Black / African American | 0 | 0.0% |
| Hawaiian / Pacific | 12 | 0.7% |
| Hispanic or Latino | 383 | 21.9% |
| Native / Alaskan | 47 | 2.7% |
| White / Caucasian | 1,265 | 72.5% |
| Two or more Races | 38 | 2.2% |
| Some other Race | 267 | 15.3% |
| Total | 1,746 | 100.0% |
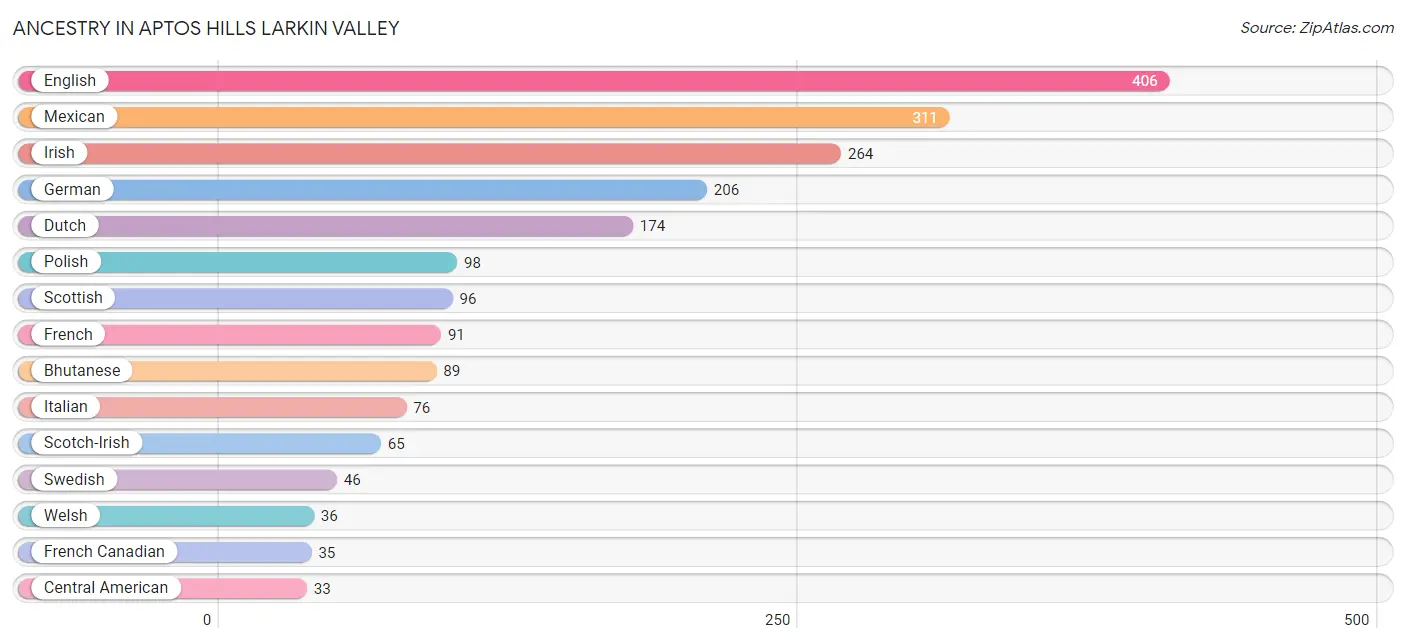
Ancestry in Aptos Hills Larkin Valley
The most populous ancestries reported in Aptos Hills Larkin Valley are English (406 | 23.3%), Mexican (311 | 17.8%), Irish (264 | 15.1%), German (206 | 11.8%), and Dutch (174 | 10.0%), together accounting for 78.0% of all Aptos Hills Larkin Valley residents.
| Ancestry | # Population | % Population |
| Alsatian | 14 | 0.8% |
| American | 19 | 1.1% |
| Austrian | 11 | 0.6% |
| Bhutanese | 89 | 5.1% |
| Central American | 33 | 1.9% |
| Central American Indian | 15 | 0.9% |
| Colombian | 12 | 0.7% |
| Czech | 19 | 1.1% |
| Danish | 23 | 1.3% |
| Dutch | 174 | 10.0% |
| English | 406 | 23.3% |
| European | 28 | 1.6% |
| French | 91 | 5.2% |
| French Canadian | 35 | 2.0% |
| German | 206 | 11.8% |
| Greek | 18 | 1.0% |
| Guatemalan | 15 | 0.9% |
| Honduran | 18 | 1.0% |
| Hungarian | 22 | 1.3% |
| Irish | 264 | 15.1% |
| Italian | 76 | 4.3% |
| Korean | 19 | 1.1% |
| Mexican | 311 | 17.8% |
| Mexican American Indian | 32 | 1.8% |
| Norwegian | 14 | 0.8% |
| Polish | 98 | 5.6% |
| Portuguese | 19 | 1.1% |
| Russian | 19 | 1.1% |
| Samoan | 12 | 0.7% |
| Scotch-Irish | 65 | 3.7% |
| Scottish | 96 | 5.5% |
| Serbian | 11 | 0.6% |
| South American | 12 | 0.7% |
| Spanish | 19 | 1.1% |
| Swedish | 46 | 2.6% |
| Thai | 9 | 0.5% |
| Welsh | 36 | 2.1% | View All 37 Rows |
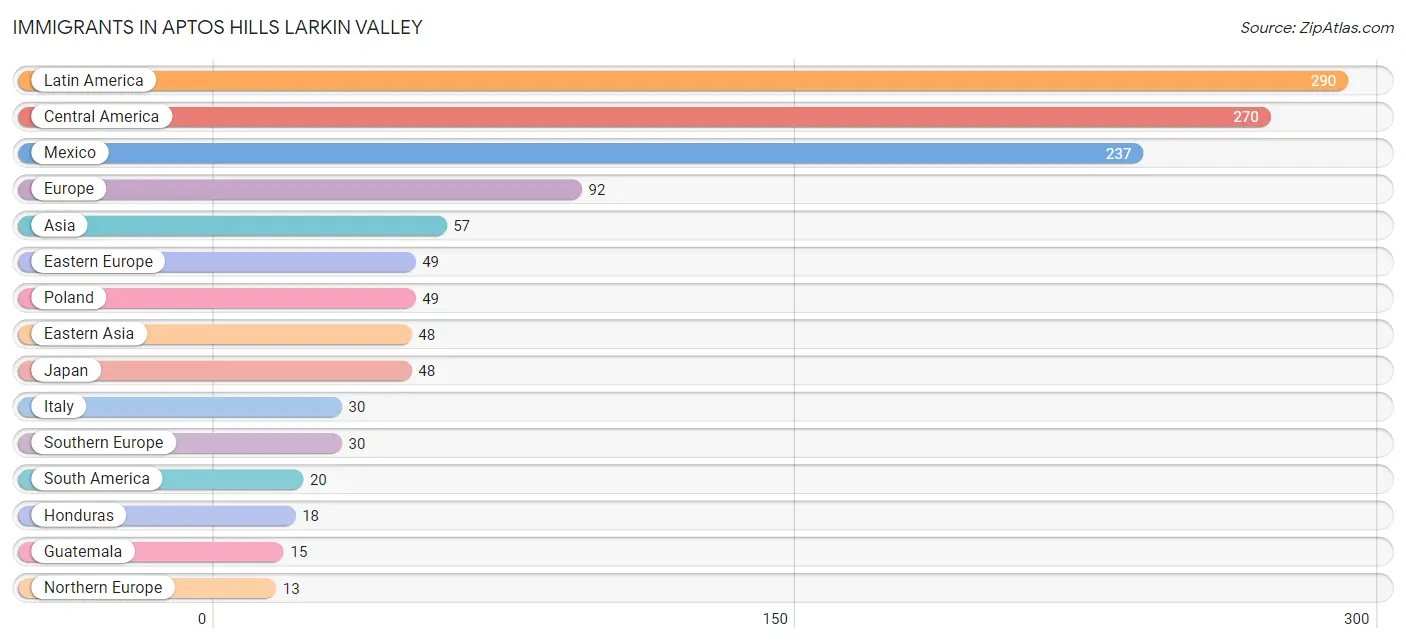
Immigrants in Aptos Hills Larkin Valley
The most numerous immigrant groups reported in Aptos Hills Larkin Valley came from Latin America (290 | 16.6%), Central America (270 | 15.5%), Mexico (237 | 13.6%), Europe (92 | 5.3%), and Asia (57 | 3.3%), together accounting for 54.2% of all Aptos Hills Larkin Valley residents.
| Immigration Origin | # Population | % Population |
| Asia | 57 | 3.3% |
| Brazil | 8 | 0.5% |
| Central America | 270 | 15.5% |
| Colombia | 12 | 0.7% |
| Eastern Asia | 48 | 2.8% |
| Eastern Europe | 49 | 2.8% |
| Europe | 92 | 5.3% |
| Guatemala | 15 | 0.9% |
| Honduras | 18 | 1.0% |
| India | 9 | 0.5% |
| Italy | 30 | 1.7% |
| Japan | 48 | 2.8% |
| Latin America | 290 | 16.6% |
| Mexico | 237 | 13.6% |
| Northern Europe | 13 | 0.7% |
| Poland | 49 | 2.8% |
| South America | 20 | 1.1% |
| South Central Asia | 9 | 0.5% |
| Southern Europe | 30 | 1.7% | View All 19 Rows |
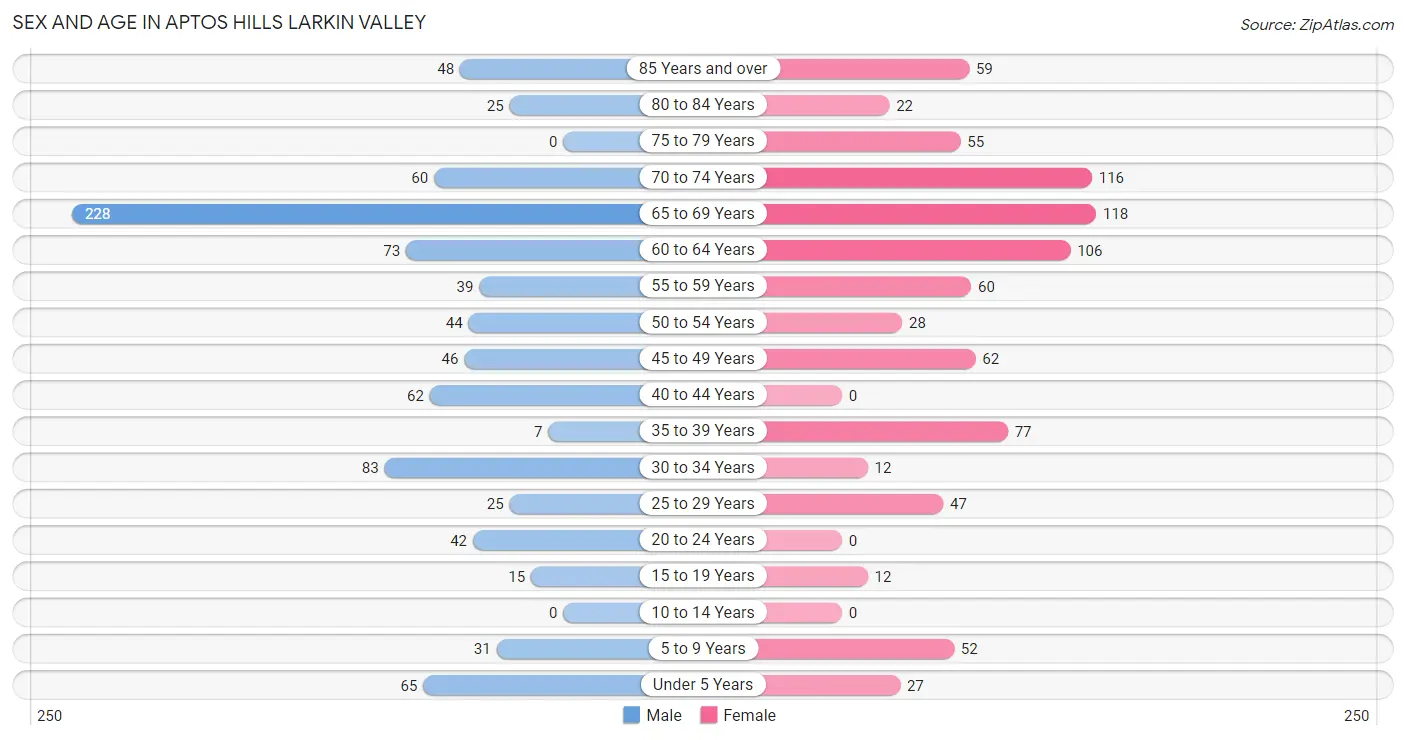
Sex and Age in Aptos Hills Larkin Valley
Sex and Age in Aptos Hills Larkin Valley
The most populous age groups in Aptos Hills Larkin Valley are 65 to 69 Years (228 | 25.5%) for men and 65 to 69 Years (118 | 13.8%) for women.
| Age Bracket | Male | Female |
| Under 5 Years | 65 (7.3%) | 27 (3.2%) |
| 5 to 9 Years | 31 (3.5%) | 52 (6.1%) |
| 10 to 14 Years | 0 (0.0%) | 0 (0.0%) |
| 15 to 19 Years | 15 (1.7%) | 12 (1.4%) |
| 20 to 24 Years | 42 (4.7%) | 0 (0.0%) |
| 25 to 29 Years | 25 (2.8%) | 47 (5.5%) |
| 30 to 34 Years | 83 (9.3%) | 12 (1.4%) |
| 35 to 39 Years | 7 (0.8%) | 77 (9.0%) |
| 40 to 44 Years | 62 (6.9%) | 0 (0.0%) |
| 45 to 49 Years | 46 (5.1%) | 62 (7.3%) |
| 50 to 54 Years | 44 (4.9%) | 28 (3.3%) |
| 55 to 59 Years | 39 (4.4%) | 60 (7.0%) |
| 60 to 64 Years | 73 (8.2%) | 106 (12.4%) |
| 65 to 69 Years | 228 (25.5%) | 118 (13.8%) |
| 70 to 74 Years | 60 (6.7%) | 116 (13.6%) |
| 75 to 79 Years | 0 (0.0%) | 55 (6.5%) |
| 80 to 84 Years | 25 (2.8%) | 22 (2.6%) |
| 85 Years and over | 48 (5.4%) | 59 (6.9%) |
| Total | 893 (100.0%) | 853 (100.0%) |
Families and Households in Aptos Hills Larkin Valley
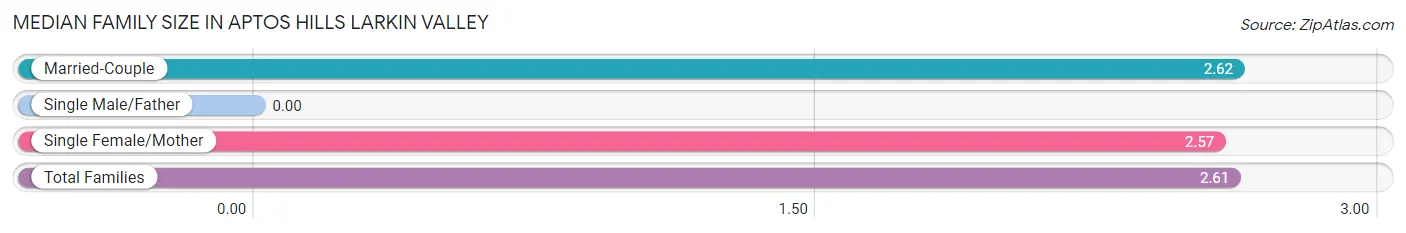
Median Family Size in Aptos Hills Larkin Valley
| Family Type | # Families | Family Size |
| Married-Couple | 547 (93.7%) | 2.62 |
| Single Male/Father | 0 (0.0%) | - |
| Single Female/Mother | 37 (6.3%) | 2.57 |
| Total Families | 584 (100.0%) | 2.61 |
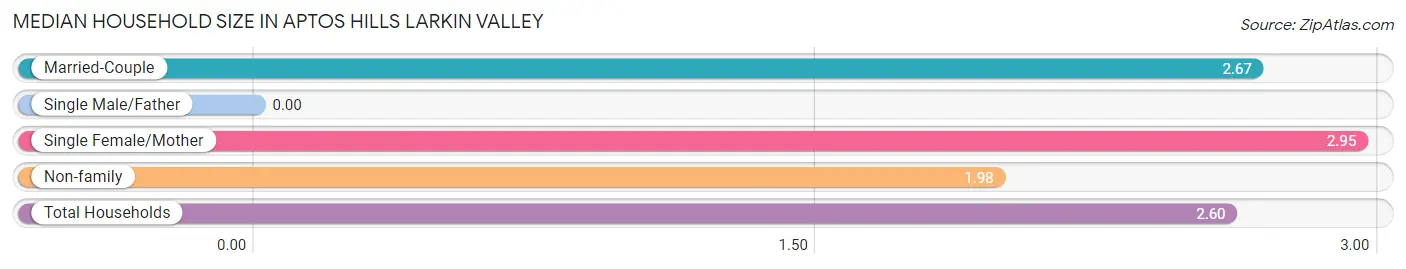
Median Household Size in Aptos Hills Larkin Valley
| Household Type | # Households | Household Size |
| Married-Couple | 547 (82.4%) | 2.67 |
| Single Male/Father | 0 (0.0%) | - |
| Single Female/Mother | 37 (5.6%) | 2.95 |
| Non-family | 80 (12.0%) | 1.98 |
| Total Households | 664 (100.0%) | 2.60 |
Household Size by Marriage Status in Aptos Hills Larkin Valley
Out of a total of 664 households in Aptos Hills Larkin Valley, 584 (87.9%) are family households, while 80 (12.0%) are nonfamily households. The most numerous type of family households are 2-person households, comprising 283, and the most common type of nonfamily households are 1-person households, comprising 29.
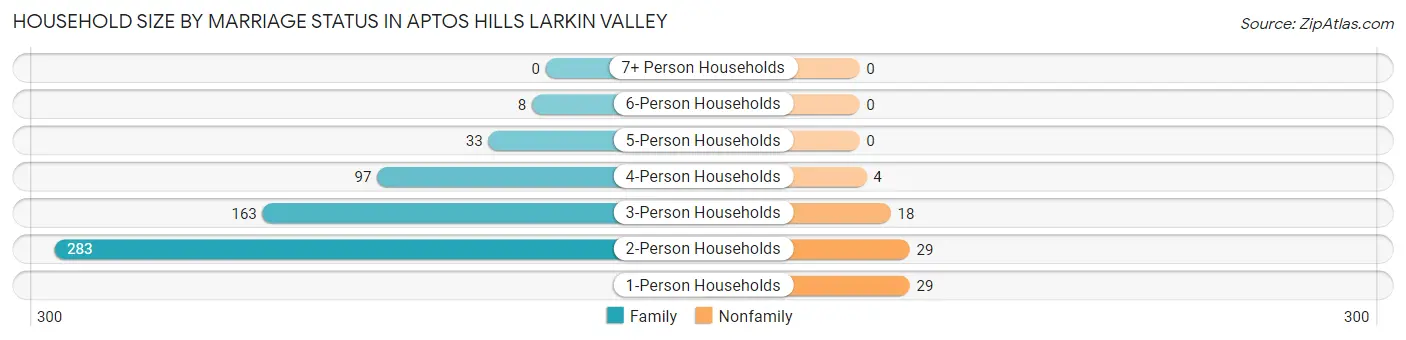
| Household Size | Family Households | Nonfamily Households |
| 1-Person Households | - | 29 (4.4%) |
| 2-Person Households | 283 (42.6%) | 29 (4.4%) |
| 3-Person Households | 163 (24.5%) | 18 (2.7%) |
| 4-Person Households | 97 (14.6%) | 4 (0.6%) |
| 5-Person Households | 33 (5.0%) | 0 (0.0%) |
| 6-Person Households | 8 (1.2%) | 0 (0.0%) |
| 7+ Person Households | 0 (0.0%) | 0 (0.0%) |
| Total | 584 (87.9%) | 80 (12.0%) |
Female Fertility in Aptos Hills Larkin Valley
Fertility by Age in Aptos Hills Larkin Valley
Average fertility rate in Aptos Hills Larkin Valley is 134.0 births per 1,000 women. Women in the age bracket of 20 to 34 years have the highest fertility rate with 203.0 births per 1,000 women. Women in the age bracket of 35 to 50 years acount for 60.0% of all women with births.
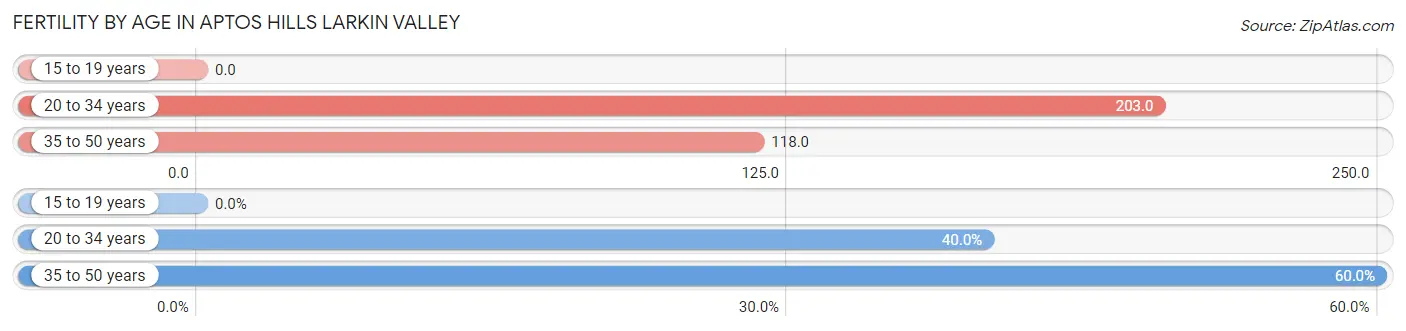
| Age Bracket | Women with Births | Births / 1,000 Women |
| 15 to 19 years | 0 (0.0%) | 0.0 |
| 20 to 34 years | 12 (40.0%) | 203.0 |
| 35 to 50 years | 18 (60.0%) | 118.0 |
| Total | 30 (100.0%) | 134.0 |
Fertility by Age by Marriage Status in Aptos Hills Larkin Valley
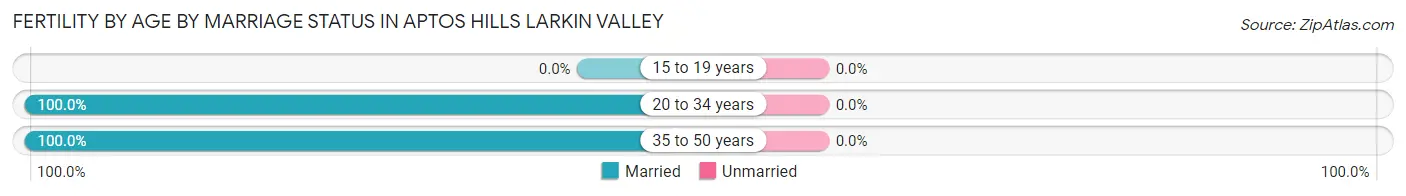
| Age Bracket | Married | Unmarried |
| 15 to 19 years | 0 (0.0%) | 0 (0.0%) |
| 20 to 34 years | 12 (100.0%) | 0 (0.0%) |
| 35 to 50 years | 18 (100.0%) | 0 (0.0%) |
| Total | 30 (100.0%) | 0 (0.0%) |
Fertility by Education in Aptos Hills Larkin Valley
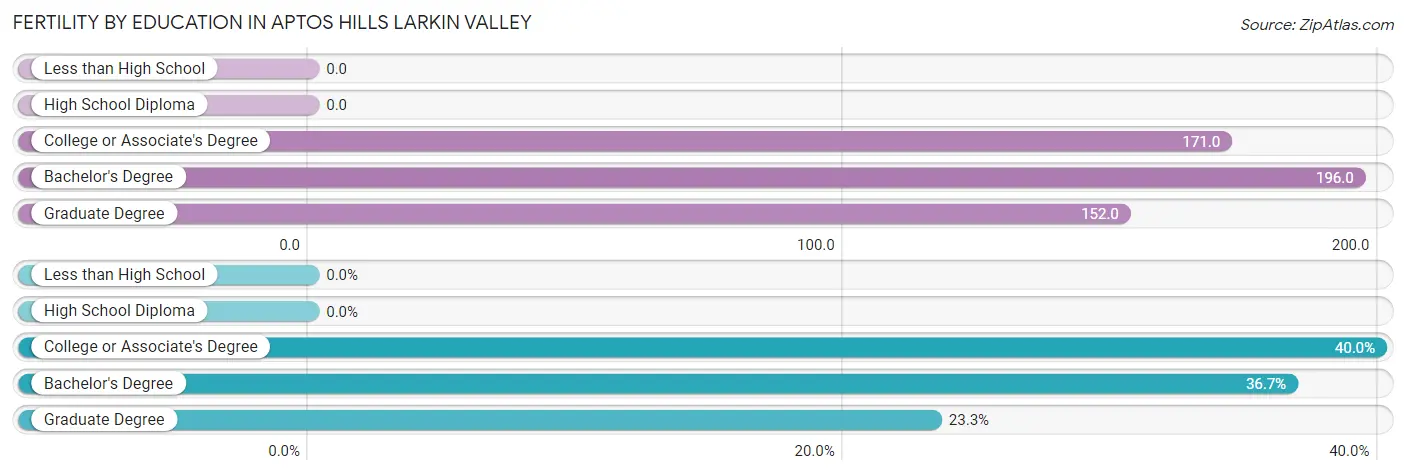
| Educational Attainment | Women with Births | Births / 1,000 Women |
| Less than High School | 0 (0.0%) | 0.0 |
| High School Diploma | 0 (0.0%) | 0.0 |
| College or Associate's Degree | 12 (40.0%) | 171.0 |
| Bachelor's Degree | 11 (36.7%) | 196.0 |
| Graduate Degree | 7 (23.3%) | 152.0 |
| Total | 30 (100.0%) | 134.0 |
Fertility by Education by Marriage Status in Aptos Hills Larkin Valley
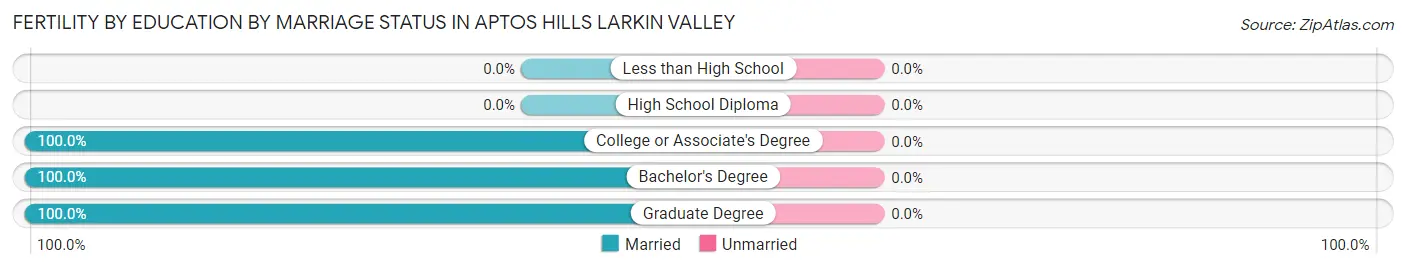
| Educational Attainment | Married | Unmarried |
| Less than High School | 0 (0.0%) | 0 (0.0%) |
| High School Diploma | 0 (0.0%) | 0 (0.0%) |
| College or Associate's Degree | 12 (100.0%) | 0 (0.0%) |
| Bachelor's Degree | 11 (100.0%) | 0 (0.0%) |
| Graduate Degree | 7 (100.0%) | 0 (0.0%) |
| Total | 30 (100.0%) | 0 (0.0%) |
Employment Characteristics in Aptos Hills Larkin Valley
Employment by Class of Employer in Aptos Hills Larkin Valley
Among the 876 employed individuals in Aptos Hills Larkin Valley, private company employees (520 | 59.4%), self-employed (not incorporated) (105 | 12.0%), and not-for-profit organizations (95 | 10.8%) make up the most common classes of employment.
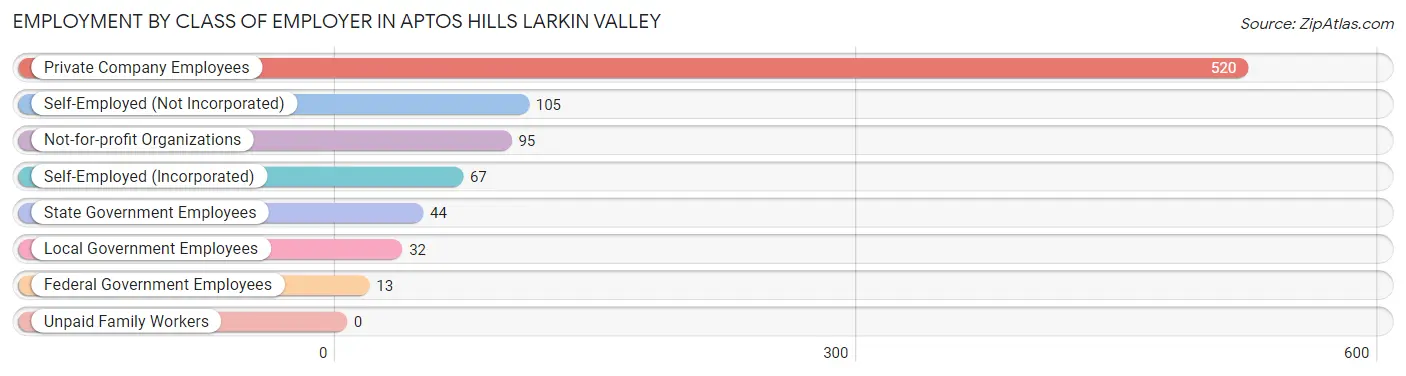
| Employer Class | # Employees | % Employees |
| Private Company Employees | 520 | 59.4% |
| Self-Employed (Incorporated) | 67 | 7.6% |
| Self-Employed (Not Incorporated) | 105 | 12.0% |
| Not-for-profit Organizations | 95 | 10.8% |
| Local Government Employees | 32 | 3.6% |
| State Government Employees | 44 | 5.0% |
| Federal Government Employees | 13 | 1.5% |
| Unpaid Family Workers | 0 | 0.0% |
| Total | 876 | 100.0% |
Employment Status by Age in Aptos Hills Larkin Valley
According to the labor force statistics for Aptos Hills Larkin Valley, out of the total population over 16 years of age (1,571), 57.0% or 895 individuals are in the labor force, with 2.1% or 19 of them unemployed. The age group with the highest labor force participation rate is 30 to 34 years, with 100.0% or 95 individuals in the labor force. Within the labor force, the 55 to 59 years age range has the highest percentage of unemployed individuals, with 22.4% or 19 of them being unemployed.
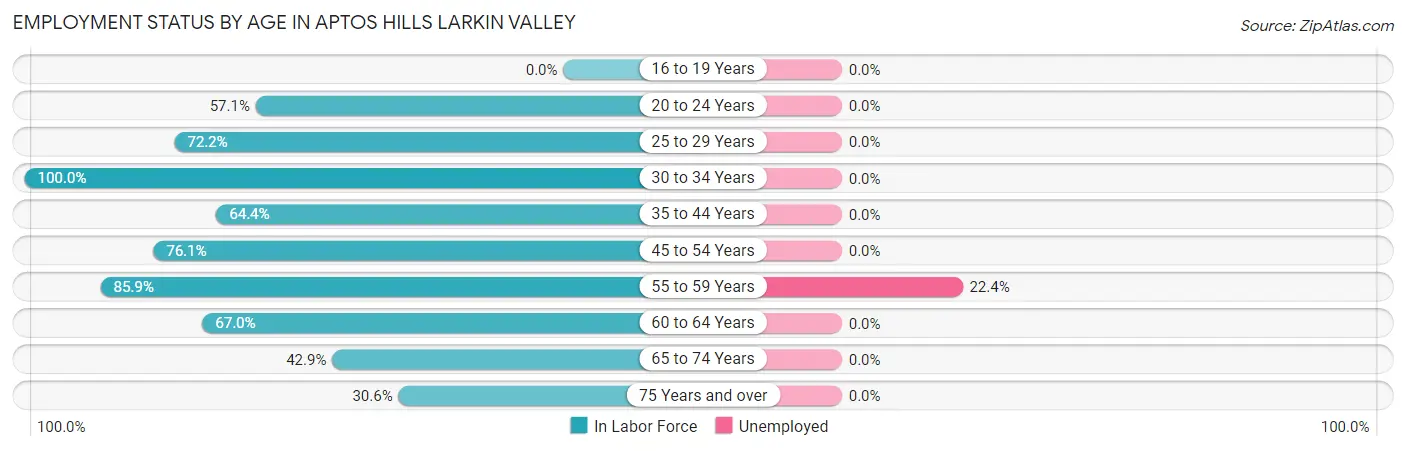
| Age Bracket | In Labor Force | Unemployed |
| 16 to 19 Years | 0 (0.0%) | 0 (0.0%) |
| 20 to 24 Years | 24 (57.1%) | 0 (0.0%) |
| 25 to 29 Years | 52 (72.2%) | 0 (0.0%) |
| 30 to 34 Years | 95 (100.0%) | 0 (0.0%) |
| 35 to 44 Years | 94 (64.4%) | 0 (0.0%) |
| 45 to 54 Years | 137 (76.1%) | 0 (0.0%) |
| 55 to 59 Years | 85 (85.9%) | 19 (22.4%) |
| 60 to 64 Years | 120 (67.0%) | 0 (0.0%) |
| 65 to 74 Years | 224 (42.9%) | 0 (0.0%) |
| 75 Years and over | 64 (30.6%) | 0 (0.0%) |
| Total | 895 (57.0%) | 19 (2.1%) |
Employment Status by Educational Attainment in Aptos Hills Larkin Valley
According to labor force statistics for Aptos Hills Larkin Valley, 75.6% of individuals (583) out of the total population between 25 and 64 years of age (771) are in the labor force, with 3.3% or 19 of them being unemployed. The group with the highest labor force participation rate are those with the educational attainment of bachelor's degree or higher, with 88.3% or 242 individuals in the labor force. Within the labor force, individuals with college / associate degree education have the highest percentage of unemployment, with 10.1% or 19 of them being unemployed.
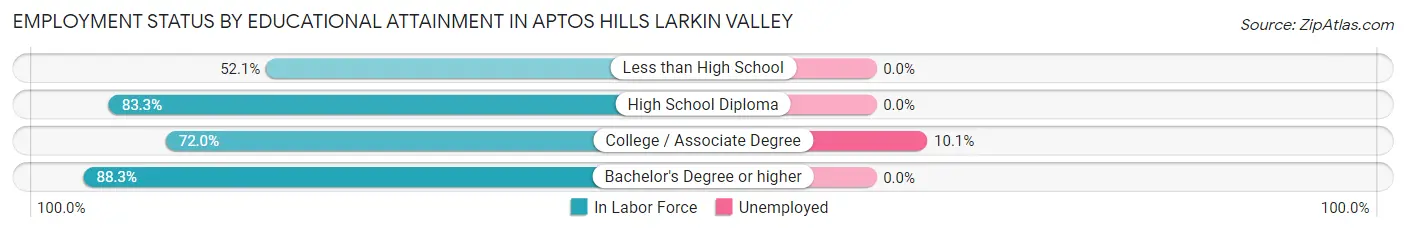
| Educational Attainment | In Labor Force | Unemployed |
| Less than High School | 73 (52.1%) | 0 (0.0%) |
| High School Diploma | 80 (83.3%) | 0 (0.0%) |
| College / Associate Degree | 188 (72.0%) | 26 (10.1%) |
| Bachelor's Degree or higher | 242 (88.3%) | 0 (0.0%) |
| Total | 583 (75.6%) | 25 (3.3%) |
Employment Occupations by Sex in Aptos Hills Larkin Valley
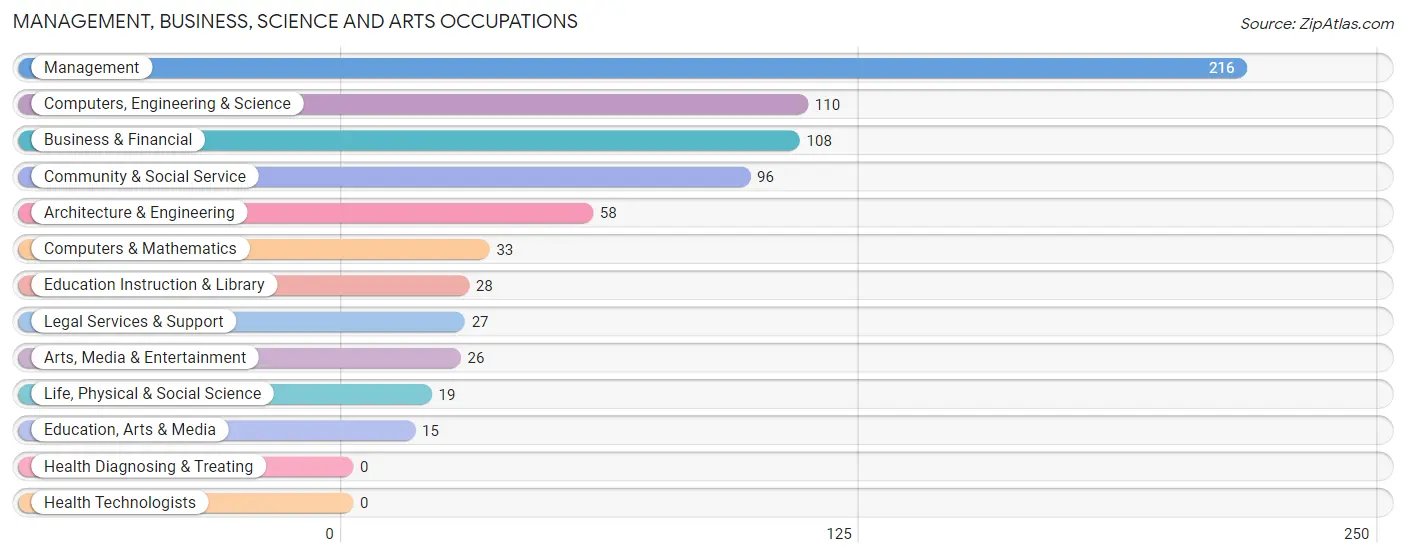
Management, Business, Science and Arts Occupations
The most common Management, Business, Science and Arts occupations in Aptos Hills Larkin Valley are Management (216 | 24.7%), Computers, Engineering & Science (110 | 12.6%), Business & Financial (108 | 12.3%), Community & Social Service (96 | 11.0%), and Architecture & Engineering (58 | 6.6%).
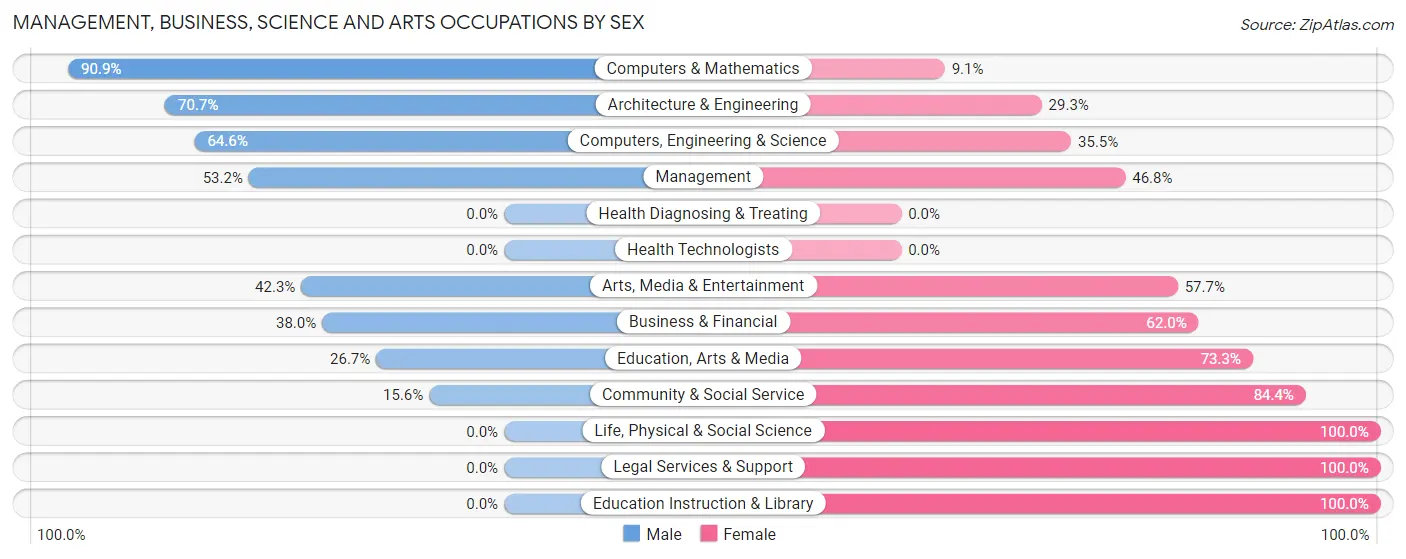
Management, Business, Science and Arts Occupations by Sex
Within the Management, Business, Science and Arts occupations in Aptos Hills Larkin Valley, the most male-oriented occupations are Computers & Mathematics (90.9%), Architecture & Engineering (70.7%), and Computers, Engineering & Science (64.5%), while the most female-oriented occupations are Life, Physical & Social Science (100.0%), Legal Services & Support (100.0%), and Education Instruction & Library (100.0%).
| Occupation | Male | Female |
| Management | 115 (53.2%) | 101 (46.8%) |
| Business & Financial | 41 (38.0%) | 67 (62.0%) |
| Computers, Engineering & Science | 71 (64.5%) | 39 (35.4%) |
| Computers & Mathematics | 30 (90.9%) | 3 (9.1%) |
| Architecture & Engineering | 41 (70.7%) | 17 (29.3%) |
| Life, Physical & Social Science | 0 (0.0%) | 19 (100.0%) |
| Community & Social Service | 15 (15.6%) | 81 (84.4%) |
| Education, Arts & Media | 4 (26.7%) | 11 (73.3%) |
| Legal Services & Support | 0 (0.0%) | 27 (100.0%) |
| Education Instruction & Library | 0 (0.0%) | 28 (100.0%) |
| Arts, Media & Entertainment | 11 (42.3%) | 15 (57.7%) |
| Health Diagnosing & Treating | 0 (0.0%) | 0 (0.0%) |
| Health Technologists | 0 (0.0%) | 0 (0.0%) |
| Total (Category) | 242 (45.7%) | 288 (54.3%) |
| Total (Overall) | 509 (58.1%) | 367 (41.9%) |
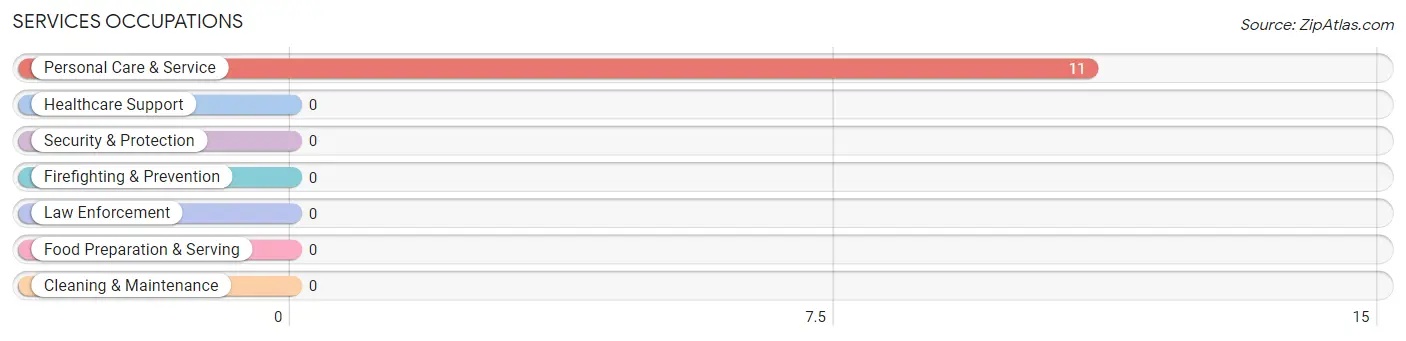
Services Occupations
The most common Services occupations in Aptos Hills Larkin Valley are , and Personal Care & Service (11 | 1.3%).
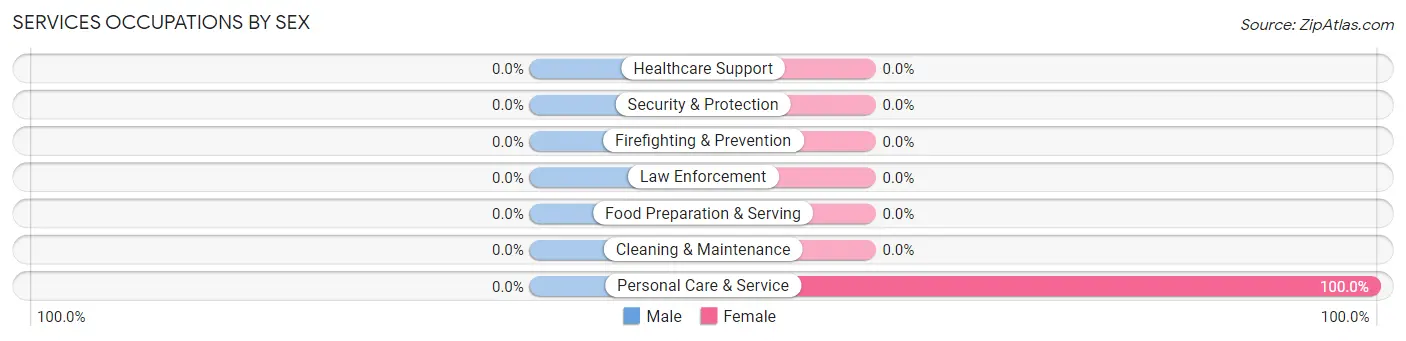
Services Occupations by Sex
| Occupation | Male | Female |
| Healthcare Support | 0 (0.0%) | 0 (0.0%) |
| Security & Protection | 0 (0.0%) | 0 (0.0%) |
| Firefighting & Prevention | 0 (0.0%) | 0 (0.0%) |
| Law Enforcement | 0 (0.0%) | 0 (0.0%) |
| Food Preparation & Serving | 0 (0.0%) | 0 (0.0%) |
| Cleaning & Maintenance | 0 (0.0%) | 0 (0.0%) |
| Personal Care & Service | 0 (0.0%) | 11 (100.0%) |
| Total (Category) | 0 (0.0%) | 11 (100.0%) |
| Total (Overall) | 509 (58.1%) | 367 (41.9%) |
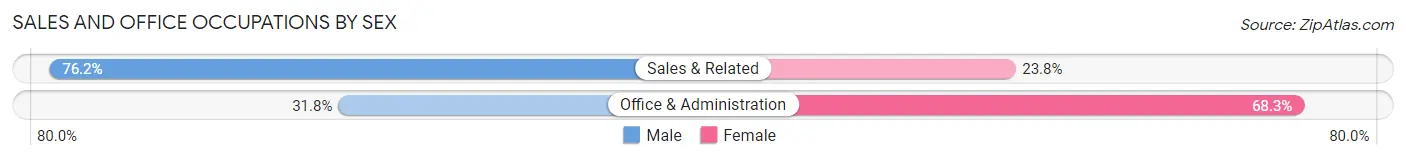
Sales and Office Occupations
The most common Sales and Office occupations in Aptos Hills Larkin Valley are Sales & Related (105 | 12.0%), and Office & Administration (63 | 7.2%).
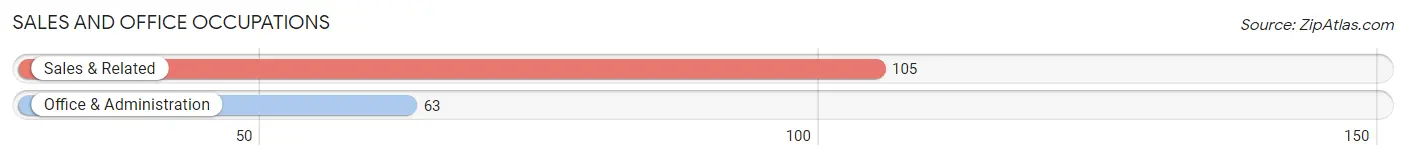
Sales and Office Occupations by Sex
| Occupation | Male | Female |
| Sales & Related | 80 (76.2%) | 25 (23.8%) |
| Office & Administration | 20 (31.8%) | 43 (68.2%) |
| Total (Category) | 100 (59.5%) | 68 (40.5%) |
| Total (Overall) | 509 (58.1%) | 367 (41.9%) |
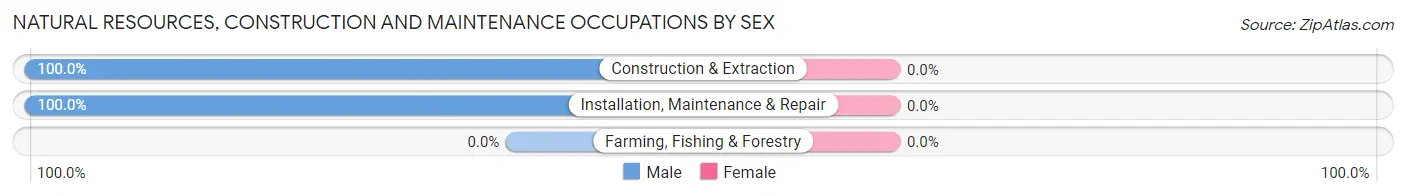
Natural Resources, Construction and Maintenance Occupations
The most common Natural Resources, Construction and Maintenance occupations in Aptos Hills Larkin Valley are Installation, Maintenance & Repair (51 | 5.8%), and Construction & Extraction (13 | 1.5%).
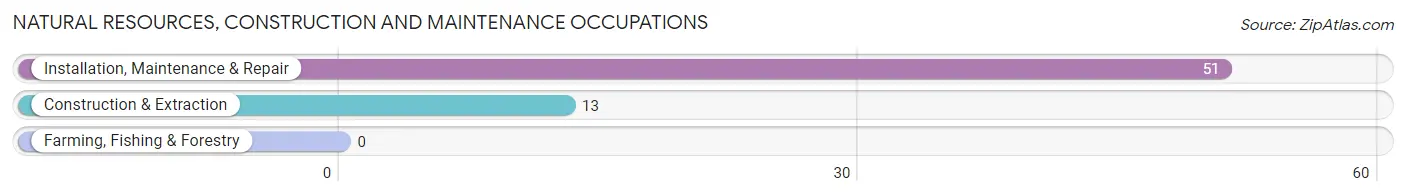
Natural Resources, Construction and Maintenance Occupations by Sex
| Occupation | Male | Female |
| Farming, Fishing & Forestry | 0 (0.0%) | 0 (0.0%) |
| Construction & Extraction | 13 (100.0%) | 0 (0.0%) |
| Installation, Maintenance & Repair | 51 (100.0%) | 0 (0.0%) |
| Total (Category) | 64 (100.0%) | 0 (0.0%) |
| Total (Overall) | 509 (58.1%) | 367 (41.9%) |
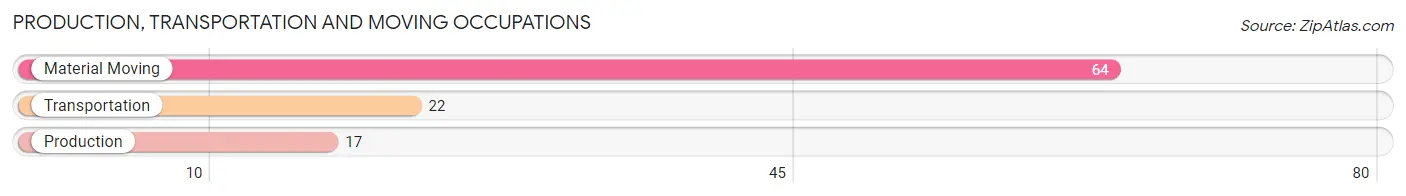
Production, Transportation and Moving Occupations
The most common Production, Transportation and Moving occupations in Aptos Hills Larkin Valley are Material Moving (64 | 7.3%), Transportation (22 | 2.5%), and Production (17 | 1.9%).
Production, Transportation and Moving Occupations by Sex
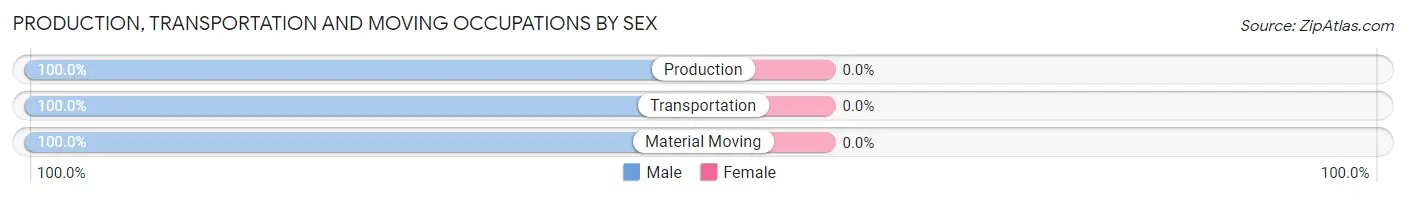
| Occupation | Male | Female |
| Production | 17 (100.0%) | 0 (0.0%) |
| Transportation | 22 (100.0%) | 0 (0.0%) |
| Material Moving | 64 (100.0%) | 0 (0.0%) |
| Total (Category) | 103 (100.0%) | 0 (0.0%) |
| Total (Overall) | 509 (58.1%) | 367 (41.9%) |
Employment Industries by Sex in Aptos Hills Larkin Valley
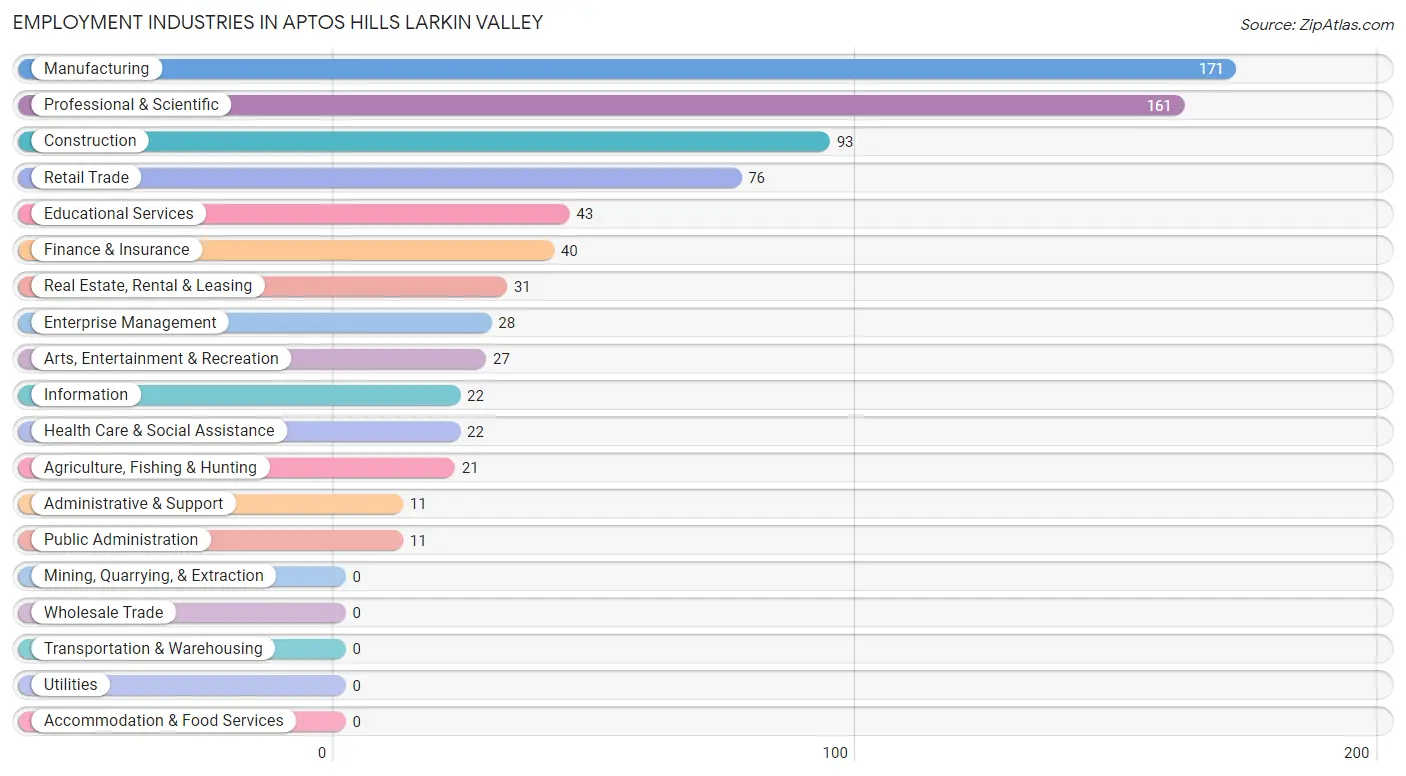
Employment Industries in Aptos Hills Larkin Valley
The major employment industries in Aptos Hills Larkin Valley include Manufacturing (171 | 19.5%), Professional & Scientific (161 | 18.4%), Construction (93 | 10.6%), Retail Trade (76 | 8.7%), and Educational Services (43 | 4.9%).
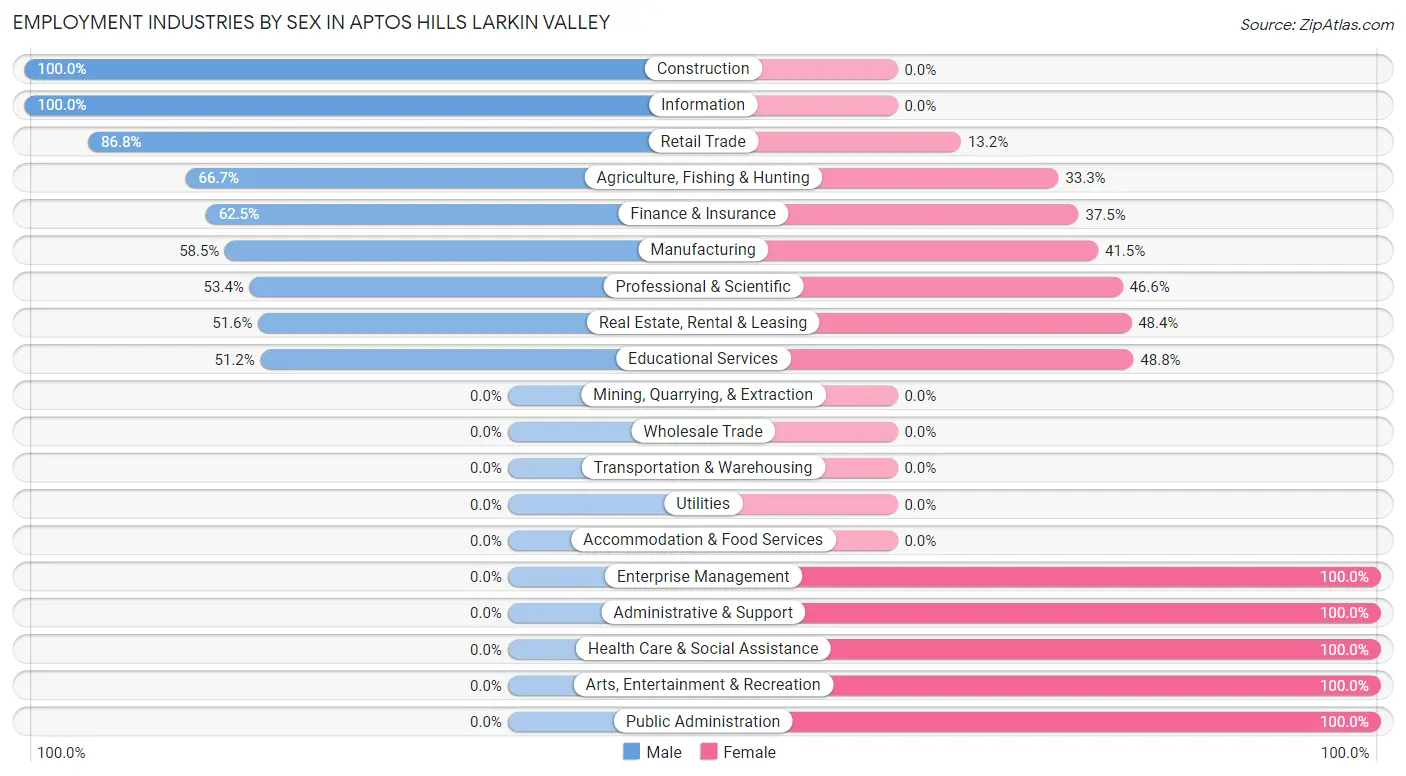
Employment Industries by Sex in Aptos Hills Larkin Valley
The Aptos Hills Larkin Valley industries that see more men than women are Construction (100.0%), Information (100.0%), and Retail Trade (86.8%), whereas the industries that tend to have a higher number of women are Enterprise Management (100.0%), Administrative & Support (100.0%), and Health Care & Social Assistance (100.0%).
| Industry | Male | Female |
| Agriculture, Fishing & Hunting | 14 (66.7%) | 7 (33.3%) |
| Mining, Quarrying, & Extraction | 0 (0.0%) | 0 (0.0%) |
| Construction | 93 (100.0%) | 0 (0.0%) |
| Manufacturing | 100 (58.5%) | 71 (41.5%) |
| Wholesale Trade | 0 (0.0%) | 0 (0.0%) |
| Retail Trade | 66 (86.8%) | 10 (13.2%) |
| Transportation & Warehousing | 0 (0.0%) | 0 (0.0%) |
| Utilities | 0 (0.0%) | 0 (0.0%) |
| Information | 22 (100.0%) | 0 (0.0%) |
| Finance & Insurance | 25 (62.5%) | 15 (37.5%) |
| Real Estate, Rental & Leasing | 16 (51.6%) | 15 (48.4%) |
| Professional & Scientific | 86 (53.4%) | 75 (46.6%) |
| Enterprise Management | 0 (0.0%) | 28 (100.0%) |
| Administrative & Support | 0 (0.0%) | 11 (100.0%) |
| Educational Services | 22 (51.2%) | 21 (48.8%) |
| Health Care & Social Assistance | 0 (0.0%) | 22 (100.0%) |
| Arts, Entertainment & Recreation | 0 (0.0%) | 27 (100.0%) |
| Accommodation & Food Services | 0 (0.0%) | 0 (0.0%) |
| Public Administration | 0 (0.0%) | 11 (100.0%) |
| Total | 509 (58.1%) | 367 (41.9%) |
Education in Aptos Hills Larkin Valley
School Enrollment in Aptos Hills Larkin Valley
The most common levels of schooling among the 228 students in Aptos Hills Larkin Valley are nursery / preschool (113 | 49.6%), college / undergraduate (53 | 23.3%), and kindergarten (31 | 13.6%).
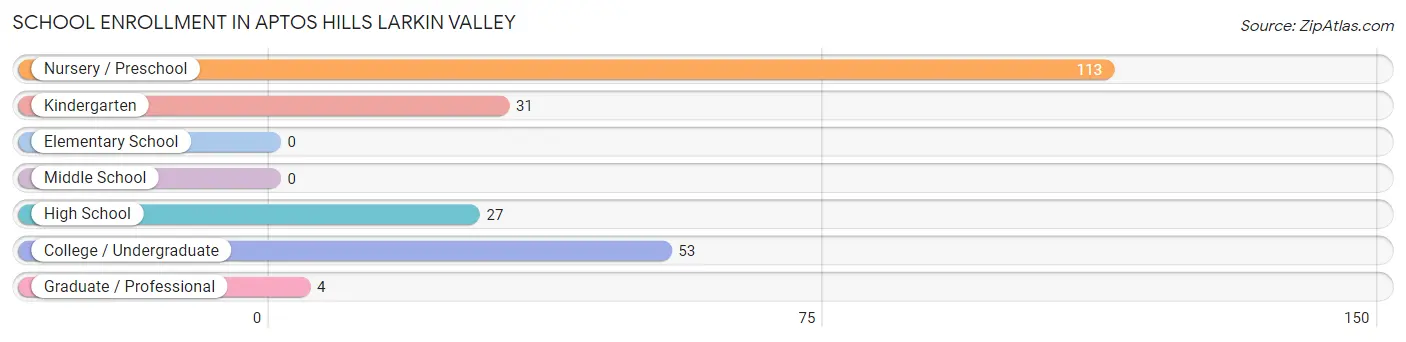
| School Level | # Students | % Students |
| Nursery / Preschool | 113 | 49.6% |
| Kindergarten | 31 | 13.6% |
| Elementary School | 0 | 0.0% |
| Middle School | 0 | 0.0% |
| High School | 27 | 11.8% |
| College / Undergraduate | 53 | 23.3% |
| Graduate / Professional | 4 | 1.8% |
| Total | 228 | 100.0% |
School Enrollment by Age by Funding Source in Aptos Hills Larkin Valley
Out of a total of 228 students who are enrolled in schools in Aptos Hills Larkin Valley, 152 (66.7%) attend a private institution, while the remaining 76 (33.3%) are enrolled in public schools. The age group of 3 to 4 year olds has the highest likelihood of being enrolled in private schools, with 61 (100.0% in the age bracket) enrolled. Conversely, the age group of 18 to 19 year olds has the lowest likelihood of being enrolled in a private school, with 12 (100.0% in the age bracket) attending a public institution.
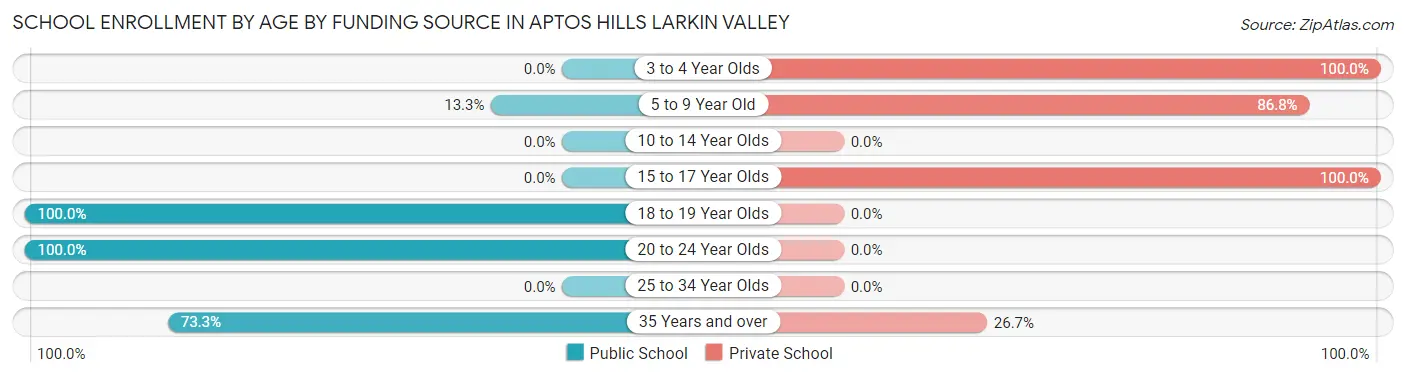
| Age Bracket | Public School | Private School |
| 3 to 4 Year Olds | 0 (0.0%) | 61 (100.0%) |
| 5 to 9 Year Old | 11 (13.3%) | 72 (86.8%) |
| 10 to 14 Year Olds | 0 (0.0%) | 0 (0.0%) |
| 15 to 17 Year Olds | 0 (0.0%) | 15 (100.0%) |
| 18 to 19 Year Olds | 12 (100.0%) | 0 (0.0%) |
| 20 to 24 Year Olds | 42 (100.0%) | 0 (0.0%) |
| 25 to 34 Year Olds | 0 (0.0%) | 0 (0.0%) |
| 35 Years and over | 11 (73.3%) | 4 (26.7%) |
| Total | 76 (33.3%) | 152 (66.7%) |
Educational Attainment by Field of Study in Aptos Hills Larkin Valley
Business (133 | 18.9%), bio, nature & agricultural (77 | 11.0%), psychology (69 | 9.8%), computers & mathematics (63 | 9.0%), and visual & performing arts (63 | 9.0%) are the most common fields of study among 703 individuals in Aptos Hills Larkin Valley who have obtained a bachelor's degree or higher.
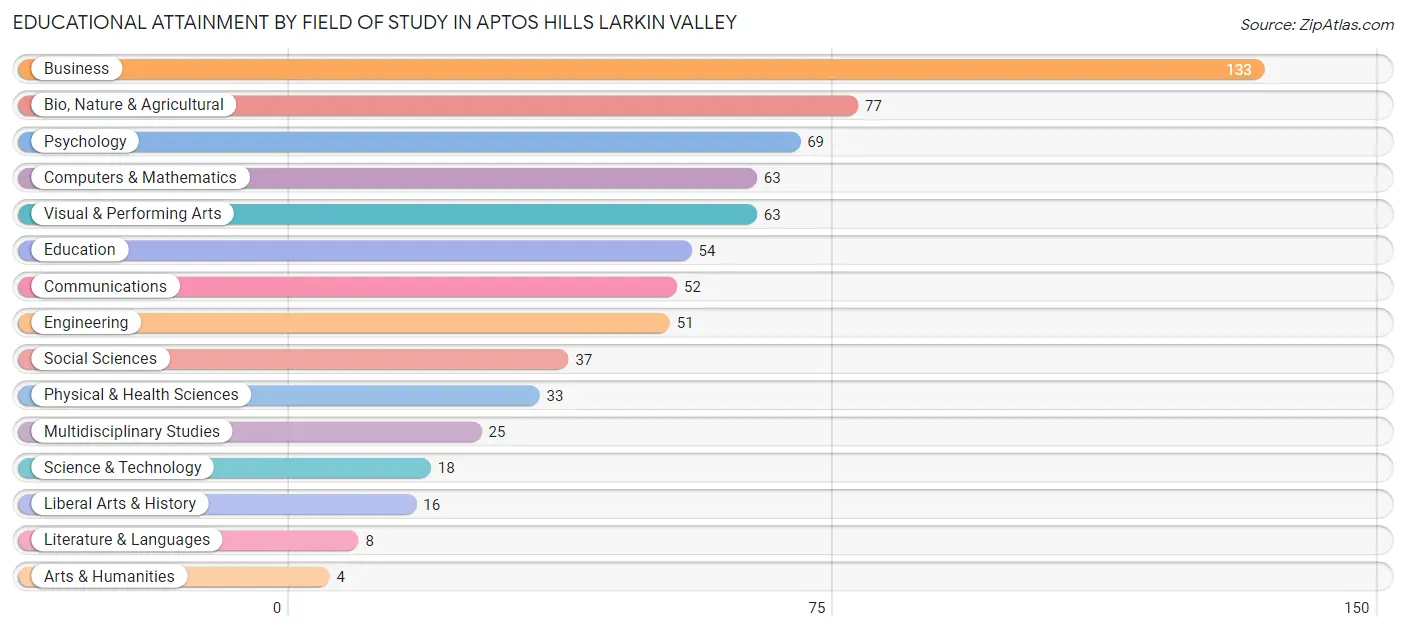
| Field of Study | # Graduates | % Graduates |
| Computers & Mathematics | 63 | 9.0% |
| Bio, Nature & Agricultural | 77 | 11.0% |
| Physical & Health Sciences | 33 | 4.7% |
| Psychology | 69 | 9.8% |
| Social Sciences | 37 | 5.3% |
| Engineering | 51 | 7.2% |
| Multidisciplinary Studies | 25 | 3.6% |
| Science & Technology | 18 | 2.6% |
| Business | 133 | 18.9% |
| Education | 54 | 7.7% |
| Literature & Languages | 8 | 1.1% |
| Liberal Arts & History | 16 | 2.3% |
| Visual & Performing Arts | 63 | 9.0% |
| Communications | 52 | 7.4% |
| Arts & Humanities | 4 | 0.6% |
| Total | 703 | 100.0% |
Transportation & Commute in Aptos Hills Larkin Valley
Vehicle Availability by Sex in Aptos Hills Larkin Valley
The most prevalent vehicle ownership categories in Aptos Hills Larkin Valley are males with 3 vehicles (241, accounting for 47.3%) and females with 3 vehicles (138, making up 65.7%).
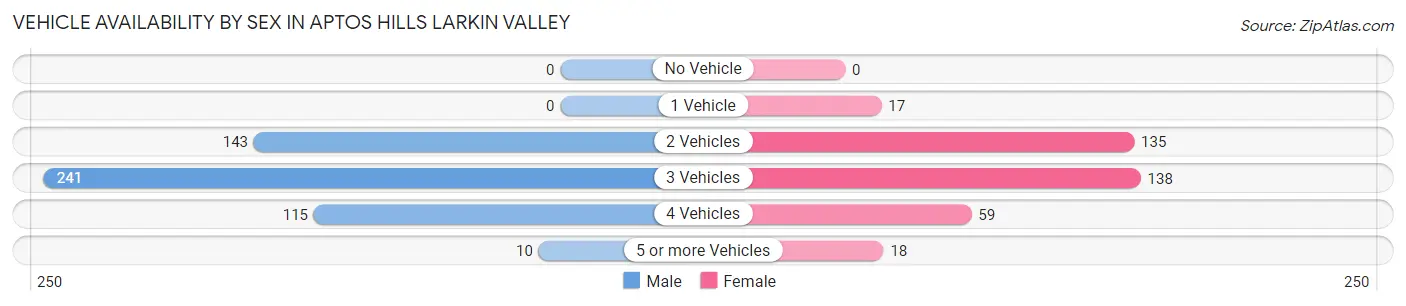
| Vehicles Available | Male | Female |
| No Vehicle | 0 (0.0%) | 0 (0.0%) |
| 1 Vehicle | 0 (0.0%) | 17 (4.6%) |
| 2 Vehicles | 143 (28.1%) | 135 (36.8%) |
| 3 Vehicles | 241 (47.3%) | 138 (37.6%) |
| 4 Vehicles | 115 (22.6%) | 59 (16.1%) |
| 5 or more Vehicles | 10 (2.0%) | 18 (4.9%) |
| Total | 509 (100.0%) | 367 (100.0%) |
Commute Time in Aptos Hills Larkin Valley
The most frequently occuring commute durations in Aptos Hills Larkin Valley are 20 to 24 minutes (224 commuters, 33.0%), 45 to 59 minutes (145 commuters, 21.4%), and 30 to 34 minutes (129 commuters, 19.0%).
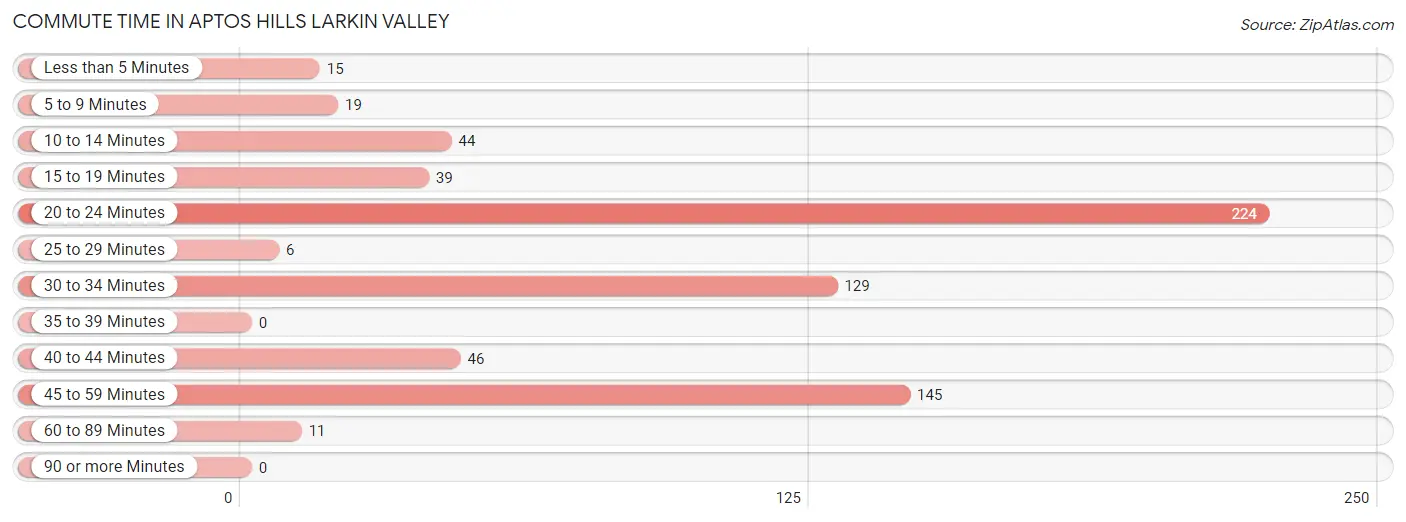
| Commute Time | # Commuters | % Commuters |
| Less than 5 Minutes | 15 | 2.2% |
| 5 to 9 Minutes | 19 | 2.8% |
| 10 to 14 Minutes | 44 | 6.5% |
| 15 to 19 Minutes | 39 | 5.8% |
| 20 to 24 Minutes | 224 | 33.0% |
| 25 to 29 Minutes | 6 | 0.9% |
| 30 to 34 Minutes | 129 | 19.0% |
| 35 to 39 Minutes | 0 | 0.0% |
| 40 to 44 Minutes | 46 | 6.8% |
| 45 to 59 Minutes | 145 | 21.4% |
| 60 to 89 Minutes | 11 | 1.6% |
| 90 or more Minutes | 0 | 0.0% |
Commute Time by Sex in Aptos Hills Larkin Valley
The most common commute times in Aptos Hills Larkin Valley are 20 to 24 minutes (181 commuters, 40.8%) for males and 45 to 59 minutes (65 commuters, 27.8%) for females.
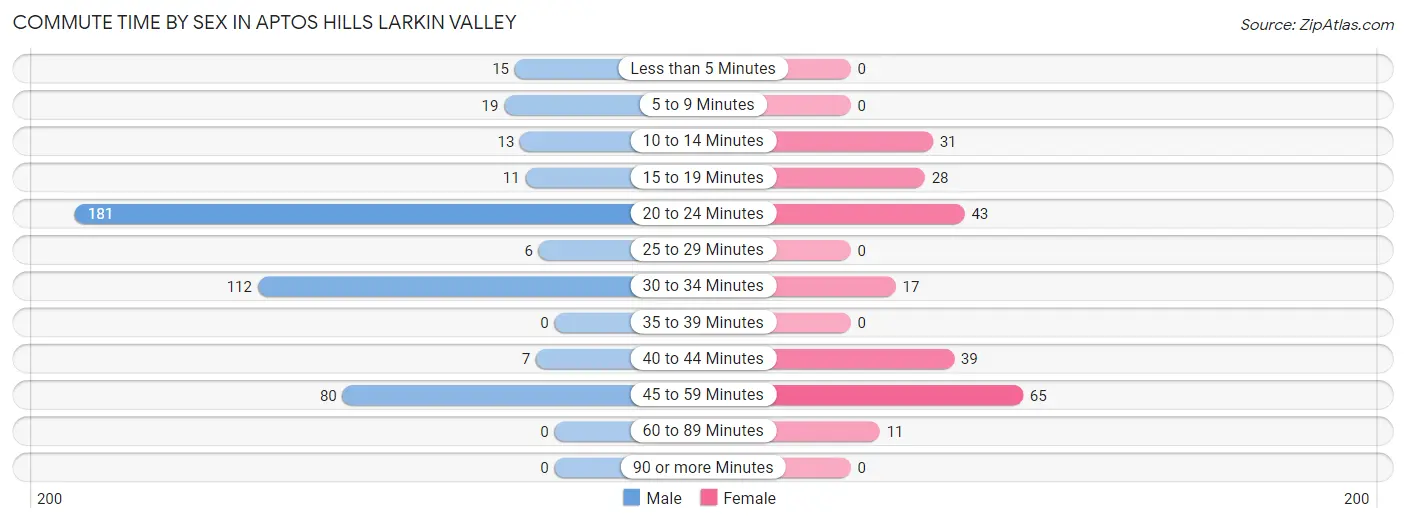
| Commute Time | Male | Female |
| Less than 5 Minutes | 15 (3.4%) | 0 (0.0%) |
| 5 to 9 Minutes | 19 (4.3%) | 0 (0.0%) |
| 10 to 14 Minutes | 13 (2.9%) | 31 (13.3%) |
| 15 to 19 Minutes | 11 (2.5%) | 28 (12.0%) |
| 20 to 24 Minutes | 181 (40.8%) | 43 (18.4%) |
| 25 to 29 Minutes | 6 (1.3%) | 0 (0.0%) |
| 30 to 34 Minutes | 112 (25.2%) | 17 (7.3%) |
| 35 to 39 Minutes | 0 (0.0%) | 0 (0.0%) |
| 40 to 44 Minutes | 7 (1.6%) | 39 (16.7%) |
| 45 to 59 Minutes | 80 (18.0%) | 65 (27.8%) |
| 60 to 89 Minutes | 0 (0.0%) | 11 (4.7%) |
| 90 or more Minutes | 0 (0.0%) | 0 (0.0%) |
Time of Departure to Work by Sex in Aptos Hills Larkin Valley
The most frequent times of departure to work in Aptos Hills Larkin Valley are 7:00 AM to 7:29 AM (116, 26.1%) for males and 7:00 AM to 7:29 AM (54, 23.1%) for females.
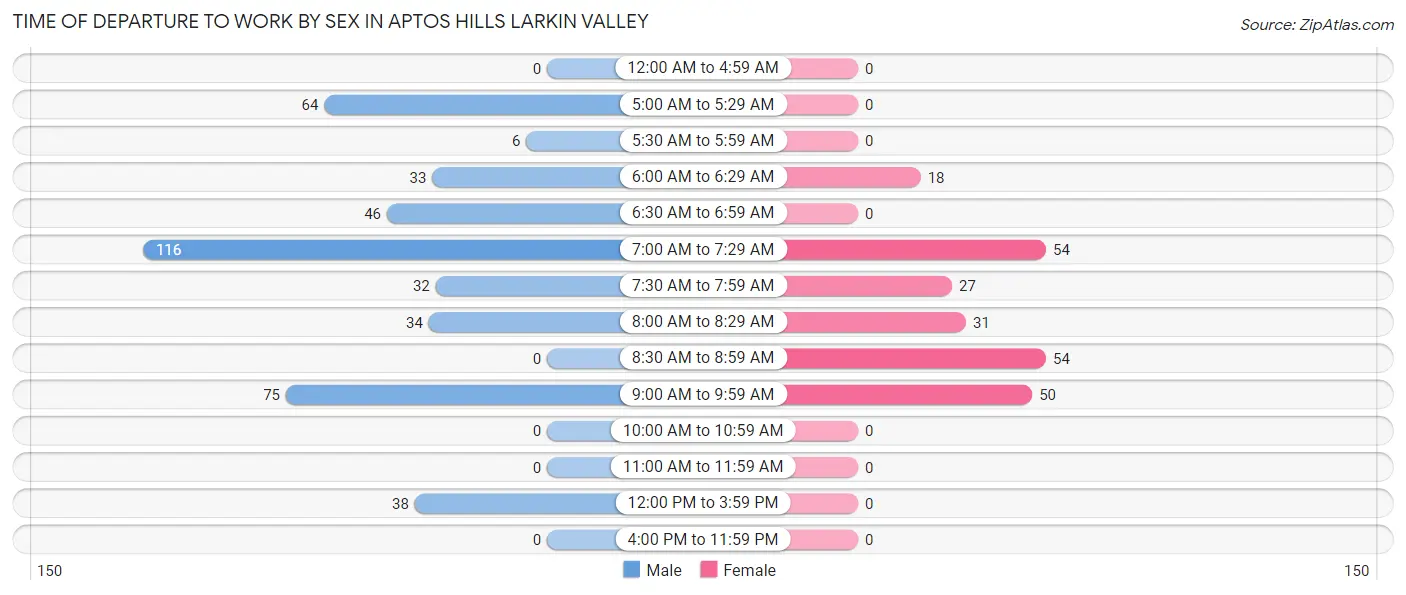
| Time of Departure | Male | Female |
| 12:00 AM to 4:59 AM | 0 (0.0%) | 0 (0.0%) |
| 5:00 AM to 5:29 AM | 64 (14.4%) | 0 (0.0%) |
| 5:30 AM to 5:59 AM | 6 (1.3%) | 0 (0.0%) |
| 6:00 AM to 6:29 AM | 33 (7.4%) | 18 (7.7%) |
| 6:30 AM to 6:59 AM | 46 (10.4%) | 0 (0.0%) |
| 7:00 AM to 7:29 AM | 116 (26.1%) | 54 (23.1%) |
| 7:30 AM to 7:59 AM | 32 (7.2%) | 27 (11.5%) |
| 8:00 AM to 8:29 AM | 34 (7.7%) | 31 (13.3%) |
| 8:30 AM to 8:59 AM | 0 (0.0%) | 54 (23.1%) |
| 9:00 AM to 9:59 AM | 75 (16.9%) | 50 (21.4%) |
| 10:00 AM to 10:59 AM | 0 (0.0%) | 0 (0.0%) |
| 11:00 AM to 11:59 AM | 0 (0.0%) | 0 (0.0%) |
| 12:00 PM to 3:59 PM | 38 (8.6%) | 0 (0.0%) |
| 4:00 PM to 11:59 PM | 0 (0.0%) | 0 (0.0%) |
| Total | 444 (100.0%) | 234 (100.0%) |
Housing Occupancy in Aptos Hills Larkin Valley
Occupancy by Ownership in Aptos Hills Larkin Valley
Of the total 664 dwellings in Aptos Hills Larkin Valley, owner-occupied units account for 600 (90.4%), while renter-occupied units make up 64 (9.6%).
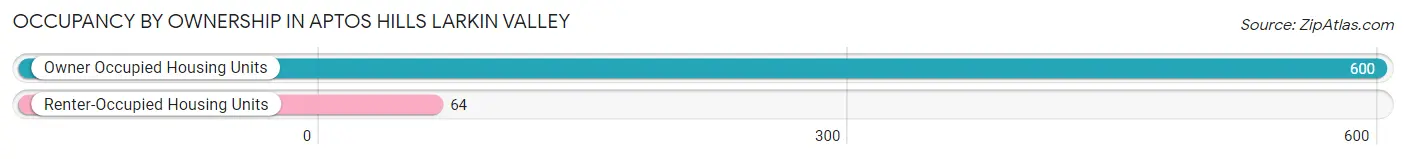
| Occupancy | # Housing Units | % Housing Units |
| Owner Occupied Housing Units | 600 | 90.4% |
| Renter-Occupied Housing Units | 64 | 9.6% |
| Total Occupied Housing Units | 664 | 100.0% |
Occupancy by Household Size in Aptos Hills Larkin Valley
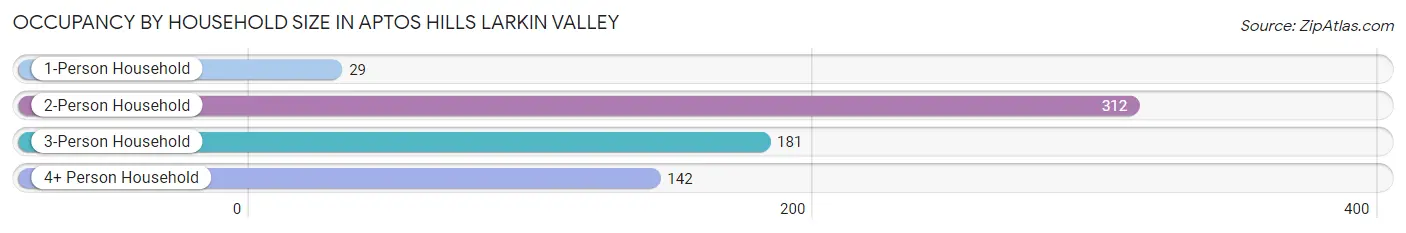
| Household Size | # Housing Units | % Housing Units |
| 1-Person Household | 29 | 4.4% |
| 2-Person Household | 312 | 47.0% |
| 3-Person Household | 181 | 27.3% |
| 4+ Person Household | 142 | 21.4% |
| Total Housing Units | 664 | 100.0% |
Occupancy by Ownership by Household Size in Aptos Hills Larkin Valley
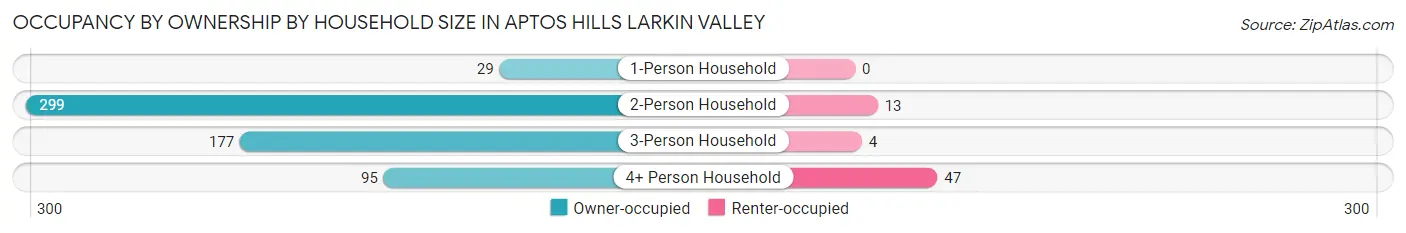
| Household Size | Owner-occupied | Renter-occupied |
| 1-Person Household | 29 (100.0%) | 0 (0.0%) |
| 2-Person Household | 299 (95.8%) | 13 (4.2%) |
| 3-Person Household | 177 (97.8%) | 4 (2.2%) |
| 4+ Person Household | 95 (66.9%) | 47 (33.1%) |
| Total Housing Units | 600 (90.4%) | 64 (9.6%) |
Occupancy by Educational Attainment in Aptos Hills Larkin Valley
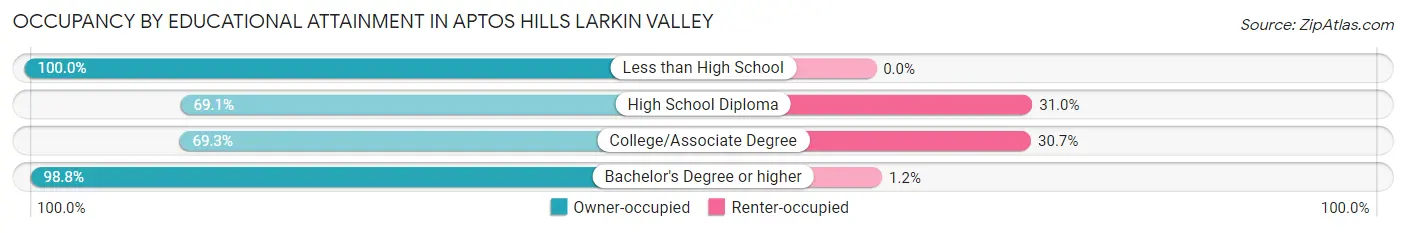
| Household Size | Owner-occupied | Renter-occupied |
| Less than High School | 134 (100.0%) | 0 (0.0%) |
| High School Diploma | 29 (69.1%) | 13 (30.9%) |
| College/Associate Degree | 106 (69.3%) | 47 (30.7%) |
| Bachelor's Degree or higher | 331 (98.8%) | 4 (1.2%) |
Occupancy by Age of Householder in Aptos Hills Larkin Valley
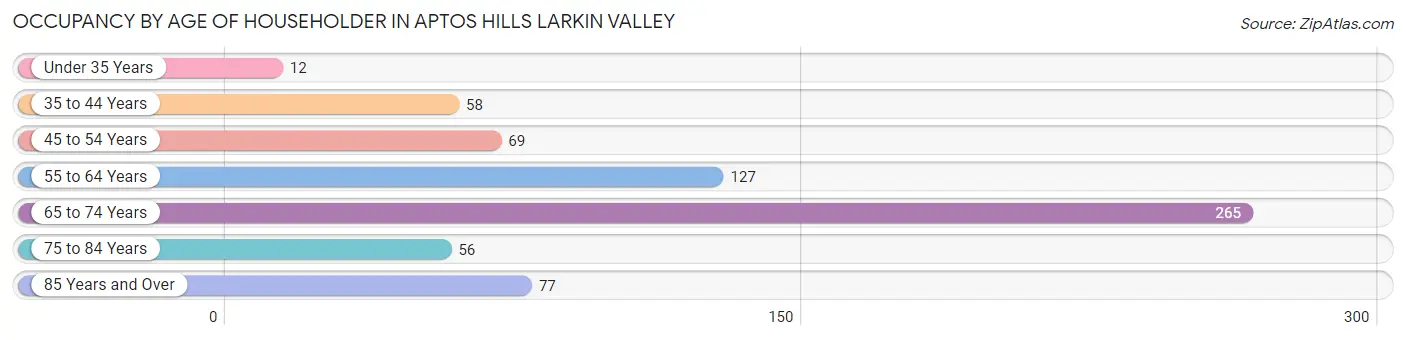
| Age Bracket | # Households | % Households |
| Under 35 Years | 12 | 1.8% |
| 35 to 44 Years | 58 | 8.7% |
| 45 to 54 Years | 69 | 10.4% |
| 55 to 64 Years | 127 | 19.1% |
| 65 to 74 Years | 265 | 39.9% |
| 75 to 84 Years | 56 | 8.4% |
| 85 Years and Over | 77 | 11.6% |
| Total | 664 | 100.0% |
Housing Finances in Aptos Hills Larkin Valley
Median Income by Occupancy in Aptos Hills Larkin Valley
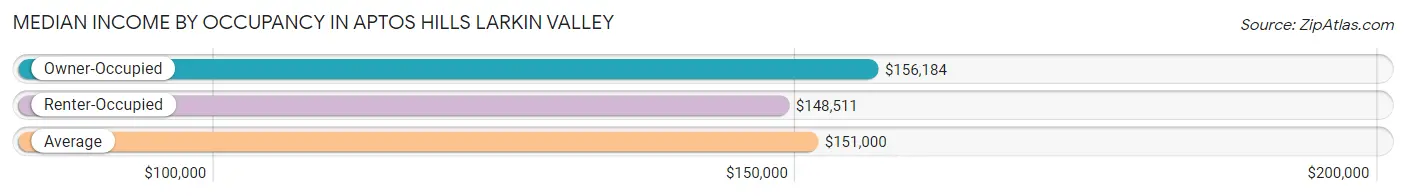
| Occupancy Type | # Households | Median Income |
| Owner-Occupied | 600 (90.4%) | $156,184 |
| Renter-Occupied | 64 (9.6%) | $148,511 |
| Average | 664 (100.0%) | $151,000 |
Occupancy by Householder Income Bracket in Aptos Hills Larkin Valley
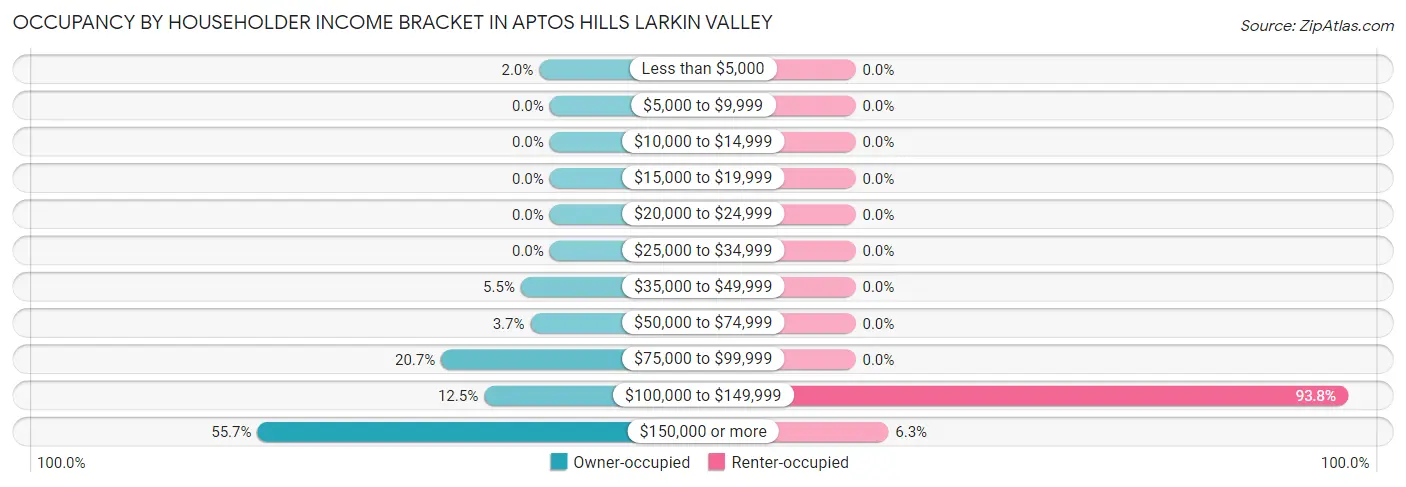
| Income Bracket | Owner-occupied | Renter-occupied |
| Less than $5,000 | 12 (2.0%) | 0 (0.0%) |
| $5,000 to $9,999 | 0 (0.0%) | 0 (0.0%) |
| $10,000 to $14,999 | 0 (0.0%) | 0 (0.0%) |
| $15,000 to $19,999 | 0 (0.0%) | 0 (0.0%) |
| $20,000 to $24,999 | 0 (0.0%) | 0 (0.0%) |
| $25,000 to $34,999 | 0 (0.0%) | 0 (0.0%) |
| $35,000 to $49,999 | 33 (5.5%) | 0 (0.0%) |
| $50,000 to $74,999 | 22 (3.7%) | 0 (0.0%) |
| $75,000 to $99,999 | 124 (20.7%) | 0 (0.0%) |
| $100,000 to $149,999 | 75 (12.5%) | 60 (93.8%) |
| $150,000 or more | 334 (55.7%) | 4 (6.2%) |
| Total | 600 (100.0%) | 64 (100.0%) |
Monthly Housing Cost Tiers in Aptos Hills Larkin Valley
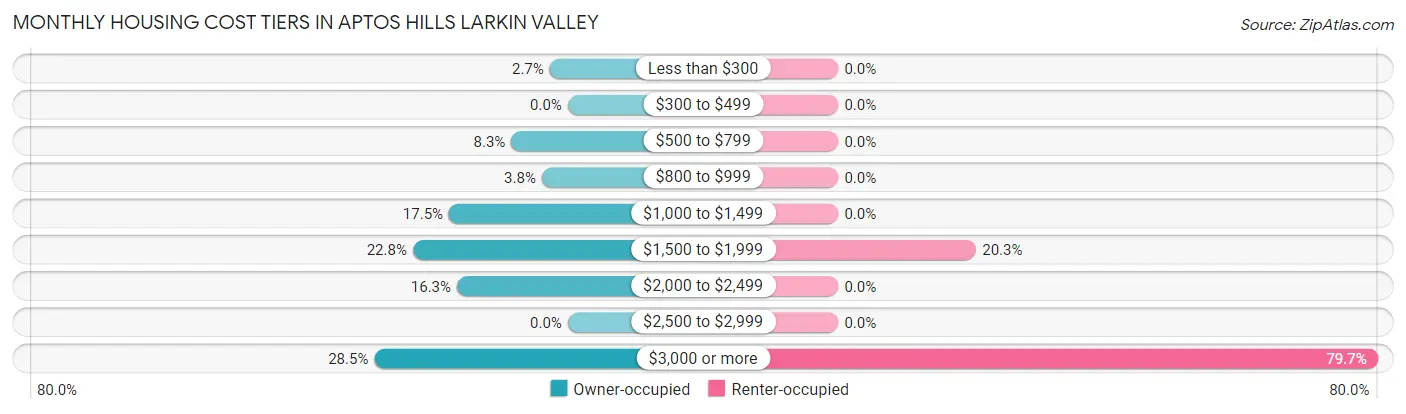
| Monthly Cost | Owner-occupied | Renter-occupied |
| Less than $300 | 16 (2.7%) | 0 (0.0%) |
| $300 to $499 | 0 (0.0%) | 0 (0.0%) |
| $500 to $799 | 50 (8.3%) | 0 (0.0%) |
| $800 to $999 | 23 (3.8%) | 0 (0.0%) |
| $1,000 to $1,499 | 105 (17.5%) | 0 (0.0%) |
| $1,500 to $1,999 | 137 (22.8%) | 13 (20.3%) |
| $2,000 to $2,499 | 98 (16.3%) | 0 (0.0%) |
| $2,500 to $2,999 | 0 (0.0%) | 0 (0.0%) |
| $3,000 or more | 171 (28.5%) | 51 (79.7%) |
| Total | 600 (100.0%) | 64 (100.0%) |
Physical Housing Characteristics in Aptos Hills Larkin Valley
Housing Structures in Aptos Hills Larkin Valley
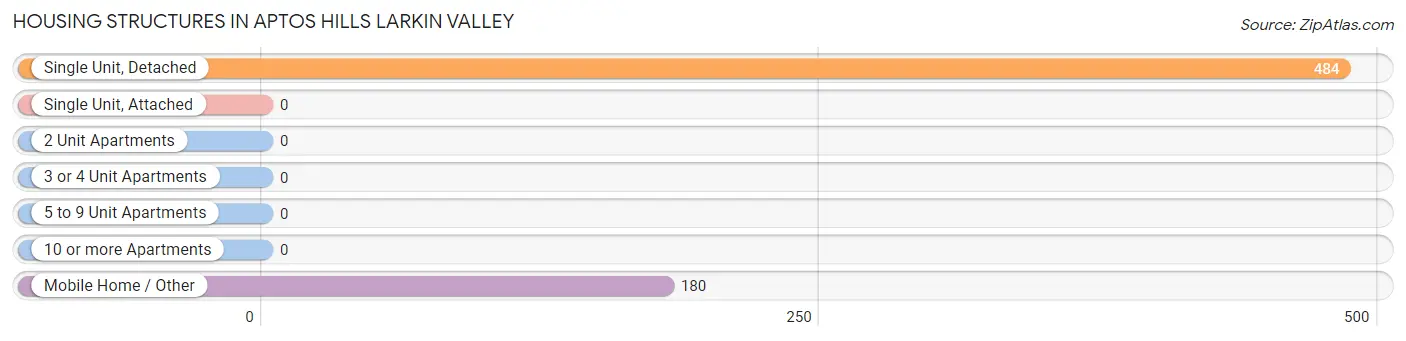
| Structure Type | # Housing Units | % Housing Units |
| Single Unit, Detached | 484 | 72.9% |
| Single Unit, Attached | 0 | 0.0% |
| 2 Unit Apartments | 0 | 0.0% |
| 3 or 4 Unit Apartments | 0 | 0.0% |
| 5 to 9 Unit Apartments | 0 | 0.0% |
| 10 or more Apartments | 0 | 0.0% |
| Mobile Home / Other | 180 | 27.1% |
| Total | 664 | 100.0% |
Housing Structures by Occupancy in Aptos Hills Larkin Valley
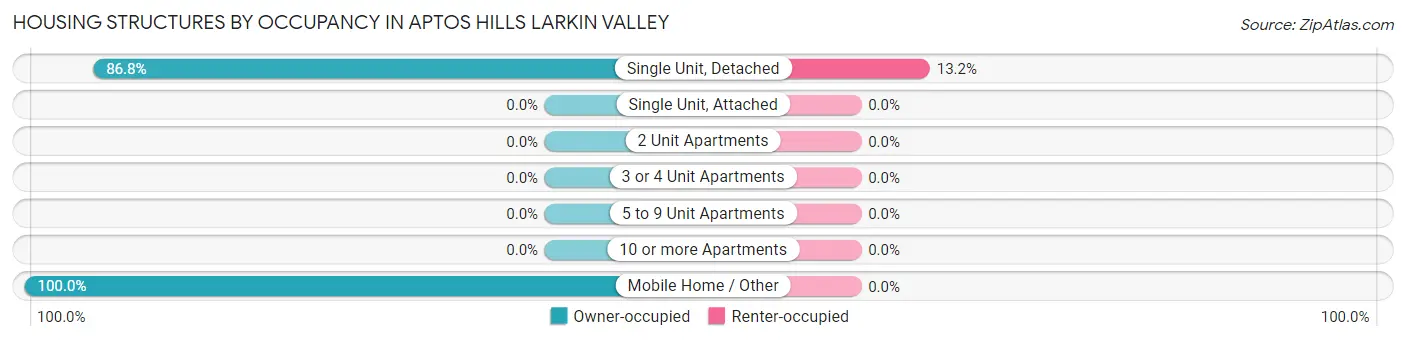
| Structure Type | Owner-occupied | Renter-occupied |
| Single Unit, Detached | 420 (86.8%) | 64 (13.2%) |
| Single Unit, Attached | 0 (0.0%) | 0 (0.0%) |
| 2 Unit Apartments | 0 (0.0%) | 0 (0.0%) |
| 3 or 4 Unit Apartments | 0 (0.0%) | 0 (0.0%) |
| 5 to 9 Unit Apartments | 0 (0.0%) | 0 (0.0%) |
| 10 or more Apartments | 0 (0.0%) | 0 (0.0%) |
| Mobile Home / Other | 180 (100.0%) | 0 (0.0%) |
| Total | 600 (90.4%) | 64 (9.6%) |
Housing Structures by Number of Rooms in Aptos Hills Larkin Valley
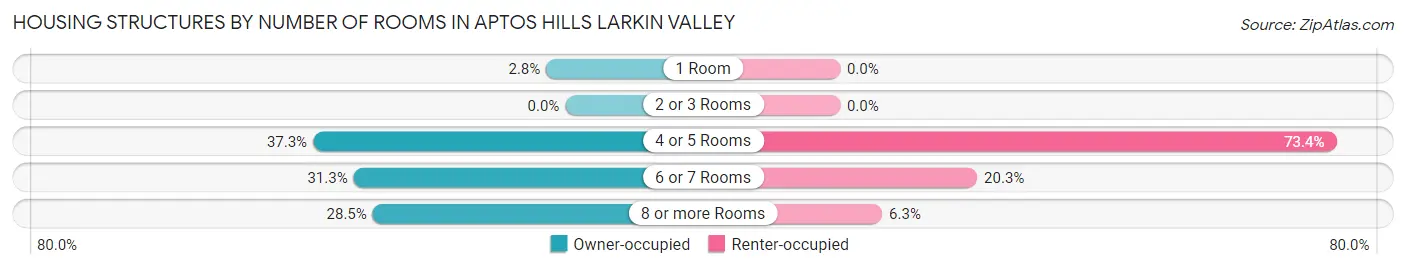
| Number of Rooms | Owner-occupied | Renter-occupied |
| 1 Room | 17 (2.8%) | 0 (0.0%) |
| 2 or 3 Rooms | 0 (0.0%) | 0 (0.0%) |
| 4 or 5 Rooms | 224 (37.3%) | 47 (73.4%) |
| 6 or 7 Rooms | 188 (31.3%) | 13 (20.3%) |
| 8 or more Rooms | 171 (28.5%) | 4 (6.2%) |
| Total | 600 (100.0%) | 64 (100.0%) |
Housing Structure by Heating Type in Aptos Hills Larkin Valley
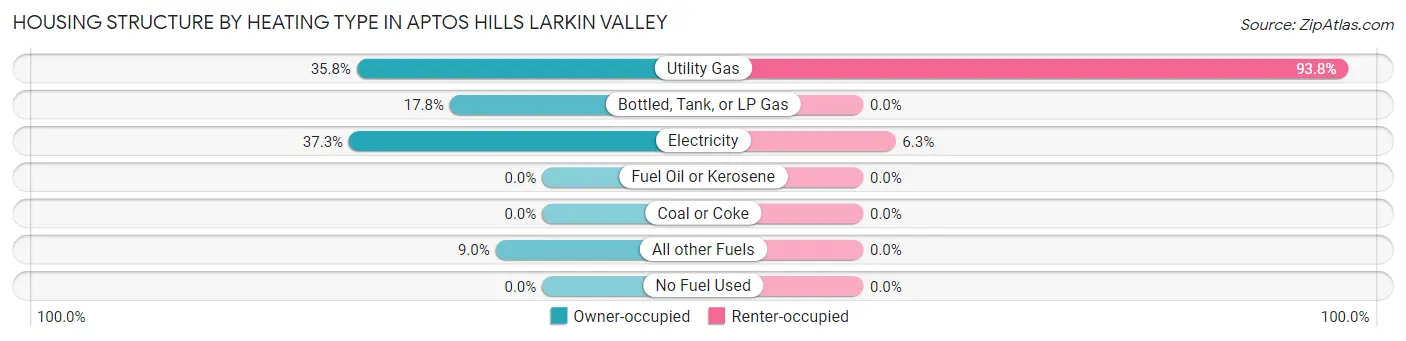
| Heating Type | Owner-occupied | Renter-occupied |
| Utility Gas | 215 (35.8%) | 60 (93.8%) |
| Bottled, Tank, or LP Gas | 107 (17.8%) | 0 (0.0%) |
| Electricity | 224 (37.3%) | 4 (6.2%) |
| Fuel Oil or Kerosene | 0 (0.0%) | 0 (0.0%) |
| Coal or Coke | 0 (0.0%) | 0 (0.0%) |
| All other Fuels | 54 (9.0%) | 0 (0.0%) |
| No Fuel Used | 0 (0.0%) | 0 (0.0%) |
| Total | 600 (100.0%) | 64 (100.0%) |
Household Vehicle Usage in Aptos Hills Larkin Valley
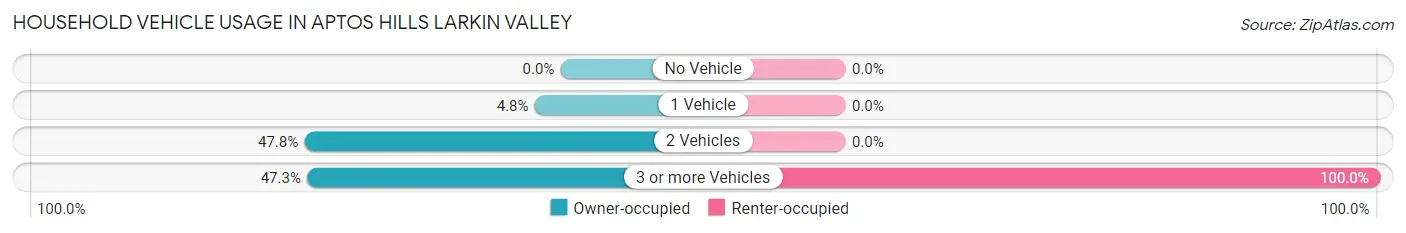
| Vehicles per Household | Owner-occupied | Renter-occupied |
| No Vehicle | 0 (0.0%) | 0 (0.0%) |
| 1 Vehicle | 29 (4.8%) | 0 (0.0%) |
| 2 Vehicles | 287 (47.8%) | 0 (0.0%) |
| 3 or more Vehicles | 284 (47.3%) | 64 (100.0%) |
| Total | 600 (100.0%) | 64 (100.0%) |
Real Estate & Mortgages in Aptos Hills Larkin Valley
Real Estate and Mortgage Overview in Aptos Hills Larkin Valley
| Characteristic | Without Mortgage | With Mortgage |
| Housing Units | 245 | 355 |
| Median Property Value | $1,049,200 | $987,500 |
| Median Household Income | $157,039 | $196 |
| Monthly Housing Costs | $1,176 | $159 |
| Real Estate Taxes | $10,001 | $0 |
Property Value by Mortgage Status in Aptos Hills Larkin Valley
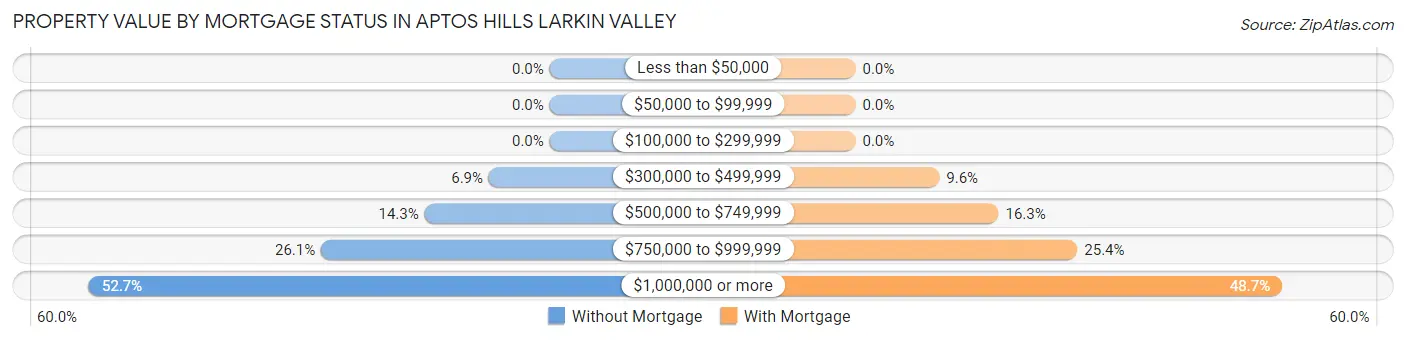
| Property Value | Without Mortgage | With Mortgage |
| Less than $50,000 | 0 (0.0%) | 0 (0.0%) |
| $50,000 to $99,999 | 0 (0.0%) | 0 (0.0%) |
| $100,000 to $299,999 | 0 (0.0%) | 0 (0.0%) |
| $300,000 to $499,999 | 17 (6.9%) | 34 (9.6%) |
| $500,000 to $749,999 | 35 (14.3%) | 58 (16.3%) |
| $750,000 to $999,999 | 64 (26.1%) | 90 (25.4%) |
| $1,000,000 or more | 129 (52.6%) | 173 (48.7%) |
| Total | 245 (100.0%) | 355 (100.0%) |
Household Income by Mortgage Status in Aptos Hills Larkin Valley
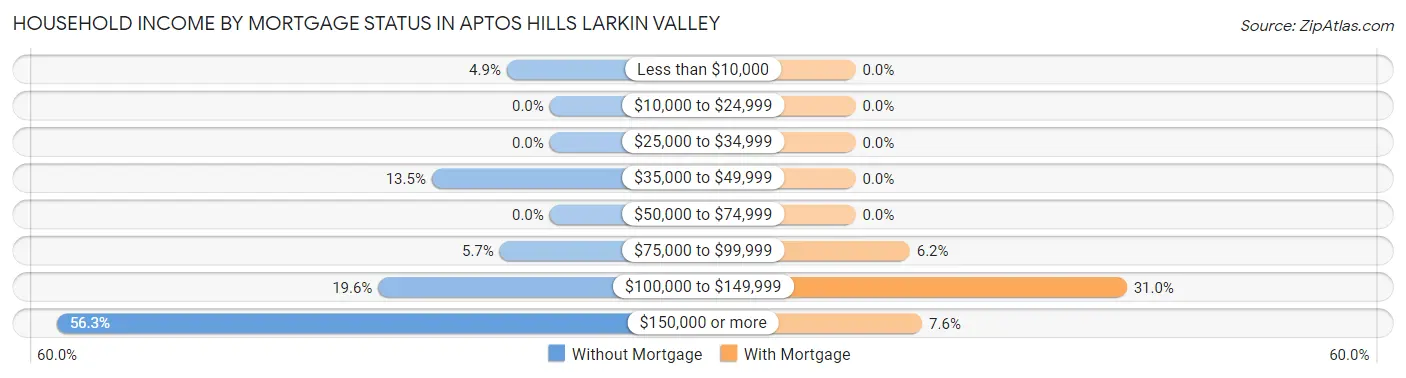
| Household Income | Without Mortgage | With Mortgage |
| Less than $10,000 | 12 (4.9%) | 0 (0.0%) |
| $10,000 to $24,999 | 0 (0.0%) | 0 (0.0%) |
| $25,000 to $34,999 | 0 (0.0%) | 0 (0.0%) |
| $35,000 to $49,999 | 33 (13.5%) | 0 (0.0%) |
| $50,000 to $74,999 | 0 (0.0%) | 0 (0.0%) |
| $75,000 to $99,999 | 14 (5.7%) | 22 (6.2%) |
| $100,000 to $149,999 | 48 (19.6%) | 110 (31.0%) |
| $150,000 or more | 138 (56.3%) | 27 (7.6%) |
| Total | 245 (100.0%) | 355 (100.0%) |
Property Value to Household Income Ratio in Aptos Hills Larkin Valley
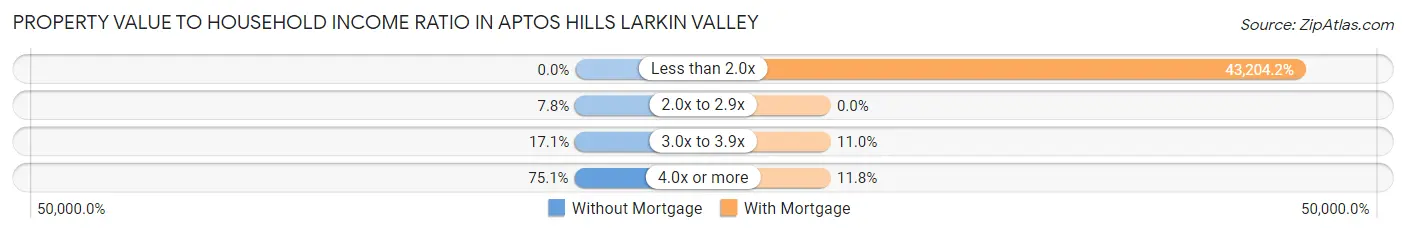
| Value-to-Income Ratio | Without Mortgage | With Mortgage |
| Less than 2.0x | 0 (0.0%) | 153,375 (43,204.2%) |
| 2.0x to 2.9x | 19 (7.8%) | 0 (0.0%) |
| 3.0x to 3.9x | 42 (17.1%) | 39 (11.0%) |
| 4.0x or more | 184 (75.1%) | 42 (11.8%) |
| Total | 245 (100.0%) | 355 (100.0%) |
Real Estate Taxes by Mortgage Status in Aptos Hills Larkin Valley
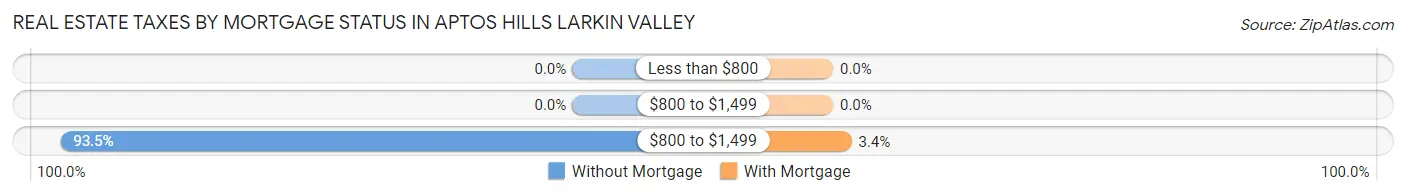
| Property Taxes | Without Mortgage | With Mortgage |
| Less than $800 | 0 (0.0%) | 0 (0.0%) |
| $800 to $1,499 | 0 (0.0%) | 0 (0.0%) |
| $800 to $1,499 | 229 (93.5%) | 12 (3.4%) |
| Total | 245 (100.0%) | 355 (100.0%) |
Health & Disability in Aptos Hills Larkin Valley
Health Insurance Coverage by Age in Aptos Hills Larkin Valley
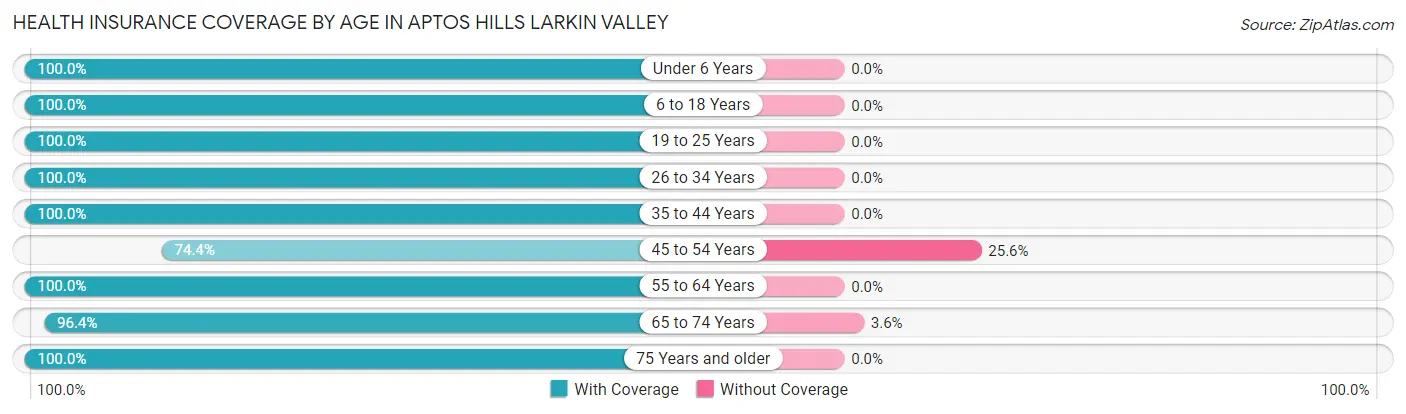
| Age Bracket | With Coverage | Without Coverage |
| Under 6 Years | 155 (100.0%) | 0 (0.0%) |
| 6 to 18 Years | 47 (100.0%) | 0 (0.0%) |
| 19 to 25 Years | 42 (100.0%) | 0 (0.0%) |
| 26 to 34 Years | 167 (100.0%) | 0 (0.0%) |
| 35 to 44 Years | 146 (100.0%) | 0 (0.0%) |
| 45 to 54 Years | 134 (74.4%) | 46 (25.6%) |
| 55 to 64 Years | 278 (100.0%) | 0 (0.0%) |
| 65 to 74 Years | 503 (96.4%) | 19 (3.6%) |
| 75 Years and older | 209 (100.0%) | 0 (0.0%) |
| Total | 1,681 (96.3%) | 65 (3.7%) |
Health Insurance Coverage by Citizenship Status in Aptos Hills Larkin Valley
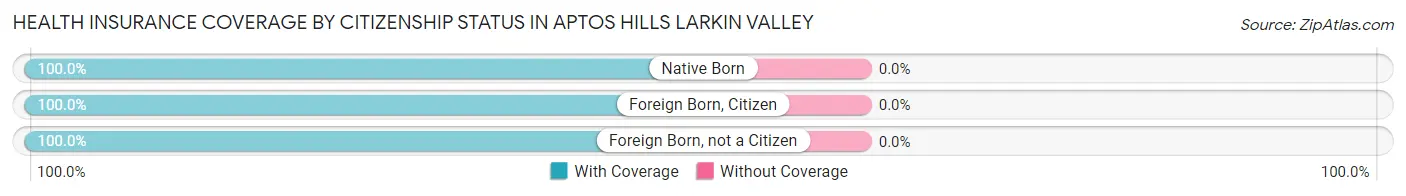
| Citizenship Status | With Coverage | Without Coverage |
| Native Born | 155 (100.0%) | 0 (0.0%) |
| Foreign Born, Citizen | 47 (100.0%) | 0 (0.0%) |
| Foreign Born, not a Citizen | 42 (100.0%) | 0 (0.0%) |
Health Insurance Coverage by Household Income in Aptos Hills Larkin Valley
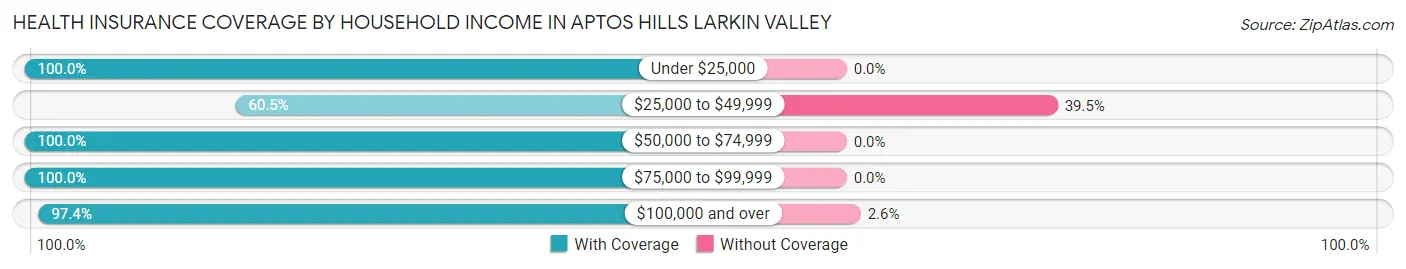
| Household Income | With Coverage | Without Coverage |
| Under $25,000 | 12 (100.0%) | 0 (0.0%) |
| $25,000 to $49,999 | 49 (60.5%) | 32 (39.5%) |
| $50,000 to $74,999 | 68 (100.0%) | 0 (0.0%) |
| $75,000 to $99,999 | 299 (100.0%) | 0 (0.0%) |
| $100,000 and over | 1,232 (97.4%) | 33 (2.6%) |
Public vs Private Health Insurance Coverage by Age in Aptos Hills Larkin Valley
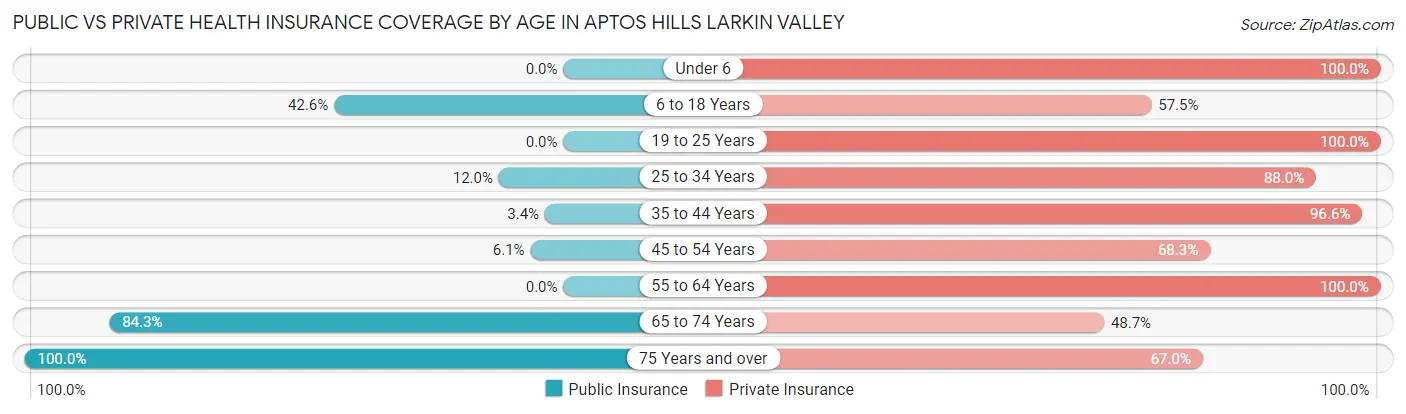
| Age Bracket | Public Insurance | Private Insurance |
| Under 6 | 0 (0.0%) | 155 (100.0%) |
| 6 to 18 Years | 20 (42.5%) | 27 (57.5%) |
| 19 to 25 Years | 0 (0.0%) | 42 (100.0%) |
| 25 to 34 Years | 20 (12.0%) | 147 (88.0%) |
| 35 to 44 Years | 5 (3.4%) | 141 (96.6%) |
| 45 to 54 Years | 11 (6.1%) | 123 (68.3%) |
| 55 to 64 Years | 0 (0.0%) | 278 (100.0%) |
| 65 to 74 Years | 440 (84.3%) | 254 (48.7%) |
| 75 Years and over | 209 (100.0%) | 140 (67.0%) |
| Total | 705 (40.4%) | 1,307 (74.9%) |
Disability Status by Sex by Age in Aptos Hills Larkin Valley
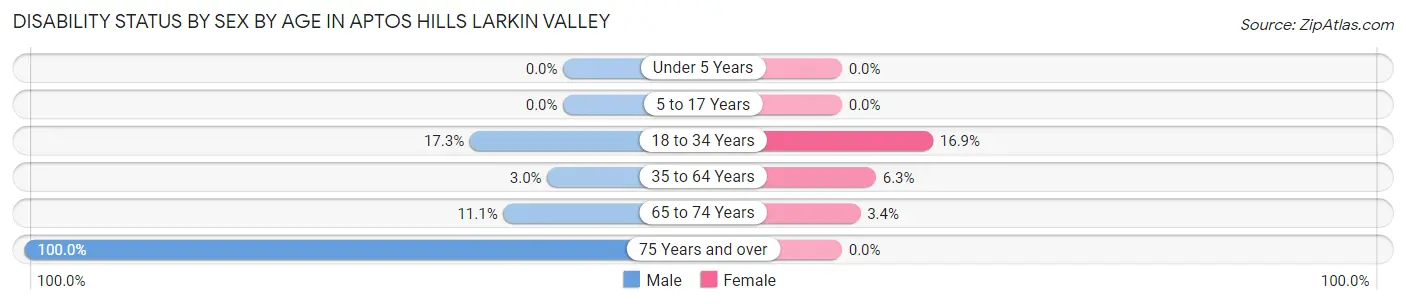
| Age Bracket | Male | Female |
| Under 5 Years | 0 (0.0%) | 0 (0.0%) |
| 5 to 17 Years | 0 (0.0%) | 0 (0.0%) |
| 18 to 34 Years | 26 (17.3%) | 12 (16.9%) |
| 35 to 64 Years | 8 (2.9%) | 21 (6.3%) |
| 65 to 74 Years | 32 (11.1%) | 8 (3.4%) |
| 75 Years and over | 73 (100.0%) | 0 (0.0%) |
Disability Class by Sex by Age in Aptos Hills Larkin Valley
Disability Class: Hearing Difficulty
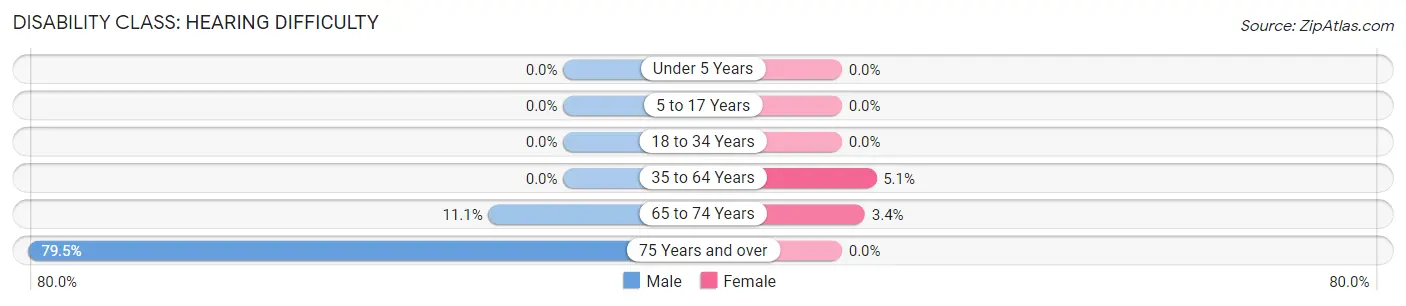
| Age Bracket | Male | Female |
| Under 5 Years | 0 (0.0%) | 0 (0.0%) |
| 5 to 17 Years | 0 (0.0%) | 0 (0.0%) |
| 18 to 34 Years | 0 (0.0%) | 0 (0.0%) |
| 35 to 64 Years | 0 (0.0%) | 17 (5.1%) |
| 65 to 74 Years | 32 (11.1%) | 8 (3.4%) |
| 75 Years and over | 58 (79.4%) | 0 (0.0%) |
Disability Class: Vision Difficulty
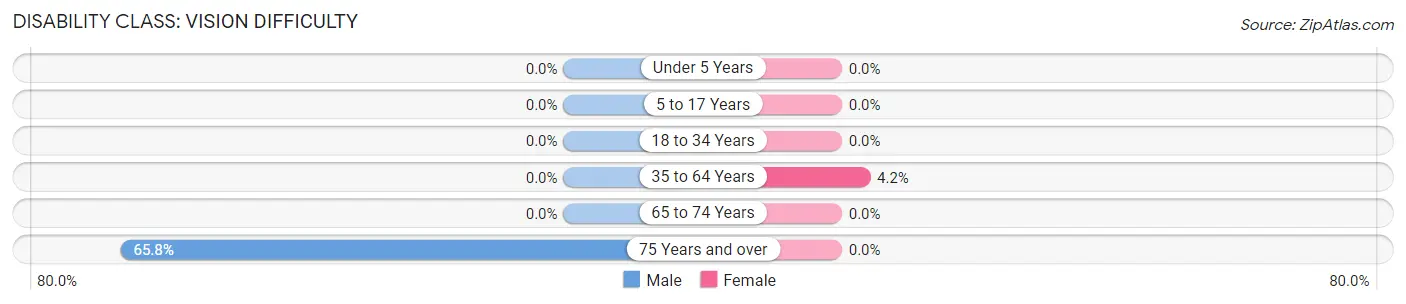
| Age Bracket | Male | Female |
| Under 5 Years | 0 (0.0%) | 0 (0.0%) |
| 5 to 17 Years | 0 (0.0%) | 0 (0.0%) |
| 18 to 34 Years | 0 (0.0%) | 0 (0.0%) |
| 35 to 64 Years | 0 (0.0%) | 14 (4.2%) |
| 65 to 74 Years | 0 (0.0%) | 0 (0.0%) |
| 75 Years and over | 48 (65.7%) | 0 (0.0%) |
Disability Class: Cognitive Difficulty
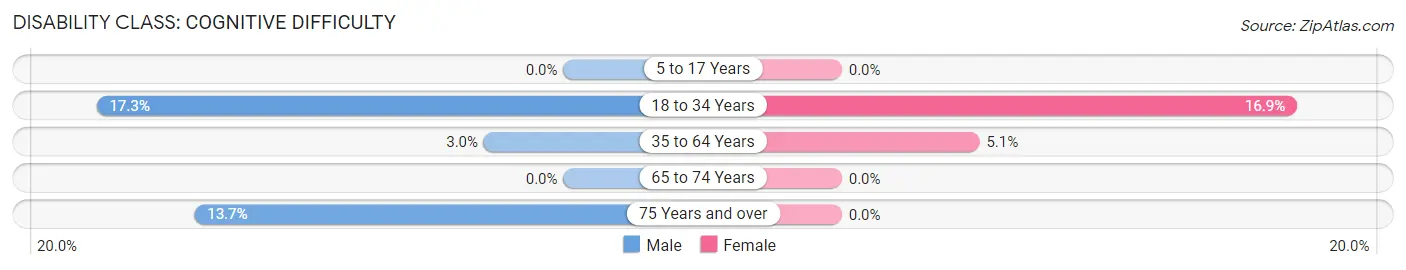
| Age Bracket | Male | Female |
| 5 to 17 Years | 0 (0.0%) | 0 (0.0%) |
| 18 to 34 Years | 26 (17.3%) | 12 (16.9%) |
| 35 to 64 Years | 8 (2.9%) | 17 (5.1%) |
| 65 to 74 Years | 0 (0.0%) | 0 (0.0%) |
| 75 Years and over | 10 (13.7%) | 0 (0.0%) |
Disability Class: Ambulatory Difficulty
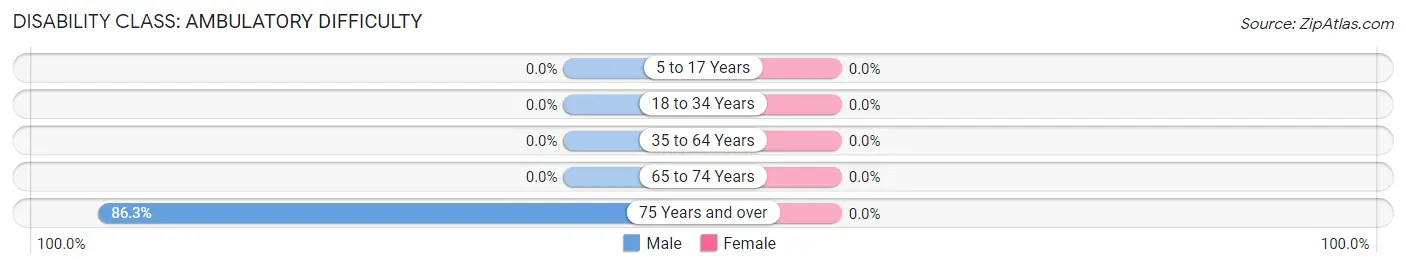
| Age Bracket | Male | Female |
| 5 to 17 Years | 0 (0.0%) | 0 (0.0%) |
| 18 to 34 Years | 0 (0.0%) | 0 (0.0%) |
| 35 to 64 Years | 0 (0.0%) | 0 (0.0%) |
| 65 to 74 Years | 0 (0.0%) | 0 (0.0%) |
| 75 Years and over | 63 (86.3%) | 0 (0.0%) |
Disability Class: Self-Care Difficulty
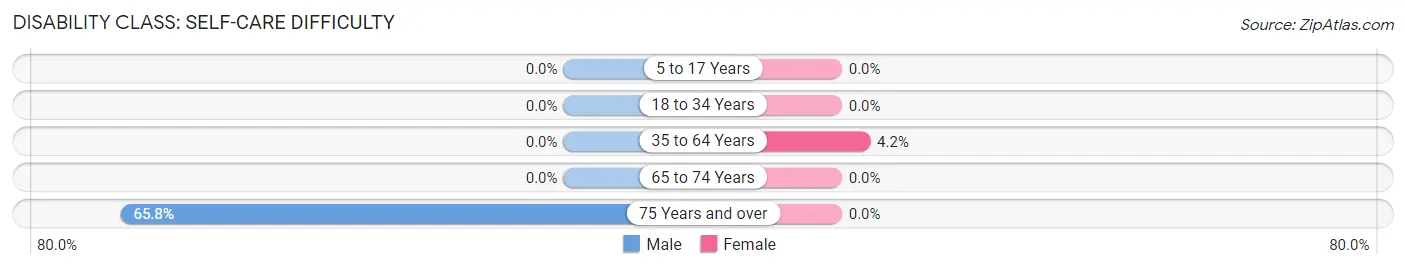
| Age Bracket | Male | Female |
| 5 to 17 Years | 0 (0.0%) | 0 (0.0%) |
| 18 to 34 Years | 0 (0.0%) | 0 (0.0%) |
| 35 to 64 Years | 0 (0.0%) | 14 (4.2%) |
| 65 to 74 Years | 0 (0.0%) | 0 (0.0%) |
| 75 Years and over | 48 (65.7%) | 0 (0.0%) |
Technology Access in Aptos Hills Larkin Valley
Computing Device Access in Aptos Hills Larkin Valley
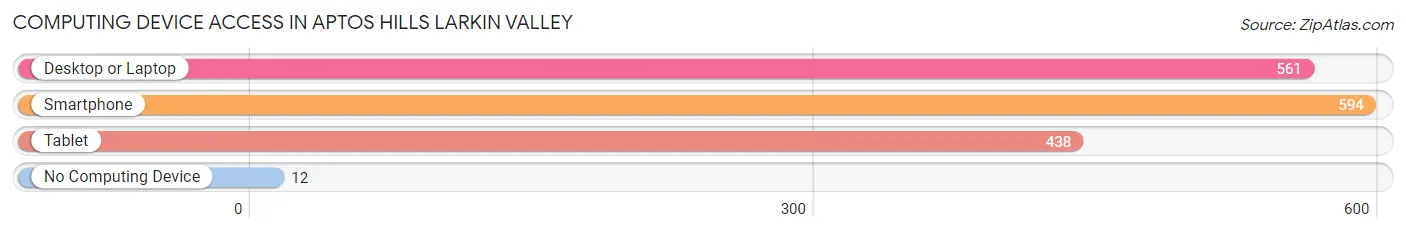
| Device Type | # Households | % Households |
| Desktop or Laptop | 561 | 84.5% |
| Smartphone | 594 | 89.5% |
| Tablet | 438 | 66.0% |
| No Computing Device | 12 | 1.8% |
| Total | 664 | 100.0% |
Internet Access in Aptos Hills Larkin Valley
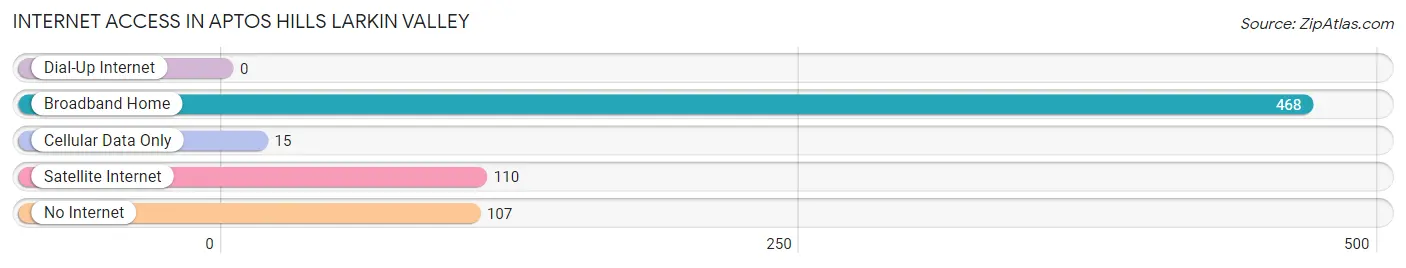
| Internet Type | # Households | % Households |
| Dial-Up Internet | 0 | 0.0% |
| Broadband Home | 468 | 70.5% |
| Cellular Data Only | 15 | 2.3% |
| Satellite Internet | 110 | 16.6% |
| No Internet | 107 | 16.1% |
| Total | 664 | 100.0% |
Aptos Hills Larkin Valley Summary
Aptos Hills Larkin Valley is a census-designated place (CDP) located in Santa Cruz County, California. It is situated in the foothills of the Santa Cruz Mountains, approximately 8 miles (13 km) northwest of the city of Santa Cruz. The population of Aptos Hills Larkin Valley was 4,845 at the 2010 census.
Geography
Aptos Hills Larkin Valley is located at latitude 37.037 and longitude -122.067. It is situated in the foothills of the Santa Cruz Mountains, approximately 8 miles (13 km) northwest of the city of Santa Cruz. The CDP has a total area of 8.3 square miles (21.5 km2), all of which is land.
History
The area now known as Aptos Hills Larkin Valley was originally inhabited by the Ohlone people. The first European settlers arrived in the area in the mid-1800s, and the area was eventually incorporated into the city of Santa Cruz in the late 1800s.
In the early 1900s, the area was primarily used for agricultural purposes, with the main crops being apples, prunes, and walnuts. In the 1950s, the area began to be developed for residential use, and by the 1970s, the area had become a popular destination for commuters to the nearby city of Santa Cruz.
Economy
The economy of Aptos Hills Larkin Valley is primarily based on agriculture and tourism. The area is home to several wineries, and the local economy is supported by the sale of wine and other agricultural products. Additionally, the area is a popular destination for tourists, who come to enjoy the area's natural beauty and recreational activities.
Demographics
As of the 2010 census, the population of Aptos Hills Larkin Valley was 4,845. The racial makeup of the CDP was 79.2% White, 0.7% African American, 0.3% Native American, 11.2% Asian, 0.2% Pacific Islander, 4.3% from other races, and 4.2% from two or more races. Hispanic or Latino of any race were 11.7% of the population.
The median household income in Aptos Hills Larkin Valley was $90,945, and the median family income was $103,945. The per capita income for the CDP was $41,945. About 4.2% of families and 5.7% of the population were below the poverty line, including 6.3% of those under age 18 and 4.2% of those age 65 or over.
Common Questions
What is Per Capita Income in Aptos Hills Larkin Valley?
Per Capita income in Aptos Hills Larkin Valley is $73,493.
What is the Median Family Income in Aptos Hills Larkin Valley?
Median Family Income in Aptos Hills Larkin Valley is $150,833.
What is the Median Household income in Aptos Hills Larkin Valley?
Median Household Income in Aptos Hills Larkin Valley is $151,000.
What is Income or Wage Gap in Aptos Hills Larkin Valley?
Income or Wage Gap in Aptos Hills Larkin Valley is 32.3%.
Women in Aptos Hills Larkin Valley earn 67.7 cents for every dollar earned by a man.
What is Inequality or Gini Index in Aptos Hills Larkin Valley?
Inequality or Gini Index in Aptos Hills Larkin Valley is 0.36.
What is the Total Population of Aptos Hills Larkin Valley?
Total Population of Aptos Hills Larkin Valley is 1,746.
What is the Total Male Population of Aptos Hills Larkin Valley?
Total Male Population of Aptos Hills Larkin Valley is 893.
What is the Total Female Population of Aptos Hills Larkin Valley?
Total Female Population of Aptos Hills Larkin Valley is 853.
What is the Ratio of Males per 100 Females in Aptos Hills Larkin Valley?
There are 104.69 Males per 100 Females in Aptos Hills Larkin Valley.
What is the Ratio of Females per 100 Males in Aptos Hills Larkin Valley?
There are 95.52 Females per 100 Males in Aptos Hills Larkin Valley.
What is the Median Population Age in Aptos Hills Larkin Valley?
Median Population Age in Aptos Hills Larkin Valley is 60.8 Years.
What is the Average Family Size in Aptos Hills Larkin Valley
Average Family Size in Aptos Hills Larkin Valley is 2.6 People.
What is the Average Household Size in Aptos Hills Larkin Valley
Average Household Size in Aptos Hills Larkin Valley is 2.6 People.
How Large is the Labor Force in Aptos Hills Larkin Valley?
There are 895 People in the Labor Forcein in Aptos Hills Larkin Valley.
What is the Percentage of People in the Labor Force in Aptos Hills Larkin Valley?
57.0% of People are in the Labor Force in Aptos Hills Larkin Valley.
What is the Unemployment Rate in Aptos Hills Larkin Valley?
Unemployment Rate in Aptos Hills Larkin Valley is 2.1%.