Ardsley, NY Map & Demographics
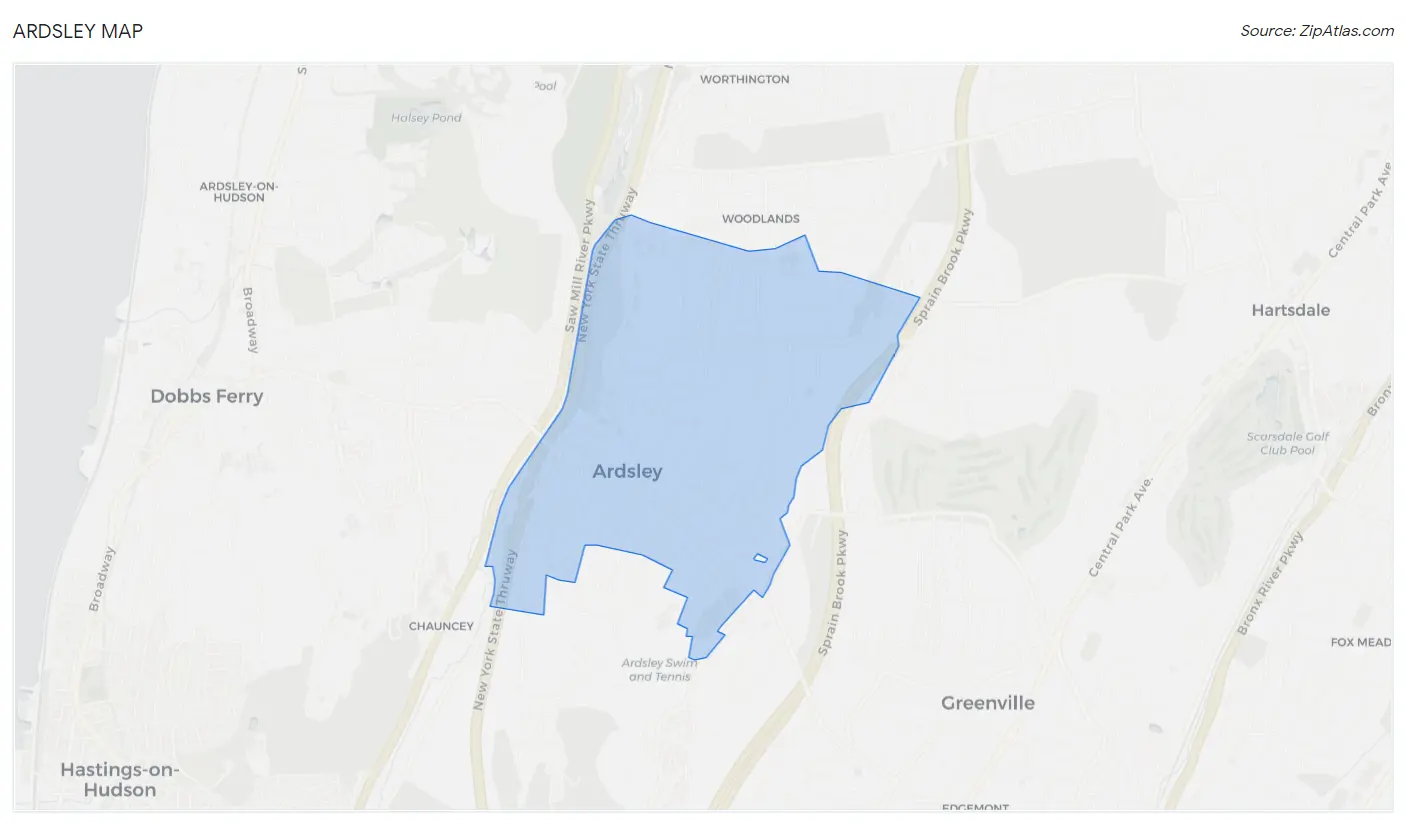
Ardsley Map
Ardsley Overview
$87,646
PER CAPITA INCOME
$250,001
AVG FAMILY INCOME
$243,594
AVG HOUSEHOLD INCOME
14.9%
WAGE / INCOME GAP [ % ]
85.1¢/ $1
WAGE / INCOME GAP [ $ ]
0.38
INEQUALITY / GINI INDEX
5,013
TOTAL POPULATION
2,427
MALE POPULATION
2,586
FEMALE POPULATION
93.85
MALES / 100 FEMALES
106.55
FEMALES / 100 MALES
43.0
MEDIAN AGE
3.3
AVG FAMILY SIZE
3.0
AVG HOUSEHOLD SIZE
2,498
LABOR FORCE [ PEOPLE ]
65.3%
PERCENT IN LABOR FORCE
8.7%
UNEMPLOYMENT RATE
Ardsley Zip Codes
Ardsley Area Codes
Income in Ardsley
Income Overview in Ardsley
Per Capita Income in Ardsley is $87,646, while median incomes of families and households are $250,001 and $243,594 respectively.
| Characteristic | Number | Measure |
| Per Capita Income | 5,013 | $87,646 |
| Median Family Income | 1,404 | $250,001 |
| Mean Family Income | 1,404 | $294,665 |
| Median Household Income | 1,679 | $243,594 |
| Mean Household Income | 1,679 | $261,891 |
| Income Deficit | 1,404 | $0 |
| Wage / Income Gap (%) | 5,013 | 14.92% |
| Wage / Income Gap ($) | 5,013 | 85.08¢ per $1 |
| Gini / Inequality Index | 5,013 | 0.38 |
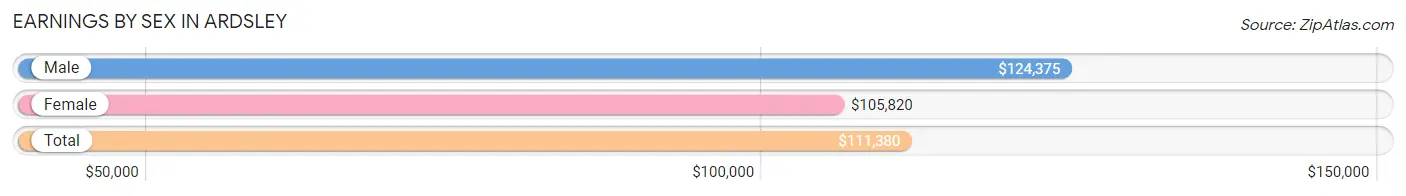
Earnings by Sex in Ardsley
Average Earnings in Ardsley are $111,380, $124,375 for men and $105,820 for women, a difference of 14.9%.
| Sex | Number | Average Earnings |
| Male | 1,465 (55.3%) | $124,375 |
| Female | 1,185 (44.7%) | $105,820 |
| Total | 2,650 (100.0%) | $111,380 |
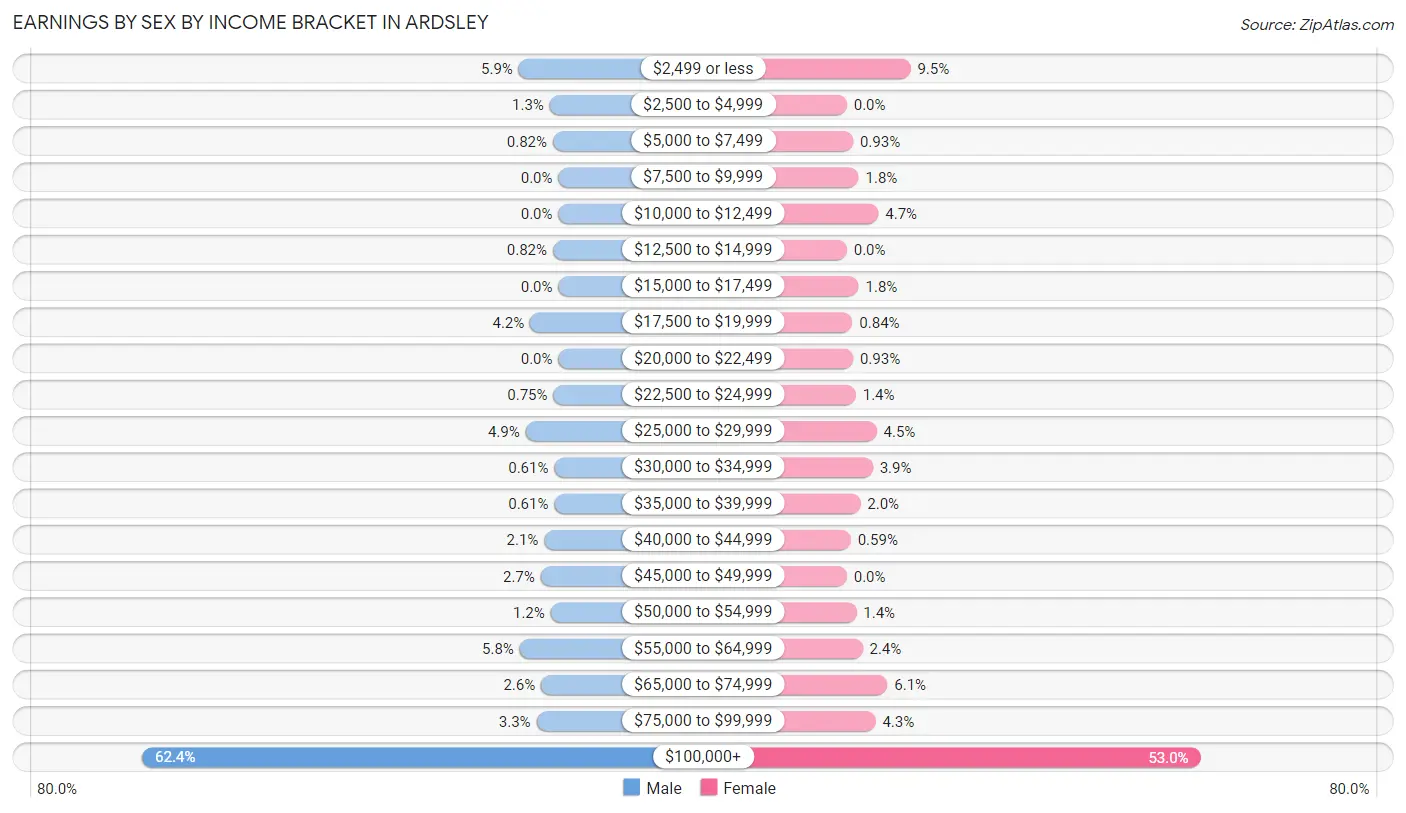
Earnings by Sex by Income Bracket in Ardsley
The most common earnings brackets in Ardsley are $100,000+ for men (914 | 62.4%) and $100,000+ for women (628 | 53.0%).
| Income | Male | Female |
| $2,499 or less | 87 (5.9%) | 113 (9.5%) |
| $2,500 to $4,999 | 19 (1.3%) | 0 (0.0%) |
| $5,000 to $7,499 | 12 (0.8%) | 11 (0.9%) |
| $7,500 to $9,999 | 0 (0.0%) | 21 (1.8%) |
| $10,000 to $12,499 | 0 (0.0%) | 56 (4.7%) |
| $12,500 to $14,999 | 12 (0.8%) | 0 (0.0%) |
| $15,000 to $17,499 | 0 (0.0%) | 21 (1.8%) |
| $17,500 to $19,999 | 62 (4.2%) | 10 (0.8%) |
| $20,000 to $22,499 | 0 (0.0%) | 11 (0.9%) |
| $22,500 to $24,999 | 11 (0.7%) | 16 (1.3%) |
| $25,000 to $29,999 | 72 (4.9%) | 53 (4.5%) |
| $30,000 to $34,999 | 9 (0.6%) | 46 (3.9%) |
| $35,000 to $39,999 | 9 (0.6%) | 24 (2.0%) |
| $40,000 to $44,999 | 31 (2.1%) | 7 (0.6%) |
| $45,000 to $49,999 | 39 (2.7%) | 0 (0.0%) |
| $50,000 to $54,999 | 17 (1.2%) | 17 (1.4%) |
| $55,000 to $64,999 | 85 (5.8%) | 28 (2.4%) |
| $65,000 to $74,999 | 38 (2.6%) | 72 (6.1%) |
| $75,000 to $99,999 | 48 (3.3%) | 51 (4.3%) |
| $100,000+ | 914 (62.4%) | 628 (53.0%) |
| Total | 1,465 (100.0%) | 1,185 (100.0%) |
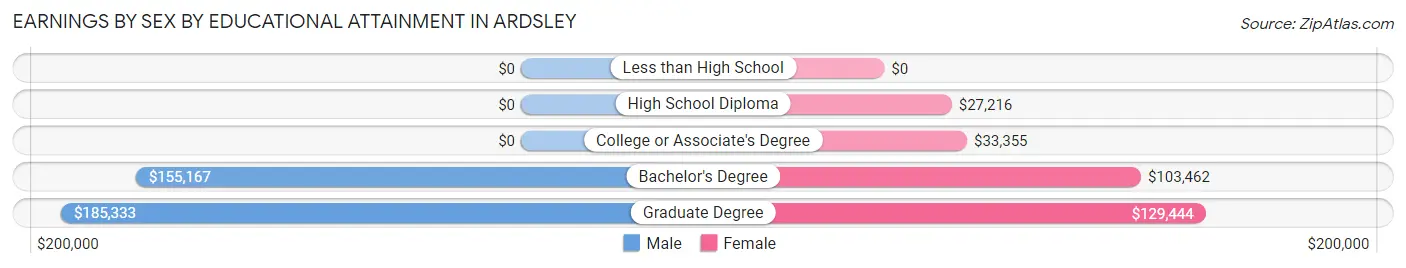
Earnings by Sex by Educational Attainment in Ardsley
Average earnings in Ardsley are $145,129 for men and $110,259 for women, a difference of 24.0%. Men with an educational attainment of graduate degree enjoy the highest average annual earnings of $185,333, while those with bachelor's degree education earn the least with $155,167. Women with an educational attainment of graduate degree earn the most with the average annual earnings of $129,444, while those with high school diploma education have the smallest earnings of $27,216.
| Educational Attainment | Male Income | Female Income |
| Less than High School | - | - |
| High School Diploma | - | - |
| College or Associate's Degree | - | - |
| Bachelor's Degree | $155,167 | $103,462 |
| Graduate Degree | $185,333 | $129,444 |
| Total | $145,129 | $110,259 |
Family Income in Ardsley
Family Income Brackets in Ardsley
According to the Ardsley family income data, there are 938 families falling into the $200,000+ income range, which is the most common income bracket and makes up 66.8% of all families.
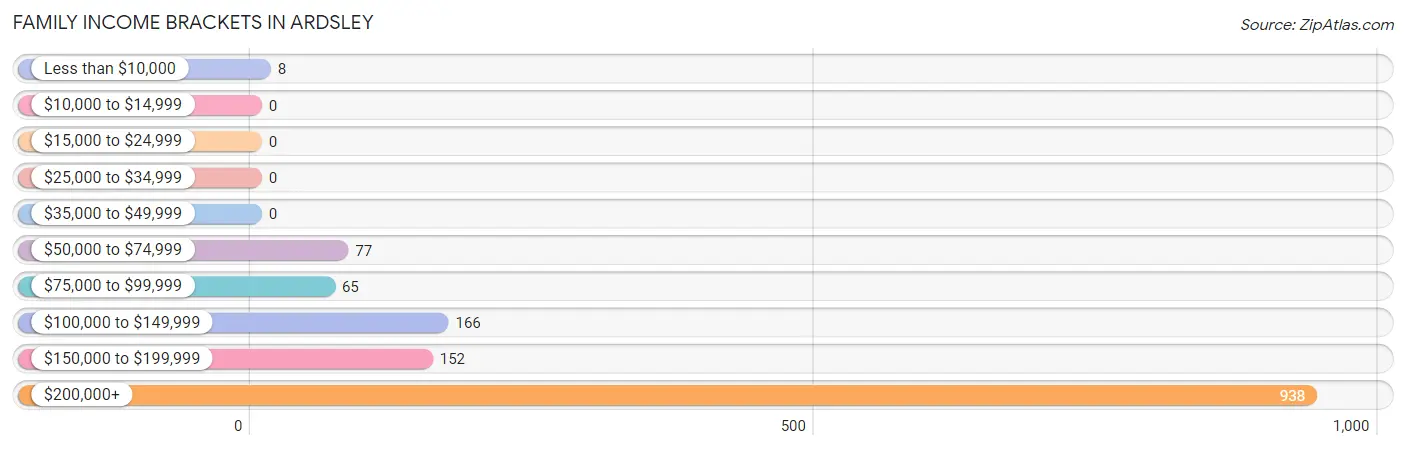
| Income Bracket | # Families | % Families |
| Less than $10,000 | 8 | 0.6% |
| $10,000 to $14,999 | 0 | 0.0% |
| $15,000 to $24,999 | 0 | 0.0% |
| $25,000 to $34,999 | 0 | 0.0% |
| $35,000 to $49,999 | 0 | 0.0% |
| $50,000 to $74,999 | 77 | 5.5% |
| $75,000 to $99,999 | 65 | 4.6% |
| $100,000 to $149,999 | 166 | 11.8% |
| $150,000 to $199,999 | 152 | 10.8% |
| $200,000+ | 938 | 66.8% |
Family Income by Famaliy Size in Ardsley
3-person families (380 | 27.1%) account for the highest median family income in Ardsley with $250,001 per family, while 2-person families (430 | 30.6%) have the highest median income of $90,710 per family member.
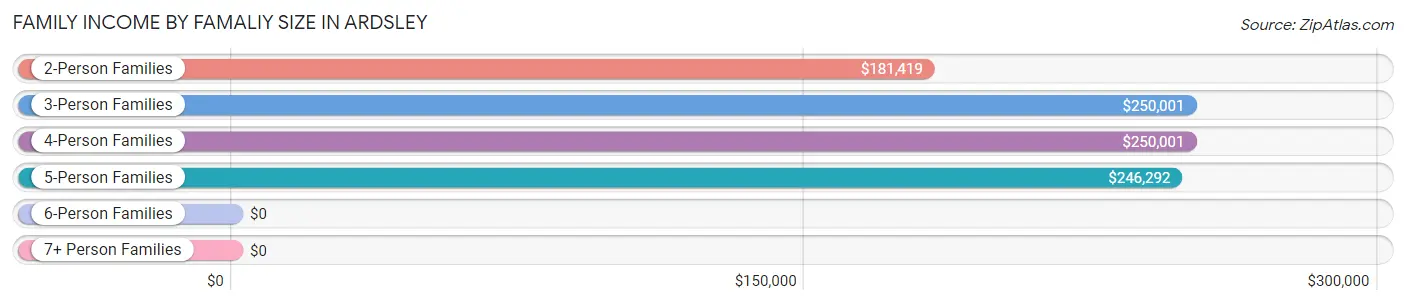
| Income Bracket | # Families | Median Income |
| 2-Person Families | 430 (30.6%) | $181,419 |
| 3-Person Families | 380 (27.1%) | $250,001 |
| 4-Person Families | 493 (35.1%) | $250,001 |
| 5-Person Families | 101 (7.2%) | $246,292 |
| 6-Person Families | 0 (0.0%) | $0 |
| 7+ Person Families | 0 (0.0%) | $0 |
| Total | 1,404 (100.0%) | $250,001 |
Family Income by Number of Earners in Ardsley
The median family income in Ardsley is $250,001, with families comprising 2 earners (852) having the highest median family income of $250,001, while families with no earners (106) have the lowest median family income of $109,545, accounting for 60.7% and 7.5% of families, respectively.
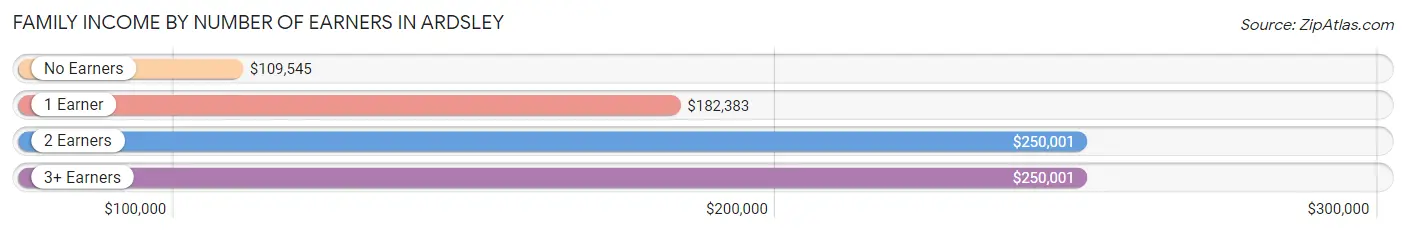
| Number of Earners | # Families | Median Income |
| No Earners | 106 (7.5%) | $109,545 |
| 1 Earner | 304 (21.6%) | $182,383 |
| 2 Earners | 852 (60.7%) | $250,001 |
| 3+ Earners | 142 (10.1%) | $250,001 |
| Total | 1,404 (100.0%) | $250,001 |
Household Income in Ardsley
Household Income Brackets in Ardsley
With 964 households falling in the category, the $200,000+ income range is the most frequent in Ardsley, accounting for 57.4% of all households.
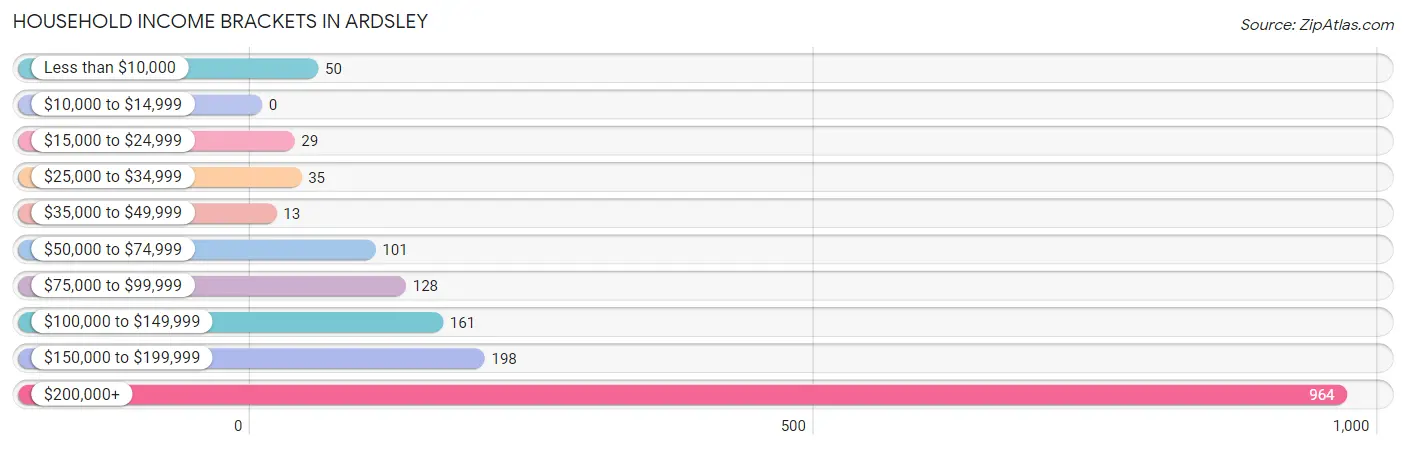
| Income Bracket | # Households | % Households |
| Less than $10,000 | 50 | 3.0% |
| $10,000 to $14,999 | 0 | 0.0% |
| $15,000 to $24,999 | 29 | 1.7% |
| $25,000 to $34,999 | 35 | 2.1% |
| $35,000 to $49,999 | 13 | 0.8% |
| $50,000 to $74,999 | 101 | 6.0% |
| $75,000 to $99,999 | 128 | 7.6% |
| $100,000 to $149,999 | 161 | 9.6% |
| $150,000 to $199,999 | 198 | 11.8% |
| $200,000+ | 964 | 57.4% |
Household Income by Householder Age in Ardsley
The median household income in Ardsley is $243,594, with the highest median household income of $250,001 found in the 25 to 44 years age bracket for the primary householder. A total of 372 households (22.2%) fall into this category.
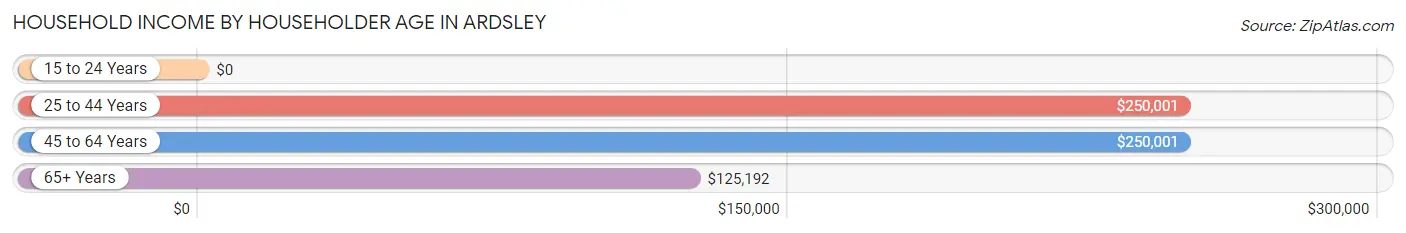
| Income Bracket | # Households | Median Income |
| 15 to 24 Years | 0 (0.0%) | $0 |
| 25 to 44 Years | 372 (22.2%) | $250,001 |
| 45 to 64 Years | 703 (41.9%) | $250,001 |
| 65+ Years | 604 (36.0%) | $125,192 |
| Total | 1,679 (100.0%) | $243,594 |
Poverty in Ardsley
Income Below Poverty by Sex and Age in Ardsley
With 2.6% poverty level for males and 0.9% for females among the residents of Ardsley, 65 to 74 year old males and 55 to 64 year old females are the most vulnerable to poverty, with 43 males (16.9%) and 8 females (4.8%) in their respective age groups living below the poverty level.
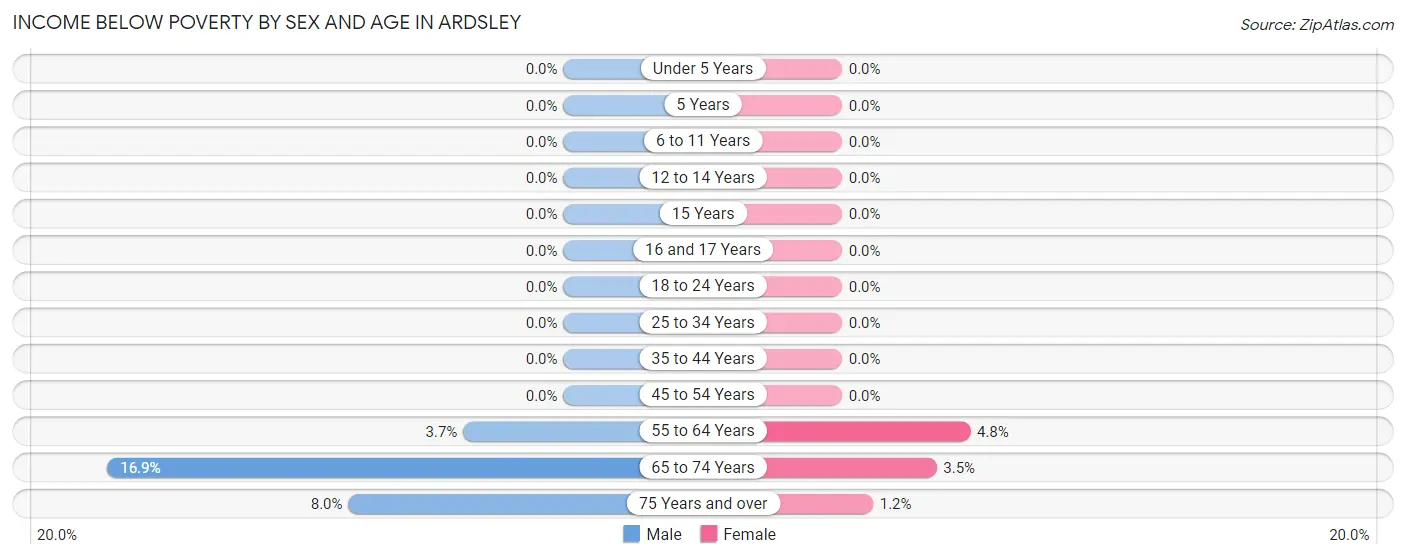
| Age Bracket | Male | Female |
| Under 5 Years | 0 (0.0%) | 0 (0.0%) |
| 5 Years | 0 (0.0%) | 0 (0.0%) |
| 6 to 11 Years | 0 (0.0%) | 0 (0.0%) |
| 12 to 14 Years | 0 (0.0%) | 0 (0.0%) |
| 15 Years | 0 (0.0%) | 0 (0.0%) |
| 16 and 17 Years | 0 (0.0%) | 0 (0.0%) |
| 18 to 24 Years | 0 (0.0%) | 0 (0.0%) |
| 25 to 34 Years | 0 (0.0%) | 0 (0.0%) |
| 35 to 44 Years | 0 (0.0%) | 0 (0.0%) |
| 45 to 54 Years | 0 (0.0%) | 0 (0.0%) |
| 55 to 64 Years | 8 (3.7%) | 8 (4.8%) |
| 65 to 74 Years | 43 (16.9%) | 12 (3.5%) |
| 75 Years and over | 13 (8.0%) | 3 (1.1%) |
| Total | 64 (2.6%) | 23 (0.9%) |
Income Above Poverty by Sex and Age in Ardsley
According to the poverty statistics in Ardsley, males aged under 5 years and females aged under 5 years are the age groups that are most secure financially, with 100.0% of males and 100.0% of females in these age groups living above the poverty line.
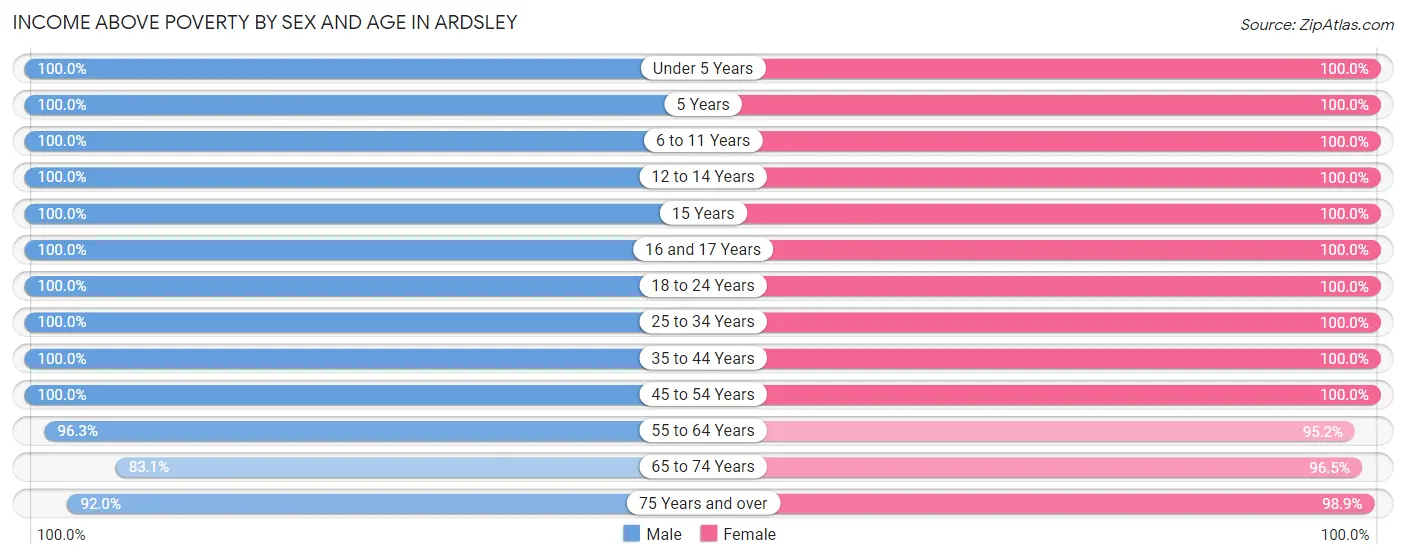
| Age Bracket | Male | Female |
| Under 5 Years | 111 (100.0%) | 151 (100.0%) |
| 5 Years | 15 (100.0%) | 15 (100.0%) |
| 6 to 11 Years | 329 (100.0%) | 180 (100.0%) |
| 12 to 14 Years | 92 (100.0%) | 143 (100.0%) |
| 15 Years | 20 (100.0%) | 132 (100.0%) |
| 16 and 17 Years | 96 (100.0%) | 59 (100.0%) |
| 18 to 24 Years | 113 (100.0%) | 128 (100.0%) |
| 25 to 34 Years | 194 (100.0%) | 148 (100.0%) |
| 35 to 44 Years | 283 (100.0%) | 374 (100.0%) |
| 45 to 54 Years | 537 (100.0%) | 475 (100.0%) |
| 55 to 64 Years | 207 (96.3%) | 160 (95.2%) |
| 65 to 74 Years | 211 (83.1%) | 330 (96.5%) |
| 75 Years and over | 150 (92.0%) | 258 (98.9%) |
| Total | 2,358 (97.4%) | 2,553 (99.1%) |
Income Below Poverty Among Married-Couple Families in Ardsley
The poverty statistics for married-couple families in Ardsley show that 0.6% or 8 of the total 1,304 families live below the poverty line. Families with no children have the highest poverty rate of 1.5%, comprising of 8 families. On the other hand, families with 1 or 2 children have the lowest poverty rate of 0.0%, which includes 0 families.
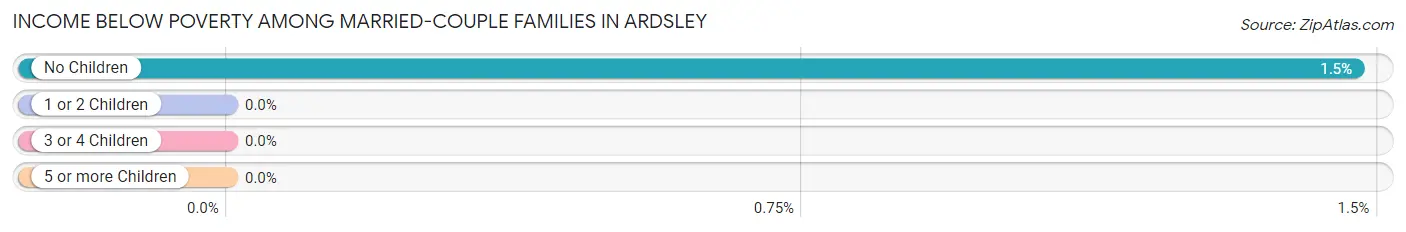
| Children | Above Poverty | Below Poverty |
| No Children | 536 (98.5%) | 8 (1.5%) |
| 1 or 2 Children | 720 (100.0%) | 0 (0.0%) |
| 3 or 4 Children | 40 (100.0%) | 0 (0.0%) |
| 5 or more Children | 0 (0.0%) | 0 (0.0%) |
| Total | 1,296 (99.4%) | 8 (0.6%) |
Income Below Poverty Among Single-Parent Households in Ardsley
| Children | Single Father | Single Mother |
| No Children | 0 (0.0%) | 0 (0.0%) |
| 1 or 2 Children | 0 (0.0%) | 0 (0.0%) |
| 3 or 4 Children | 0 (0.0%) | 0 (0.0%) |
| 5 or more Children | 0 (0.0%) | 0 (0.0%) |
| Total | 0 (0.0%) | 0 (0.0%) |
Income Below Poverty Among Married-Couple vs Single-Parent Households in Ardsley
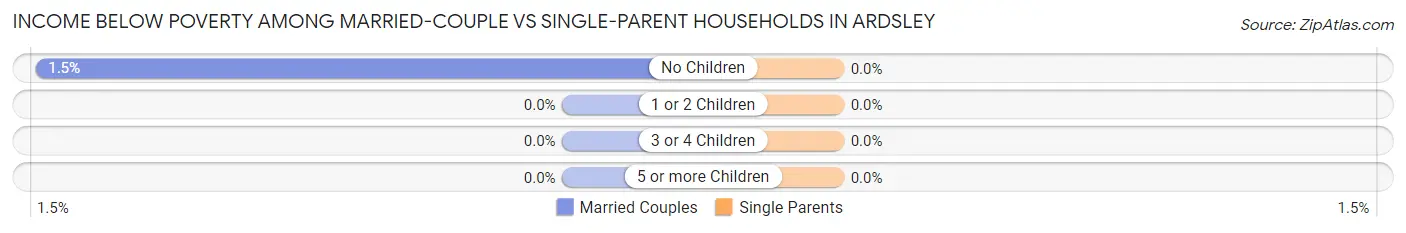
| Children | Married-Couple Families | Single-Parent Households |
| No Children | 8 (1.5%) | 0 (0.0%) |
| 1 or 2 Children | 0 (0.0%) | 0 (0.0%) |
| 3 or 4 Children | 0 (0.0%) | 0 (0.0%) |
| 5 or more Children | 0 (0.0%) | 0 (0.0%) |
| Total | 8 (0.6%) | 0 (0.0%) |
Race in Ardsley
The most populous races in Ardsley are White / Caucasian (3,404 | 67.9%), Asian (671 | 13.4%), and Two or more Races (529 | 10.5%).
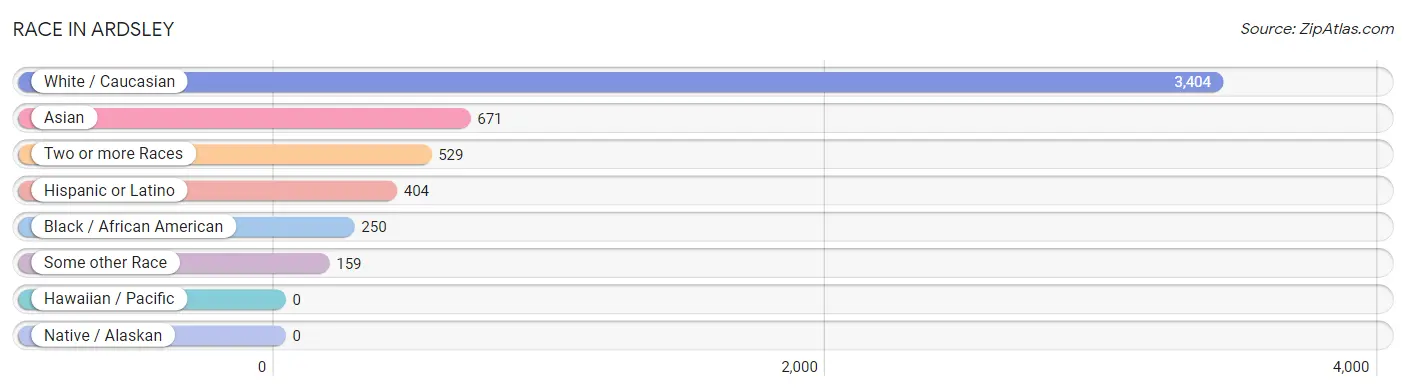
| Race | # Population | % Population |
| Asian | 671 | 13.4% |
| Black / African American | 250 | 5.0% |
| Hawaiian / Pacific | 0 | 0.0% |
| Hispanic or Latino | 404 | 8.1% |
| Native / Alaskan | 0 | 0.0% |
| White / Caucasian | 3,404 | 67.9% |
| Two or more Races | 529 | 10.5% |
| Some other Race | 159 | 3.2% |
| Total | 5,013 | 100.0% |
Ancestry in Ardsley
The most populous ancestries reported in Ardsley are Italian (882 | 17.6%), Irish (680 | 13.6%), German (485 | 9.7%), Ukrainian (405 | 8.1%), and Polish (401 | 8.0%), together accounting for 56.9% of all Ardsley residents.
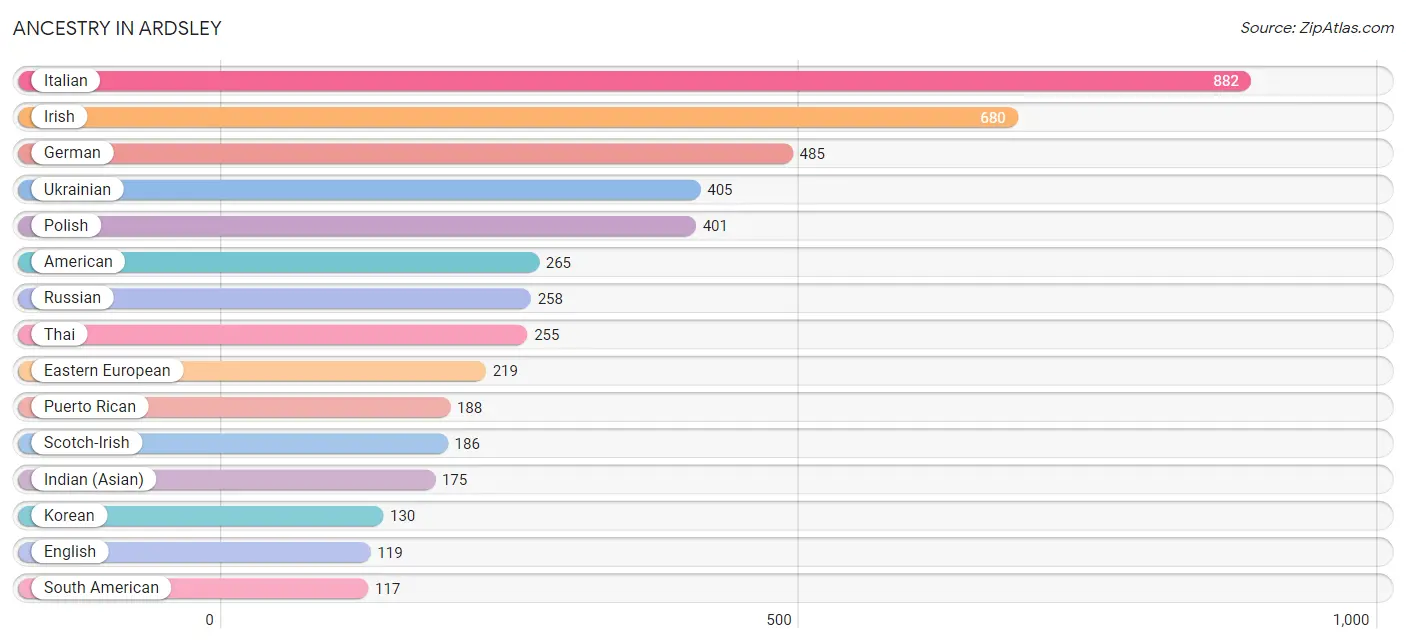
| Ancestry | # Population | % Population |
| Albanian | 25 | 0.5% |
| American | 265 | 5.3% |
| Argentinean | 42 | 0.8% |
| Armenian | 9 | 0.2% |
| Austrian | 38 | 0.8% |
| Belgian | 23 | 0.5% |
| Brazilian | 9 | 0.2% |
| British | 49 | 1.0% |
| Burmese | 78 | 1.6% |
| Canadian | 81 | 1.6% |
| Central American | 44 | 0.9% |
| Czech | 11 | 0.2% |
| Eastern European | 219 | 4.4% |
| Ecuadorian | 75 | 1.5% |
| English | 119 | 2.4% |
| European | 48 | 1.0% |
| Filipino | 32 | 0.6% |
| French | 49 | 1.0% |
| German | 485 | 9.7% |
| Greek | 26 | 0.5% |
| Haitian | 102 | 2.0% |
| Hungarian | 24 | 0.5% |
| Indian (Asian) | 175 | 3.5% |
| Iranian | 13 | 0.3% |
| Irish | 680 | 13.6% |
| Italian | 882 | 17.6% |
| Korean | 130 | 2.6% |
| Laotian | 20 | 0.4% |
| Latvian | 11 | 0.2% |
| Lithuanian | 8 | 0.2% |
| Nicaraguan | 44 | 0.9% |
| Norwegian | 12 | 0.2% |
| Polish | 401 | 8.0% |
| Portuguese | 21 | 0.4% |
| Puerto Rican | 188 | 3.7% |
| Romanian | 38 | 0.8% |
| Russian | 258 | 5.1% |
| Scotch-Irish | 186 | 3.7% |
| Scottish | 6 | 0.1% |
| Slavic | 3 | 0.1% |
| Slovak | 8 | 0.2% |
| South American | 117 | 2.3% |
| Spaniard | 55 | 1.1% |
| Sri Lankan | 3 | 0.1% |
| Swiss | 19 | 0.4% |
| Thai | 255 | 5.1% |
| Ukrainian | 405 | 8.1% | View All 47 Rows |
Immigrants in Ardsley
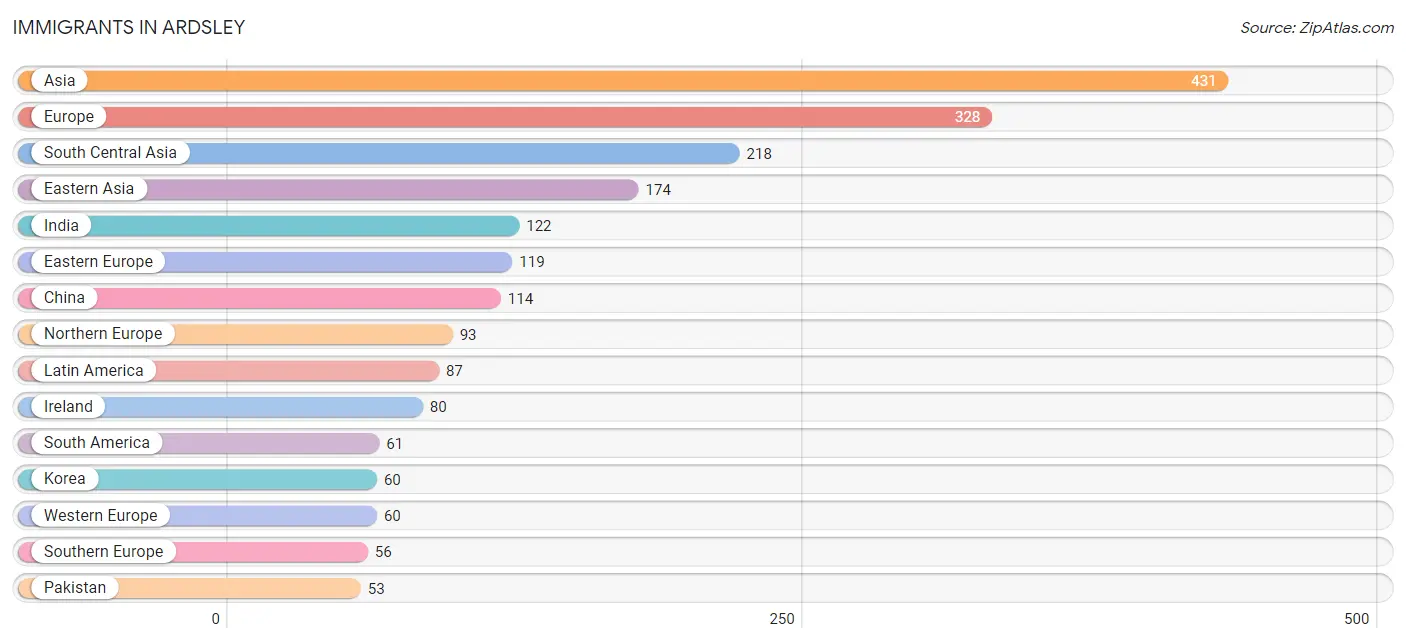
The most numerous immigrant groups reported in Ardsley came from Asia (431 | 8.6%), Europe (328 | 6.5%), South Central Asia (218 | 4.3%), Eastern Asia (174 | 3.5%), and India (122 | 2.4%), together accounting for 25.4% of all Ardsley residents.
| Immigration Origin | # Population | % Population |
| Africa | 8 | 0.2% |
| Albania | 25 | 0.5% |
| Asia | 431 | 8.6% |
| Canada | 44 | 0.9% |
| Caribbean | 26 | 0.5% |
| China | 114 | 2.3% |
| Colombia | 17 | 0.3% |
| Eastern Asia | 174 | 3.5% |
| Eastern Europe | 119 | 2.4% |
| Ecuador | 44 | 0.9% |
| England | 13 | 0.3% |
| Europe | 328 | 6.5% |
| France | 37 | 0.7% |
| Germany | 23 | 0.5% |
| Greece | 14 | 0.3% |
| Haiti | 26 | 0.5% |
| Hong Kong | 12 | 0.2% |
| India | 122 | 2.4% |
| Iran | 43 | 0.9% |
| Ireland | 80 | 1.6% |
| Italy | 42 | 0.8% |
| Korea | 60 | 1.2% |
| Latin America | 87 | 1.7% |
| Latvia | 11 | 0.2% |
| Nigeria | 8 | 0.2% |
| Northern Europe | 93 | 1.9% |
| Pakistan | 53 | 1.1% |
| Philippines | 39 | 0.8% |
| Romania | 52 | 1.0% |
| South America | 61 | 1.2% |
| South Central Asia | 218 | 4.3% |
| South Eastern Asia | 39 | 0.8% |
| Southern Europe | 56 | 1.1% |
| Taiwan | 2 | 0.0% |
| Ukraine | 31 | 0.6% |
| Western Africa | 8 | 0.2% |
| Western Europe | 60 | 1.2% | View All 37 Rows |
Sex and Age in Ardsley
Sex and Age in Ardsley
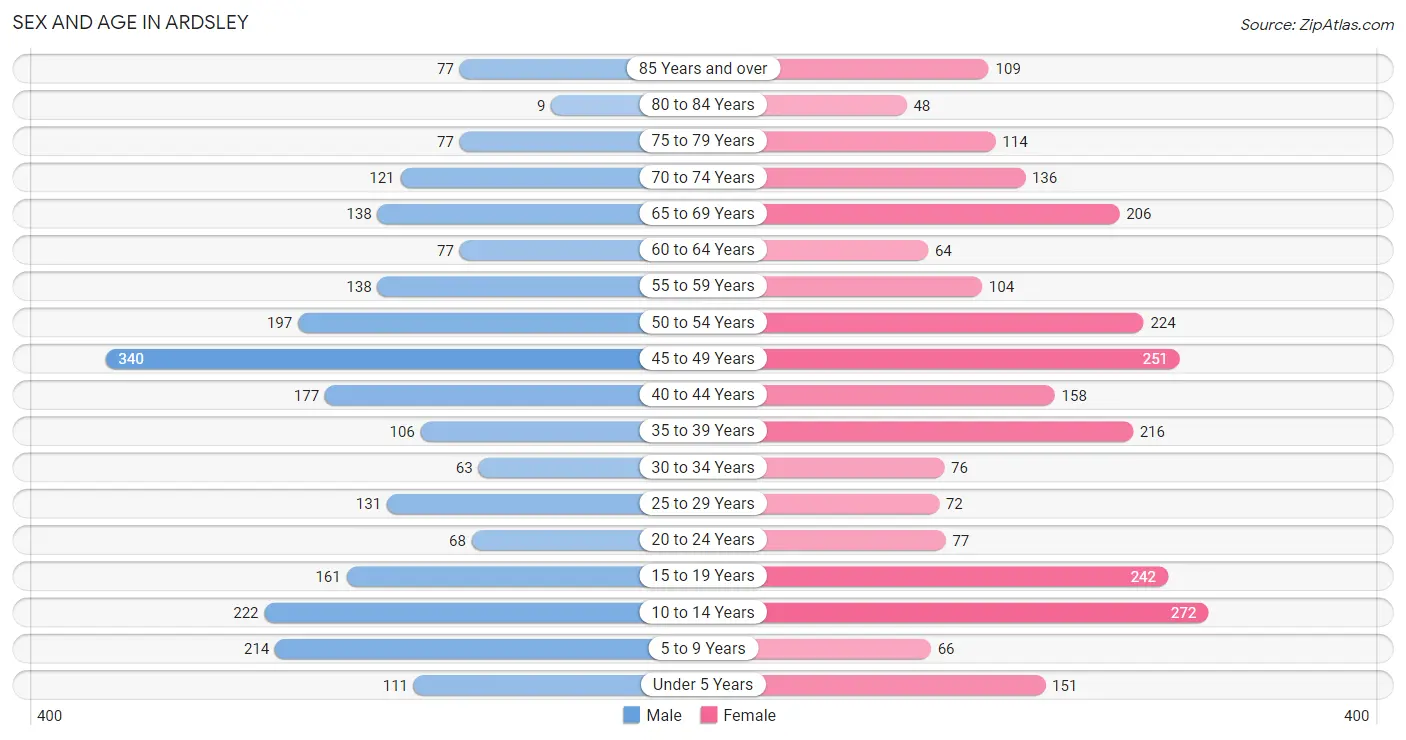
The most populous age groups in Ardsley are 45 to 49 Years (340 | 14.0%) for men and 10 to 14 Years (272 | 10.5%) for women.
| Age Bracket | Male | Female |
| Under 5 Years | 111 (4.6%) | 151 (5.8%) |
| 5 to 9 Years | 214 (8.8%) | 66 (2.5%) |
| 10 to 14 Years | 222 (9.1%) | 272 (10.5%) |
| 15 to 19 Years | 161 (6.6%) | 242 (9.4%) |
| 20 to 24 Years | 68 (2.8%) | 77 (3.0%) |
| 25 to 29 Years | 131 (5.4%) | 72 (2.8%) |
| 30 to 34 Years | 63 (2.6%) | 76 (2.9%) |
| 35 to 39 Years | 106 (4.4%) | 216 (8.4%) |
| 40 to 44 Years | 177 (7.3%) | 158 (6.1%) |
| 45 to 49 Years | 340 (14.0%) | 251 (9.7%) |
| 50 to 54 Years | 197 (8.1%) | 224 (8.7%) |
| 55 to 59 Years | 138 (5.7%) | 104 (4.0%) |
| 60 to 64 Years | 77 (3.2%) | 64 (2.5%) |
| 65 to 69 Years | 138 (5.7%) | 206 (8.0%) |
| 70 to 74 Years | 121 (5.0%) | 136 (5.3%) |
| 75 to 79 Years | 77 (3.2%) | 114 (4.4%) |
| 80 to 84 Years | 9 (0.4%) | 48 (1.9%) |
| 85 Years and over | 77 (3.2%) | 109 (4.2%) |
| Total | 2,427 (100.0%) | 2,586 (100.0%) |
Families and Households in Ardsley
Median Family Size in Ardsley
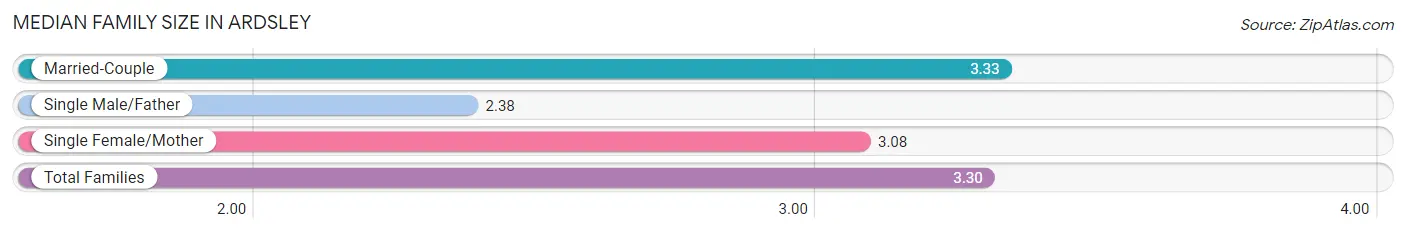
The median family size in Ardsley is 3.30 persons per family, with married-couple families (1,304 | 92.9%) accounting for the largest median family size of 3.33 persons per family. On the other hand, single male/father families (21 | 1.5%) represent the smallest median family size with 2.38 persons per family.
| Family Type | # Families | Family Size |
| Married-Couple | 1,304 (92.9%) | 3.33 |
| Single Male/Father | 21 (1.5%) | 2.38 |
| Single Female/Mother | 79 (5.6%) | 3.08 |
| Total Families | 1,404 (100.0%) | 3.30 |
Median Household Size in Ardsley
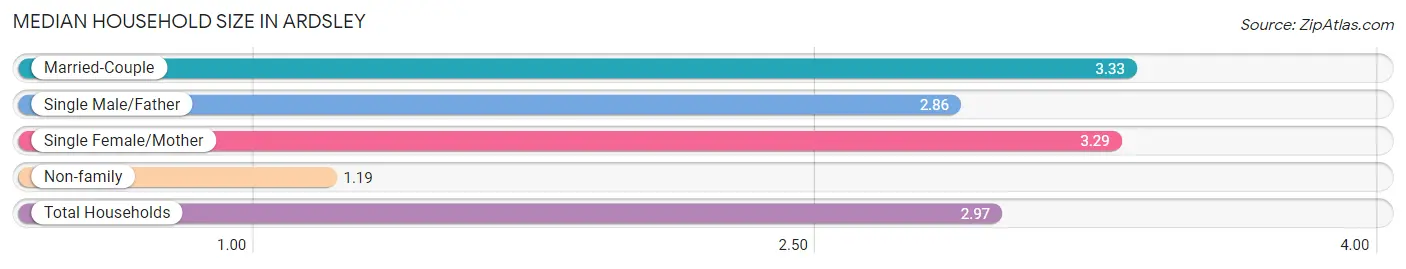
The median household size in Ardsley is 2.97 persons per household, with married-couple households (1,304 | 77.7%) accounting for the largest median household size of 3.33 persons per household. non-family households (275 | 16.4%) represent the smallest median household size with 1.19 persons per household.
| Household Type | # Households | Household Size |
| Married-Couple | 1,304 (77.7%) | 3.33 |
| Single Male/Father | 21 (1.3%) | 2.86 |
| Single Female/Mother | 79 (4.7%) | 3.29 |
| Non-family | 275 (16.4%) | 1.19 |
| Total Households | 1,679 (100.0%) | 2.97 |
Household Size by Marriage Status in Ardsley
Out of a total of 1,679 households in Ardsley, 1,404 (83.6%) are family households, while 275 (16.4%) are nonfamily households. The most numerous type of family households are 4-person households, comprising 503, and the most common type of nonfamily households are 1-person households, comprising 226.
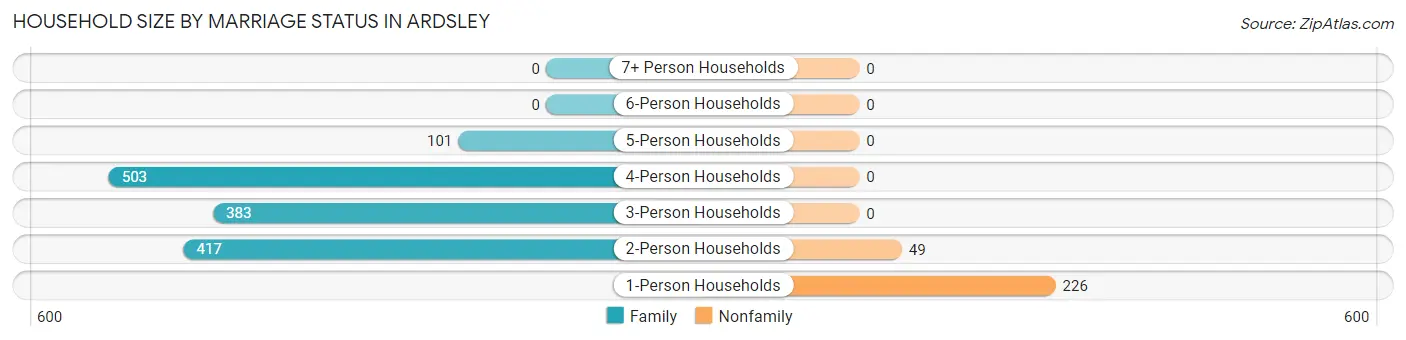
| Household Size | Family Households | Nonfamily Households |
| 1-Person Households | - | 226 (13.5%) |
| 2-Person Households | 417 (24.8%) | 49 (2.9%) |
| 3-Person Households | 383 (22.8%) | 0 (0.0%) |
| 4-Person Households | 503 (30.0%) | 0 (0.0%) |
| 5-Person Households | 101 (6.0%) | 0 (0.0%) |
| 6-Person Households | 0 (0.0%) | 0 (0.0%) |
| 7+ Person Households | 0 (0.0%) | 0 (0.0%) |
| Total | 1,404 (83.6%) | 275 (16.4%) |
Female Fertility in Ardsley
Fertility by Age in Ardsley
Average fertility rate in Ardsley is 16.0 births per 1,000 women. Women in the age bracket of 35 to 50 years have the highest fertility rate with 28.0 births per 1,000 women. Women in the age bracket of 35 to 50 years acount for 100.0% of all women with births.
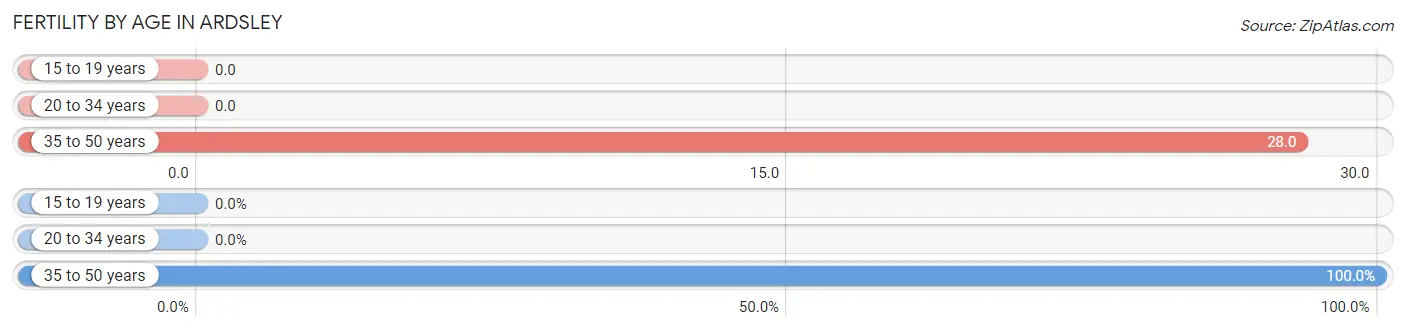
| Age Bracket | Women with Births | Births / 1,000 Women |
| 15 to 19 years | 0 (0.0%) | 0.0 |
| 20 to 34 years | 0 (0.0%) | 0.0 |
| 35 to 50 years | 18 (100.0%) | 28.0 |
| Total | 18 (100.0%) | 16.0 |
Fertility by Age by Marriage Status in Ardsley
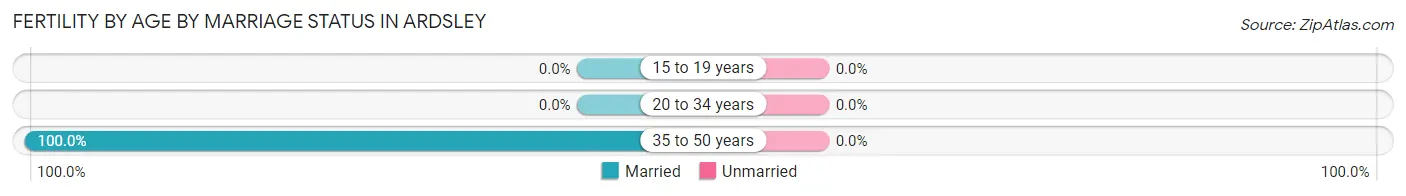
| Age Bracket | Married | Unmarried |
| 15 to 19 years | 0 (0.0%) | 0 (0.0%) |
| 20 to 34 years | 0 (0.0%) | 0 (0.0%) |
| 35 to 50 years | 18 (100.0%) | 0 (0.0%) |
| Total | 18 (100.0%) | 0 (0.0%) |
Fertility by Education in Ardsley
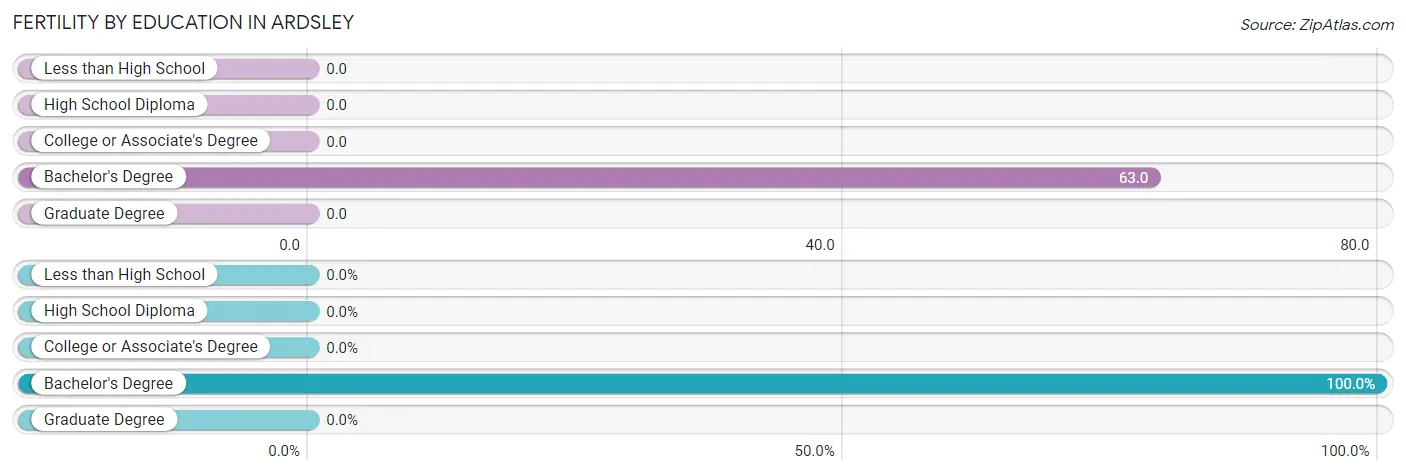
| Educational Attainment | Women with Births | Births / 1,000 Women |
| Less than High School | 0 (0.0%) | 0.0 |
| High School Diploma | 0 (0.0%) | 0.0 |
| College or Associate's Degree | 0 (0.0%) | 0.0 |
| Bachelor's Degree | 18 (100.0%) | 63.0 |
| Graduate Degree | 0 (0.0%) | 0.0 |
| Total | 18 (100.0%) | 16.0 |
Fertility by Education by Marriage Status in Ardsley
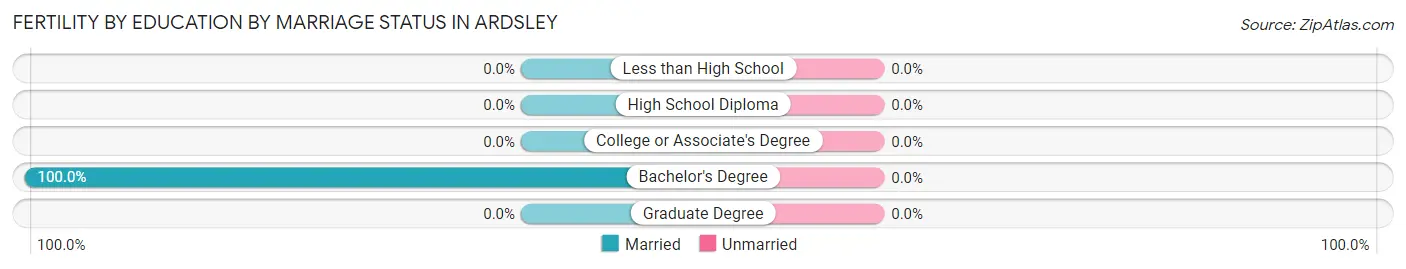
| Educational Attainment | Married | Unmarried |
| Less than High School | 0 (0.0%) | 0 (0.0%) |
| High School Diploma | 0 (0.0%) | 0 (0.0%) |
| College or Associate's Degree | 0 (0.0%) | 0 (0.0%) |
| Bachelor's Degree | 18 (100.0%) | 0 (0.0%) |
| Graduate Degree | 0 (0.0%) | 0 (0.0%) |
| Total | 18 (100.0%) | 0 (0.0%) |
Employment Characteristics in Ardsley
Employment by Class of Employer in Ardsley
Among the 2,263 employed individuals in Ardsley, private company employees (1,121 | 49.5%), local government employees (372 | 16.4%), and self-employed (not incorporated) (259 | 11.4%) make up the most common classes of employment.
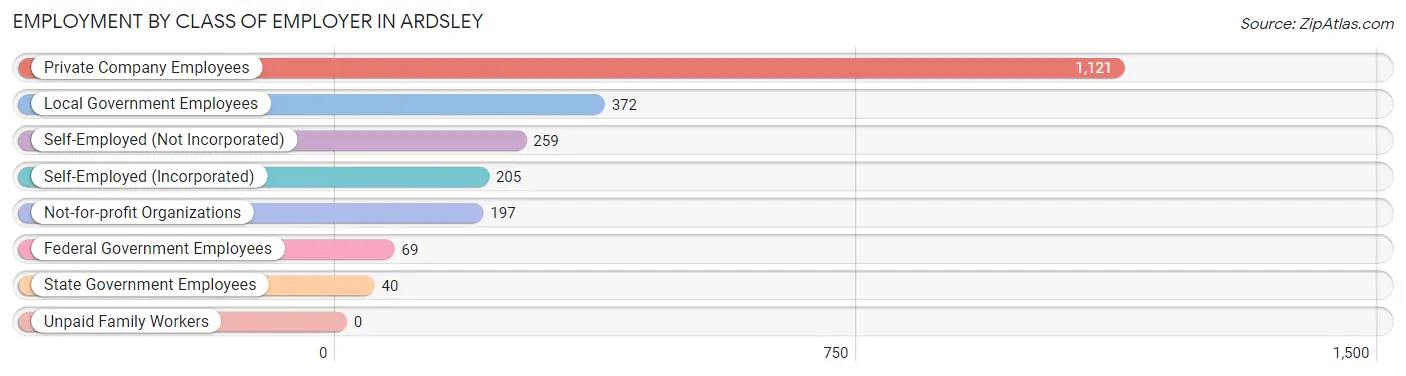
| Employer Class | # Employees | % Employees |
| Private Company Employees | 1,121 | 49.5% |
| Self-Employed (Incorporated) | 205 | 9.1% |
| Self-Employed (Not Incorporated) | 259 | 11.4% |
| Not-for-profit Organizations | 197 | 8.7% |
| Local Government Employees | 372 | 16.4% |
| State Government Employees | 40 | 1.8% |
| Federal Government Employees | 69 | 3.0% |
| Unpaid Family Workers | 0 | 0.0% |
| Total | 2,263 | 100.0% |
Employment Status by Age in Ardsley
According to the labor force statistics for Ardsley, out of the total population over 16 years of age (3,825), 65.3% or 2,498 individuals are in the labor force, with 8.7% or 217 of them unemployed. The age group with the highest labor force participation rate is 35 to 44 years, with 94.7% or 622 individuals in the labor force. Within the labor force, the 25 to 29 years age range has the highest percentage of unemployed individuals, with 38.6% or 51 of them being unemployed.
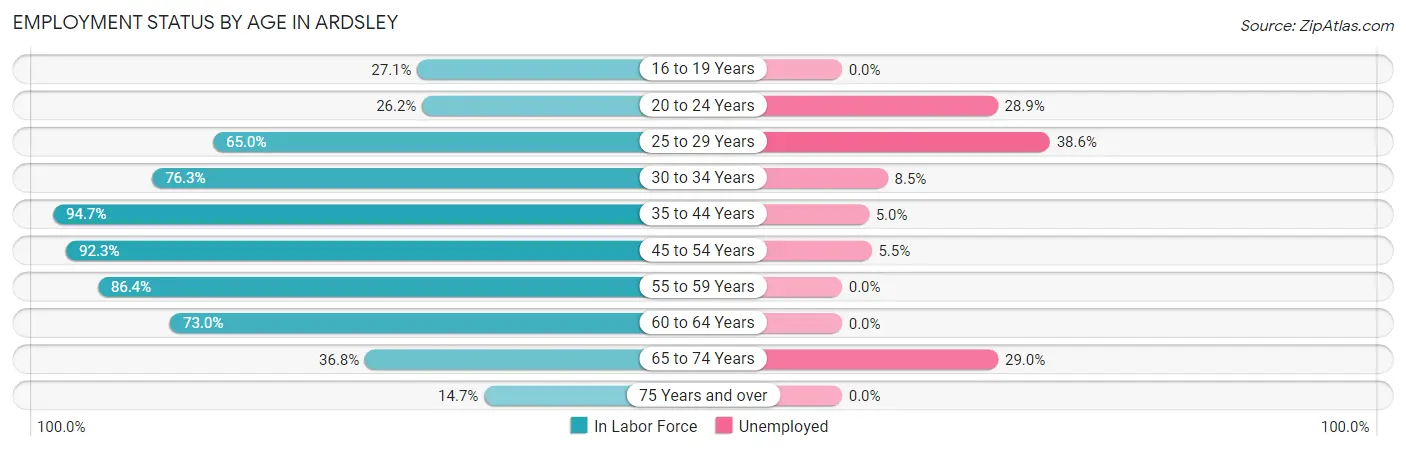
| Age Bracket | In Labor Force | Unemployed |
| 16 to 19 Years | 68 (27.1%) | 0 (0.0%) |
| 20 to 24 Years | 38 (26.2%) | 11 (28.9%) |
| 25 to 29 Years | 132 (65.0%) | 51 (38.6%) |
| 30 to 34 Years | 106 (76.3%) | 9 (8.5%) |
| 35 to 44 Years | 622 (94.7%) | 31 (5.0%) |
| 45 to 54 Years | 934 (92.3%) | 51 (5.5%) |
| 55 to 59 Years | 209 (86.4%) | 0 (0.0%) |
| 60 to 64 Years | 103 (73.0%) | 0 (0.0%) |
| 65 to 74 Years | 221 (36.8%) | 64 (29.0%) |
| 75 Years and over | 64 (14.7%) | 0 (0.0%) |
| Total | 2,498 (65.3%) | 217 (8.7%) |
Employment Status by Educational Attainment in Ardsley
According to labor force statistics for Ardsley, 88.0% of individuals (2,107) out of the total population between 25 and 64 years of age (2,394) are in the labor force, with 6.7% or 141 of them being unemployed. The group with the highest labor force participation rate are those with the educational attainment of bachelor's degree or higher, with 90.7% or 1,679 individuals in the labor force. Within the labor force, individuals with high school diploma education have the highest percentage of unemployment, with 22.4% or 51 of them being unemployed.
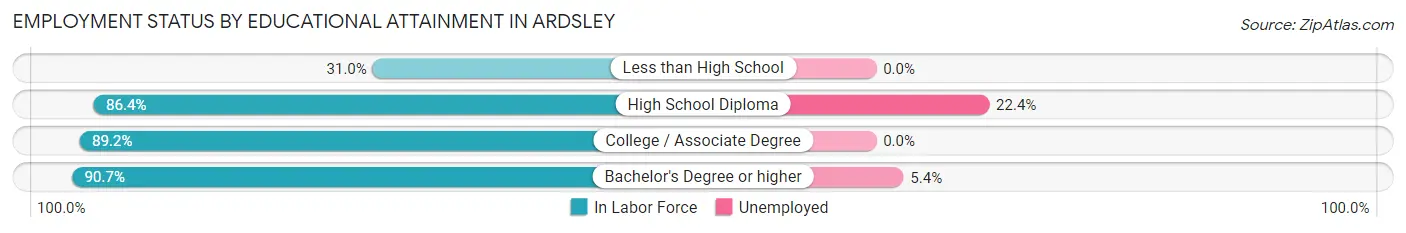
| Educational Attainment | In Labor Force | Unemployed |
| Less than High School | 26 (31.0%) | 0 (0.0%) |
| High School Diploma | 228 (86.4%) | 59 (22.4%) |
| College / Associate Degree | 174 (89.2%) | 0 (0.0%) |
| Bachelor's Degree or higher | 1,679 (90.7%) | 100 (5.4%) |
| Total | 2,107 (88.0%) | 160 (6.7%) |
Employment Occupations by Sex in Ardsley
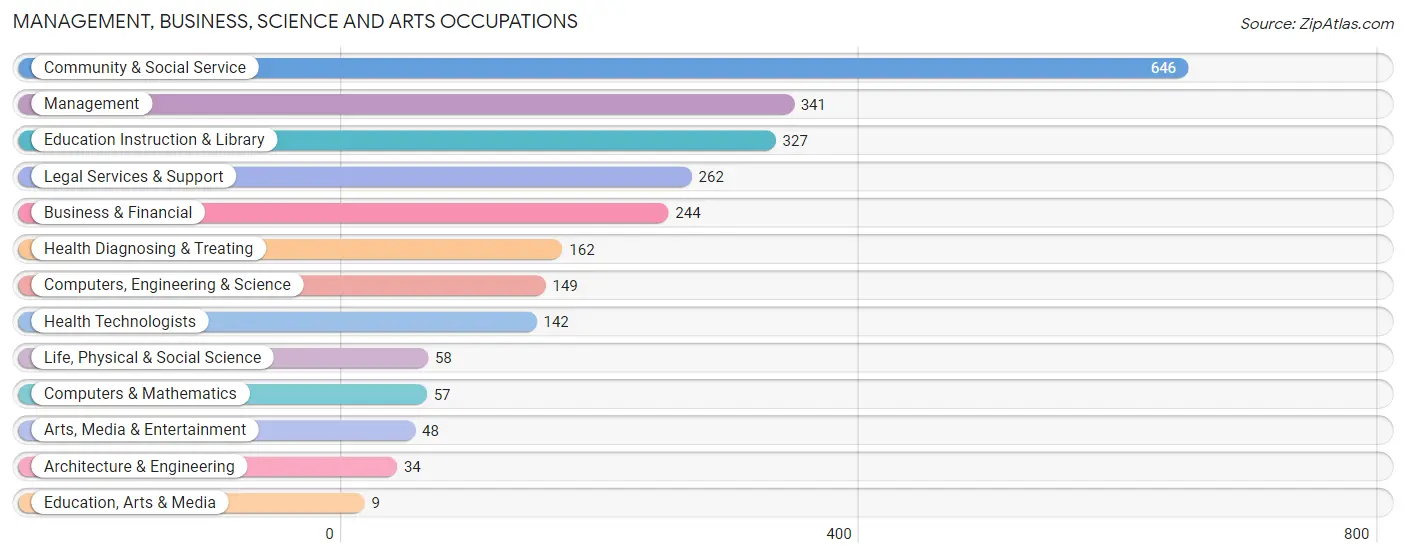
Management, Business, Science and Arts Occupations
The most common Management, Business, Science and Arts occupations in Ardsley are Community & Social Service (646 | 28.3%), Management (341 | 15.0%), Education Instruction & Library (327 | 14.3%), Legal Services & Support (262 | 11.5%), and Business & Financial (244 | 10.7%).
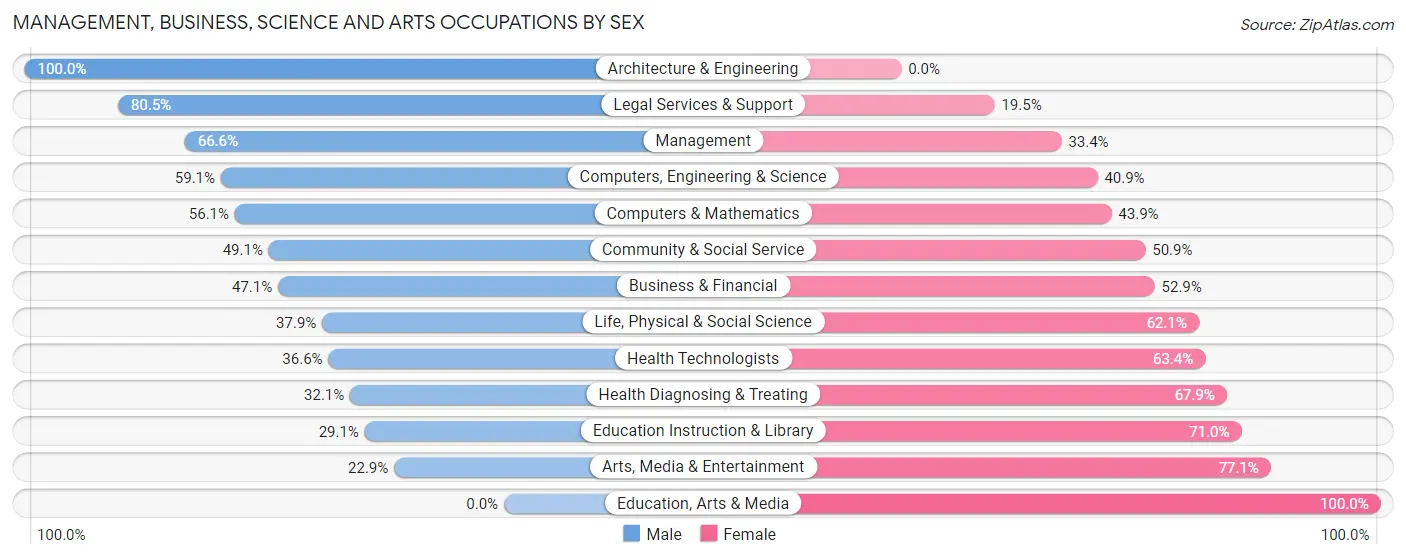
Management, Business, Science and Arts Occupations by Sex
Within the Management, Business, Science and Arts occupations in Ardsley, the most male-oriented occupations are Architecture & Engineering (100.0%), Legal Services & Support (80.5%), and Management (66.6%), while the most female-oriented occupations are Education, Arts & Media (100.0%), Arts, Media & Entertainment (77.1%), and Education Instruction & Library (71.0%).
| Occupation | Male | Female |
| Management | 227 (66.6%) | 114 (33.4%) |
| Business & Financial | 115 (47.1%) | 129 (52.9%) |
| Computers, Engineering & Science | 88 (59.1%) | 61 (40.9%) |
| Computers & Mathematics | 32 (56.1%) | 25 (43.9%) |
| Architecture & Engineering | 34 (100.0%) | 0 (0.0%) |
| Life, Physical & Social Science | 22 (37.9%) | 36 (62.1%) |
| Community & Social Service | 317 (49.1%) | 329 (50.9%) |
| Education, Arts & Media | 0 (0.0%) | 9 (100.0%) |
| Legal Services & Support | 211 (80.5%) | 51 (19.5%) |
| Education Instruction & Library | 95 (29.0%) | 232 (71.0%) |
| Arts, Media & Entertainment | 11 (22.9%) | 37 (77.1%) |
| Health Diagnosing & Treating | 52 (32.1%) | 110 (67.9%) |
| Health Technologists | 52 (36.6%) | 90 (63.4%) |
| Total (Category) | 799 (51.8%) | 743 (48.2%) |
| Total (Overall) | 1,251 (54.9%) | 1,029 (45.1%) |
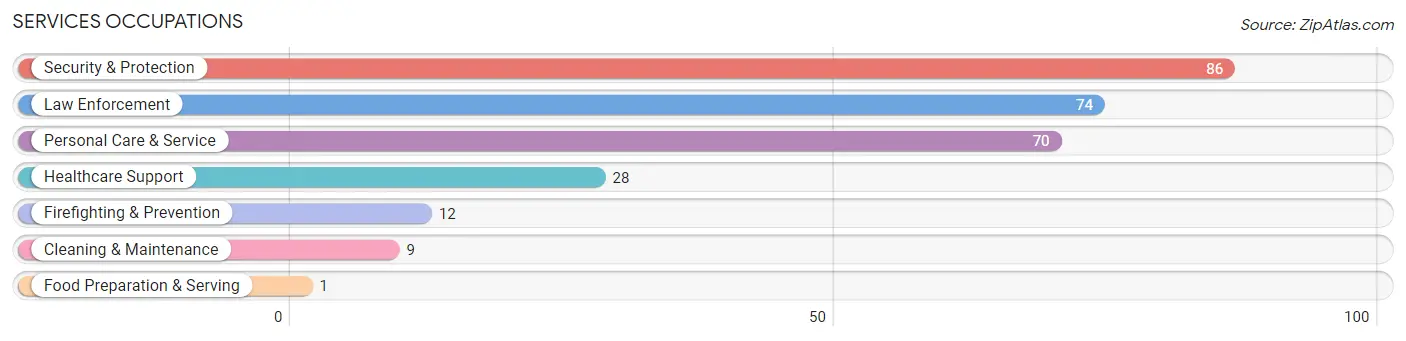
Services Occupations
The most common Services occupations in Ardsley are Security & Protection (86 | 3.8%), Law Enforcement (74 | 3.3%), Personal Care & Service (70 | 3.1%), Healthcare Support (28 | 1.2%), and Firefighting & Prevention (12 | 0.5%).
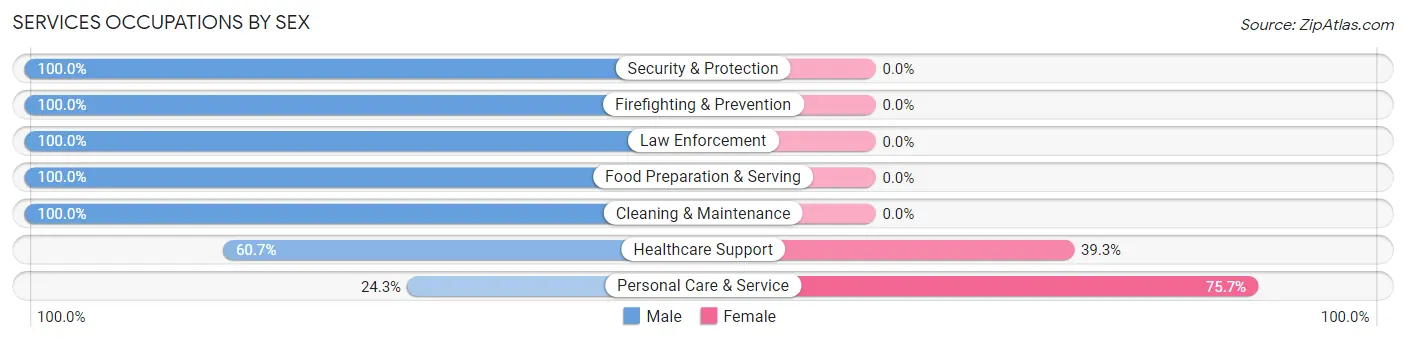
Services Occupations by Sex
Within the Services occupations in Ardsley, the most male-oriented occupations are Security & Protection (100.0%), Firefighting & Prevention (100.0%), and Law Enforcement (100.0%), while the most female-oriented occupations are Personal Care & Service (75.7%), and Healthcare Support (39.3%).
| Occupation | Male | Female |
| Healthcare Support | 17 (60.7%) | 11 (39.3%) |
| Security & Protection | 86 (100.0%) | 0 (0.0%) |
| Firefighting & Prevention | 12 (100.0%) | 0 (0.0%) |
| Law Enforcement | 74 (100.0%) | 0 (0.0%) |
| Food Preparation & Serving | 1 (100.0%) | 0 (0.0%) |
| Cleaning & Maintenance | 9 (100.0%) | 0 (0.0%) |
| Personal Care & Service | 17 (24.3%) | 53 (75.7%) |
| Total (Category) | 130 (67.0%) | 64 (33.0%) |
| Total (Overall) | 1,251 (54.9%) | 1,029 (45.1%) |
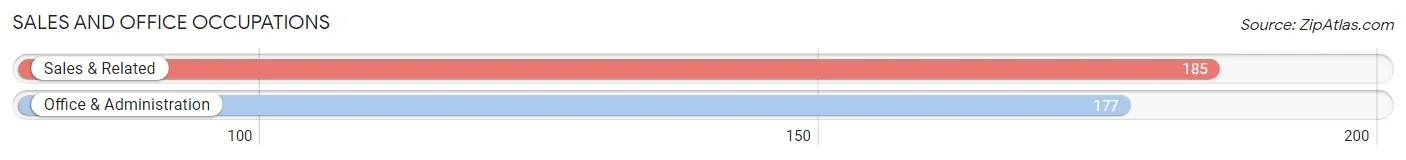
Sales and Office Occupations
The most common Sales and Office occupations in Ardsley are Sales & Related (185 | 8.1%), and Office & Administration (177 | 7.8%).
Sales and Office Occupations by Sex
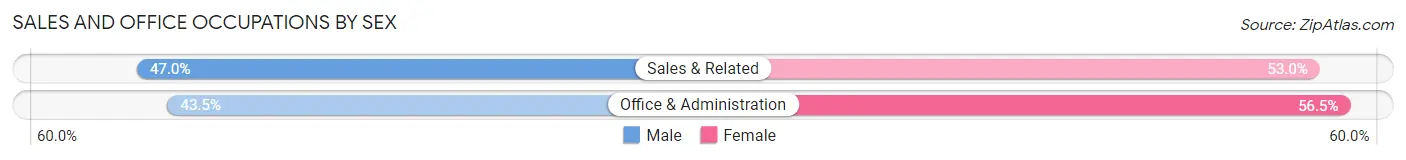
| Occupation | Male | Female |
| Sales & Related | 87 (47.0%) | 98 (53.0%) |
| Office & Administration | 77 (43.5%) | 100 (56.5%) |
| Total (Category) | 164 (45.3%) | 198 (54.7%) |
| Total (Overall) | 1,251 (54.9%) | 1,029 (45.1%) |
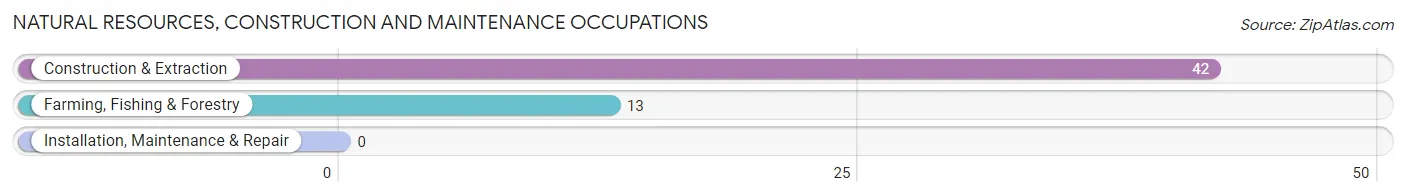
Natural Resources, Construction and Maintenance Occupations
The most common Natural Resources, Construction and Maintenance occupations in Ardsley are Construction & Extraction (42 | 1.8%), and Farming, Fishing & Forestry (13 | 0.6%).
Natural Resources, Construction and Maintenance Occupations by Sex
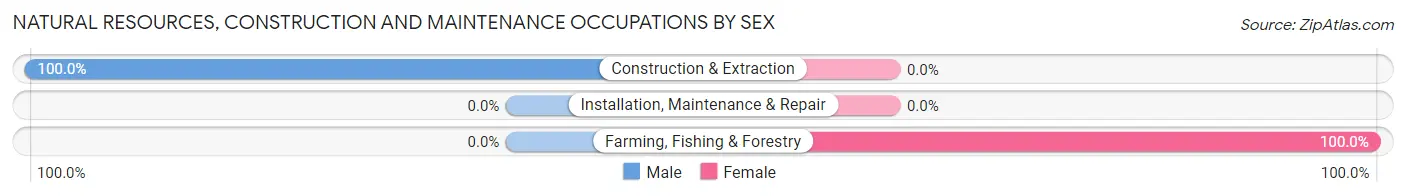
| Occupation | Male | Female |
| Farming, Fishing & Forestry | 0 (0.0%) | 13 (100.0%) |
| Construction & Extraction | 42 (100.0%) | 0 (0.0%) |
| Installation, Maintenance & Repair | 0 (0.0%) | 0 (0.0%) |
| Total (Category) | 42 (76.4%) | 13 (23.6%) |
| Total (Overall) | 1,251 (54.9%) | 1,029 (45.1%) |
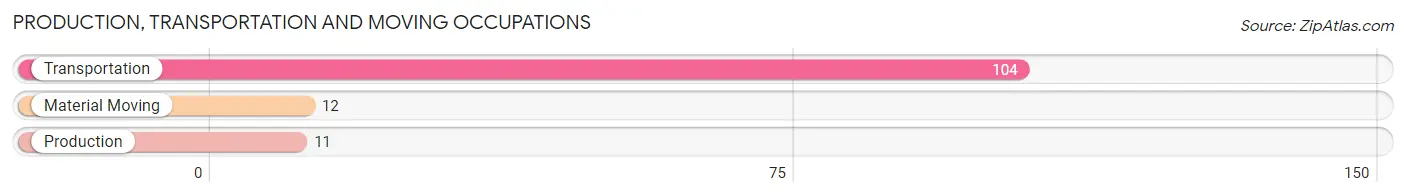
Production, Transportation and Moving Occupations
The most common Production, Transportation and Moving occupations in Ardsley are Transportation (104 | 4.6%), Material Moving (12 | 0.5%), and Production (11 | 0.5%).
Production, Transportation and Moving Occupations by Sex
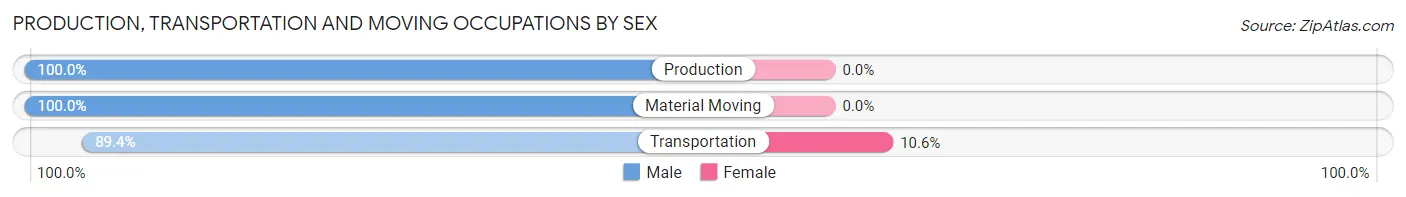
| Occupation | Male | Female |
| Production | 11 (100.0%) | 0 (0.0%) |
| Transportation | 93 (89.4%) | 11 (10.6%) |
| Material Moving | 12 (100.0%) | 0 (0.0%) |
| Total (Category) | 116 (91.3%) | 11 (8.7%) |
| Total (Overall) | 1,251 (54.9%) | 1,029 (45.1%) |
Employment Industries by Sex in Ardsley
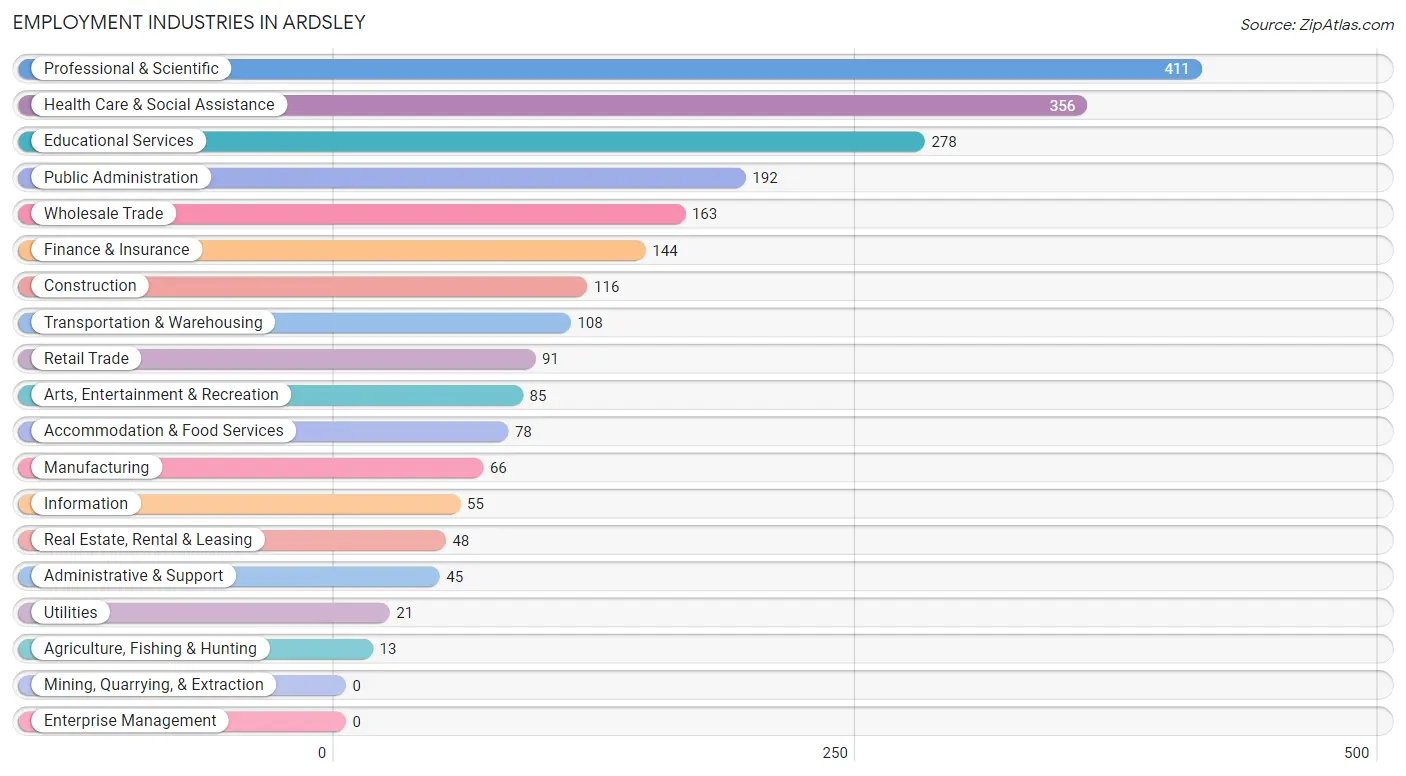
Employment Industries in Ardsley
The major employment industries in Ardsley include Professional & Scientific (411 | 18.0%), Health Care & Social Assistance (356 | 15.6%), Educational Services (278 | 12.2%), Public Administration (192 | 8.4%), and Wholesale Trade (163 | 7.1%).
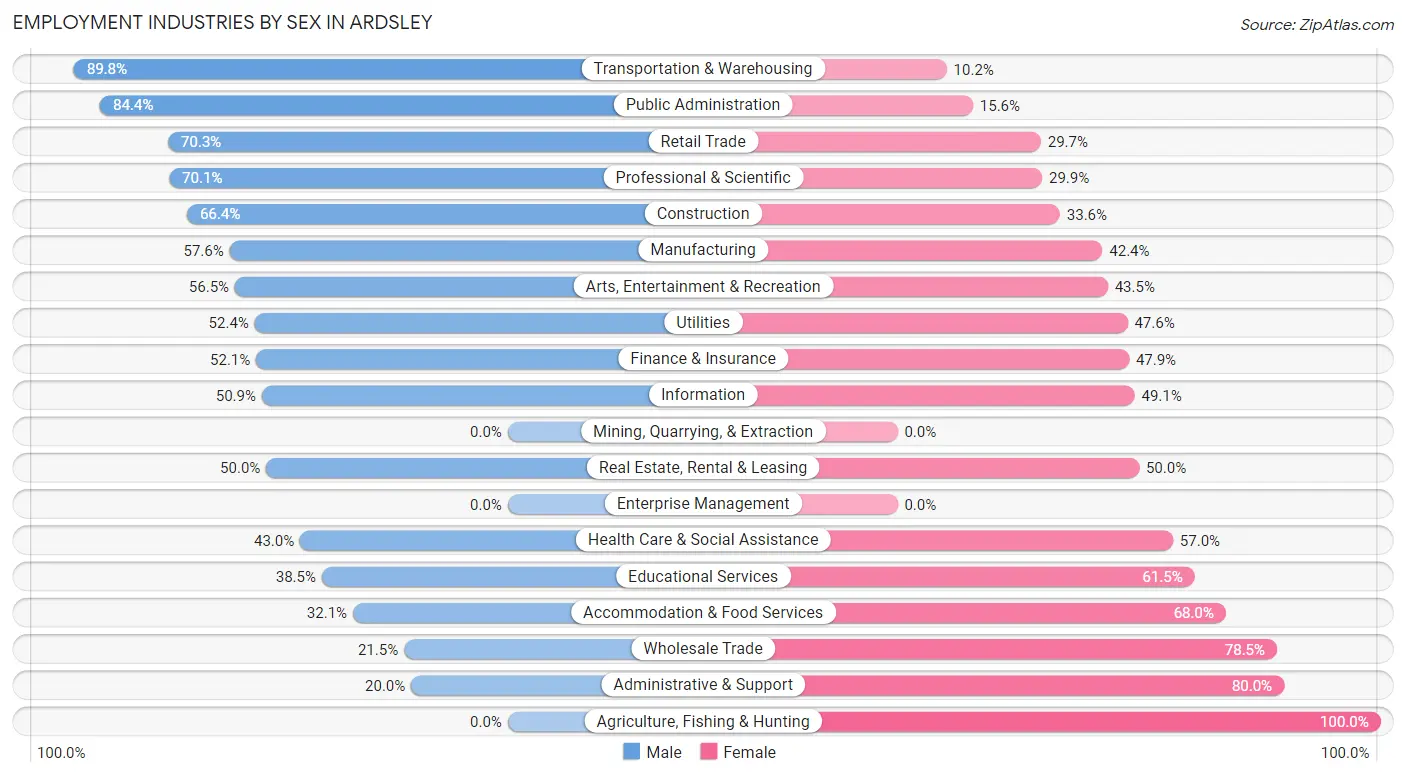
Employment Industries by Sex in Ardsley
The Ardsley industries that see more men than women are Transportation & Warehousing (89.8%), Public Administration (84.4%), and Retail Trade (70.3%), whereas the industries that tend to have a higher number of women are Agriculture, Fishing & Hunting (100.0%), Administrative & Support (80.0%), and Wholesale Trade (78.5%).
| Industry | Male | Female |
| Agriculture, Fishing & Hunting | 0 (0.0%) | 13 (100.0%) |
| Mining, Quarrying, & Extraction | 0 (0.0%) | 0 (0.0%) |
| Construction | 77 (66.4%) | 39 (33.6%) |
| Manufacturing | 38 (57.6%) | 28 (42.4%) |
| Wholesale Trade | 35 (21.5%) | 128 (78.5%) |
| Retail Trade | 64 (70.3%) | 27 (29.7%) |
| Transportation & Warehousing | 97 (89.8%) | 11 (10.2%) |
| Utilities | 11 (52.4%) | 10 (47.6%) |
| Information | 28 (50.9%) | 27 (49.1%) |
| Finance & Insurance | 75 (52.1%) | 69 (47.9%) |
| Real Estate, Rental & Leasing | 24 (50.0%) | 24 (50.0%) |
| Professional & Scientific | 288 (70.1%) | 123 (29.9%) |
| Enterprise Management | 0 (0.0%) | 0 (0.0%) |
| Administrative & Support | 9 (20.0%) | 36 (80.0%) |
| Educational Services | 107 (38.5%) | 171 (61.5%) |
| Health Care & Social Assistance | 153 (43.0%) | 203 (57.0%) |
| Arts, Entertainment & Recreation | 48 (56.5%) | 37 (43.5%) |
| Accommodation & Food Services | 25 (32.1%) | 53 (67.9%) |
| Public Administration | 162 (84.4%) | 30 (15.6%) |
| Total | 1,251 (54.9%) | 1,029 (45.1%) |
Education in Ardsley
School Enrollment in Ardsley
The most common levels of schooling among the 1,450 students in Ardsley are high school (446 | 30.8%), middle school (419 | 28.9%), and elementary school (251 | 17.3%).
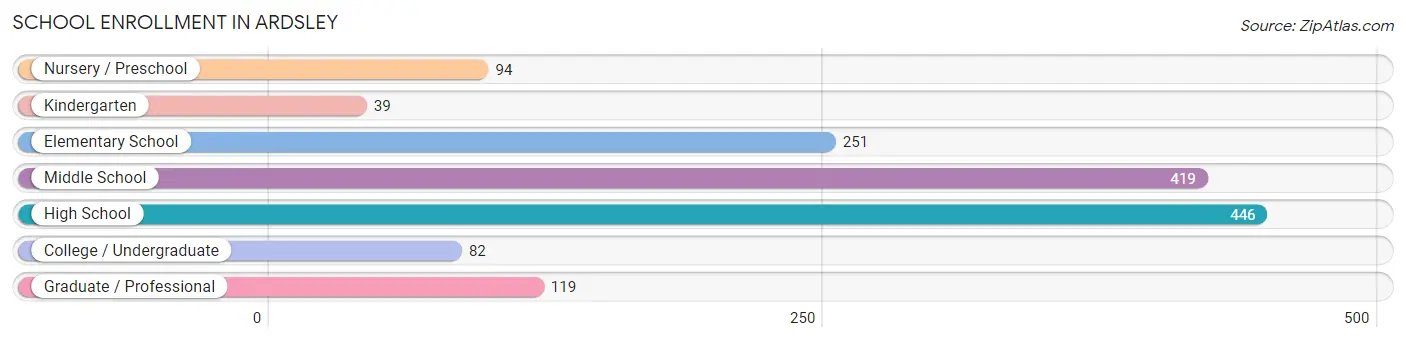
| School Level | # Students | % Students |
| Nursery / Preschool | 94 | 6.5% |
| Kindergarten | 39 | 2.7% |
| Elementary School | 251 | 17.3% |
| Middle School | 419 | 28.9% |
| High School | 446 | 30.8% |
| College / Undergraduate | 82 | 5.7% |
| Graduate / Professional | 119 | 8.2% |
| Total | 1,450 | 100.0% |
School Enrollment by Age by Funding Source in Ardsley
Out of a total of 1,450 students who are enrolled in schools in Ardsley, 352 (24.3%) attend a private institution, while the remaining 1,098 (75.7%) are enrolled in public schools. The age group of 20 to 24 year olds has the highest likelihood of being enrolled in private schools, with 55 (100.0% in the age bracket) enrolled. Conversely, the age group of 5 to 9 year old has the lowest likelihood of being enrolled in a private school, with 280 (100.0% in the age bracket) attending a public institution.
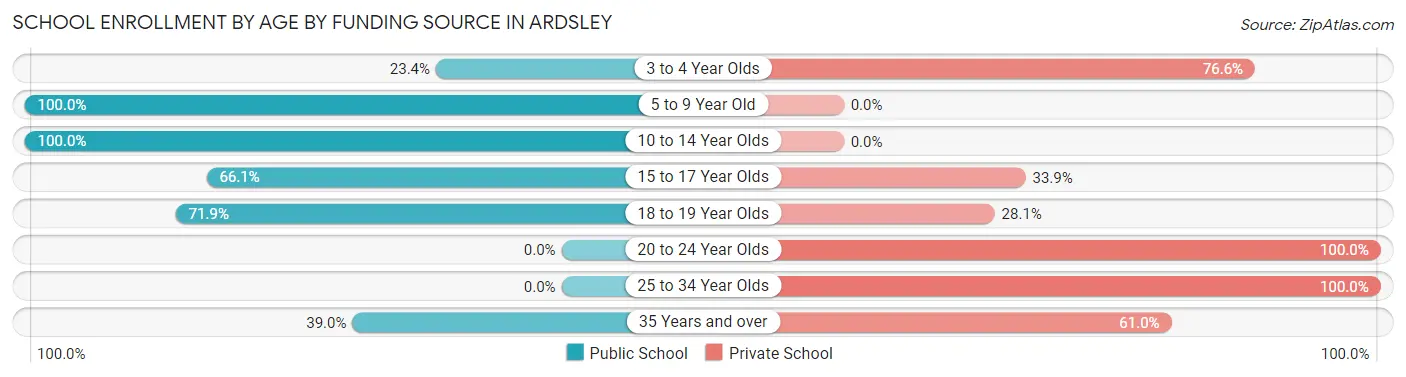
| Age Bracket | Public School | Private School |
| 3 to 4 Year Olds | 22 (23.4%) | 72 (76.6%) |
| 5 to 9 Year Old | 280 (100.0%) | 0 (0.0%) |
| 10 to 14 Year Olds | 494 (100.0%) | 0 (0.0%) |
| 15 to 17 Year Olds | 203 (66.1%) | 104 (33.9%) |
| 18 to 19 Year Olds | 69 (71.9%) | 27 (28.1%) |
| 20 to 24 Year Olds | 0 (0.0%) | 55 (100.0%) |
| 25 to 34 Year Olds | 0 (0.0%) | 47 (100.0%) |
| 35 Years and over | 30 (39.0%) | 47 (61.0%) |
| Total | 1,098 (75.7%) | 352 (24.3%) |
Educational Attainment by Field of Study in Ardsley
Business (432 | 15.0%), social sciences (425 | 14.7%), liberal arts & history (328 | 11.4%), education (311 | 10.8%), and psychology (240 | 8.3%) are the most common fields of study among 2,883 individuals in Ardsley who have obtained a bachelor's degree or higher.
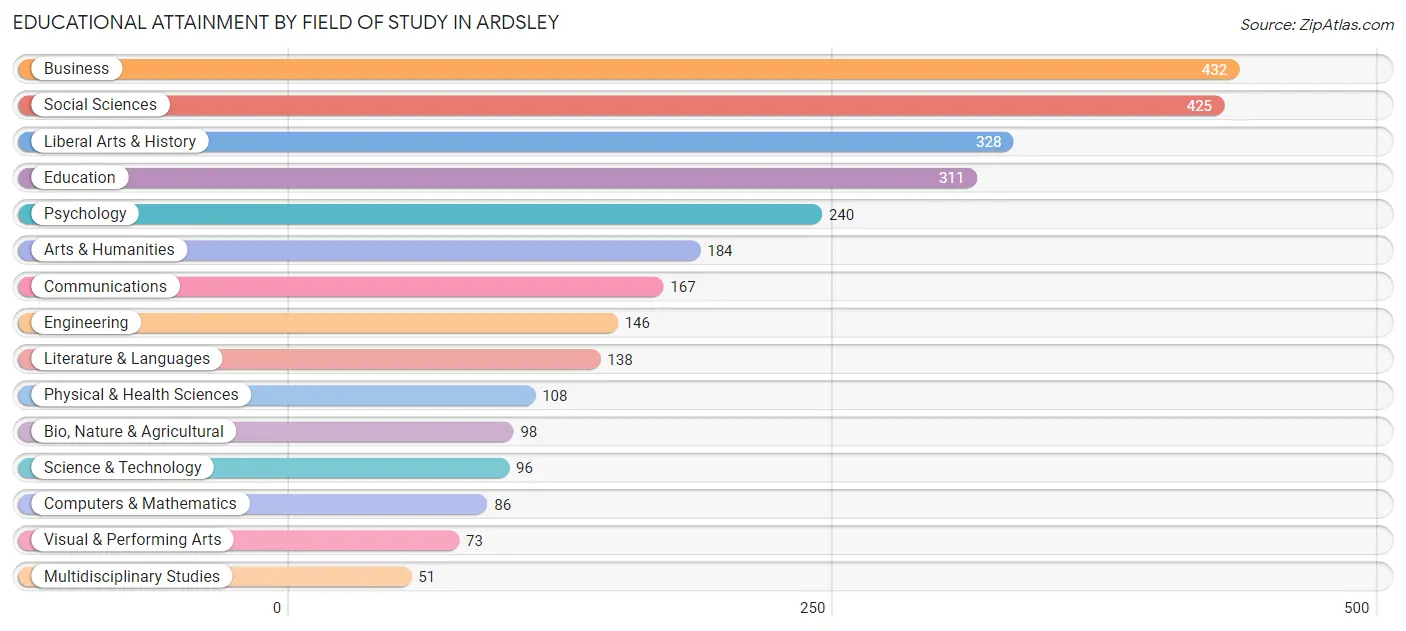
| Field of Study | # Graduates | % Graduates |
| Computers & Mathematics | 86 | 3.0% |
| Bio, Nature & Agricultural | 98 | 3.4% |
| Physical & Health Sciences | 108 | 3.7% |
| Psychology | 240 | 8.3% |
| Social Sciences | 425 | 14.7% |
| Engineering | 146 | 5.1% |
| Multidisciplinary Studies | 51 | 1.8% |
| Science & Technology | 96 | 3.3% |
| Business | 432 | 15.0% |
| Education | 311 | 10.8% |
| Literature & Languages | 138 | 4.8% |
| Liberal Arts & History | 328 | 11.4% |
| Visual & Performing Arts | 73 | 2.5% |
| Communications | 167 | 5.8% |
| Arts & Humanities | 184 | 6.4% |
| Total | 2,883 | 100.0% |
Transportation & Commute in Ardsley
Vehicle Availability by Sex in Ardsley
The most prevalent vehicle ownership categories in Ardsley are males with 2 vehicles (745, accounting for 60.4%) and females with 2 vehicles (575, making up 72.4%).
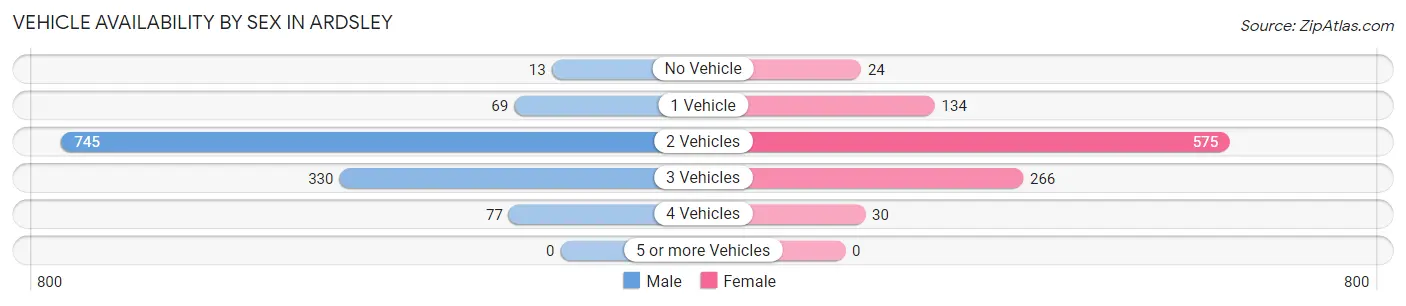
| Vehicles Available | Male | Female |
| No Vehicle | 13 (1.1%) | 24 (2.3%) |
| 1 Vehicle | 69 (5.6%) | 134 (13.0%) |
| 2 Vehicles | 745 (60.4%) | 575 (55.9%) |
| 3 Vehicles | 330 (26.7%) | 266 (25.9%) |
| 4 Vehicles | 77 (6.2%) | 30 (2.9%) |
| 5 or more Vehicles | 0 (0.0%) | 0 (0.0%) |
| Total | 1,234 (100.0%) | 1,029 (100.0%) |
Commute Time in Ardsley
The most frequently occuring commute durations in Ardsley are 15 to 19 minutes (406 commuters, 23.6%), 60 to 89 minutes (230 commuters, 13.4%), and 20 to 24 minutes (197 commuters, 11.5%).
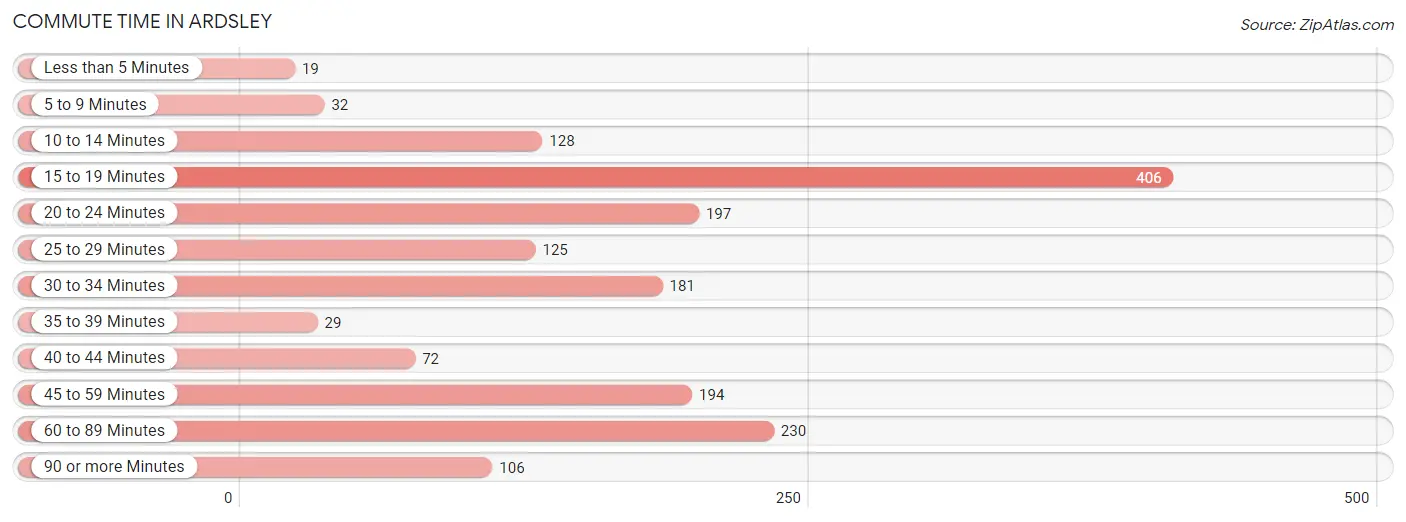
| Commute Time | # Commuters | % Commuters |
| Less than 5 Minutes | 19 | 1.1% |
| 5 to 9 Minutes | 32 | 1.9% |
| 10 to 14 Minutes | 128 | 7.4% |
| 15 to 19 Minutes | 406 | 23.6% |
| 20 to 24 Minutes | 197 | 11.5% |
| 25 to 29 Minutes | 125 | 7.3% |
| 30 to 34 Minutes | 181 | 10.5% |
| 35 to 39 Minutes | 29 | 1.7% |
| 40 to 44 Minutes | 72 | 4.2% |
| 45 to 59 Minutes | 194 | 11.3% |
| 60 to 89 Minutes | 230 | 13.4% |
| 90 or more Minutes | 106 | 6.2% |
Commute Time by Sex in Ardsley
The most common commute times in Ardsley are 15 to 19 minutes (191 commuters, 19.7%) for males and 15 to 19 minutes (215 commuters, 28.7%) for females.
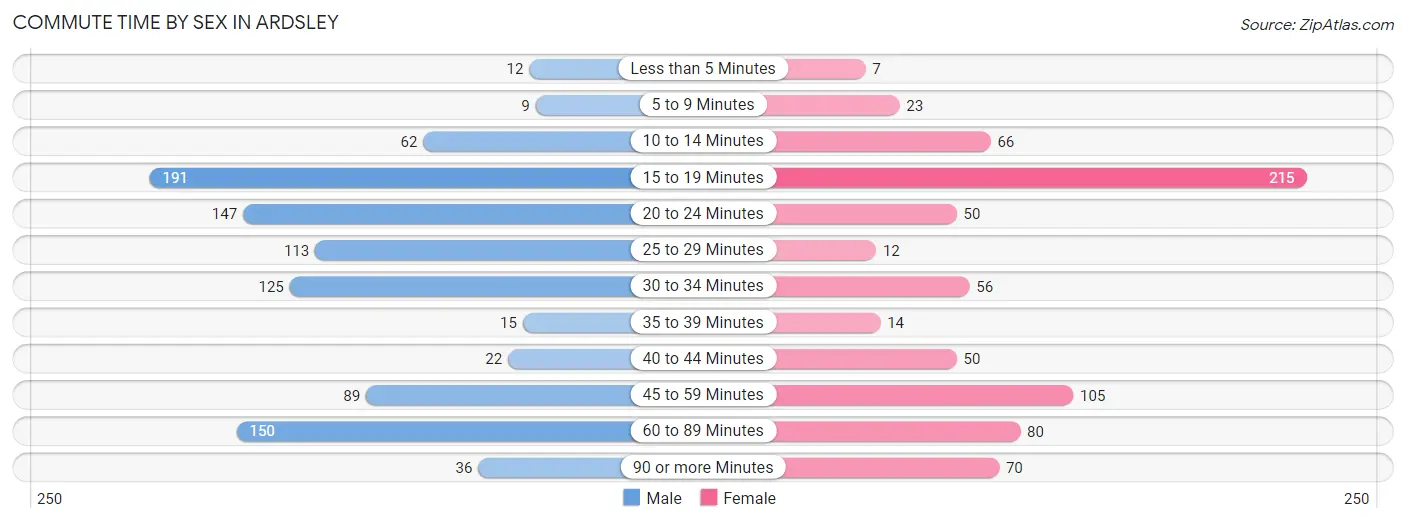
| Commute Time | Male | Female |
| Less than 5 Minutes | 12 (1.2%) | 7 (0.9%) |
| 5 to 9 Minutes | 9 (0.9%) | 23 (3.1%) |
| 10 to 14 Minutes | 62 (6.4%) | 66 (8.8%) |
| 15 to 19 Minutes | 191 (19.7%) | 215 (28.7%) |
| 20 to 24 Minutes | 147 (15.1%) | 50 (6.7%) |
| 25 to 29 Minutes | 113 (11.6%) | 12 (1.6%) |
| 30 to 34 Minutes | 125 (12.9%) | 56 (7.5%) |
| 35 to 39 Minutes | 15 (1.5%) | 14 (1.9%) |
| 40 to 44 Minutes | 22 (2.3%) | 50 (6.7%) |
| 45 to 59 Minutes | 89 (9.2%) | 105 (14.0%) |
| 60 to 89 Minutes | 150 (15.4%) | 80 (10.7%) |
| 90 or more Minutes | 36 (3.7%) | 70 (9.4%) |
Time of Departure to Work by Sex in Ardsley
The most frequent times of departure to work in Ardsley are 8:00 AM to 8:29 AM (191, 19.7%) for males and 8:00 AM to 8:29 AM (186, 24.9%) for females.
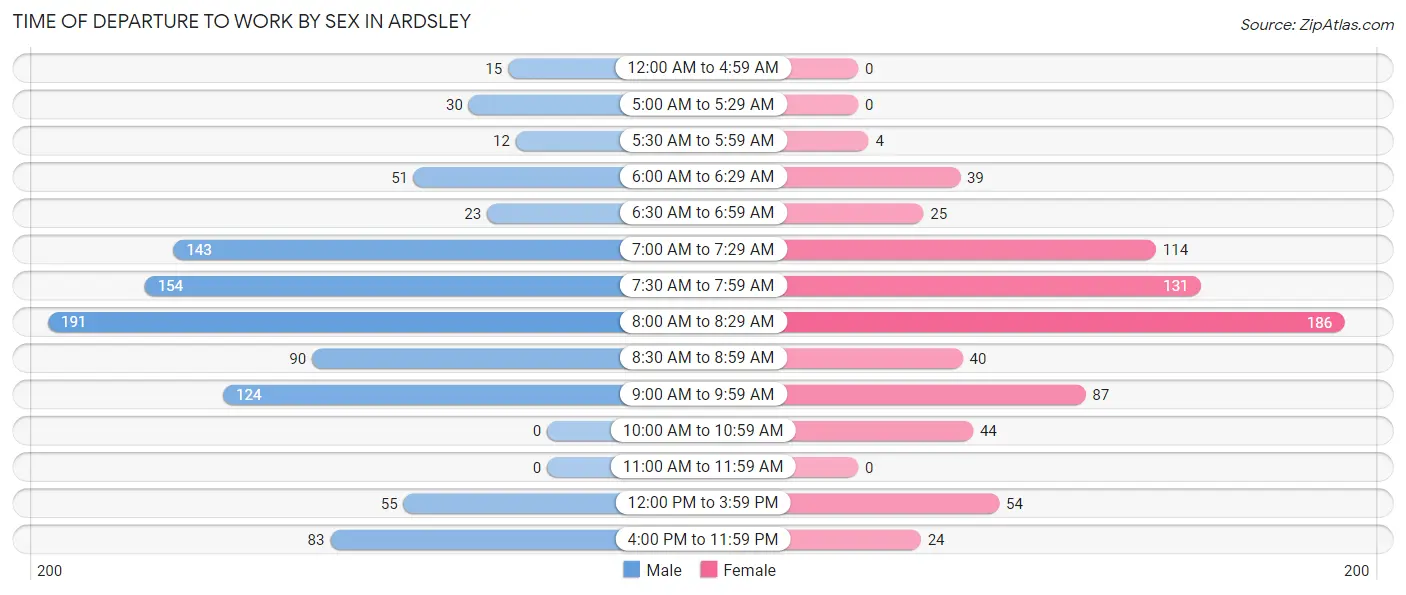
| Time of Departure | Male | Female |
| 12:00 AM to 4:59 AM | 15 (1.5%) | 0 (0.0%) |
| 5:00 AM to 5:29 AM | 30 (3.1%) | 0 (0.0%) |
| 5:30 AM to 5:59 AM | 12 (1.2%) | 4 (0.5%) |
| 6:00 AM to 6:29 AM | 51 (5.2%) | 39 (5.2%) |
| 6:30 AM to 6:59 AM | 23 (2.4%) | 25 (3.3%) |
| 7:00 AM to 7:29 AM | 143 (14.7%) | 114 (15.2%) |
| 7:30 AM to 7:59 AM | 154 (15.9%) | 131 (17.5%) |
| 8:00 AM to 8:29 AM | 191 (19.7%) | 186 (24.9%) |
| 8:30 AM to 8:59 AM | 90 (9.3%) | 40 (5.3%) |
| 9:00 AM to 9:59 AM | 124 (12.8%) | 87 (11.6%) |
| 10:00 AM to 10:59 AM | 0 (0.0%) | 44 (5.9%) |
| 11:00 AM to 11:59 AM | 0 (0.0%) | 0 (0.0%) |
| 12:00 PM to 3:59 PM | 55 (5.7%) | 54 (7.2%) |
| 4:00 PM to 11:59 PM | 83 (8.6%) | 24 (3.2%) |
| Total | 971 (100.0%) | 748 (100.0%) |
Housing Occupancy in Ardsley
Occupancy by Ownership in Ardsley
Of the total 1,679 dwellings in Ardsley, owner-occupied units account for 1,349 (80.3%), while renter-occupied units make up 330 (19.7%).
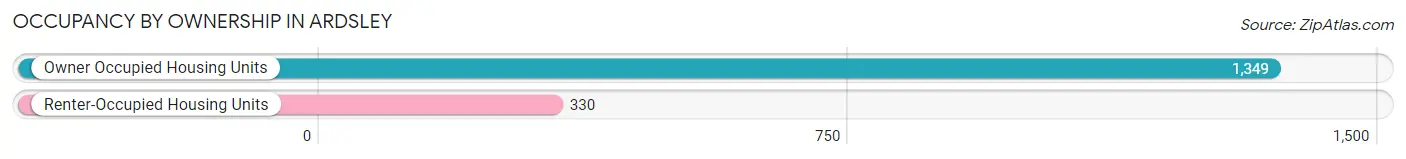
| Occupancy | # Housing Units | % Housing Units |
| Owner Occupied Housing Units | 1,349 | 80.3% |
| Renter-Occupied Housing Units | 330 | 19.7% |
| Total Occupied Housing Units | 1,679 | 100.0% |
Occupancy by Household Size in Ardsley
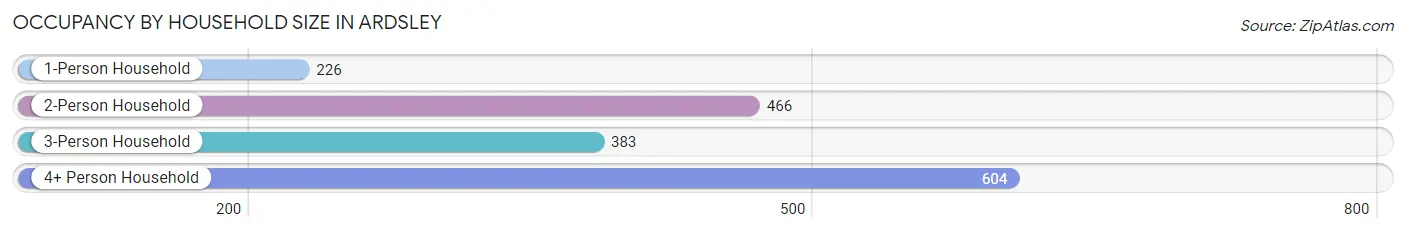
| Household Size | # Housing Units | % Housing Units |
| 1-Person Household | 226 | 13.5% |
| 2-Person Household | 466 | 27.8% |
| 3-Person Household | 383 | 22.8% |
| 4+ Person Household | 604 | 36.0% |
| Total Housing Units | 1,679 | 100.0% |
Occupancy by Ownership by Household Size in Ardsley
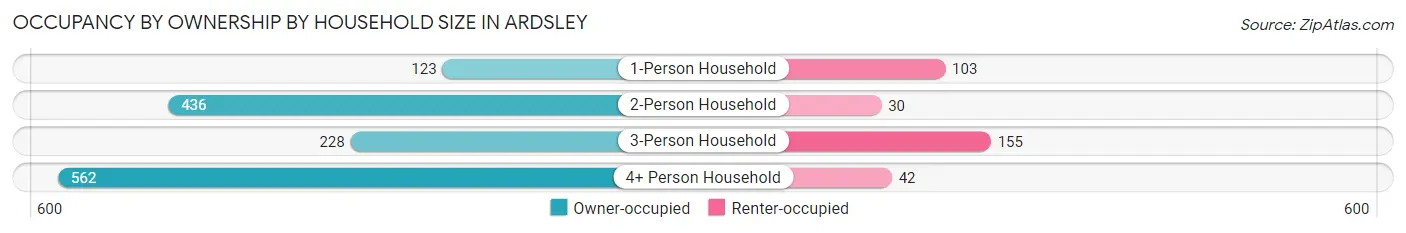
| Household Size | Owner-occupied | Renter-occupied |
| 1-Person Household | 123 (54.4%) | 103 (45.6%) |
| 2-Person Household | 436 (93.6%) | 30 (6.4%) |
| 3-Person Household | 228 (59.5%) | 155 (40.5%) |
| 4+ Person Household | 562 (93.0%) | 42 (7.0%) |
| Total Housing Units | 1,349 (80.3%) | 330 (19.7%) |
Occupancy by Educational Attainment in Ardsley
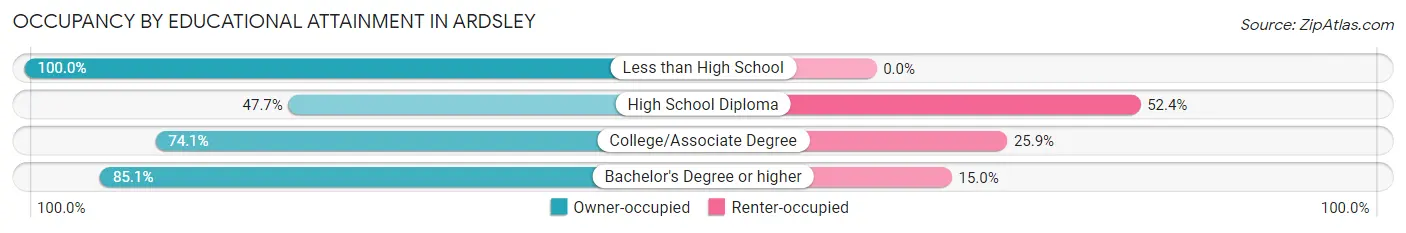
| Household Size | Owner-occupied | Renter-occupied |
| Less than High School | 16 (100.0%) | 0 (0.0%) |
| High School Diploma | 81 (47.6%) | 89 (52.3%) |
| College/Associate Degree | 120 (74.1%) | 42 (25.9%) |
| Bachelor's Degree or higher | 1,132 (85.1%) | 199 (14.9%) |
Occupancy by Age of Householder in Ardsley
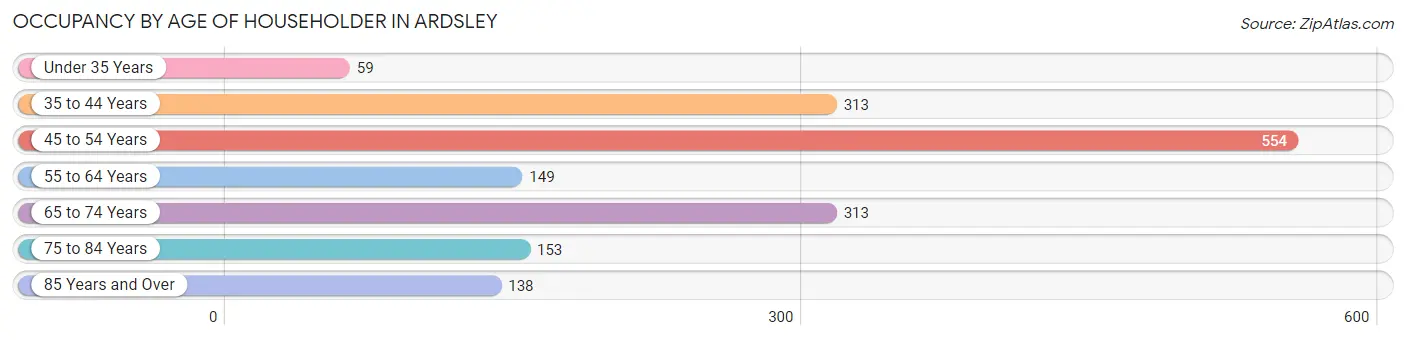
| Age Bracket | # Households | % Households |
| Under 35 Years | 59 | 3.5% |
| 35 to 44 Years | 313 | 18.6% |
| 45 to 54 Years | 554 | 33.0% |
| 55 to 64 Years | 149 | 8.9% |
| 65 to 74 Years | 313 | 18.6% |
| 75 to 84 Years | 153 | 9.1% |
| 85 Years and Over | 138 | 8.2% |
| Total | 1,679 | 100.0% |
Housing Finances in Ardsley
Median Income by Occupancy in Ardsley
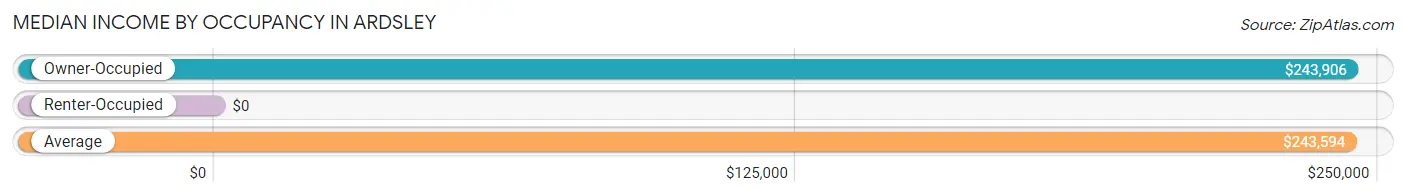
| Occupancy Type | # Households | Median Income |
| Owner-Occupied | 1,349 (80.3%) | $243,906 |
| Renter-Occupied | 330 (19.7%) | $0 |
| Average | 1,679 (100.0%) | $243,594 |
Occupancy by Householder Income Bracket in Ardsley
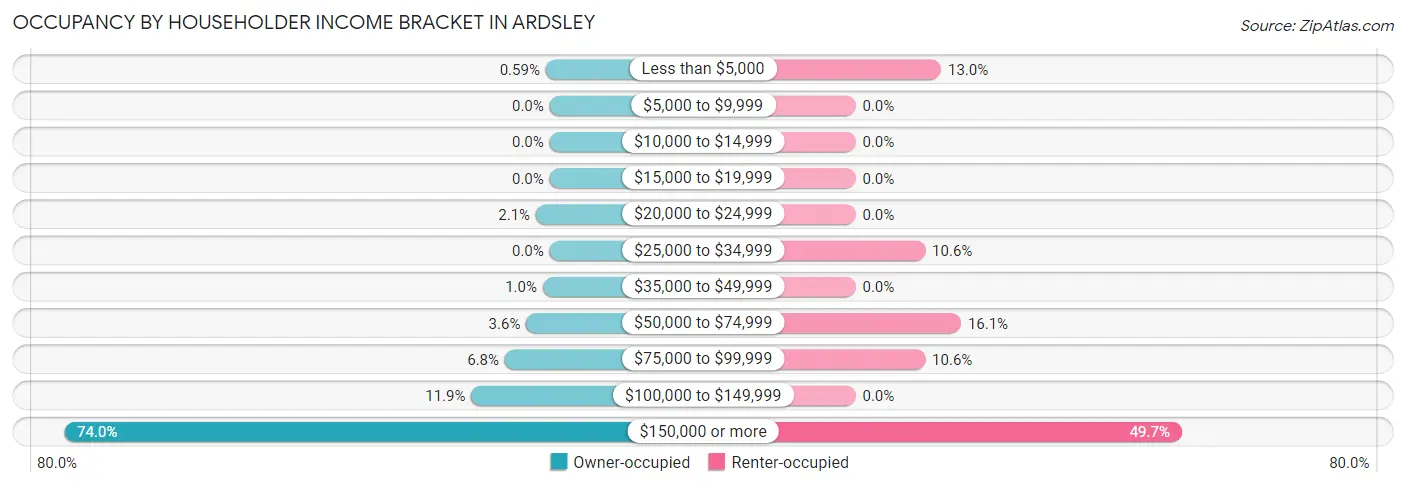
| Income Bracket | Owner-occupied | Renter-occupied |
| Less than $5,000 | 8 (0.6%) | 43 (13.0%) |
| $5,000 to $9,999 | 0 (0.0%) | 0 (0.0%) |
| $10,000 to $14,999 | 0 (0.0%) | 0 (0.0%) |
| $15,000 to $19,999 | 0 (0.0%) | 0 (0.0%) |
| $20,000 to $24,999 | 28 (2.1%) | 0 (0.0%) |
| $25,000 to $34,999 | 0 (0.0%) | 35 (10.6%) |
| $35,000 to $49,999 | 14 (1.0%) | 0 (0.0%) |
| $50,000 to $74,999 | 48 (3.6%) | 53 (16.1%) |
| $75,000 to $99,999 | 92 (6.8%) | 35 (10.6%) |
| $100,000 to $149,999 | 161 (11.9%) | 0 (0.0%) |
| $150,000 or more | 998 (74.0%) | 164 (49.7%) |
| Total | 1,349 (100.0%) | 330 (100.0%) |
Monthly Housing Cost Tiers in Ardsley
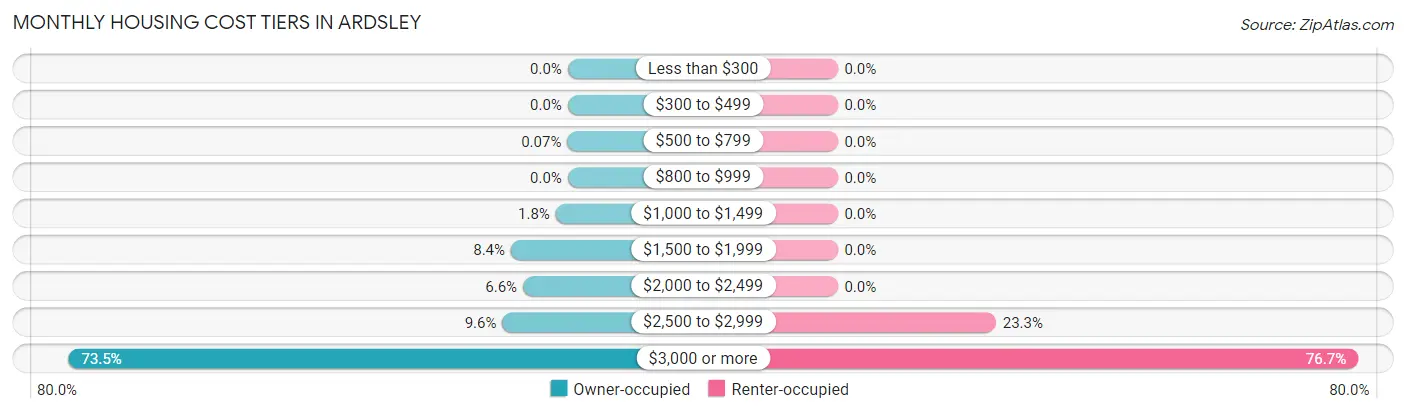
| Monthly Cost | Owner-occupied | Renter-occupied |
| Less than $300 | 0 (0.0%) | 0 (0.0%) |
| $300 to $499 | 0 (0.0%) | 0 (0.0%) |
| $500 to $799 | 1 (0.1%) | 0 (0.0%) |
| $800 to $999 | 0 (0.0%) | 0 (0.0%) |
| $1,000 to $1,499 | 24 (1.8%) | 0 (0.0%) |
| $1,500 to $1,999 | 113 (8.4%) | 0 (0.0%) |
| $2,000 to $2,499 | 89 (6.6%) | 0 (0.0%) |
| $2,500 to $2,999 | 130 (9.6%) | 77 (23.3%) |
| $3,000 or more | 992 (73.5%) | 253 (76.7%) |
| Total | 1,349 (100.0%) | 330 (100.0%) |
Physical Housing Characteristics in Ardsley
Housing Structures in Ardsley
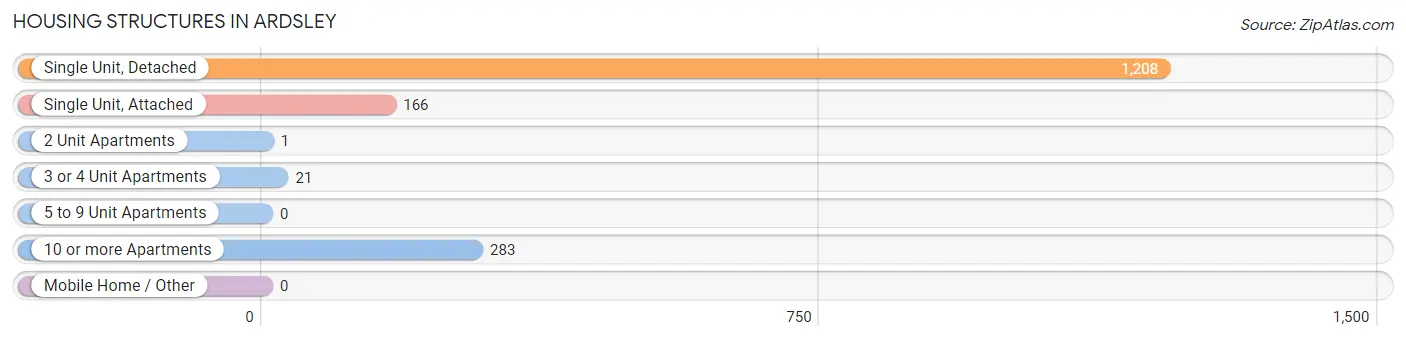
| Structure Type | # Housing Units | % Housing Units |
| Single Unit, Detached | 1,208 | 72.0% |
| Single Unit, Attached | 166 | 9.9% |
| 2 Unit Apartments | 1 | 0.1% |
| 3 or 4 Unit Apartments | 21 | 1.3% |
| 5 to 9 Unit Apartments | 0 | 0.0% |
| 10 or more Apartments | 283 | 16.9% |
| Mobile Home / Other | 0 | 0.0% |
| Total | 1,679 | 100.0% |
Housing Structures by Occupancy in Ardsley
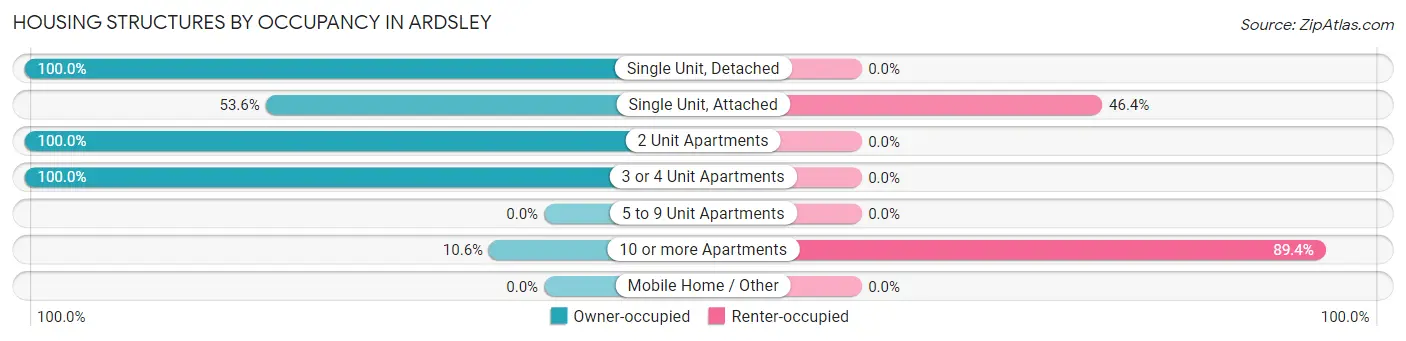
| Structure Type | Owner-occupied | Renter-occupied |
| Single Unit, Detached | 1,208 (100.0%) | 0 (0.0%) |
| Single Unit, Attached | 89 (53.6%) | 77 (46.4%) |
| 2 Unit Apartments | 1 (100.0%) | 0 (0.0%) |
| 3 or 4 Unit Apartments | 21 (100.0%) | 0 (0.0%) |
| 5 to 9 Unit Apartments | 0 (0.0%) | 0 (0.0%) |
| 10 or more Apartments | 30 (10.6%) | 253 (89.4%) |
| Mobile Home / Other | 0 (0.0%) | 0 (0.0%) |
| Total | 1,349 (80.3%) | 330 (19.7%) |
Housing Structures by Number of Rooms in Ardsley
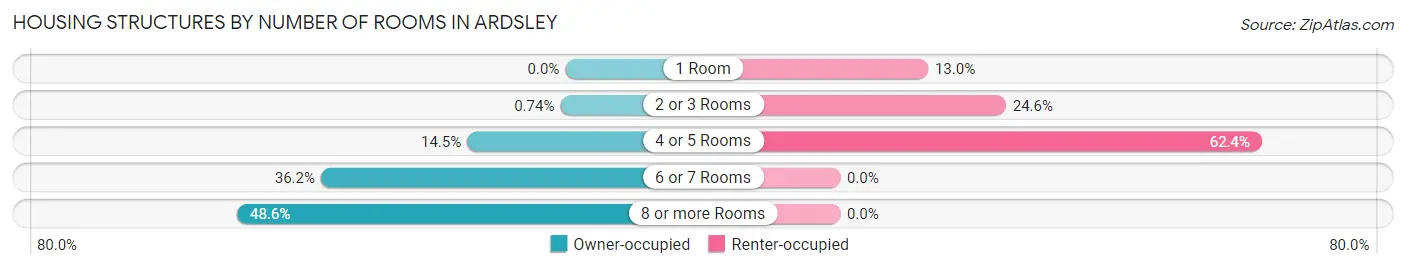
| Number of Rooms | Owner-occupied | Renter-occupied |
| 1 Room | 0 (0.0%) | 43 (13.0%) |
| 2 or 3 Rooms | 10 (0.7%) | 81 (24.5%) |
| 4 or 5 Rooms | 196 (14.5%) | 206 (62.4%) |
| 6 or 7 Rooms | 488 (36.2%) | 0 (0.0%) |
| 8 or more Rooms | 655 (48.5%) | 0 (0.0%) |
| Total | 1,349 (100.0%) | 330 (100.0%) |
Housing Structure by Heating Type in Ardsley
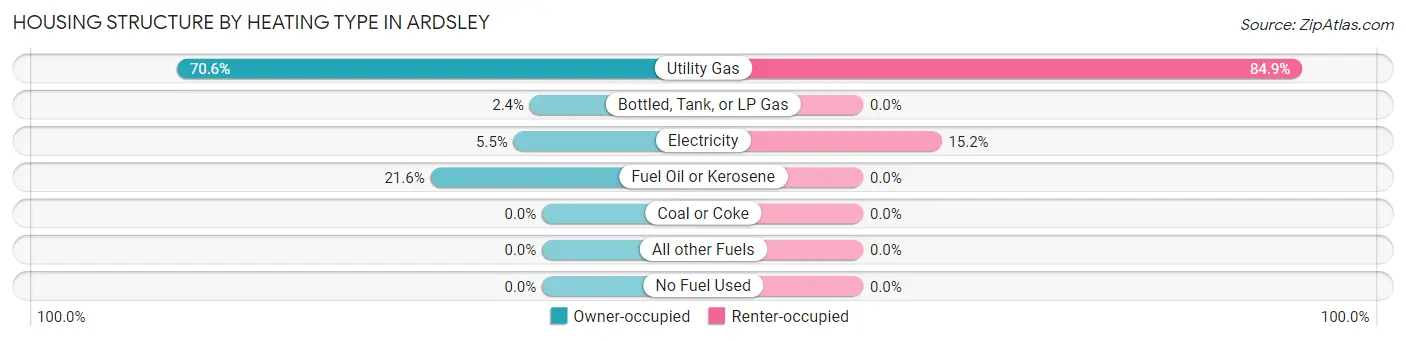
| Heating Type | Owner-occupied | Renter-occupied |
| Utility Gas | 952 (70.6%) | 280 (84.9%) |
| Bottled, Tank, or LP Gas | 32 (2.4%) | 0 (0.0%) |
| Electricity | 74 (5.5%) | 50 (15.1%) |
| Fuel Oil or Kerosene | 291 (21.6%) | 0 (0.0%) |
| Coal or Coke | 0 (0.0%) | 0 (0.0%) |
| All other Fuels | 0 (0.0%) | 0 (0.0%) |
| No Fuel Used | 0 (0.0%) | 0 (0.0%) |
| Total | 1,349 (100.0%) | 330 (100.0%) |
Household Vehicle Usage in Ardsley
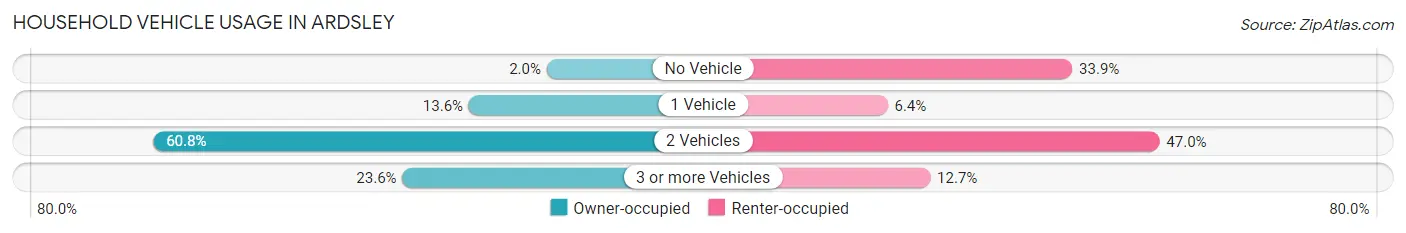
| Vehicles per Household | Owner-occupied | Renter-occupied |
| No Vehicle | 27 (2.0%) | 112 (33.9%) |
| 1 Vehicle | 184 (13.6%) | 21 (6.4%) |
| 2 Vehicles | 820 (60.8%) | 155 (47.0%) |
| 3 or more Vehicles | 318 (23.6%) | 42 (12.7%) |
| Total | 1,349 (100.0%) | 330 (100.0%) |
Real Estate & Mortgages in Ardsley
Real Estate and Mortgage Overview in Ardsley
| Characteristic | Without Mortgage | With Mortgage |
| Housing Units | 407 | 942 |
| Median Property Value | $704,100 | $836,100 |
| Median Household Income | $150,521 | $792 |
| Monthly Housing Costs | $1,501 | $873 |
| Real Estate Taxes | $10,001 | $1 |
Property Value by Mortgage Status in Ardsley
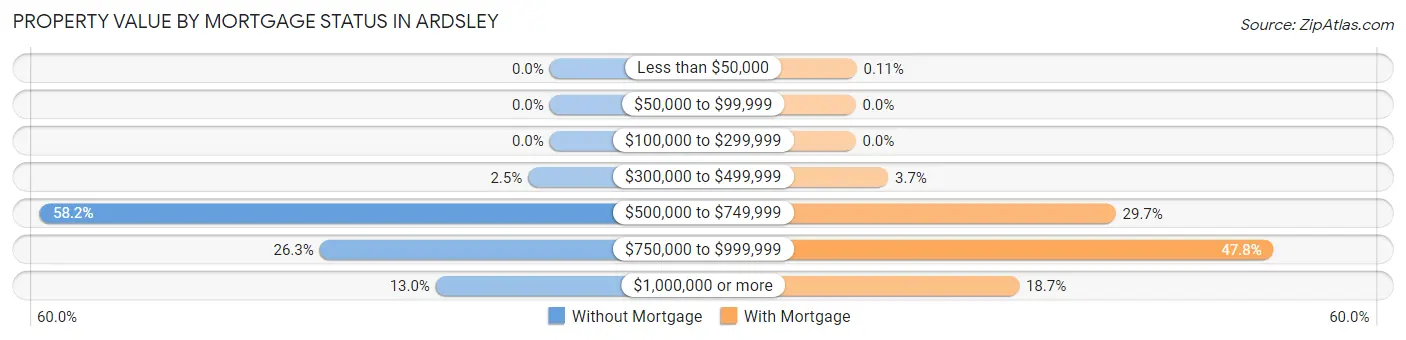
| Property Value | Without Mortgage | With Mortgage |
| Less than $50,000 | 0 (0.0%) | 1 (0.1%) |
| $50,000 to $99,999 | 0 (0.0%) | 0 (0.0%) |
| $100,000 to $299,999 | 0 (0.0%) | 0 (0.0%) |
| $300,000 to $499,999 | 10 (2.5%) | 35 (3.7%) |
| $500,000 to $749,999 | 237 (58.2%) | 280 (29.7%) |
| $750,000 to $999,999 | 107 (26.3%) | 450 (47.8%) |
| $1,000,000 or more | 53 (13.0%) | 176 (18.7%) |
| Total | 407 (100.0%) | 942 (100.0%) |
Household Income by Mortgage Status in Ardsley
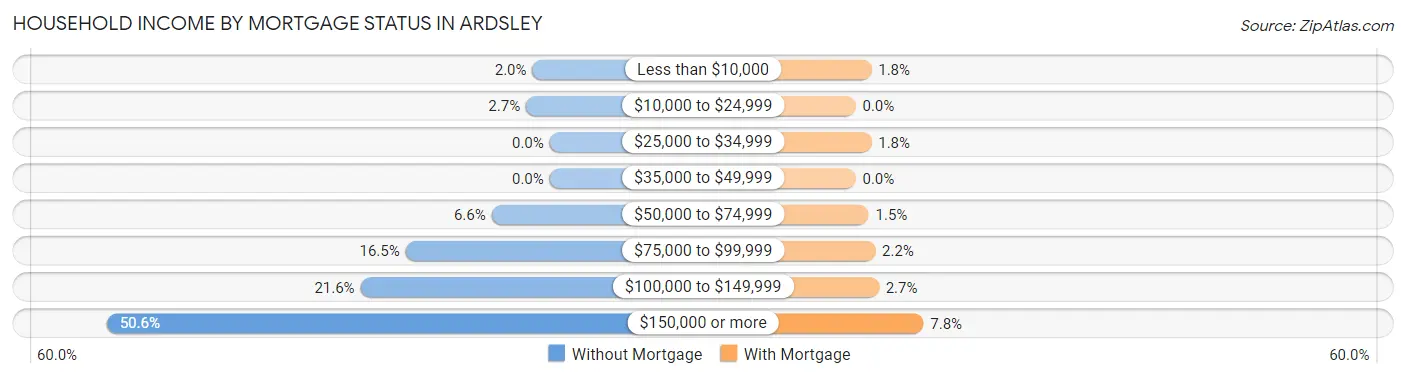
| Household Income | Without Mortgage | With Mortgage |
| Less than $10,000 | 8 (2.0%) | 17 (1.8%) |
| $10,000 to $24,999 | 11 (2.7%) | 0 (0.0%) |
| $25,000 to $34,999 | 0 (0.0%) | 17 (1.8%) |
| $35,000 to $49,999 | 0 (0.0%) | 0 (0.0%) |
| $50,000 to $74,999 | 27 (6.6%) | 14 (1.5%) |
| $75,000 to $99,999 | 67 (16.5%) | 21 (2.2%) |
| $100,000 to $149,999 | 88 (21.6%) | 25 (2.6%) |
| $150,000 or more | 206 (50.6%) | 73 (7.7%) |
| Total | 407 (100.0%) | 942 (100.0%) |
Property Value to Household Income Ratio in Ardsley
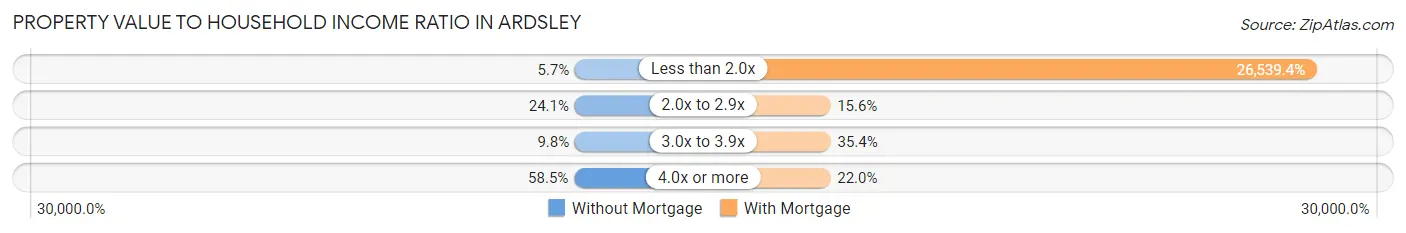
| Value-to-Income Ratio | Without Mortgage | With Mortgage |
| Less than 2.0x | 23 (5.7%) | 250,001 (26,539.4%) |
| 2.0x to 2.9x | 98 (24.1%) | 147 (15.6%) |
| 3.0x to 3.9x | 40 (9.8%) | 333 (35.3%) |
| 4.0x or more | 238 (58.5%) | 207 (22.0%) |
| Total | 407 (100.0%) | 942 (100.0%) |
Real Estate Taxes by Mortgage Status in Ardsley
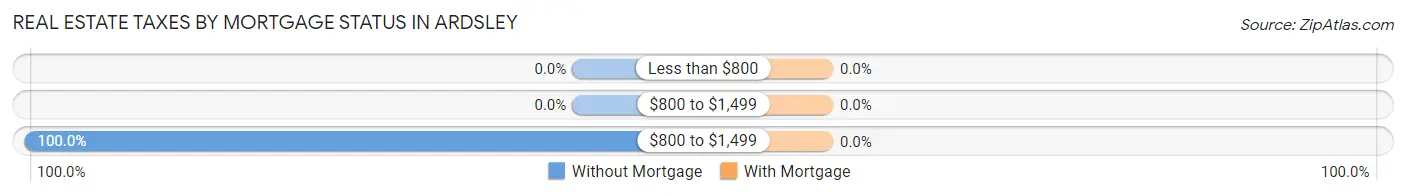
| Property Taxes | Without Mortgage | With Mortgage |
| Less than $800 | 0 (0.0%) | 0 (0.0%) |
| $800 to $1,499 | 0 (0.0%) | 0 (0.0%) |
| $800 to $1,499 | 407 (100.0%) | 0 (0.0%) |
| Total | 407 (100.0%) | 942 (100.0%) |
Health & Disability in Ardsley
Health Insurance Coverage by Age in Ardsley
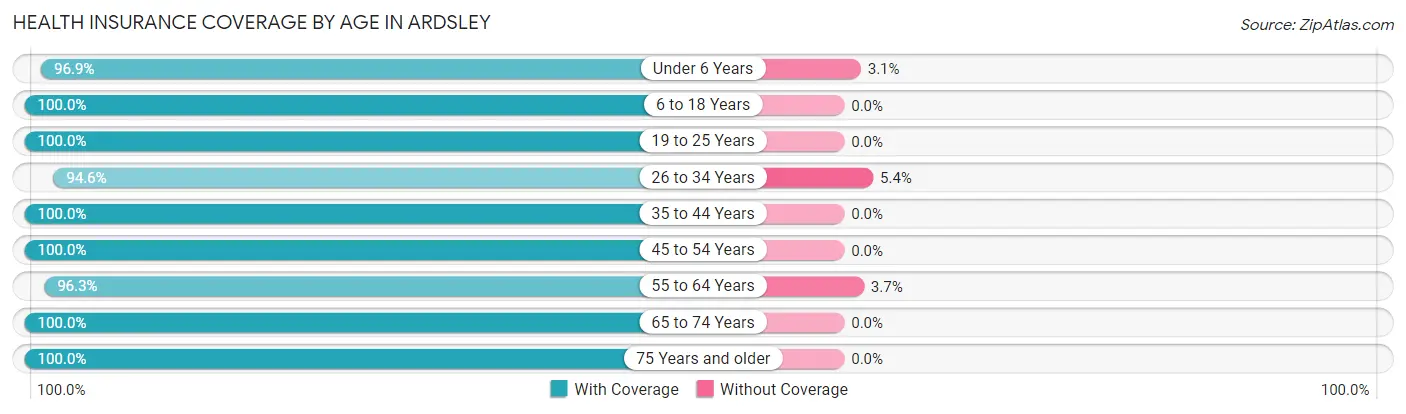
| Age Bracket | With Coverage | Without Coverage |
| Under 6 Years | 283 (96.9%) | 9 (3.1%) |
| 6 to 18 Years | 1,130 (100.0%) | 0 (0.0%) |
| 19 to 25 Years | 206 (100.0%) | 0 (0.0%) |
| 26 to 34 Years | 282 (94.6%) | 16 (5.4%) |
| 35 to 44 Years | 657 (100.0%) | 0 (0.0%) |
| 45 to 54 Years | 1,012 (100.0%) | 0 (0.0%) |
| 55 to 64 Years | 369 (96.3%) | 14 (3.7%) |
| 65 to 74 Years | 596 (100.0%) | 0 (0.0%) |
| 75 Years and older | 424 (100.0%) | 0 (0.0%) |
| Total | 4,959 (99.2%) | 39 (0.8%) |
Health Insurance Coverage by Citizenship Status in Ardsley
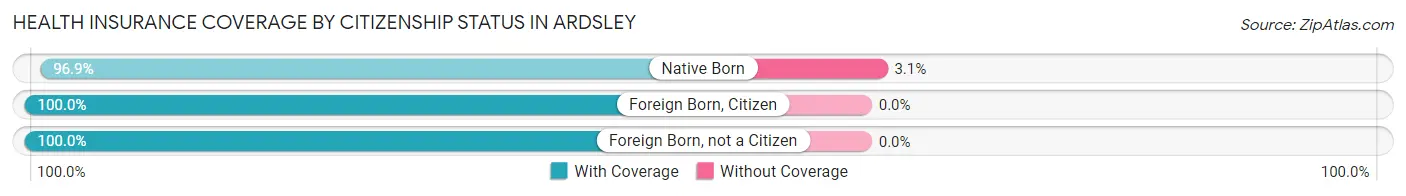
| Citizenship Status | With Coverage | Without Coverage |
| Native Born | 283 (96.9%) | 9 (3.1%) |
| Foreign Born, Citizen | 1,130 (100.0%) | 0 (0.0%) |
| Foreign Born, not a Citizen | 206 (100.0%) | 0 (0.0%) |
Health Insurance Coverage by Household Income in Ardsley
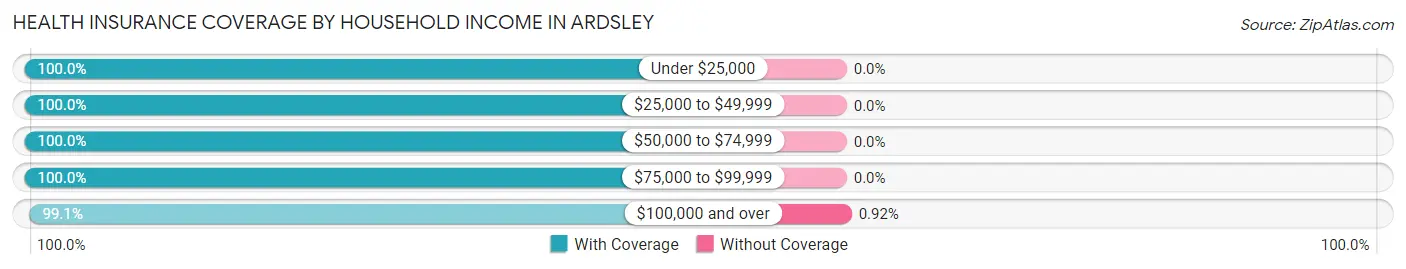
| Household Income | With Coverage | Without Coverage |
| Under $25,000 | 99 (100.0%) | 0 (0.0%) |
| $25,000 to $49,999 | 49 (100.0%) | 0 (0.0%) |
| $50,000 to $74,999 | 373 (100.0%) | 0 (0.0%) |
| $75,000 to $99,999 | 209 (100.0%) | 0 (0.0%) |
| $100,000 and over | 4,220 (99.1%) | 39 (0.9%) |
Public vs Private Health Insurance Coverage by Age in Ardsley
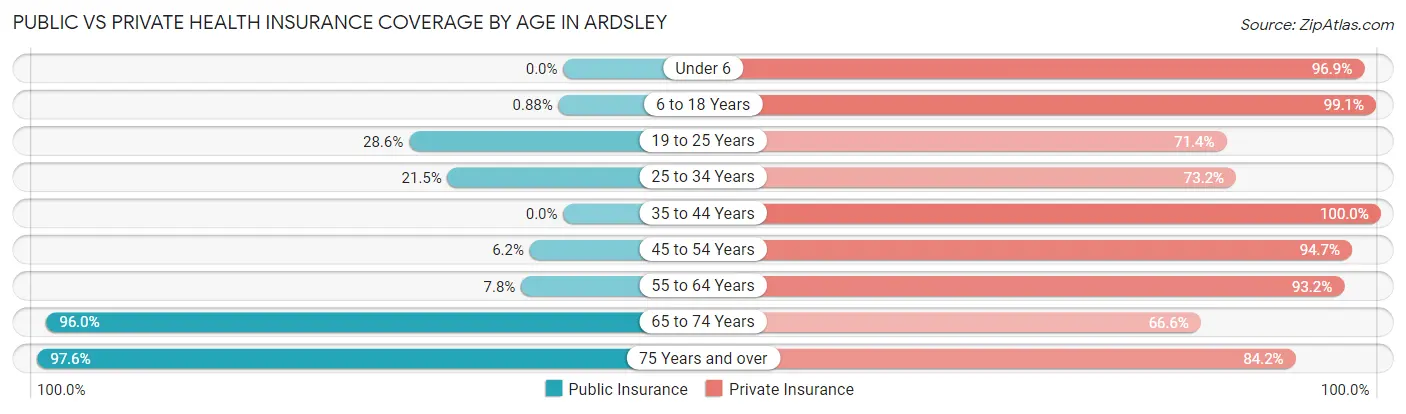
| Age Bracket | Public Insurance | Private Insurance |
| Under 6 | 0 (0.0%) | 283 (96.9%) |
| 6 to 18 Years | 10 (0.9%) | 1,120 (99.1%) |
| 19 to 25 Years | 59 (28.6%) | 147 (71.4%) |
| 25 to 34 Years | 64 (21.5%) | 218 (73.2%) |
| 35 to 44 Years | 0 (0.0%) | 657 (100.0%) |
| 45 to 54 Years | 63 (6.2%) | 958 (94.7%) |
| 55 to 64 Years | 30 (7.8%) | 357 (93.2%) |
| 65 to 74 Years | 572 (96.0%) | 397 (66.6%) |
| 75 Years and over | 414 (97.6%) | 357 (84.2%) |
| Total | 1,212 (24.2%) | 4,494 (89.9%) |
Disability Status by Sex by Age in Ardsley
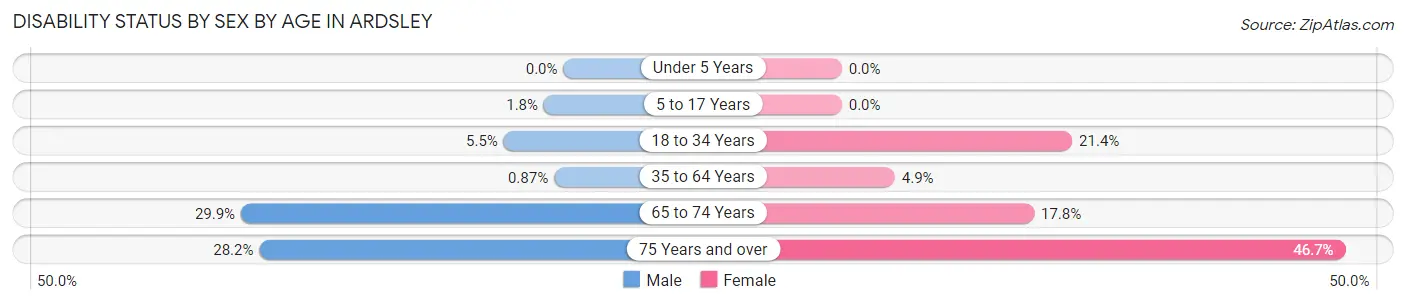
| Age Bracket | Male | Female |
| Under 5 Years | 0 (0.0%) | 0 (0.0%) |
| 5 to 17 Years | 10 (1.8%) | 0 (0.0%) |
| 18 to 34 Years | 17 (5.5%) | 59 (21.4%) |
| 35 to 64 Years | 9 (0.9%) | 50 (4.9%) |
| 65 to 74 Years | 76 (29.9%) | 61 (17.8%) |
| 75 Years and over | 46 (28.2%) | 122 (46.7%) |
Disability Class by Sex by Age in Ardsley
Disability Class: Hearing Difficulty
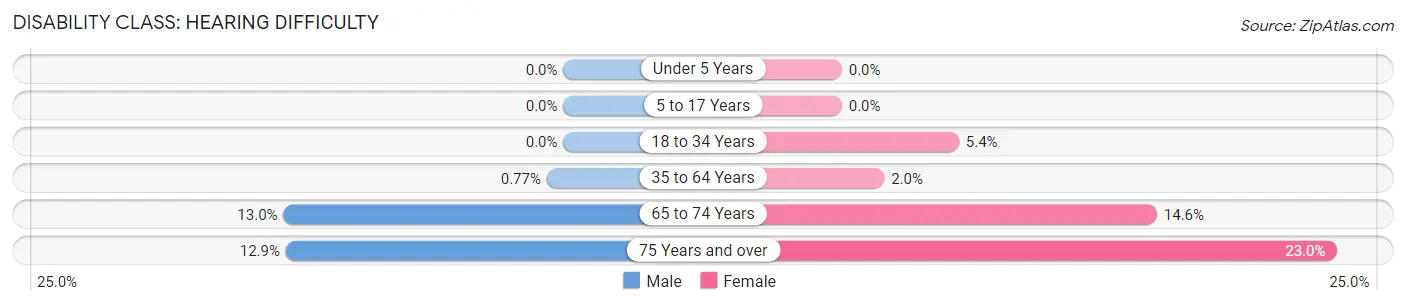
| Age Bracket | Male | Female |
| Under 5 Years | 0 (0.0%) | 0 (0.0%) |
| 5 to 17 Years | 0 (0.0%) | 0 (0.0%) |
| 18 to 34 Years | 0 (0.0%) | 15 (5.4%) |
| 35 to 64 Years | 8 (0.8%) | 20 (2.0%) |
| 65 to 74 Years | 33 (13.0%) | 50 (14.6%) |
| 75 Years and over | 21 (12.9%) | 60 (23.0%) |
Disability Class: Vision Difficulty
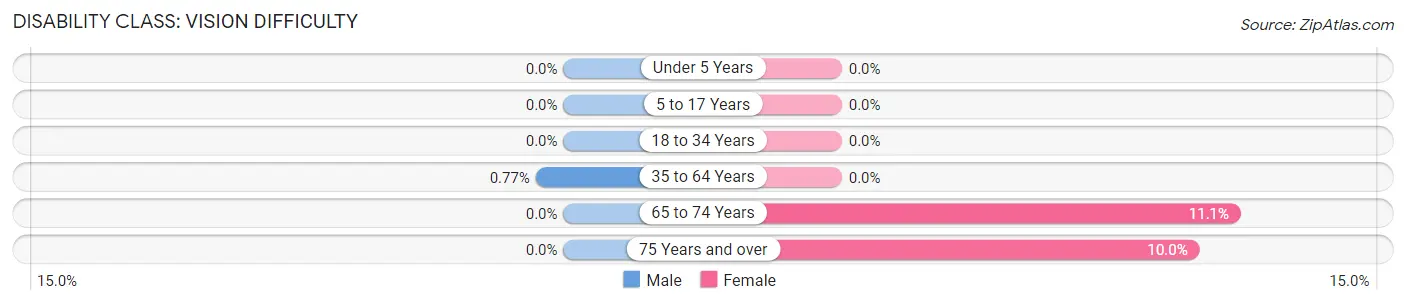
| Age Bracket | Male | Female |
| Under 5 Years | 0 (0.0%) | 0 (0.0%) |
| 5 to 17 Years | 0 (0.0%) | 0 (0.0%) |
| 18 to 34 Years | 0 (0.0%) | 0 (0.0%) |
| 35 to 64 Years | 8 (0.8%) | 0 (0.0%) |
| 65 to 74 Years | 0 (0.0%) | 38 (11.1%) |
| 75 Years and over | 0 (0.0%) | 26 (10.0%) |
Disability Class: Cognitive Difficulty
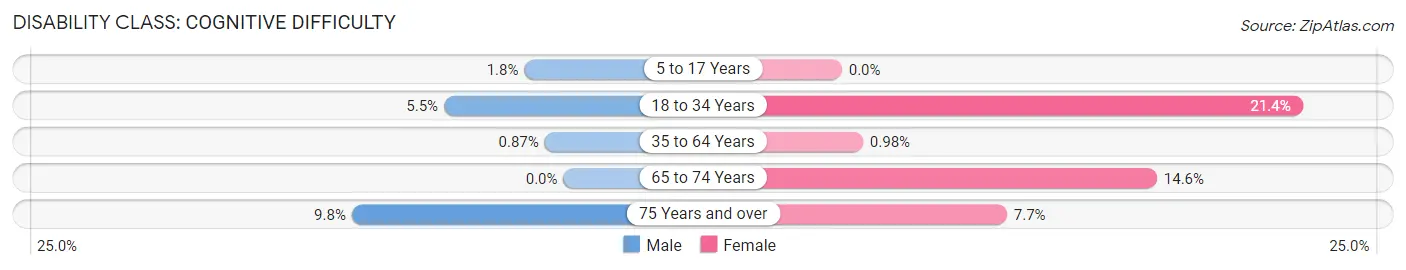
| Age Bracket | Male | Female |
| 5 to 17 Years | 10 (1.8%) | 0 (0.0%) |
| 18 to 34 Years | 17 (5.5%) | 59 (21.4%) |
| 35 to 64 Years | 9 (0.9%) | 10 (1.0%) |
| 65 to 74 Years | 0 (0.0%) | 50 (14.6%) |
| 75 Years and over | 16 (9.8%) | 20 (7.7%) |
Disability Class: Ambulatory Difficulty
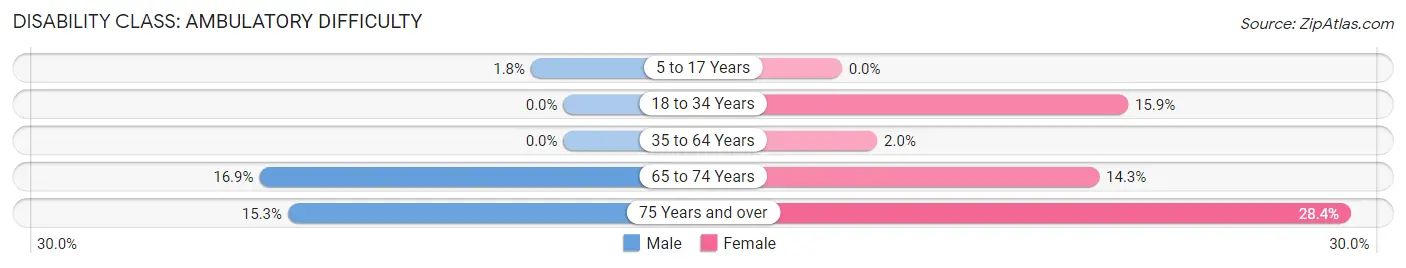
| Age Bracket | Male | Female |
| 5 to 17 Years | 10 (1.8%) | 0 (0.0%) |
| 18 to 34 Years | 0 (0.0%) | 44 (15.9%) |
| 35 to 64 Years | 0 (0.0%) | 20 (2.0%) |
| 65 to 74 Years | 43 (16.9%) | 49 (14.3%) |
| 75 Years and over | 25 (15.3%) | 74 (28.3%) |
Disability Class: Self-Care Difficulty
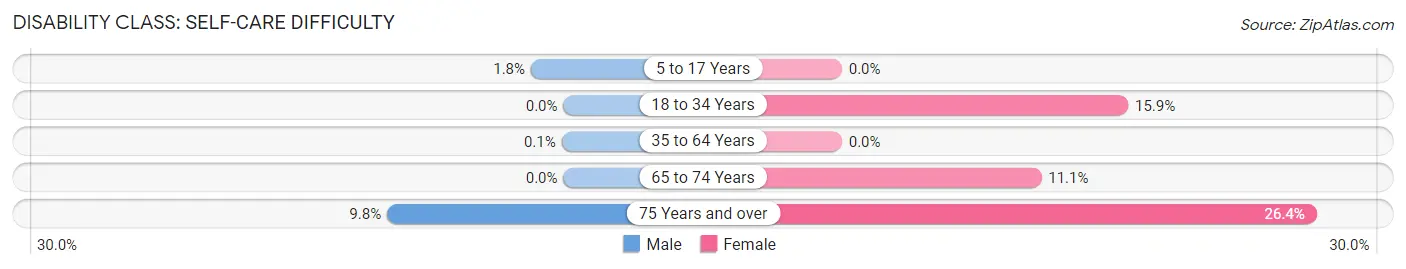
| Age Bracket | Male | Female |
| 5 to 17 Years | 10 (1.8%) | 0 (0.0%) |
| 18 to 34 Years | 0 (0.0%) | 44 (15.9%) |
| 35 to 64 Years | 1 (0.1%) | 0 (0.0%) |
| 65 to 74 Years | 0 (0.0%) | 38 (11.1%) |
| 75 Years and over | 16 (9.8%) | 69 (26.4%) |
Technology Access in Ardsley
Computing Device Access in Ardsley
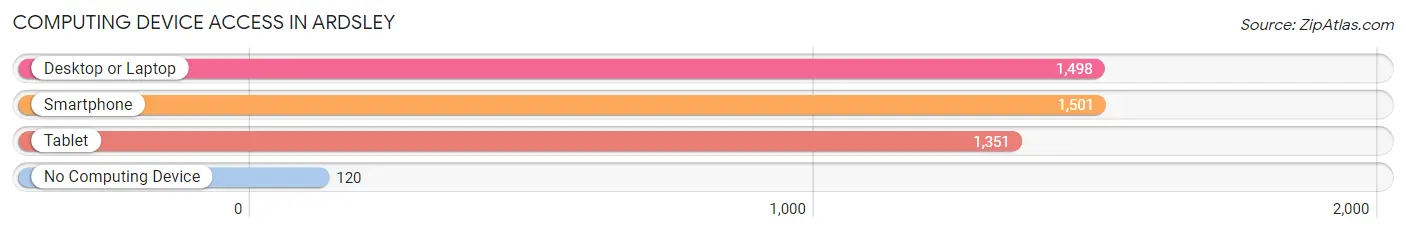
| Device Type | # Households | % Households |
| Desktop or Laptop | 1,498 | 89.2% |
| Smartphone | 1,501 | 89.4% |
| Tablet | 1,351 | 80.5% |
| No Computing Device | 120 | 7.1% |
| Total | 1,679 | 100.0% |
Internet Access in Ardsley
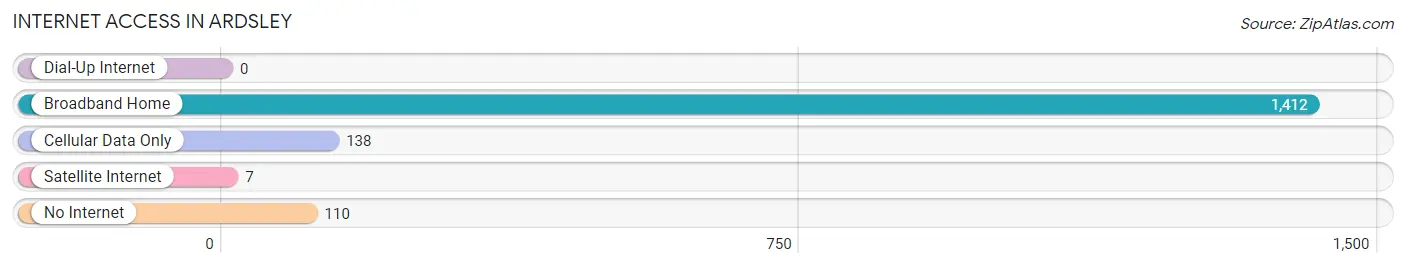
| Internet Type | # Households | % Households |
| Dial-Up Internet | 0 | 0.0% |
| Broadband Home | 1,412 | 84.1% |
| Cellular Data Only | 138 | 8.2% |
| Satellite Internet | 7 | 0.4% |
| No Internet | 110 | 6.6% |
| Total | 1,679 | 100.0% |
Ardsley Summary
Ardsley, NY is a village located in Westchester County, New York. It is situated on the banks of the Hudson River, about 25 miles north of New York City. The village has a population of 4,452 as of the 2010 census.
History
Ardsley was originally part of the land purchased by Adriaen van der Donck from the Native Americans in 1646. The land was then divided into two parts, the northern part being called "Arsdalen" and the southern part being called "Boswijck". The two parts were later combined to form the village of Ardsley.
The village was incorporated in 1872 and was named after the Ardsley family, who had been living in the area since the late 1700s. The Ardsleys were prominent landowners and farmers in the area.
Geography
Ardsley is located at 41°3'25" North, 73°50'25" West (41.056944, -73.840278). According to the United States Census Bureau, the village has a total area of 1.2 square miles, all of it land.
The village is bordered by the towns of Greenburgh to the north, Dobbs Ferry to the east, Irvington to the south, and Hastings-on-Hudson to the west.
Economy
Ardsley is primarily a residential community, with most of its residents commuting to New York City for work. The village is home to several small businesses, including restaurants, retail stores, and professional services.
The village is also home to the Ardsley Country Club, which is a private golf and country club. The club was founded in 1895 and is one of the oldest golf clubs in the United States.
Demographics
As of the 2010 census, there were 4,452 people, 1,717 households, and 1,220 families residing in the village. The population density was 3,717.2 people per square mile. The racial makeup of the village was 87.2% White, 4.2% African American, 0.2% Native American, 5.2% Asian, 0.1% Pacific Islander, 1.2% from other races, and 2.1% from two or more races. Hispanic or Latino of any race were 5.3% of the population.
There were 1,717 households, out of which 33.2% had children under the age of 18 living with them, 57.2% were married couples living together, 9.2% had a female householder with no husband present, and 30.2% were non-families. 24.7% of all households were made up of individuals, and 10.2% had someone living alone who was 65 years of age or older. The average household size was 2.60 and the average family size was 3.14.
In the village, the population was spread out, with 24.2% under the age of 18, 5.2% from 18 to 24, 28.2% from 25 to 44, 27.2% from 45 to 64, and 15.2% who were 65 years of age or older. The median age was 40 years. For every 100 females, there were 91.2 males. For every 100 females age 18 and over, there were 87.2 males.
The median income for a household in the village was $90,917, and the median income for a family was $106,917. Males had a median income of $76,250 versus $50,000 for females. The per capita income for the village was $45,917. About 2.2% of families and 3.2% of the population were below the poverty line, including 3.2% of those under age 18 and 4.2% of those age 65 or over.
Common Questions
What is Per Capita Income in Ardsley?
Per Capita income in Ardsley is $87,646.
What is the Median Family Income in Ardsley?
Median Family Income in Ardsley is $250,001.
What is the Median Household income in Ardsley?
Median Household Income in Ardsley is $243,594.
What is Income or Wage Gap in Ardsley?
Income or Wage Gap in Ardsley is 14.9%.
Women in Ardsley earn 85.1 cents for every dollar earned by a man.
What is Inequality or Gini Index in Ardsley?
Inequality or Gini Index in Ardsley is 0.38.
What is the Total Population of Ardsley?
Total Population of Ardsley is 5,013.
What is the Total Male Population of Ardsley?
Total Male Population of Ardsley is 2,427.
What is the Total Female Population of Ardsley?
Total Female Population of Ardsley is 2,586.
What is the Ratio of Males per 100 Females in Ardsley?
There are 93.85 Males per 100 Females in Ardsley.
What is the Ratio of Females per 100 Males in Ardsley?
There are 106.55 Females per 100 Males in Ardsley.
What is the Median Population Age in Ardsley?
Median Population Age in Ardsley is 43.0 Years.
What is the Average Family Size in Ardsley
Average Family Size in Ardsley is 3.3 People.
What is the Average Household Size in Ardsley
Average Household Size in Ardsley is 3.0 People.
How Large is the Labor Force in Ardsley?
There are 2,498 People in the Labor Forcein in Ardsley.
What is the Percentage of People in the Labor Force in Ardsley?
65.3% of People are in the Labor Force in Ardsley.
What is the Unemployment Rate in Ardsley?
Unemployment Rate in Ardsley is 8.7%.