Zip Codes with the Highest Percentage of Population Employed in Food Preparation & Serving in Burlington, VT
RELATED REPORTS & OPTIONS
Food Preparation & Serving
Burlington
Compare Zip Codes
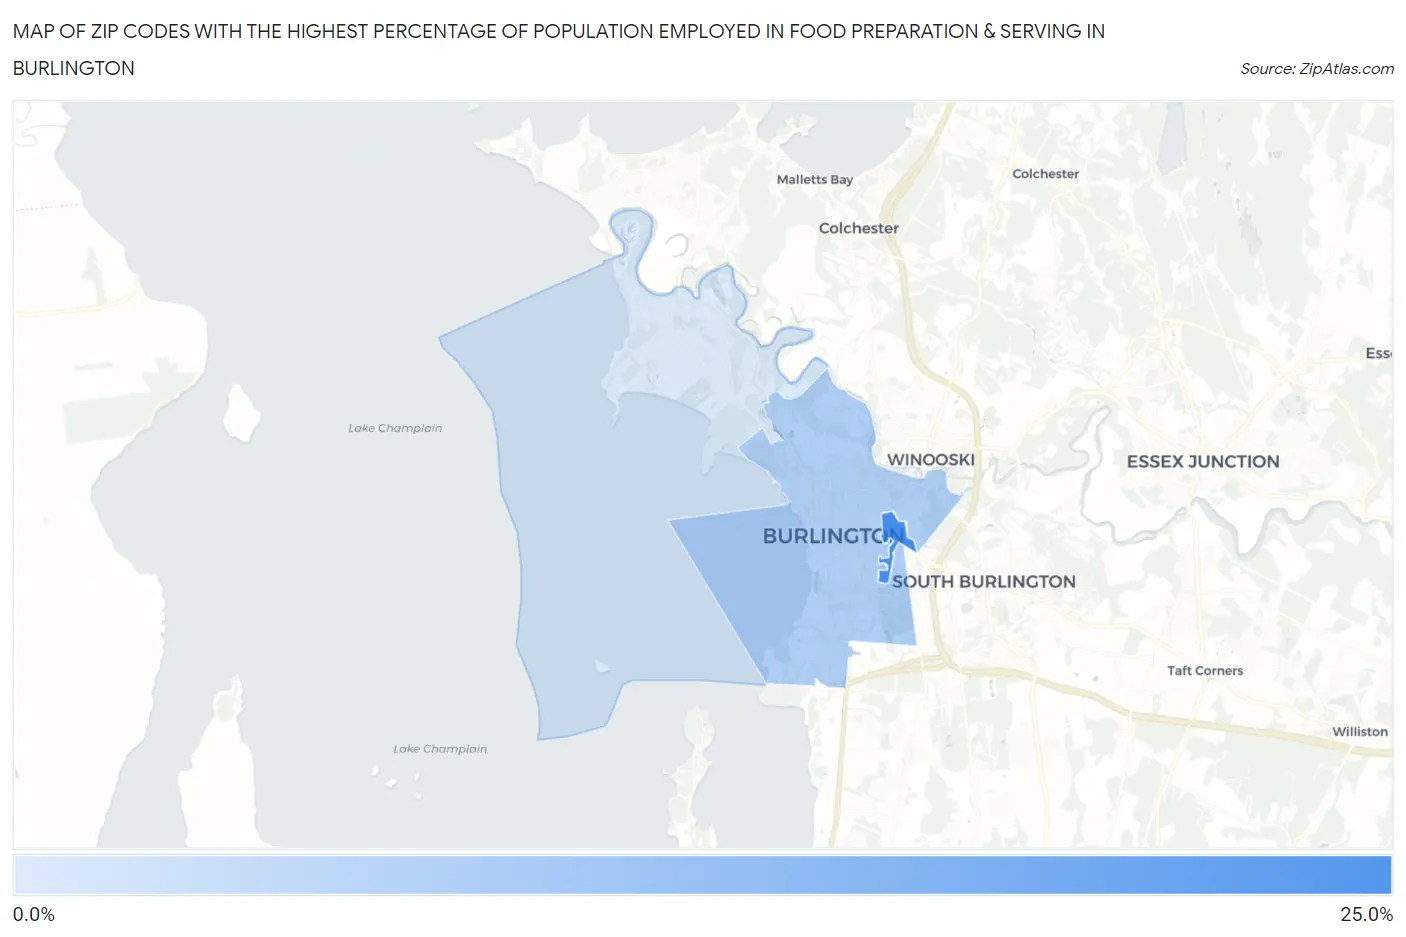
Map of Zip Codes with the Highest Percentage of Population Employed in Food Preparation & Serving in Burlington
3.5%
20.3%
Zip Codes with the Highest Percentage of Population Employed in Food Preparation & Serving in Burlington, VT
| Zip Code | % Employed | vs State | vs National | |
| 1. | 05405 | 20.3% | 5.3%(+15.0)#7 | 5.3%(+15.0)#487 |
| 2. | 05401 | 8.4% | 5.3%(+3.10)#43 | 5.3%(+3.08)#4,217 |
| 3. | 05408 | 3.5% | 5.3%(-1.75)#133 | 5.3%(-1.76)#19,092 |
1
Common Questions
What are the Top Zip Codes with the Highest Percentage of Population Employed in Food Preparation & Serving in Burlington, VT?
Top Zip Codes with the Highest Percentage of Population Employed in Food Preparation & Serving in Burlington, VT are:
What zip code has the Highest Percentage of Population Employed in Food Preparation & Serving in Burlington, VT?
05405 has the Highest Percentage of Population Employed in Food Preparation & Serving in Burlington, VT with 20.3%.
What is the Percentage of Population Employed in Food Preparation & Serving in Burlington, VT?
Percentage of Population Employed in Food Preparation & Serving in Burlington is 7.6%.
What is the Percentage of Population Employed in Food Preparation & Serving in Vermont?
Percentage of Population Employed in Food Preparation & Serving in Vermont is 5.3%.
What is the Percentage of Population Employed in Food Preparation & Serving in the United States?
Percentage of Population Employed in Food Preparation & Serving in the United States is 5.3%.