Barton, VT Map & Demographics
Barton Map
Barton Overview
$19,106
PER CAPITA INCOME
$40,078
AVG FAMILY INCOME
$29,375
AVG HOUSEHOLD INCOME
13.2%
WAGE / INCOME GAP [ % ]
86.8¢/ $1
WAGE / INCOME GAP [ $ ]
0.45
INEQUALITY / GINI INDEX
700
TOTAL POPULATION
377
MALE POPULATION
323
FEMALE POPULATION
116.72
MALES / 100 FEMALES
85.68
FEMALES / 100 MALES
44.0
MEDIAN AGE
2.8
AVG FAMILY SIZE
2.2
AVG HOUSEHOLD SIZE
283
LABOR FORCE [ PEOPLE ]
49.8%
PERCENT IN LABOR FORCE
15.5%
UNEMPLOYMENT RATE
Barton Area Codes
Income in Barton
Income Overview in Barton
Per Capita Income in Barton is $19,106, while median incomes of families and households are $40,078 and $29,375 respectively.
| Characteristic | Number | Measure |
| Per Capita Income | 700 | $19,106 |
| Median Family Income | 177 | $40,078 |
| Mean Family Income | 177 | $42,680 |
| Median Household Income | 311 | $29,375 |
| Mean Household Income | 311 | $38,918 |
| Income Deficit | 177 | $0 |
| Wage / Income Gap (%) | 700 | 13.18% |
| Wage / Income Gap ($) | 700 | 86.82¢ per $1 |
| Gini / Inequality Index | 700 | 0.45 |
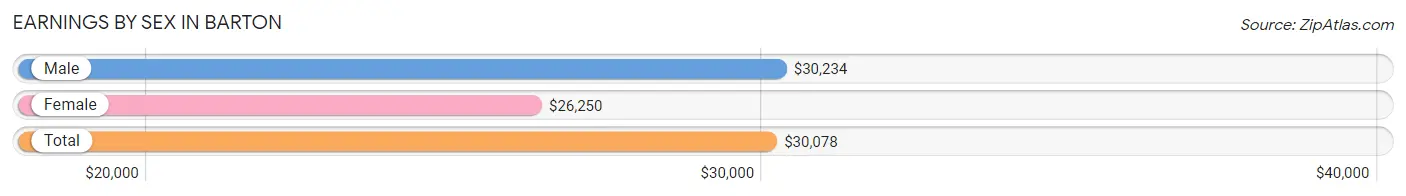
Earnings by Sex in Barton
Average Earnings in Barton are $30,078, $30,234 for men and $26,250 for women, a difference of 13.2%.
| Sex | Number | Average Earnings |
| Male | 145 (51.6%) | $30,234 |
| Female | 136 (48.4%) | $26,250 |
| Total | 281 (100.0%) | $30,078 |
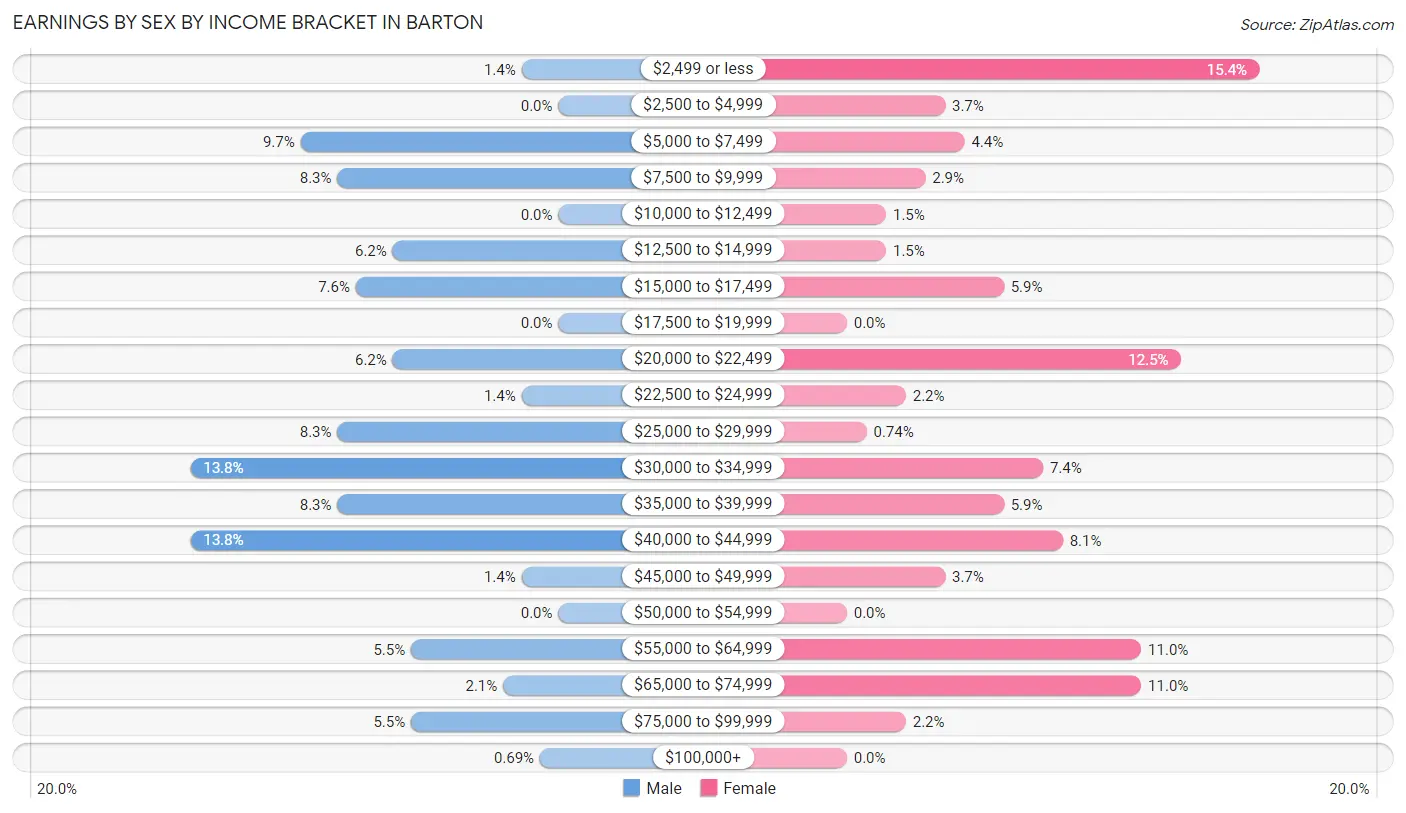
Earnings by Sex by Income Bracket in Barton
The most common earnings brackets in Barton are $30,000 to $34,999 for men (20 | 13.8%) and $2,499 or less for women (21 | 15.4%).
| Income | Male | Female |
| $2,499 or less | 2 (1.4%) | 21 (15.4%) |
| $2,500 to $4,999 | 0 (0.0%) | 5 (3.7%) |
| $5,000 to $7,499 | 14 (9.7%) | 6 (4.4%) |
| $7,500 to $9,999 | 12 (8.3%) | 4 (2.9%) |
| $10,000 to $12,499 | 0 (0.0%) | 2 (1.5%) |
| $12,500 to $14,999 | 9 (6.2%) | 2 (1.5%) |
| $15,000 to $17,499 | 11 (7.6%) | 8 (5.9%) |
| $17,500 to $19,999 | 0 (0.0%) | 0 (0.0%) |
| $20,000 to $22,499 | 9 (6.2%) | 17 (12.5%) |
| $22,500 to $24,999 | 2 (1.4%) | 3 (2.2%) |
| $25,000 to $29,999 | 12 (8.3%) | 1 (0.7%) |
| $30,000 to $34,999 | 20 (13.8%) | 10 (7.3%) |
| $35,000 to $39,999 | 12 (8.3%) | 8 (5.9%) |
| $40,000 to $44,999 | 20 (13.8%) | 11 (8.1%) |
| $45,000 to $49,999 | 2 (1.4%) | 5 (3.7%) |
| $50,000 to $54,999 | 0 (0.0%) | 0 (0.0%) |
| $55,000 to $64,999 | 8 (5.5%) | 15 (11.0%) |
| $65,000 to $74,999 | 3 (2.1%) | 15 (11.0%) |
| $75,000 to $99,999 | 8 (5.5%) | 3 (2.2%) |
| $100,000+ | 1 (0.7%) | 0 (0.0%) |
| Total | 145 (100.0%) | 136 (100.0%) |
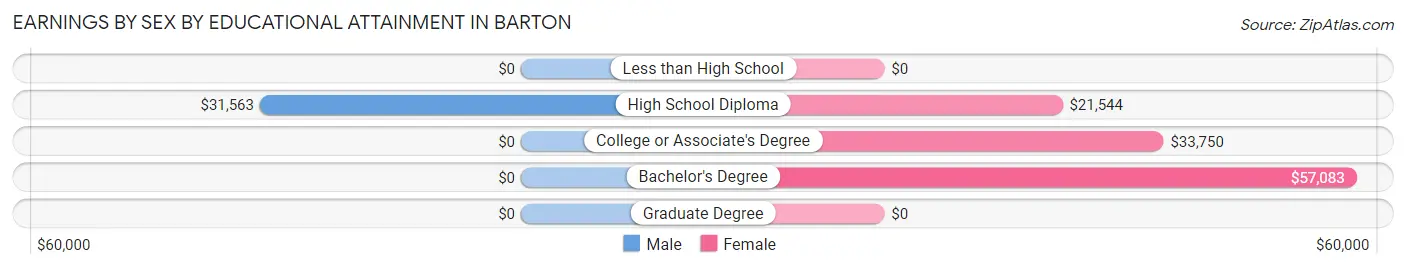
Earnings by Sex by Educational Attainment in Barton
Average earnings in Barton are $31,328 for men and $26,250 for women, a difference of 16.2%. Men with an educational attainment of high school diploma enjoy the highest average annual earnings of $31,563, while those with high school diploma education earn the least with $31,563. Women with an educational attainment of bachelor's degree earn the most with the average annual earnings of $57,083, while those with high school diploma education have the smallest earnings of $21,544.
| Educational Attainment | Male Income | Female Income |
| Less than High School | - | - |
| High School Diploma | $31,563 | $21,544 |
| College or Associate's Degree | - | - |
| Bachelor's Degree | - | - |
| Graduate Degree | - | - |
| Total | $31,328 | $26,250 |
Family Income in Barton
Family Income Brackets in Barton
According to the Barton family income data, there are 48 families falling into the $35,000 to $49,999 income range, which is the most common income bracket and makes up 27.1% of all families.
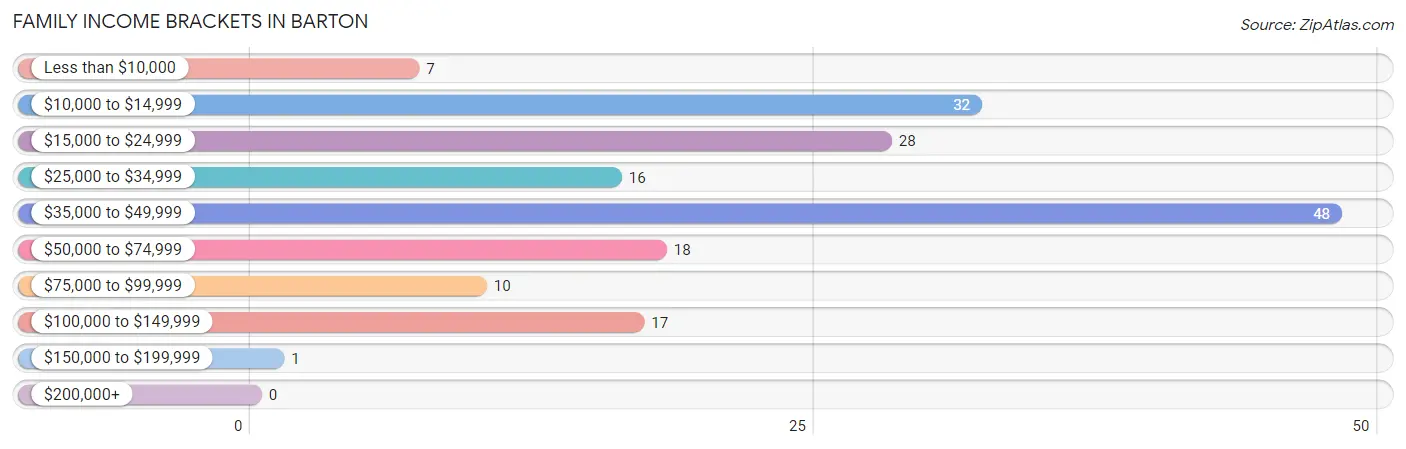
| Income Bracket | # Families | % Families |
| Less than $10,000 | 7 | 4.0% |
| $10,000 to $14,999 | 32 | 18.1% |
| $15,000 to $24,999 | 28 | 15.8% |
| $25,000 to $34,999 | 16 | 9.0% |
| $35,000 to $49,999 | 48 | 27.1% |
| $50,000 to $74,999 | 18 | 10.2% |
| $75,000 to $99,999 | 10 | 5.6% |
| $100,000 to $149,999 | 17 | 9.6% |
| $150,000 to $199,999 | 1 | 0.6% |
| $200,000+ | 0 | 0.0% |
Family Income by Famaliy Size in Barton
3-person families (35 | 19.8%) account for the highest median family income in Barton with $42,054 per family, while 3-person families (35 | 19.8%) have the highest median income of $14,018 per family member.
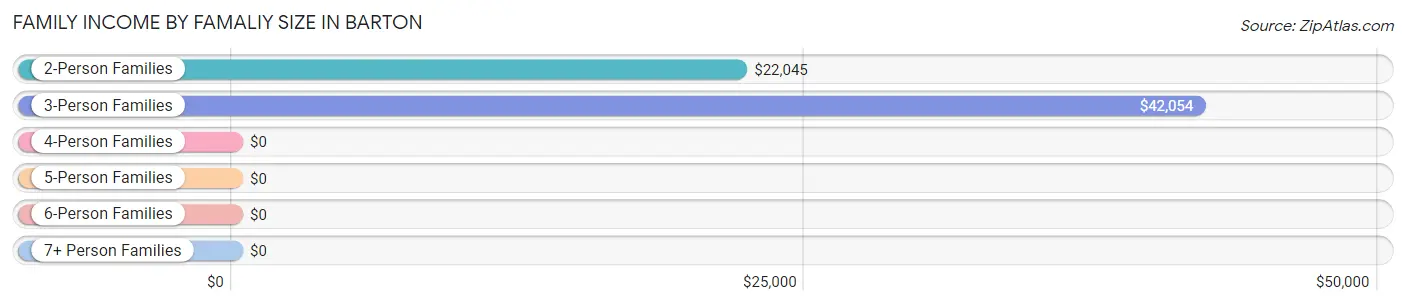
| Income Bracket | # Families | Median Income |
| 2-Person Families | 116 (65.5%) | $22,045 |
| 3-Person Families | 35 (19.8%) | $42,054 |
| 4-Person Families | 10 (5.7%) | $0 |
| 5-Person Families | 15 (8.5%) | $0 |
| 6-Person Families | 0 (0.0%) | $0 |
| 7+ Person Families | 1 (0.6%) | $0 |
| Total | 177 (100.0%) | $40,078 |
Family Income by Number of Earners in Barton
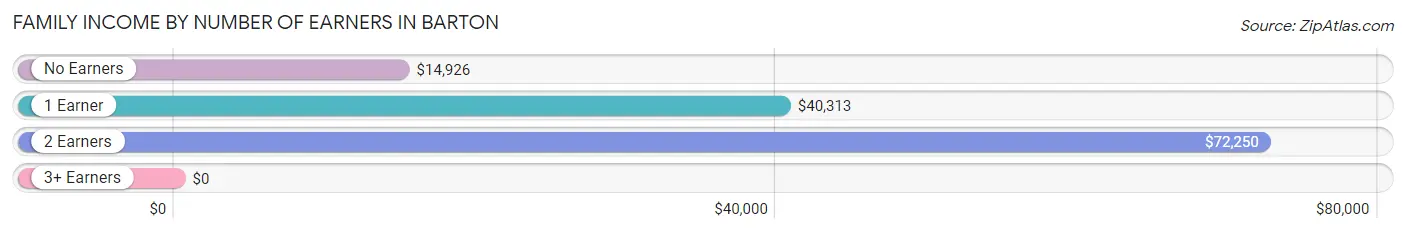
| Number of Earners | # Families | Median Income |
| No Earners | 61 (34.5%) | $14,926 |
| 1 Earner | 62 (35.0%) | $40,313 |
| 2 Earners | 53 (29.9%) | $72,250 |
| 3+ Earners | 1 (0.6%) | $0 |
| Total | 177 (100.0%) | $40,078 |
Household Income in Barton
Household Income Brackets in Barton
With 63 households falling in the category, the $10,000 to $14,999 income range is the most frequent in Barton, accounting for 20.3% of all households.
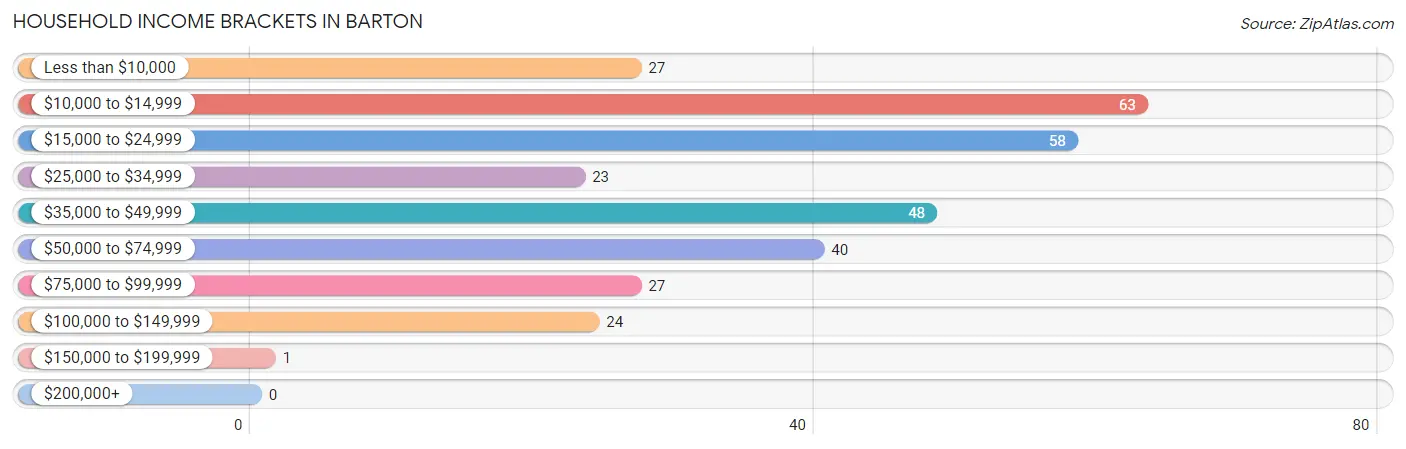
| Income Bracket | # Households | % Households |
| Less than $10,000 | 27 | 8.7% |
| $10,000 to $14,999 | 63 | 20.3% |
| $15,000 to $24,999 | 58 | 18.6% |
| $25,000 to $34,999 | 23 | 7.4% |
| $35,000 to $49,999 | 48 | 15.4% |
| $50,000 to $74,999 | 40 | 12.9% |
| $75,000 to $99,999 | 27 | 8.7% |
| $100,000 to $149,999 | 24 | 7.7% |
| $150,000 to $199,999 | 1 | 0.3% |
| $200,000+ | 0 | 0.0% |
Household Income by Householder Age in Barton
The median household income in Barton is $29,375, with the highest median household income of $44,583 found in the 25 to 44 years age bracket for the primary householder. A total of 93 households (29.9%) fall into this category. Meanwhile, the 15 to 24 years age bracket for the primary householder has the lowest median household income of $0, with 14 households (4.5%) in this group.
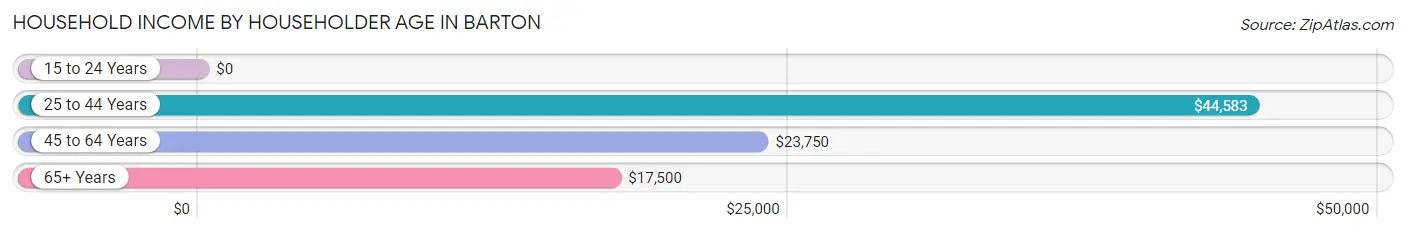
| Income Bracket | # Households | Median Income |
| 15 to 24 Years | 14 (4.5%) | $0 |
| 25 to 44 Years | 93 (29.9%) | $44,583 |
| 45 to 64 Years | 108 (34.7%) | $23,750 |
| 65+ Years | 96 (30.9%) | $17,500 |
| Total | 311 (100.0%) | $29,375 |
Poverty in Barton
Income Below Poverty by Sex and Age in Barton
With 28.3% poverty level for males and 31.6% for females among the residents of Barton, 6 to 11 year old males and 55 to 64 year old females are the most vulnerable to poverty, with 9 males (56.2%) and 22 females (59.5%) in their respective age groups living below the poverty level.
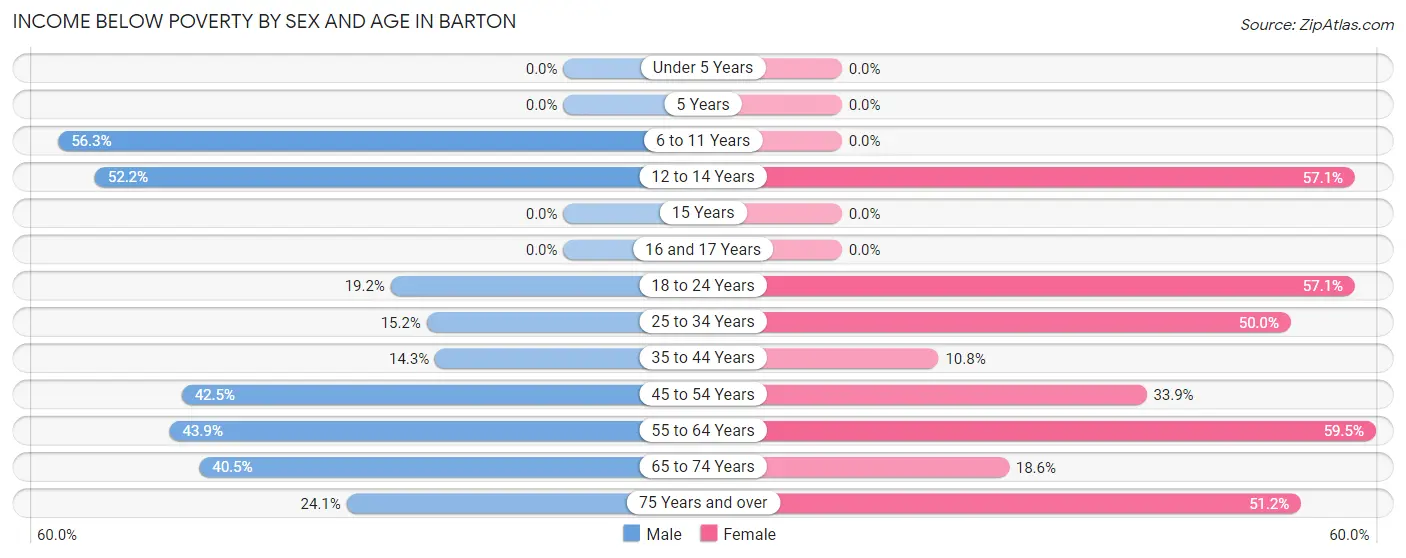
| Age Bracket | Male | Female |
| Under 5 Years | 0 (0.0%) | 0 (0.0%) |
| 5 Years | 0 (0.0%) | 0 (0.0%) |
| 6 to 11 Years | 9 (56.2%) | 0 (0.0%) |
| 12 to 14 Years | 12 (52.2%) | 4 (57.1%) |
| 15 Years | 0 (0.0%) | 0 (0.0%) |
| 16 and 17 Years | 0 (0.0%) | 0 (0.0%) |
| 18 to 24 Years | 5 (19.2%) | 8 (57.1%) |
| 25 to 34 Years | 7 (15.2%) | 12 (50.0%) |
| 35 to 44 Years | 7 (14.3%) | 7 (10.8%) |
| 45 to 54 Years | 17 (42.5%) | 19 (33.9%) |
| 55 to 64 Years | 25 (43.9%) | 22 (59.5%) |
| 65 to 74 Years | 15 (40.5%) | 8 (18.6%) |
| 75 Years and over | 7 (24.1%) | 22 (51.2%) |
| Total | 104 (28.3%) | 102 (31.6%) |
Income Above Poverty by Sex and Age in Barton
According to the poverty statistics in Barton, males aged under 5 years and females aged under 5 years are the age groups that are most secure financially, with 100.0% of males and 100.0% of females in these age groups living above the poverty line.
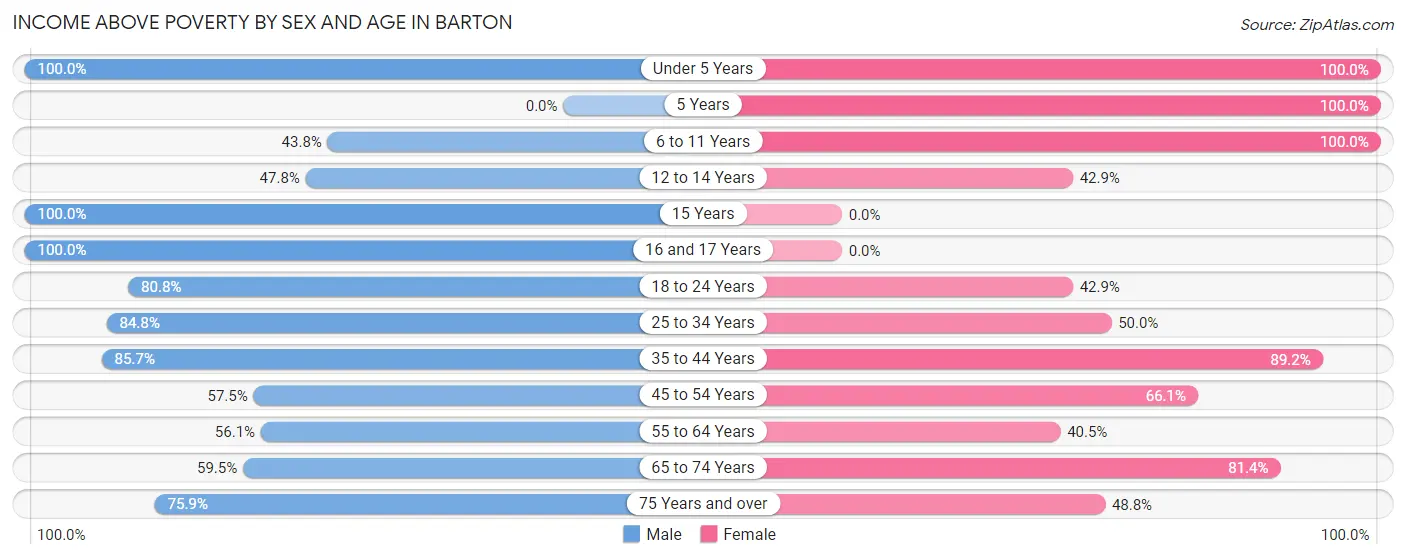
| Age Bracket | Male | Female |
| Under 5 Years | 28 (100.0%) | 7 (100.0%) |
| 5 Years | 0 (0.0%) | 2 (100.0%) |
| 6 to 11 Years | 7 (43.8%) | 25 (100.0%) |
| 12 to 14 Years | 11 (47.8%) | 3 (42.9%) |
| 15 Years | 14 (100.0%) | 0 (0.0%) |
| 16 and 17 Years | 2 (100.0%) | 0 (0.0%) |
| 18 to 24 Years | 21 (80.8%) | 6 (42.9%) |
| 25 to 34 Years | 39 (84.8%) | 12 (50.0%) |
| 35 to 44 Years | 42 (85.7%) | 58 (89.2%) |
| 45 to 54 Years | 23 (57.5%) | 37 (66.1%) |
| 55 to 64 Years | 32 (56.1%) | 15 (40.5%) |
| 65 to 74 Years | 22 (59.5%) | 35 (81.4%) |
| 75 Years and over | 22 (75.9%) | 21 (48.8%) |
| Total | 263 (71.7%) | 221 (68.4%) |
Income Below Poverty Among Married-Couple Families in Barton
The poverty statistics for married-couple families in Barton show that 23.3% or 21 of the total 90 families live below the poverty line. Families with 3 or 4 children have the highest poverty rate of 43.8%, comprising of 7 families. On the other hand, families with 1 or 2 children have the lowest poverty rate of 0.0%, which includes 0 families.
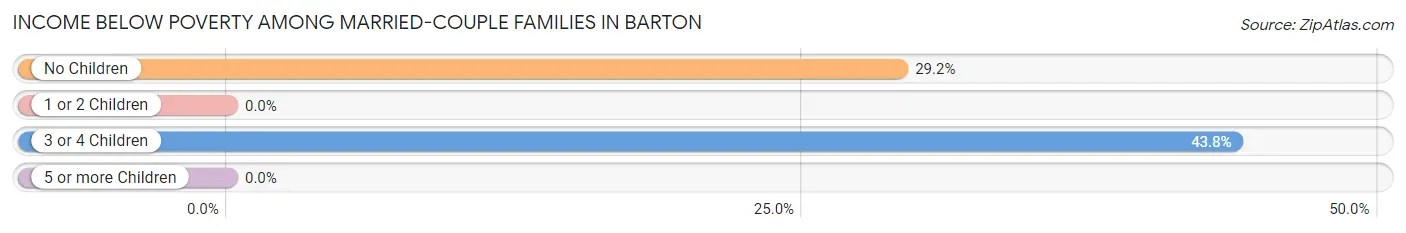
| Children | Above Poverty | Below Poverty |
| No Children | 34 (70.8%) | 14 (29.2%) |
| 1 or 2 Children | 26 (100.0%) | 0 (0.0%) |
| 3 or 4 Children | 9 (56.2%) | 7 (43.8%) |
| 5 or more Children | 0 (0.0%) | 0 (0.0%) |
| Total | 69 (76.7%) | 21 (23.3%) |
Income Below Poverty Among Single-Parent Households in Barton
According to the poverty data in Barton, 30.2% or 13 single-father households and 50.0% or 22 single-mother households are living below the poverty line. Among single-father households, those with 1 or 2 children have the highest poverty rate, with 13 households (48.1%) experiencing poverty. Likewise, among single-mother households, those with no children have the highest poverty rate, with 22 households (71.0%) falling below the poverty line.
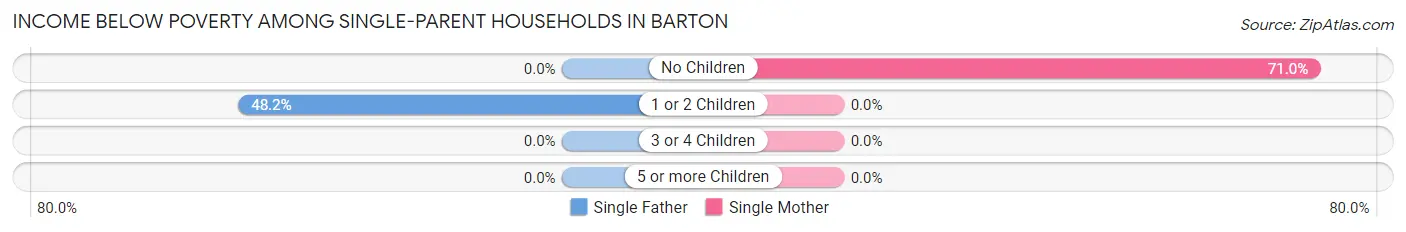
| Children | Single Father | Single Mother |
| No Children | 0 (0.0%) | 22 (71.0%) |
| 1 or 2 Children | 13 (48.1%) | 0 (0.0%) |
| 3 or 4 Children | 0 (0.0%) | 0 (0.0%) |
| 5 or more Children | 0 (0.0%) | 0 (0.0%) |
| Total | 13 (30.2%) | 22 (50.0%) |
Income Below Poverty Among Married-Couple vs Single-Parent Households in Barton
The poverty data for Barton shows that 21 of the married-couple family households (23.3%) and 35 of the single-parent households (40.2%) are living below the poverty level. Within the married-couple family households, those with 3 or 4 children have the highest poverty rate, with 7 households (43.8%) falling below the poverty line. Among the single-parent households, those with no children have the highest poverty rate, with 22 household (46.8%) living below poverty.
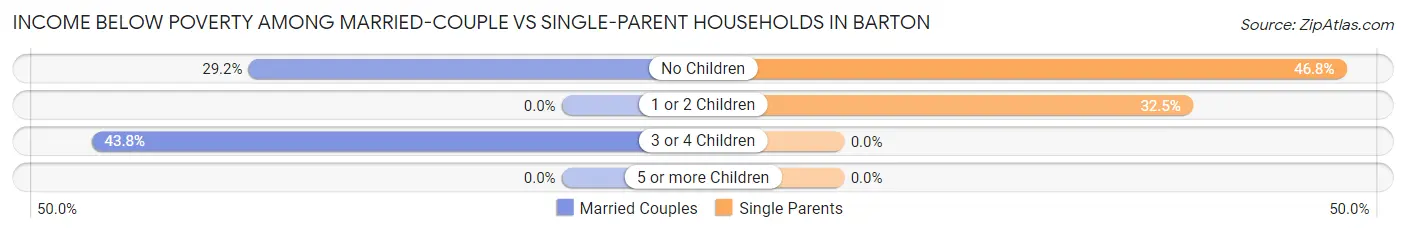
| Children | Married-Couple Families | Single-Parent Households |
| No Children | 14 (29.2%) | 22 (46.8%) |
| 1 or 2 Children | 0 (0.0%) | 13 (32.5%) |
| 3 or 4 Children | 7 (43.8%) | 0 (0.0%) |
| 5 or more Children | 0 (0.0%) | 0 (0.0%) |
| Total | 21 (23.3%) | 35 (40.2%) |
Race in Barton
The most populous races in Barton are White / Caucasian (606 | 86.6%), Two or more Races (42 | 6.0%), and Black / African American (34 | 4.9%).
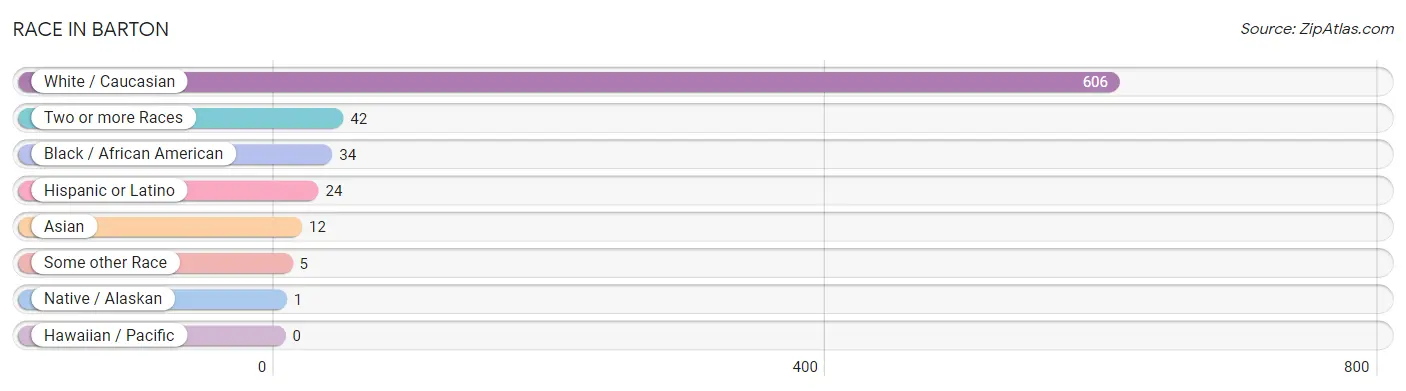
| Race | # Population | % Population |
| Asian | 12 | 1.7% |
| Black / African American | 34 | 4.9% |
| Hawaiian / Pacific | 0 | 0.0% |
| Hispanic or Latino | 24 | 3.4% |
| Native / Alaskan | 1 | 0.1% |
| White / Caucasian | 606 | 86.6% |
| Two or more Races | 42 | 6.0% |
| Some other Race | 5 | 0.7% |
| Total | 700 | 100.0% |
Ancestry in Barton
The most populous ancestries reported in Barton are Irish (126 | 18.0%), American (105 | 15.0%), French (105 | 15.0%), English (76 | 10.9%), and French Canadian (65 | 9.3%), together accounting for 68.1% of all Barton residents.
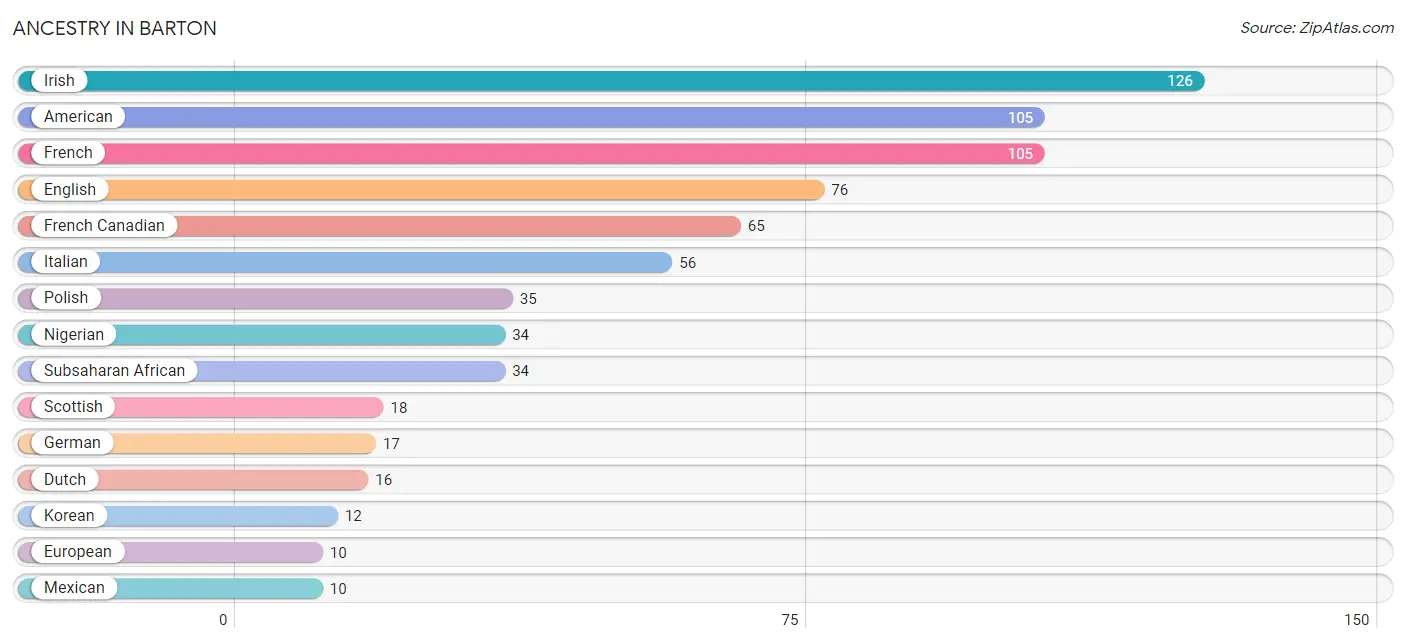
| Ancestry | # Population | % Population |
| American | 105 | 15.0% |
| Belgian | 6 | 0.9% |
| Burmese | 2 | 0.3% |
| Canadian | 5 | 0.7% |
| Central American | 5 | 0.7% |
| Cherokee | 1 | 0.1% |
| Dutch | 16 | 2.3% |
| English | 76 | 10.9% |
| European | 10 | 1.4% |
| French | 105 | 15.0% |
| French American Indian | 6 | 0.9% |
| French Canadian | 65 | 9.3% |
| German | 17 | 2.4% |
| Greek | 4 | 0.6% |
| Honduran | 5 | 0.7% |
| Hungarian | 4 | 0.6% |
| Indian (Asian) | 2 | 0.3% |
| Iranian | 2 | 0.3% |
| Irish | 126 | 18.0% |
| Italian | 56 | 8.0% |
| Jamaican | 2 | 0.3% |
| Korean | 12 | 1.7% |
| Mexican | 10 | 1.4% |
| Nigerian | 34 | 4.9% |
| Norwegian | 3 | 0.4% |
| Polish | 35 | 5.0% |
| Scottish | 18 | 2.6% |
| Slavic | 6 | 0.9% |
| Subsaharan African | 34 | 4.9% |
| Swedish | 4 | 0.6% |
| Welsh | 3 | 0.4% | View All 31 Rows |
Immigrants in Barton
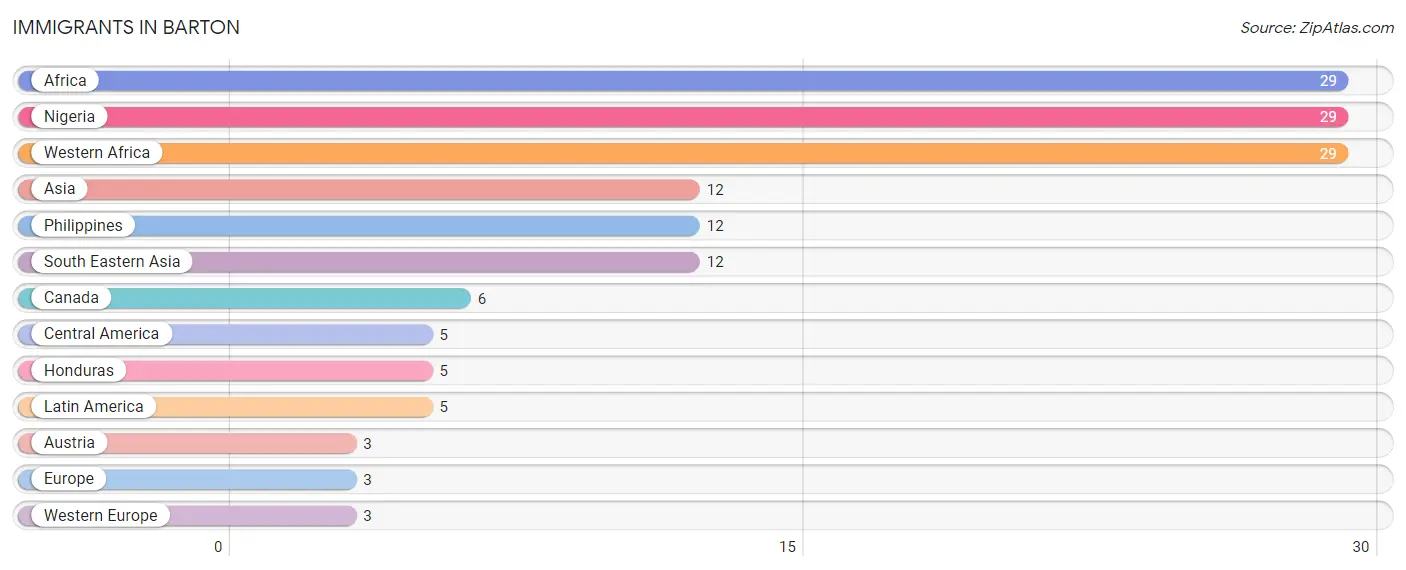
The most numerous immigrant groups reported in Barton came from Africa (29 | 4.1%), Nigeria (29 | 4.1%), Western Africa (29 | 4.1%), Asia (12 | 1.7%), and Philippines (12 | 1.7%), together accounting for 15.8% of all Barton residents.
| Immigration Origin | # Population | % Population |
| Africa | 29 | 4.1% |
| Asia | 12 | 1.7% |
| Austria | 3 | 0.4% |
| Canada | 6 | 0.9% |
| Central America | 5 | 0.7% |
| Europe | 3 | 0.4% |
| Honduras | 5 | 0.7% |
| Latin America | 5 | 0.7% |
| Nigeria | 29 | 4.1% |
| Philippines | 12 | 1.7% |
| South Eastern Asia | 12 | 1.7% |
| Western Africa | 29 | 4.1% |
| Western Europe | 3 | 0.4% | View All 13 Rows |
Sex and Age in Barton
Sex and Age in Barton
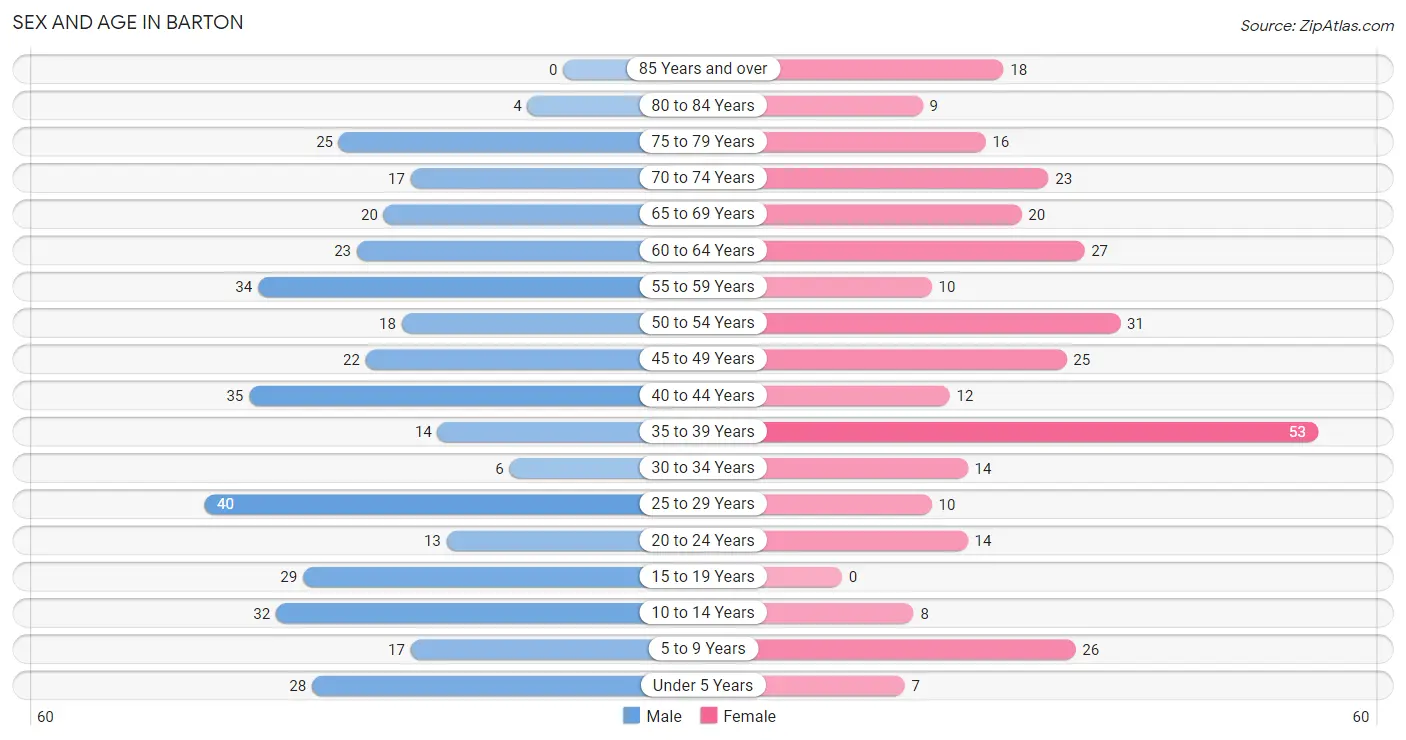
The most populous age groups in Barton are 25 to 29 Years (40 | 10.6%) for men and 35 to 39 Years (53 | 16.4%) for women.
| Age Bracket | Male | Female |
| Under 5 Years | 28 (7.4%) | 7 (2.2%) |
| 5 to 9 Years | 17 (4.5%) | 26 (8.1%) |
| 10 to 14 Years | 32 (8.5%) | 8 (2.5%) |
| 15 to 19 Years | 29 (7.7%) | 0 (0.0%) |
| 20 to 24 Years | 13 (3.5%) | 14 (4.3%) |
| 25 to 29 Years | 40 (10.6%) | 10 (3.1%) |
| 30 to 34 Years | 6 (1.6%) | 14 (4.3%) |
| 35 to 39 Years | 14 (3.7%) | 53 (16.4%) |
| 40 to 44 Years | 35 (9.3%) | 12 (3.7%) |
| 45 to 49 Years | 22 (5.8%) | 25 (7.7%) |
| 50 to 54 Years | 18 (4.8%) | 31 (9.6%) |
| 55 to 59 Years | 34 (9.0%) | 10 (3.1%) |
| 60 to 64 Years | 23 (6.1%) | 27 (8.4%) |
| 65 to 69 Years | 20 (5.3%) | 20 (6.2%) |
| 70 to 74 Years | 17 (4.5%) | 23 (7.1%) |
| 75 to 79 Years | 25 (6.6%) | 16 (5.0%) |
| 80 to 84 Years | 4 (1.1%) | 9 (2.8%) |
| 85 Years and over | 0 (0.0%) | 18 (5.6%) |
| Total | 377 (100.0%) | 323 (100.0%) |
Families and Households in Barton
Median Family Size in Barton
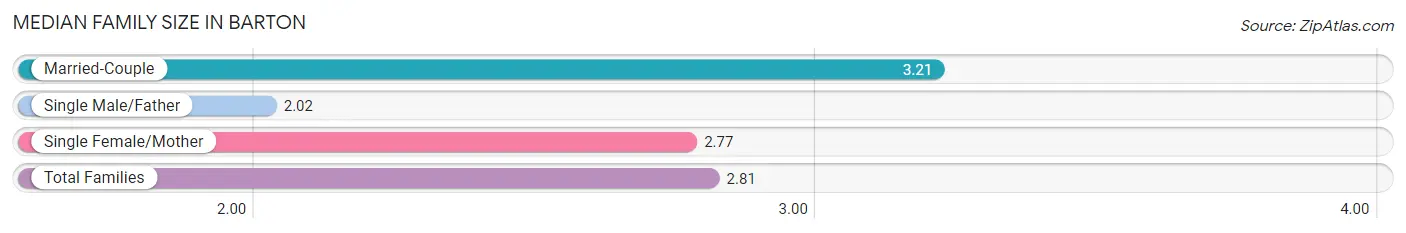
The median family size in Barton is 2.81 persons per family, with married-couple families (90 | 50.8%) accounting for the largest median family size of 3.21 persons per family. On the other hand, single male/father families (43 | 24.3%) represent the smallest median family size with 2.02 persons per family.
| Family Type | # Families | Family Size |
| Married-Couple | 90 (50.8%) | 3.21 |
| Single Male/Father | 43 (24.3%) | 2.02 |
| Single Female/Mother | 44 (24.9%) | 2.77 |
| Total Families | 177 (100.0%) | 2.81 |
Median Household Size in Barton
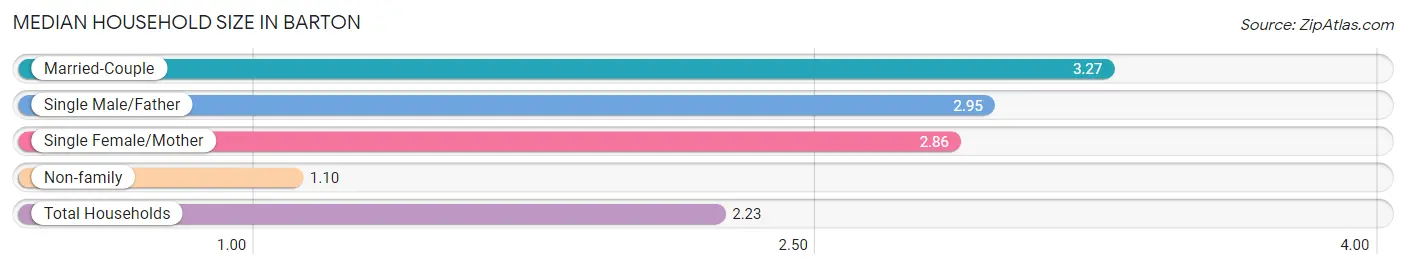
The median household size in Barton is 2.23 persons per household, with married-couple households (90 | 28.9%) accounting for the largest median household size of 3.27 persons per household. non-family households (134 | 43.1%) represent the smallest median household size with 1.10 persons per household.
| Household Type | # Households | Household Size |
| Married-Couple | 90 (28.9%) | 3.27 |
| Single Male/Father | 43 (13.8%) | 2.95 |
| Single Female/Mother | 44 (14.1%) | 2.86 |
| Non-family | 134 (43.1%) | 1.10 |
| Total Households | 311 (100.0%) | 2.23 |
Household Size by Marriage Status in Barton
Out of a total of 311 households in Barton, 177 (56.9%) are family households, while 134 (43.1%) are nonfamily households. The most numerous type of family households are 2-person households, comprising 85, and the most common type of nonfamily households are 1-person households, comprising 116.
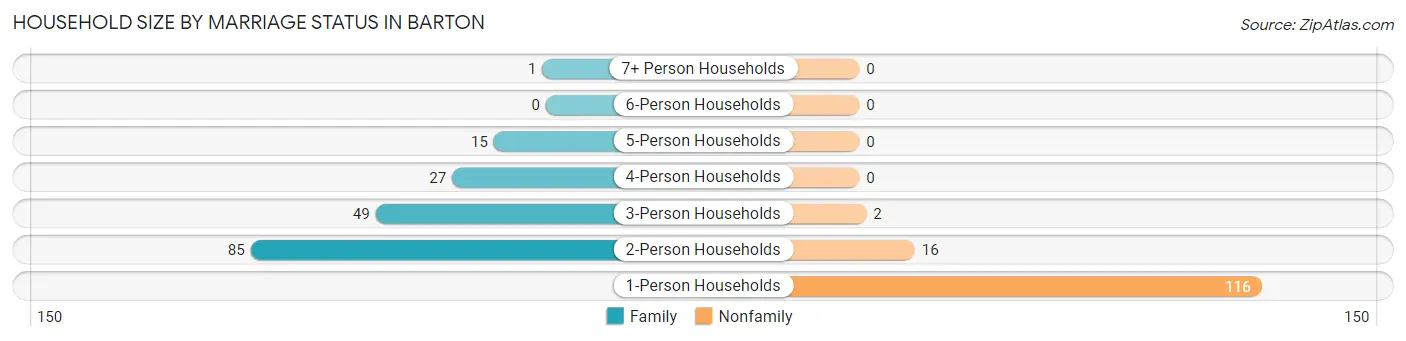
| Household Size | Family Households | Nonfamily Households |
| 1-Person Households | - | 116 (37.3%) |
| 2-Person Households | 85 (27.3%) | 16 (5.1%) |
| 3-Person Households | 49 (15.8%) | 2 (0.6%) |
| 4-Person Households | 27 (8.7%) | 0 (0.0%) |
| 5-Person Households | 15 (4.8%) | 0 (0.0%) |
| 6-Person Households | 0 (0.0%) | 0 (0.0%) |
| 7+ Person Households | 1 (0.3%) | 0 (0.0%) |
| Total | 177 (56.9%) | 134 (43.1%) |
Female Fertility in Barton
Fertility by Age in Barton
| Age Bracket | Women with Births | Births / 1,000 Women |
| 15 to 19 years | 0 (0.0%) | 0.0 |
| 20 to 34 years | 0 (0.0%) | 0.0 |
| 35 to 50 years | 0 (0.0%) | 0.0 |
| Total | 0 (0.0%) | 0.0 |
Fertility by Age by Marriage Status in Barton
| Age Bracket | Married | Unmarried |
| 15 to 19 years | 0 (0.0%) | 0 (0.0%) |
| 20 to 34 years | 0 (0.0%) | 0 (0.0%) |
| 35 to 50 years | 0 (0.0%) | 0 (0.0%) |
| Total | 0 (0.0%) | 0 (0.0%) |
Fertility by Education in Barton
| Educational Attainment | Women with Births | Births / 1,000 Women |
| Less than High School | 0 (0.0%) | 0.0 |
| High School Diploma | 0 (0.0%) | 0.0 |
| College or Associate's Degree | 0 (0.0%) | 0.0 |
| Bachelor's Degree | 0 (0.0%) | 0.0 |
| Graduate Degree | 0 (0.0%) | 0.0 |
| Total | 0 (0.0%) | 0.0 |
Fertility by Education by Marriage Status in Barton
| Educational Attainment | Married | Unmarried |
| Less than High School | 0 (0.0%) | 0 (0.0%) |
| High School Diploma | 0 (0.0%) | 0 (0.0%) |
| College or Associate's Degree | 0 (0.0%) | 0 (0.0%) |
| Bachelor's Degree | 0 (0.0%) | 0 (0.0%) |
| Graduate Degree | 0 (0.0%) | 0 (0.0%) |
| Total | 0 (0.0%) | 0 (0.0%) |
Employment Characteristics in Barton
Employment by Class of Employer in Barton
Among the 239 employed individuals in Barton, private company employees (160 | 66.9%), local government employees (21 | 8.8%), and not-for-profit organizations (20 | 8.4%) make up the most common classes of employment.
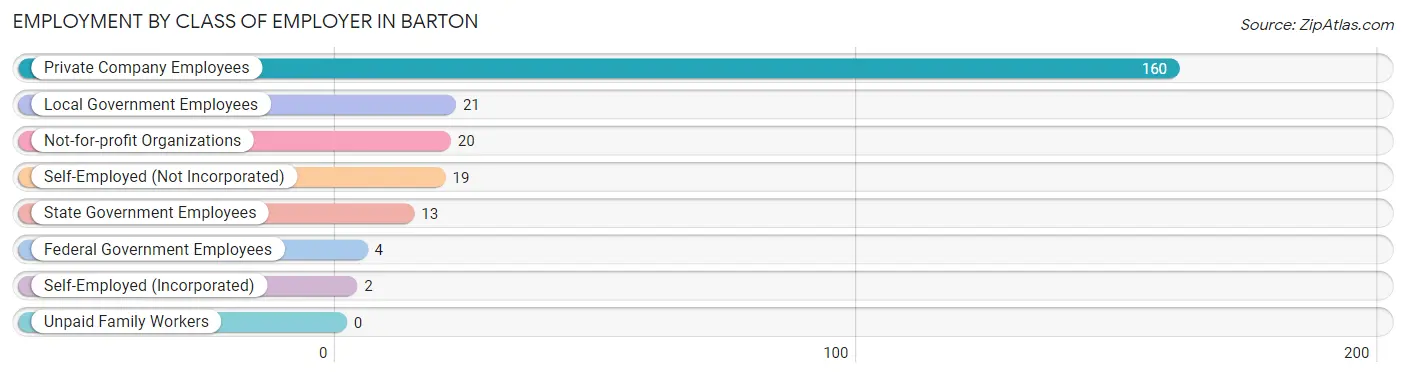
| Employer Class | # Employees | % Employees |
| Private Company Employees | 160 | 66.9% |
| Self-Employed (Incorporated) | 2 | 0.8% |
| Self-Employed (Not Incorporated) | 19 | 8.0% |
| Not-for-profit Organizations | 20 | 8.4% |
| Local Government Employees | 21 | 8.8% |
| State Government Employees | 13 | 5.4% |
| Federal Government Employees | 4 | 1.7% |
| Unpaid Family Workers | 0 | 0.0% |
| Total | 239 | 100.0% |
Employment Status by Age in Barton
According to the labor force statistics for Barton, out of the total population over 16 years of age (568), 49.8% or 283 individuals are in the labor force, with 15.5% or 44 of them unemployed. The age group with the highest labor force participation rate is 25 to 29 years, with 92.0% or 46 individuals in the labor force. Within the labor force, the 25 to 29 years age range has the highest percentage of unemployed individuals, with 34.8% or 16 of them being unemployed.
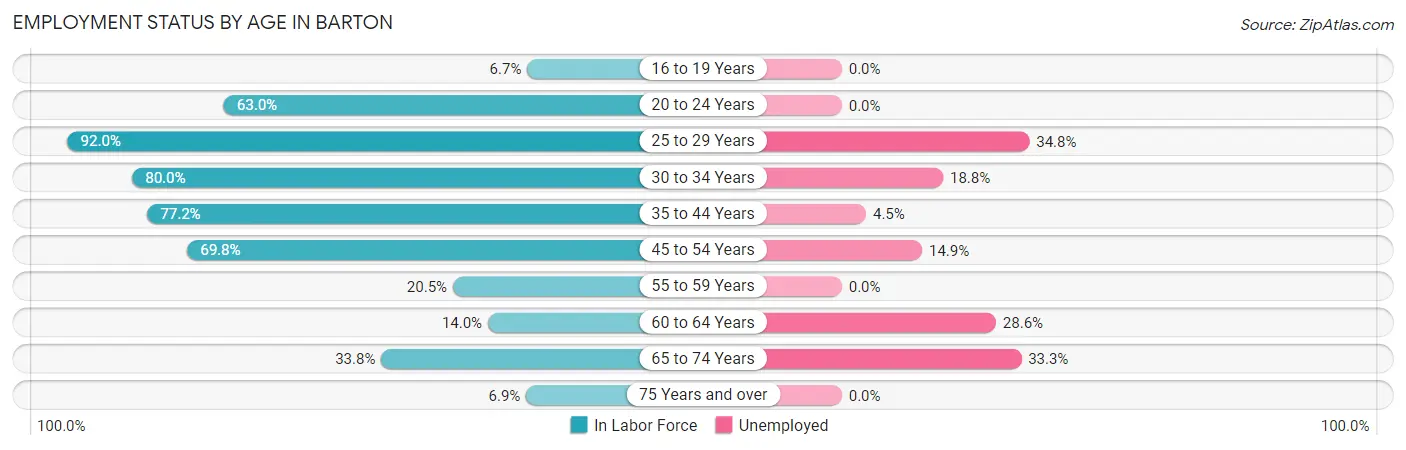
| Age Bracket | In Labor Force | Unemployed |
| 16 to 19 Years | 1 (6.7%) | 0 (0.0%) |
| 20 to 24 Years | 17 (63.0%) | 0 (0.0%) |
| 25 to 29 Years | 46 (92.0%) | 16 (34.8%) |
| 30 to 34 Years | 16 (80.0%) | 3 (18.8%) |
| 35 to 44 Years | 88 (77.2%) | 4 (4.5%) |
| 45 to 54 Years | 67 (69.8%) | 10 (14.9%) |
| 55 to 59 Years | 9 (20.5%) | 0 (0.0%) |
| 60 to 64 Years | 7 (14.0%) | 2 (28.6%) |
| 65 to 74 Years | 27 (33.8%) | 9 (33.3%) |
| 75 Years and over | 5 (6.9%) | 0 (0.0%) |
| Total | 283 (49.8%) | 44 (15.5%) |
Employment Status by Educational Attainment in Barton
According to labor force statistics for Barton, 62.3% of individuals (233) out of the total population between 25 and 64 years of age (374) are in the labor force, with 15.0% or 35 of them being unemployed. The group with the highest labor force participation rate are those with the educational attainment of bachelor's degree or higher, with 87.3% or 48 individuals in the labor force. Within the labor force, individuals with high school diploma education have the highest percentage of unemployment, with 20.2% or 21 of them being unemployed.
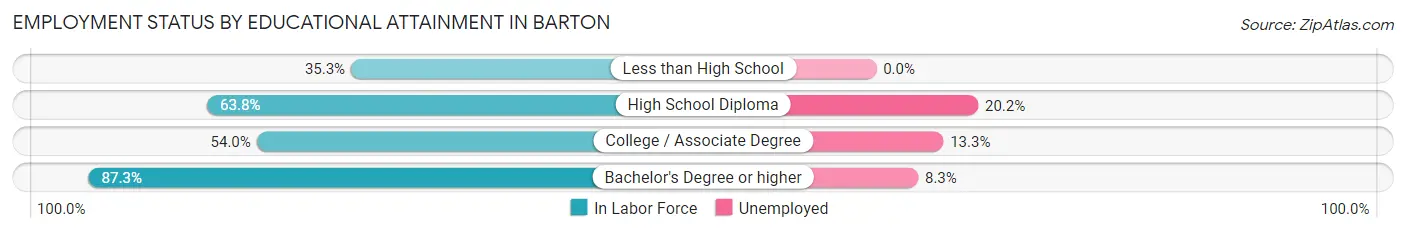
| Educational Attainment | In Labor Force | Unemployed |
| Less than High School | 6 (35.3%) | 0 (0.0%) |
| High School Diploma | 104 (63.8%) | 33 (20.2%) |
| College / Associate Degree | 75 (54.0%) | 18 (13.3%) |
| Bachelor's Degree or higher | 48 (87.3%) | 5 (8.3%) |
| Total | 233 (62.3%) | 56 (15.0%) |
Employment Occupations by Sex in Barton
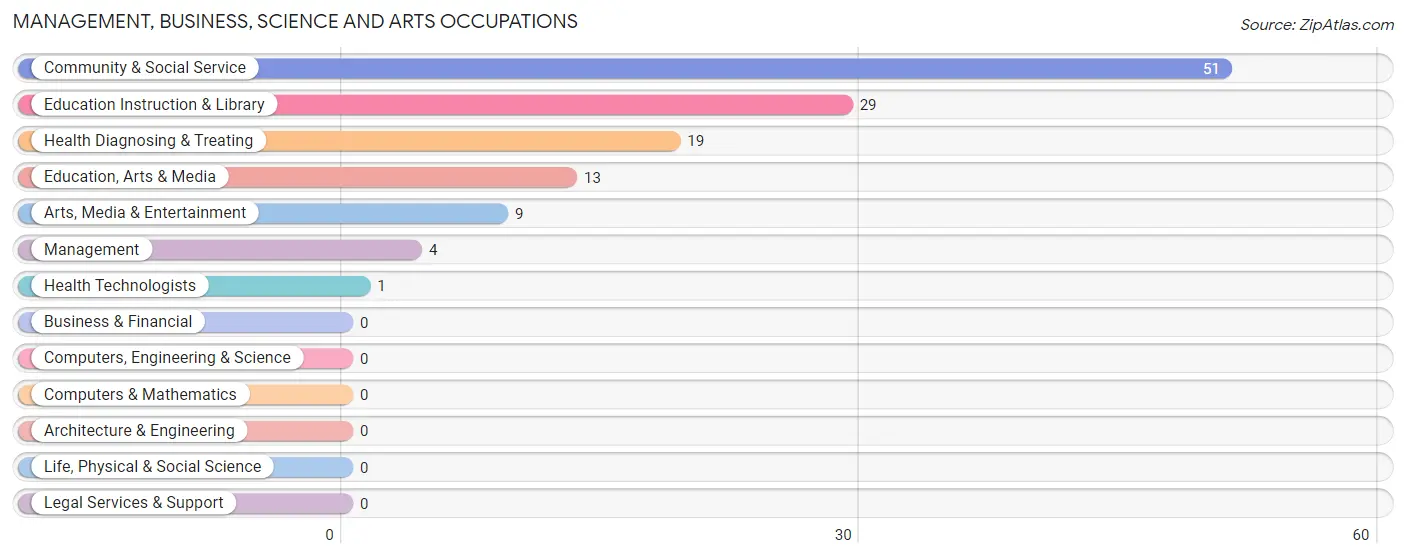
Management, Business, Science and Arts Occupations
The most common Management, Business, Science and Arts occupations in Barton are Community & Social Service (51 | 21.3%), Education Instruction & Library (29 | 12.1%), Health Diagnosing & Treating (19 | 8.0%), Education, Arts & Media (13 | 5.4%), and Arts, Media & Entertainment (9 | 3.8%).
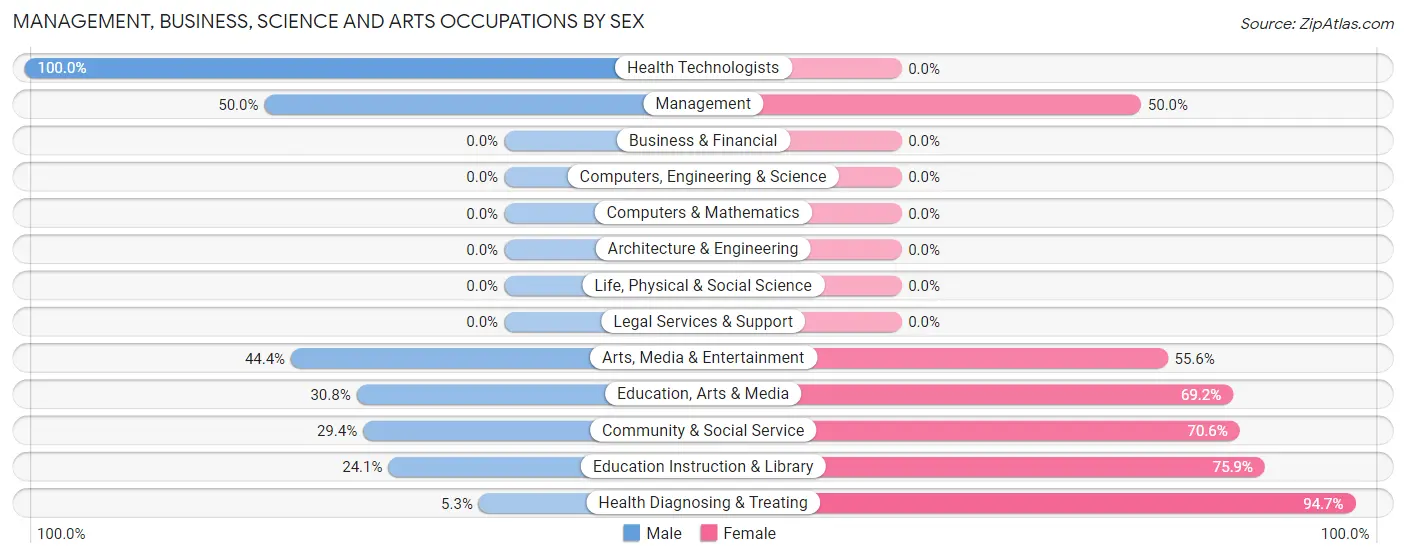
Management, Business, Science and Arts Occupations by Sex
Within the Management, Business, Science and Arts occupations in Barton, the most male-oriented occupations are Health Technologists (100.0%), Management (50.0%), and Arts, Media & Entertainment (44.4%), while the most female-oriented occupations are Health Diagnosing & Treating (94.7%), Education Instruction & Library (75.9%), and Community & Social Service (70.6%).
| Occupation | Male | Female |
| Management | 2 (50.0%) | 2 (50.0%) |
| Business & Financial | 0 (0.0%) | 0 (0.0%) |
| Computers, Engineering & Science | 0 (0.0%) | 0 (0.0%) |
| Computers & Mathematics | 0 (0.0%) | 0 (0.0%) |
| Architecture & Engineering | 0 (0.0%) | 0 (0.0%) |
| Life, Physical & Social Science | 0 (0.0%) | 0 (0.0%) |
| Community & Social Service | 15 (29.4%) | 36 (70.6%) |
| Education, Arts & Media | 4 (30.8%) | 9 (69.2%) |
| Legal Services & Support | 0 (0.0%) | 0 (0.0%) |
| Education Instruction & Library | 7 (24.1%) | 22 (75.9%) |
| Arts, Media & Entertainment | 4 (44.4%) | 5 (55.6%) |
| Health Diagnosing & Treating | 1 (5.3%) | 18 (94.7%) |
| Health Technologists | 1 (100.0%) | 0 (0.0%) |
| Total (Category) | 18 (24.3%) | 56 (75.7%) |
| Total (Overall) | 113 (47.3%) | 126 (52.7%) |
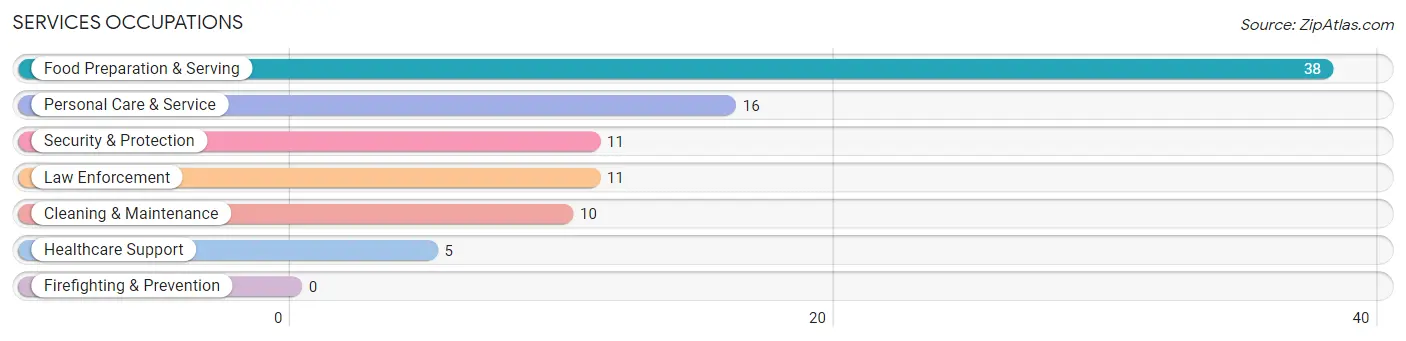
Services Occupations
The most common Services occupations in Barton are Food Preparation & Serving (38 | 15.9%), Personal Care & Service (16 | 6.7%), Security & Protection (11 | 4.6%), Law Enforcement (11 | 4.6%), and Cleaning & Maintenance (10 | 4.2%).
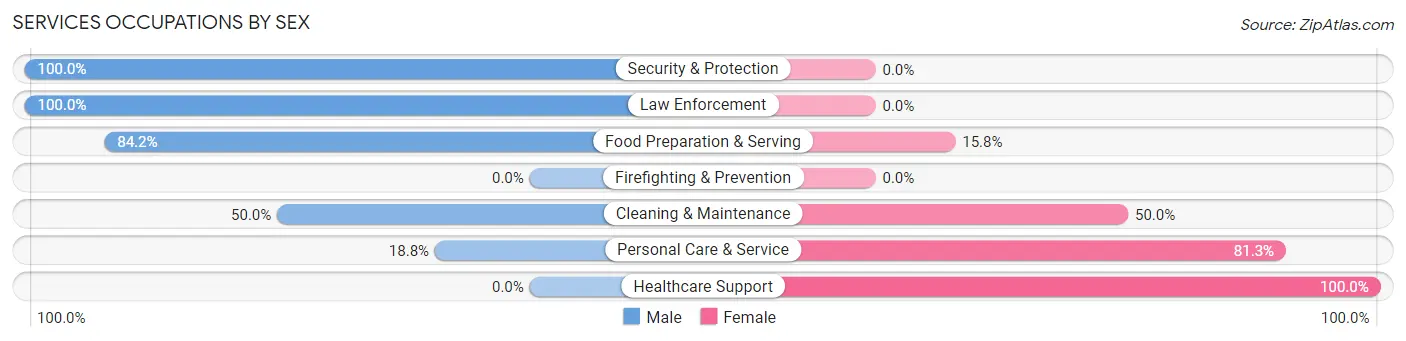
Services Occupations by Sex
Within the Services occupations in Barton, the most male-oriented occupations are Security & Protection (100.0%), Law Enforcement (100.0%), and Food Preparation & Serving (84.2%), while the most female-oriented occupations are Healthcare Support (100.0%), Personal Care & Service (81.2%), and Cleaning & Maintenance (50.0%).
| Occupation | Male | Female |
| Healthcare Support | 0 (0.0%) | 5 (100.0%) |
| Security & Protection | 11 (100.0%) | 0 (0.0%) |
| Firefighting & Prevention | 0 (0.0%) | 0 (0.0%) |
| Law Enforcement | 11 (100.0%) | 0 (0.0%) |
| Food Preparation & Serving | 32 (84.2%) | 6 (15.8%) |
| Cleaning & Maintenance | 5 (50.0%) | 5 (50.0%) |
| Personal Care & Service | 3 (18.8%) | 13 (81.2%) |
| Total (Category) | 51 (63.7%) | 29 (36.2%) |
| Total (Overall) | 113 (47.3%) | 126 (52.7%) |
Sales and Office Occupations
The most common Sales and Office occupations in Barton are Office & Administration (25 | 10.5%), and Sales & Related (8 | 3.4%).
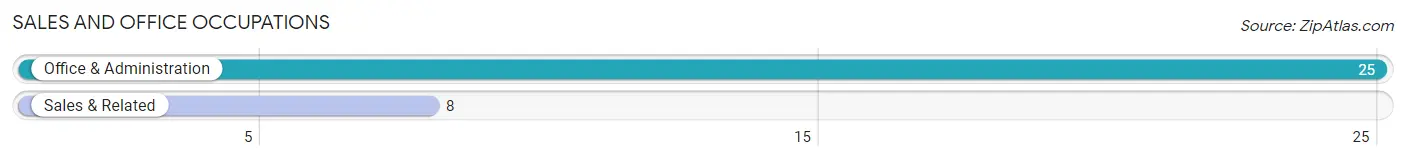
Sales and Office Occupations by Sex
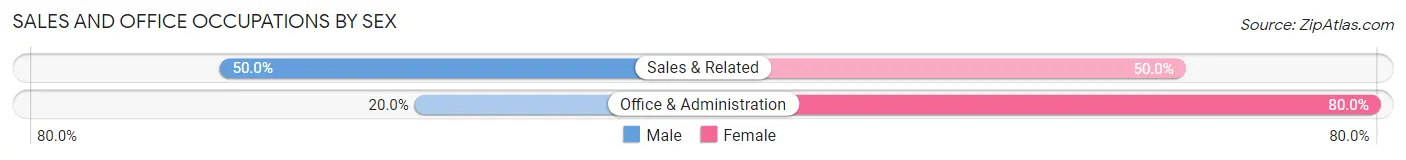
| Occupation | Male | Female |
| Sales & Related | 4 (50.0%) | 4 (50.0%) |
| Office & Administration | 5 (20.0%) | 20 (80.0%) |
| Total (Category) | 9 (27.3%) | 24 (72.7%) |
| Total (Overall) | 113 (47.3%) | 126 (52.7%) |
Natural Resources, Construction and Maintenance Occupations
The most common Natural Resources, Construction and Maintenance occupations in Barton are , and Construction & Extraction (22 | 9.2%).
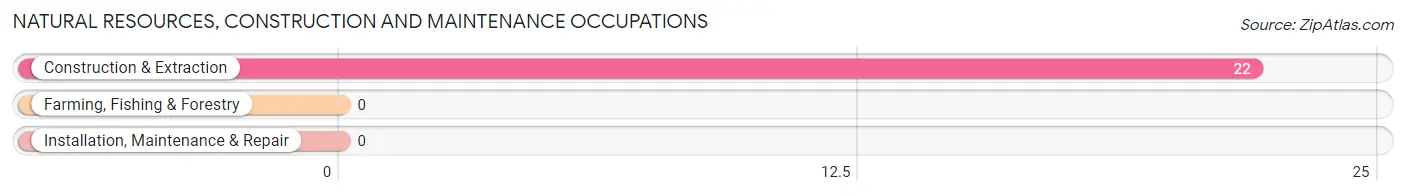
Natural Resources, Construction and Maintenance Occupations by Sex
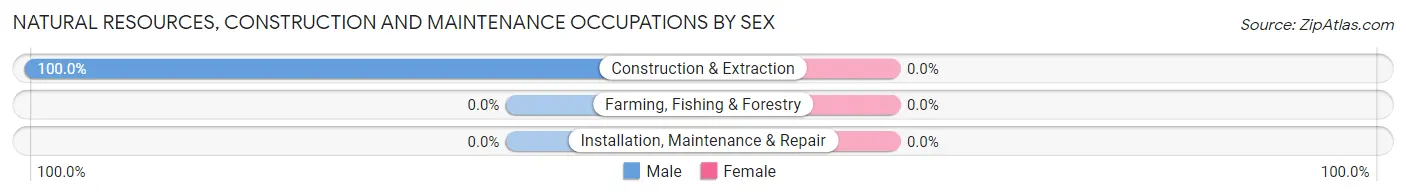
| Occupation | Male | Female |
| Farming, Fishing & Forestry | 0 (0.0%) | 0 (0.0%) |
| Construction & Extraction | 22 (100.0%) | 0 (0.0%) |
| Installation, Maintenance & Repair | 0 (0.0%) | 0 (0.0%) |
| Total (Category) | 22 (100.0%) | 0 (0.0%) |
| Total (Overall) | 113 (47.3%) | 126 (52.7%) |
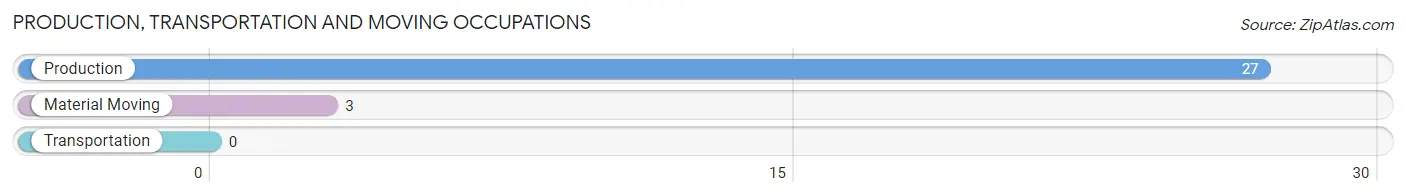
Production, Transportation and Moving Occupations
The most common Production, Transportation and Moving occupations in Barton are Production (27 | 11.3%), and Material Moving (3 | 1.3%).
Production, Transportation and Moving Occupations by Sex
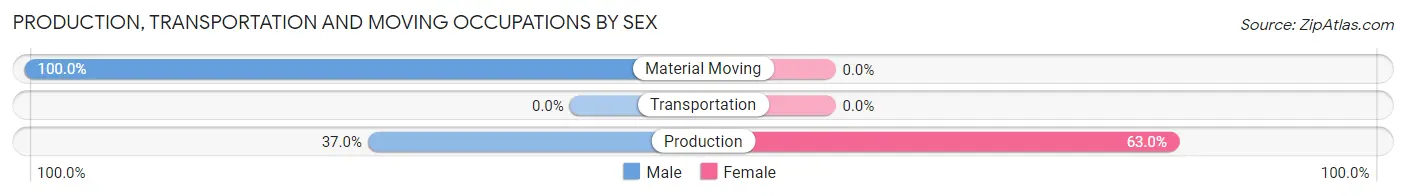
| Occupation | Male | Female |
| Production | 10 (37.0%) | 17 (63.0%) |
| Transportation | 0 (0.0%) | 0 (0.0%) |
| Material Moving | 3 (100.0%) | 0 (0.0%) |
| Total (Category) | 13 (43.3%) | 17 (56.7%) |
| Total (Overall) | 113 (47.3%) | 126 (52.7%) |
Employment Industries by Sex in Barton
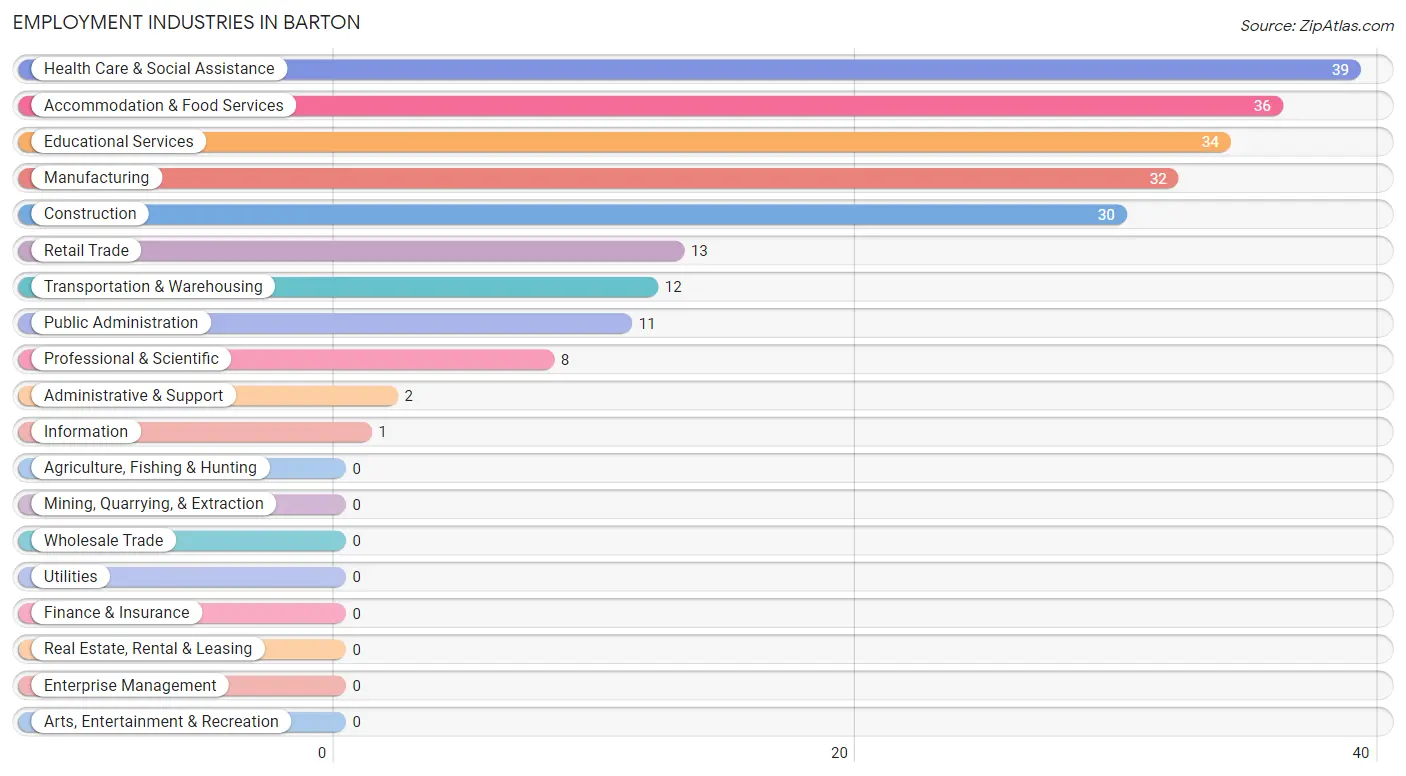
Employment Industries in Barton
The major employment industries in Barton include Health Care & Social Assistance (39 | 16.3%), Accommodation & Food Services (36 | 15.1%), Educational Services (34 | 14.2%), Manufacturing (32 | 13.4%), and Construction (30 | 12.6%).
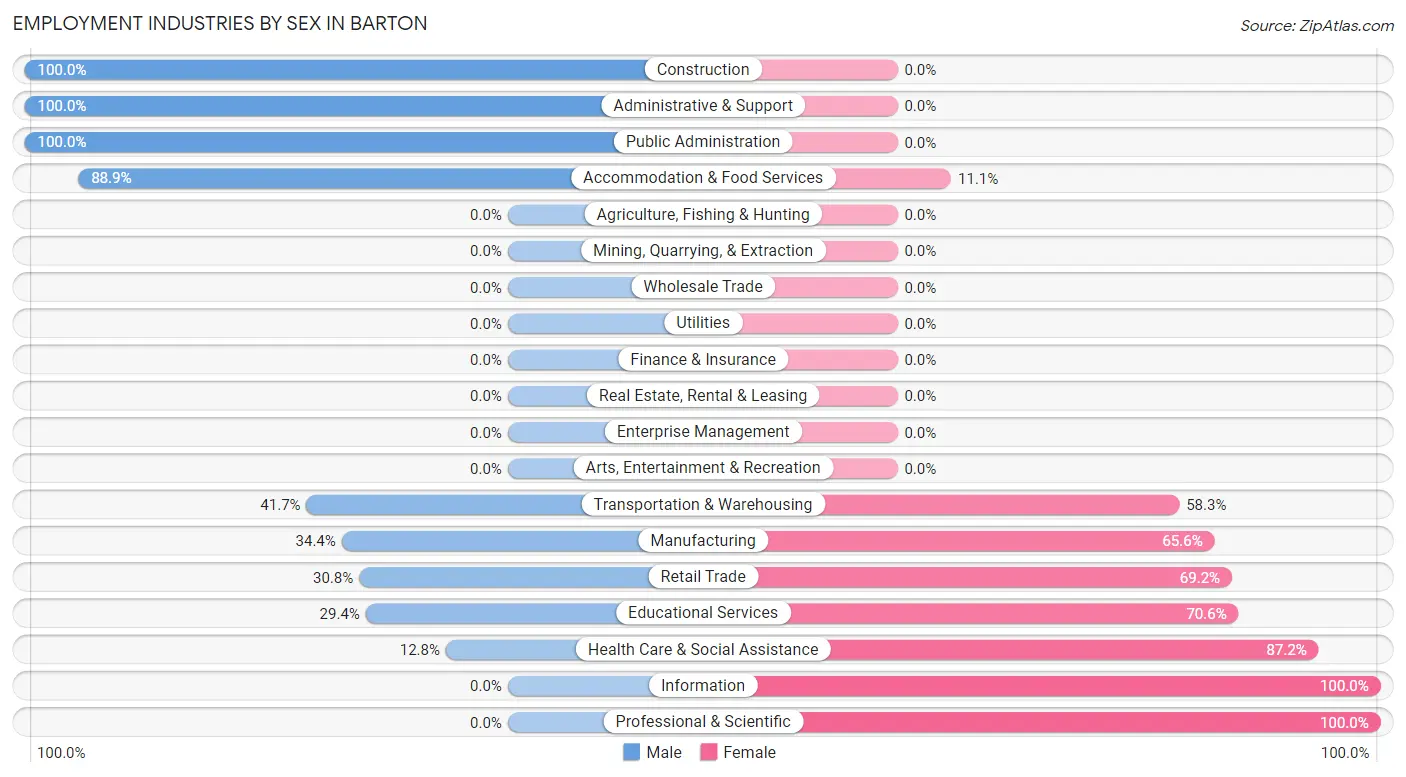
Employment Industries by Sex in Barton
The Barton industries that see more men than women are Construction (100.0%), Administrative & Support (100.0%), and Public Administration (100.0%), whereas the industries that tend to have a higher number of women are Information (100.0%), Professional & Scientific (100.0%), and Health Care & Social Assistance (87.2%).
| Industry | Male | Female |
| Agriculture, Fishing & Hunting | 0 (0.0%) | 0 (0.0%) |
| Mining, Quarrying, & Extraction | 0 (0.0%) | 0 (0.0%) |
| Construction | 30 (100.0%) | 0 (0.0%) |
| Manufacturing | 11 (34.4%) | 21 (65.6%) |
| Wholesale Trade | 0 (0.0%) | 0 (0.0%) |
| Retail Trade | 4 (30.8%) | 9 (69.2%) |
| Transportation & Warehousing | 5 (41.7%) | 7 (58.3%) |
| Utilities | 0 (0.0%) | 0 (0.0%) |
| Information | 0 (0.0%) | 1 (100.0%) |
| Finance & Insurance | 0 (0.0%) | 0 (0.0%) |
| Real Estate, Rental & Leasing | 0 (0.0%) | 0 (0.0%) |
| Professional & Scientific | 0 (0.0%) | 8 (100.0%) |
| Enterprise Management | 0 (0.0%) | 0 (0.0%) |
| Administrative & Support | 2 (100.0%) | 0 (0.0%) |
| Educational Services | 10 (29.4%) | 24 (70.6%) |
| Health Care & Social Assistance | 5 (12.8%) | 34 (87.2%) |
| Arts, Entertainment & Recreation | 0 (0.0%) | 0 (0.0%) |
| Accommodation & Food Services | 32 (88.9%) | 4 (11.1%) |
| Public Administration | 11 (100.0%) | 0 (0.0%) |
| Total | 113 (47.3%) | 126 (52.7%) |
Education in Barton
School Enrollment in Barton
The most common levels of schooling among the 122 students in Barton are middle school (36 | 29.5%), high school (32 | 26.2%), and elementary school (26 | 21.3%).
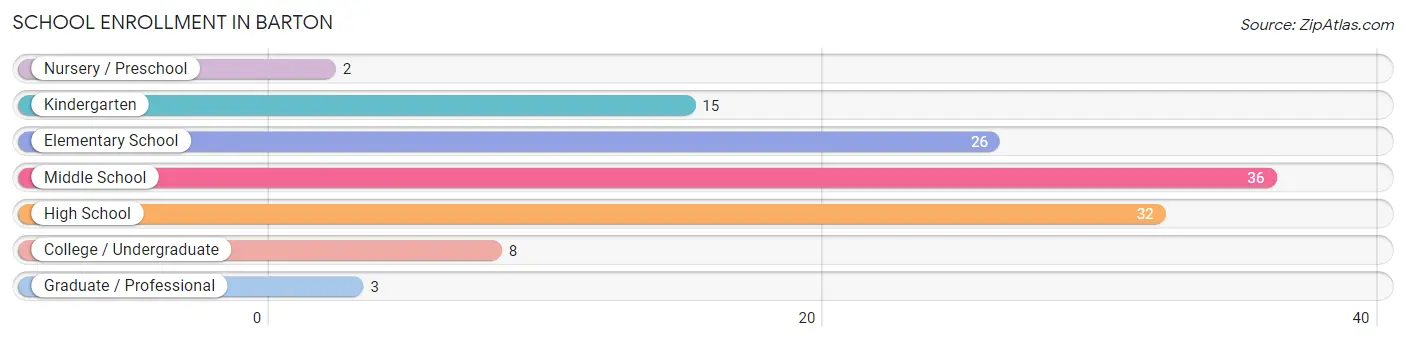
| School Level | # Students | % Students |
| Nursery / Preschool | 2 | 1.6% |
| Kindergarten | 15 | 12.3% |
| Elementary School | 26 | 21.3% |
| Middle School | 36 | 29.5% |
| High School | 32 | 26.2% |
| College / Undergraduate | 8 | 6.6% |
| Graduate / Professional | 3 | 2.5% |
| Total | 122 | 100.0% |
School Enrollment by Age by Funding Source in Barton
Out of a total of 122 students who are enrolled in schools in Barton, 17 (13.9%) attend a private institution, while the remaining 105 (86.1%) are enrolled in public schools. The age group of 35 years and over has the highest likelihood of being enrolled in private schools, with 4 (40.0% in the age bracket) enrolled. Conversely, the age group of 15 to 17 year olds has the lowest likelihood of being enrolled in a private school, with 16 (100.0% in the age bracket) attending a public institution.
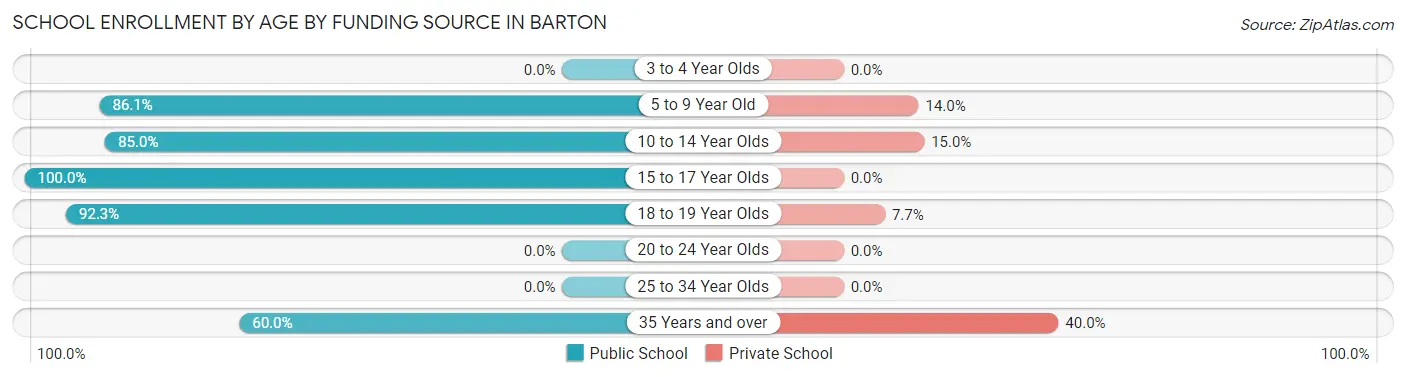
| Age Bracket | Public School | Private School |
| 3 to 4 Year Olds | 0 (0.0%) | 0 (0.0%) |
| 5 to 9 Year Old | 37 (86.1%) | 6 (14.0%) |
| 10 to 14 Year Olds | 34 (85.0%) | 6 (15.0%) |
| 15 to 17 Year Olds | 16 (100.0%) | 0 (0.0%) |
| 18 to 19 Year Olds | 12 (92.3%) | 1 (7.7%) |
| 20 to 24 Year Olds | 0 (0.0%) | 0 (0.0%) |
| 25 to 34 Year Olds | 0 (0.0%) | 0 (0.0%) |
| 35 Years and over | 6 (60.0%) | 4 (40.0%) |
| Total | 105 (86.1%) | 17 (13.9%) |
Educational Attainment by Field of Study in Barton
Business (20 | 19.1%), education (18 | 17.1%), arts & humanities (17 | 16.2%), social sciences (13 | 12.4%), and computers & mathematics (7 | 6.7%) are the most common fields of study among 105 individuals in Barton who have obtained a bachelor's degree or higher.
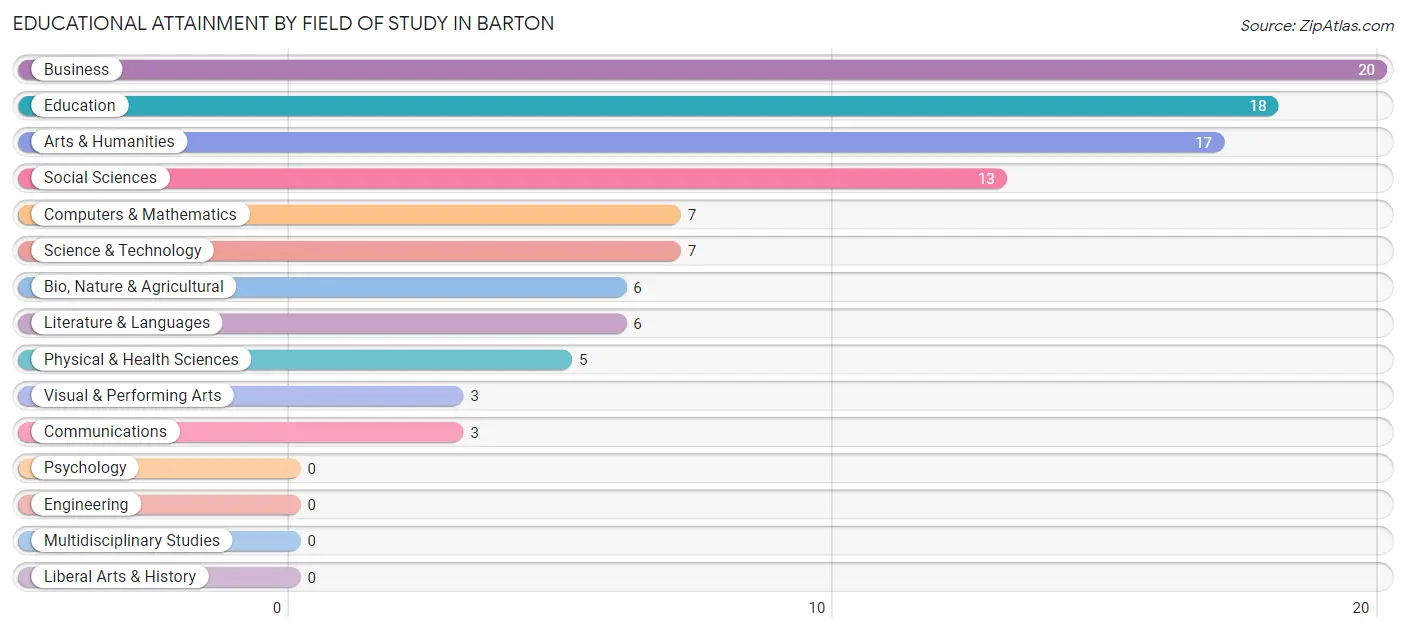
| Field of Study | # Graduates | % Graduates |
| Computers & Mathematics | 7 | 6.7% |
| Bio, Nature & Agricultural | 6 | 5.7% |
| Physical & Health Sciences | 5 | 4.8% |
| Psychology | 0 | 0.0% |
| Social Sciences | 13 | 12.4% |
| Engineering | 0 | 0.0% |
| Multidisciplinary Studies | 0 | 0.0% |
| Science & Technology | 7 | 6.7% |
| Business | 20 | 19.1% |
| Education | 18 | 17.1% |
| Literature & Languages | 6 | 5.7% |
| Liberal Arts & History | 0 | 0.0% |
| Visual & Performing Arts | 3 | 2.9% |
| Communications | 3 | 2.9% |
| Arts & Humanities | 17 | 16.2% |
| Total | 105 | 100.0% |
Transportation & Commute in Barton
Vehicle Availability by Sex in Barton
The most prevalent vehicle ownership categories in Barton are males with 2 vehicles (73, accounting for 64.6%) and females with 2 vehicles (75, making up 57.9%).
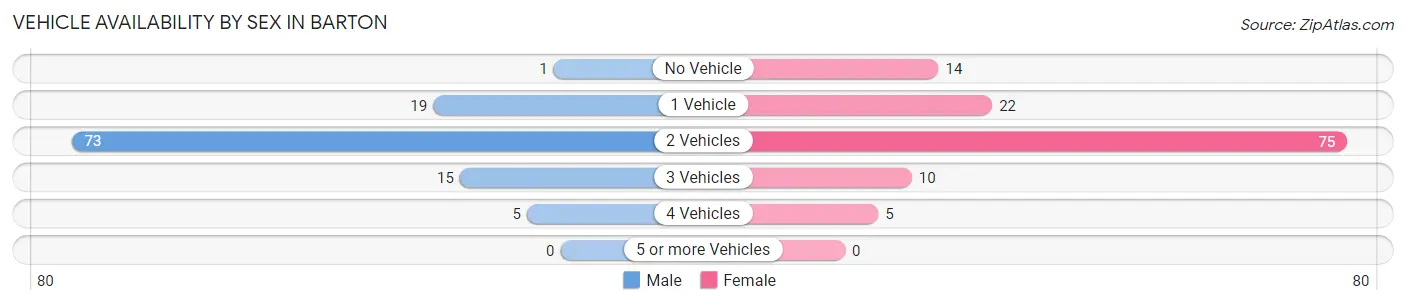
| Vehicles Available | Male | Female |
| No Vehicle | 1 (0.9%) | 14 (11.1%) |
| 1 Vehicle | 19 (16.8%) | 22 (17.5%) |
| 2 Vehicles | 73 (64.6%) | 75 (59.5%) |
| 3 Vehicles | 15 (13.3%) | 10 (7.9%) |
| 4 Vehicles | 5 (4.4%) | 5 (4.0%) |
| 5 or more Vehicles | 0 (0.0%) | 0 (0.0%) |
| Total | 113 (100.0%) | 126 (100.0%) |
Commute Time in Barton
The most frequently occuring commute durations in Barton are 20 to 24 minutes (42 commuters, 20.7%), 30 to 34 minutes (33 commuters, 16.3%), and 5 to 9 minutes (24 commuters, 11.8%).
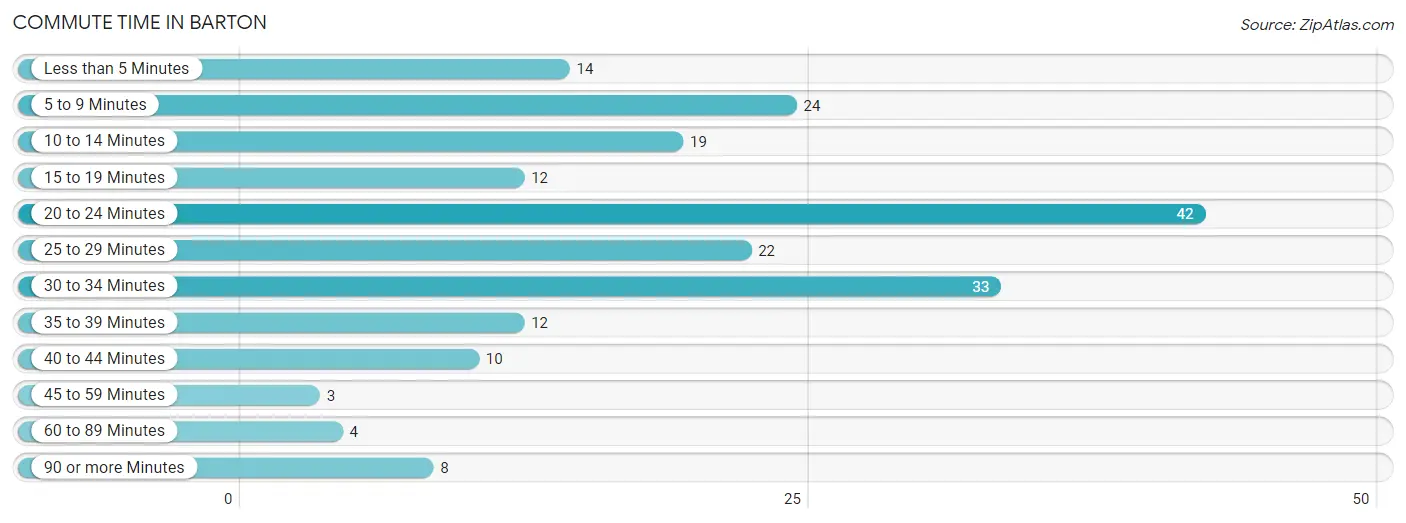
| Commute Time | # Commuters | % Commuters |
| Less than 5 Minutes | 14 | 6.9% |
| 5 to 9 Minutes | 24 | 11.8% |
| 10 to 14 Minutes | 19 | 9.4% |
| 15 to 19 Minutes | 12 | 5.9% |
| 20 to 24 Minutes | 42 | 20.7% |
| 25 to 29 Minutes | 22 | 10.8% |
| 30 to 34 Minutes | 33 | 16.3% |
| 35 to 39 Minutes | 12 | 5.9% |
| 40 to 44 Minutes | 10 | 4.9% |
| 45 to 59 Minutes | 3 | 1.5% |
| 60 to 89 Minutes | 4 | 2.0% |
| 90 or more Minutes | 8 | 3.9% |
Commute Time by Sex in Barton
The most common commute times in Barton are 20 to 24 minutes (26 commuters, 25.7%) for males and 5 to 9 minutes (24 commuters, 23.5%) for females.
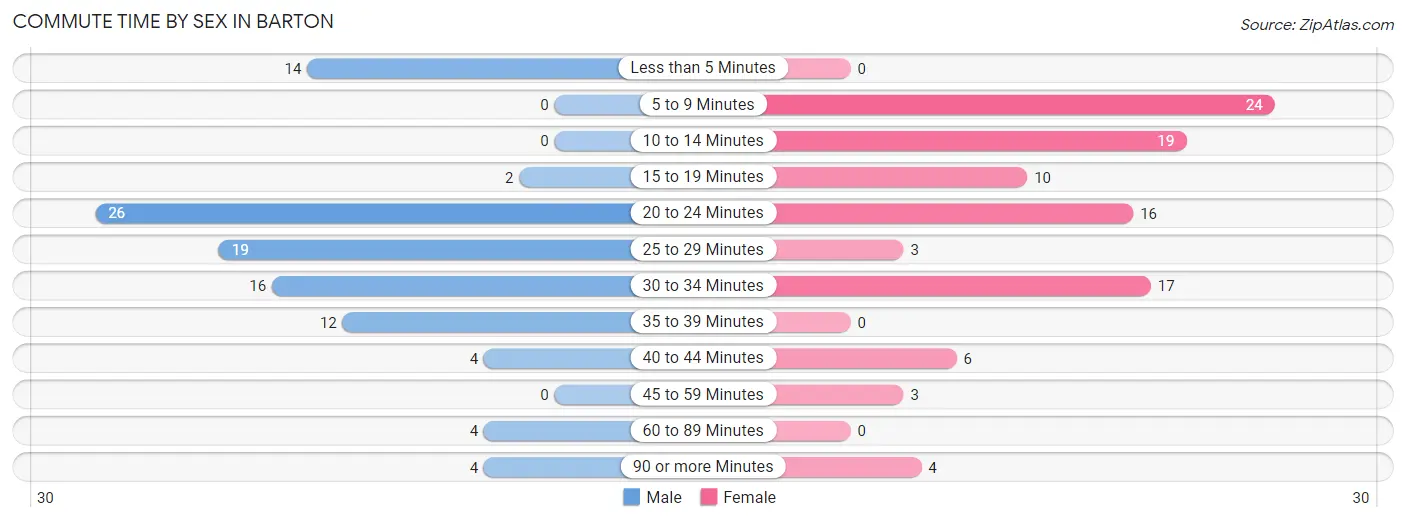
| Commute Time | Male | Female |
| Less than 5 Minutes | 14 (13.9%) | 0 (0.0%) |
| 5 to 9 Minutes | 0 (0.0%) | 24 (23.5%) |
| 10 to 14 Minutes | 0 (0.0%) | 19 (18.6%) |
| 15 to 19 Minutes | 2 (2.0%) | 10 (9.8%) |
| 20 to 24 Minutes | 26 (25.7%) | 16 (15.7%) |
| 25 to 29 Minutes | 19 (18.8%) | 3 (2.9%) |
| 30 to 34 Minutes | 16 (15.8%) | 17 (16.7%) |
| 35 to 39 Minutes | 12 (11.9%) | 0 (0.0%) |
| 40 to 44 Minutes | 4 (4.0%) | 6 (5.9%) |
| 45 to 59 Minutes | 0 (0.0%) | 3 (2.9%) |
| 60 to 89 Minutes | 4 (4.0%) | 0 (0.0%) |
| 90 or more Minutes | 4 (4.0%) | 4 (3.9%) |
Time of Departure to Work by Sex in Barton
The most frequent times of departure to work in Barton are 8:00 AM to 8:29 AM (37, 36.6%) for males and 7:30 AM to 7:59 AM (29, 28.4%) for females.
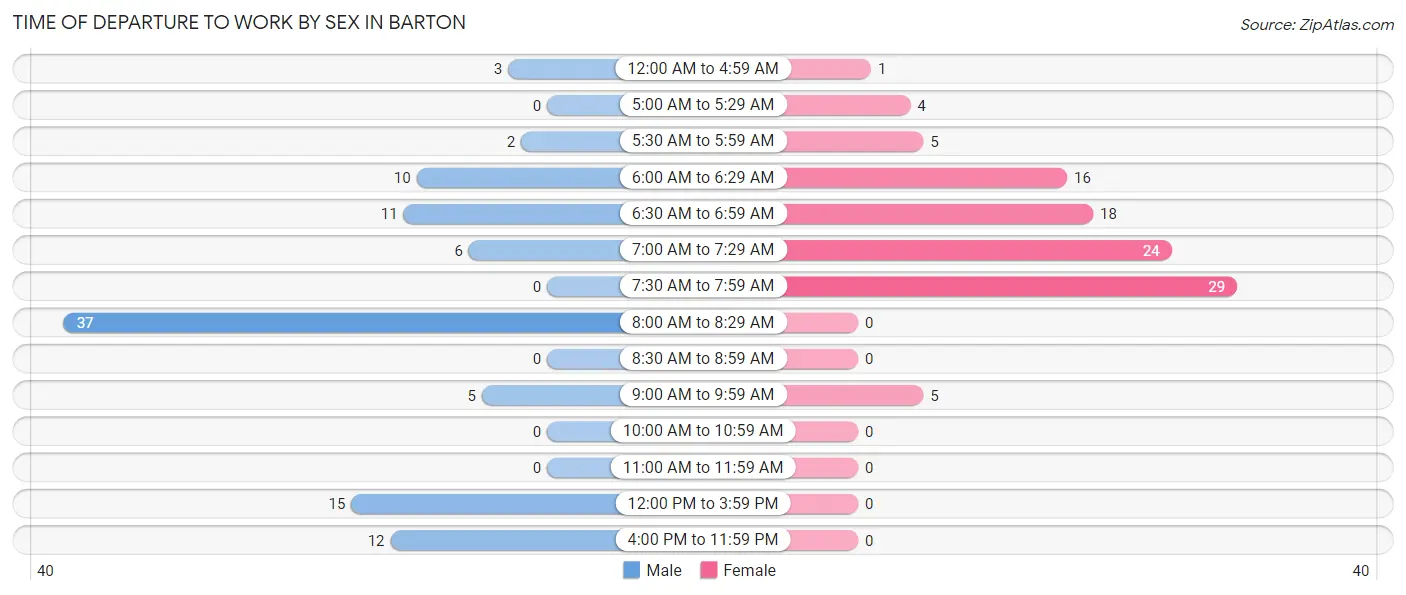
| Time of Departure | Male | Female |
| 12:00 AM to 4:59 AM | 3 (3.0%) | 1 (1.0%) |
| 5:00 AM to 5:29 AM | 0 (0.0%) | 4 (3.9%) |
| 5:30 AM to 5:59 AM | 2 (2.0%) | 5 (4.9%) |
| 6:00 AM to 6:29 AM | 10 (9.9%) | 16 (15.7%) |
| 6:30 AM to 6:59 AM | 11 (10.9%) | 18 (17.6%) |
| 7:00 AM to 7:29 AM | 6 (5.9%) | 24 (23.5%) |
| 7:30 AM to 7:59 AM | 0 (0.0%) | 29 (28.4%) |
| 8:00 AM to 8:29 AM | 37 (36.6%) | 0 (0.0%) |
| 8:30 AM to 8:59 AM | 0 (0.0%) | 0 (0.0%) |
| 9:00 AM to 9:59 AM | 5 (5.0%) | 5 (4.9%) |
| 10:00 AM to 10:59 AM | 0 (0.0%) | 0 (0.0%) |
| 11:00 AM to 11:59 AM | 0 (0.0%) | 0 (0.0%) |
| 12:00 PM to 3:59 PM | 15 (14.8%) | 0 (0.0%) |
| 4:00 PM to 11:59 PM | 12 (11.9%) | 0 (0.0%) |
| Total | 101 (100.0%) | 102 (100.0%) |
Housing Occupancy in Barton
Occupancy by Ownership in Barton
Of the total 311 dwellings in Barton, owner-occupied units account for 142 (45.7%), while renter-occupied units make up 169 (54.3%).
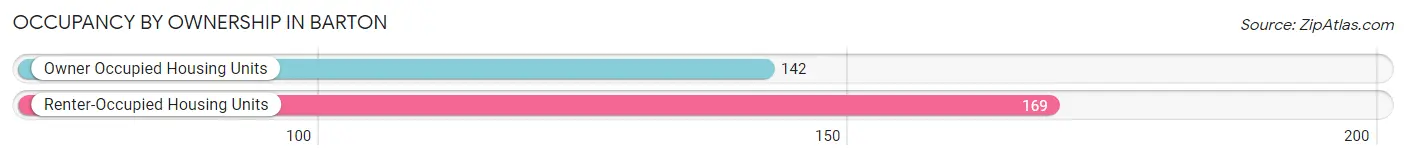
| Occupancy | # Housing Units | % Housing Units |
| Owner Occupied Housing Units | 142 | 45.7% |
| Renter-Occupied Housing Units | 169 | 54.3% |
| Total Occupied Housing Units | 311 | 100.0% |
Occupancy by Household Size in Barton
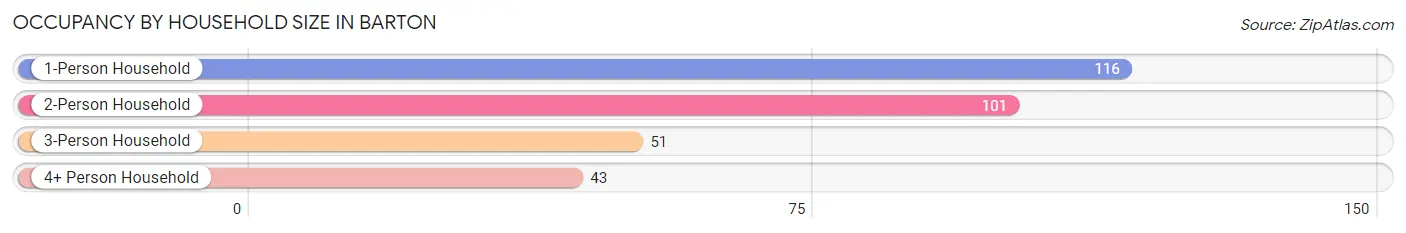
| Household Size | # Housing Units | % Housing Units |
| 1-Person Household | 116 | 37.3% |
| 2-Person Household | 101 | 32.5% |
| 3-Person Household | 51 | 16.4% |
| 4+ Person Household | 43 | 13.8% |
| Total Housing Units | 311 | 100.0% |
Occupancy by Ownership by Household Size in Barton
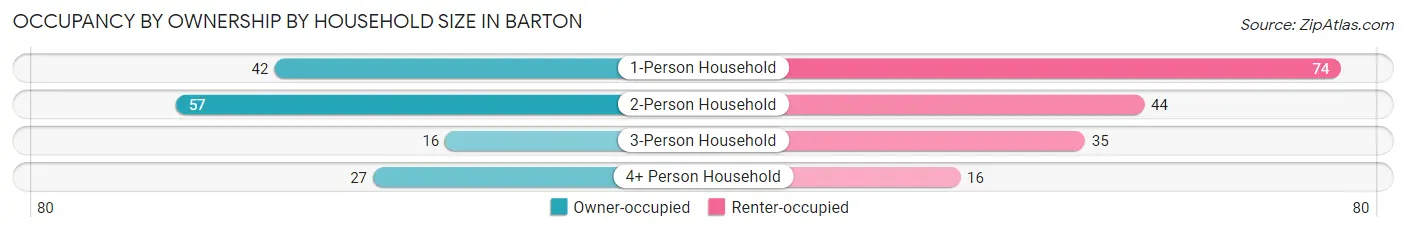
| Household Size | Owner-occupied | Renter-occupied |
| 1-Person Household | 42 (36.2%) | 74 (63.8%) |
| 2-Person Household | 57 (56.4%) | 44 (43.6%) |
| 3-Person Household | 16 (31.4%) | 35 (68.6%) |
| 4+ Person Household | 27 (62.8%) | 16 (37.2%) |
| Total Housing Units | 142 (45.7%) | 169 (54.3%) |
Occupancy by Educational Attainment in Barton
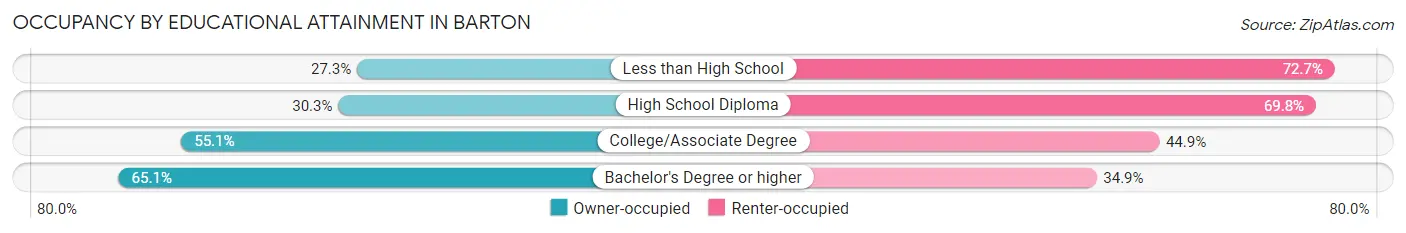
| Household Size | Owner-occupied | Renter-occupied |
| Less than High School | 6 (27.3%) | 16 (72.7%) |
| High School Diploma | 36 (30.2%) | 83 (69.8%) |
| College/Associate Degree | 59 (55.1%) | 48 (44.9%) |
| Bachelor's Degree or higher | 41 (65.1%) | 22 (34.9%) |
Occupancy by Age of Householder in Barton
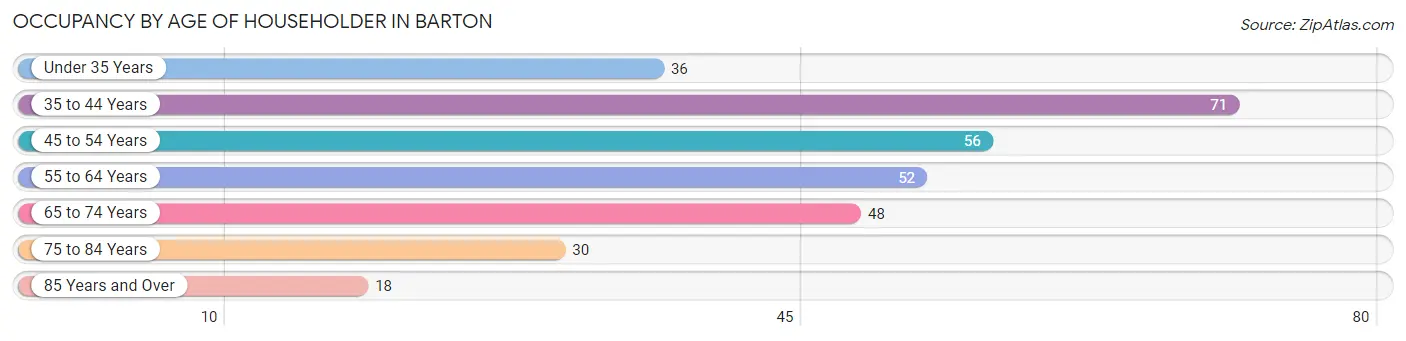
| Age Bracket | # Households | % Households |
| Under 35 Years | 36 | 11.6% |
| 35 to 44 Years | 71 | 22.8% |
| 45 to 54 Years | 56 | 18.0% |
| 55 to 64 Years | 52 | 16.7% |
| 65 to 74 Years | 48 | 15.4% |
| 75 to 84 Years | 30 | 9.7% |
| 85 Years and Over | 18 | 5.8% |
| Total | 311 | 100.0% |
Housing Finances in Barton
Median Income by Occupancy in Barton
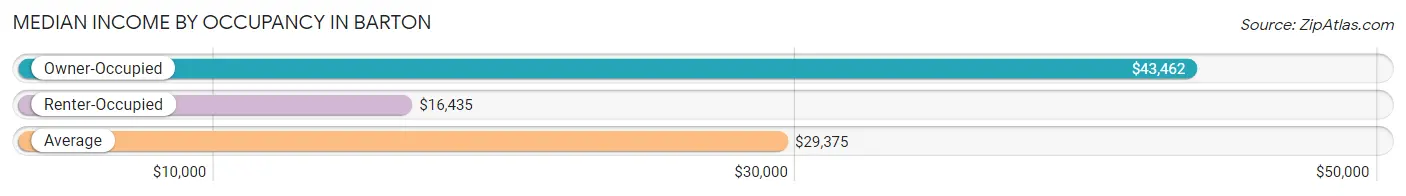
| Occupancy Type | # Households | Median Income |
| Owner-Occupied | 142 (45.7%) | $43,462 |
| Renter-Occupied | 169 (54.3%) | $16,435 |
| Average | 311 (100.0%) | $29,375 |
Occupancy by Householder Income Bracket in Barton
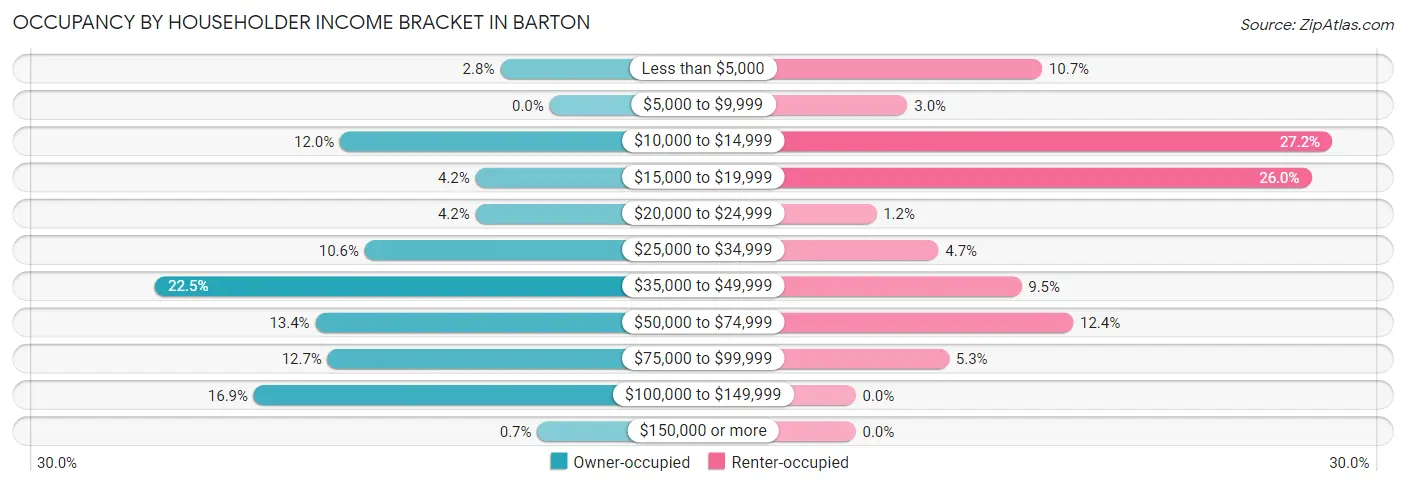
| Income Bracket | Owner-occupied | Renter-occupied |
| Less than $5,000 | 4 (2.8%) | 18 (10.6%) |
| $5,000 to $9,999 | 0 (0.0%) | 5 (3.0%) |
| $10,000 to $14,999 | 17 (12.0%) | 46 (27.2%) |
| $15,000 to $19,999 | 6 (4.2%) | 44 (26.0%) |
| $20,000 to $24,999 | 6 (4.2%) | 2 (1.2%) |
| $25,000 to $34,999 | 15 (10.6%) | 8 (4.7%) |
| $35,000 to $49,999 | 32 (22.5%) | 16 (9.5%) |
| $50,000 to $74,999 | 19 (13.4%) | 21 (12.4%) |
| $75,000 to $99,999 | 18 (12.7%) | 9 (5.3%) |
| $100,000 to $149,999 | 24 (16.9%) | 0 (0.0%) |
| $150,000 or more | 1 (0.7%) | 0 (0.0%) |
| Total | 142 (100.0%) | 169 (100.0%) |
Monthly Housing Cost Tiers in Barton
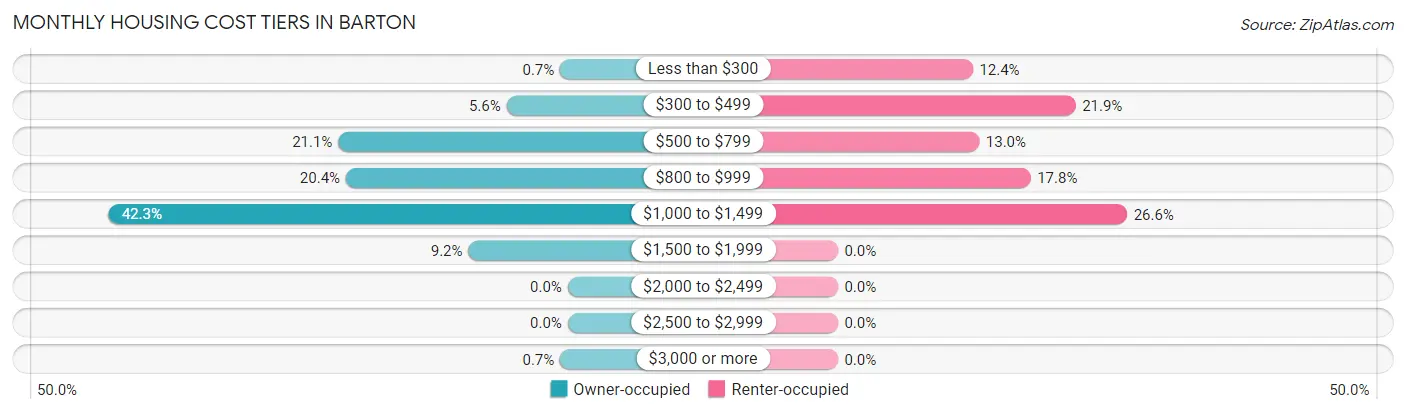
| Monthly Cost | Owner-occupied | Renter-occupied |
| Less than $300 | 1 (0.7%) | 21 (12.4%) |
| $300 to $499 | 8 (5.6%) | 37 (21.9%) |
| $500 to $799 | 30 (21.1%) | 22 (13.0%) |
| $800 to $999 | 29 (20.4%) | 30 (17.7%) |
| $1,000 to $1,499 | 60 (42.2%) | 45 (26.6%) |
| $1,500 to $1,999 | 13 (9.1%) | 0 (0.0%) |
| $2,000 to $2,499 | 0 (0.0%) | 0 (0.0%) |
| $2,500 to $2,999 | 0 (0.0%) | 0 (0.0%) |
| $3,000 or more | 1 (0.7%) | 0 (0.0%) |
| Total | 142 (100.0%) | 169 (100.0%) |
Physical Housing Characteristics in Barton
Housing Structures in Barton
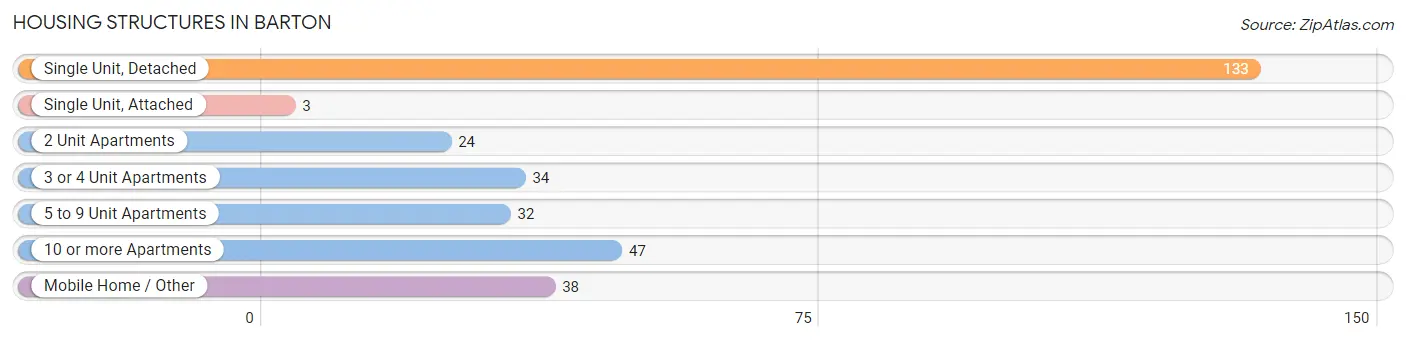
| Structure Type | # Housing Units | % Housing Units |
| Single Unit, Detached | 133 | 42.8% |
| Single Unit, Attached | 3 | 1.0% |
| 2 Unit Apartments | 24 | 7.7% |
| 3 or 4 Unit Apartments | 34 | 10.9% |
| 5 to 9 Unit Apartments | 32 | 10.3% |
| 10 or more Apartments | 47 | 15.1% |
| Mobile Home / Other | 38 | 12.2% |
| Total | 311 | 100.0% |
Housing Structures by Occupancy in Barton
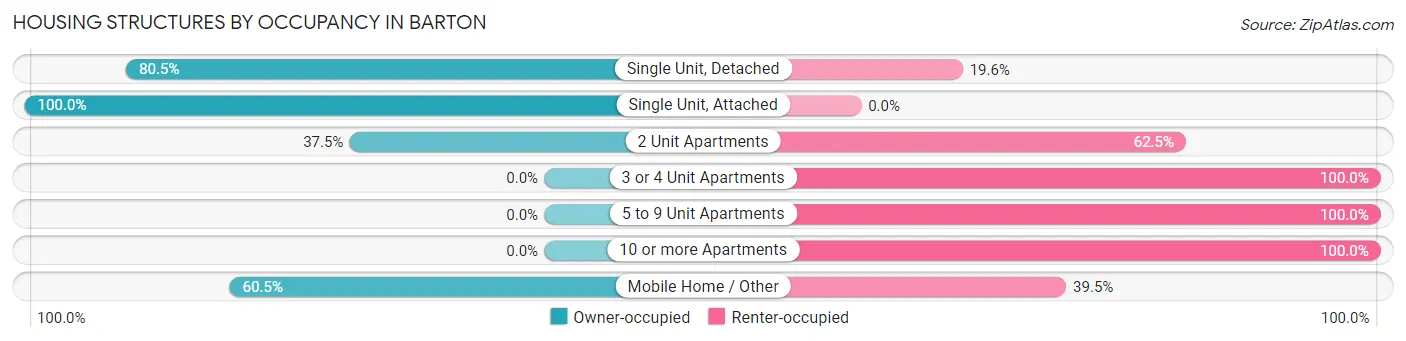
| Structure Type | Owner-occupied | Renter-occupied |
| Single Unit, Detached | 107 (80.4%) | 26 (19.6%) |
| Single Unit, Attached | 3 (100.0%) | 0 (0.0%) |
| 2 Unit Apartments | 9 (37.5%) | 15 (62.5%) |
| 3 or 4 Unit Apartments | 0 (0.0%) | 34 (100.0%) |
| 5 to 9 Unit Apartments | 0 (0.0%) | 32 (100.0%) |
| 10 or more Apartments | 0 (0.0%) | 47 (100.0%) |
| Mobile Home / Other | 23 (60.5%) | 15 (39.5%) |
| Total | 142 (45.7%) | 169 (54.3%) |
Housing Structures by Number of Rooms in Barton
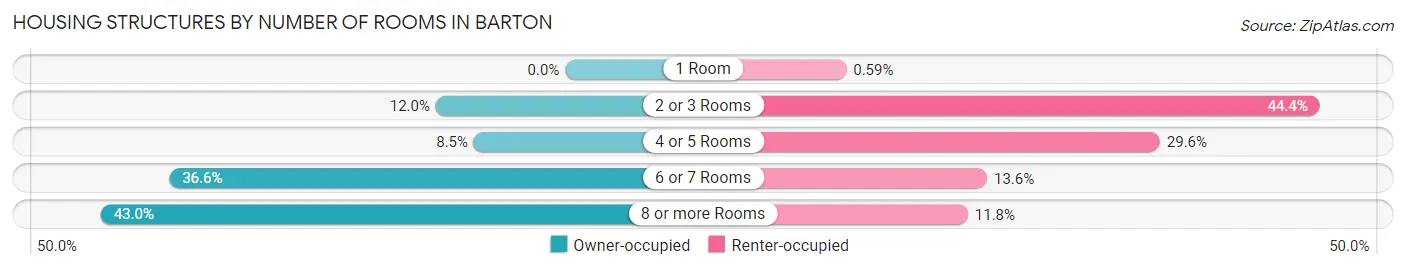
| Number of Rooms | Owner-occupied | Renter-occupied |
| 1 Room | 0 (0.0%) | 1 (0.6%) |
| 2 or 3 Rooms | 17 (12.0%) | 75 (44.4%) |
| 4 or 5 Rooms | 12 (8.5%) | 50 (29.6%) |
| 6 or 7 Rooms | 52 (36.6%) | 23 (13.6%) |
| 8 or more Rooms | 61 (43.0%) | 20 (11.8%) |
| Total | 142 (100.0%) | 169 (100.0%) |
Housing Structure by Heating Type in Barton
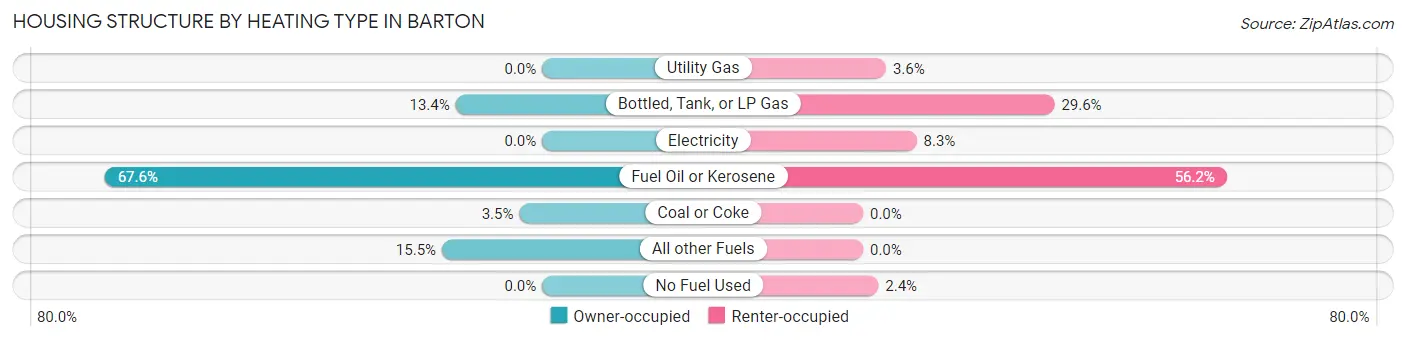
| Heating Type | Owner-occupied | Renter-occupied |
| Utility Gas | 0 (0.0%) | 6 (3.5%) |
| Bottled, Tank, or LP Gas | 19 (13.4%) | 50 (29.6%) |
| Electricity | 0 (0.0%) | 14 (8.3%) |
| Fuel Oil or Kerosene | 96 (67.6%) | 95 (56.2%) |
| Coal or Coke | 5 (3.5%) | 0 (0.0%) |
| All other Fuels | 22 (15.5%) | 0 (0.0%) |
| No Fuel Used | 0 (0.0%) | 4 (2.4%) |
| Total | 142 (100.0%) | 169 (100.0%) |
Household Vehicle Usage in Barton
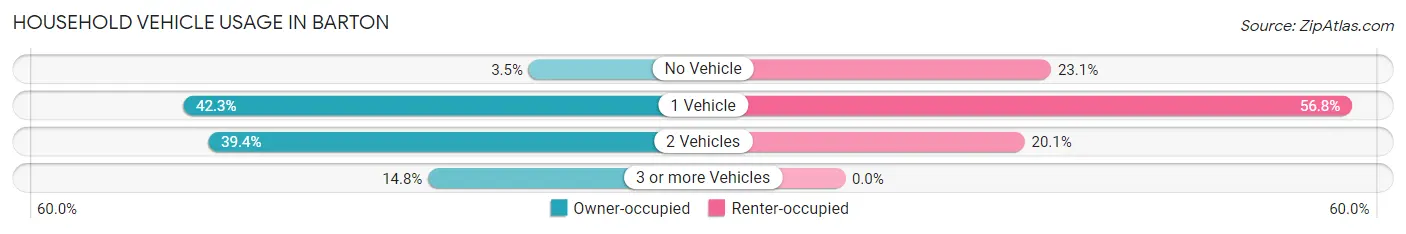
| Vehicles per Household | Owner-occupied | Renter-occupied |
| No Vehicle | 5 (3.5%) | 39 (23.1%) |
| 1 Vehicle | 60 (42.2%) | 96 (56.8%) |
| 2 Vehicles | 56 (39.4%) | 34 (20.1%) |
| 3 or more Vehicles | 21 (14.8%) | 0 (0.0%) |
| Total | 142 (100.0%) | 169 (100.0%) |
Real Estate & Mortgages in Barton
Real Estate and Mortgage Overview in Barton
| Characteristic | Without Mortgage | With Mortgage |
| Housing Units | 66 | 76 |
| Median Property Value | $67,500 | $141,100 |
| Median Household Income | $26,250 | $1 |
| Monthly Housing Costs | $811 | $1 |
| Real Estate Taxes | $3,000 | $0 |
Property Value by Mortgage Status in Barton
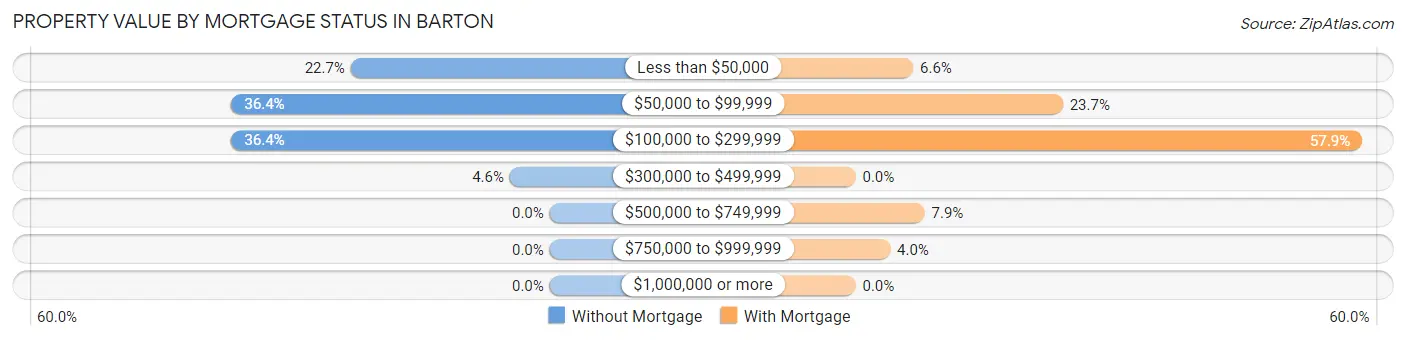
| Property Value | Without Mortgage | With Mortgage |
| Less than $50,000 | 15 (22.7%) | 5 (6.6%) |
| $50,000 to $99,999 | 24 (36.4%) | 18 (23.7%) |
| $100,000 to $299,999 | 24 (36.4%) | 44 (57.9%) |
| $300,000 to $499,999 | 3 (4.5%) | 0 (0.0%) |
| $500,000 to $749,999 | 0 (0.0%) | 6 (7.9%) |
| $750,000 to $999,999 | 0 (0.0%) | 3 (4.0%) |
| $1,000,000 or more | 0 (0.0%) | 0 (0.0%) |
| Total | 66 (100.0%) | 76 (100.0%) |
Household Income by Mortgage Status in Barton
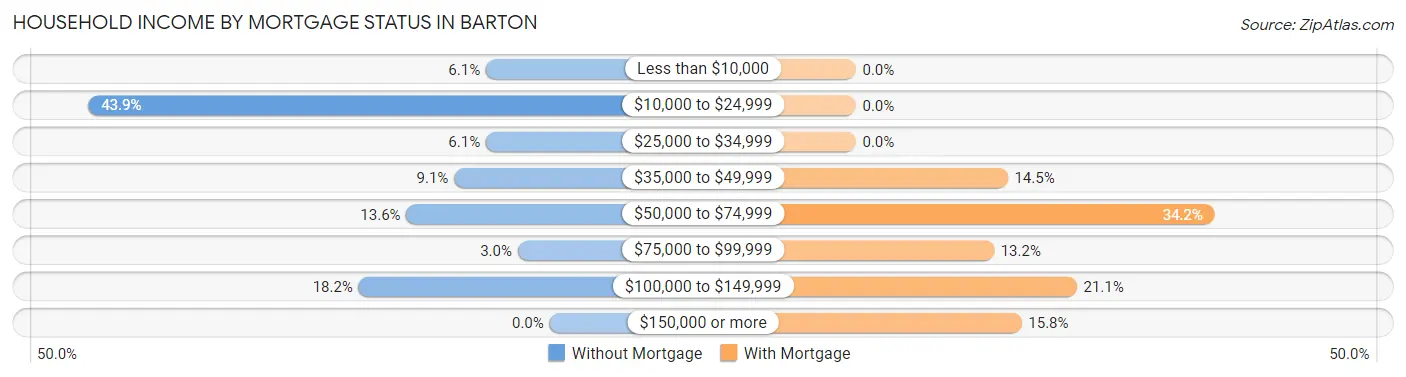
| Household Income | Without Mortgage | With Mortgage |
| Less than $10,000 | 4 (6.1%) | 0 (0.0%) |
| $10,000 to $24,999 | 29 (43.9%) | 0 (0.0%) |
| $25,000 to $34,999 | 4 (6.1%) | 0 (0.0%) |
| $35,000 to $49,999 | 6 (9.1%) | 11 (14.5%) |
| $50,000 to $74,999 | 9 (13.6%) | 26 (34.2%) |
| $75,000 to $99,999 | 2 (3.0%) | 10 (13.2%) |
| $100,000 to $149,999 | 12 (18.2%) | 16 (21.0%) |
| $150,000 or more | 0 (0.0%) | 12 (15.8%) |
| Total | 66 (100.0%) | 76 (100.0%) |
Property Value to Household Income Ratio in Barton
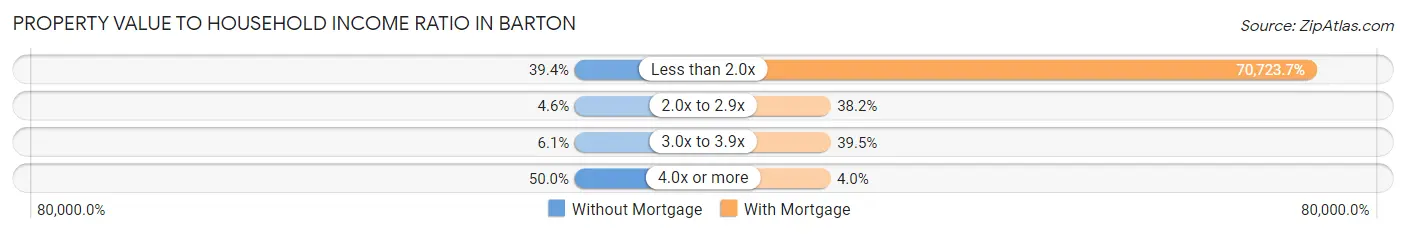
| Value-to-Income Ratio | Without Mortgage | With Mortgage |
| Less than 2.0x | 26 (39.4%) | 53,750 (70,723.7%) |
| 2.0x to 2.9x | 3 (4.5%) | 29 (38.2%) |
| 3.0x to 3.9x | 4 (6.1%) | 30 (39.5%) |
| 4.0x or more | 33 (50.0%) | 3 (4.0%) |
| Total | 66 (100.0%) | 76 (100.0%) |
Real Estate Taxes by Mortgage Status in Barton
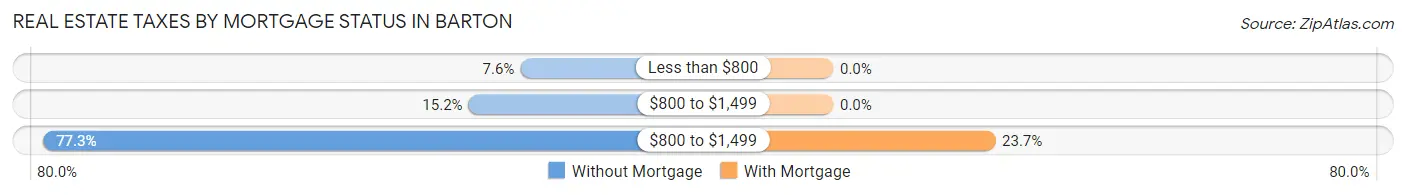
| Property Taxes | Without Mortgage | With Mortgage |
| Less than $800 | 5 (7.6%) | 0 (0.0%) |
| $800 to $1,499 | 10 (15.1%) | 0 (0.0%) |
| $800 to $1,499 | 51 (77.3%) | 18 (23.7%) |
| Total | 66 (100.0%) | 76 (100.0%) |
Health & Disability in Barton
Health Insurance Coverage by Age in Barton
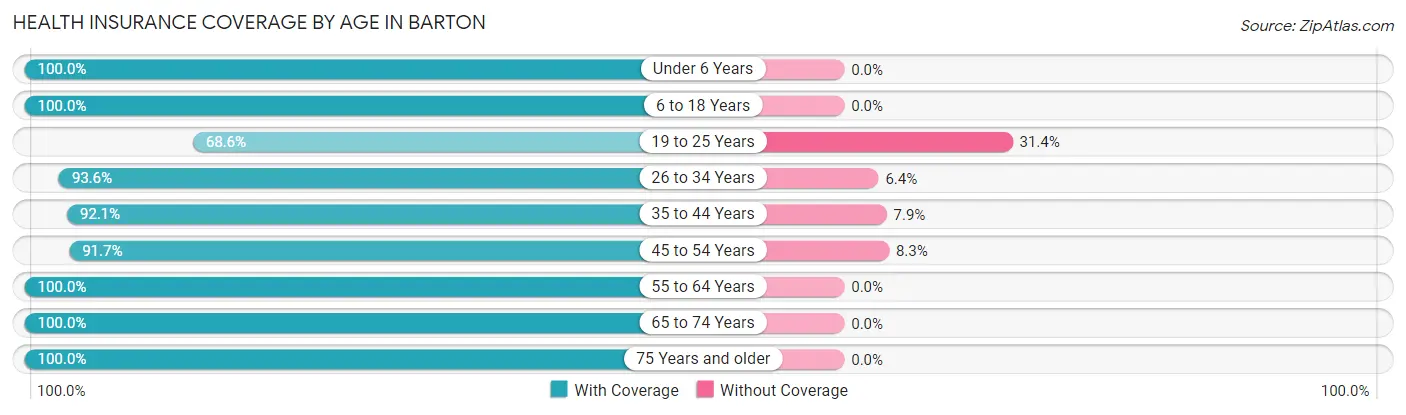
| Age Bracket | With Coverage | Without Coverage |
| Under 6 Years | 37 (100.0%) | 0 (0.0%) |
| 6 to 18 Years | 109 (100.0%) | 0 (0.0%) |
| 19 to 25 Years | 35 (68.6%) | 16 (31.4%) |
| 26 to 34 Years | 44 (93.6%) | 3 (6.4%) |
| 35 to 44 Years | 105 (92.1%) | 9 (7.9%) |
| 45 to 54 Years | 88 (91.7%) | 8 (8.3%) |
| 55 to 64 Years | 94 (100.0%) | 0 (0.0%) |
| 65 to 74 Years | 80 (100.0%) | 0 (0.0%) |
| 75 Years and older | 72 (100.0%) | 0 (0.0%) |
| Total | 664 (94.9%) | 36 (5.1%) |
Health Insurance Coverage by Citizenship Status in Barton
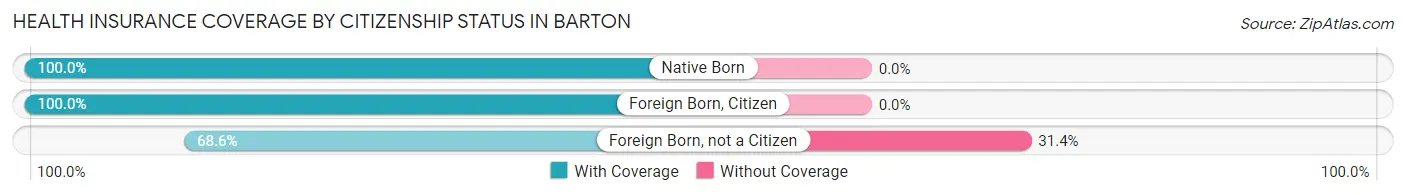
| Citizenship Status | With Coverage | Without Coverage |
| Native Born | 37 (100.0%) | 0 (0.0%) |
| Foreign Born, Citizen | 109 (100.0%) | 0 (0.0%) |
| Foreign Born, not a Citizen | 35 (68.6%) | 16 (31.4%) |
Health Insurance Coverage by Household Income in Barton
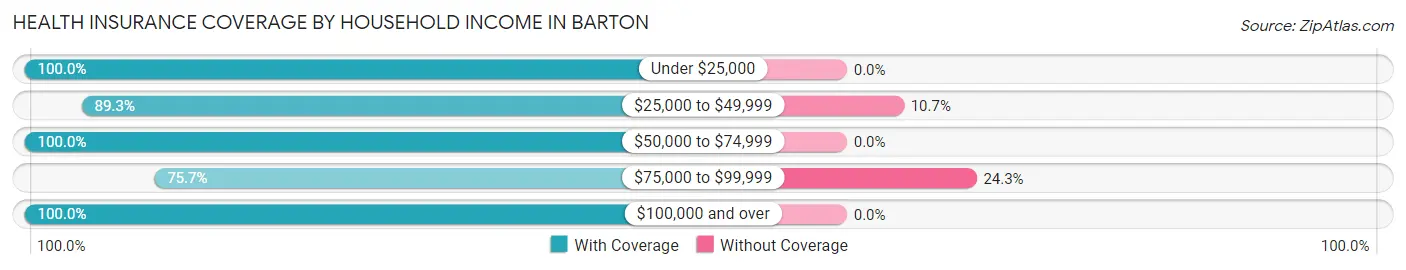
| Household Income | With Coverage | Without Coverage |
| Under $25,000 | 232 (100.0%) | 0 (0.0%) |
| $25,000 to $49,999 | 159 (89.3%) | 19 (10.7%) |
| $50,000 to $74,999 | 79 (100.0%) | 0 (0.0%) |
| $75,000 to $99,999 | 53 (75.7%) | 17 (24.3%) |
| $100,000 and over | 135 (100.0%) | 0 (0.0%) |
Public vs Private Health Insurance Coverage by Age in Barton
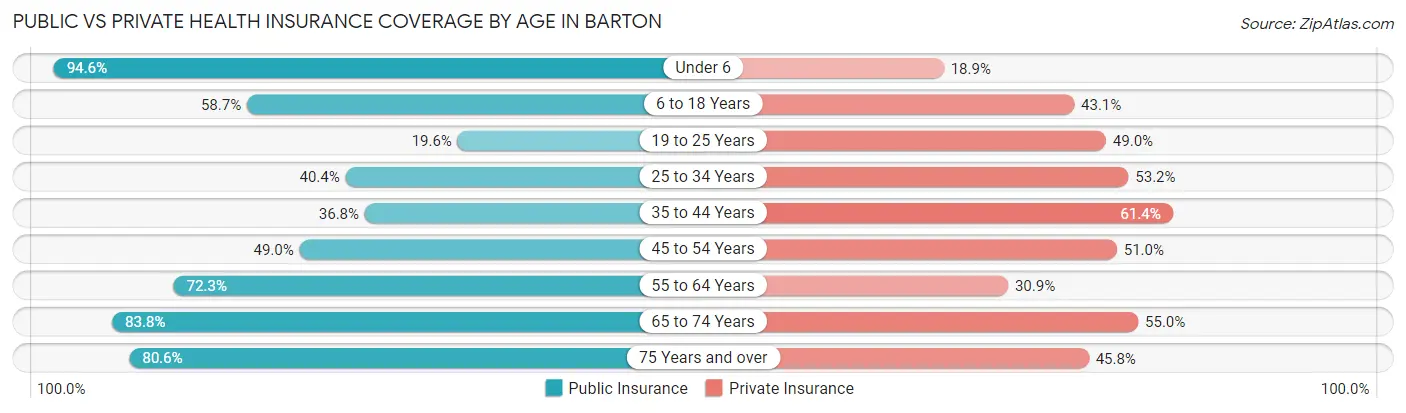
| Age Bracket | Public Insurance | Private Insurance |
| Under 6 | 35 (94.6%) | 7 (18.9%) |
| 6 to 18 Years | 64 (58.7%) | 47 (43.1%) |
| 19 to 25 Years | 10 (19.6%) | 25 (49.0%) |
| 25 to 34 Years | 19 (40.4%) | 25 (53.2%) |
| 35 to 44 Years | 42 (36.8%) | 70 (61.4%) |
| 45 to 54 Years | 47 (49.0%) | 49 (51.0%) |
| 55 to 64 Years | 68 (72.3%) | 29 (30.8%) |
| 65 to 74 Years | 67 (83.8%) | 44 (55.0%) |
| 75 Years and over | 58 (80.6%) | 33 (45.8%) |
| Total | 410 (58.6%) | 329 (47.0%) |
Disability Status by Sex by Age in Barton
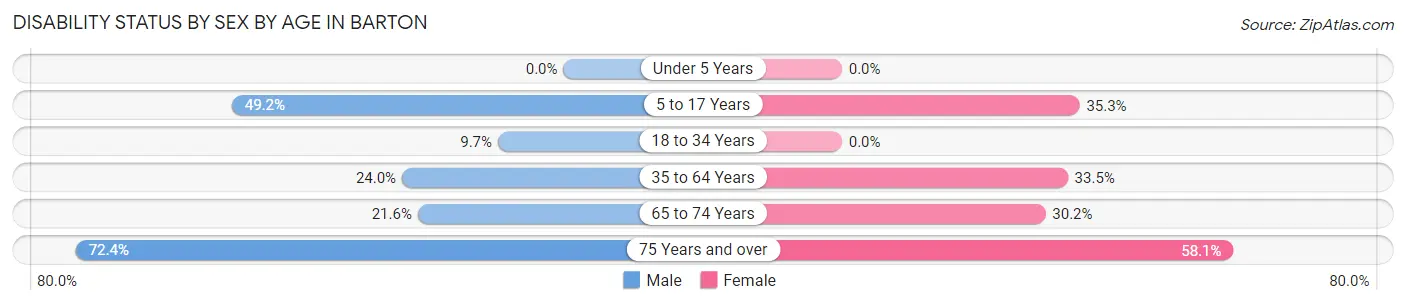
| Age Bracket | Male | Female |
| Under 5 Years | 0 (0.0%) | 0 (0.0%) |
| 5 to 17 Years | 32 (49.2%) | 12 (35.3%) |
| 18 to 34 Years | 7 (9.7%) | 0 (0.0%) |
| 35 to 64 Years | 35 (24.0%) | 53 (33.5%) |
| 65 to 74 Years | 8 (21.6%) | 13 (30.2%) |
| 75 Years and over | 21 (72.4%) | 25 (58.1%) |
Disability Class by Sex by Age in Barton
Disability Class: Hearing Difficulty
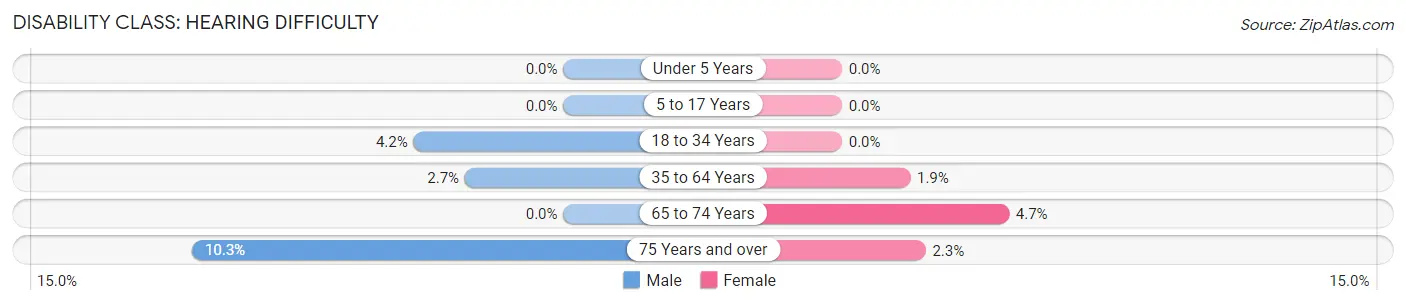
| Age Bracket | Male | Female |
| Under 5 Years | 0 (0.0%) | 0 (0.0%) |
| 5 to 17 Years | 0 (0.0%) | 0 (0.0%) |
| 18 to 34 Years | 3 (4.2%) | 0 (0.0%) |
| 35 to 64 Years | 4 (2.7%) | 3 (1.9%) |
| 65 to 74 Years | 0 (0.0%) | 2 (4.6%) |
| 75 Years and over | 3 (10.3%) | 1 (2.3%) |
Disability Class: Vision Difficulty
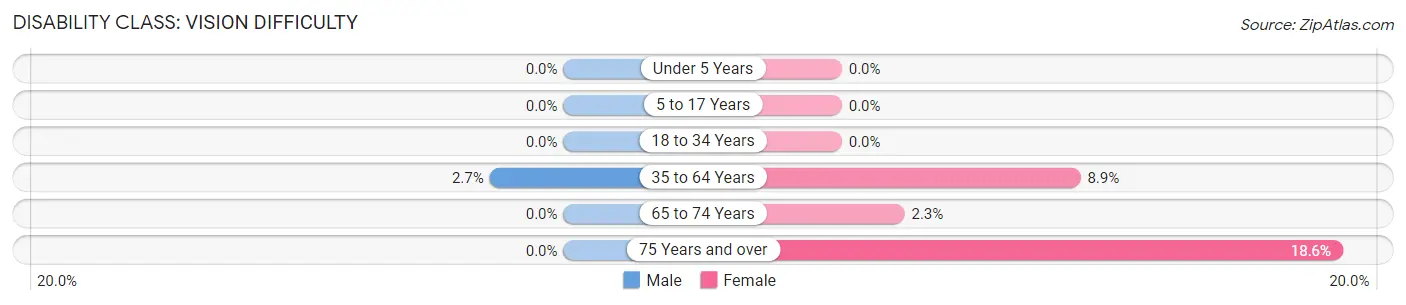
| Age Bracket | Male | Female |
| Under 5 Years | 0 (0.0%) | 0 (0.0%) |
| 5 to 17 Years | 0 (0.0%) | 0 (0.0%) |
| 18 to 34 Years | 0 (0.0%) | 0 (0.0%) |
| 35 to 64 Years | 4 (2.7%) | 14 (8.9%) |
| 65 to 74 Years | 0 (0.0%) | 1 (2.3%) |
| 75 Years and over | 0 (0.0%) | 8 (18.6%) |
Disability Class: Cognitive Difficulty
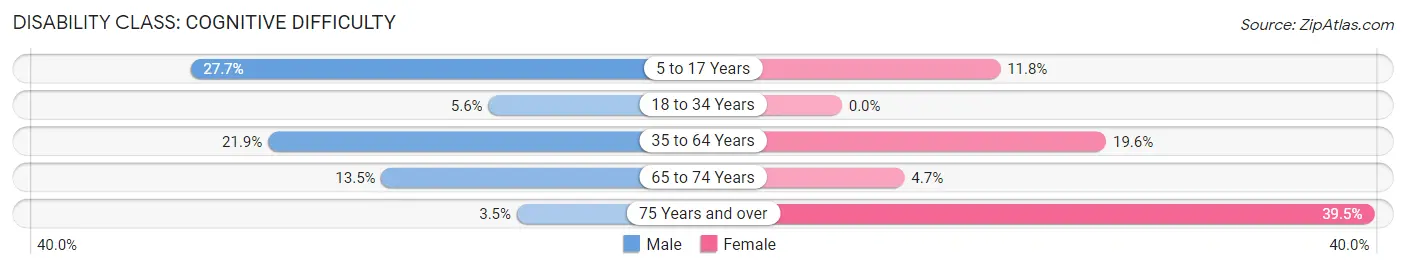
| Age Bracket | Male | Female |
| 5 to 17 Years | 18 (27.7%) | 4 (11.8%) |
| 18 to 34 Years | 4 (5.6%) | 0 (0.0%) |
| 35 to 64 Years | 32 (21.9%) | 31 (19.6%) |
| 65 to 74 Years | 5 (13.5%) | 2 (4.6%) |
| 75 Years and over | 1 (3.5%) | 17 (39.5%) |
Disability Class: Ambulatory Difficulty
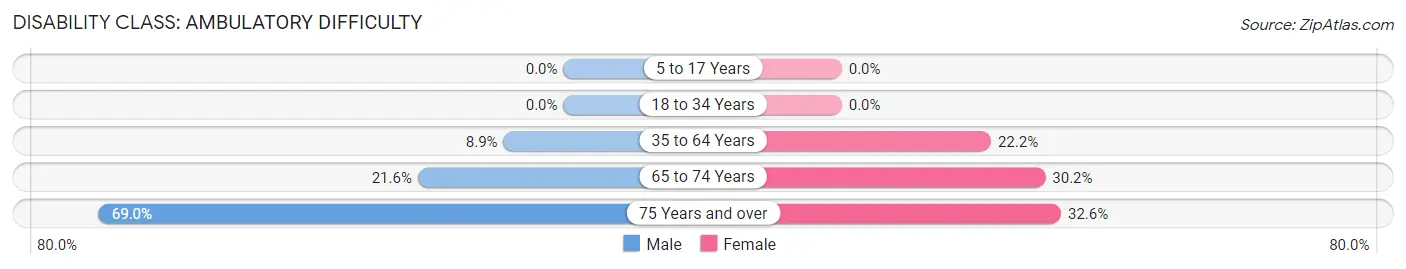
| Age Bracket | Male | Female |
| 5 to 17 Years | 0 (0.0%) | 0 (0.0%) |
| 18 to 34 Years | 0 (0.0%) | 0 (0.0%) |
| 35 to 64 Years | 13 (8.9%) | 35 (22.2%) |
| 65 to 74 Years | 8 (21.6%) | 13 (30.2%) |
| 75 Years and over | 20 (69.0%) | 14 (32.6%) |
Disability Class: Self-Care Difficulty
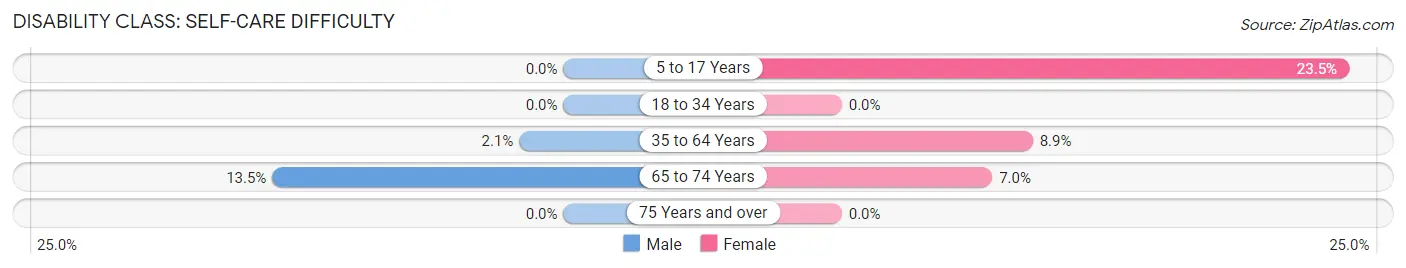
| Age Bracket | Male | Female |
| 5 to 17 Years | 0 (0.0%) | 8 (23.5%) |
| 18 to 34 Years | 0 (0.0%) | 0 (0.0%) |
| 35 to 64 Years | 3 (2.1%) | 14 (8.9%) |
| 65 to 74 Years | 5 (13.5%) | 3 (7.0%) |
| 75 Years and over | 0 (0.0%) | 0 (0.0%) |
Technology Access in Barton
Computing Device Access in Barton
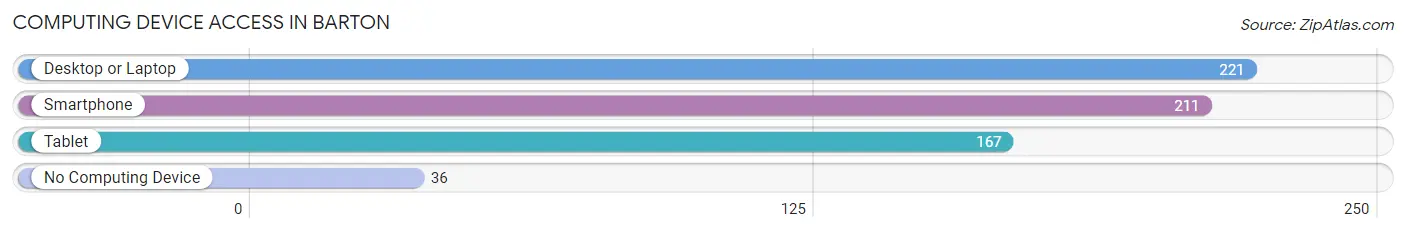
| Device Type | # Households | % Households |
| Desktop or Laptop | 221 | 71.1% |
| Smartphone | 211 | 67.8% |
| Tablet | 167 | 53.7% |
| No Computing Device | 36 | 11.6% |
| Total | 311 | 100.0% |
Internet Access in Barton
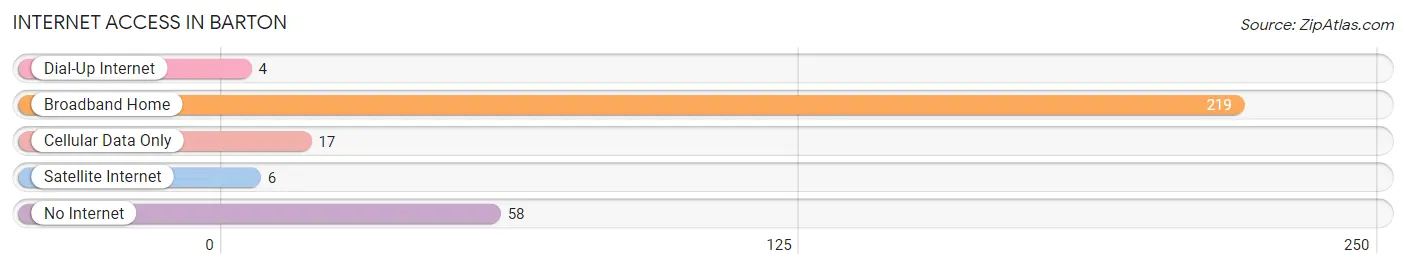
| Internet Type | # Households | % Households |
| Dial-Up Internet | 4 | 1.3% |
| Broadband Home | 219 | 70.4% |
| Cellular Data Only | 17 | 5.5% |
| Satellite Internet | 6 | 1.9% |
| No Internet | 58 | 18.6% |
| Total | 311 | 100.0% |
Barton Summary
Barton is a small town located in the northeastern corner of Vermont, in the United States. It is situated in the heart of the Northeast Kingdom, a region of Vermont known for its rural beauty and small-town charm. Barton is home to a population of just over 1,000 people, and is the county seat of Orleans County.
History
Barton was first settled in 1790 by a group of settlers from Massachusetts. The town was named after William Barton, a Revolutionary War veteran who had served in the Battle of Bunker Hill. The town was incorporated in 1796, and the first town meeting was held in 1797.
In the early 19th century, Barton was a thriving agricultural community, with a variety of crops being grown in the area. The town was also home to several mills, including a sawmill, gristmill, and a woolen mill.
In the late 19th century, Barton began to experience a decline in its agricultural economy. This was due in part to the introduction of new farming techniques and the development of railroads, which allowed farmers to transport their goods to larger markets. As a result, many of the town’s mills closed, and the population began to decline.
In the early 20th century, Barton experienced a resurgence in its economy. This was due in part to the development of the nearby Jay Peak ski resort, which brought in a large number of tourists to the area. The town also benefited from the construction of the Barton Dam, which provided hydroelectric power to the region.
Geography
Barton is located in the northeastern corner of Vermont, in the United States. It is situated in the heart of the Northeast Kingdom, a region of Vermont known for its rural beauty and small-town charm. The town is bordered by the towns of Coventry to the north, Irasburg to the east, Lowell to the south, and Westfield to the west.
The town is situated in a valley, surrounded by the Green Mountains to the east and the White Mountains to the west. The Barton River runs through the center of town, and is a popular spot for fishing and swimming.
Economy
Barton’s economy is largely based on tourism and agriculture. The town is home to several small businesses, including restaurants, shops, and lodging. The nearby Jay Peak ski resort is a major source of tourism for the area, and brings in a large number of visitors each year.
Agriculture is also an important part of the local economy. The town is home to several dairy farms, as well as a variety of other crops, including corn, hay, and apples.
Demographics
As of the 2010 census, the population of Barton was 1,039. The racial makeup of the town was 97.3% White, 0.7% African American, 0.3% Native American, 0.2% Asian, 0.1% Pacific Islander, and 1.4% from two or more races.
The median household income in Barton was $41,250, and the median family income was $48,750. The per capita income was $20,945. About 11.2% of the population was below the poverty line.
Barton is a small town with a rich history and a strong sense of community. It is a great place to live, work, and raise a family. The town is home to a variety of businesses, and offers a variety of recreational activities. It is a great place to experience the beauty of Vermont and the charm of small-town life.
Common Questions
What is Per Capita Income in Barton?
Per Capita income in Barton is $19,106.
What is the Median Family Income in Barton?
Median Family Income in Barton is $40,078.
What is the Median Household income in Barton?
Median Household Income in Barton is $29,375.
What is Income or Wage Gap in Barton?
Income or Wage Gap in Barton is 13.2%.
Women in Barton earn 86.8 cents for every dollar earned by a man.
What is Inequality or Gini Index in Barton?
Inequality or Gini Index in Barton is 0.45.
What is the Total Population of Barton?
Total Population of Barton is 700.
What is the Total Male Population of Barton?
Total Male Population of Barton is 377.
What is the Total Female Population of Barton?
Total Female Population of Barton is 323.
What is the Ratio of Males per 100 Females in Barton?
There are 116.72 Males per 100 Females in Barton.
What is the Ratio of Females per 100 Males in Barton?
There are 85.68 Females per 100 Males in Barton.
What is the Median Population Age in Barton?
Median Population Age in Barton is 44.0 Years.
What is the Average Family Size in Barton
Average Family Size in Barton is 2.8 People.
What is the Average Household Size in Barton
Average Household Size in Barton is 2.2 People.
How Large is the Labor Force in Barton?
There are 283 People in the Labor Forcein in Barton.
What is the Percentage of People in the Labor Force in Barton?
49.8% of People are in the Labor Force in Barton.
What is the Unemployment Rate in Barton?
Unemployment Rate in Barton is 15.5%.