Zip Codes with the Highest Percentage of Population Employed in Food Preparation & Serving in Vermont
RELATED REPORTS & OPTIONS
Food Preparation & Serving
Vermont
Compare Zip Codes
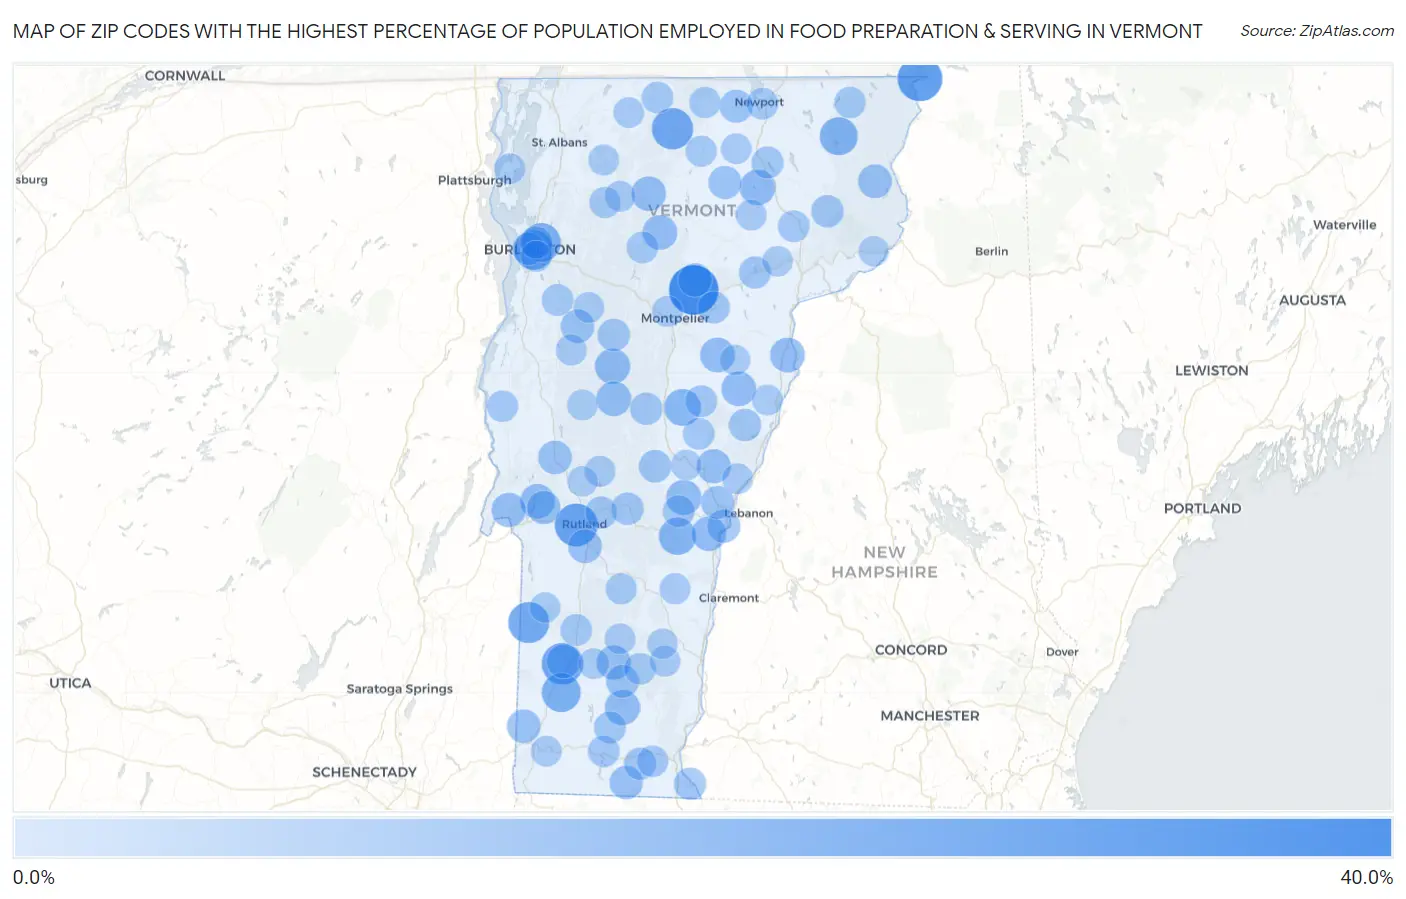
Map of Zip Codes with the Highest Percentage of Population Employed in Food Preparation & Serving in Vermont
0.0%
40.0%
Zip Codes with the Highest Percentage of Population Employed in Food Preparation & Serving in Vermont
| Zip Code | % Employed | vs State | vs National | |
| 1. | 05640 | 37.8% | 5.3%(+32.5)#1 | 5.3%(+32.5)#118 |
| 2. | 05902 | 29.4% | 5.3%(+24.1)#2 | 5.3%(+24.1)#224 |
| 3. | 05736 | 26.1% | 5.3%(+20.8)#3 | 5.3%(+20.8)#286 |
| 4. | 05254 | 23.8% | 5.3%(+18.6)#4 | 5.3%(+18.5)#350 |
| 5. | 05471 | 23.4% | 5.3%(+18.1)#5 | 5.3%(+18.1)#372 |
| 6. | 05768 | 22.7% | 5.3%(+17.5)#6 | 5.3%(+17.4)#390 |
| 7. | 05405 | 20.3% | 5.3%(+15.0)#7 | 5.3%(+15.0)#487 |
| 8. | 05439 | 19.4% | 5.3%(+14.2)#8 | 5.3%(+14.2)#534 |
| 9. | 05252 | 19.3% | 5.3%(+14.0)#9 | 5.3%(+14.0)#546 |
| 10. | 05846 | 17.6% | 5.3%(+12.3)#10 | 5.3%(+12.3)#695 |
| 11. | 05071 | 16.4% | 5.3%(+11.1)#11 | 5.3%(+11.1)#810 |
| 12. | 05041 | 15.6% | 5.3%(+10.3)#12 | 5.3%(+10.3)#906 |
| 13. | 05839 | 13.4% | 5.3%(+8.11)#13 | 5.3%(+8.09)#1,295 |
| 14. | 05674 | 13.2% | 5.3%(+7.90)#14 | 5.3%(+7.88)#1,347 |
| 15. | 05067 | 12.9% | 5.3%(+7.59)#15 | 5.3%(+7.57)#1,428 |
| 16. | 05355 | 12.8% | 5.3%(+7.48)#16 | 5.3%(+7.47)#1,450 |
| 17. | 05747 | 12.1% | 5.3%(+6.85)#17 | 5.3%(+6.84)#1,624 |
| 18. | 05649 | 12.0% | 5.3%(+6.77)#18 | 5.3%(+6.75)#1,649 |
| 19. | 05039 | 12.0% | 5.3%(+6.73)#19 | 5.3%(+6.71)#1,662 |
| 20. | 05081 | 12.0% | 5.3%(+6.69)#20 | 5.3%(+6.68)#1,681 |
| 21. | 05661 | 12.0% | 5.3%(+6.69)#21 | 5.3%(+6.67)#1,684 |
| 22. | 05732 | 11.9% | 5.3%(+6.63)#22 | 5.3%(+6.61)#1,705 |
| 23. | 05048 | 11.8% | 5.3%(+6.49)#23 | 5.3%(+6.47)#1,757 |
| 24. | 05656 | 11.7% | 5.3%(+6.43)#24 | 5.3%(+6.41)#1,776 |
| 25. | 05155 | 11.3% | 5.3%(+6.00)#25 | 5.3%(+5.98)#1,927 |
| 26. | 05743 | 11.2% | 5.3%(+5.97)#26 | 5.3%(+5.96)#1,940 |
| 27. | 05065 | 11.1% | 5.3%(+5.84)#27 | 5.3%(+5.83)#1,995 |
| 28. | 05255 | 11.0% | 5.3%(+5.76)#28 | 5.3%(+5.74)#2,044 |
| 29. | 05905 | 10.5% | 5.3%(+5.26)#29 | 5.3%(+5.24)#2,313 |
| 30. | 05759 | 10.4% | 5.3%(+5.16)#30 | 5.3%(+5.15)#2,356 |
| 31. | 05733 | 10.1% | 5.3%(+4.87)#31 | 5.3%(+4.85)#2,530 |
| 32. | 05257 | 10.1% | 5.3%(+4.86)#32 | 5.3%(+4.84)#2,540 |
| 33. | 05648 | 10.1% | 5.3%(+4.80)#33 | 5.3%(+4.78)#2,581 |
| 34. | 05487 | 9.8% | 5.3%(+4.56)#34 | 5.3%(+4.55)#2,767 |
| 35. | 05735 | 9.8% | 5.3%(+4.51)#35 | 5.3%(+4.50)#2,809 |
| 36. | 05342 | 9.7% | 5.3%(+4.43)#36 | 5.3%(+4.42)#2,879 |
| 37. | 05052 | 9.4% | 5.3%(+4.13)#37 | 5.3%(+4.11)#3,145 |
| 38. | 05827 | 9.3% | 5.3%(+4.07)#38 | 5.3%(+4.05)#3,202 |
| 39. | 05857 | 9.2% | 5.3%(+3.97)#39 | 5.3%(+3.95)#3,286 |
| 40. | 05343 | 9.2% | 5.3%(+3.91)#40 | 5.3%(+3.90)#3,337 |
| 41. | 05001 | 9.0% | 5.3%(+3.72)#41 | 5.3%(+3.70)#3,542 |
| 42. | 05032 | 8.4% | 5.3%(+3.10)#42 | 5.3%(+3.08)#4,211 |
| 43. | 05401 | 8.4% | 5.3%(+3.10)#43 | 5.3%(+3.08)#4,217 |
| 44. | 05751 | 8.2% | 5.3%(+2.96)#44 | 5.3%(+2.95)#4,393 |
| 45. | 05673 | 8.2% | 5.3%(+2.94)#45 | 5.3%(+2.93)#4,421 |
| 46. | 05832 | 8.2% | 5.3%(+2.90)#46 | 5.3%(+2.89)#4,475 |
| 47. | 05060 | 8.1% | 5.3%(+2.81)#47 | 5.3%(+2.80)#4,597 |
| 48. | 05083 | 8.1% | 5.3%(+2.79)#48 | 5.3%(+2.78)#4,639 |
| 49. | 05404 | 8.0% | 5.3%(+2.73)#49 | 5.3%(+2.71)#4,723 |
| 50. | 05354 | 8.0% | 5.3%(+2.69)#50 | 5.3%(+2.67)#4,788 |
| 51. | 05344 | 7.8% | 5.3%(+2.54)#51 | 5.3%(+2.53)#5,024 |
| 52. | 05873 | 7.8% | 5.3%(+2.52)#52 | 5.3%(+2.50)#5,075 |
| 53. | 05701 | 7.8% | 5.3%(+2.48)#53 | 5.3%(+2.47)#5,137 |
| 54. | 05667 | 7.6% | 5.3%(+2.32)#54 | 5.3%(+2.31)#5,386 |
| 55. | 05822 | 7.5% | 5.3%(+2.25)#55 | 5.3%(+2.23)#5,519 |
| 56. | 05356 | 7.3% | 5.3%(+2.00)#56 | 5.3%(+1.99)#5,976 |
| 57. | 05091 | 7.2% | 5.3%(+1.92)#57 | 5.3%(+1.90)#6,157 |
| 58. | 05038 | 7.0% | 5.3%(+1.77)#58 | 5.3%(+1.75)#6,467 |
| 59. | 05461 | 7.0% | 5.3%(+1.72)#59 | 5.3%(+1.70)#6,596 |
| 60. | 05359 | 6.9% | 5.3%(+1.66)#60 | 5.3%(+1.64)#6,745 |
| 61. | 05855 | 6.9% | 5.3%(+1.63)#61 | 5.3%(+1.62)#6,810 |
| 62. | 05253 | 6.9% | 5.3%(+1.61)#62 | 5.3%(+1.59)#6,866 |
| 63. | 05851 | 6.9% | 5.3%(+1.60)#63 | 5.3%(+1.59)#6,875 |
| 64. | 05476 | 6.7% | 5.3%(+1.46)#64 | 5.3%(+1.45)#7,250 |
| 65. | 05672 | 6.7% | 5.3%(+1.45)#65 | 5.3%(+1.43)#7,292 |
| 66. | 05363 | 6.7% | 5.3%(+1.40)#66 | 5.3%(+1.38)#7,420 |
| 67. | 05907 | 6.6% | 5.3%(+1.31)#67 | 5.3%(+1.29)#7,657 |
| 68. | 05077 | 6.6% | 5.3%(+1.31)#68 | 5.3%(+1.29)#7,660 |
| 69. | 05301 | 6.5% | 5.3%(+1.20)#69 | 5.3%(+1.18)#7,960 |
| 70. | 05734 | 6.4% | 5.3%(+1.12)#70 | 5.3%(+1.11)#8,158 |
| 71. | 05859 | 6.2% | 5.3%(+0.931)#71 | 5.3%(+0.916)#8,720 |
| 72. | 05444 | 6.1% | 5.3%(+0.871)#72 | 5.3%(+0.856)#8,897 |
| 73. | 05403 | 5.9% | 5.3%(+0.661)#73 | 5.3%(+0.646)#9,571 |
| 74. | 05847 | 5.9% | 5.3%(+0.611)#74 | 5.3%(+0.596)#9,740 |
| 75. | 05730 | 5.9% | 5.3%(+0.611)#75 | 5.3%(+0.596)#9,744 |
| 76. | 05142 | 5.7% | 5.3%(+0.384)#76 | 5.3%(+0.369)#10,503 |
| 77. | 05602 | 5.6% | 5.3%(+0.347)#77 | 5.3%(+0.332)#10,646 |
| 78. | 05443 | 5.6% | 5.3%(+0.328)#78 | 5.3%(+0.313)#10,701 |
| 79. | 05737 | 5.5% | 5.3%(+0.267)#79 | 5.3%(+0.251)#10,932 |
| 80. | 05448 | 5.5% | 5.3%(+0.258)#80 | 5.3%(+0.243)#10,967 |
| 81. | 05464 | 5.5% | 5.3%(+0.184)#81 | 5.3%(+0.168)#11,203 |
| 82. | 05055 | 5.4% | 5.3%(+0.136)#82 | 5.3%(+0.121)#11,378 |
| 83. | 05766 | 5.3% | 5.3%(+0.032)#83 | 5.3%(+0.017)#11,754 |
| 84. | 05146 | 5.3% | 5.3%(+0.020)#84 | 5.3%(+0.005)#11,800 |
| 85. | 05462 | 5.3% | 5.3%(+0.003)#85 | 5.3%(-0.012)#11,862 |
| 86. | 05033 | 5.3% | 5.3%(-0.008)#86 | 5.3%(-0.023)#11,888 |
| 87. | 05845 | 5.2% | 5.3%(-0.065)#87 | 5.3%(-0.081)#12,115 |
| 88. | 05201 | 5.2% | 5.3%(-0.069)#88 | 5.3%(-0.084)#12,133 |
| 89. | 05842 | 5.2% | 5.3%(-0.081)#89 | 5.3%(-0.096)#12,186 |
| 90. | 05148 | 5.2% | 5.3%(-0.102)#90 | 5.3%(-0.118)#12,282 |
| 91. | 05450 | 5.1% | 5.3%(-0.200)#91 | 5.3%(-0.216)#12,649 |
| 92. | 05340 | 5.0% | 5.3%(-0.247)#92 | 5.3%(-0.262)#12,849 |
| 93. | 05458 | 5.0% | 5.3%(-0.293)#93 | 5.3%(-0.308)#13,037 |
| 94. | 05828 | 4.9% | 5.3%(-0.376)#94 | 5.3%(-0.391)#13,376 |
| 95. | 05143 | 4.8% | 5.3%(-0.421)#95 | 5.3%(-0.436)#13,562 |
| 96. | 05761 | 4.8% | 5.3%(-0.457)#96 | 5.3%(-0.472)#13,703 |
| 97. | 05068 | 4.8% | 5.3%(-0.464)#97 | 5.3%(-0.479)#13,736 |
| 98. | 05906 | 4.8% | 5.3%(-0.489)#98 | 5.3%(-0.504)#13,817 |
| 99. | 05086 | 4.8% | 5.3%(-0.493)#99 | 5.3%(-0.508)#13,829 |
| 100. | 05763 | 4.7% | 5.3%(-0.593)#100 | 5.3%(-0.608)#14,253 |
Common Questions
What are the Top 10 Zip Codes with the Highest Percentage of Population Employed in Food Preparation & Serving in Vermont?
Top 10 Zip Codes with the Highest Percentage of Population Employed in Food Preparation & Serving in Vermont are:
What zip code has the Highest Percentage of Population Employed in Food Preparation & Serving in Vermont?
05640 has the Highest Percentage of Population Employed in Food Preparation & Serving in Vermont with 37.8%.
What is the Percentage of Population Employed in Food Preparation & Serving in the State of Vermont?
Percentage of Population Employed in Food Preparation & Serving in Vermont is 5.3%.
What is the Percentage of Population Employed in Food Preparation & Serving in the United States?
Percentage of Population Employed in Food Preparation & Serving in the United States is 5.3%.