Zip Codes with the Lowest Poverty Level Among Children Under the Age of 5 in Utah
RELATED REPORTS & OPTIONS
Lowest Poverty | Child 0-5
Utah
Compare Zip Codes
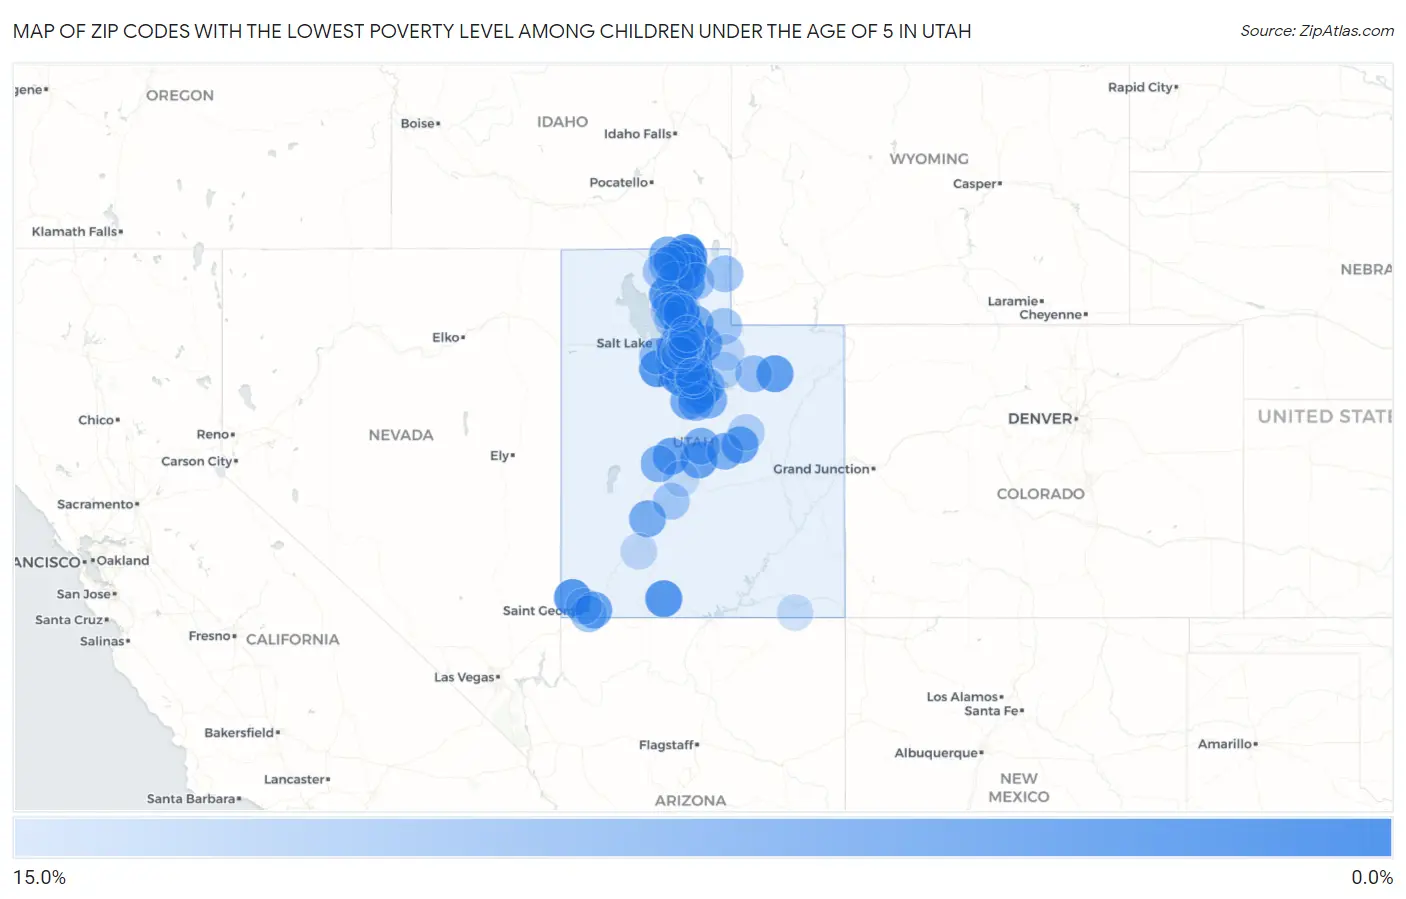
Map of Zip Codes with the Lowest Poverty Level Among Children Under the Age of 5 in Utah
15.0%
0.0%
Zip Codes with the Lowest Poverty Level Among Children Under the Age of 5 in Utah
| Zip Code | Child Poverty | vs State | vs National | |
| 1. | 84108 | 1.2% | 10.0%(-8.75)#1 | 18.1%(-16.8)#398 |
| 2. | 84741 | 1.3% | 10.0%(-8.69)#2 | 18.1%(-16.8)#423 |
| 3. | 84765 | 1.3% | 10.0%(-8.69)#3 | 18.1%(-16.8)#424 |
| 4. | 84340 | 1.3% | 10.0%(-8.68)#4 | 18.1%(-16.8)#427 |
| 5. | 84333 | 1.3% | 10.0%(-8.64)#5 | 18.1%(-16.7)#444 |
| 6. | 84071 | 1.5% | 10.0%(-8.53)#6 | 18.1%(-16.6)#508 |
| 7. | 84320 | 1.5% | 10.0%(-8.48)#7 | 18.1%(-16.6)#537 |
| 8. | 84025 | 1.6% | 10.0%(-8.39)#8 | 18.1%(-16.5)#593 |
| 9. | 84009 | 1.6% | 10.0%(-8.37)#9 | 18.1%(-16.4)#602 |
| 10. | 84664 | 1.7% | 10.0%(-8.32)#10 | 18.1%(-16.4)#629 |
| 11. | 84020 | 1.9% | 10.0%(-8.12)#11 | 18.1%(-16.2)#750 |
| 12. | 84109 | 1.9% | 10.0%(-8.12)#12 | 18.1%(-16.2)#751 |
| 13. | 84097 | 2.1% | 10.0%(-7.88)#13 | 18.1%(-16.0)#904 |
| 14. | 84040 | 2.1% | 10.0%(-7.85)#14 | 18.1%(-15.9)#929 |
| 15. | 84001 | 2.4% | 10.0%(-7.58)#15 | 18.1%(-15.7)#1,104 |
| 16. | 84328 | 2.7% | 10.0%(-7.33)#16 | 18.1%(-15.4)#1,260 |
| 17. | 84092 | 2.7% | 10.0%(-7.30)#17 | 18.1%(-15.4)#1,282 |
| 18. | 84124 | 2.8% | 10.0%(-7.24)#18 | 18.1%(-15.3)#1,331 |
| 19. | 84093 | 2.9% | 10.0%(-7.13)#19 | 18.1%(-15.2)#1,414 |
| 20. | 84005 | 3.0% | 10.0%(-6.99)#20 | 18.1%(-15.1)#1,497 |
| 21. | 84642 | 3.2% | 10.0%(-6.82)#21 | 18.1%(-14.9)#1,618 |
| 22. | 84518 | 3.2% | 10.0%(-6.80)#22 | 18.1%(-14.9)#1,639 |
| 23. | 84656 | 3.2% | 10.0%(-6.76)#23 | 18.1%(-14.8)#1,663 |
| 24. | 84003 | 3.4% | 10.0%(-6.59)#24 | 18.1%(-14.7)#1,757 |
| 25. | 84780 | 3.6% | 10.0%(-6.43)#25 | 18.1%(-14.5)#1,858 |
| 26. | 84318 | 3.7% | 10.0%(-6.25)#26 | 18.1%(-14.3)#1,982 |
| 27. | 84098 | 3.7% | 10.0%(-6.24)#27 | 18.1%(-14.3)#1,986 |
| 28. | 84094 | 3.8% | 10.0%(-6.17)#28 | 18.1%(-14.2)#2,036 |
| 29. | 84095 | 3.8% | 10.0%(-6.15)#29 | 18.1%(-14.2)#2,053 |
| 30. | 84037 | 3.9% | 10.0%(-6.13)#30 | 18.1%(-14.2)#2,071 |
| 31. | 84050 | 4.5% | 10.0%(-5.51)#31 | 18.1%(-13.6)#2,542 |
| 32. | 84070 | 4.5% | 10.0%(-5.48)#32 | 18.1%(-13.6)#2,564 |
| 33. | 84655 | 4.6% | 10.0%(-5.44)#33 | 18.1%(-13.5)#2,601 |
| 34. | 84081 | 4.6% | 10.0%(-5.39)#34 | 18.1%(-13.5)#2,638 |
| 35. | 84128 | 4.7% | 10.0%(-5.33)#35 | 18.1%(-13.4)#2,672 |
| 36. | 84339 | 4.8% | 10.0%(-5.23)#36 | 18.1%(-13.3)#2,729 |
| 37. | 84713 | 4.8% | 10.0%(-5.14)#37 | 18.1%(-13.2)#2,792 |
| 38. | 84330 | 4.9% | 10.0%(-5.11)#38 | 18.1%(-13.2)#2,823 |
| 39. | 84106 | 5.2% | 10.0%(-4.81)#39 | 18.1%(-12.9)#3,032 |
| 40. | 84065 | 5.3% | 10.0%(-4.67)#40 | 18.1%(-12.7)#3,106 |
| 41. | 84660 | 5.4% | 10.0%(-4.57)#41 | 18.1%(-12.6)#3,185 |
| 42. | 84335 | 5.5% | 10.0%(-4.44)#42 | 18.1%(-12.5)#3,271 |
| 43. | 84627 | 5.6% | 10.0%(-4.43)#43 | 18.1%(-12.5)#3,277 |
| 44. | 84537 | 5.6% | 10.0%(-4.43)#44 | 18.1%(-12.5)#3,286 |
| 45. | 84327 | 5.6% | 10.0%(-4.43)#45 | 18.1%(-12.5)#3,289 |
| 46. | 84047 | 5.6% | 10.0%(-4.36)#46 | 18.1%(-12.4)#3,334 |
| 47. | 84636 | 6.0% | 10.0%(-3.99)#47 | 18.1%(-12.1)#3,594 |
| 48. | 84062 | 6.1% | 10.0%(-3.88)#48 | 18.1%(-12.0)#3,669 |
| 49. | 84042 | 6.3% | 10.0%(-3.68)#49 | 18.1%(-11.8)#3,821 |
| 50. | 84414 | 6.7% | 10.0%(-3.27)#50 | 18.1%(-11.3)#4,085 |
| 51. | 84332 | 6.8% | 10.0%(-3.20)#51 | 18.1%(-11.3)#4,137 |
| 52. | 84663 | 6.9% | 10.0%(-3.12)#52 | 18.1%(-11.2)#4,196 |
| 53. | 84312 | 6.9% | 10.0%(-3.09)#53 | 18.1%(-11.2)#4,206 |
| 54. | 84653 | 7.0% | 10.0%(-3.00)#54 | 18.1%(-11.1)#4,279 |
| 55. | 84059 | 7.2% | 10.0%(-2.80)#55 | 18.1%(-10.9)#4,413 |
| 56. | 84045 | 7.2% | 10.0%(-2.74)#56 | 18.1%(-10.8)#4,448 |
| 57. | 84651 | 7.3% | 10.0%(-2.65)#57 | 18.1%(-10.7)#4,501 |
| 58. | 84043 | 7.4% | 10.0%(-2.61)#58 | 18.1%(-10.7)#4,528 |
| 59. | 84004 | 7.4% | 10.0%(-2.57)#59 | 18.1%(-10.6)#4,560 |
| 60. | 84121 | 7.5% | 10.0%(-2.52)#60 | 18.1%(-10.6)#4,587 |
| 61. | 84096 | 7.6% | 10.0%(-2.37)#61 | 18.1%(-10.4)#4,685 |
| 62. | 84074 | 7.8% | 10.0%(-2.22)#62 | 18.1%(-10.3)#4,774 |
| 63. | 84302 | 7.8% | 10.0%(-2.18)#63 | 18.1%(-10.3)#4,800 |
| 64. | 84056 | 7.9% | 10.0%(-2.09)#64 | 18.1%(-10.2)#4,842 |
| 65. | 84072 | 8.0% | 10.0%(-1.99)#65 | 18.1%(-10.1)#4,927 |
| 66. | 84067 | 8.2% | 10.0%(-1.84)#66 | 18.1%(-9.91)#5,004 |
| 67. | 84087 | 8.5% | 10.0%(-1.50)#67 | 18.1%(-9.57)#5,253 |
| 68. | 84790 | 8.5% | 10.0%(-1.48)#68 | 18.1%(-9.56)#5,257 |
| 69. | 84064 | 8.8% | 10.0%(-1.19)#69 | 18.1%(-9.26)#5,477 |
| 70. | 84337 | 9.0% | 10.0%(-0.984)#70 | 18.1%(-9.06)#5,619 |
| 71. | 84403 | 9.2% | 10.0%(-0.780)#71 | 18.1%(-8.85)#5,754 |
| 72. | 84404 | 9.3% | 10.0%(-0.733)#72 | 18.1%(-8.81)#5,786 |
| 73. | 84075 | 9.3% | 10.0%(-0.720)#73 | 18.1%(-8.79)#5,800 |
| 74. | 84754 | 9.3% | 10.0%(-0.720)#74 | 18.1%(-8.79)#5,801 |
| 75. | 84319 | 9.3% | 10.0%(-0.678)#75 | 18.1%(-8.75)#5,827 |
| 76. | 84311 | 9.5% | 10.0%(-0.506)#76 | 18.1%(-8.58)#5,932 |
| 77. | 84017 | 9.5% | 10.0%(-0.465)#77 | 18.1%(-8.54)#5,960 |
| 78. | 84123 | 9.5% | 10.0%(-0.456)#78 | 18.1%(-8.53)#5,986 |
| 79. | 84118 | 9.6% | 10.0%(-0.423)#79 | 18.1%(-8.50)#6,013 |
| 80. | 84107 | 9.7% | 10.0%(-0.302)#80 | 18.1%(-8.38)#6,072 |
| 81. | 84401 | 9.8% | 10.0%(-0.172)#81 | 18.1%(-8.25)#6,145 |
| 82. | 84102 | 9.8% | 10.0%(-0.140)#82 | 18.1%(-8.21)#6,159 |
| 83. | 84101 | 10.7% | 10.0%(+0.750)#83 | 18.1%(-7.32)#6,692 |
| 84. | 84501 | 10.8% | 10.0%(+0.817)#84 | 18.1%(-7.26)#6,720 |
| 85. | 84032 | 11.0% | 10.0%(+0.997)#85 | 18.1%(-7.08)#6,831 |
| 86. | 84084 | 11.3% | 10.0%(+1.30)#86 | 18.1%(-6.77)#7,021 |
| 87. | 84770 | 11.3% | 10.0%(+1.31)#87 | 18.1%(-6.76)#7,028 |
| 88. | 84058 | 11.6% | 10.0%(+1.62)#88 | 18.1%(-6.46)#7,201 |
| 89. | 84315 | 11.8% | 10.0%(+1.79)#89 | 18.1%(-6.29)#7,328 |
| 90. | 84117 | 11.9% | 10.0%(+1.87)#90 | 18.1%(-6.21)#7,369 |
| 91. | 84105 | 12.0% | 10.0%(+1.99)#91 | 18.1%(-6.09)#7,441 |
| 92. | 84088 | 12.0% | 10.0%(+1.99)#92 | 18.1%(-6.08)#7,443 |
| 93. | 84760 | 12.1% | 10.0%(+2.10)#93 | 18.1%(-5.97)#7,519 |
| 94. | 84036 | 12.2% | 10.0%(+2.18)#94 | 18.1%(-5.90)#7,552 |
| 95. | 84103 | 12.2% | 10.0%(+2.23)#95 | 18.1%(-5.85)#7,583 |
| 96. | 84057 | 12.2% | 10.0%(+2.23)#96 | 18.1%(-5.85)#7,584 |
| 97. | 84405 | 12.4% | 10.0%(+2.44)#97 | 18.1%(-5.63)#7,716 |
| 98. | 84620 | 12.7% | 10.0%(+2.74)#98 | 18.1%(-5.34)#7,885 |
| 99. | 84010 | 12.7% | 10.0%(+2.76)#99 | 18.1%(-5.32)#7,893 |
| 100. | 84531 | 12.8% | 10.0%(+2.78)#100 | 18.1%(-5.30)#7,906 |
Common Questions
What are the Top 10 Zip Codes with the Lowest Poverty Level Among Children Under the Age of 5 in Utah?
Top 10 Zip Codes with the Lowest Poverty Level Among Children Under the Age of 5 in Utah are:
What zip code has the Lowest Poverty Level Among Children Under the Age of 5 in Utah?
84108 has the Lowest Poverty Level Among Children Under the Age of 5 in Utah with 1.2%.
What is the Poverty Level Among Children Under the Age of 5 in the State of Utah?
Poverty Level Among Children Under the Age of 5 in Utah is 10.0%.
What is the Poverty Level Among Children Under the Age of 5 in the United States?
Poverty Level Among Children Under the Age of 5 in the United States is 18.1%.