Zip Codes with the Highest Percentage of Population with a Degree in Liberal Arts and History in Kingwood, TX
RELATED REPORTS & OPTIONS
Liberal Arts and History
Kingwood
Compare Zip Codes
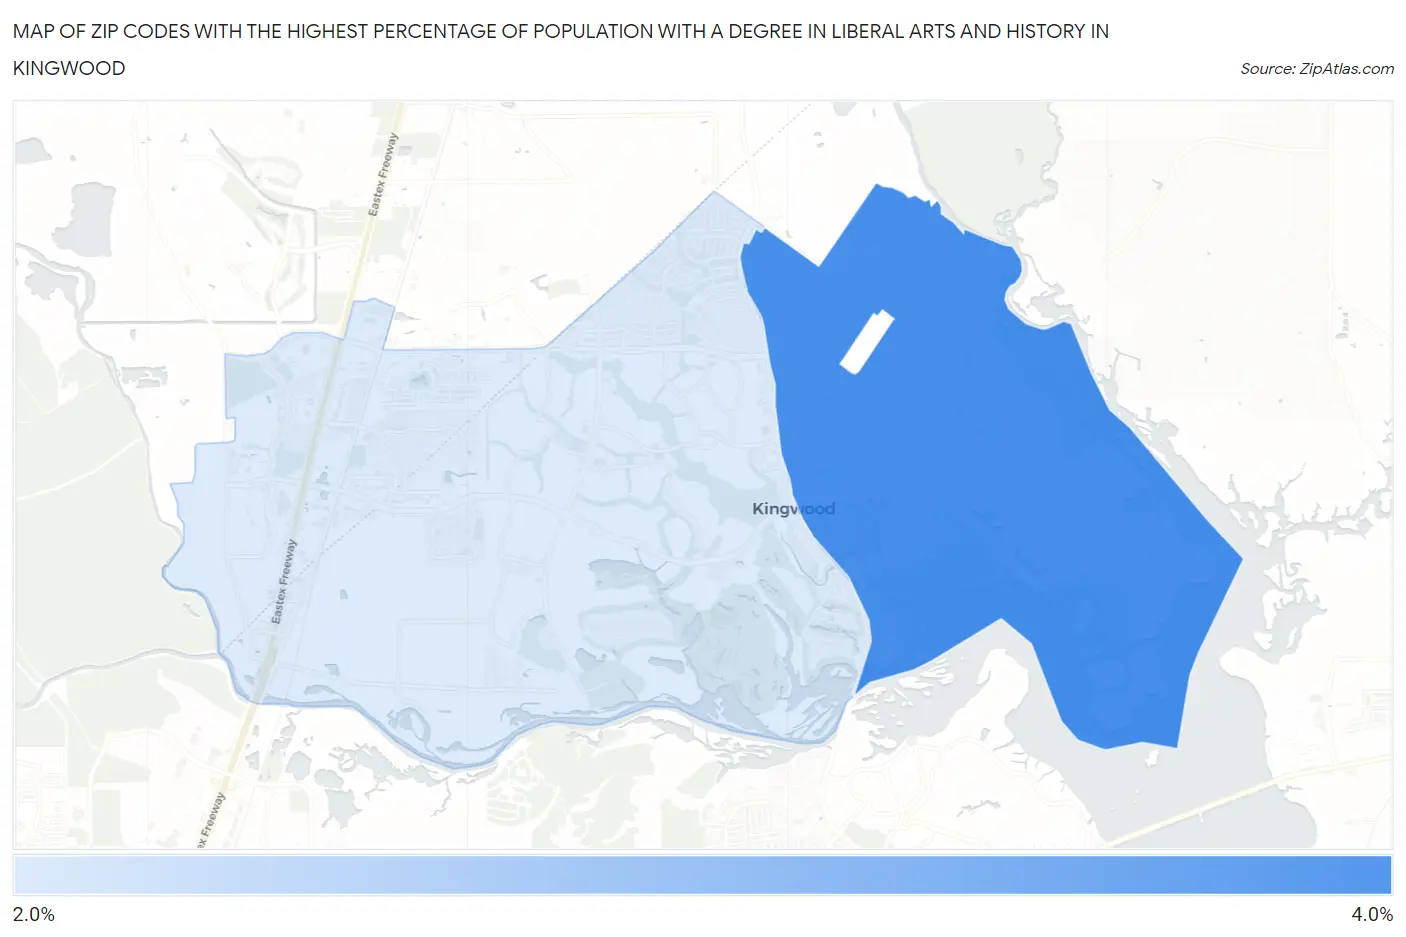
Map of Zip Codes with the Highest Percentage of Population with a Degree in Liberal Arts and History in Kingwood
2.9%
3.5%
Zip Codes with the Highest Percentage of Population with a Degree in Liberal Arts and History in Kingwood, TX
| Zip Code | % Graduates | vs State | vs National | |
| 1. | 77345 | 3.5% | 4.2%(-0.647)#896 | 4.9%(-1.37)#16,583 |
| 2. | 77339 | 2.9% | 4.2%(-1.24)#1,036 | 4.9%(-1.96)#18,660 |
1
Common Questions
What are the Top Zip Codes with the Highest Percentage of Population with a Degree in Liberal Arts and History in Kingwood, TX?
Top Zip Codes with the Highest Percentage of Population with a Degree in Liberal Arts and History in Kingwood, TX are:
What zip code has the Highest Percentage of Population with a Degree in Liberal Arts and History in Kingwood, TX?
77345 has the Highest Percentage of Population with a Degree in Liberal Arts and History in Kingwood, TX with 3.5%.
What is the Percentage of Population with a Degree in Liberal Arts and History in Texas?
Percentage of Population with a Degree in Liberal Arts and History in Texas is 4.2%.
What is the Percentage of Population with a Degree in Liberal Arts and History in the United States?
Percentage of Population with a Degree in Liberal Arts and History in the United States is 4.9%.