Pine Harbor, TX Map & Demographics
Pine Harbor Map
Pine Harbor Overview
$25,776
PER CAPITA INCOME
$45,104
AVG FAMILY INCOME
$41,042
AVG HOUSEHOLD INCOME
0.38
INEQUALITY / GINI INDEX
444
TOTAL POPULATION
252
MALE POPULATION
192
FEMALE POPULATION
131.25
MALES / 100 FEMALES
76.19
FEMALES / 100 MALES
62.5
MEDIAN AGE
3.0
AVG FAMILY SIZE
2.3
AVG HOUSEHOLD SIZE
107
LABOR FORCE [ PEOPLE ]
24.8%
PERCENT IN LABOR FORCE
43.0%
UNEMPLOYMENT RATE
Income in Pine Harbor
Income Overview in Pine Harbor
Per Capita Income in Pine Harbor is $25,776, while median incomes of families and households are $45,104 and $41,042 respectively.
| Characteristic | Number | Measure |
| Per Capita Income | 444 | $25,776 |
| Median Family Income | 119 | $45,104 |
| Mean Family Income | 119 | $63,535 |
| Median Household Income | 190 | $41,042 |
| Mean Household Income | 190 | $53,526 |
| Income Deficit | 119 | $0 |
| Wage / Income Gap (%) | 444 | 0.00% |
| Wage / Income Gap ($) | 444 | 100.00¢ per $1 |
| Gini / Inequality Index | 444 | 0.38 |
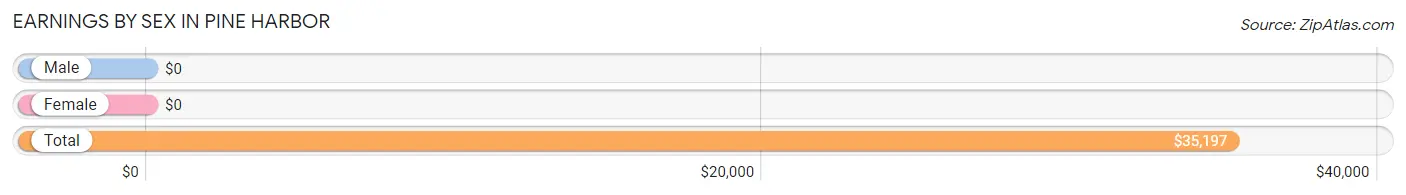
Earnings by Sex in Pine Harbor
| Sex | Number | Average Earnings |
| Male | 32 (52.5%) | $0 |
| Female | 29 (47.5%) | $0 |
| Total | 61 (100.0%) | $35,197 |
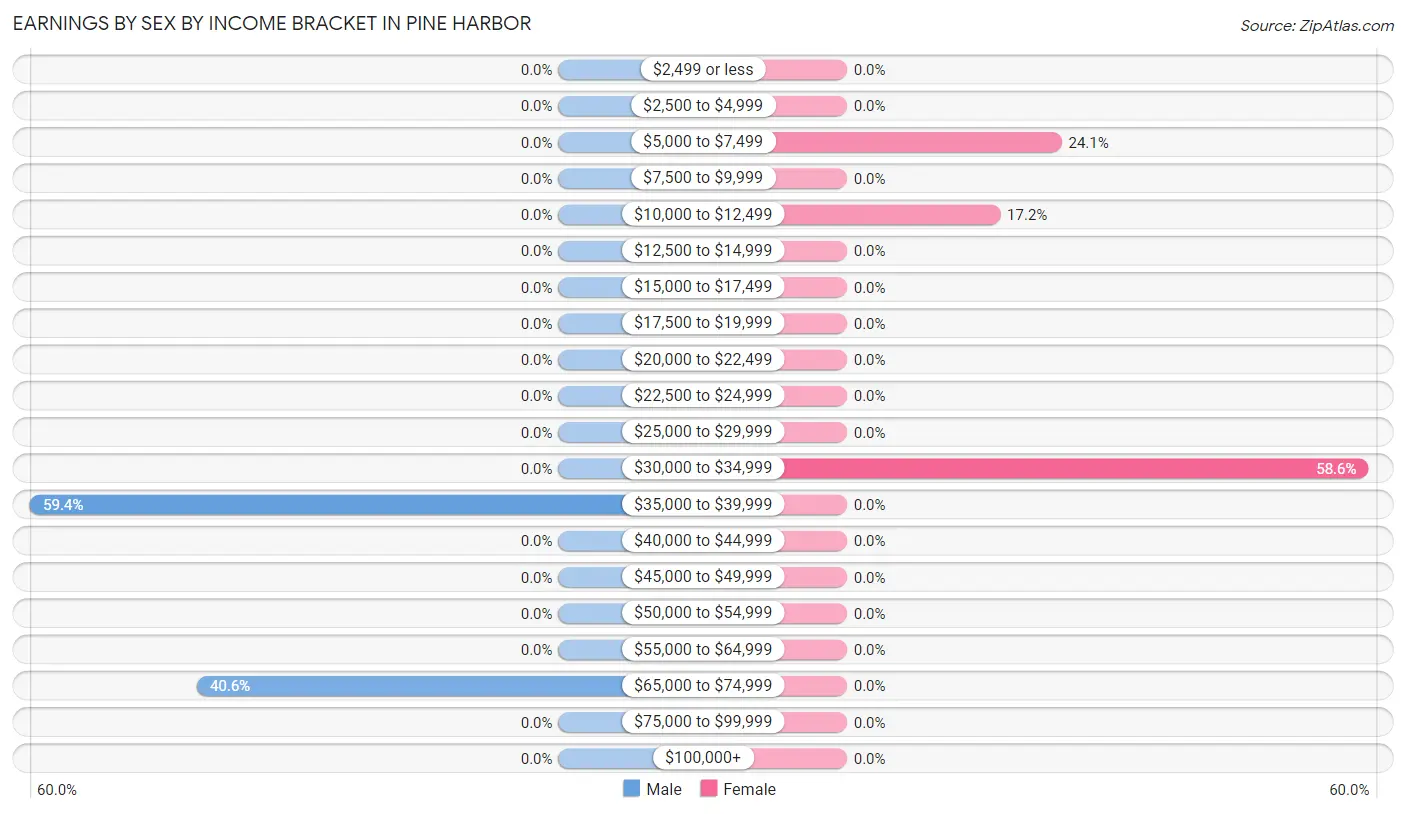
Earnings by Sex by Income Bracket in Pine Harbor
The most common earnings brackets in Pine Harbor are $35,000 to $39,999 for men (19 | 59.4%) and $30,000 to $34,999 for women (17 | 58.6%).
| Income | Male | Female |
| $2,499 or less | 0 (0.0%) | 0 (0.0%) |
| $2,500 to $4,999 | 0 (0.0%) | 0 (0.0%) |
| $5,000 to $7,499 | 0 (0.0%) | 7 (24.1%) |
| $7,500 to $9,999 | 0 (0.0%) | 0 (0.0%) |
| $10,000 to $12,499 | 0 (0.0%) | 5 (17.2%) |
| $12,500 to $14,999 | 0 (0.0%) | 0 (0.0%) |
| $15,000 to $17,499 | 0 (0.0%) | 0 (0.0%) |
| $17,500 to $19,999 | 0 (0.0%) | 0 (0.0%) |
| $20,000 to $22,499 | 0 (0.0%) | 0 (0.0%) |
| $22,500 to $24,999 | 0 (0.0%) | 0 (0.0%) |
| $25,000 to $29,999 | 0 (0.0%) | 0 (0.0%) |
| $30,000 to $34,999 | 0 (0.0%) | 17 (58.6%) |
| $35,000 to $39,999 | 19 (59.4%) | 0 (0.0%) |
| $40,000 to $44,999 | 0 (0.0%) | 0 (0.0%) |
| $45,000 to $49,999 | 0 (0.0%) | 0 (0.0%) |
| $50,000 to $54,999 | 0 (0.0%) | 0 (0.0%) |
| $55,000 to $64,999 | 0 (0.0%) | 0 (0.0%) |
| $65,000 to $74,999 | 13 (40.6%) | 0 (0.0%) |
| $75,000 to $99,999 | 0 (0.0%) | 0 (0.0%) |
| $100,000+ | 0 (0.0%) | 0 (0.0%) |
| Total | 32 (100.0%) | 29 (100.0%) |
Earnings by Sex by Educational Attainment in Pine Harbor
| Educational Attainment | Male Income | Female Income |
| Less than High School | - | - |
| High School Diploma | - | - |
| College or Associate's Degree | - | - |
| Bachelor's Degree | - | - |
| Graduate Degree | - | - |
| Total | - | - |
Family Income in Pine Harbor
Family Income Brackets in Pine Harbor
According to the Pine Harbor family income data, there are 35 families falling into the $25,000 to $34,999 income range, which is the most common income bracket and makes up 29.4% of all families.
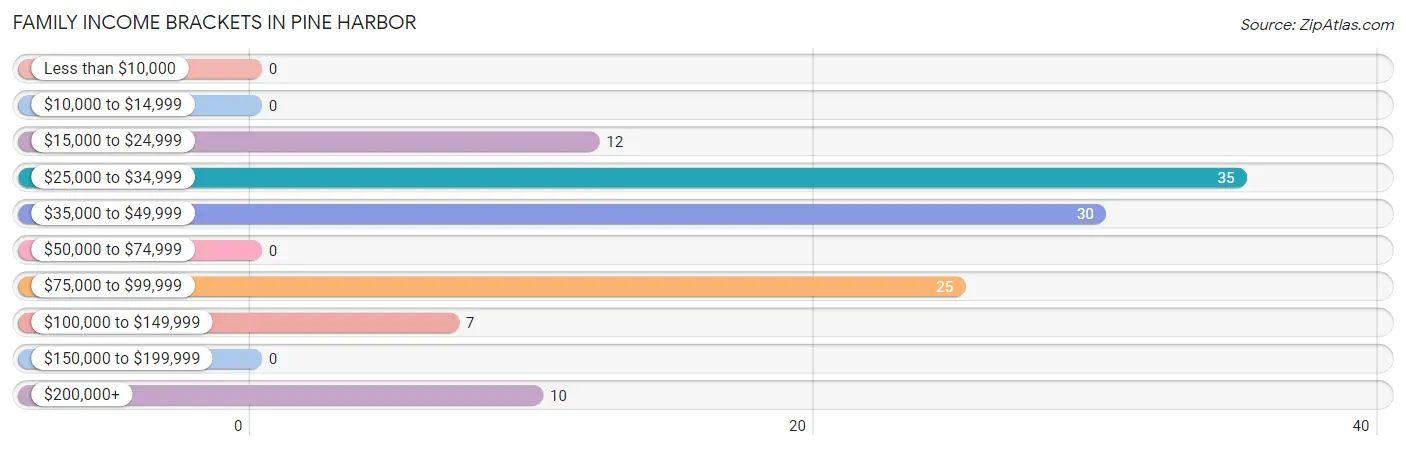
| Income Bracket | # Families | % Families |
| Less than $10,000 | 0 | 0.0% |
| $10,000 to $14,999 | 0 | 0.0% |
| $15,000 to $24,999 | 12 | 10.1% |
| $25,000 to $34,999 | 35 | 29.4% |
| $35,000 to $49,999 | 30 | 25.2% |
| $50,000 to $74,999 | 0 | 0.0% |
| $75,000 to $99,999 | 25 | 21.0% |
| $100,000 to $149,999 | 7 | 5.9% |
| $150,000 to $199,999 | 0 | 0.0% |
| $200,000+ | 10 | 8.4% |
Family Income by Famaliy Size in Pine Harbor
3-person families (28 | 23.5%) account for the highest median family income in Pine Harbor with $83,056 per family, while 3-person families (28 | 23.5%) have the highest median income of $27,685 per family member.
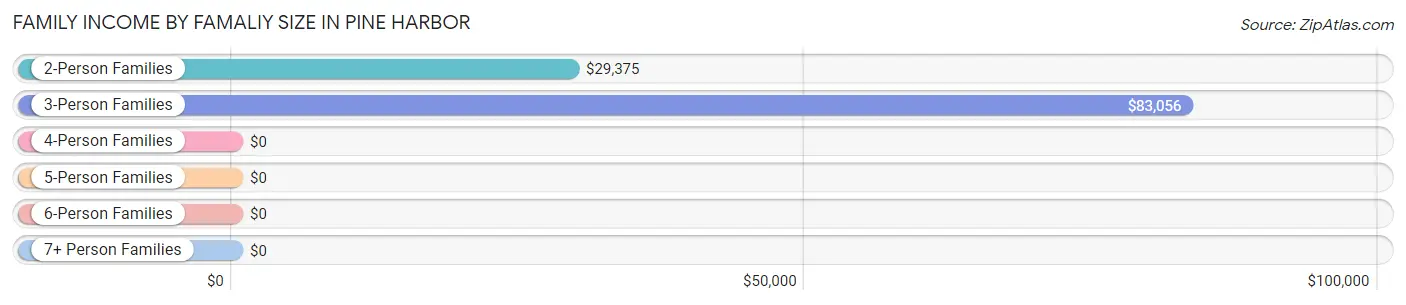
| Income Bracket | # Families | Median Income |
| 2-Person Families | 91 (76.5%) | $29,375 |
| 3-Person Families | 28 (23.5%) | $83,056 |
| 4-Person Families | 0 (0.0%) | $0 |
| 5-Person Families | 0 (0.0%) | $0 |
| 6-Person Families | 0 (0.0%) | $0 |
| 7+ Person Families | 0 (0.0%) | $0 |
| Total | 119 (100.0%) | $45,104 |
Family Income by Number of Earners in Pine Harbor
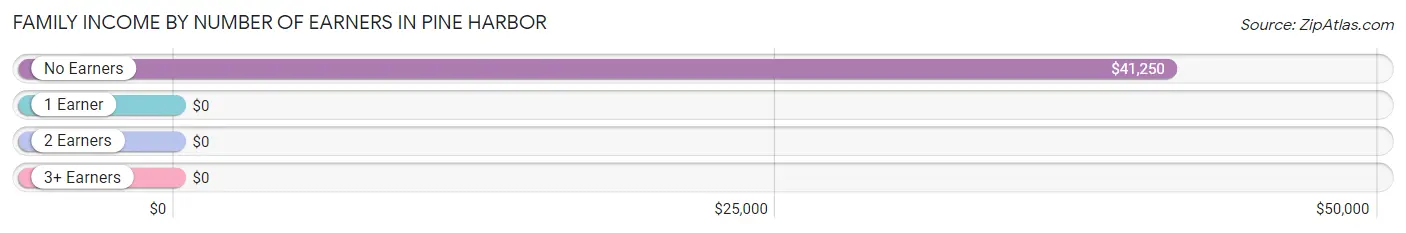
| Number of Earners | # Families | Median Income |
| No Earners | 106 (89.1%) | $41,250 |
| 1 Earner | 6 (5.0%) | $0 |
| 2 Earners | 7 (5.9%) | $0 |
| 3+ Earners | 0 (0.0%) | $0 |
| Total | 119 (100.0%) | $45,104 |
Household Income in Pine Harbor
Household Income Brackets in Pine Harbor
With 49 households falling in the category, the $35,000 to $49,999 income range is the most frequent in Pine Harbor, accounting for 25.8% of all households.
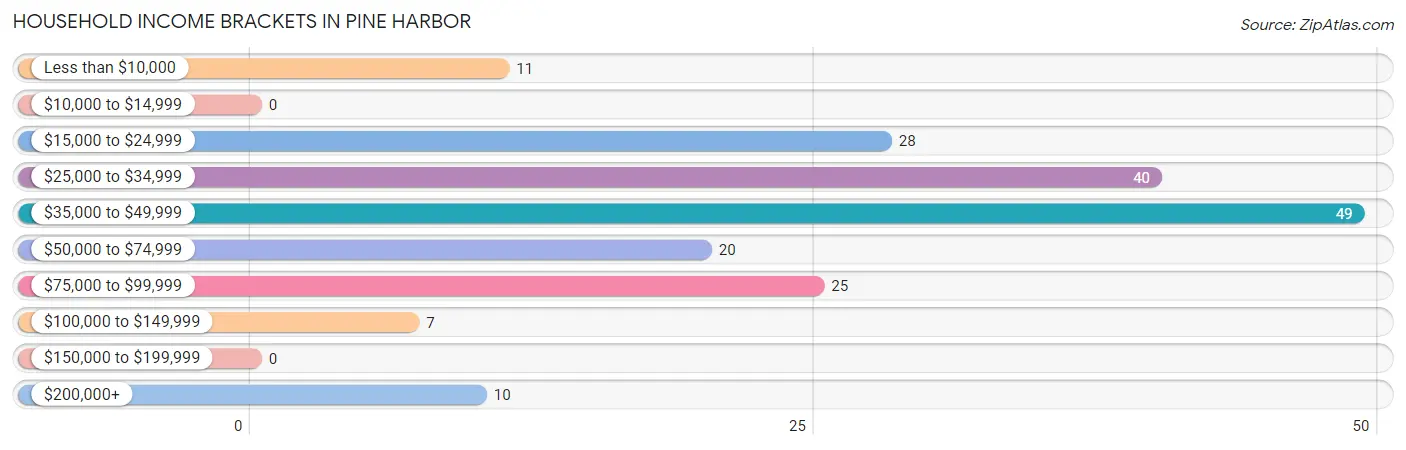
| Income Bracket | # Households | % Households |
| Less than $10,000 | 11 | 5.8% |
| $10,000 to $14,999 | 0 | 0.0% |
| $15,000 to $24,999 | 28 | 14.7% |
| $25,000 to $34,999 | 40 | 21.1% |
| $35,000 to $49,999 | 49 | 25.8% |
| $50,000 to $74,999 | 20 | 10.5% |
| $75,000 to $99,999 | 25 | 13.2% |
| $100,000 to $149,999 | 7 | 3.7% |
| $150,000 to $199,999 | 0 | 0.0% |
| $200,000+ | 10 | 5.3% |
Household Income by Householder Age in Pine Harbor
The median household income in Pine Harbor is $41,042, with the highest median household income of $46,458 found in the 65+ years age bracket for the primary householder. A total of 92 households (48.4%) fall into this category.
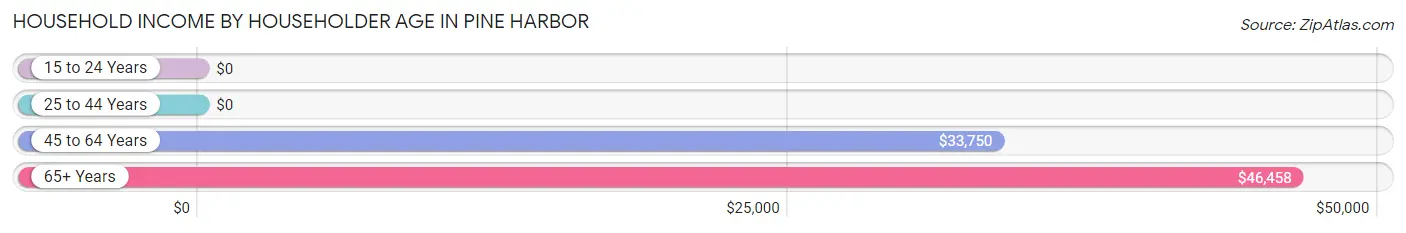
| Income Bracket | # Households | Median Income |
| 15 to 24 Years | 0 (0.0%) | $0 |
| 25 to 44 Years | 0 (0.0%) | $0 |
| 45 to 64 Years | 98 (51.6%) | $33,750 |
| 65+ Years | 92 (48.4%) | $46,458 |
| Total | 190 (100.0%) | $41,042 |
Poverty in Pine Harbor
Income Below Poverty by Sex and Age in Pine Harbor
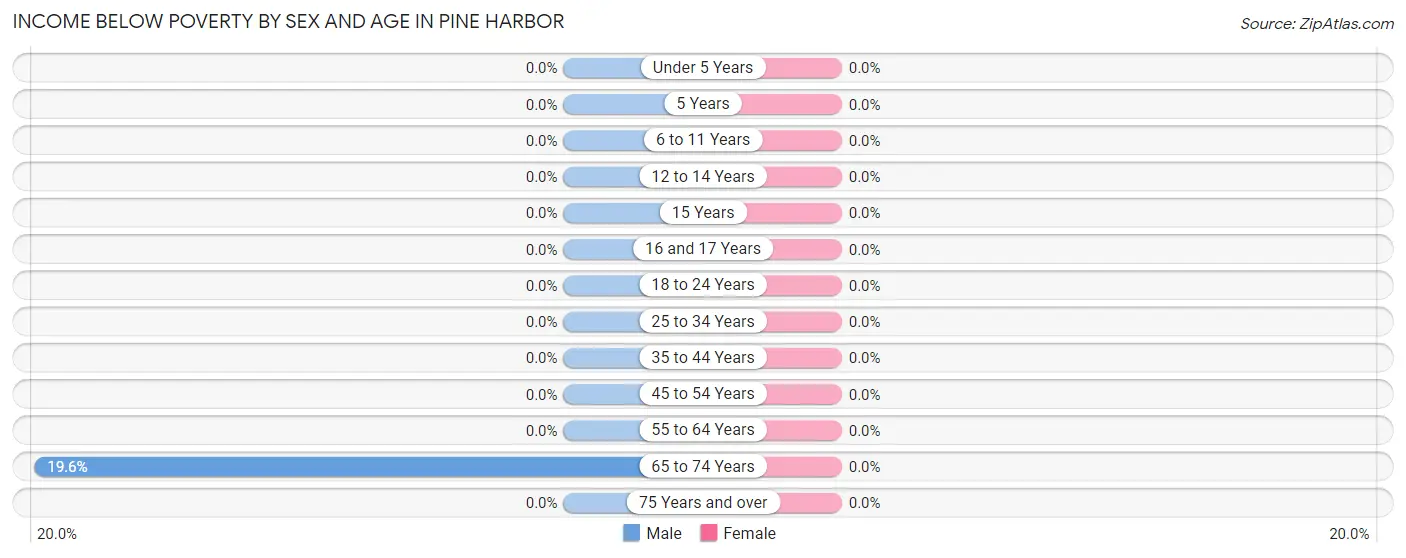
| Age Bracket | Male | Female |
| Under 5 Years | 0 (0.0%) | 0 (0.0%) |
| 5 Years | 0 (0.0%) | 0 (0.0%) |
| 6 to 11 Years | 0 (0.0%) | 0 (0.0%) |
| 12 to 14 Years | 0 (0.0%) | 0 (0.0%) |
| 15 Years | 0 (0.0%) | 0 (0.0%) |
| 16 and 17 Years | 0 (0.0%) | 0 (0.0%) |
| 18 to 24 Years | 0 (0.0%) | 0 (0.0%) |
| 25 to 34 Years | 0 (0.0%) | 0 (0.0%) |
| 35 to 44 Years | 0 (0.0%) | 0 (0.0%) |
| 45 to 54 Years | 0 (0.0%) | 0 (0.0%) |
| 55 to 64 Years | 0 (0.0%) | 0 (0.0%) |
| 65 to 74 Years | 11 (19.6%) | 0 (0.0%) |
| 75 Years and over | 0 (0.0%) | 0 (0.0%) |
| Total | 11 (4.4%) | 0 (0.0%) |
Income Above Poverty by Sex and Age in Pine Harbor
According to the poverty statistics in Pine Harbor, males aged 18 to 24 years and females aged under 5 years are the age groups that are most secure financially, with 100.0% of males and 100.0% of females in these age groups living above the poverty line.
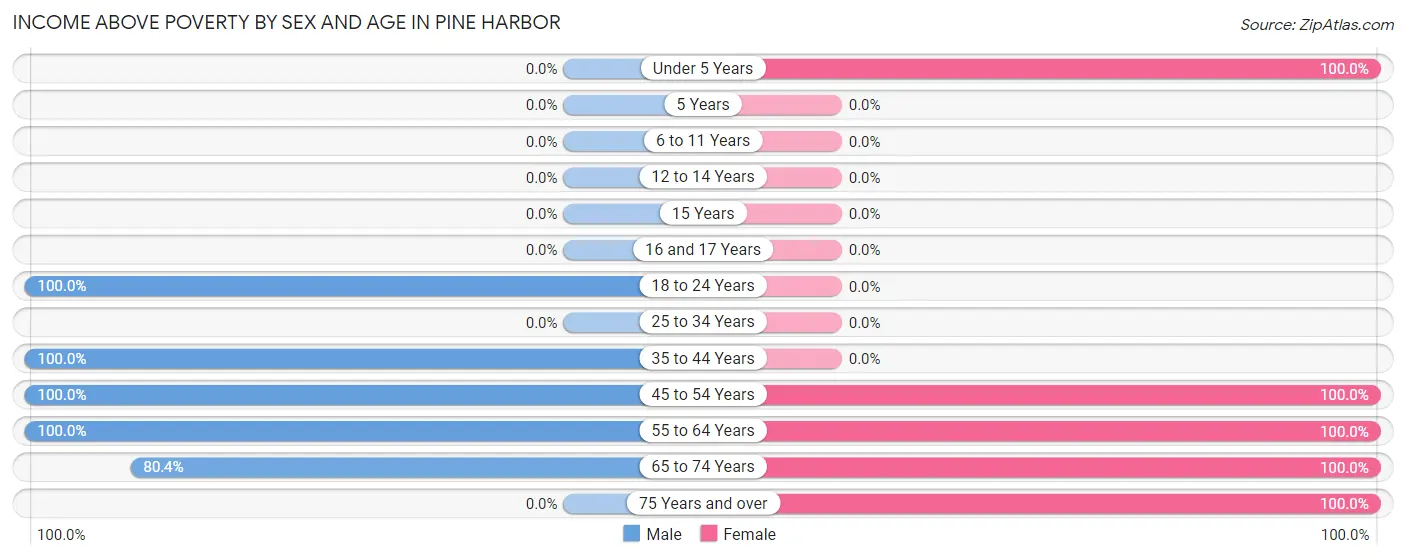
| Age Bracket | Male | Female |
| Under 5 Years | 0 (0.0%) | 12 (100.0%) |
| 5 Years | 0 (0.0%) | 0 (0.0%) |
| 6 to 11 Years | 0 (0.0%) | 0 (0.0%) |
| 12 to 14 Years | 0 (0.0%) | 0 (0.0%) |
| 15 Years | 0 (0.0%) | 0 (0.0%) |
| 16 and 17 Years | 0 (0.0%) | 0 (0.0%) |
| 18 to 24 Years | 8 (100.0%) | 0 (0.0%) |
| 25 to 34 Years | 0 (0.0%) | 0 (0.0%) |
| 35 to 44 Years | 61 (100.0%) | 0 (0.0%) |
| 45 to 54 Years | 52 (100.0%) | 17 (100.0%) |
| 55 to 64 Years | 75 (100.0%) | 99 (100.0%) |
| 65 to 74 Years | 45 (80.4%) | 24 (100.0%) |
| 75 Years and over | 0 (0.0%) | 40 (100.0%) |
| Total | 241 (95.6%) | 192 (100.0%) |
Income Below Poverty Among Married-Couple Families in Pine Harbor
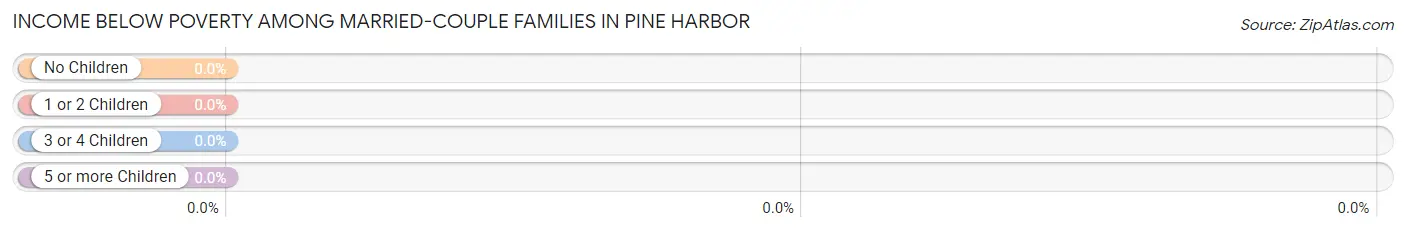
| Children | Above Poverty | Below Poverty |
| No Children | 86 (100.0%) | 0 (0.0%) |
| 1 or 2 Children | 0 (0.0%) | 0 (0.0%) |
| 3 or 4 Children | 0 (0.0%) | 0 (0.0%) |
| 5 or more Children | 0 (0.0%) | 0 (0.0%) |
| Total | 86 (100.0%) | 0 (0.0%) |
Income Below Poverty Among Single-Parent Households in Pine Harbor
| Children | Single Father | Single Mother |
| No Children | 0 (0.0%) | 0 (0.0%) |
| 1 or 2 Children | 0 (0.0%) | 0 (0.0%) |
| 3 or 4 Children | 0 (0.0%) | 0 (0.0%) |
| 5 or more Children | 0 (0.0%) | 0 (0.0%) |
| Total | 0 (0.0%) | 0 (0.0%) |
Income Below Poverty Among Married-Couple vs Single-Parent Households in Pine Harbor
| Children | Married-Couple Families | Single-Parent Households |
| No Children | 0 (0.0%) | 0 (0.0%) |
| 1 or 2 Children | 0 (0.0%) | 0 (0.0%) |
| 3 or 4 Children | 0 (0.0%) | 0 (0.0%) |
| 5 or more Children | 0 (0.0%) | 0 (0.0%) |
| Total | 0 (0.0%) | 0 (0.0%) |
Race in Pine Harbor
The most populous races in Pine Harbor are White / Caucasian (377 | 84.9%), Two or more Races (67 | 15.1%), and Hispanic or Latino (52 | 11.7%).
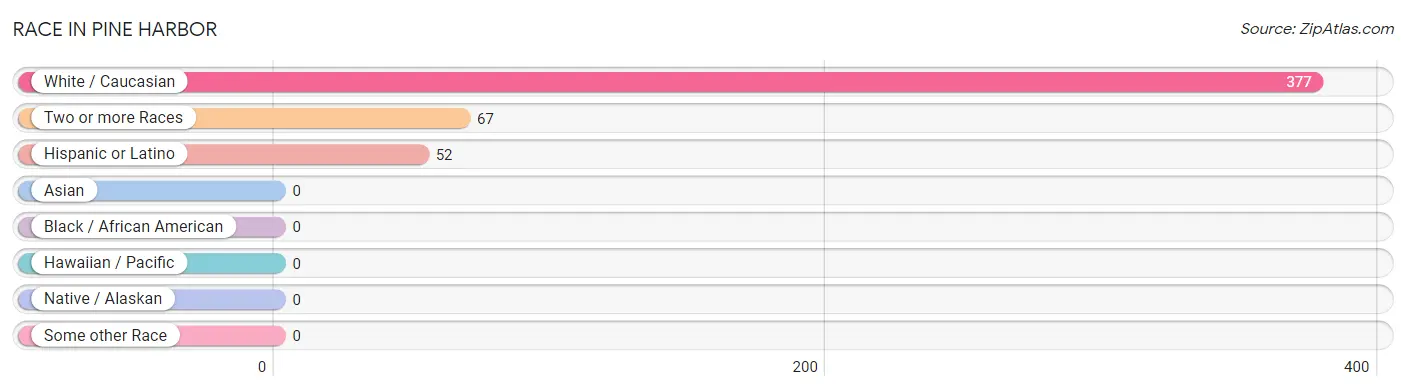
| Race | # Population | % Population |
| Asian | 0 | 0.0% |
| Black / African American | 0 | 0.0% |
| Hawaiian / Pacific | 0 | 0.0% |
| Hispanic or Latino | 52 | 11.7% |
| Native / Alaskan | 0 | 0.0% |
| White / Caucasian | 377 | 84.9% |
| Two or more Races | 67 | 15.1% |
| Some other Race | 0 | 0.0% |
| Total | 444 | 100.0% |
Ancestry in Pine Harbor
The most populous ancestries reported in Pine Harbor are Irish (86 | 19.4%), English (78 | 17.6%), Spanish (52 | 11.7%), American (33 | 7.4%), and Cherokee (32 | 7.2%), together accounting for 63.3% of all Pine Harbor residents.
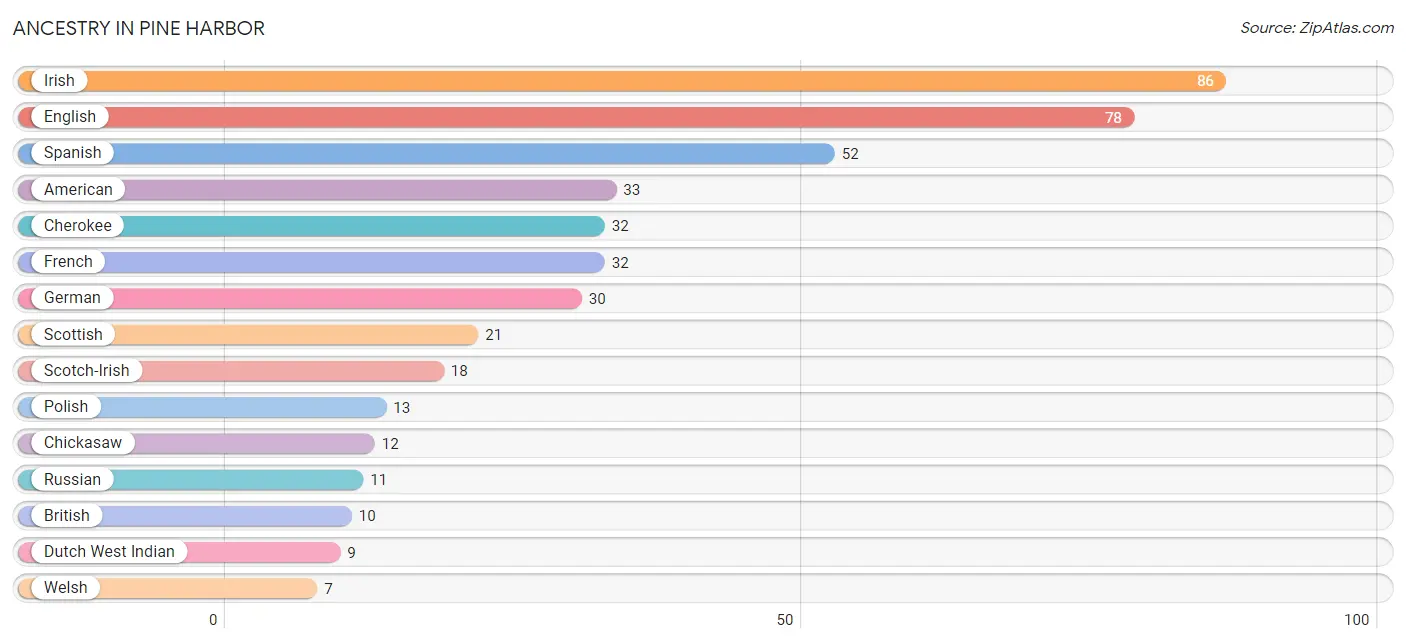
| Ancestry | # Population | % Population |
| American | 33 | 7.4% |
| British | 10 | 2.2% |
| Cherokee | 32 | 7.2% |
| Chickasaw | 12 | 2.7% |
| Dutch West Indian | 9 | 2.0% |
| English | 78 | 17.6% |
| French | 32 | 7.2% |
| French American Indian | 3 | 0.7% |
| German | 30 | 6.8% |
| Irish | 86 | 19.4% |
| Polish | 13 | 2.9% |
| Russian | 11 | 2.5% |
| Scotch-Irish | 18 | 4.1% |
| Scottish | 21 | 4.7% |
| Spanish | 52 | 11.7% |
| Welsh | 7 | 1.6% | View All 16 Rows |
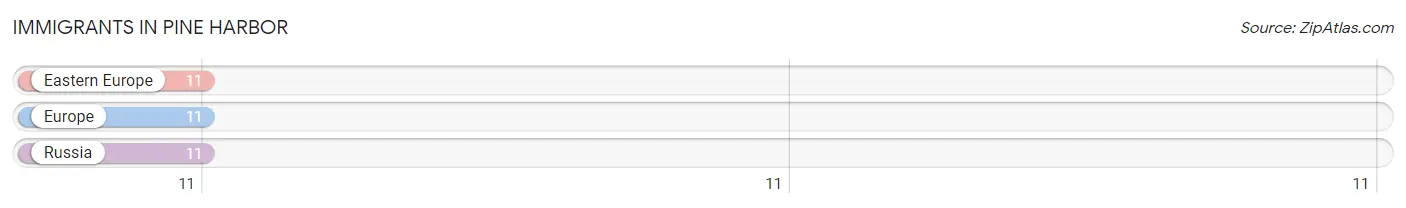
Immigrants in Pine Harbor
The most numerous immigrant groups reported in Pine Harbor came from Eastern Europe (11 | 2.5%), Europe (11 | 2.5%), and Russia (11 | 2.5%), together accounting for 7.4% of all Pine Harbor residents.
| Immigration Origin | # Population | % Population |
| Eastern Europe | 11 | 2.5% |
| Europe | 11 | 2.5% |
| Russia | 11 | 2.5% | View All 3 Rows |
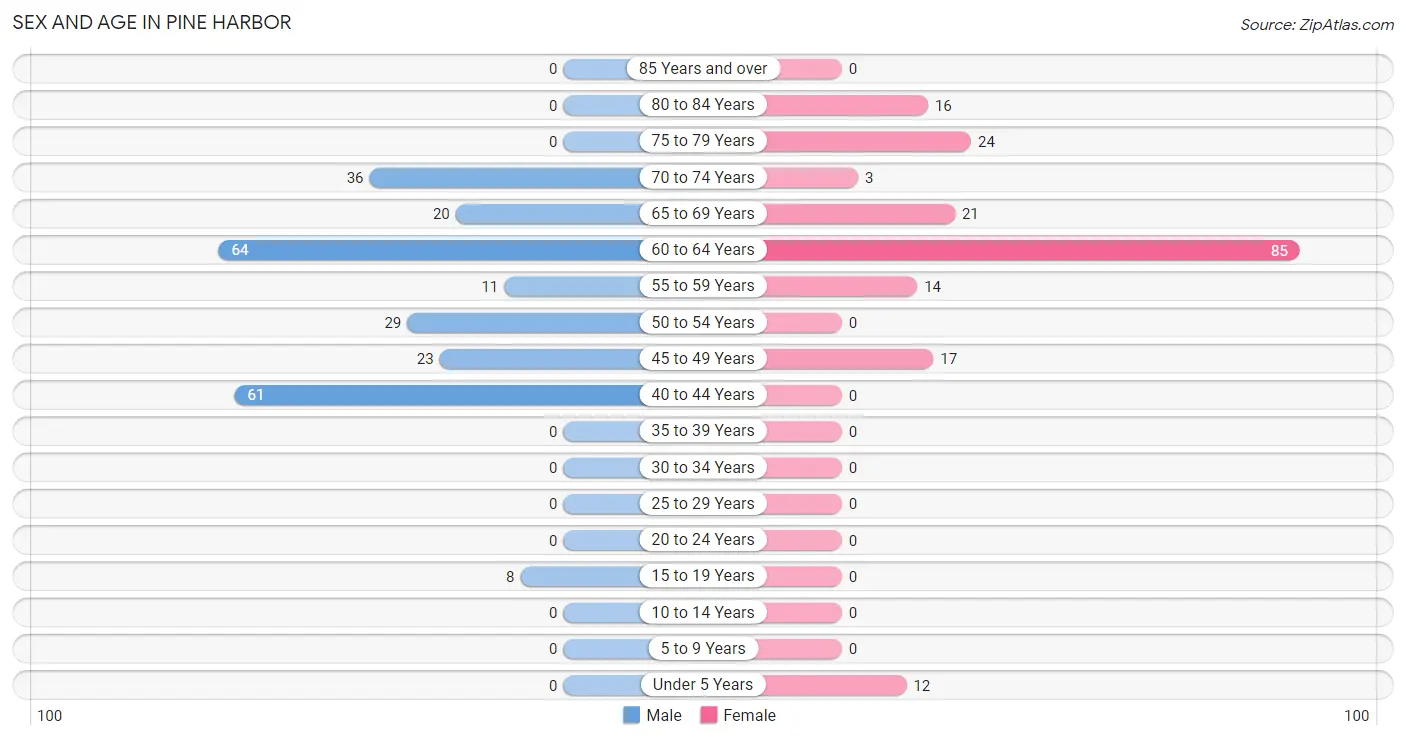
Sex and Age in Pine Harbor
Sex and Age in Pine Harbor
The most populous age groups in Pine Harbor are 60 to 64 Years (64 | 25.4%) for men and 60 to 64 Years (85 | 44.3%) for women.
| Age Bracket | Male | Female |
| Under 5 Years | 0 (0.0%) | 12 (6.2%) |
| 5 to 9 Years | 0 (0.0%) | 0 (0.0%) |
| 10 to 14 Years | 0 (0.0%) | 0 (0.0%) |
| 15 to 19 Years | 8 (3.2%) | 0 (0.0%) |
| 20 to 24 Years | 0 (0.0%) | 0 (0.0%) |
| 25 to 29 Years | 0 (0.0%) | 0 (0.0%) |
| 30 to 34 Years | 0 (0.0%) | 0 (0.0%) |
| 35 to 39 Years | 0 (0.0%) | 0 (0.0%) |
| 40 to 44 Years | 61 (24.2%) | 0 (0.0%) |
| 45 to 49 Years | 23 (9.1%) | 17 (8.8%) |
| 50 to 54 Years | 29 (11.5%) | 0 (0.0%) |
| 55 to 59 Years | 11 (4.4%) | 14 (7.3%) |
| 60 to 64 Years | 64 (25.4%) | 85 (44.3%) |
| 65 to 69 Years | 20 (7.9%) | 21 (10.9%) |
| 70 to 74 Years | 36 (14.3%) | 3 (1.6%) |
| 75 to 79 Years | 0 (0.0%) | 24 (12.5%) |
| 80 to 84 Years | 0 (0.0%) | 16 (8.3%) |
| 85 Years and over | 0 (0.0%) | 0 (0.0%) |
| Total | 252 (100.0%) | 192 (100.0%) |
Families and Households in Pine Harbor
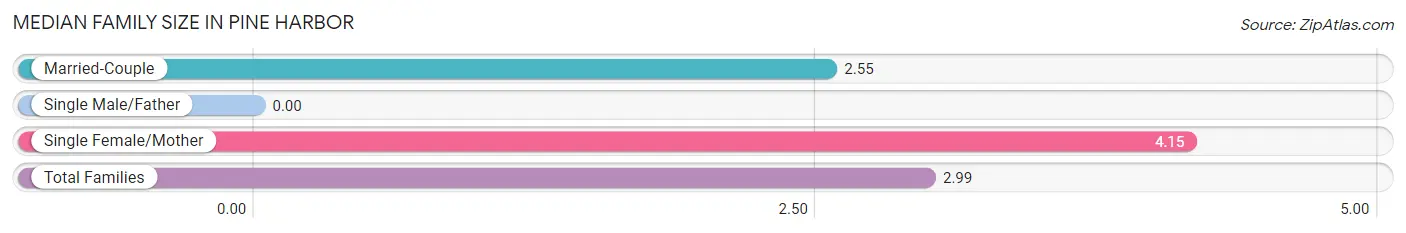
Median Family Size in Pine Harbor
| Family Type | # Families | Family Size |
| Married-Couple | 86 (72.3%) | 2.55 |
| Single Male/Father | 0 (0.0%) | - |
| Single Female/Mother | 33 (27.7%) | 4.15 |
| Total Families | 119 (100.0%) | 2.99 |
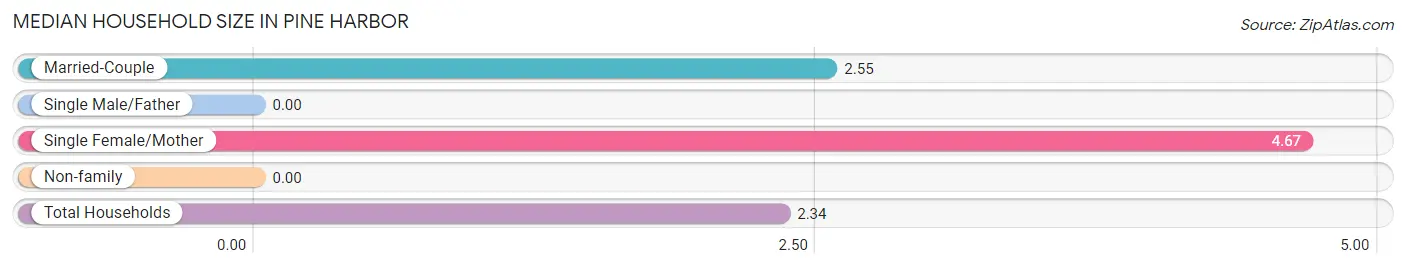
Median Household Size in Pine Harbor
| Household Type | # Households | Household Size |
| Married-Couple | 86 (45.3%) | 2.55 |
| Single Male/Father | 0 (0.0%) | - |
| Single Female/Mother | 33 (17.4%) | 4.67 |
| Non-family | 71 (37.4%) | - |
| Total Households | 190 (100.0%) | 2.34 |
Household Size by Marriage Status in Pine Harbor
Out of a total of 190 households in Pine Harbor, 119 (62.6%) are family households, while 71 (37.4%) are nonfamily households. The most numerous type of family households are 2-person households, comprising 83, and the most common type of nonfamily households are 1-person households, comprising 71.
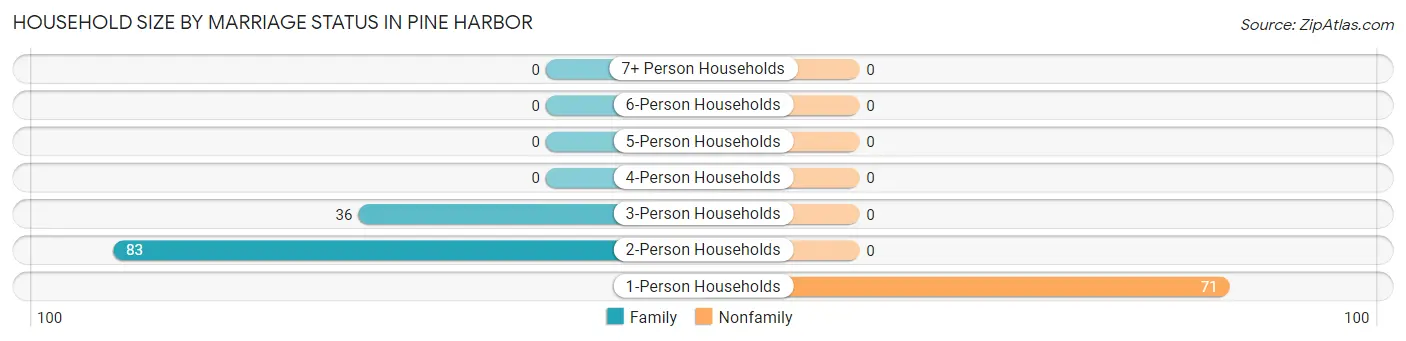
| Household Size | Family Households | Nonfamily Households |
| 1-Person Households | - | 71 (37.4%) |
| 2-Person Households | 83 (43.7%) | 0 (0.0%) |
| 3-Person Households | 36 (19.0%) | 0 (0.0%) |
| 4-Person Households | 0 (0.0%) | 0 (0.0%) |
| 5-Person Households | 0 (0.0%) | 0 (0.0%) |
| 6-Person Households | 0 (0.0%) | 0 (0.0%) |
| 7+ Person Households | 0 (0.0%) | 0 (0.0%) |
| Total | 119 (62.6%) | 71 (37.4%) |
Female Fertility in Pine Harbor
Fertility by Age in Pine Harbor
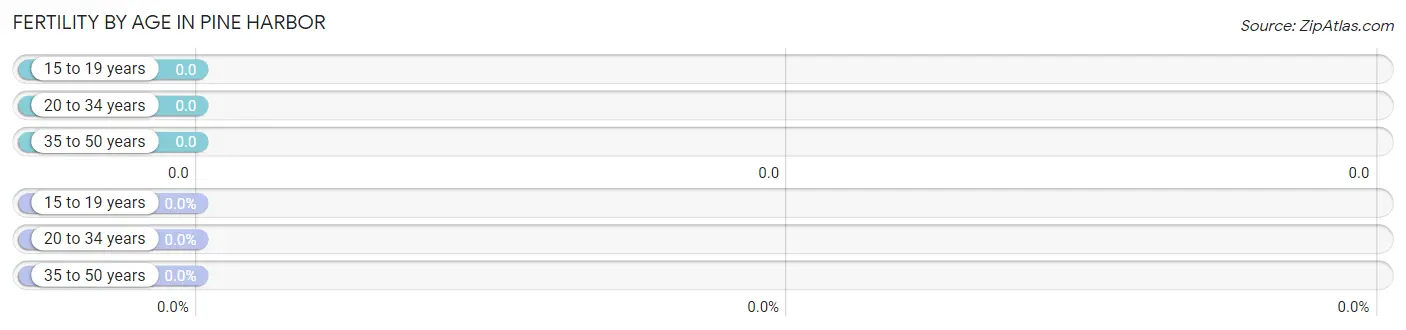
| Age Bracket | Women with Births | Births / 1,000 Women |
| 15 to 19 years | 0 (0.0%) | 0.0 |
| 20 to 34 years | 0 (0.0%) | 0.0 |
| 35 to 50 years | 0 (0.0%) | 0.0 |
| Total | 0 (0.0%) | 0.0 |
Fertility by Age by Marriage Status in Pine Harbor
| Age Bracket | Married | Unmarried |
| 15 to 19 years | 0 (0.0%) | 0 (0.0%) |
| 20 to 34 years | 0 (0.0%) | 0 (0.0%) |
| 35 to 50 years | 0 (0.0%) | 0 (0.0%) |
| Total | 0 (0.0%) | 0 (0.0%) |
Fertility by Education in Pine Harbor
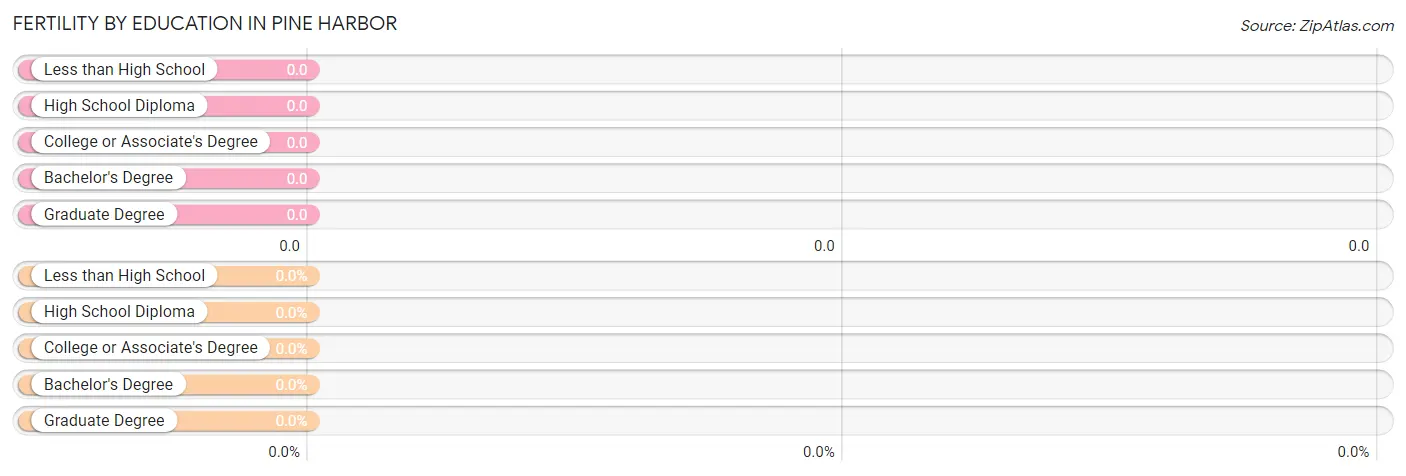
| Educational Attainment | Women with Births | Births / 1,000 Women |
| Less than High School | 0 (0.0%) | 0.0 |
| High School Diploma | 0 (0.0%) | 0.0 |
| College or Associate's Degree | 0 (0.0%) | 0.0 |
| Bachelor's Degree | 0 (0.0%) | 0.0 |
| Graduate Degree | 0 (0.0%) | 0.0 |
| Total | 0 (0.0%) | 0.0 |
Fertility by Education by Marriage Status in Pine Harbor
| Educational Attainment | Married | Unmarried |
| Less than High School | 0 (0.0%) | 0 (0.0%) |
| High School Diploma | 0 (0.0%) | 0 (0.0%) |
| College or Associate's Degree | 0 (0.0%) | 0 (0.0%) |
| Bachelor's Degree | 0 (0.0%) | 0 (0.0%) |
| Graduate Degree | 0 (0.0%) | 0 (0.0%) |
| Total | 0 (0.0%) | 0 (0.0%) |
Employment Characteristics in Pine Harbor
Employment by Class of Employer in Pine Harbor
Among the 50 employed individuals in Pine Harbor, private company employees (37 | 74.0%), and self-employed (not incorporated) (13 | 26.0%) make up the most common classes of employment.
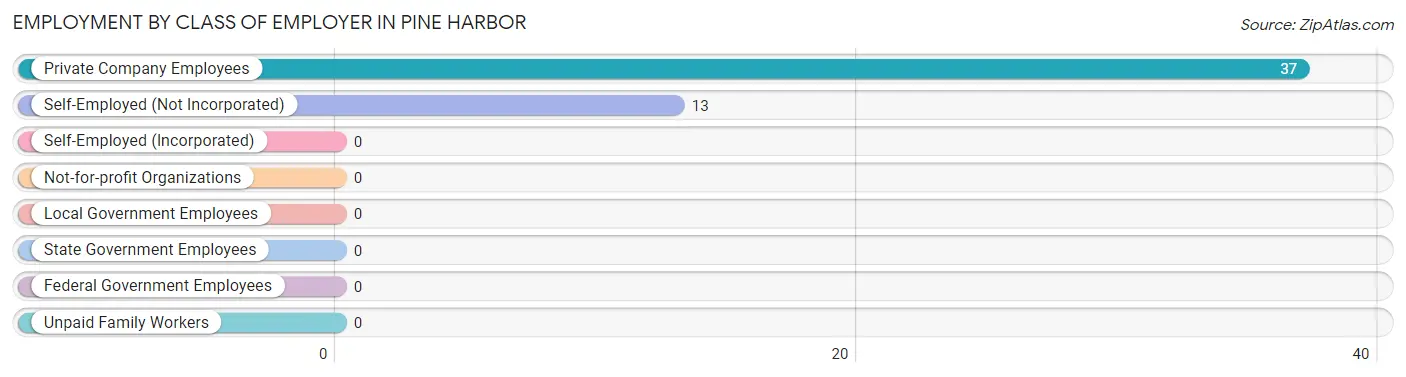
| Employer Class | # Employees | % Employees |
| Private Company Employees | 37 | 74.0% |
| Self-Employed (Incorporated) | 0 | 0.0% |
| Self-Employed (Not Incorporated) | 13 | 26.0% |
| Not-for-profit Organizations | 0 | 0.0% |
| Local Government Employees | 0 | 0.0% |
| State Government Employees | 0 | 0.0% |
| Federal Government Employees | 0 | 0.0% |
| Unpaid Family Workers | 0 | 0.0% |
| Total | 50 | 100.0% |
Employment Status by Age in Pine Harbor
According to the labor force statistics for Pine Harbor, out of the total population over 16 years of age (432), 24.8% or 107 individuals are in the labor force, with 43.0% or 46 of them unemployed. The age group with the highest labor force participation rate is 16 to 19 years, with 100.0% or 8 individuals in the labor force. Within the labor force, the 45 to 54 years age range has the highest percentage of unemployed individuals, with 63.0% or 29 of them being unemployed.
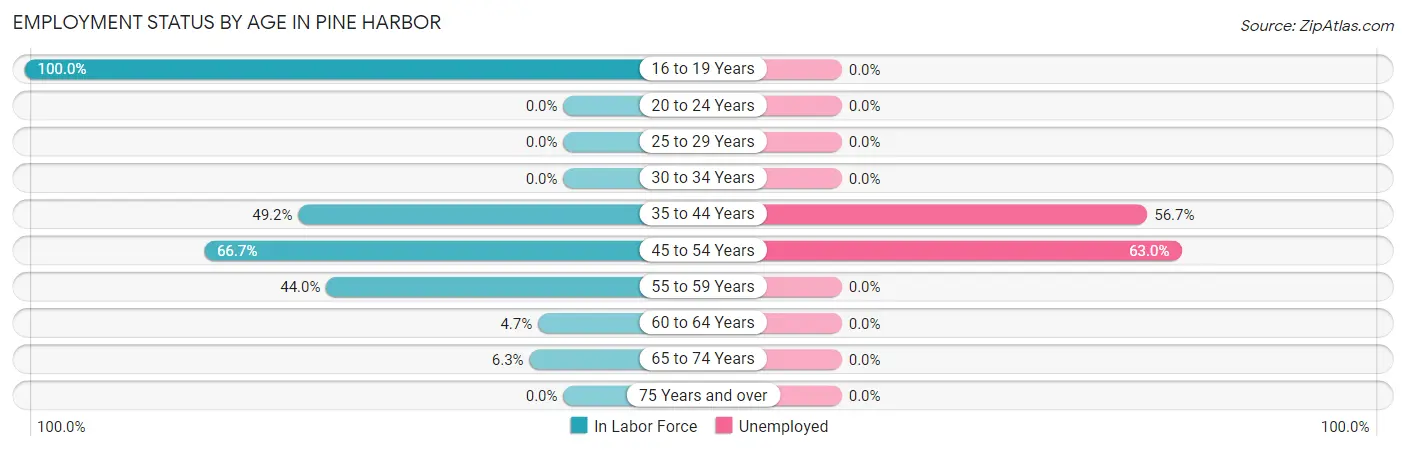
| Age Bracket | In Labor Force | Unemployed |
| 16 to 19 Years | 8 (100.0%) | 0 (0.0%) |
| 20 to 24 Years | 0 (0.0%) | 0 (0.0%) |
| 25 to 29 Years | 0 (0.0%) | 0 (0.0%) |
| 30 to 34 Years | 0 (0.0%) | 0 (0.0%) |
| 35 to 44 Years | 30 (49.2%) | 17 (56.7%) |
| 45 to 54 Years | 46 (66.7%) | 29 (63.0%) |
| 55 to 59 Years | 11 (44.0%) | 0 (0.0%) |
| 60 to 64 Years | 7 (4.7%) | 0 (0.0%) |
| 65 to 74 Years | 5 (6.3%) | 0 (0.0%) |
| 75 Years and over | 0 (0.0%) | 0 (0.0%) |
| Total | 107 (24.8%) | 46 (43.0%) |
Employment Status by Educational Attainment in Pine Harbor
According to labor force statistics for Pine Harbor, 30.9% of individuals (94) out of the total population between 25 and 64 years of age (304) are in the labor force, with 48.9% or 46 of them being unemployed. The group with the highest labor force participation rate are those with the educational attainment of college / associate degree, with 58.6% or 41 individuals in the labor force. Within the labor force, individuals with high school diploma education have the highest percentage of unemployment, with 69.0% or 29 of them being unemployed.
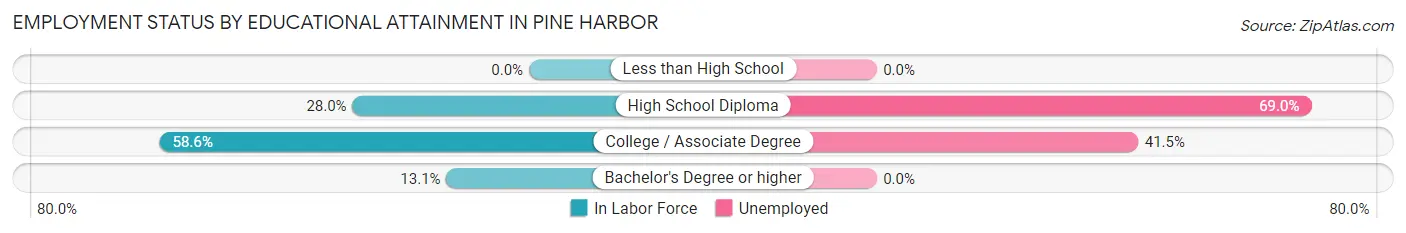
| Educational Attainment | In Labor Force | Unemployed |
| Less than High School | 0 (0.0%) | 0 (0.0%) |
| High School Diploma | 42 (28.0%) | 104 (69.0%) |
| College / Associate Degree | 41 (58.6%) | 29 (41.5%) |
| Bachelor's Degree or higher | 11 (13.1%) | 0 (0.0%) |
| Total | 94 (30.9%) | 149 (48.9%) |
Employment Occupations by Sex in Pine Harbor
Management, Business, Science and Arts Occupations
The most common Management, Business, Science and Arts occupations in Pine Harbor are , and Management (17 | 27.9%).
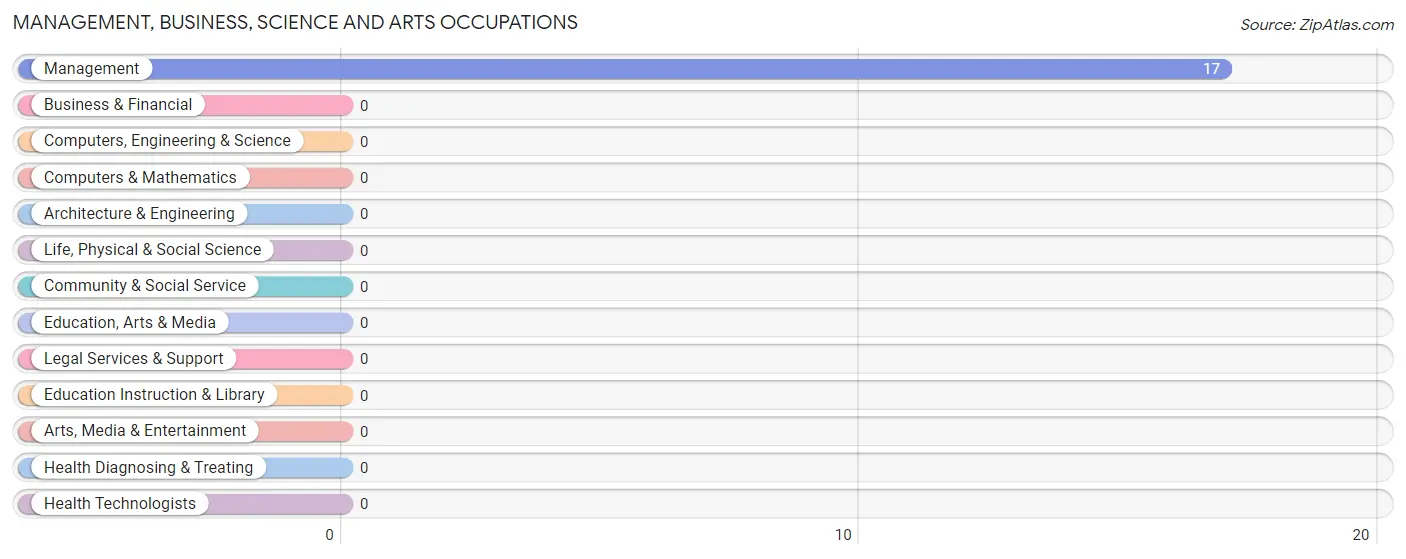
Management, Business, Science and Arts Occupations by Sex
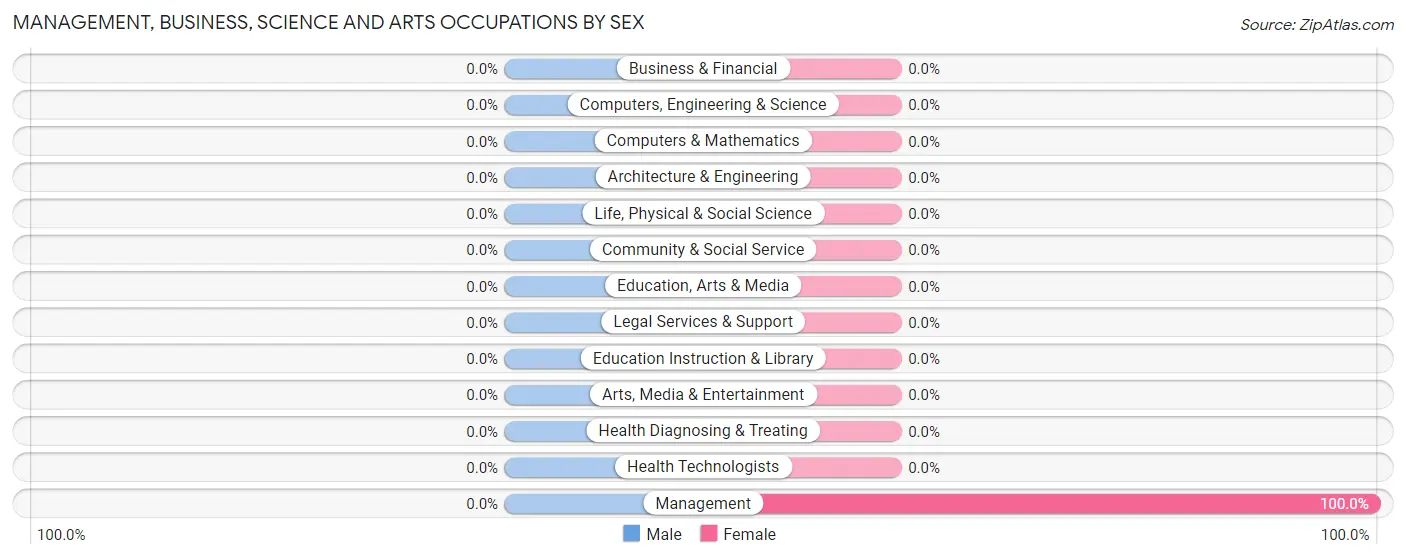
| Occupation | Male | Female |
| Management | 0 (0.0%) | 17 (100.0%) |
| Business & Financial | 0 (0.0%) | 0 (0.0%) |
| Computers, Engineering & Science | 0 (0.0%) | 0 (0.0%) |
| Computers & Mathematics | 0 (0.0%) | 0 (0.0%) |
| Architecture & Engineering | 0 (0.0%) | 0 (0.0%) |
| Life, Physical & Social Science | 0 (0.0%) | 0 (0.0%) |
| Community & Social Service | 0 (0.0%) | 0 (0.0%) |
| Education, Arts & Media | 0 (0.0%) | 0 (0.0%) |
| Legal Services & Support | 0 (0.0%) | 0 (0.0%) |
| Education Instruction & Library | 0 (0.0%) | 0 (0.0%) |
| Arts, Media & Entertainment | 0 (0.0%) | 0 (0.0%) |
| Health Diagnosing & Treating | 0 (0.0%) | 0 (0.0%) |
| Health Technologists | 0 (0.0%) | 0 (0.0%) |
| Total (Category) | 0 (0.0%) | 17 (100.0%) |
| Total (Overall) | 32 (52.5%) | 29 (47.5%) |
Services Occupations
The most common Services occupations in Pine Harbor are , and Healthcare Support (7 | 11.5%).
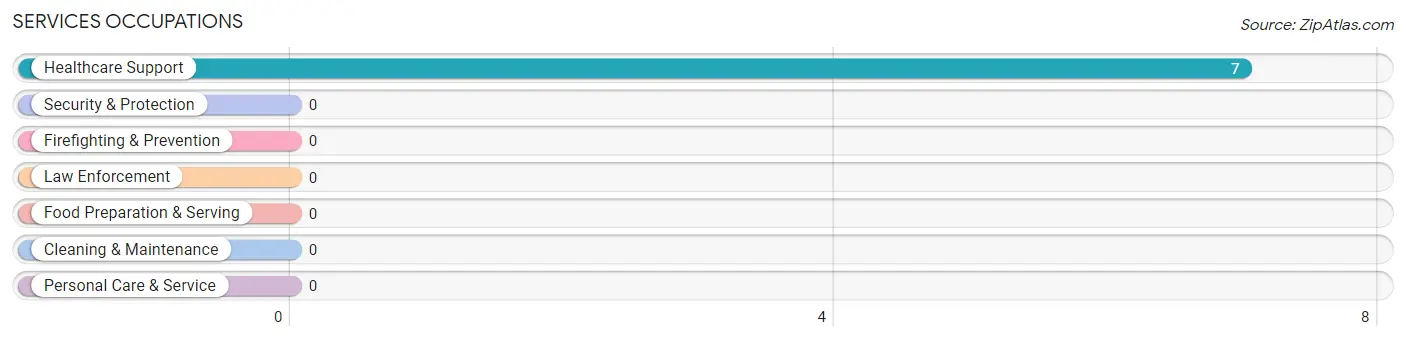
Services Occupations by Sex
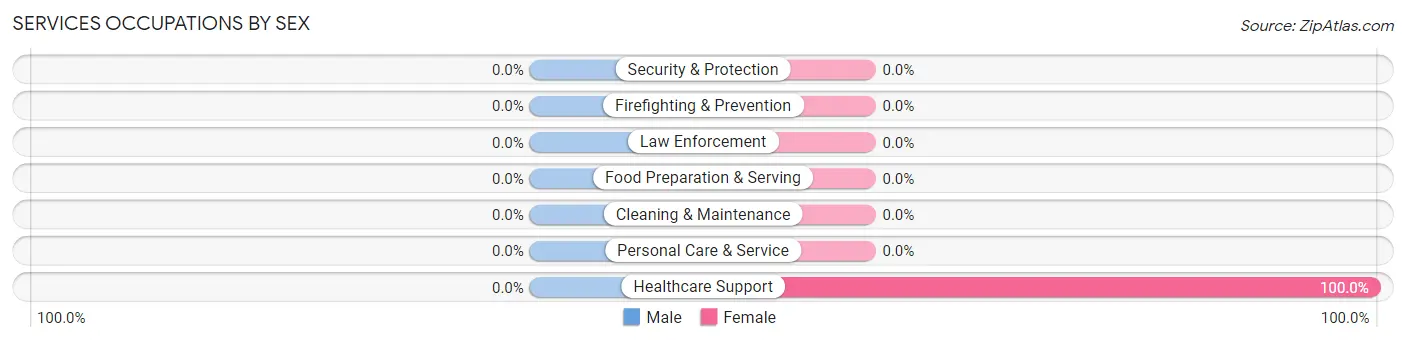
| Occupation | Male | Female |
| Healthcare Support | 0 (0.0%) | 7 (100.0%) |
| Security & Protection | 0 (0.0%) | 0 (0.0%) |
| Firefighting & Prevention | 0 (0.0%) | 0 (0.0%) |
| Law Enforcement | 0 (0.0%) | 0 (0.0%) |
| Food Preparation & Serving | 0 (0.0%) | 0 (0.0%) |
| Cleaning & Maintenance | 0 (0.0%) | 0 (0.0%) |
| Personal Care & Service | 0 (0.0%) | 0 (0.0%) |
| Total (Category) | 0 (0.0%) | 7 (100.0%) |
| Total (Overall) | 32 (52.5%) | 29 (47.5%) |
Sales and Office Occupations
The most common Sales and Office occupations in Pine Harbor are , and Office & Administration (5 | 8.2%).
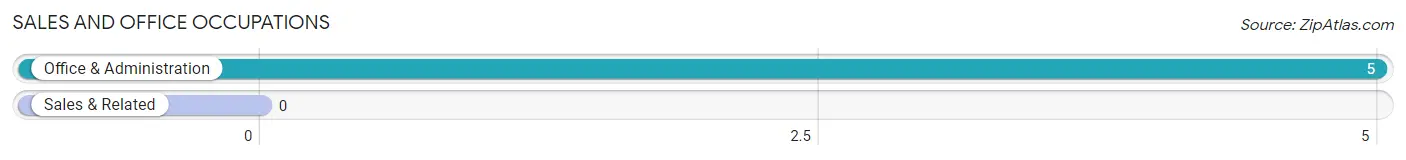
Sales and Office Occupations by Sex
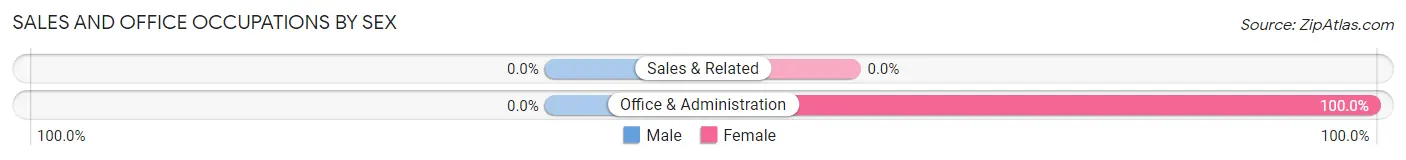
| Occupation | Male | Female |
| Sales & Related | 0 (0.0%) | 0 (0.0%) |
| Office & Administration | 0 (0.0%) | 5 (100.0%) |
| Total (Category) | 0 (0.0%) | 5 (100.0%) |
| Total (Overall) | 32 (52.5%) | 29 (47.5%) |
Natural Resources, Construction and Maintenance Occupations
The most common Natural Resources, Construction and Maintenance occupations in Pine Harbor are , and Construction & Extraction (32 | 52.5%).
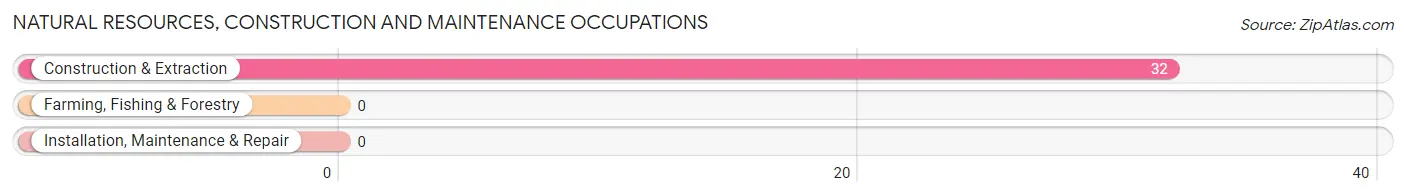
Natural Resources, Construction and Maintenance Occupations by Sex
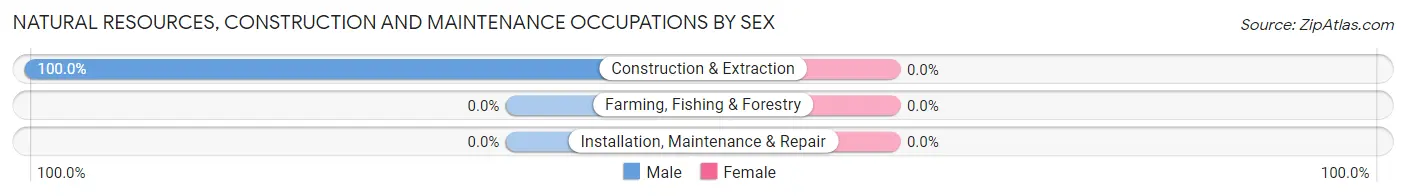
| Occupation | Male | Female |
| Farming, Fishing & Forestry | 0 (0.0%) | 0 (0.0%) |
| Construction & Extraction | 32 (100.0%) | 0 (0.0%) |
| Installation, Maintenance & Repair | 0 (0.0%) | 0 (0.0%) |
| Total (Category) | 32 (100.0%) | 0 (0.0%) |
| Total (Overall) | 32 (52.5%) | 29 (47.5%) |
Production, Transportation and Moving Occupations
Production, Transportation and Moving Occupations by Sex
| Occupation | Male | Female |
| Production | 0 (0.0%) | 0 (0.0%) |
| Transportation | 0 (0.0%) | 0 (0.0%) |
| Material Moving | 0 (0.0%) | 0 (0.0%) |
| Total (Category) | 0 (0.0%) | 0 (0.0%) |
| Total (Overall) | 32 (52.5%) | 29 (47.5%) |
Employment Industries by Sex in Pine Harbor
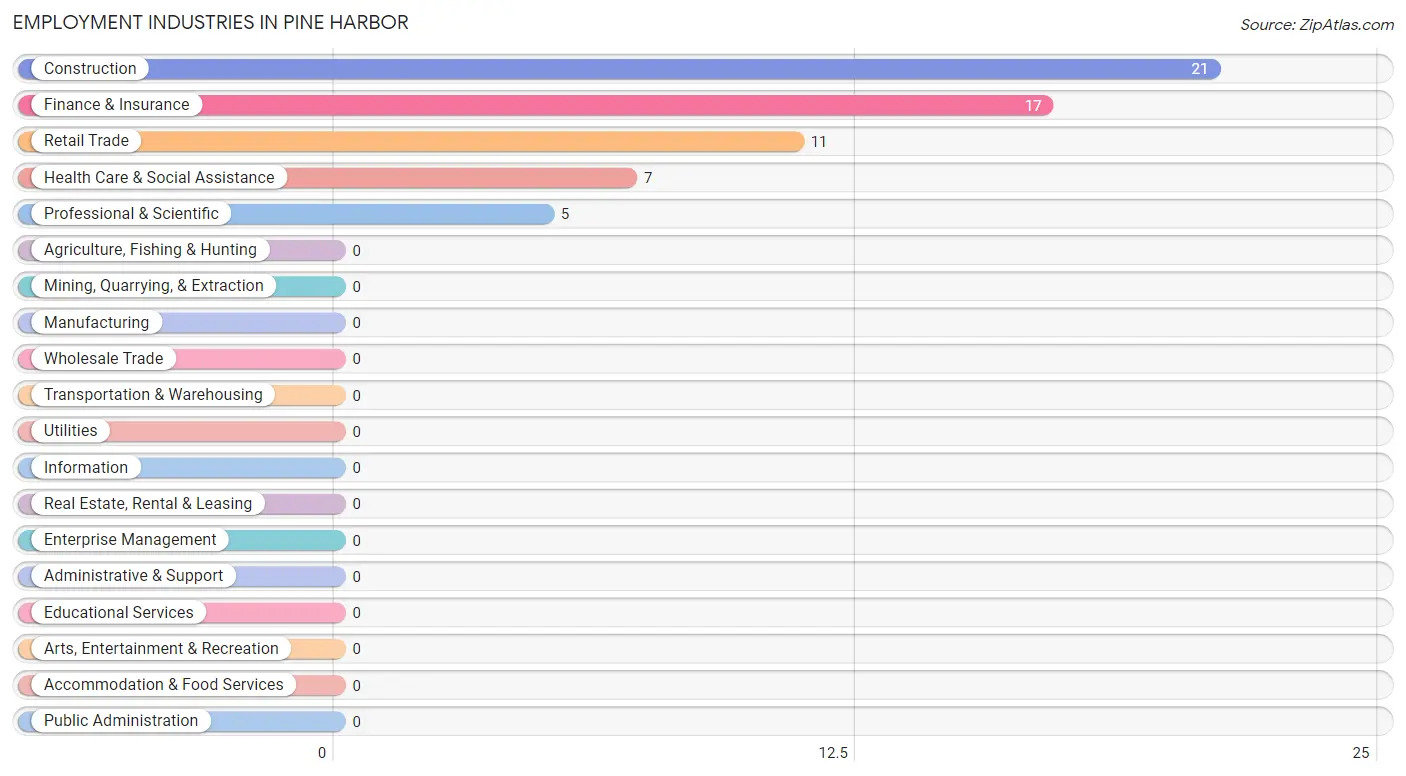
Employment Industries in Pine Harbor
The major employment industries in Pine Harbor include Construction (21 | 34.4%), Finance & Insurance (17 | 27.9%), Retail Trade (11 | 18.0%), Health Care & Social Assistance (7 | 11.5%), and Professional & Scientific (5 | 8.2%).
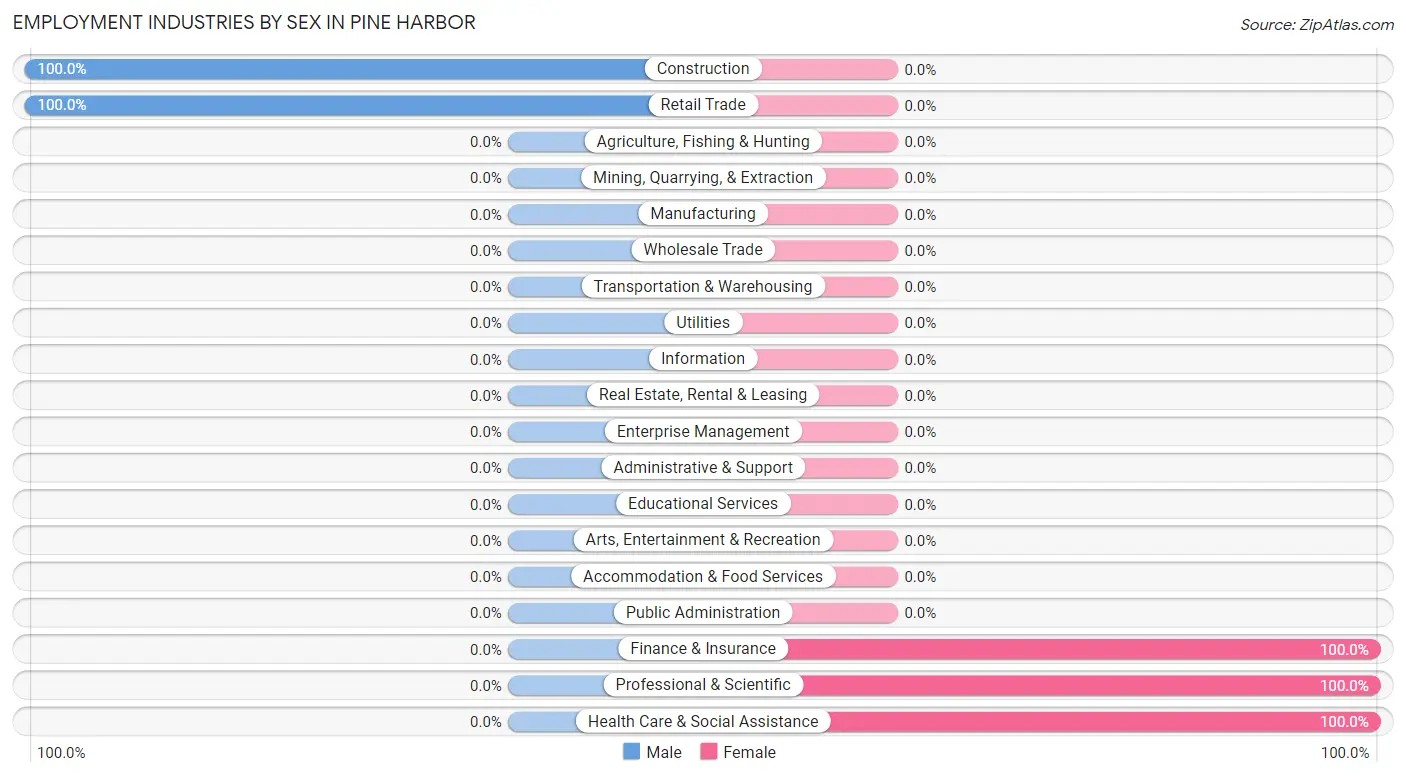
Employment Industries by Sex in Pine Harbor
The Pine Harbor industries that see more men than women are Construction (100.0%), and Retail Trade (100.0%), whereas the industries that tend to have a higher number of women are Finance & Insurance (100.0%), Professional & Scientific (100.0%), and Health Care & Social Assistance (100.0%).
| Industry | Male | Female |
| Agriculture, Fishing & Hunting | 0 (0.0%) | 0 (0.0%) |
| Mining, Quarrying, & Extraction | 0 (0.0%) | 0 (0.0%) |
| Construction | 21 (100.0%) | 0 (0.0%) |
| Manufacturing | 0 (0.0%) | 0 (0.0%) |
| Wholesale Trade | 0 (0.0%) | 0 (0.0%) |
| Retail Trade | 11 (100.0%) | 0 (0.0%) |
| Transportation & Warehousing | 0 (0.0%) | 0 (0.0%) |
| Utilities | 0 (0.0%) | 0 (0.0%) |
| Information | 0 (0.0%) | 0 (0.0%) |
| Finance & Insurance | 0 (0.0%) | 17 (100.0%) |
| Real Estate, Rental & Leasing | 0 (0.0%) | 0 (0.0%) |
| Professional & Scientific | 0 (0.0%) | 5 (100.0%) |
| Enterprise Management | 0 (0.0%) | 0 (0.0%) |
| Administrative & Support | 0 (0.0%) | 0 (0.0%) |
| Educational Services | 0 (0.0%) | 0 (0.0%) |
| Health Care & Social Assistance | 0 (0.0%) | 7 (100.0%) |
| Arts, Entertainment & Recreation | 0 (0.0%) | 0 (0.0%) |
| Accommodation & Food Services | 0 (0.0%) | 0 (0.0%) |
| Public Administration | 0 (0.0%) | 0 (0.0%) |
| Total | 32 (52.5%) | 29 (47.5%) |
Education in Pine Harbor
School Enrollment in Pine Harbor
| School Level | # Students | % Students |
| Nursery / Preschool | 0 | 0.0% |
| Kindergarten | 0 | 0.0% |
| Elementary School | 0 | 0.0% |
| Middle School | 0 | 0.0% |
| High School | 0 | 0.0% |
| College / Undergraduate | 0 | 0.0% |
| Graduate / Professional | 0 | 0.0% |
| Total | 0 | 0.0% |
School Enrollment by Age by Funding Source in Pine Harbor
| Age Bracket | Public School | Private School |
| 3 to 4 Year Olds | 0 (0.0%) | 0 (0.0%) |
| 5 to 9 Year Old | 0 (0.0%) | 0 (0.0%) |
| 10 to 14 Year Olds | 0 (0.0%) | 0 (0.0%) |
| 15 to 17 Year Olds | 0 (0.0%) | 0 (0.0%) |
| 18 to 19 Year Olds | 0 (0.0%) | 0 (0.0%) |
| 20 to 24 Year Olds | 0 (0.0%) | 0 (0.0%) |
| 25 to 34 Year Olds | 0 (0.0%) | 0 (0.0%) |
| 35 Years and over | 0 (0.0%) | 0 (0.0%) |
| Total | 0 (0.0%) | 0 (0.0%) |
Educational Attainment by Field of Study in Pine Harbor
Education (35 | 34.6%), computers & mathematics (23 | 22.8%), liberal arts & history (21 | 20.8%), business (17 | 16.8%), and visual & performing arts (5 | 5.0%) are the most common fields of study among 101 individuals in Pine Harbor who have obtained a bachelor's degree or higher.
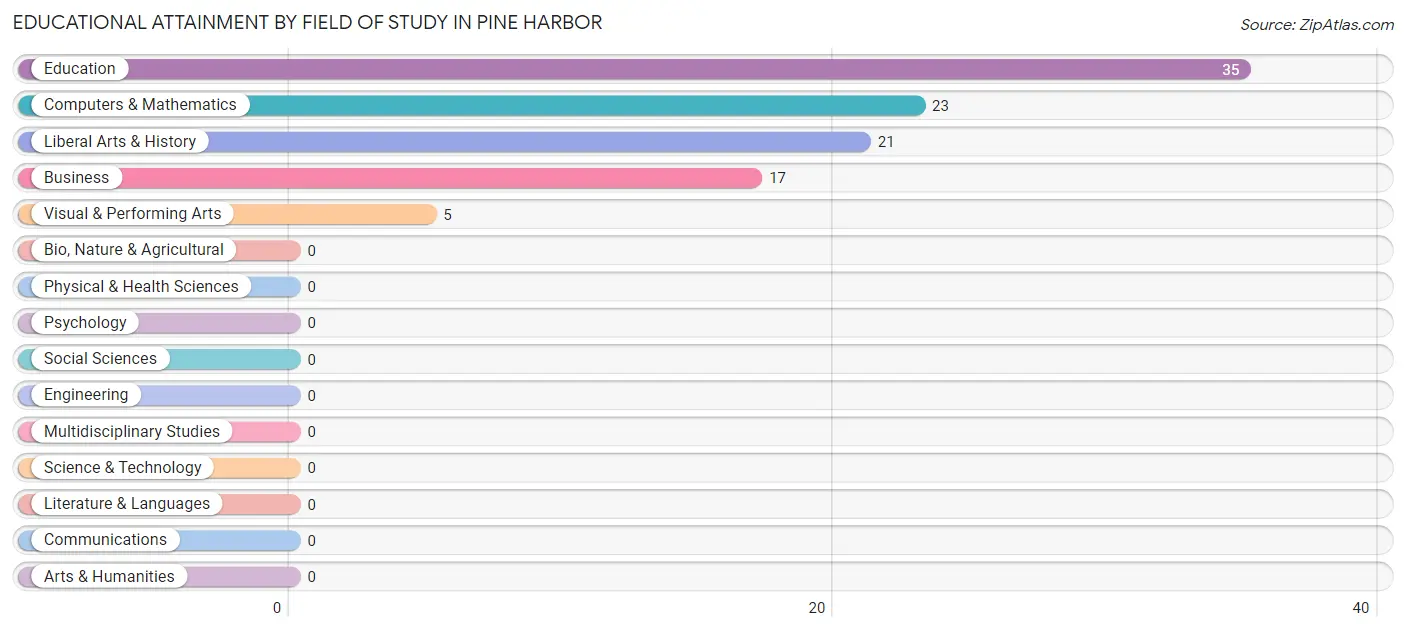
| Field of Study | # Graduates | % Graduates |
| Computers & Mathematics | 23 | 22.8% |
| Bio, Nature & Agricultural | 0 | 0.0% |
| Physical & Health Sciences | 0 | 0.0% |
| Psychology | 0 | 0.0% |
| Social Sciences | 0 | 0.0% |
| Engineering | 0 | 0.0% |
| Multidisciplinary Studies | 0 | 0.0% |
| Science & Technology | 0 | 0.0% |
| Business | 17 | 16.8% |
| Education | 35 | 34.6% |
| Literature & Languages | 0 | 0.0% |
| Liberal Arts & History | 21 | 20.8% |
| Visual & Performing Arts | 5 | 5.0% |
| Communications | 0 | 0.0% |
| Arts & Humanities | 0 | 0.0% |
| Total | 101 | 100.0% |
Transportation & Commute in Pine Harbor
Vehicle Availability by Sex in Pine Harbor
The most prevalent vehicle ownership categories in Pine Harbor are males with 3 vehicles (21, accounting for 100.0%) and females with 3 vehicles (17, making up 72.4%).
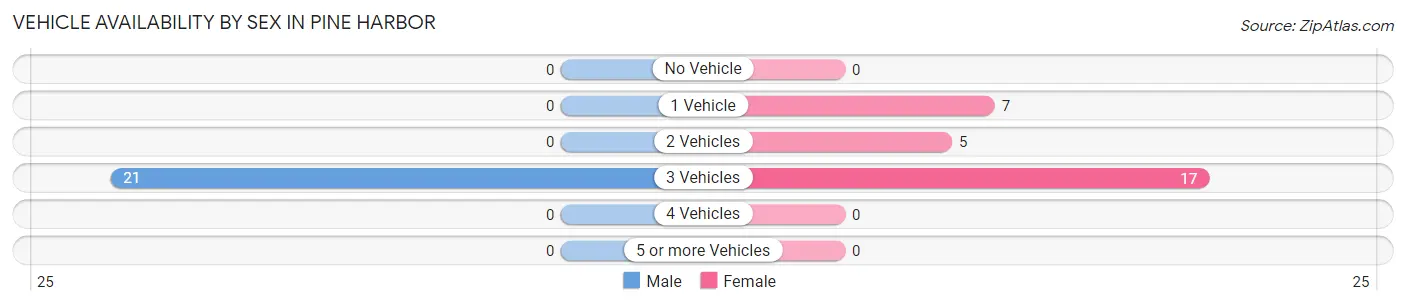
| Vehicles Available | Male | Female |
| No Vehicle | 0 (0.0%) | 0 (0.0%) |
| 1 Vehicle | 0 (0.0%) | 7 (24.1%) |
| 2 Vehicles | 0 (0.0%) | 5 (17.2%) |
| 3 Vehicles | 21 (100.0%) | 17 (58.6%) |
| 4 Vehicles | 0 (0.0%) | 0 (0.0%) |
| 5 or more Vehicles | 0 (0.0%) | 0 (0.0%) |
| Total | 21 (100.0%) | 29 (100.0%) |
Commute Time in Pine Harbor
The most frequently occuring commute durations in Pine Harbor are less than 5 minutes (20 commuters, 40.0%), 40 to 44 minutes (17 commuters, 34.0%), and 90 or more minutes (8 commuters, 16.0%).
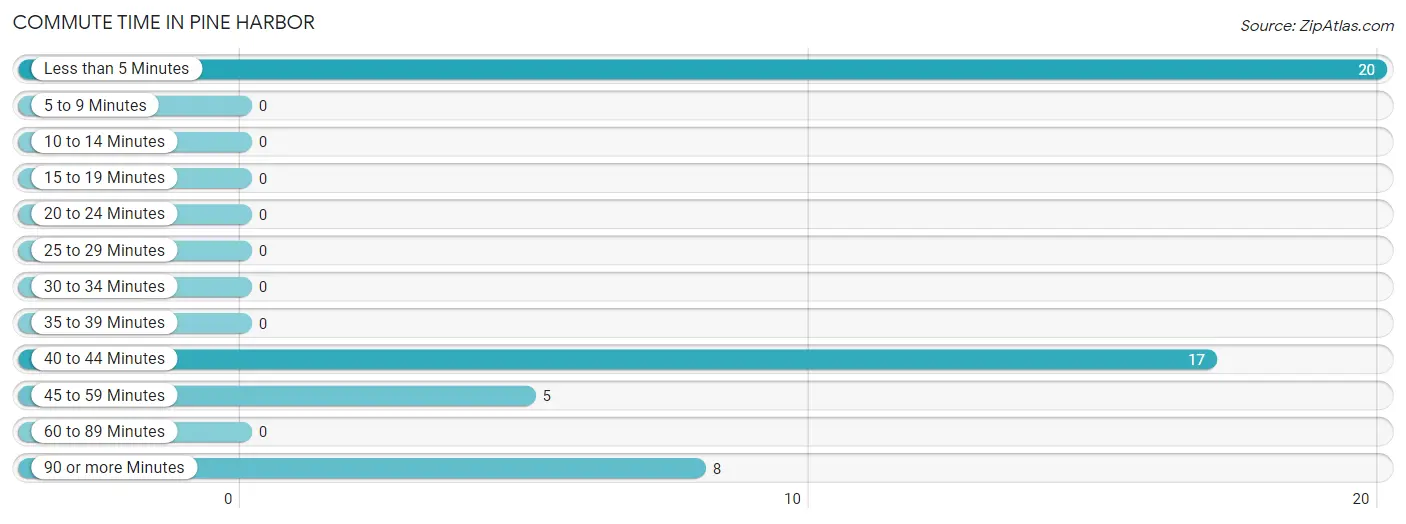
| Commute Time | # Commuters | % Commuters |
| Less than 5 Minutes | 20 | 40.0% |
| 5 to 9 Minutes | 0 | 0.0% |
| 10 to 14 Minutes | 0 | 0.0% |
| 15 to 19 Minutes | 0 | 0.0% |
| 20 to 24 Minutes | 0 | 0.0% |
| 25 to 29 Minutes | 0 | 0.0% |
| 30 to 34 Minutes | 0 | 0.0% |
| 35 to 39 Minutes | 0 | 0.0% |
| 40 to 44 Minutes | 17 | 34.0% |
| 45 to 59 Minutes | 5 | 10.0% |
| 60 to 89 Minutes | 0 | 0.0% |
| 90 or more Minutes | 8 | 16.0% |
Commute Time by Sex in Pine Harbor
The most common commute times in Pine Harbor are less than 5 minutes (13 commuters, 61.9%) for males and 40 to 44 minutes (17 commuters, 58.6%) for females.
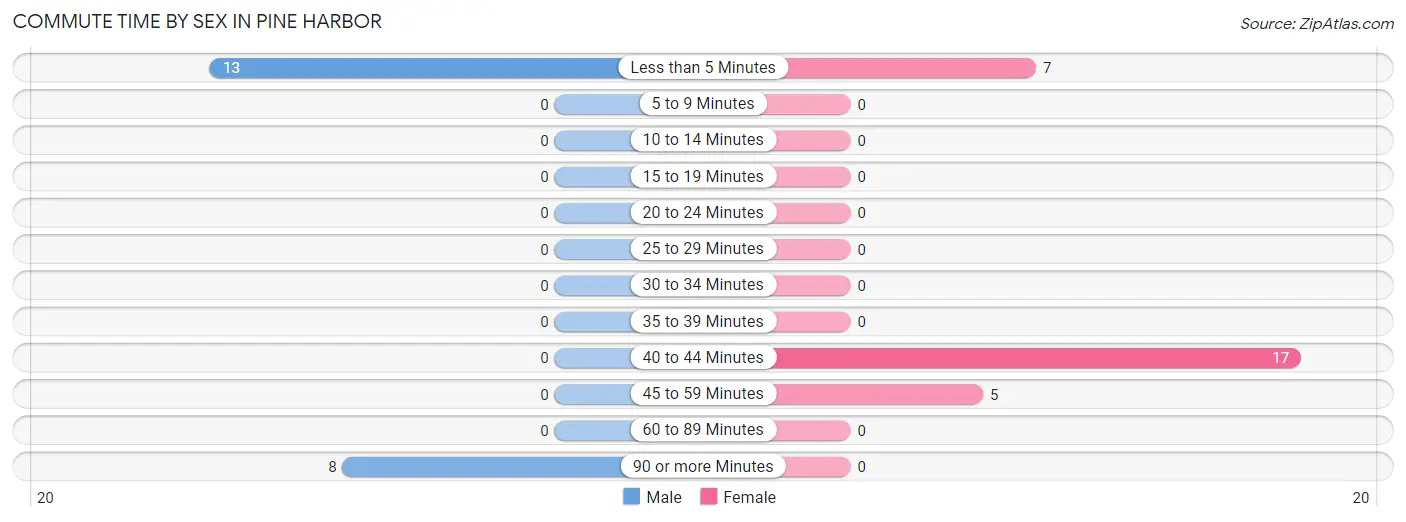
| Commute Time | Male | Female |
| Less than 5 Minutes | 13 (61.9%) | 7 (24.1%) |
| 5 to 9 Minutes | 0 (0.0%) | 0 (0.0%) |
| 10 to 14 Minutes | 0 (0.0%) | 0 (0.0%) |
| 15 to 19 Minutes | 0 (0.0%) | 0 (0.0%) |
| 20 to 24 Minutes | 0 (0.0%) | 0 (0.0%) |
| 25 to 29 Minutes | 0 (0.0%) | 0 (0.0%) |
| 30 to 34 Minutes | 0 (0.0%) | 0 (0.0%) |
| 35 to 39 Minutes | 0 (0.0%) | 0 (0.0%) |
| 40 to 44 Minutes | 0 (0.0%) | 17 (58.6%) |
| 45 to 59 Minutes | 0 (0.0%) | 5 (17.2%) |
| 60 to 89 Minutes | 0 (0.0%) | 0 (0.0%) |
| 90 or more Minutes | 8 (38.1%) | 0 (0.0%) |
Time of Departure to Work by Sex in Pine Harbor
The most frequent times of departure to work in Pine Harbor are 6:30 AM to 6:59 AM (13, 61.9%) for males and 9:00 AM to 9:59 AM (24, 82.8%) for females.
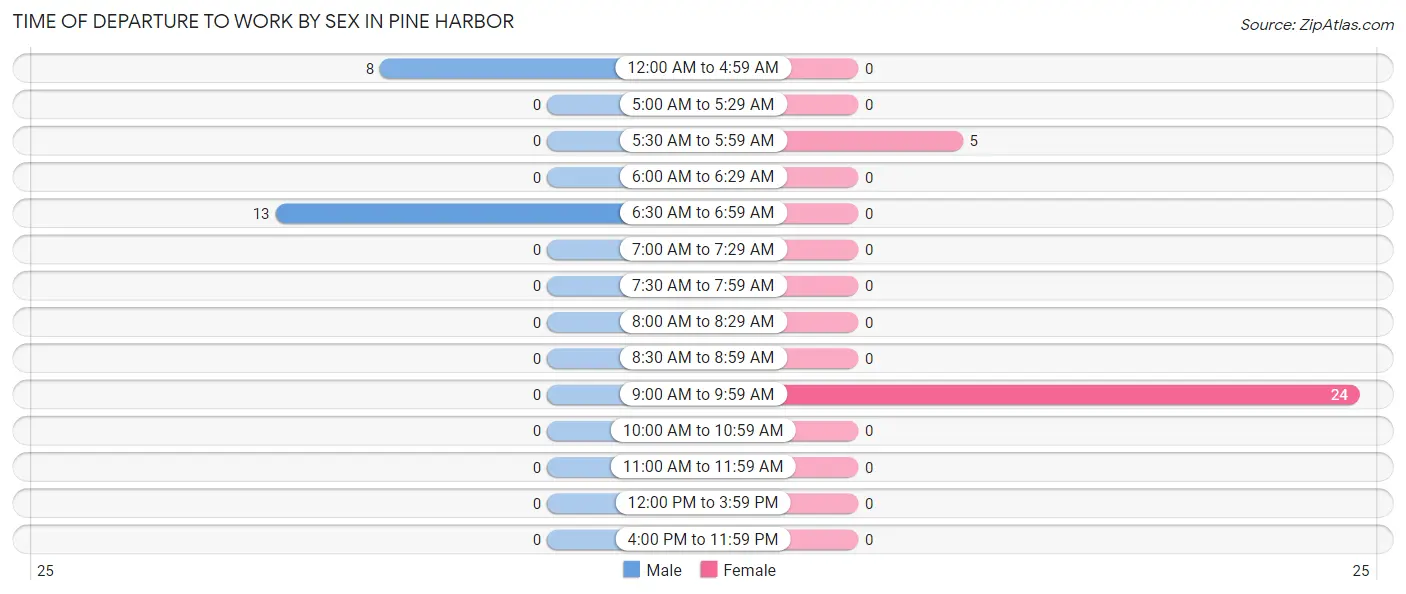
| Time of Departure | Male | Female |
| 12:00 AM to 4:59 AM | 8 (38.1%) | 0 (0.0%) |
| 5:00 AM to 5:29 AM | 0 (0.0%) | 0 (0.0%) |
| 5:30 AM to 5:59 AM | 0 (0.0%) | 5 (17.2%) |
| 6:00 AM to 6:29 AM | 0 (0.0%) | 0 (0.0%) |
| 6:30 AM to 6:59 AM | 13 (61.9%) | 0 (0.0%) |
| 7:00 AM to 7:29 AM | 0 (0.0%) | 0 (0.0%) |
| 7:30 AM to 7:59 AM | 0 (0.0%) | 0 (0.0%) |
| 8:00 AM to 8:29 AM | 0 (0.0%) | 0 (0.0%) |
| 8:30 AM to 8:59 AM | 0 (0.0%) | 0 (0.0%) |
| 9:00 AM to 9:59 AM | 0 (0.0%) | 24 (82.8%) |
| 10:00 AM to 10:59 AM | 0 (0.0%) | 0 (0.0%) |
| 11:00 AM to 11:59 AM | 0 (0.0%) | 0 (0.0%) |
| 12:00 PM to 3:59 PM | 0 (0.0%) | 0 (0.0%) |
| 4:00 PM to 11:59 PM | 0 (0.0%) | 0 (0.0%) |
| Total | 21 (100.0%) | 29 (100.0%) |
Housing Occupancy in Pine Harbor
Occupancy by Ownership in Pine Harbor
Of the total 190 dwellings in Pine Harbor, owner-occupied units account for 179 (94.2%), while renter-occupied units make up 11 (5.8%).
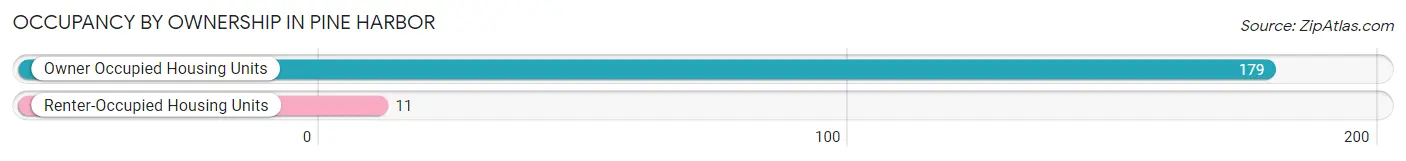
| Occupancy | # Housing Units | % Housing Units |
| Owner Occupied Housing Units | 179 | 94.2% |
| Renter-Occupied Housing Units | 11 | 5.8% |
| Total Occupied Housing Units | 190 | 100.0% |
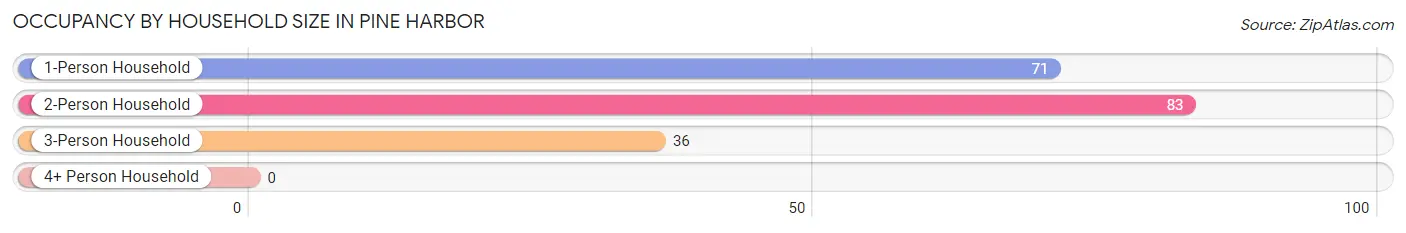
Occupancy by Household Size in Pine Harbor
| Household Size | # Housing Units | % Housing Units |
| 1-Person Household | 71 | 37.4% |
| 2-Person Household | 83 | 43.7% |
| 3-Person Household | 36 | 19.0% |
| 4+ Person Household | 0 | 0.0% |
| Total Housing Units | 190 | 100.0% |
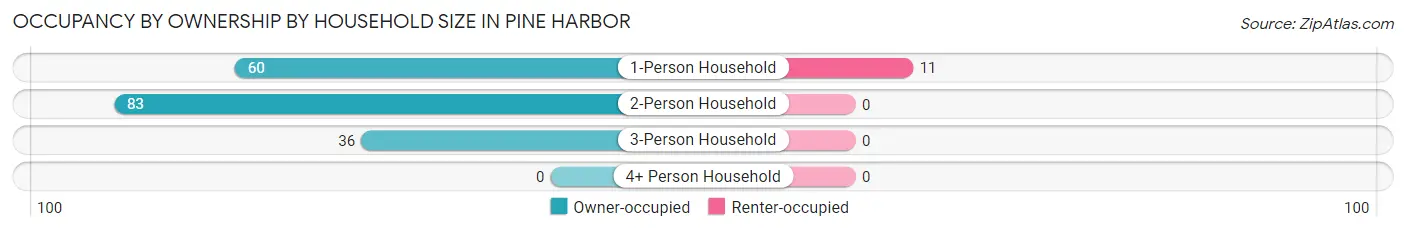
Occupancy by Ownership by Household Size in Pine Harbor
| Household Size | Owner-occupied | Renter-occupied |
| 1-Person Household | 60 (84.5%) | 11 (15.5%) |
| 2-Person Household | 83 (100.0%) | 0 (0.0%) |
| 3-Person Household | 36 (100.0%) | 0 (0.0%) |
| 4+ Person Household | 0 (0.0%) | 0 (0.0%) |
| Total Housing Units | 179 (94.2%) | 11 (5.8%) |
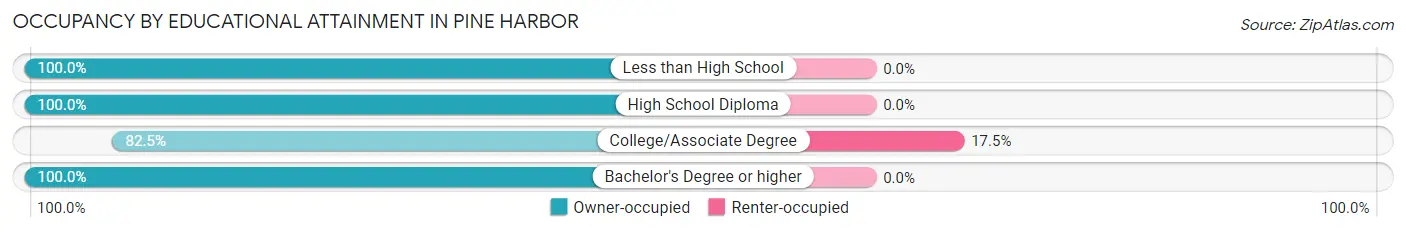
Occupancy by Educational Attainment in Pine Harbor
| Household Size | Owner-occupied | Renter-occupied |
| Less than High School | 12 (100.0%) | 0 (0.0%) |
| High School Diploma | 55 (100.0%) | 0 (0.0%) |
| College/Associate Degree | 52 (82.5%) | 11 (17.5%) |
| Bachelor's Degree or higher | 60 (100.0%) | 0 (0.0%) |
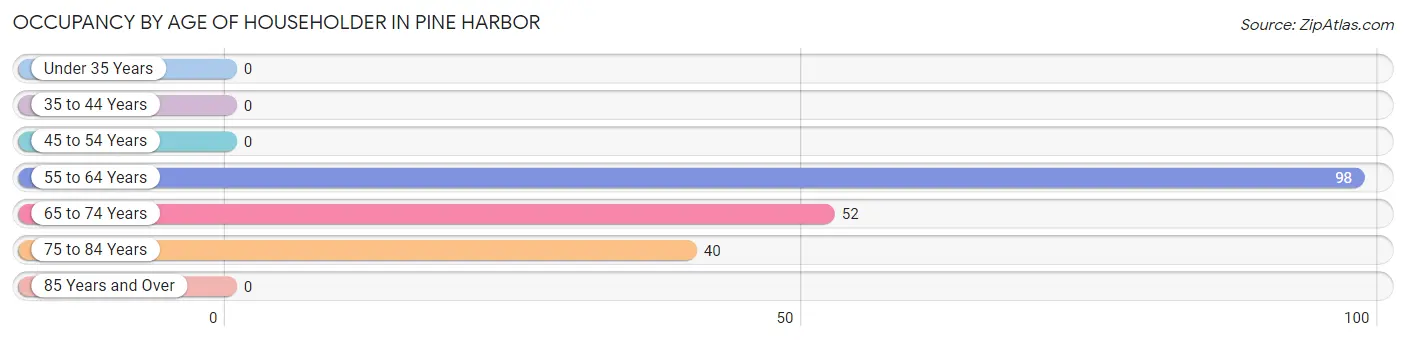
Occupancy by Age of Householder in Pine Harbor
| Age Bracket | # Households | % Households |
| Under 35 Years | 0 | 0.0% |
| 35 to 44 Years | 0 | 0.0% |
| 45 to 54 Years | 0 | 0.0% |
| 55 to 64 Years | 98 | 51.6% |
| 65 to 74 Years | 52 | 27.4% |
| 75 to 84 Years | 40 | 21.0% |
| 85 Years and Over | 0 | 0.0% |
| Total | 190 | 100.0% |
Housing Finances in Pine Harbor
Median Income by Occupancy in Pine Harbor
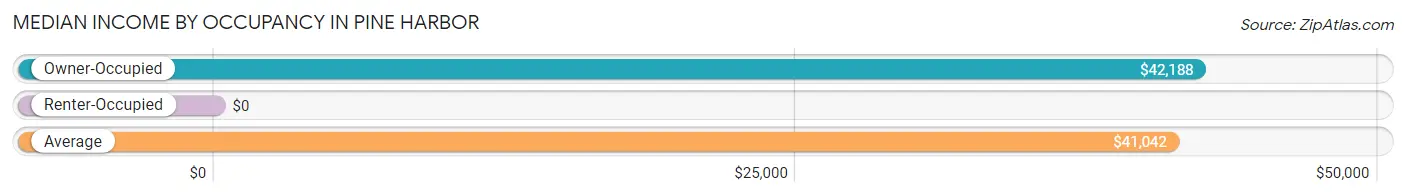
| Occupancy Type | # Households | Median Income |
| Owner-Occupied | 179 (94.2%) | $42,188 |
| Renter-Occupied | 11 (5.8%) | $0 |
| Average | 190 (100.0%) | $41,042 |
Occupancy by Householder Income Bracket in Pine Harbor
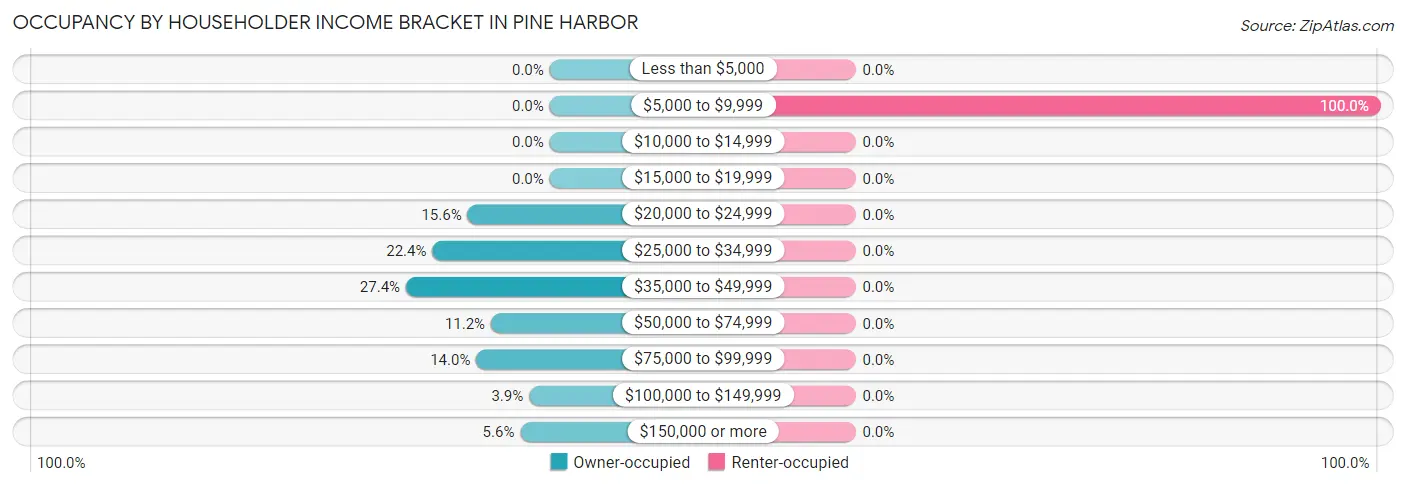
| Income Bracket | Owner-occupied | Renter-occupied |
| Less than $5,000 | 0 (0.0%) | 0 (0.0%) |
| $5,000 to $9,999 | 0 (0.0%) | 11 (100.0%) |
| $10,000 to $14,999 | 0 (0.0%) | 0 (0.0%) |
| $15,000 to $19,999 | 0 (0.0%) | 0 (0.0%) |
| $20,000 to $24,999 | 28 (15.6%) | 0 (0.0%) |
| $25,000 to $34,999 | 40 (22.4%) | 0 (0.0%) |
| $35,000 to $49,999 | 49 (27.4%) | 0 (0.0%) |
| $50,000 to $74,999 | 20 (11.2%) | 0 (0.0%) |
| $75,000 to $99,999 | 25 (14.0%) | 0 (0.0%) |
| $100,000 to $149,999 | 7 (3.9%) | 0 (0.0%) |
| $150,000 or more | 10 (5.6%) | 0 (0.0%) |
| Total | 179 (100.0%) | 11 (100.0%) |
Monthly Housing Cost Tiers in Pine Harbor
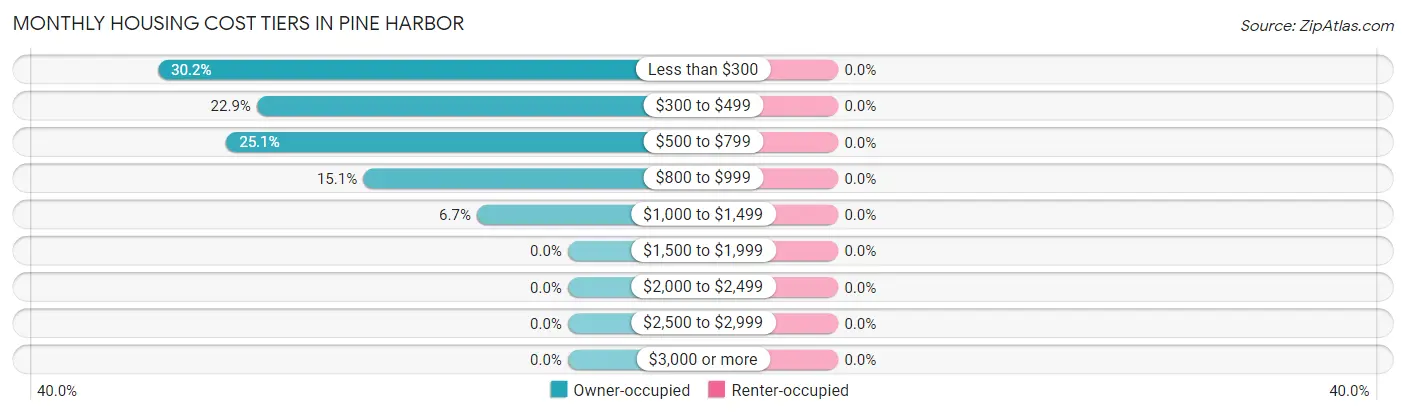
| Monthly Cost | Owner-occupied | Renter-occupied |
| Less than $300 | 54 (30.2%) | 0 (0.0%) |
| $300 to $499 | 41 (22.9%) | 0 (0.0%) |
| $500 to $799 | 45 (25.1%) | 0 (0.0%) |
| $800 to $999 | 27 (15.1%) | 0 (0.0%) |
| $1,000 to $1,499 | 12 (6.7%) | 0 (0.0%) |
| $1,500 to $1,999 | 0 (0.0%) | 0 (0.0%) |
| $2,000 to $2,499 | 0 (0.0%) | 0 (0.0%) |
| $2,500 to $2,999 | 0 (0.0%) | 0 (0.0%) |
| $3,000 or more | 0 (0.0%) | 0 (0.0%) |
| Total | 179 (100.0%) | 11 (100.0%) |
Physical Housing Characteristics in Pine Harbor
Housing Structures in Pine Harbor
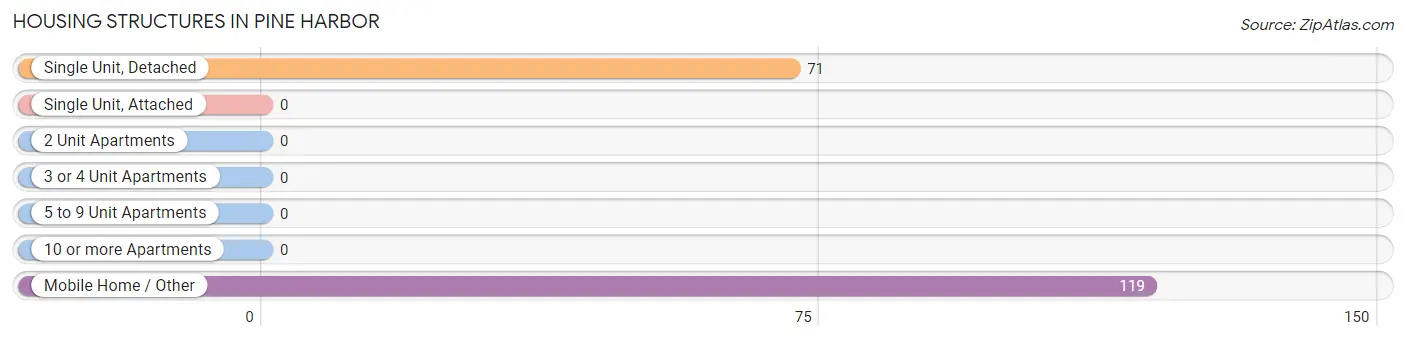
| Structure Type | # Housing Units | % Housing Units |
| Single Unit, Detached | 71 | 37.4% |
| Single Unit, Attached | 0 | 0.0% |
| 2 Unit Apartments | 0 | 0.0% |
| 3 or 4 Unit Apartments | 0 | 0.0% |
| 5 to 9 Unit Apartments | 0 | 0.0% |
| 10 or more Apartments | 0 | 0.0% |
| Mobile Home / Other | 119 | 62.6% |
| Total | 190 | 100.0% |
Housing Structures by Occupancy in Pine Harbor
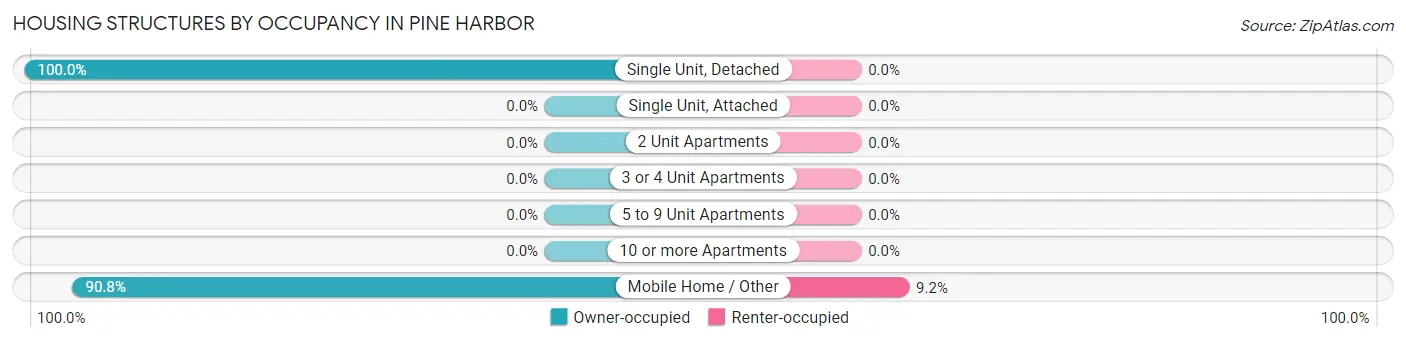
| Structure Type | Owner-occupied | Renter-occupied |
| Single Unit, Detached | 71 (100.0%) | 0 (0.0%) |
| Single Unit, Attached | 0 (0.0%) | 0 (0.0%) |
| 2 Unit Apartments | 0 (0.0%) | 0 (0.0%) |
| 3 or 4 Unit Apartments | 0 (0.0%) | 0 (0.0%) |
| 5 to 9 Unit Apartments | 0 (0.0%) | 0 (0.0%) |
| 10 or more Apartments | 0 (0.0%) | 0 (0.0%) |
| Mobile Home / Other | 108 (90.8%) | 11 (9.2%) |
| Total | 179 (94.2%) | 11 (5.8%) |
Housing Structures by Number of Rooms in Pine Harbor
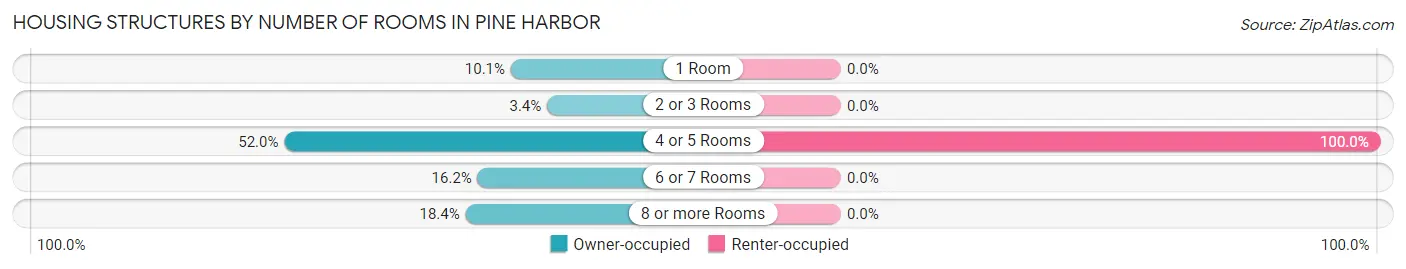
| Number of Rooms | Owner-occupied | Renter-occupied |
| 1 Room | 18 (10.1%) | 0 (0.0%) |
| 2 or 3 Rooms | 6 (3.4%) | 0 (0.0%) |
| 4 or 5 Rooms | 93 (52.0%) | 11 (100.0%) |
| 6 or 7 Rooms | 29 (16.2%) | 0 (0.0%) |
| 8 or more Rooms | 33 (18.4%) | 0 (0.0%) |
| Total | 179 (100.0%) | 11 (100.0%) |
Housing Structure by Heating Type in Pine Harbor
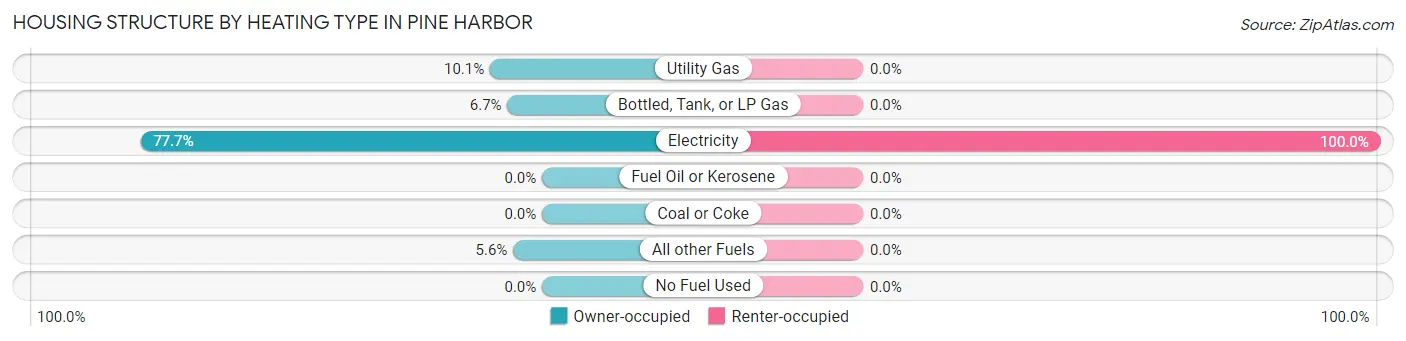
| Heating Type | Owner-occupied | Renter-occupied |
| Utility Gas | 18 (10.1%) | 0 (0.0%) |
| Bottled, Tank, or LP Gas | 12 (6.7%) | 0 (0.0%) |
| Electricity | 139 (77.6%) | 11 (100.0%) |
| Fuel Oil or Kerosene | 0 (0.0%) | 0 (0.0%) |
| Coal or Coke | 0 (0.0%) | 0 (0.0%) |
| All other Fuels | 10 (5.6%) | 0 (0.0%) |
| No Fuel Used | 0 (0.0%) | 0 (0.0%) |
| Total | 179 (100.0%) | 11 (100.0%) |
Household Vehicle Usage in Pine Harbor
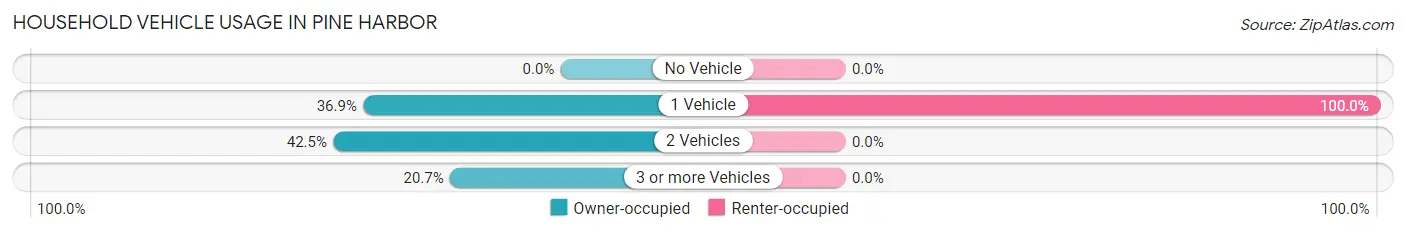
| Vehicles per Household | Owner-occupied | Renter-occupied |
| No Vehicle | 0 (0.0%) | 0 (0.0%) |
| 1 Vehicle | 66 (36.9%) | 11 (100.0%) |
| 2 Vehicles | 76 (42.5%) | 0 (0.0%) |
| 3 or more Vehicles | 37 (20.7%) | 0 (0.0%) |
| Total | 179 (100.0%) | 11 (100.0%) |
Real Estate & Mortgages in Pine Harbor
Real Estate and Mortgage Overview in Pine Harbor
| Characteristic | Without Mortgage | With Mortgage |
| Housing Units | 158 | 21 |
| Median Property Value | $105,000 | $0 |
| Median Household Income | $46,875 | $0 |
| Monthly Housing Costs | $443 | $0 |
| Real Estate Taxes | - | - |
Property Value by Mortgage Status in Pine Harbor
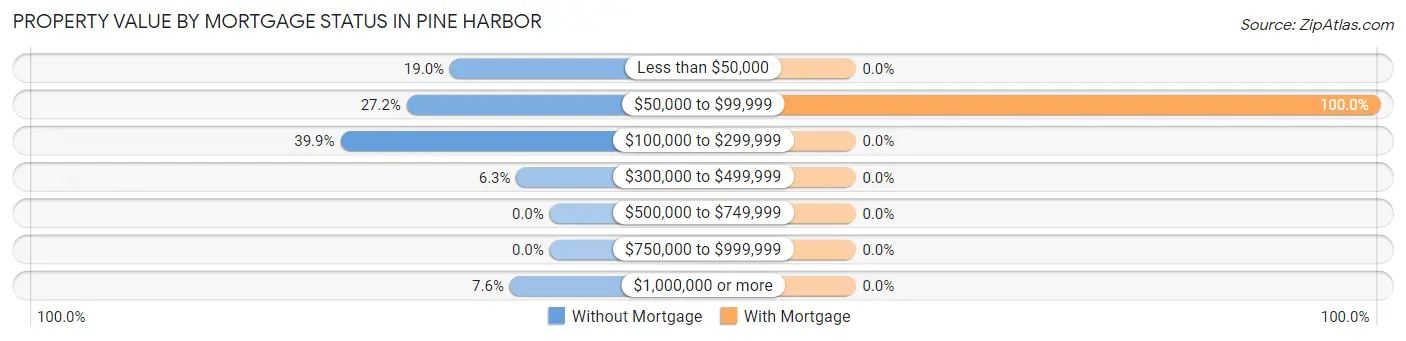
| Property Value | Without Mortgage | With Mortgage |
| Less than $50,000 | 30 (19.0%) | 0 (0.0%) |
| $50,000 to $99,999 | 43 (27.2%) | 21 (100.0%) |
| $100,000 to $299,999 | 63 (39.9%) | 0 (0.0%) |
| $300,000 to $499,999 | 10 (6.3%) | 0 (0.0%) |
| $500,000 to $749,999 | 0 (0.0%) | 0 (0.0%) |
| $750,000 to $999,999 | 0 (0.0%) | 0 (0.0%) |
| $1,000,000 or more | 12 (7.6%) | 0 (0.0%) |
| Total | 158 (100.0%) | 21 (100.0%) |
Household Income by Mortgage Status in Pine Harbor
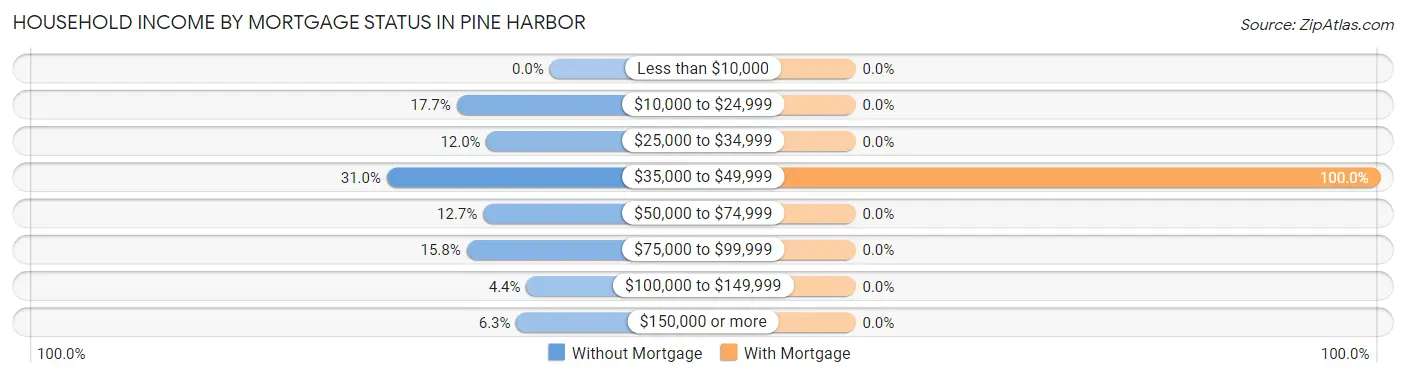
| Household Income | Without Mortgage | With Mortgage |
| Less than $10,000 | 0 (0.0%) | 0 (0.0%) |
| $10,000 to $24,999 | 28 (17.7%) | 0 (0.0%) |
| $25,000 to $34,999 | 19 (12.0%) | 0 (0.0%) |
| $35,000 to $49,999 | 49 (31.0%) | 21 (100.0%) |
| $50,000 to $74,999 | 20 (12.7%) | 0 (0.0%) |
| $75,000 to $99,999 | 25 (15.8%) | 0 (0.0%) |
| $100,000 to $149,999 | 7 (4.4%) | 0 (0.0%) |
| $150,000 or more | 10 (6.3%) | 0 (0.0%) |
| Total | 158 (100.0%) | 21 (100.0%) |
Property Value to Household Income Ratio in Pine Harbor
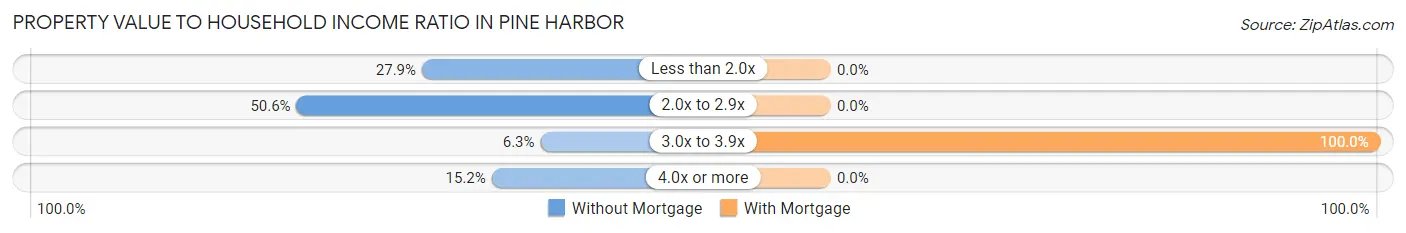
| Value-to-Income Ratio | Without Mortgage | With Mortgage |
| Less than 2.0x | 44 (27.9%) | 0 (0.0%) |
| 2.0x to 2.9x | 80 (50.6%) | 0 (0.0%) |
| 3.0x to 3.9x | 10 (6.3%) | 21 (100.0%) |
| 4.0x or more | 24 (15.2%) | 0 (0.0%) |
| Total | 158 (100.0%) | 21 (100.0%) |
Real Estate Taxes by Mortgage Status in Pine Harbor
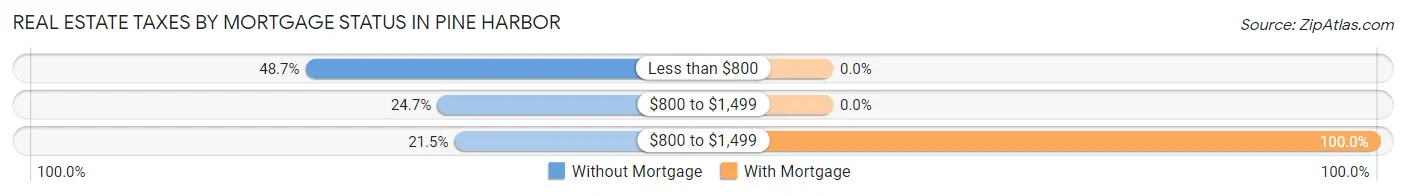
| Property Taxes | Without Mortgage | With Mortgage |
| Less than $800 | 77 (48.7%) | 0 (0.0%) |
| $800 to $1,499 | 39 (24.7%) | 0 (0.0%) |
| $800 to $1,499 | 34 (21.5%) | 21 (100.0%) |
| Total | 158 (100.0%) | 21 (100.0%) |
Health & Disability in Pine Harbor
Health Insurance Coverage by Age in Pine Harbor
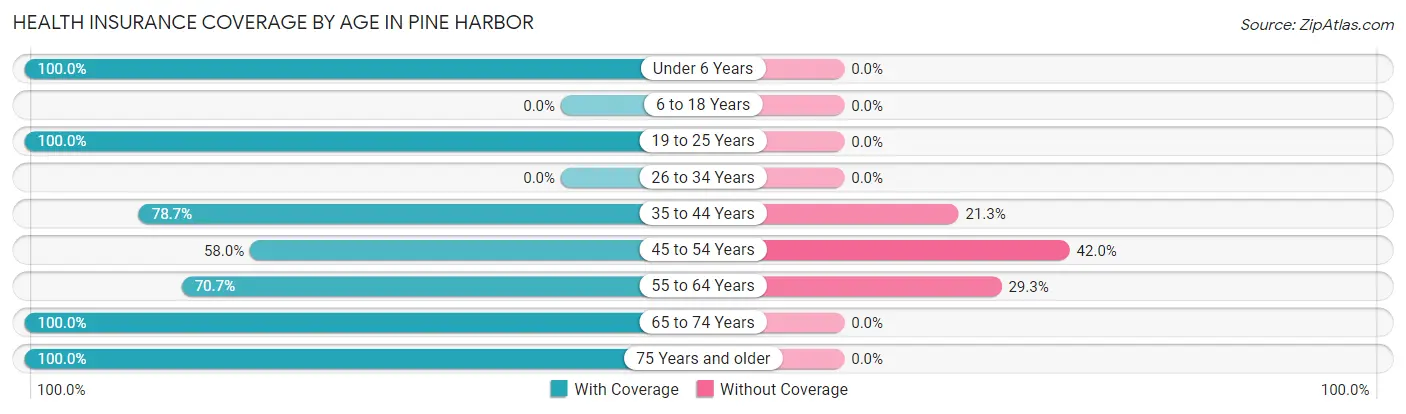
| Age Bracket | With Coverage | Without Coverage |
| Under 6 Years | 12 (100.0%) | 0 (0.0%) |
| 6 to 18 Years | 0 (0.0%) | 0 (0.0%) |
| 19 to 25 Years | 8 (100.0%) | 0 (0.0%) |
| 26 to 34 Years | 0 (0.0%) | 0 (0.0%) |
| 35 to 44 Years | 48 (78.7%) | 13 (21.3%) |
| 45 to 54 Years | 40 (58.0%) | 29 (42.0%) |
| 55 to 64 Years | 123 (70.7%) | 51 (29.3%) |
| 65 to 74 Years | 80 (100.0%) | 0 (0.0%) |
| 75 Years and older | 40 (100.0%) | 0 (0.0%) |
| Total | 351 (79.0%) | 93 (20.9%) |
Health Insurance Coverage by Citizenship Status in Pine Harbor
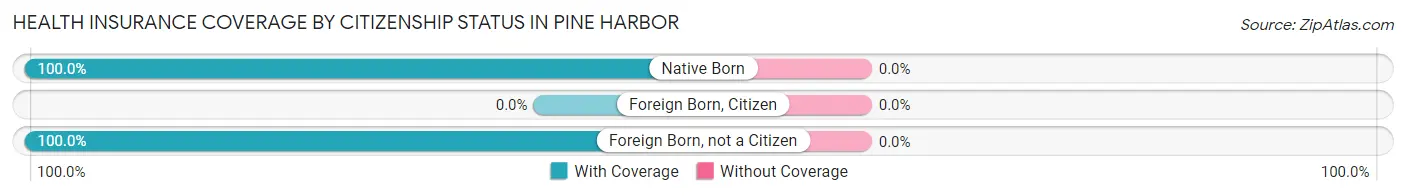
| Citizenship Status | With Coverage | Without Coverage |
| Native Born | 12 (100.0%) | 0 (0.0%) |
| Foreign Born, Citizen | 0 (0.0%) | 0 (0.0%) |
| Foreign Born, not a Citizen | 8 (100.0%) | 0 (0.0%) |
Health Insurance Coverage by Household Income in Pine Harbor
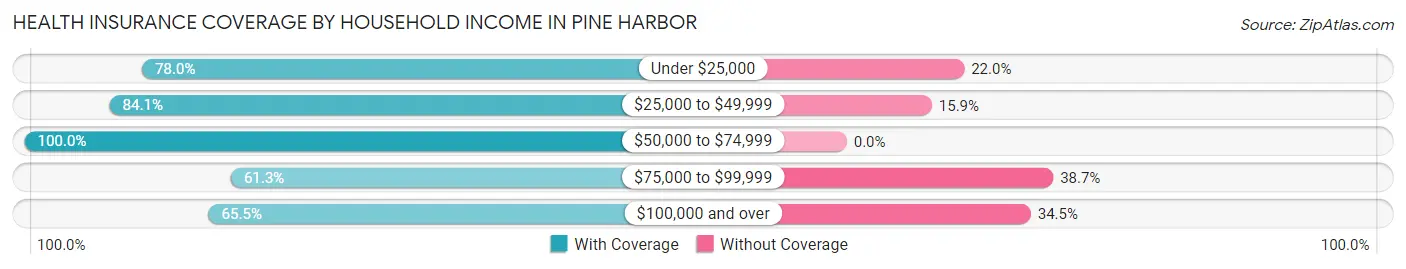
| Household Income | With Coverage | Without Coverage |
| Under $25,000 | 39 (78.0%) | 11 (22.0%) |
| $25,000 to $49,999 | 174 (84.1%) | 33 (15.9%) |
| $50,000 to $74,999 | 54 (100.0%) | 0 (0.0%) |
| $75,000 to $99,999 | 46 (61.3%) | 29 (38.7%) |
| $100,000 and over | 38 (65.5%) | 20 (34.5%) |
Public vs Private Health Insurance Coverage by Age in Pine Harbor
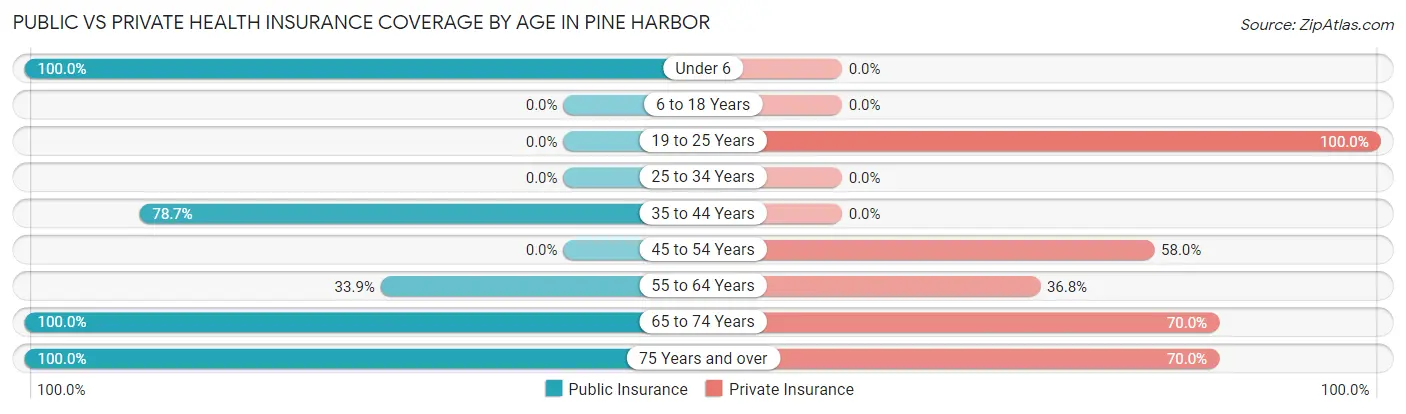
| Age Bracket | Public Insurance | Private Insurance |
| Under 6 | 12 (100.0%) | 0 (0.0%) |
| 6 to 18 Years | 0 (0.0%) | 0 (0.0%) |
| 19 to 25 Years | 0 (0.0%) | 8 (100.0%) |
| 25 to 34 Years | 0 (0.0%) | 0 (0.0%) |
| 35 to 44 Years | 48 (78.7%) | 0 (0.0%) |
| 45 to 54 Years | 0 (0.0%) | 40 (58.0%) |
| 55 to 64 Years | 59 (33.9%) | 64 (36.8%) |
| 65 to 74 Years | 80 (100.0%) | 56 (70.0%) |
| 75 Years and over | 40 (100.0%) | 28 (70.0%) |
| Total | 239 (53.8%) | 196 (44.1%) |
Disability Status by Sex by Age in Pine Harbor
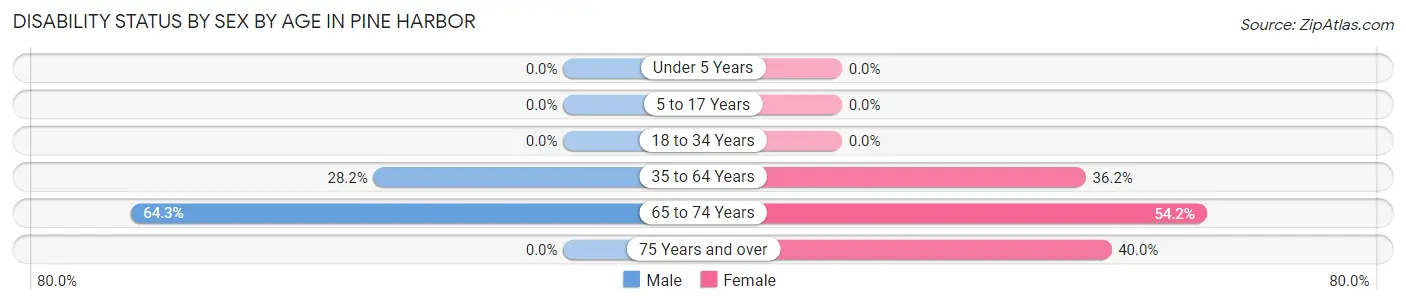
| Age Bracket | Male | Female |
| Under 5 Years | 0 (0.0%) | 0 (0.0%) |
| 5 to 17 Years | 0 (0.0%) | 0 (0.0%) |
| 18 to 34 Years | 0 (0.0%) | 0 (0.0%) |
| 35 to 64 Years | 53 (28.2%) | 42 (36.2%) |
| 65 to 74 Years | 36 (64.3%) | 13 (54.2%) |
| 75 Years and over | 0 (0.0%) | 16 (40.0%) |
Disability Class by Sex by Age in Pine Harbor
Disability Class: Hearing Difficulty
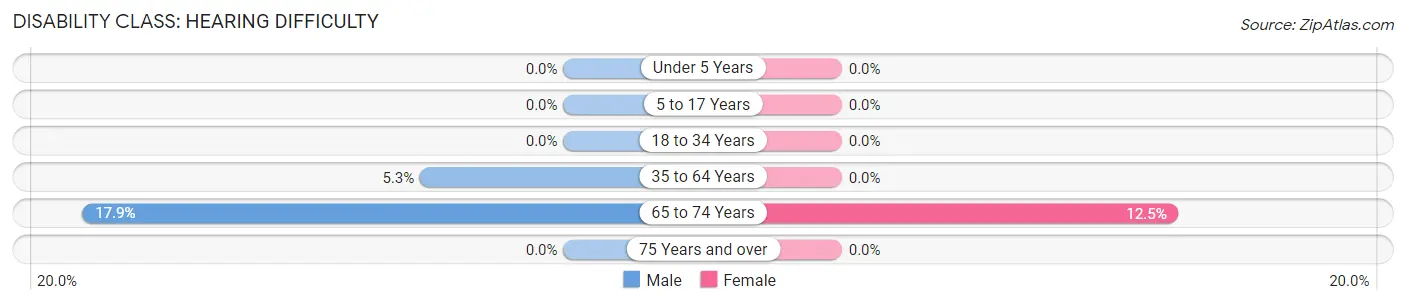
| Age Bracket | Male | Female |
| Under 5 Years | 0 (0.0%) | 0 (0.0%) |
| 5 to 17 Years | 0 (0.0%) | 0 (0.0%) |
| 18 to 34 Years | 0 (0.0%) | 0 (0.0%) |
| 35 to 64 Years | 10 (5.3%) | 0 (0.0%) |
| 65 to 74 Years | 10 (17.9%) | 3 (12.5%) |
| 75 Years and over | 0 (0.0%) | 0 (0.0%) |
Disability Class: Vision Difficulty
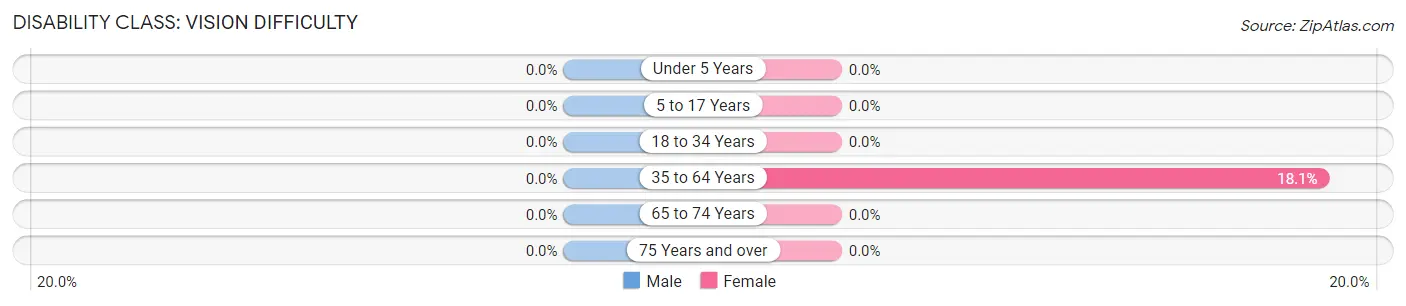
| Age Bracket | Male | Female |
| Under 5 Years | 0 (0.0%) | 0 (0.0%) |
| 5 to 17 Years | 0 (0.0%) | 0 (0.0%) |
| 18 to 34 Years | 0 (0.0%) | 0 (0.0%) |
| 35 to 64 Years | 0 (0.0%) | 21 (18.1%) |
| 65 to 74 Years | 0 (0.0%) | 0 (0.0%) |
| 75 Years and over | 0 (0.0%) | 0 (0.0%) |
Disability Class: Cognitive Difficulty
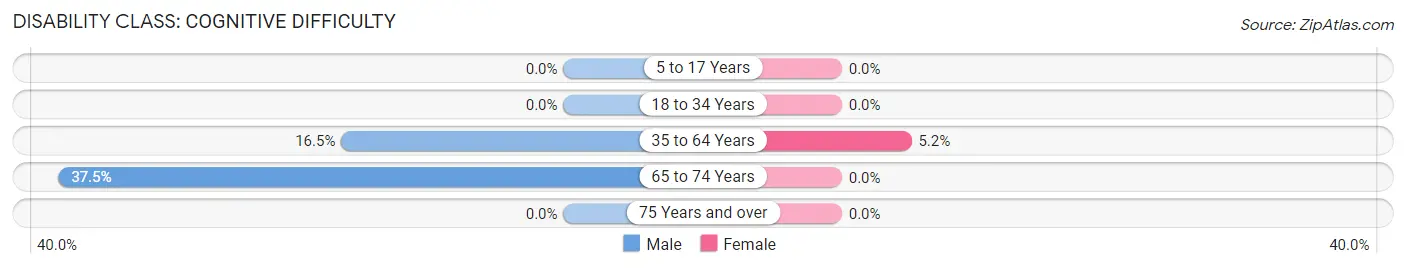
| Age Bracket | Male | Female |
| 5 to 17 Years | 0 (0.0%) | 0 (0.0%) |
| 18 to 34 Years | 0 (0.0%) | 0 (0.0%) |
| 35 to 64 Years | 31 (16.5%) | 6 (5.2%) |
| 65 to 74 Years | 21 (37.5%) | 0 (0.0%) |
| 75 Years and over | 0 (0.0%) | 0 (0.0%) |
Disability Class: Ambulatory Difficulty
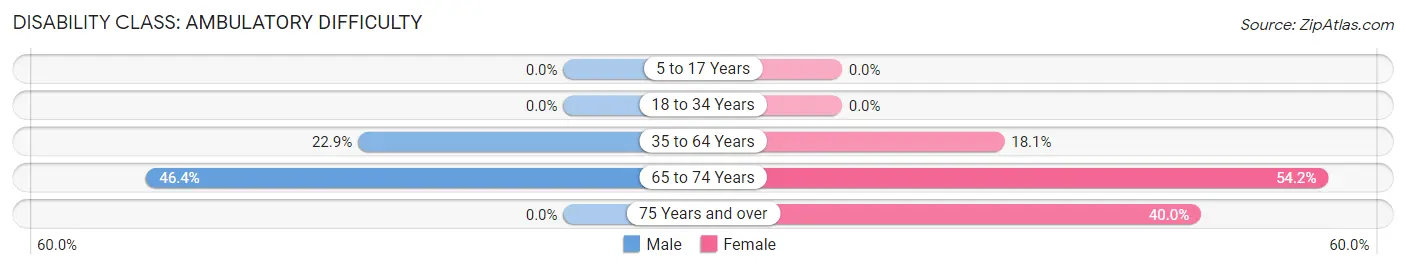
| Age Bracket | Male | Female |
| 5 to 17 Years | 0 (0.0%) | 0 (0.0%) |
| 18 to 34 Years | 0 (0.0%) | 0 (0.0%) |
| 35 to 64 Years | 43 (22.9%) | 21 (18.1%) |
| 65 to 74 Years | 26 (46.4%) | 13 (54.2%) |
| 75 Years and over | 0 (0.0%) | 16 (40.0%) |
Disability Class: Self-Care Difficulty
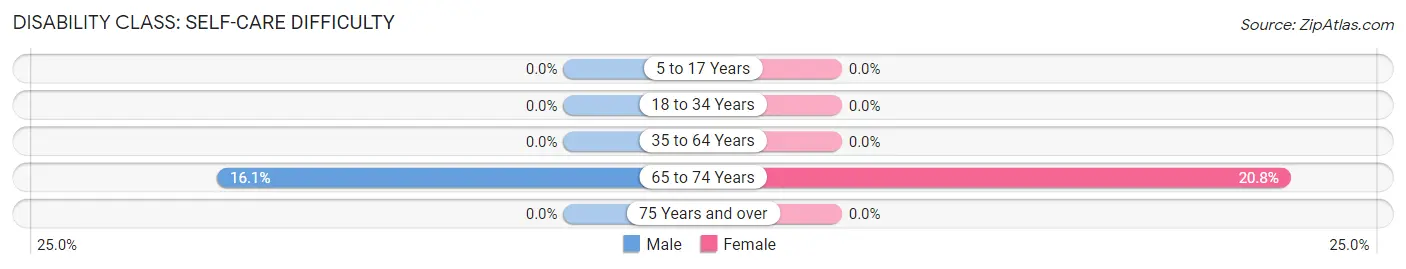
| Age Bracket | Male | Female |
| 5 to 17 Years | 0 (0.0%) | 0 (0.0%) |
| 18 to 34 Years | 0 (0.0%) | 0 (0.0%) |
| 35 to 64 Years | 0 (0.0%) | 0 (0.0%) |
| 65 to 74 Years | 9 (16.1%) | 5 (20.8%) |
| 75 Years and over | 0 (0.0%) | 0 (0.0%) |
Technology Access in Pine Harbor
Computing Device Access in Pine Harbor
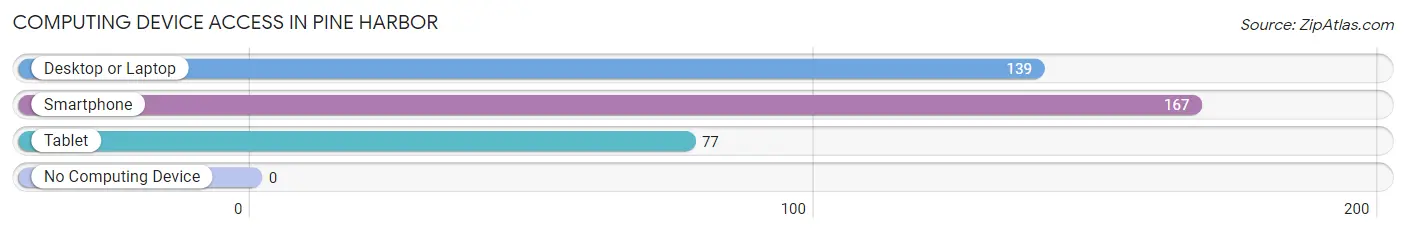
| Device Type | # Households | % Households |
| Desktop or Laptop | 139 | 73.2% |
| Smartphone | 167 | 87.9% |
| Tablet | 77 | 40.5% |
| No Computing Device | 0 | 0.0% |
| Total | 190 | 100.0% |
Internet Access in Pine Harbor
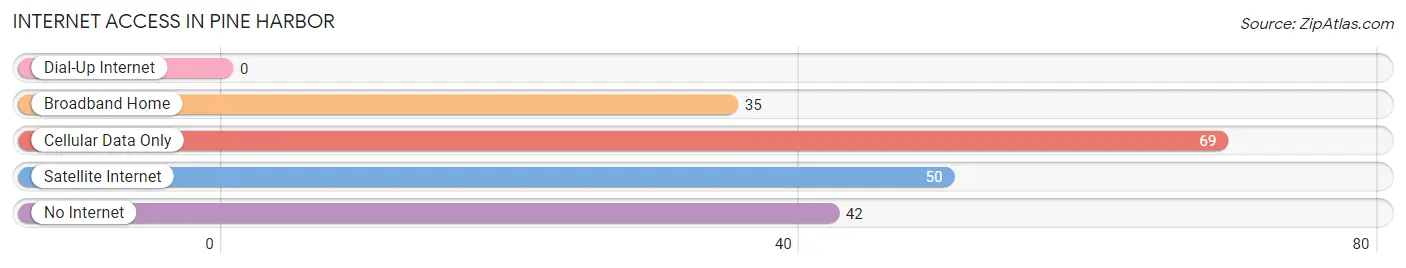
| Internet Type | # Households | % Households |
| Dial-Up Internet | 0 | 0.0% |
| Broadband Home | 35 | 18.4% |
| Cellular Data Only | 69 | 36.3% |
| Satellite Internet | 50 | 26.3% |
| No Internet | 42 | 22.1% |
| Total | 190 | 100.0% |
Pine Harbor Summary
Pine Harbor is a small town located in the eastern part of Texas, in the United States. It is situated in the county of Harrison, and is part of the Longview Metropolitan Statistical Area. The town has a population of around 1,000 people, and is known for its rural charm and friendly atmosphere.
History
Pine Harbor was founded in 1845 by a group of settlers from the nearby town of Marshall. The settlers were looking for a place to settle and start a new life, and they chose the area around Pine Harbor due to its abundance of natural resources. The town was originally called “Piney Woods”, but the name was changed to Pine Harbor in 1851.
The town grew slowly over the years, and by the early 1900s it had become a thriving community. The town was home to several businesses, including a sawmill, a cotton gin, and a general store. The town also had a school, a post office, and a church.
In the 1950s, the town began to decline as many of its residents moved away in search of better opportunities. However, in the late 1980s, the town began to experience a resurgence as people began to move back to the area. Today, Pine Harbor is a small but vibrant community with a population of around 1,000 people.
Geography
Pine Harbor is located in the eastern part of Texas, in the county of Harrison. The town is situated in the Longview Metropolitan Statistical Area, and is surrounded by the towns of Marshall, Hallsville, and Longview. The town is located on the banks of the Sabine River, and is surrounded by lush forests and rolling hills.
The climate in Pine Harbor is humid subtropical, with hot summers and mild winters. The average temperature in the summer is around 90 degrees Fahrenheit, and the average temperature in the winter is around 50 degrees Fahrenheit. The town receives an average of 48 inches of rain per year.
Economy
The economy of Pine Harbor is largely based on agriculture and forestry. The town is home to several farms, and the surrounding area is known for its timber production. The town also has several small businesses, including a general store, a hardware store, and a restaurant.
The town is also home to several manufacturing companies, including a furniture factory and a plastics factory. The town is also home to a number of small businesses, including a gas station, a grocery store, and a barber shop.
Demographics
As of the 2010 census, the population of Pine Harbor was 1,000 people. The racial makeup of the town was 95.2% White, 0.7% African American, 0.7% Native American, 0.7% Asian, 0.7% from other races, and 2.1% from two or more races. The median household income was $37,500, and the median family income was $41,250.
Conclusion
Pine Harbor is a small town located in the eastern part of Texas, in the United States. It is situated in the county of Harrison, and is part of the Longview Metropolitan Statistical Area. The town has a population of around 1,000 people, and is known for its rural charm and friendly atmosphere. The economy of Pine Harbor is largely based on agriculture and forestry, and the town is home to several small businesses. The racial makeup of the town is predominantly White, with a small percentage of African American, Native American, and Asian residents.
Common Questions
What is Per Capita Income in Pine Harbor?
Per Capita income in Pine Harbor is $25,776.
What is the Median Family Income in Pine Harbor?
Median Family Income in Pine Harbor is $45,104.
What is the Median Household income in Pine Harbor?
Median Household Income in Pine Harbor is $41,042.
What is Inequality or Gini Index in Pine Harbor?
Inequality or Gini Index in Pine Harbor is 0.38.
What is the Total Population of Pine Harbor?
Total Population of Pine Harbor is 444.
What is the Total Male Population of Pine Harbor?
Total Male Population of Pine Harbor is 252.
What is the Total Female Population of Pine Harbor?
Total Female Population of Pine Harbor is 192.
What is the Ratio of Males per 100 Females in Pine Harbor?
There are 131.25 Males per 100 Females in Pine Harbor.
What is the Ratio of Females per 100 Males in Pine Harbor?
There are 76.19 Females per 100 Males in Pine Harbor.
What is the Median Population Age in Pine Harbor?
Median Population Age in Pine Harbor is 62.5 Years.
What is the Average Family Size in Pine Harbor
Average Family Size in Pine Harbor is 3.0 People.
What is the Average Household Size in Pine Harbor
Average Household Size in Pine Harbor is 2.3 People.
How Large is the Labor Force in Pine Harbor?
There are 107 People in the Labor Forcein in Pine Harbor.
What is the Percentage of People in the Labor Force in Pine Harbor?
24.8% of People are in the Labor Force in Pine Harbor.
What is the Unemployment Rate in Pine Harbor?
Unemployment Rate in Pine Harbor is 43.0%.