Zip Codes with the Highest Percentage of Population with a Degree in Liberal Arts and History in Mission, TX
RELATED REPORTS & OPTIONS
Liberal Arts and History
Mission
Compare Zip Codes
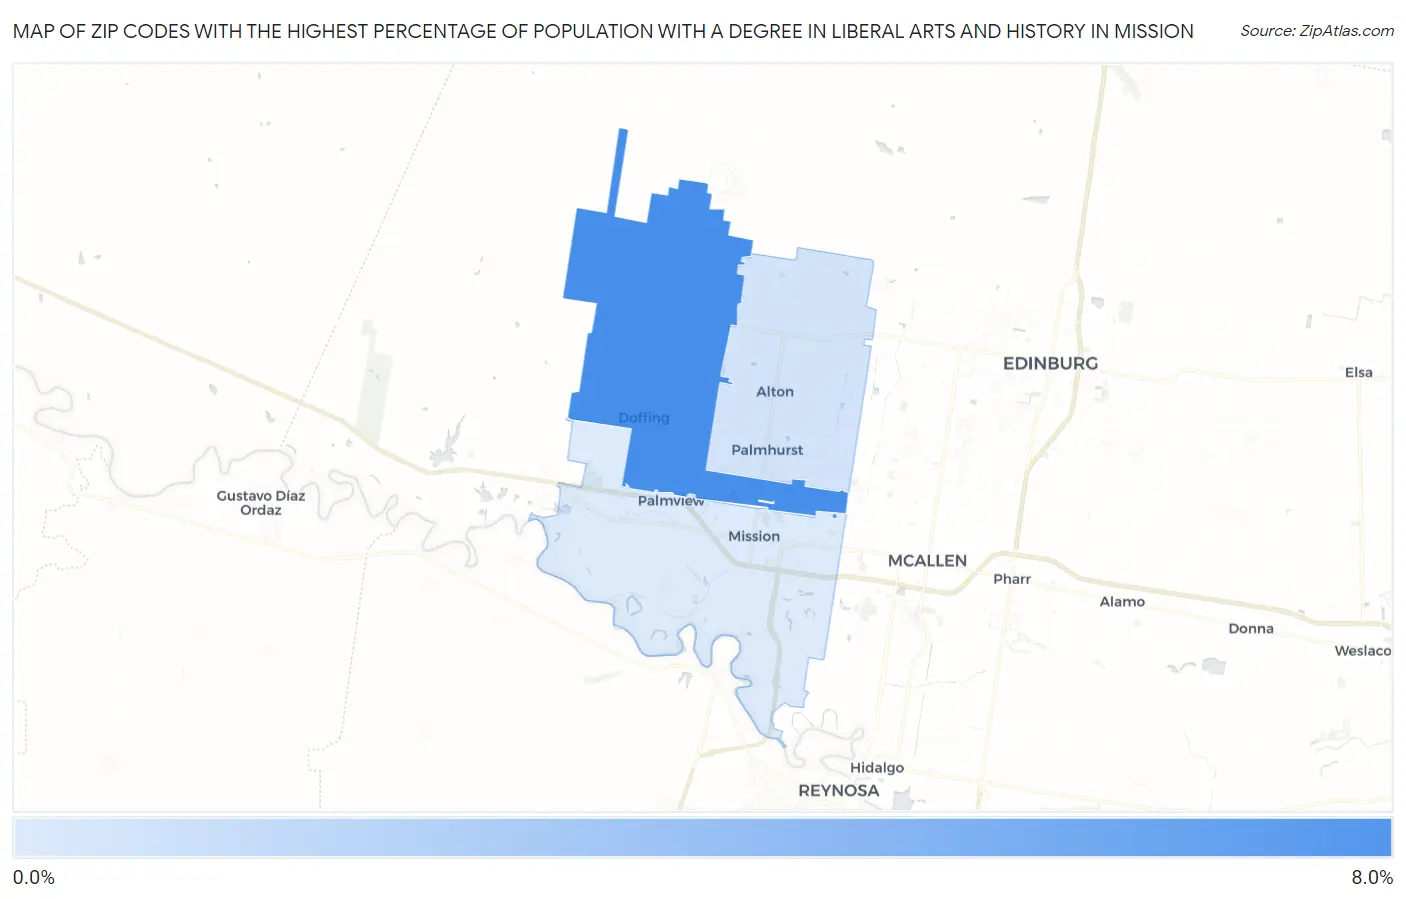
Map of Zip Codes with the Highest Percentage of Population with a Degree in Liberal Arts and History in Mission
1.3%
7.0%
Zip Codes with the Highest Percentage of Population with a Degree in Liberal Arts and History in Mission, TX
| Zip Code | % Graduates | vs State | vs National | |
| 1. | 78574 | 7.0% | 4.2%(+2.90)#310 | 4.9%(+2.18)#6,304 |
| 2. | 78573 | 1.7% | 4.2%(-2.43)#1,285 | 4.9%(-3.15)#22,040 |
| 3. | 78572 | 1.3% | 4.2%(-2.84)#1,338 | 4.9%(-3.56)#22,852 |
1
Common Questions
What are the Top Zip Codes with the Highest Percentage of Population with a Degree in Liberal Arts and History in Mission, TX?
Top Zip Codes with the Highest Percentage of Population with a Degree in Liberal Arts and History in Mission, TX are:
What zip code has the Highest Percentage of Population with a Degree in Liberal Arts and History in Mission, TX?
78574 has the Highest Percentage of Population with a Degree in Liberal Arts and History in Mission, TX with 7.0%.
What is the Percentage of Population with a Degree in Liberal Arts and History in Mission, TX?
Percentage of Population with a Degree in Liberal Arts and History in Mission is 2.6%.
What is the Percentage of Population with a Degree in Liberal Arts and History in Texas?
Percentage of Population with a Degree in Liberal Arts and History in Texas is 4.2%.
What is the Percentage of Population with a Degree in Liberal Arts and History in the United States?
Percentage of Population with a Degree in Liberal Arts and History in the United States is 4.9%.