Zip Codes with the Highest Percentage of Population with a Degree in Liberal Arts and History in Mcallen, TX
RELATED REPORTS & OPTIONS
Liberal Arts and History
Mcallen
Compare Zip Codes
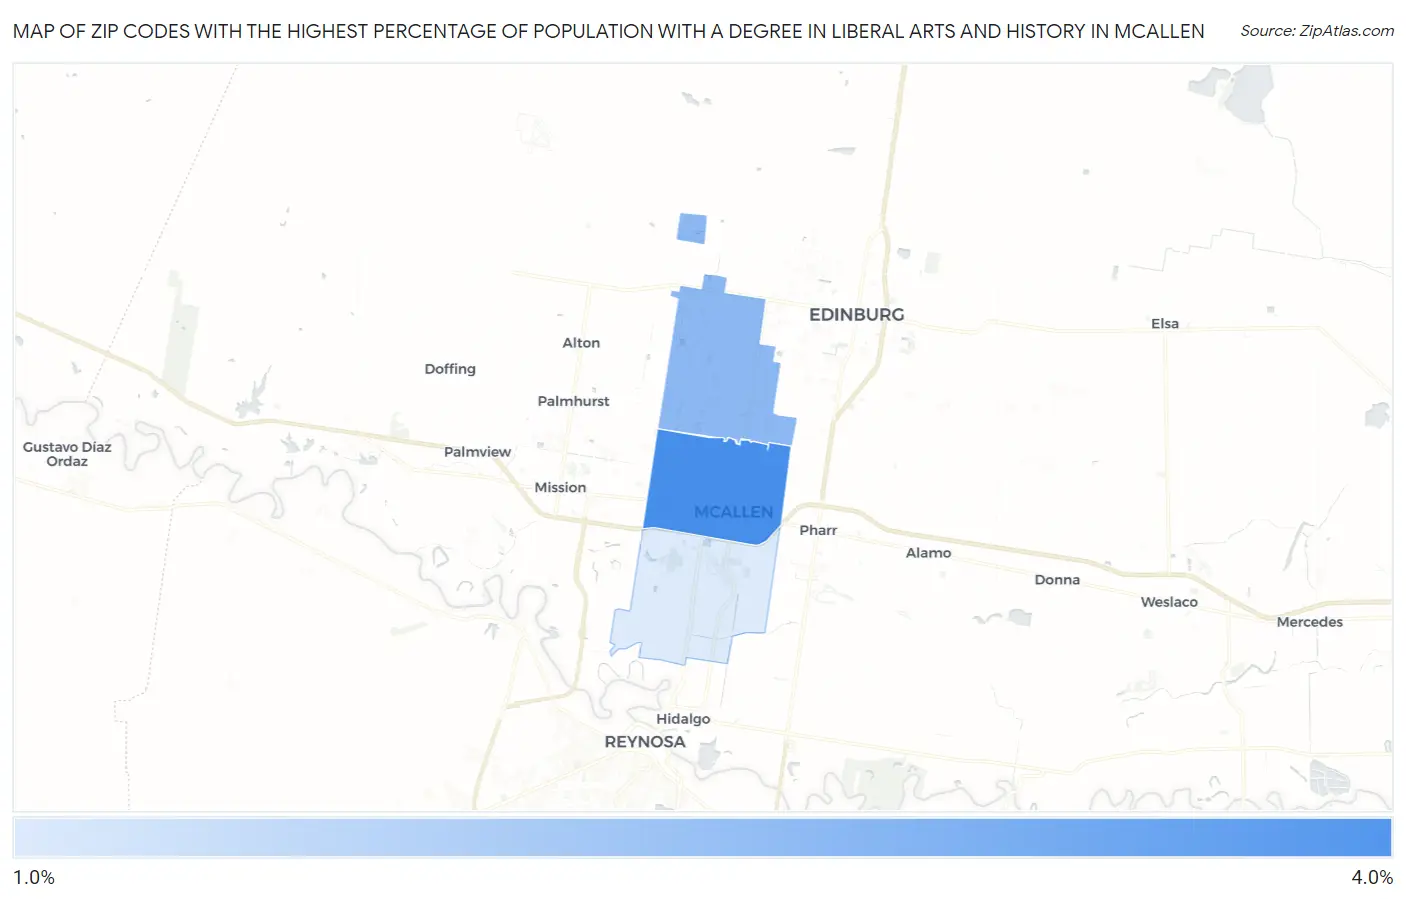
Map of Zip Codes with the Highest Percentage of Population with a Degree in Liberal Arts and History in Mcallen
1.9%
3.4%
Zip Codes with the Highest Percentage of Population with a Degree in Liberal Arts and History in Mcallen, TX
| Zip Code | % Graduates | vs State | vs National | |
| 1. | 78501 | 3.4% | 4.2%(-0.708)#923 | 4.9%(-1.43)#16,838 |
| 2. | 78504 | 2.7% | 4.2%(-1.44)#1,078 | 4.9%(-2.16)#19,279 |
| 3. | 78503 | 1.9% | 4.2%(-2.29)#1,263 | 4.9%(-3.02)#21,708 |
1
Common Questions
What are the Top Zip Codes with the Highest Percentage of Population with a Degree in Liberal Arts and History in Mcallen, TX?
Top Zip Codes with the Highest Percentage of Population with a Degree in Liberal Arts and History in Mcallen, TX are:
What zip code has the Highest Percentage of Population with a Degree in Liberal Arts and History in Mcallen, TX?
78501 has the Highest Percentage of Population with a Degree in Liberal Arts and History in Mcallen, TX with 3.4%.
What is the Percentage of Population with a Degree in Liberal Arts and History in Mcallen, TX?
Percentage of Population with a Degree in Liberal Arts and History in Mcallen is 2.9%.
What is the Percentage of Population with a Degree in Liberal Arts and History in Texas?
Percentage of Population with a Degree in Liberal Arts and History in Texas is 4.2%.
What is the Percentage of Population with a Degree in Liberal Arts and History in the United States?
Percentage of Population with a Degree in Liberal Arts and History in the United States is 4.9%.