Zip Codes with the Highest Percentage of Population with a Degree in Liberal Arts and History in San Angelo, TX
RELATED REPORTS & OPTIONS
Liberal Arts and History
San Angelo
Compare Zip Codes
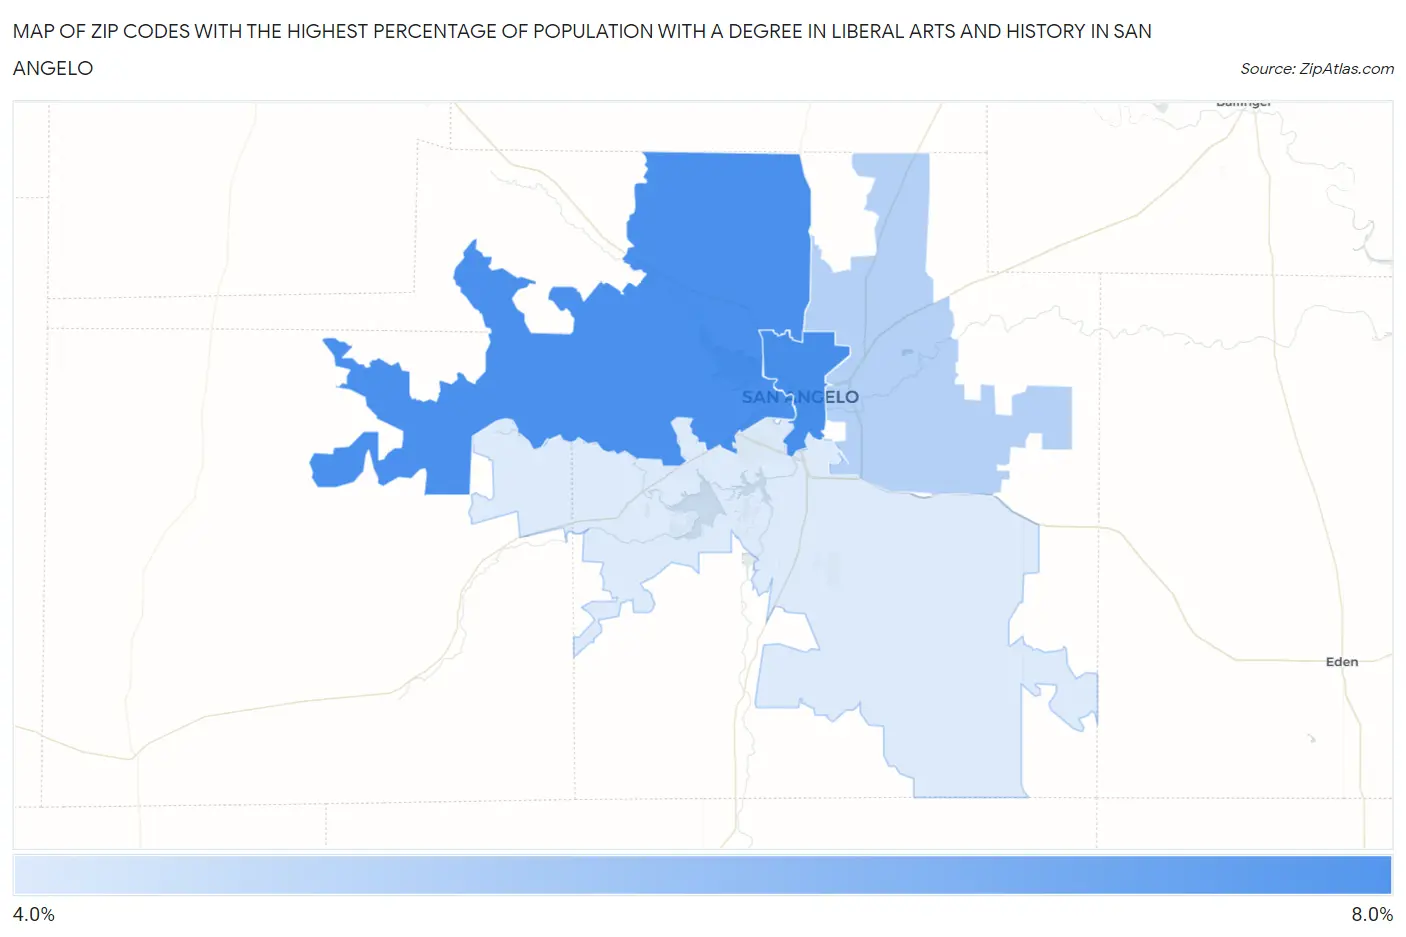
Map of Zip Codes with the Highest Percentage of Population with a Degree in Liberal Arts and History in San Angelo
4.8%
6.1%
Zip Codes with the Highest Percentage of Population with a Degree in Liberal Arts and History in San Angelo, TX
| Zip Code | % Graduates | vs State | vs National | |
| 1. | 76903 | 6.1% | 4.2%(+1.90)#419 | 4.9%(+1.18)#8,384 |
| 2. | 76901 | 6.0% | 4.2%(+1.88)#420 | 4.9%(+1.16)#8,445 |
| 3. | 76905 | 5.1% | 4.2%(+0.997)#546 | 4.9%(+0.276)#10,878 |
| 4. | 76904 | 4.8% | 4.2%(+0.663)#606 | 4.9%(-0.059)#11,938 |
1
Common Questions
What are the Top 3 Zip Codes with the Highest Percentage of Population with a Degree in Liberal Arts and History in San Angelo, TX?
Top 3 Zip Codes with the Highest Percentage of Population with a Degree in Liberal Arts and History in San Angelo, TX are:
What zip code has the Highest Percentage of Population with a Degree in Liberal Arts and History in San Angelo, TX?
76903 has the Highest Percentage of Population with a Degree in Liberal Arts and History in San Angelo, TX with 6.1%.
What is the Percentage of Population with a Degree in Liberal Arts and History in San Angelo, TX?
Percentage of Population with a Degree in Liberal Arts and History in San Angelo is 5.9%.
What is the Percentage of Population with a Degree in Liberal Arts and History in Texas?
Percentage of Population with a Degree in Liberal Arts and History in Texas is 4.2%.
What is the Percentage of Population with a Degree in Liberal Arts and History in the United States?
Percentage of Population with a Degree in Liberal Arts and History in the United States is 4.9%.