Nordheim, TX Map & Demographics
Nordheim Map
Nordheim Overview
$28,807
PER CAPITA INCOME
$95,221
AVG FAMILY INCOME
$37,656
AVG HOUSEHOLD INCOME
28.1%
WAGE / INCOME GAP [ % ]
71.9¢/ $1
WAGE / INCOME GAP [ $ ]
0.40
INEQUALITY / GINI INDEX
442
TOTAL POPULATION
229
MALE POPULATION
213
FEMALE POPULATION
107.51
MALES / 100 FEMALES
93.01
FEMALES / 100 MALES
56.0
MEDIAN AGE
3.8
AVG FAMILY SIZE
2.0
AVG HOUSEHOLD SIZE
160
LABOR FORCE [ PEOPLE ]
40.3%
PERCENT IN LABOR FORCE
6.3%
UNEMPLOYMENT RATE
Nordheim Zip Codes
Income in Nordheim
Income Overview in Nordheim
Per Capita Income in Nordheim is $28,807, while median incomes of families and households are $95,221 and $37,656 respectively.
| Characteristic | Number | Measure |
| Per Capita Income | 442 | $28,807 |
| Median Family Income | 81 | $95,221 |
| Mean Family Income | 81 | $97,972 |
| Median Household Income | 216 | $37,656 |
| Mean Household Income | 216 | $57,584 |
| Income Deficit | 81 | $0 |
| Wage / Income Gap (%) | 442 | 28.11% |
| Wage / Income Gap ($) | 442 | 71.89¢ per $1 |
| Gini / Inequality Index | 442 | 0.40 |
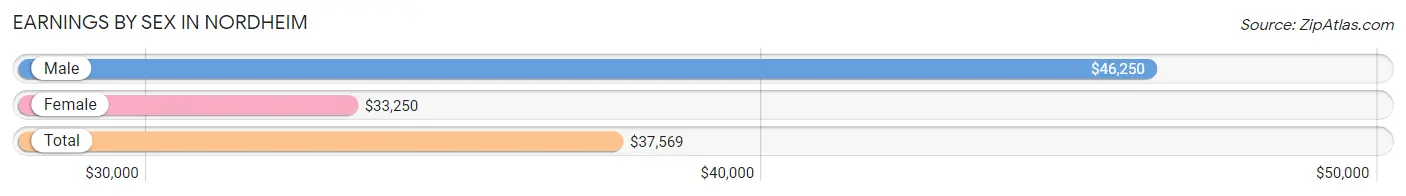
Earnings by Sex in Nordheim
Average Earnings in Nordheim are $37,569, $46,250 for men and $33,250 for women, a difference of 28.1%.
| Sex | Number | Average Earnings |
| Male | 60 (38.2%) | $46,250 |
| Female | 97 (61.8%) | $33,250 |
| Total | 157 (100.0%) | $37,569 |
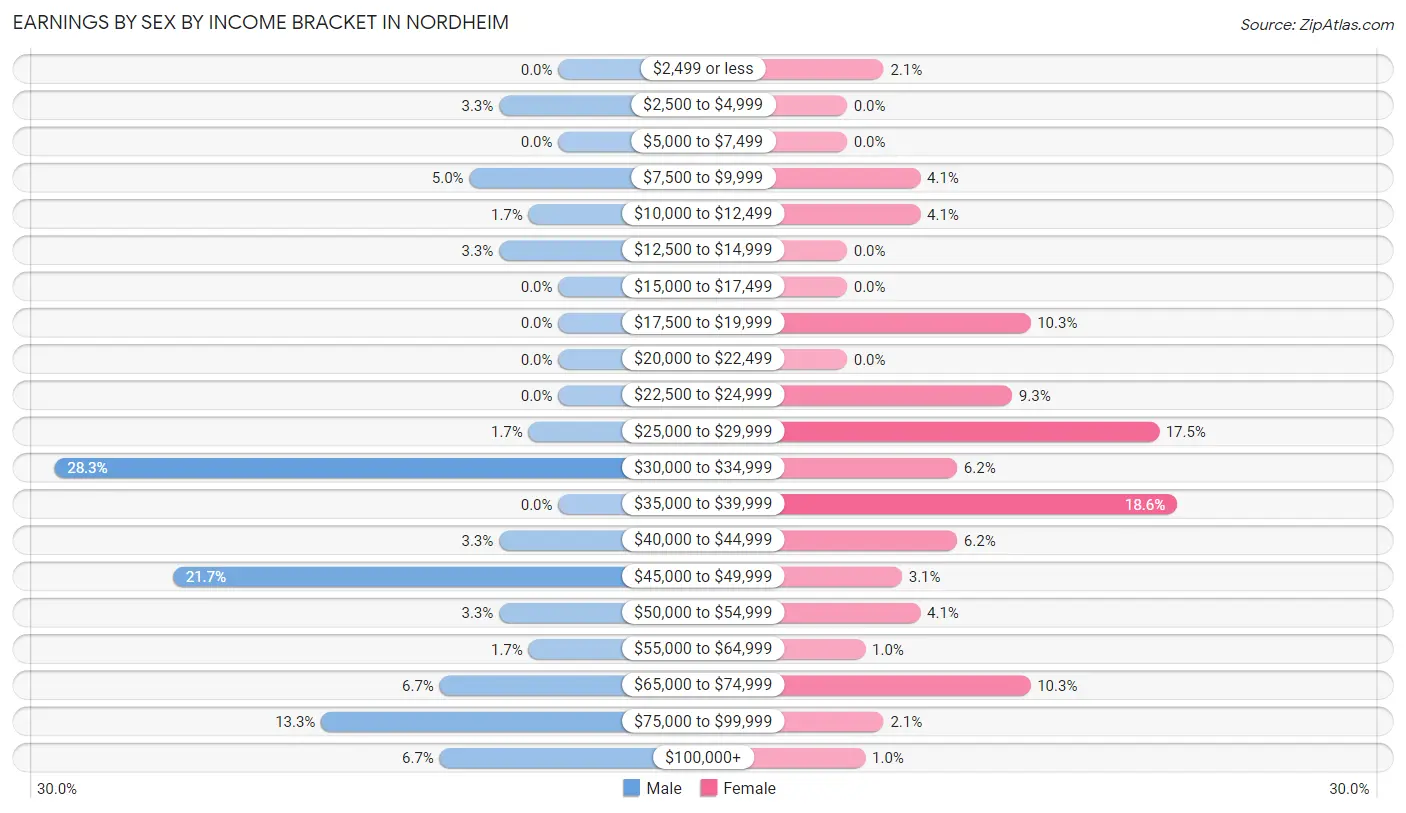
Earnings by Sex by Income Bracket in Nordheim
The most common earnings brackets in Nordheim are $30,000 to $34,999 for men (17 | 28.3%) and $35,000 to $39,999 for women (18 | 18.6%).
| Income | Male | Female |
| $2,499 or less | 0 (0.0%) | 2 (2.1%) |
| $2,500 to $4,999 | 2 (3.3%) | 0 (0.0%) |
| $5,000 to $7,499 | 0 (0.0%) | 0 (0.0%) |
| $7,500 to $9,999 | 3 (5.0%) | 4 (4.1%) |
| $10,000 to $12,499 | 1 (1.7%) | 4 (4.1%) |
| $12,500 to $14,999 | 2 (3.3%) | 0 (0.0%) |
| $15,000 to $17,499 | 0 (0.0%) | 0 (0.0%) |
| $17,500 to $19,999 | 0 (0.0%) | 10 (10.3%) |
| $20,000 to $22,499 | 0 (0.0%) | 0 (0.0%) |
| $22,500 to $24,999 | 0 (0.0%) | 9 (9.3%) |
| $25,000 to $29,999 | 1 (1.7%) | 17 (17.5%) |
| $30,000 to $34,999 | 17 (28.3%) | 6 (6.2%) |
| $35,000 to $39,999 | 0 (0.0%) | 18 (18.6%) |
| $40,000 to $44,999 | 2 (3.3%) | 6 (6.2%) |
| $45,000 to $49,999 | 13 (21.7%) | 3 (3.1%) |
| $50,000 to $54,999 | 2 (3.3%) | 4 (4.1%) |
| $55,000 to $64,999 | 1 (1.7%) | 1 (1.0%) |
| $65,000 to $74,999 | 4 (6.7%) | 10 (10.3%) |
| $75,000 to $99,999 | 8 (13.3%) | 2 (2.1%) |
| $100,000+ | 4 (6.7%) | 1 (1.0%) |
| Total | 60 (100.0%) | 97 (100.0%) |
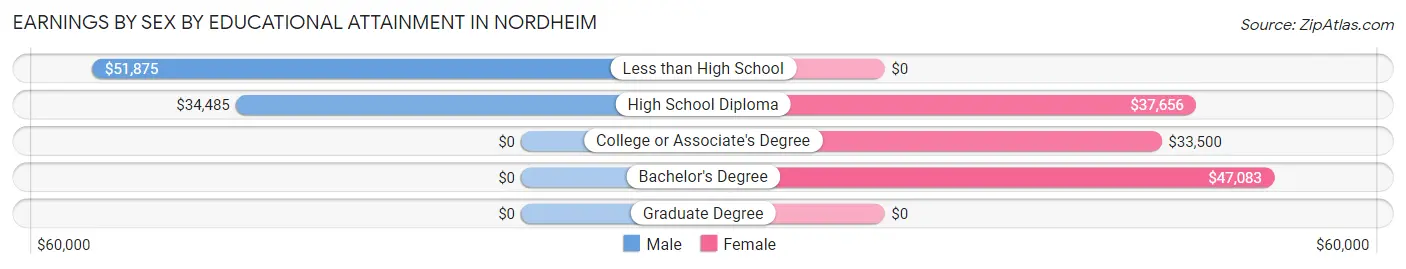
Earnings by Sex by Educational Attainment in Nordheim
Average earnings in Nordheim are $46,250 for men and $37,813 for women, a difference of 18.2%. Men with an educational attainment of less than high school enjoy the highest average annual earnings of $51,875, while those with high school diploma education earn the least with $34,485. Women with an educational attainment of bachelor's degree earn the most with the average annual earnings of $47,083, while those with college or associate's degree education have the smallest earnings of $33,500.
| Educational Attainment | Male Income | Female Income |
| Less than High School | $51,875 | $0 |
| High School Diploma | $34,485 | $37,656 |
| College or Associate's Degree | - | - |
| Bachelor's Degree | - | - |
| Graduate Degree | - | - |
| Total | $46,250 | $37,813 |
Family Income in Nordheim
Family Income Brackets in Nordheim
According to the Nordheim family income data, there are 24 families falling into the $50,000 to $74,999 income range, which is the most common income bracket and makes up 29.6% of all families.
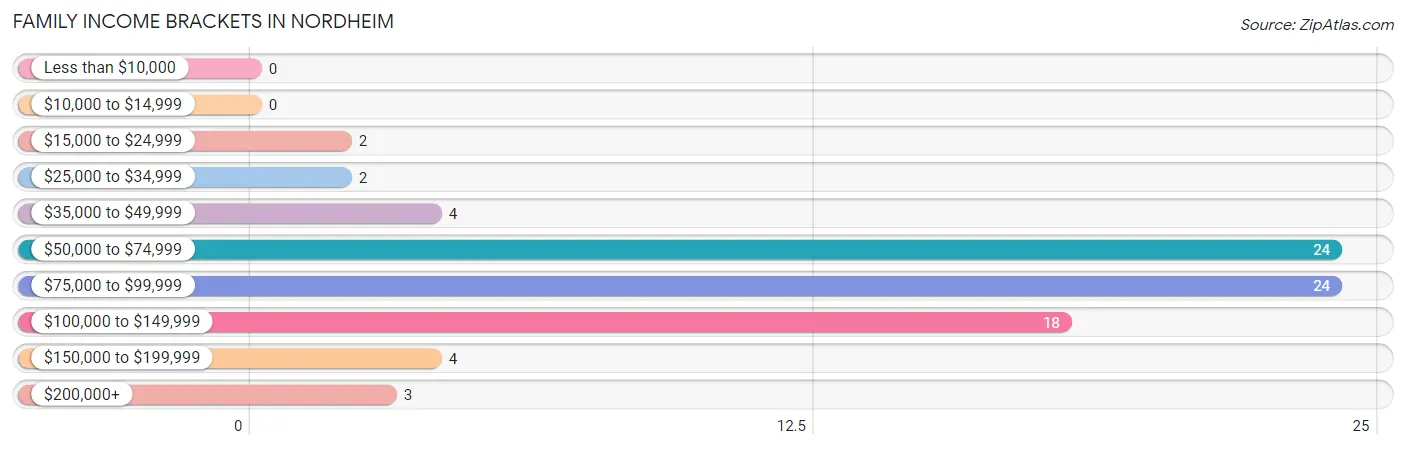
| Income Bracket | # Families | % Families |
| Less than $10,000 | 0 | 0.0% |
| $10,000 to $14,999 | 0 | 0.0% |
| $15,000 to $24,999 | 2 | 2.5% |
| $25,000 to $34,999 | 2 | 2.5% |
| $35,000 to $49,999 | 4 | 4.9% |
| $50,000 to $74,999 | 24 | 29.6% |
| $75,000 to $99,999 | 24 | 29.6% |
| $100,000 to $149,999 | 18 | 22.2% |
| $150,000 to $199,999 | 4 | 4.9% |
| $200,000+ | 3 | 3.7% |
Family Income by Famaliy Size in Nordheim
5-person families (10 | 12.3%) account for the highest median family income in Nordheim with $114,167 per family, while 2-person families (31 | 38.3%) have the highest median income of $38,438 per family member.
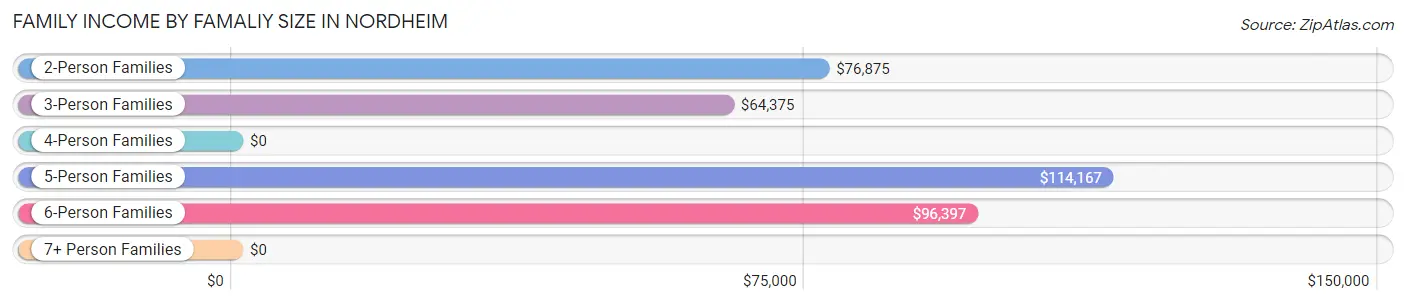
| Income Bracket | # Families | Median Income |
| 2-Person Families | 31 (38.3%) | $76,875 |
| 3-Person Families | 11 (13.6%) | $64,375 |
| 4-Person Families | 10 (12.3%) | $0 |
| 5-Person Families | 10 (12.3%) | $114,167 |
| 6-Person Families | 19 (23.5%) | $96,397 |
| 7+ Person Families | 0 (0.0%) | $0 |
| Total | 81 (100.0%) | $95,221 |
Family Income by Number of Earners in Nordheim
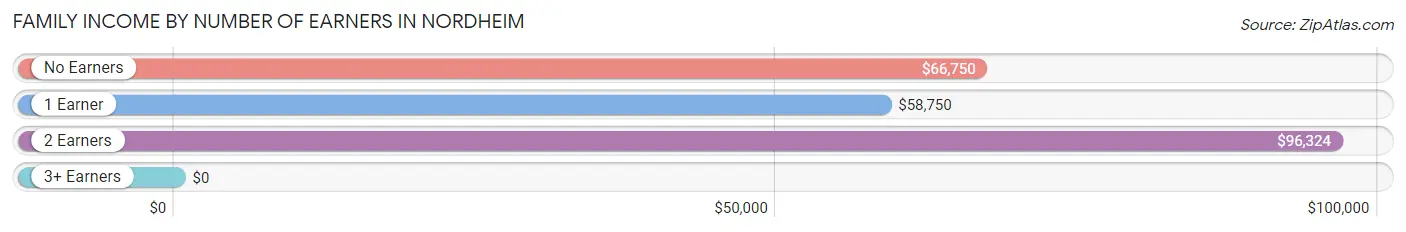
| Number of Earners | # Families | Median Income |
| No Earners | 15 (18.5%) | $66,750 |
| 1 Earner | 22 (27.2%) | $58,750 |
| 2 Earners | 42 (51.8%) | $96,324 |
| 3+ Earners | 2 (2.5%) | $0 |
| Total | 81 (100.0%) | $95,221 |
Household Income in Nordheim
Household Income Brackets in Nordheim
With 59 households falling in the category, the $25,000 to $34,999 income range is the most frequent in Nordheim, accounting for 27.3% of all households.
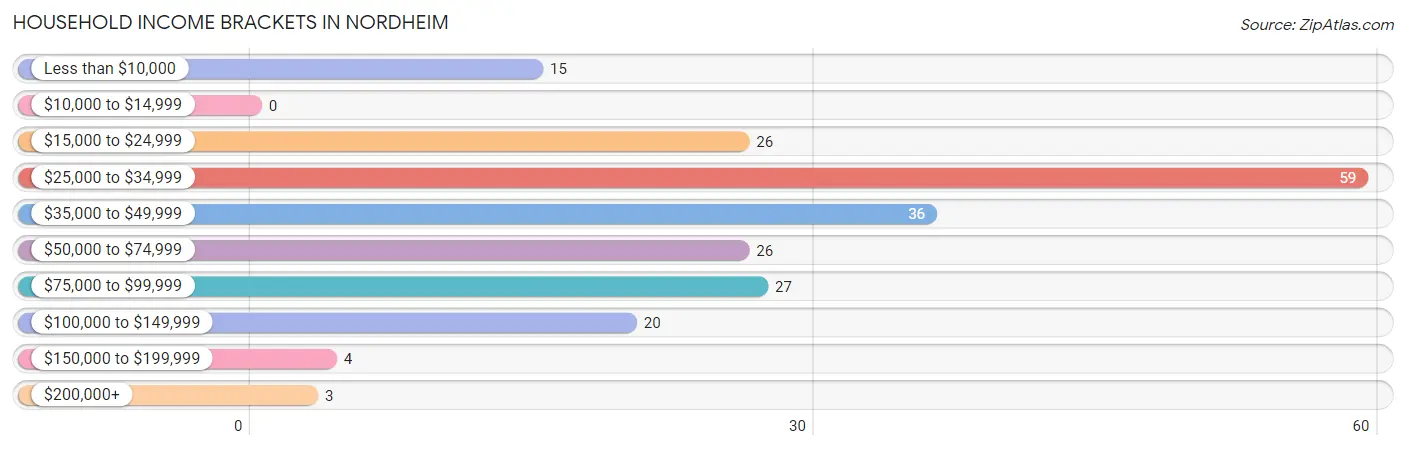
| Income Bracket | # Households | % Households |
| Less than $10,000 | 15 | 6.9% |
| $10,000 to $14,999 | 0 | 0.0% |
| $15,000 to $24,999 | 26 | 12.0% |
| $25,000 to $34,999 | 59 | 27.3% |
| $35,000 to $49,999 | 36 | 16.7% |
| $50,000 to $74,999 | 26 | 12.0% |
| $75,000 to $99,999 | 27 | 12.5% |
| $100,000 to $149,999 | 20 | 9.3% |
| $150,000 to $199,999 | 4 | 1.9% |
| $200,000+ | 3 | 1.4% |
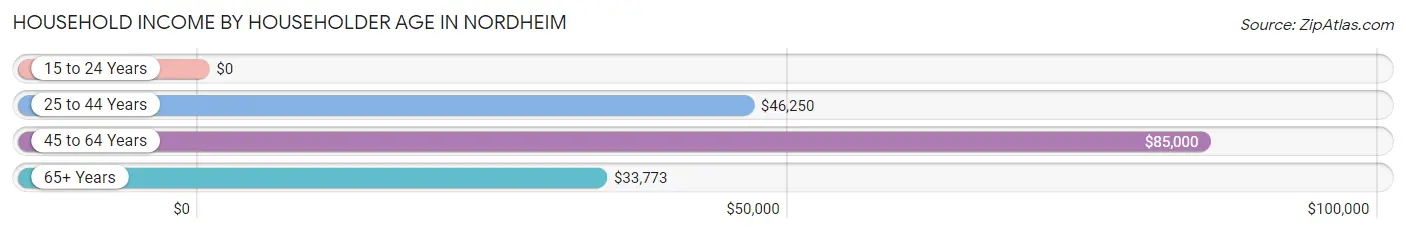
Household Income by Householder Age in Nordheim
The median household income in Nordheim is $37,656, with the highest median household income of $85,000 found in the 45 to 64 years age bracket for the primary householder. A total of 40 households (18.5%) fall into this category.
| Income Bracket | # Households | Median Income |
| 15 to 24 Years | 0 (0.0%) | $0 |
| 25 to 44 Years | 34 (15.7%) | $46,250 |
| 45 to 64 Years | 40 (18.5%) | $85,000 |
| 65+ Years | 142 (65.7%) | $33,773 |
| Total | 216 (100.0%) | $37,656 |
Poverty in Nordheim
Income Below Poverty by Sex and Age in Nordheim
With 2.2% poverty level for males and 8.0% for females among the residents of Nordheim, 15 year old males and 75 year old and over females are the most vulnerable to poverty, with 1 males (100.0%) and 15 females (37.5%) in their respective age groups living below the poverty level.
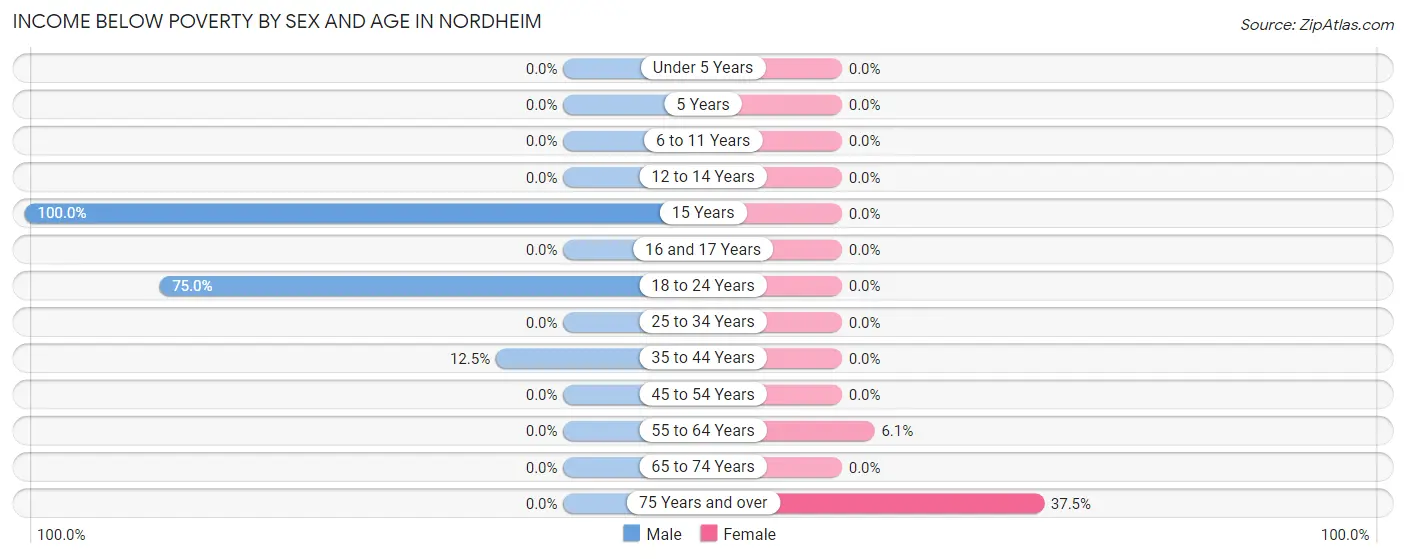
| Age Bracket | Male | Female |
| Under 5 Years | 0 (0.0%) | 0 (0.0%) |
| 5 Years | 0 (0.0%) | 0 (0.0%) |
| 6 to 11 Years | 0 (0.0%) | 0 (0.0%) |
| 12 to 14 Years | 0 (0.0%) | 0 (0.0%) |
| 15 Years | 1 (100.0%) | 0 (0.0%) |
| 16 and 17 Years | 0 (0.0%) | 0 (0.0%) |
| 18 to 24 Years | 3 (75.0%) | 0 (0.0%) |
| 25 to 34 Years | 0 (0.0%) | 0 (0.0%) |
| 35 to 44 Years | 1 (12.5%) | 0 (0.0%) |
| 45 to 54 Years | 0 (0.0%) | 0 (0.0%) |
| 55 to 64 Years | 0 (0.0%) | 2 (6.1%) |
| 65 to 74 Years | 0 (0.0%) | 0 (0.0%) |
| 75 Years and over | 0 (0.0%) | 15 (37.5%) |
| Total | 5 (2.2%) | 17 (8.0%) |
Income Above Poverty by Sex and Age in Nordheim
According to the poverty statistics in Nordheim, males aged under 5 years and females aged under 5 years are the age groups that are most secure financially, with 100.0% of males and 100.0% of females in these age groups living above the poverty line.
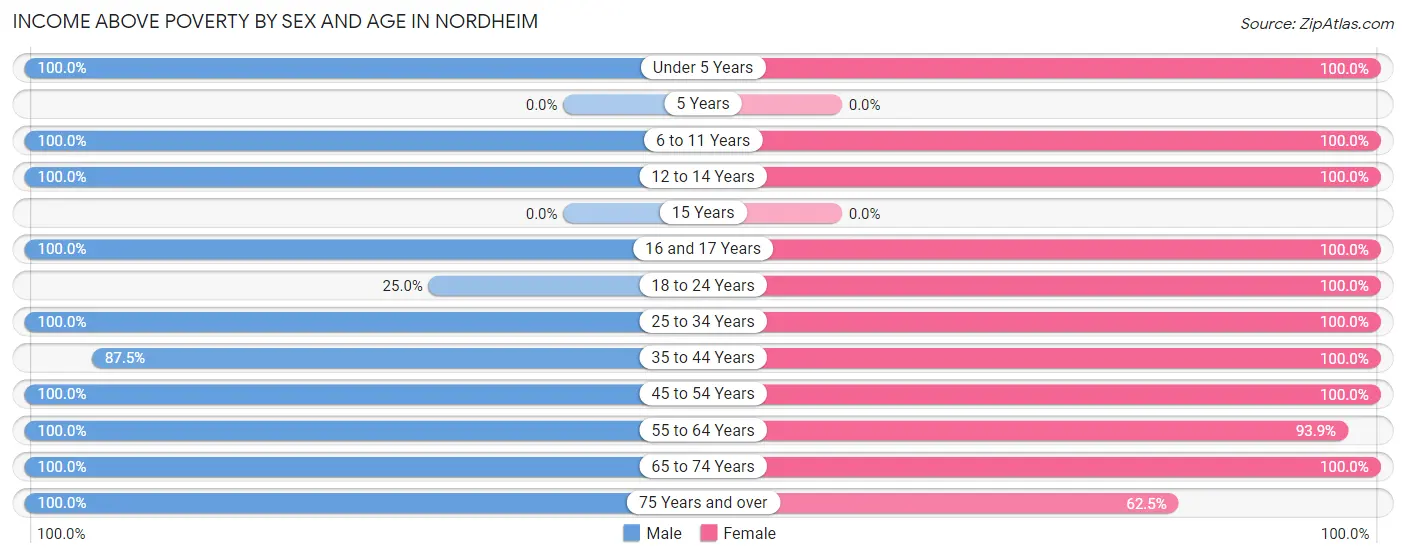
| Age Bracket | Male | Female |
| Under 5 Years | 5 (100.0%) | 6 (100.0%) |
| 5 Years | 0 (0.0%) | 0 (0.0%) |
| 6 to 11 Years | 16 (100.0%) | 12 (100.0%) |
| 12 to 14 Years | 3 (100.0%) | 2 (100.0%) |
| 15 Years | 0 (0.0%) | 0 (0.0%) |
| 16 and 17 Years | 26 (100.0%) | 3 (100.0%) |
| 18 to 24 Years | 1 (25.0%) | 14 (100.0%) |
| 25 to 34 Years | 5 (100.0%) | 44 (100.0%) |
| 35 to 44 Years | 7 (87.5%) | 28 (100.0%) |
| 45 to 54 Years | 19 (100.0%) | 22 (100.0%) |
| 55 to 64 Years | 19 (100.0%) | 31 (93.9%) |
| 65 to 74 Years | 93 (100.0%) | 9 (100.0%) |
| 75 Years and over | 30 (100.0%) | 25 (62.5%) |
| Total | 224 (97.8%) | 196 (92.0%) |
Income Below Poverty Among Married-Couple Families in Nordheim
The poverty statistics for married-couple families in Nordheim show that 2.9% or 2 of the total 68 families live below the poverty line. Families with 1 or 2 children have the highest poverty rate of 5.7%, comprising of 2 families. On the other hand, families with no children have the lowest poverty rate of 0.0%, which includes 0 families.
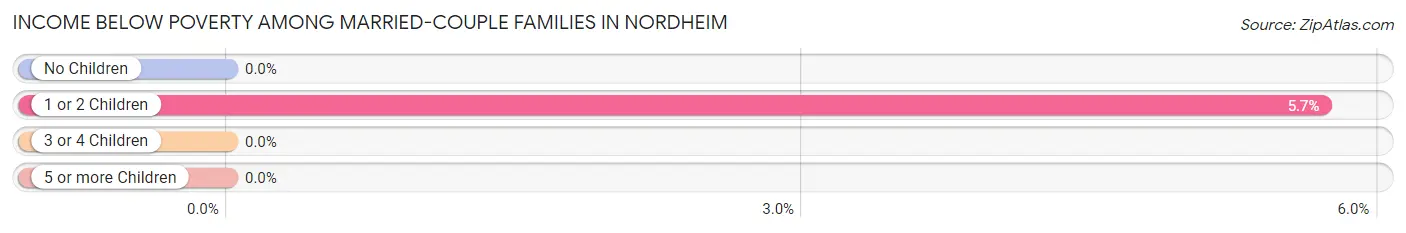
| Children | Above Poverty | Below Poverty |
| No Children | 30 (100.0%) | 0 (0.0%) |
| 1 or 2 Children | 33 (94.3%) | 2 (5.7%) |
| 3 or 4 Children | 3 (100.0%) | 0 (0.0%) |
| 5 or more Children | 0 (0.0%) | 0 (0.0%) |
| Total | 66 (97.1%) | 2 (2.9%) |
Income Below Poverty Among Single-Parent Households in Nordheim
| Children | Single Father | Single Mother |
| No Children | 0 (0.0%) | 0 (0.0%) |
| 1 or 2 Children | 0 (0.0%) | 0 (0.0%) |
| 3 or 4 Children | 0 (0.0%) | 0 (0.0%) |
| 5 or more Children | 0 (0.0%) | 0 (0.0%) |
| Total | 0 (0.0%) | 0 (0.0%) |
Income Below Poverty Among Married-Couple vs Single-Parent Households in Nordheim
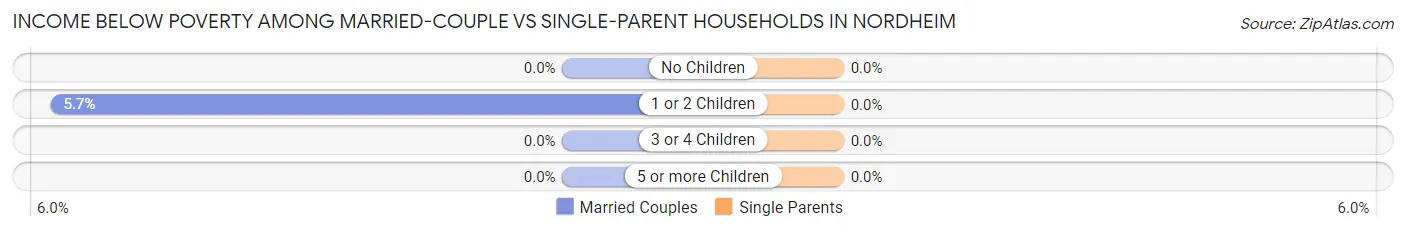
| Children | Married-Couple Families | Single-Parent Households |
| No Children | 0 (0.0%) | 0 (0.0%) |
| 1 or 2 Children | 2 (5.7%) | 0 (0.0%) |
| 3 or 4 Children | 0 (0.0%) | 0 (0.0%) |
| 5 or more Children | 0 (0.0%) | 0 (0.0%) |
| Total | 2 (2.9%) | 0 (0.0%) |
Race in Nordheim
The most populous races in Nordheim are White / Caucasian (376 | 85.1%), Hispanic or Latino (97 | 22.0%), and Some other Race (53 | 12.0%).
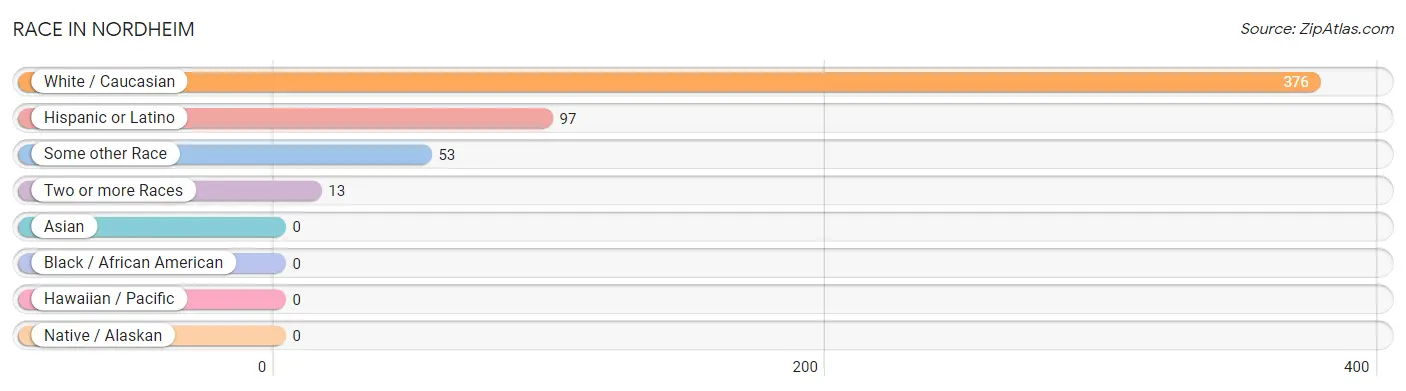
| Race | # Population | % Population |
| Asian | 0 | 0.0% |
| Black / African American | 0 | 0.0% |
| Hawaiian / Pacific | 0 | 0.0% |
| Hispanic or Latino | 97 | 22.0% |
| Native / Alaskan | 0 | 0.0% |
| White / Caucasian | 376 | 85.1% |
| Two or more Races | 13 | 2.9% |
| Some other Race | 53 | 12.0% |
| Total | 442 | 100.0% |
Ancestry in Nordheim
The most populous ancestries reported in Nordheim are German (238 | 53.8%), Irish (75 | 17.0%), Mexican (75 | 17.0%), English (40 | 9.0%), and Czech (20 | 4.5%), together accounting for 101.4% of all Nordheim residents.
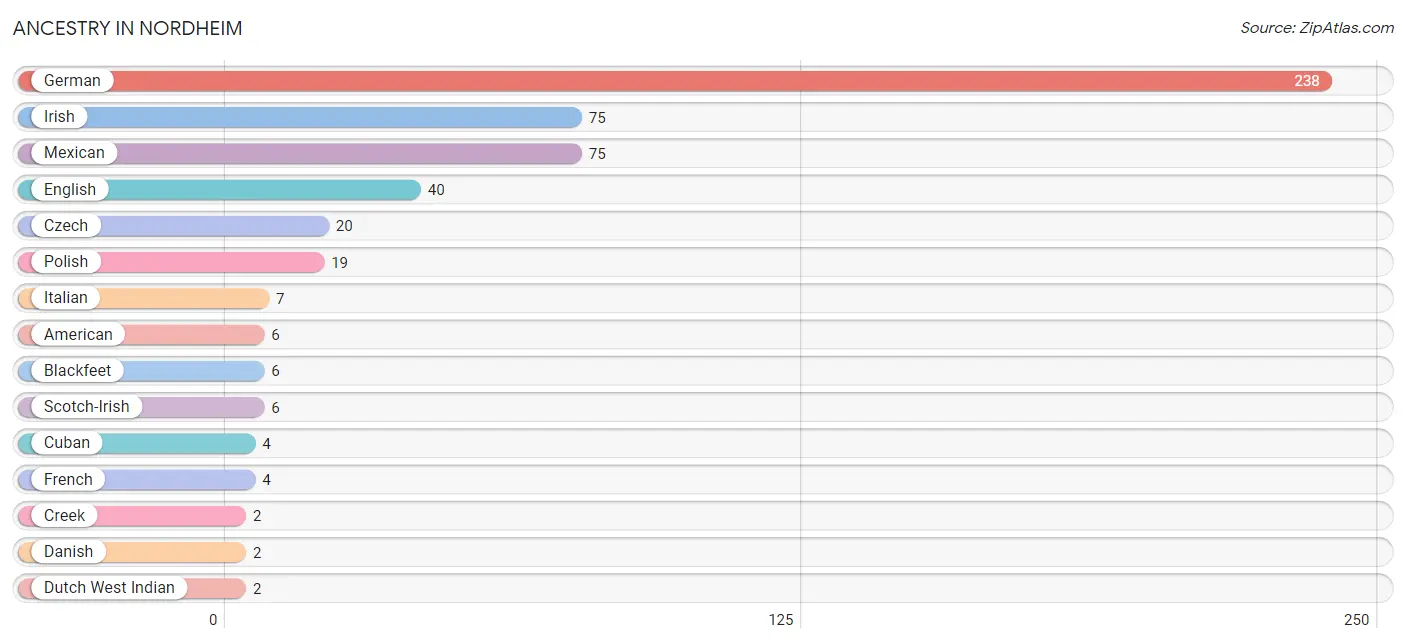
| Ancestry | # Population | % Population |
| American | 6 | 1.4% |
| Blackfeet | 6 | 1.4% |
| Creek | 2 | 0.4% |
| Cuban | 4 | 0.9% |
| Czech | 20 | 4.5% |
| Danish | 2 | 0.4% |
| Dutch West Indian | 2 | 0.4% |
| English | 40 | 9.0% |
| French | 4 | 0.9% |
| German | 238 | 53.8% |
| Irish | 75 | 17.0% |
| Italian | 7 | 1.6% |
| Mexican | 75 | 17.0% |
| Polish | 19 | 4.3% |
| Scotch-Irish | 6 | 1.4% |
| Spanish | 2 | 0.4% |
| Swedish | 2 | 0.4% | View All 17 Rows |
Immigrants in Nordheim

| Immigration Origin | # Population | % Population | View All 0 Rows |
Sex and Age in Nordheim
Sex and Age in Nordheim
The most populous age groups in Nordheim are 65 to 69 Years (89 | 38.9%) for men and 60 to 64 Years (27 | 12.7%) for women.
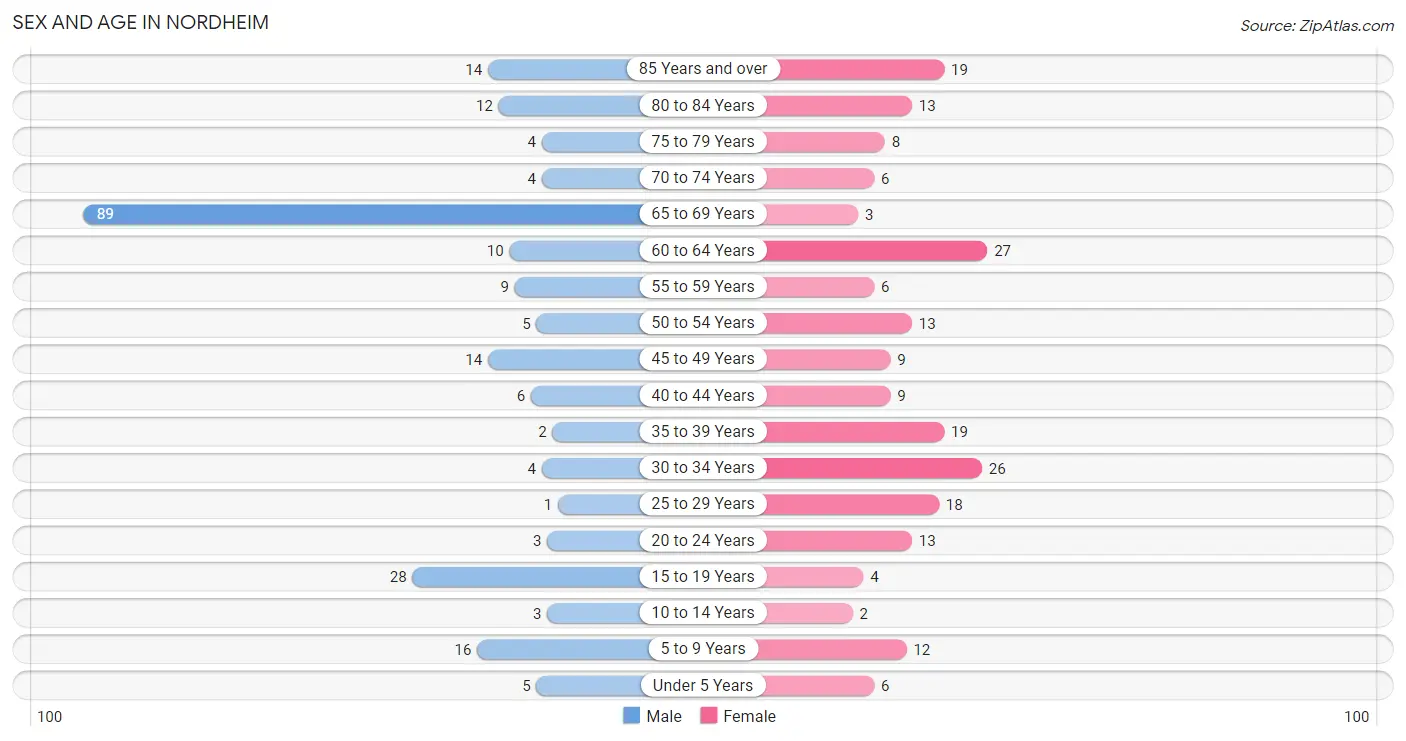
| Age Bracket | Male | Female |
| Under 5 Years | 5 (2.2%) | 6 (2.8%) |
| 5 to 9 Years | 16 (7.0%) | 12 (5.6%) |
| 10 to 14 Years | 3 (1.3%) | 2 (0.9%) |
| 15 to 19 Years | 28 (12.2%) | 4 (1.9%) |
| 20 to 24 Years | 3 (1.3%) | 13 (6.1%) |
| 25 to 29 Years | 1 (0.4%) | 18 (8.5%) |
| 30 to 34 Years | 4 (1.8%) | 26 (12.2%) |
| 35 to 39 Years | 2 (0.9%) | 19 (8.9%) |
| 40 to 44 Years | 6 (2.6%) | 9 (4.2%) |
| 45 to 49 Years | 14 (6.1%) | 9 (4.2%) |
| 50 to 54 Years | 5 (2.2%) | 13 (6.1%) |
| 55 to 59 Years | 9 (3.9%) | 6 (2.8%) |
| 60 to 64 Years | 10 (4.4%) | 27 (12.7%) |
| 65 to 69 Years | 89 (38.9%) | 3 (1.4%) |
| 70 to 74 Years | 4 (1.8%) | 6 (2.8%) |
| 75 to 79 Years | 4 (1.8%) | 8 (3.8%) |
| 80 to 84 Years | 12 (5.2%) | 13 (6.1%) |
| 85 Years and over | 14 (6.1%) | 19 (8.9%) |
| Total | 229 (100.0%) | 213 (100.0%) |
Families and Households in Nordheim
Median Family Size in Nordheim
The median family size in Nordheim is 3.77 persons per family, with married-couple families (68 | 84.0%) accounting for the largest median family size of 3.82 persons per family. On the other hand, single female/mother families (3 | 3.7%) represent the smallest median family size with 2.33 persons per family.
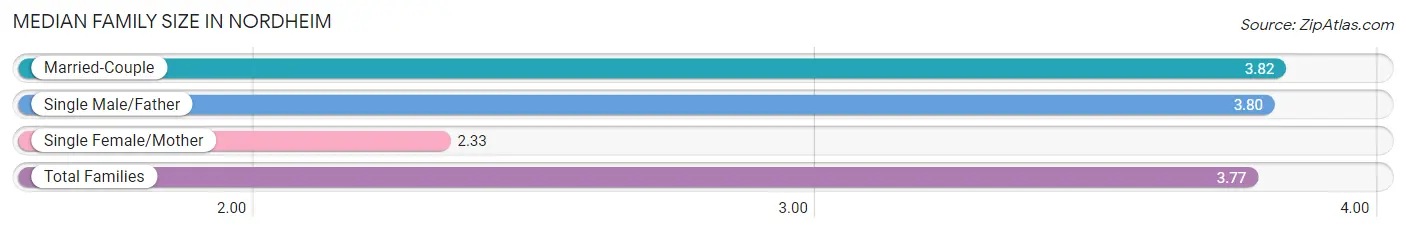
| Family Type | # Families | Family Size |
| Married-Couple | 68 (84.0%) | 3.82 |
| Single Male/Father | 10 (12.3%) | 3.80 |
| Single Female/Mother | 3 (3.7%) | 2.33 |
| Total Families | 81 (100.0%) | 3.77 |
Median Household Size in Nordheim
The median household size in Nordheim is 2.05 persons per household, with married-couple households (68 | 31.5%) accounting for the largest median household size of 3.82 persons per household. non-family households (135 | 62.5%) represent the smallest median household size with 1.01 persons per household.
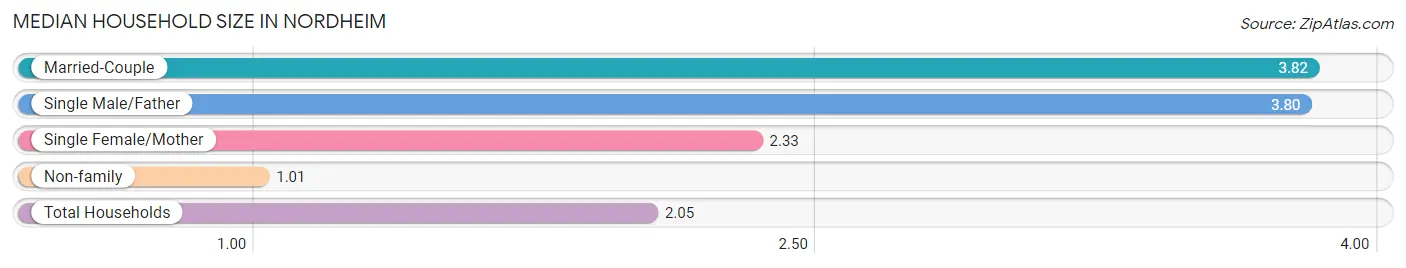
| Household Type | # Households | Household Size |
| Married-Couple | 68 (31.5%) | 3.82 |
| Single Male/Father | 10 (4.6%) | 3.80 |
| Single Female/Mother | 3 (1.4%) | 2.33 |
| Non-family | 135 (62.5%) | 1.01 |
| Total Households | 216 (100.0%) | 2.05 |
Household Size by Marriage Status in Nordheim
Out of a total of 216 households in Nordheim, 81 (37.5%) are family households, while 135 (62.5%) are nonfamily households. The most numerous type of family households are 2-person households, comprising 31, and the most common type of nonfamily households are 1-person households, comprising 132.
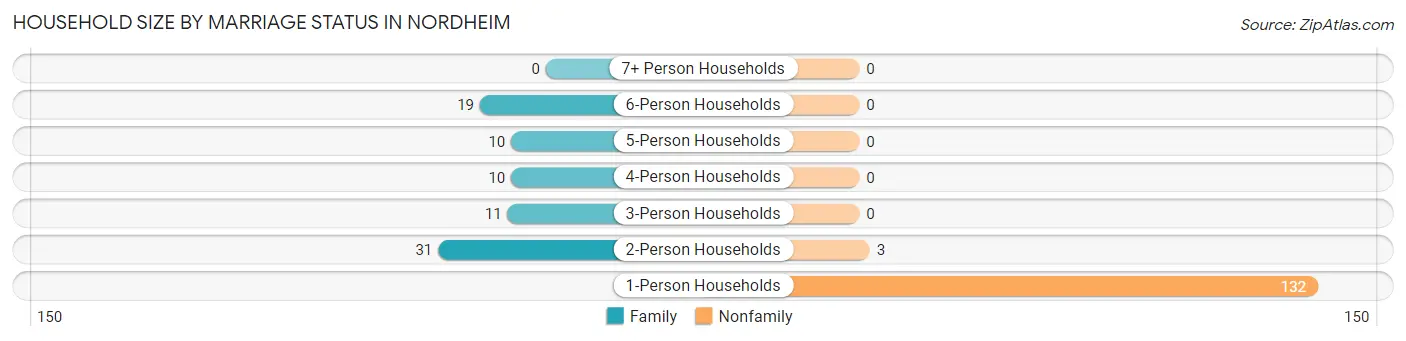
| Household Size | Family Households | Nonfamily Households |
| 1-Person Households | - | 132 (61.1%) |
| 2-Person Households | 31 (14.3%) | 3 (1.4%) |
| 3-Person Households | 11 (5.1%) | 0 (0.0%) |
| 4-Person Households | 10 (4.6%) | 0 (0.0%) |
| 5-Person Households | 10 (4.6%) | 0 (0.0%) |
| 6-Person Households | 19 (8.8%) | 0 (0.0%) |
| 7+ Person Households | 0 (0.0%) | 0 (0.0%) |
| Total | 81 (37.5%) | 135 (62.5%) |
Female Fertility in Nordheim
Fertility by Age in Nordheim
Average fertility rate in Nordheim is 10.0 births per 1,000 women. Women in the age bracket of 20 to 34 years have the highest fertility rate with 18.0 births per 1,000 women. Women in the age bracket of 20 to 34 years acount for 100.0% of all women with births.
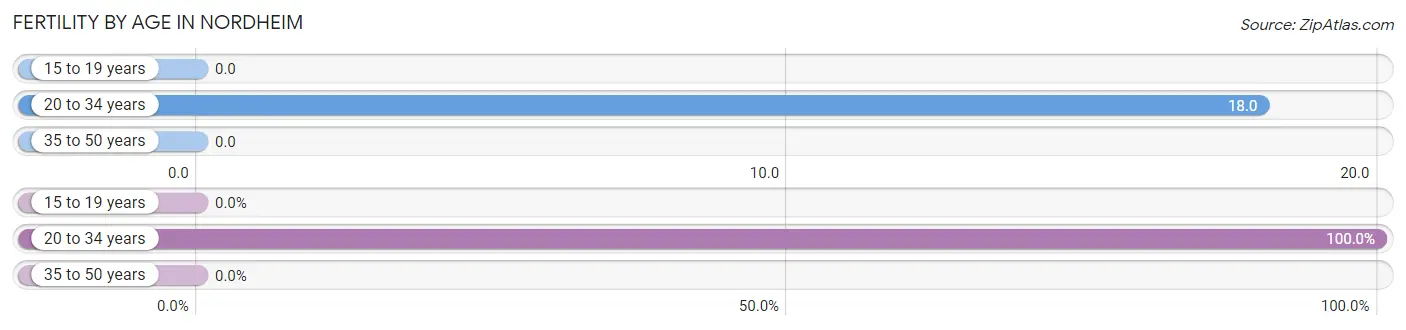
| Age Bracket | Women with Births | Births / 1,000 Women |
| 15 to 19 years | 0 (0.0%) | 0.0 |
| 20 to 34 years | 1 (100.0%) | 18.0 |
| 35 to 50 years | 0 (0.0%) | 0.0 |
| Total | 1 (100.0%) | 10.0 |
Fertility by Age by Marriage Status in Nordheim
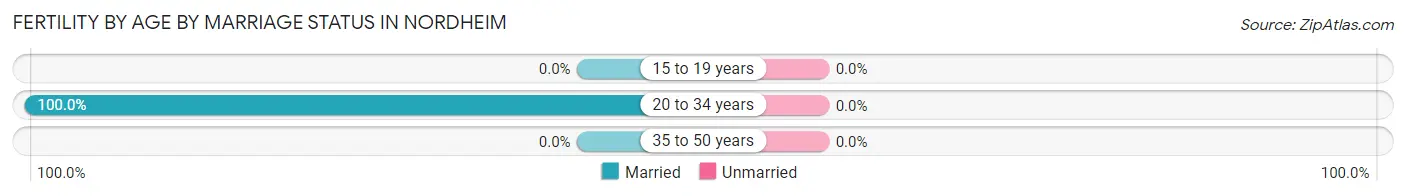
| Age Bracket | Married | Unmarried |
| 15 to 19 years | 0 (0.0%) | 0 (0.0%) |
| 20 to 34 years | 1 (100.0%) | 0 (0.0%) |
| 35 to 50 years | 0 (0.0%) | 0 (0.0%) |
| Total | 1 (100.0%) | 0 (0.0%) |
Fertility by Education in Nordheim
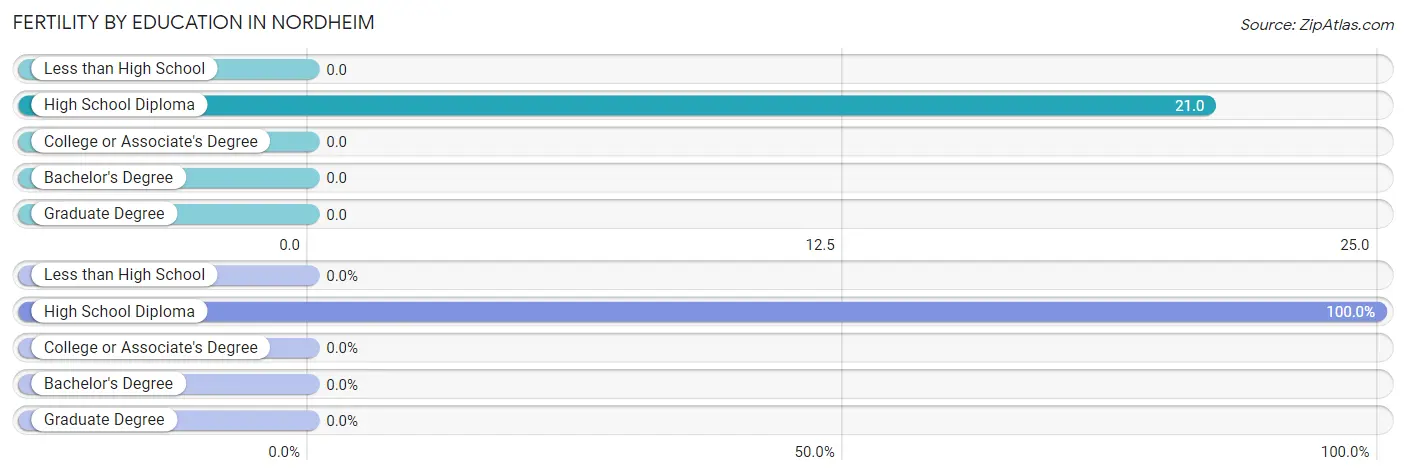
| Educational Attainment | Women with Births | Births / 1,000 Women |
| Less than High School | 0 (0.0%) | 0.0 |
| High School Diploma | 1 (100.0%) | 21.0 |
| College or Associate's Degree | 0 (0.0%) | 0.0 |
| Bachelor's Degree | 0 (0.0%) | 0.0 |
| Graduate Degree | 0 (0.0%) | 0.0 |
| Total | 1 (100.0%) | 10.0 |
Fertility by Education by Marriage Status in Nordheim
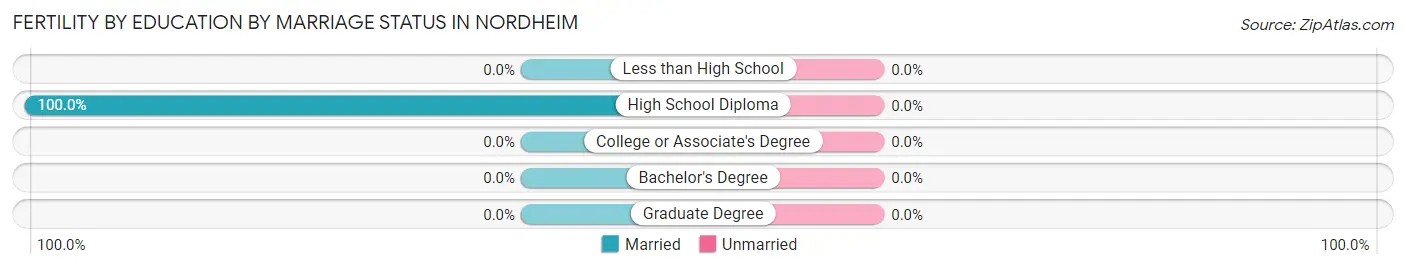
| Educational Attainment | Married | Unmarried |
| Less than High School | 0 (0.0%) | 0 (0.0%) |
| High School Diploma | 1 (100.0%) | 0 (0.0%) |
| College or Associate's Degree | 0 (0.0%) | 0 (0.0%) |
| Bachelor's Degree | 0 (0.0%) | 0 (0.0%) |
| Graduate Degree | 0 (0.0%) | 0 (0.0%) |
| Total | 1 (100.0%) | 0 (0.0%) |
Employment Characteristics in Nordheim
Employment by Class of Employer in Nordheim
Among the 150 employed individuals in Nordheim, private company employees (112 | 74.7%), self-employed (not incorporated) (12 | 8.0%), and local government employees (12 | 8.0%) make up the most common classes of employment.
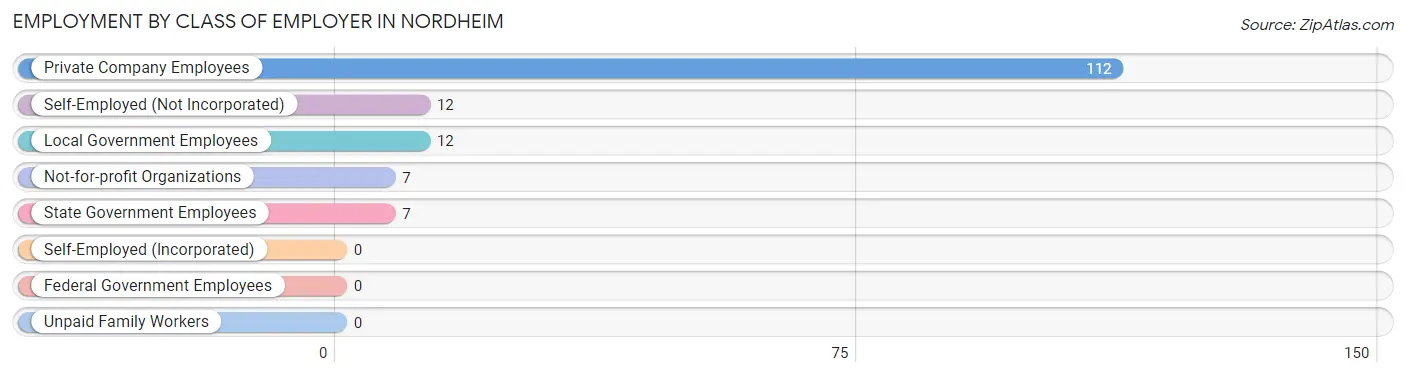
| Employer Class | # Employees | % Employees |
| Private Company Employees | 112 | 74.7% |
| Self-Employed (Incorporated) | 0 | 0.0% |
| Self-Employed (Not Incorporated) | 12 | 8.0% |
| Not-for-profit Organizations | 7 | 4.7% |
| Local Government Employees | 12 | 8.0% |
| State Government Employees | 7 | 4.7% |
| Federal Government Employees | 0 | 0.0% |
| Unpaid Family Workers | 0 | 0.0% |
| Total | 150 | 100.0% |
Employment Status by Age in Nordheim
According to the labor force statistics for Nordheim, out of the total population over 16 years of age (397), 40.3% or 160 individuals are in the labor force, with 6.3% or 10 of them unemployed. The age group with the highest labor force participation rate is 25 to 29 years, with 100.0% or 19 individuals in the labor force. Within the labor force, the 25 to 29 years age range has the highest percentage of unemployed individuals, with 26.3% or 5 of them being unemployed.
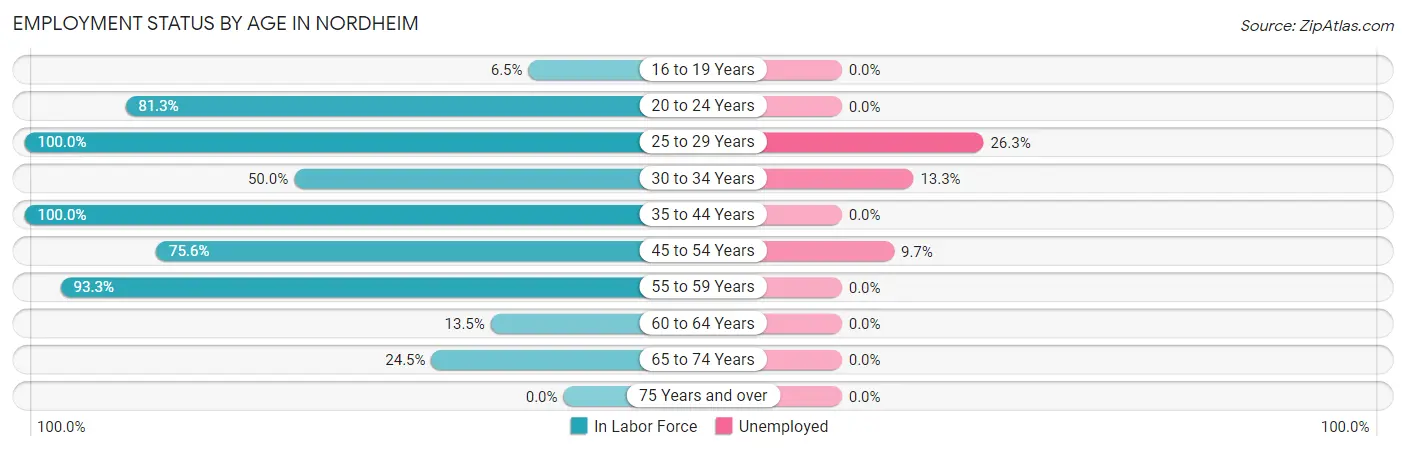
| Age Bracket | In Labor Force | Unemployed |
| 16 to 19 Years | 2 (6.5%) | 0 (0.0%) |
| 20 to 24 Years | 13 (81.3%) | 0 (0.0%) |
| 25 to 29 Years | 19 (100.0%) | 5 (26.3%) |
| 30 to 34 Years | 15 (50.0%) | 2 (13.3%) |
| 35 to 44 Years | 36 (100.0%) | 0 (0.0%) |
| 45 to 54 Years | 31 (75.6%) | 3 (9.7%) |
| 55 to 59 Years | 14 (93.3%) | 0 (0.0%) |
| 60 to 64 Years | 5 (13.5%) | 0 (0.0%) |
| 65 to 74 Years | 25 (24.5%) | 0 (0.0%) |
| 75 Years and over | 0 (0.0%) | 0 (0.0%) |
| Total | 160 (40.3%) | 10 (6.3%) |
Employment Status by Educational Attainment in Nordheim
According to labor force statistics for Nordheim, 67.4% of individuals (120) out of the total population between 25 and 64 years of age (178) are in the labor force, with 8.3% or 10 of them being unemployed. The group with the highest labor force participation rate are those with the educational attainment of bachelor's degree or higher, with 96.2% or 25 individuals in the labor force. Within the labor force, individuals with less than high school education have the highest percentage of unemployment, with 40.0% or 2 of them being unemployed.
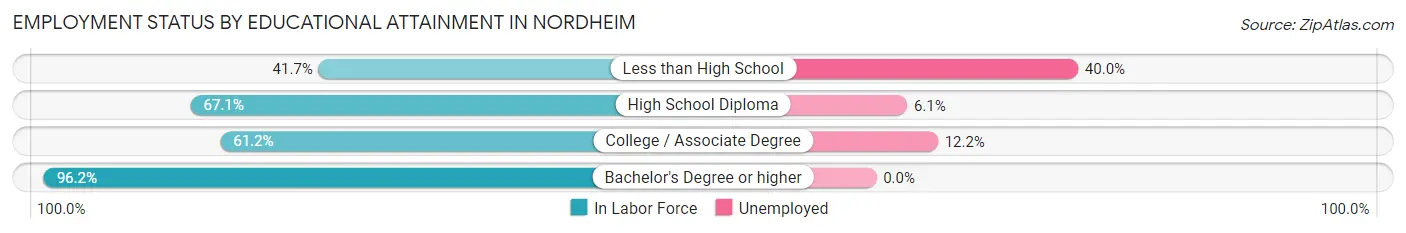
| Educational Attainment | In Labor Force | Unemployed |
| Less than High School | 5 (41.7%) | 5 (40.0%) |
| High School Diploma | 49 (67.1%) | 4 (6.1%) |
| College / Associate Degree | 41 (61.2%) | 8 (12.2%) |
| Bachelor's Degree or higher | 25 (96.2%) | 0 (0.0%) |
| Total | 120 (67.4%) | 15 (8.3%) |
Employment Occupations by Sex in Nordheim
Management, Business, Science and Arts Occupations
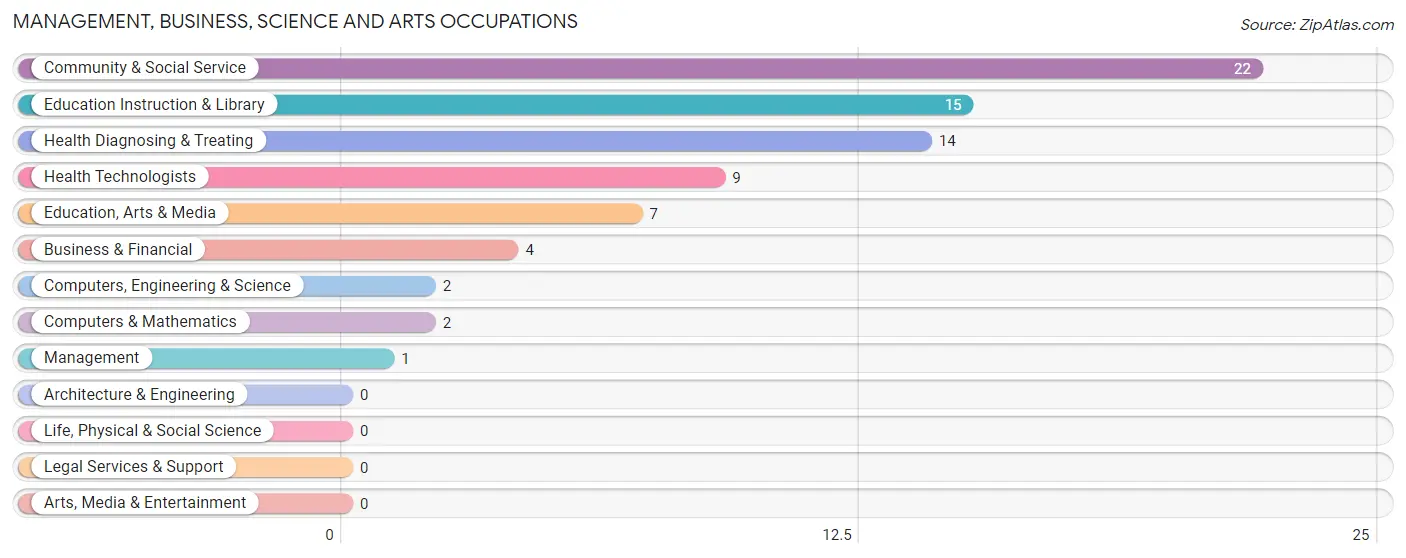
The most common Management, Business, Science and Arts occupations in Nordheim are Community & Social Service (22 | 14.7%), Education Instruction & Library (15 | 10.0%), Health Diagnosing & Treating (14 | 9.3%), Health Technologists (9 | 6.0%), and Education, Arts & Media (7 | 4.7%).
Management, Business, Science and Arts Occupations by Sex
Within the Management, Business, Science and Arts occupations in Nordheim, the most male-oriented occupations are Business & Financial (100.0%), Education, Arts & Media (100.0%), and Community & Social Service (50.0%), while the most female-oriented occupations are Management (100.0%), Computers, Engineering & Science (100.0%), and Computers & Mathematics (100.0%).
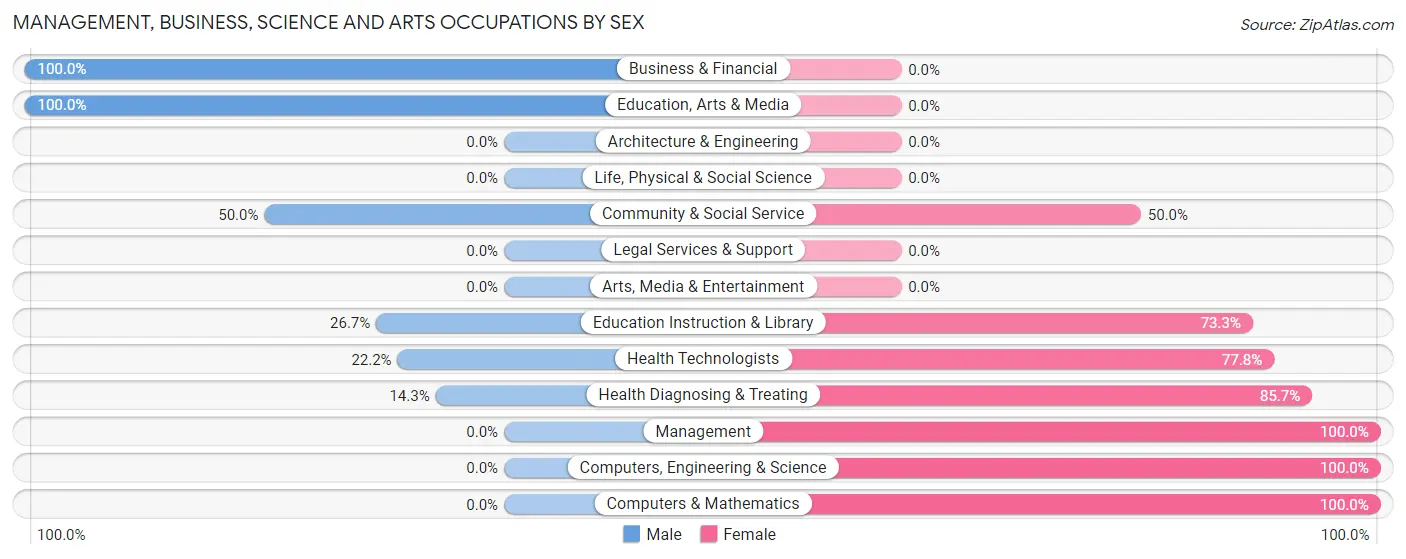
| Occupation | Male | Female |
| Management | 0 (0.0%) | 1 (100.0%) |
| Business & Financial | 4 (100.0%) | 0 (0.0%) |
| Computers, Engineering & Science | 0 (0.0%) | 2 (100.0%) |
| Computers & Mathematics | 0 (0.0%) | 2 (100.0%) |
| Architecture & Engineering | 0 (0.0%) | 0 (0.0%) |
| Life, Physical & Social Science | 0 (0.0%) | 0 (0.0%) |
| Community & Social Service | 11 (50.0%) | 11 (50.0%) |
| Education, Arts & Media | 7 (100.0%) | 0 (0.0%) |
| Legal Services & Support | 0 (0.0%) | 0 (0.0%) |
| Education Instruction & Library | 4 (26.7%) | 11 (73.3%) |
| Arts, Media & Entertainment | 0 (0.0%) | 0 (0.0%) |
| Health Diagnosing & Treating | 2 (14.3%) | 12 (85.7%) |
| Health Technologists | 2 (22.2%) | 7 (77.8%) |
| Total (Category) | 17 (39.5%) | 26 (60.5%) |
| Total (Overall) | 58 (38.7%) | 92 (61.3%) |
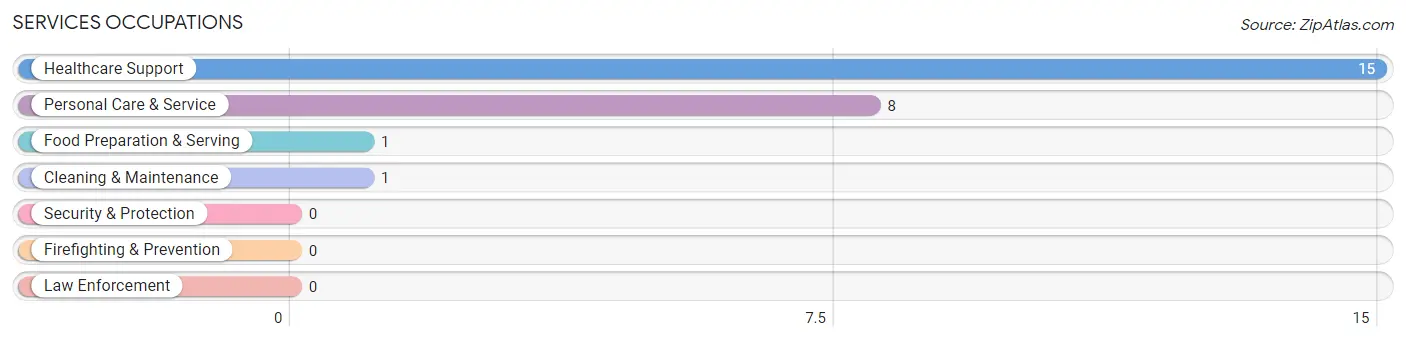
Services Occupations
The most common Services occupations in Nordheim are Healthcare Support (15 | 10.0%), Personal Care & Service (8 | 5.3%), Food Preparation & Serving (1 | 0.7%), and Cleaning & Maintenance (1 | 0.7%).
Services Occupations by Sex
Within the Services occupations in Nordheim, the most male-oriented occupations are Food Preparation & Serving (100.0%), Cleaning & Maintenance (100.0%), and Healthcare Support (20.0%), while the most female-oriented occupations are Personal Care & Service (87.5%), and Healthcare Support (80.0%).
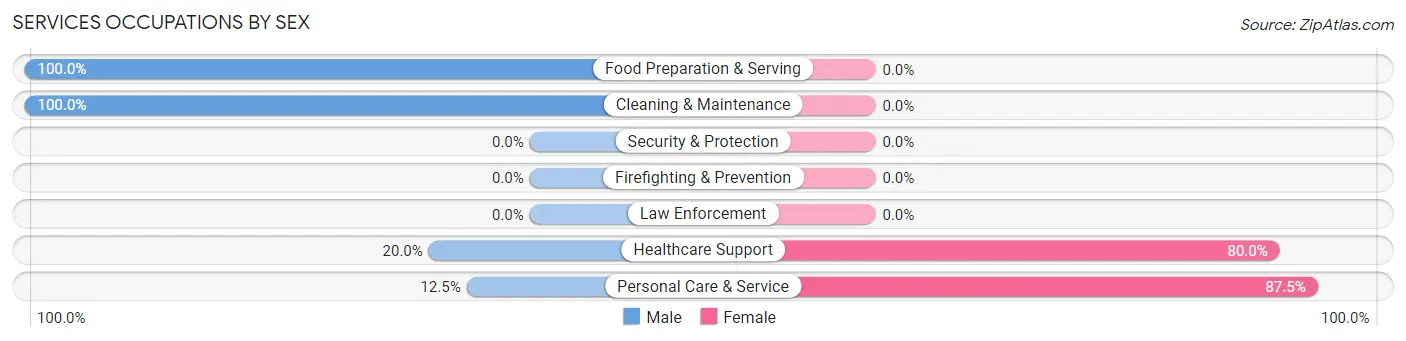
| Occupation | Male | Female |
| Healthcare Support | 3 (20.0%) | 12 (80.0%) |
| Security & Protection | 0 (0.0%) | 0 (0.0%) |
| Firefighting & Prevention | 0 (0.0%) | 0 (0.0%) |
| Law Enforcement | 0 (0.0%) | 0 (0.0%) |
| Food Preparation & Serving | 1 (100.0%) | 0 (0.0%) |
| Cleaning & Maintenance | 1 (100.0%) | 0 (0.0%) |
| Personal Care & Service | 1 (12.5%) | 7 (87.5%) |
| Total (Category) | 6 (24.0%) | 19 (76.0%) |
| Total (Overall) | 58 (38.7%) | 92 (61.3%) |
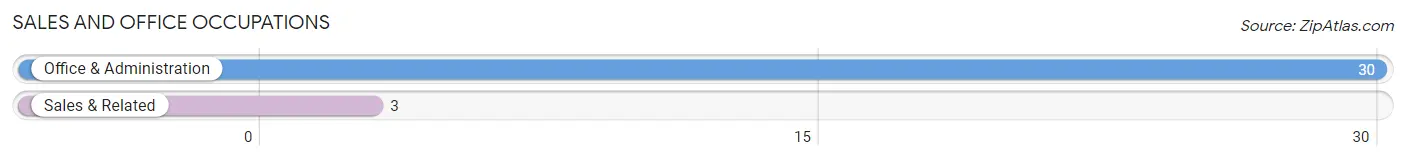
Sales and Office Occupations
The most common Sales and Office occupations in Nordheim are Office & Administration (30 | 20.0%), and Sales & Related (3 | 2.0%).
Sales and Office Occupations by Sex
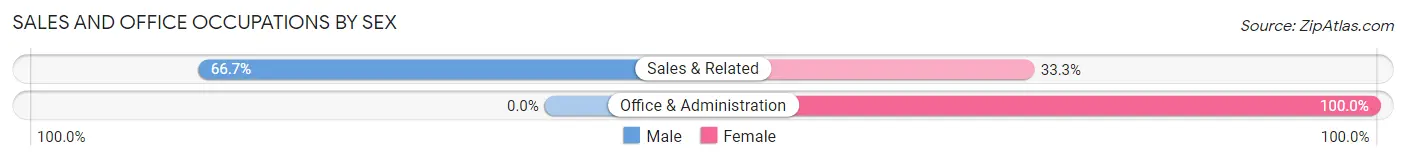
| Occupation | Male | Female |
| Sales & Related | 2 (66.7%) | 1 (33.3%) |
| Office & Administration | 0 (0.0%) | 30 (100.0%) |
| Total (Category) | 2 (6.1%) | 31 (93.9%) |
| Total (Overall) | 58 (38.7%) | 92 (61.3%) |
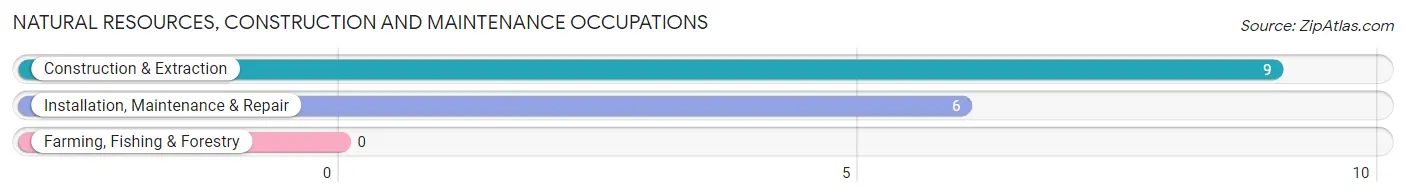
Natural Resources, Construction and Maintenance Occupations
The most common Natural Resources, Construction and Maintenance occupations in Nordheim are Construction & Extraction (9 | 6.0%), and Installation, Maintenance & Repair (6 | 4.0%).
Natural Resources, Construction and Maintenance Occupations by Sex
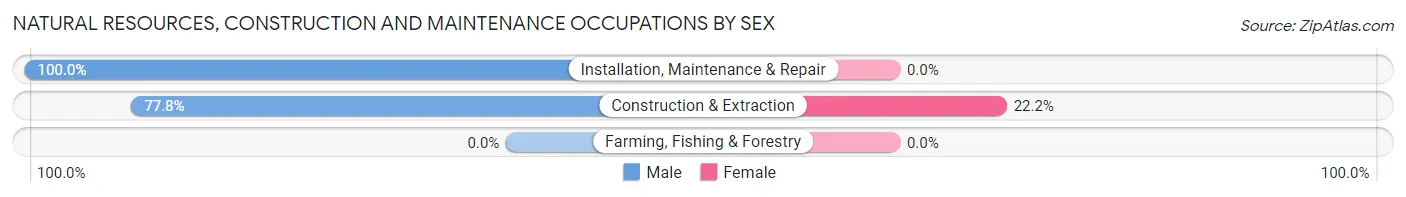
| Occupation | Male | Female |
| Farming, Fishing & Forestry | 0 (0.0%) | 0 (0.0%) |
| Construction & Extraction | 7 (77.8%) | 2 (22.2%) |
| Installation, Maintenance & Repair | 6 (100.0%) | 0 (0.0%) |
| Total (Category) | 13 (86.7%) | 2 (13.3%) |
| Total (Overall) | 58 (38.7%) | 92 (61.3%) |
Production, Transportation and Moving Occupations
The most common Production, Transportation and Moving occupations in Nordheim are Production (19 | 12.7%), Material Moving (11 | 7.3%), and Transportation (4 | 2.7%).
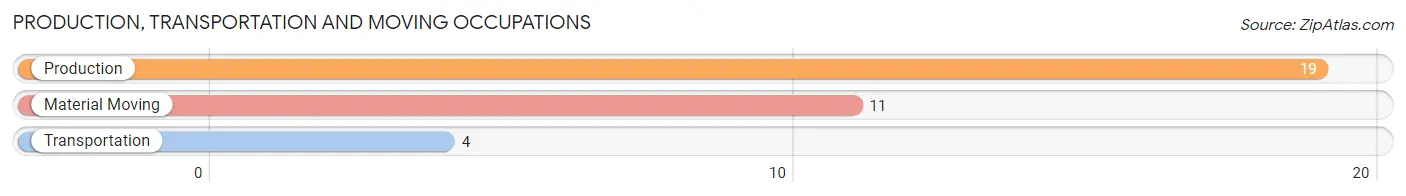
Production, Transportation and Moving Occupations by Sex
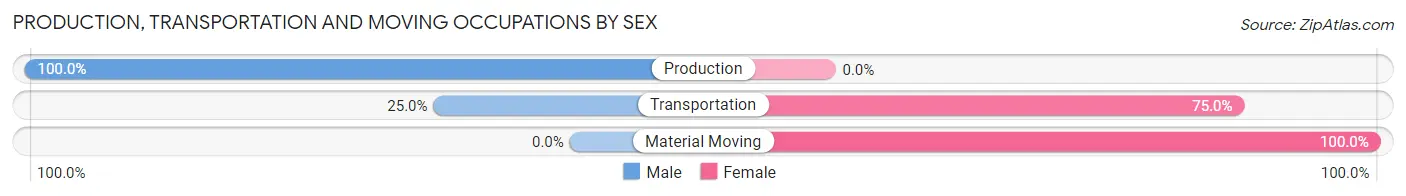
| Occupation | Male | Female |
| Production | 19 (100.0%) | 0 (0.0%) |
| Transportation | 1 (25.0%) | 3 (75.0%) |
| Material Moving | 0 (0.0%) | 11 (100.0%) |
| Total (Category) | 20 (58.8%) | 14 (41.2%) |
| Total (Overall) | 58 (38.7%) | 92 (61.3%) |
Employment Industries by Sex in Nordheim
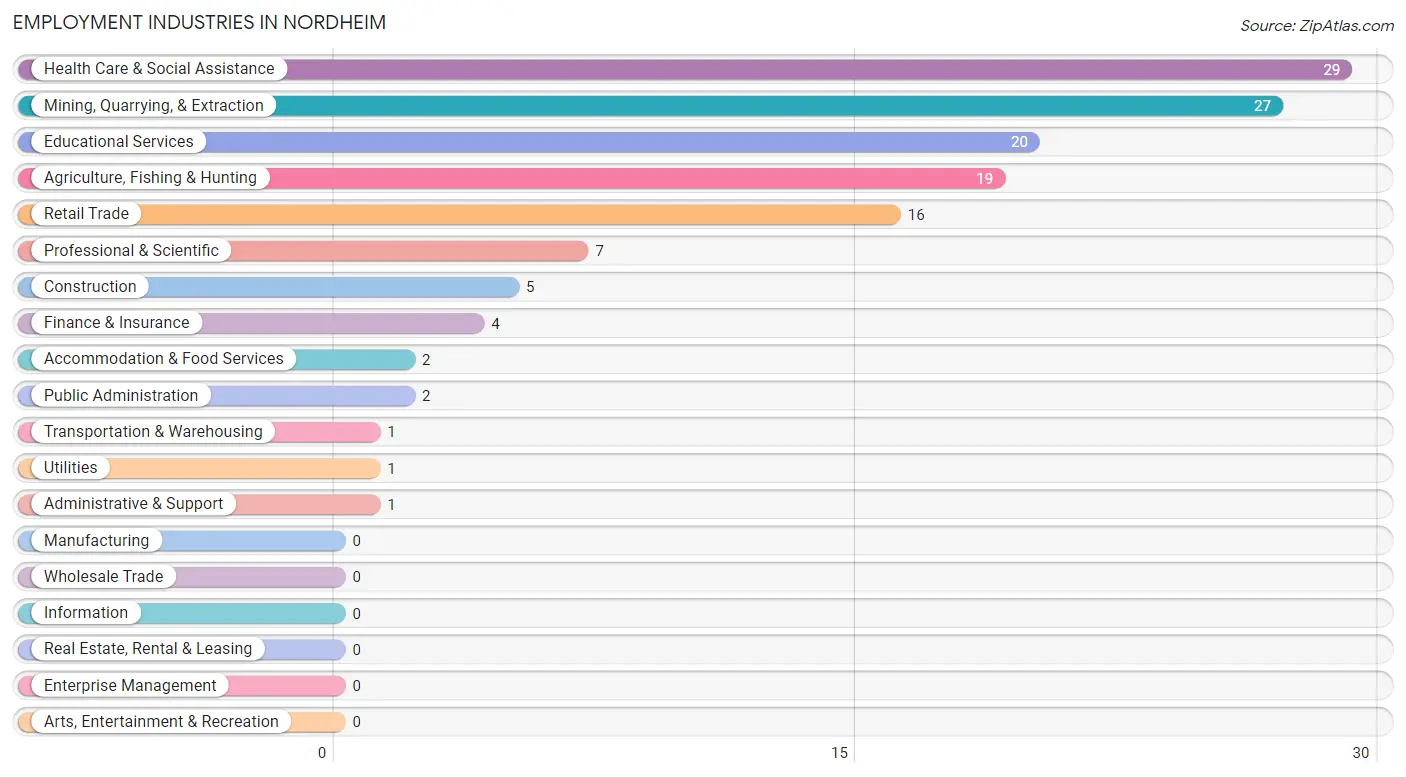
Employment Industries in Nordheim
The major employment industries in Nordheim include Health Care & Social Assistance (29 | 19.3%), Mining, Quarrying, & Extraction (27 | 18.0%), Educational Services (20 | 13.3%), Agriculture, Fishing & Hunting (19 | 12.7%), and Retail Trade (16 | 10.7%).
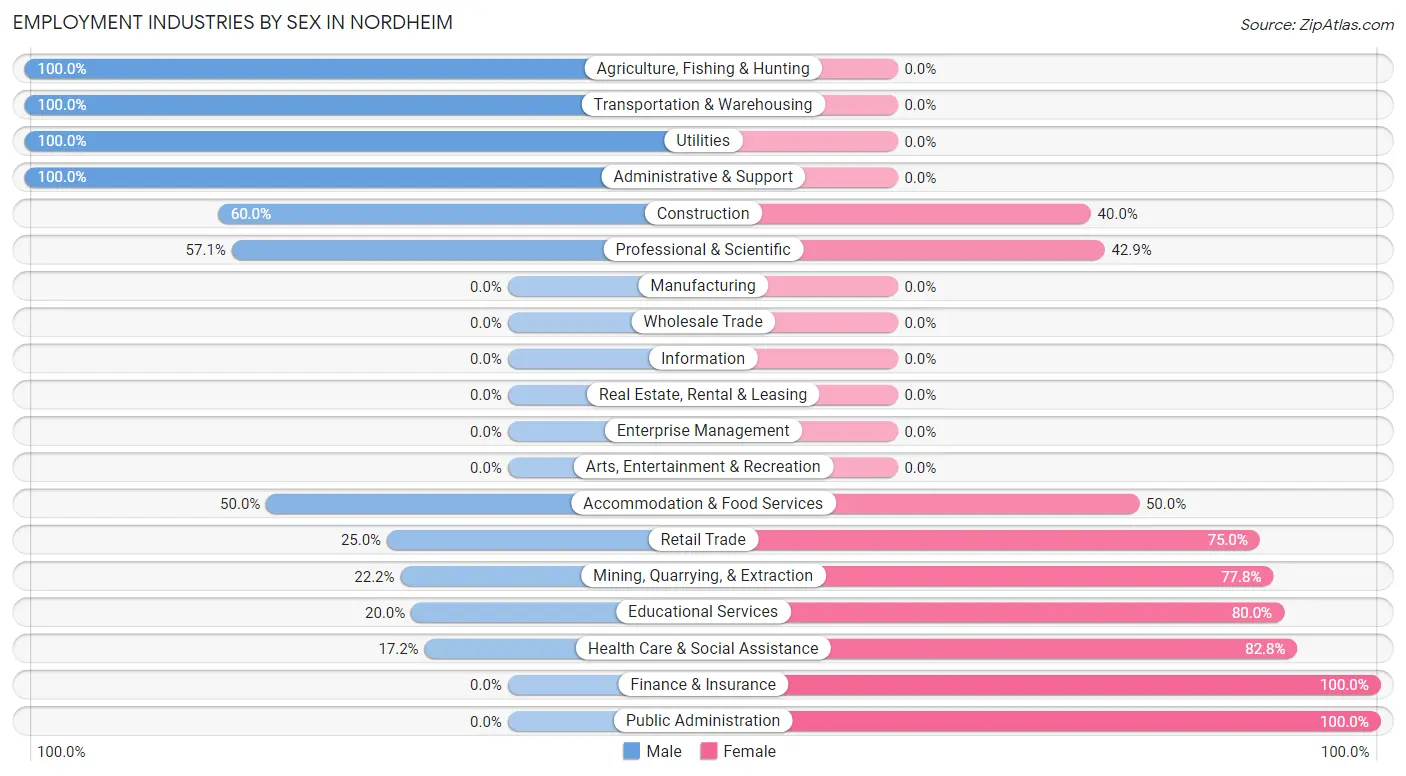
Employment Industries by Sex in Nordheim
The Nordheim industries that see more men than women are Agriculture, Fishing & Hunting (100.0%), Transportation & Warehousing (100.0%), and Utilities (100.0%), whereas the industries that tend to have a higher number of women are Finance & Insurance (100.0%), Public Administration (100.0%), and Health Care & Social Assistance (82.8%).
| Industry | Male | Female |
| Agriculture, Fishing & Hunting | 19 (100.0%) | 0 (0.0%) |
| Mining, Quarrying, & Extraction | 6 (22.2%) | 21 (77.8%) |
| Construction | 3 (60.0%) | 2 (40.0%) |
| Manufacturing | 0 (0.0%) | 0 (0.0%) |
| Wholesale Trade | 0 (0.0%) | 0 (0.0%) |
| Retail Trade | 4 (25.0%) | 12 (75.0%) |
| Transportation & Warehousing | 1 (100.0%) | 0 (0.0%) |
| Utilities | 1 (100.0%) | 0 (0.0%) |
| Information | 0 (0.0%) | 0 (0.0%) |
| Finance & Insurance | 0 (0.0%) | 4 (100.0%) |
| Real Estate, Rental & Leasing | 0 (0.0%) | 0 (0.0%) |
| Professional & Scientific | 4 (57.1%) | 3 (42.9%) |
| Enterprise Management | 0 (0.0%) | 0 (0.0%) |
| Administrative & Support | 1 (100.0%) | 0 (0.0%) |
| Educational Services | 4 (20.0%) | 16 (80.0%) |
| Health Care & Social Assistance | 5 (17.2%) | 24 (82.8%) |
| Arts, Entertainment & Recreation | 0 (0.0%) | 0 (0.0%) |
| Accommodation & Food Services | 1 (50.0%) | 1 (50.0%) |
| Public Administration | 0 (0.0%) | 2 (100.0%) |
| Total | 58 (38.7%) | 92 (61.3%) |
Education in Nordheim
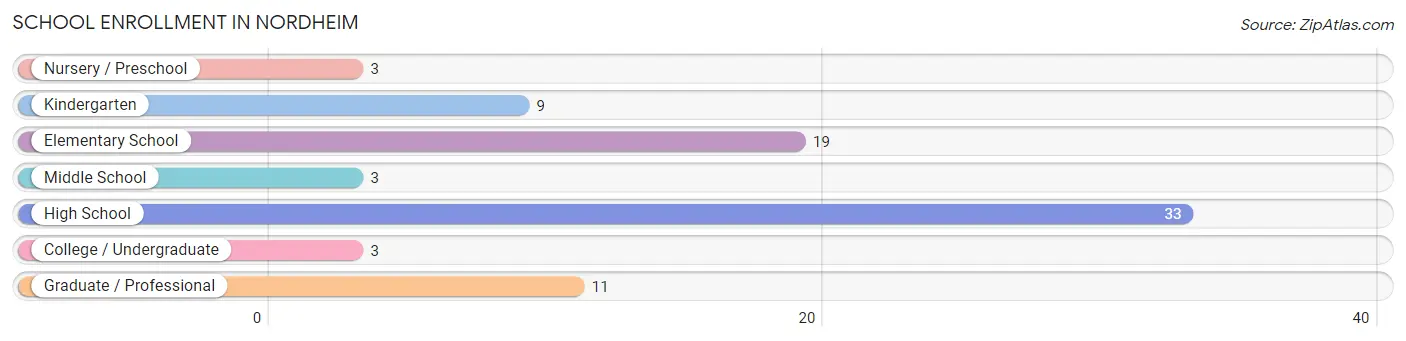
School Enrollment in Nordheim
The most common levels of schooling among the 81 students in Nordheim are high school (33 | 40.7%), elementary school (19 | 23.5%), and graduate / professional (11 | 13.6%).
| School Level | # Students | % Students |
| Nursery / Preschool | 3 | 3.7% |
| Kindergarten | 9 | 11.1% |
| Elementary School | 19 | 23.5% |
| Middle School | 3 | 3.7% |
| High School | 33 | 40.7% |
| College / Undergraduate | 3 | 3.7% |
| Graduate / Professional | 11 | 13.6% |
| Total | 81 | 100.0% |
School Enrollment by Age by Funding Source in Nordheim
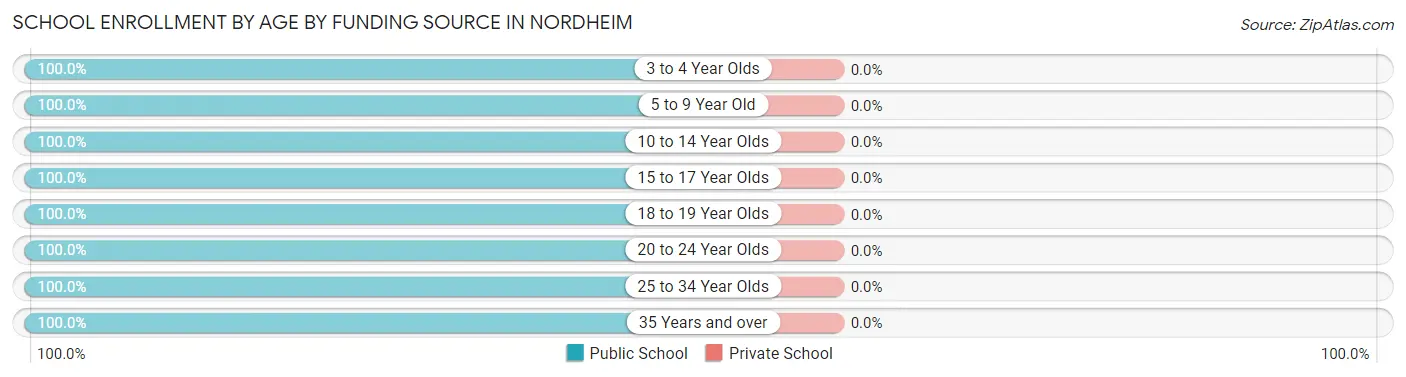
| Age Bracket | Public School | Private School |
| 3 to 4 Year Olds | 3 (100.0%) | 0 (0.0%) |
| 5 to 9 Year Old | 28 (100.0%) | 0 (0.0%) |
| 10 to 14 Year Olds | 5 (100.0%) | 0 (0.0%) |
| 15 to 17 Year Olds | 30 (100.0%) | 0 (0.0%) |
| 18 to 19 Year Olds | 2 (100.0%) | 0 (0.0%) |
| 20 to 24 Year Olds | 10 (100.0%) | 0 (0.0%) |
| 25 to 34 Year Olds | 1 (100.0%) | 0 (0.0%) |
| 35 Years and over | 2 (100.0%) | 0 (0.0%) |
| Total | 81 (100.0%) | 0 (0.0%) |
Educational Attainment by Field of Study in Nordheim
Education (19 | 44.2%), liberal arts & history (10 | 23.3%), science & technology (4 | 9.3%), bio, nature & agricultural (2 | 4.6%), and social sciences (2 | 4.6%) are the most common fields of study among 43 individuals in Nordheim who have obtained a bachelor's degree or higher.
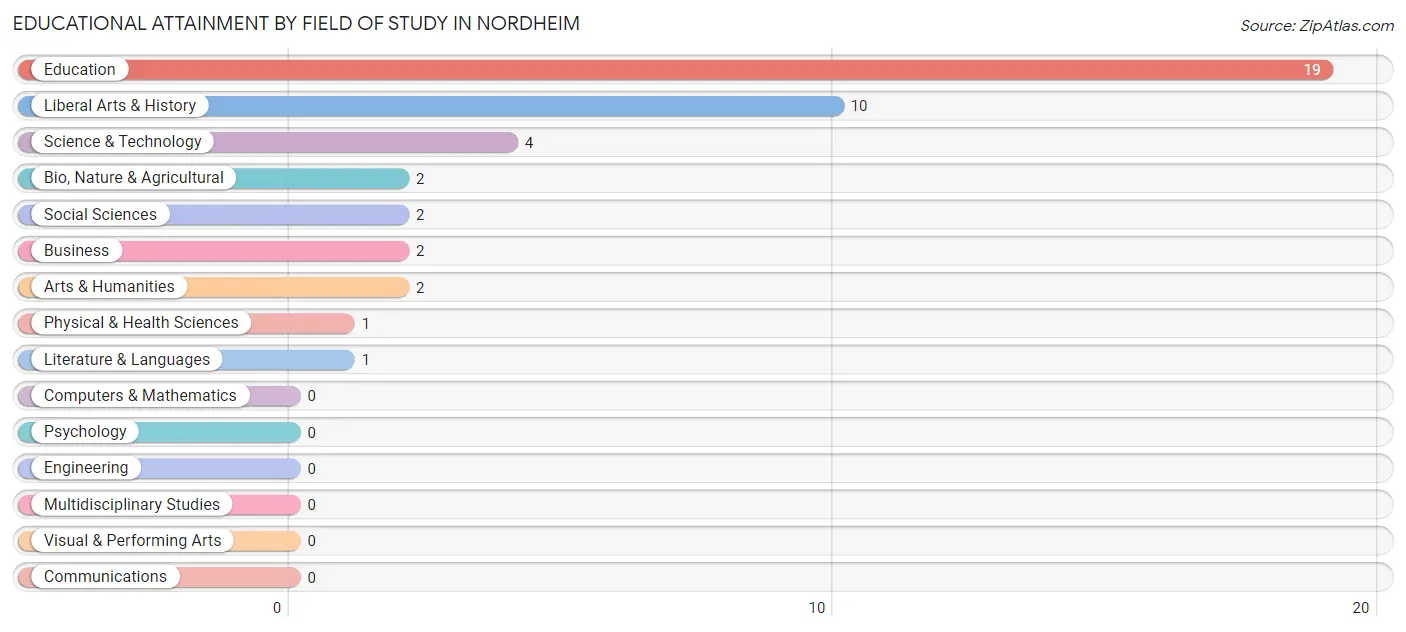
| Field of Study | # Graduates | % Graduates |
| Computers & Mathematics | 0 | 0.0% |
| Bio, Nature & Agricultural | 2 | 4.6% |
| Physical & Health Sciences | 1 | 2.3% |
| Psychology | 0 | 0.0% |
| Social Sciences | 2 | 4.6% |
| Engineering | 0 | 0.0% |
| Multidisciplinary Studies | 0 | 0.0% |
| Science & Technology | 4 | 9.3% |
| Business | 2 | 4.6% |
| Education | 19 | 44.2% |
| Literature & Languages | 1 | 2.3% |
| Liberal Arts & History | 10 | 23.3% |
| Visual & Performing Arts | 0 | 0.0% |
| Communications | 0 | 0.0% |
| Arts & Humanities | 2 | 4.6% |
| Total | 43 | 100.0% |
Transportation & Commute in Nordheim
Vehicle Availability by Sex in Nordheim
The most prevalent vehicle ownership categories in Nordheim are males with 2 vehicles (32, accounting for 55.2%) and females with 2 vehicles (32, making up 34.8%).
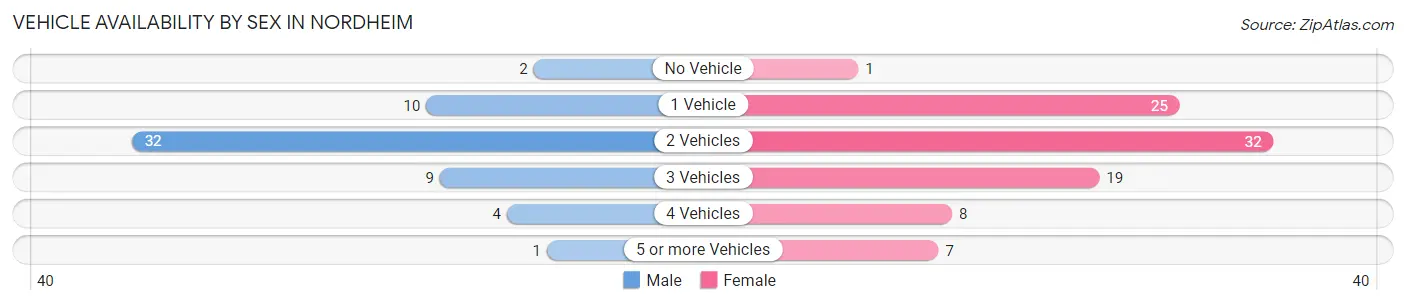
| Vehicles Available | Male | Female |
| No Vehicle | 2 (3.5%) | 1 (1.1%) |
| 1 Vehicle | 10 (17.2%) | 25 (27.2%) |
| 2 Vehicles | 32 (55.2%) | 32 (34.8%) |
| 3 Vehicles | 9 (15.5%) | 19 (20.6%) |
| 4 Vehicles | 4 (6.9%) | 8 (8.7%) |
| 5 or more Vehicles | 1 (1.7%) | 7 (7.6%) |
| Total | 58 (100.0%) | 92 (100.0%) |
Commute Time in Nordheim
The most frequently occuring commute durations in Nordheim are 90 or more minutes (31 commuters, 21.2%), less than 5 minutes (19 commuters, 13.0%), and 30 to 34 minutes (18 commuters, 12.3%).
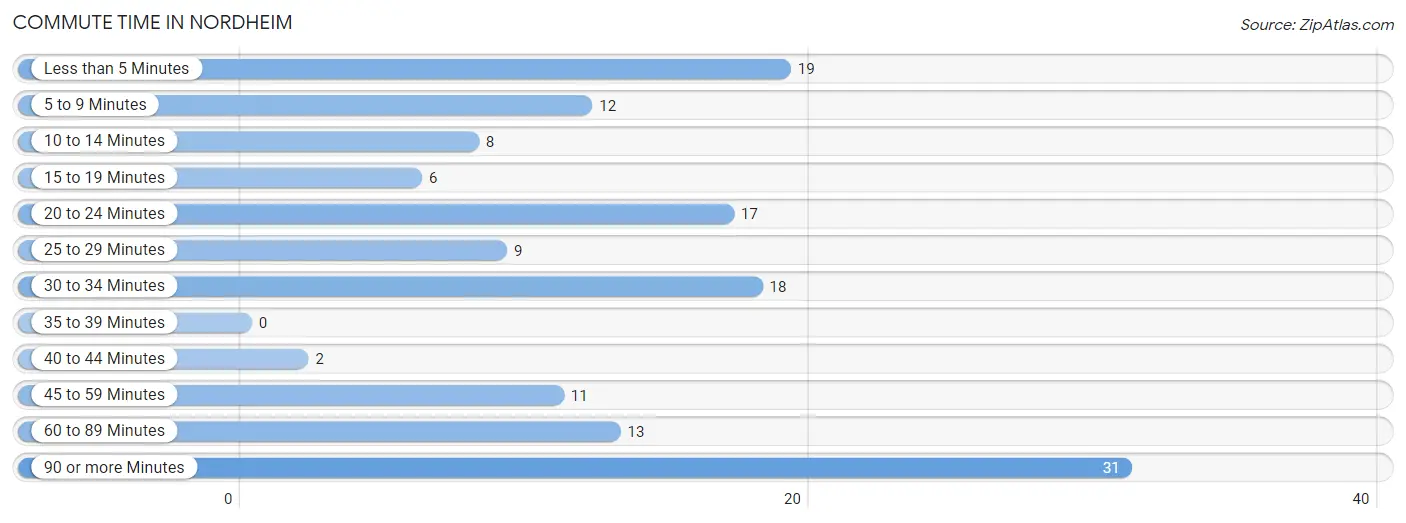
| Commute Time | # Commuters | % Commuters |
| Less than 5 Minutes | 19 | 13.0% |
| 5 to 9 Minutes | 12 | 8.2% |
| 10 to 14 Minutes | 8 | 5.5% |
| 15 to 19 Minutes | 6 | 4.1% |
| 20 to 24 Minutes | 17 | 11.6% |
| 25 to 29 Minutes | 9 | 6.2% |
| 30 to 34 Minutes | 18 | 12.3% |
| 35 to 39 Minutes | 0 | 0.0% |
| 40 to 44 Minutes | 2 | 1.4% |
| 45 to 59 Minutes | 11 | 7.5% |
| 60 to 89 Minutes | 13 | 8.9% |
| 90 or more Minutes | 31 | 21.2% |
Commute Time by Sex in Nordheim
The most common commute times in Nordheim are 90 or more minutes (25 commuters, 45.5%) for males and 20 to 24 minutes (17 commuters, 18.7%) for females.
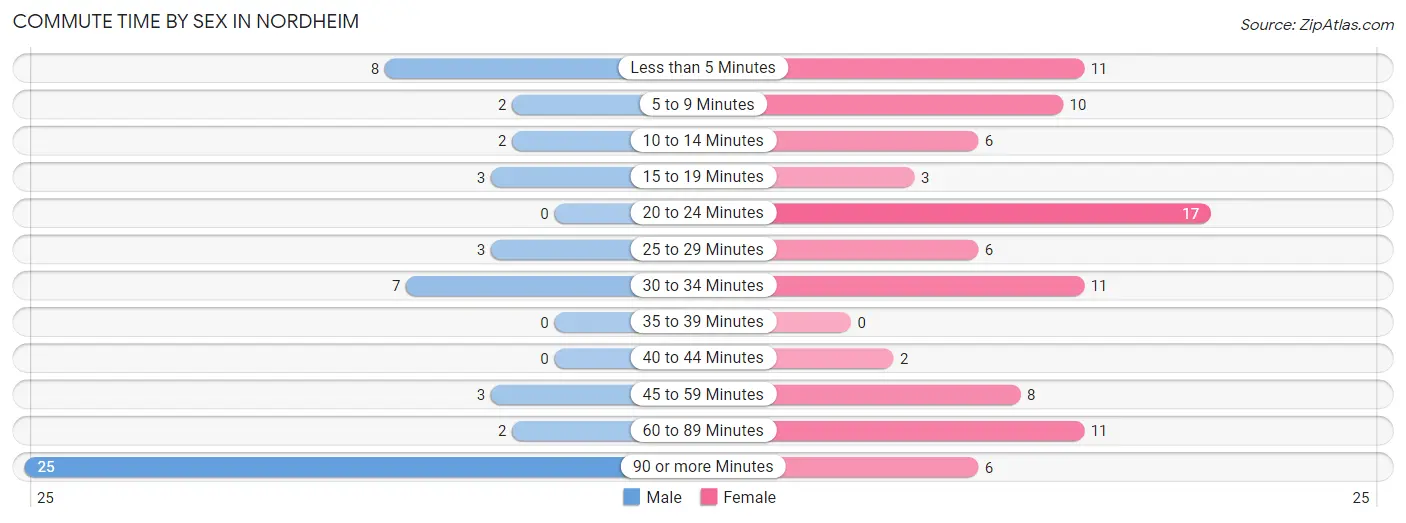
| Commute Time | Male | Female |
| Less than 5 Minutes | 8 (14.5%) | 11 (12.1%) |
| 5 to 9 Minutes | 2 (3.6%) | 10 (11.0%) |
| 10 to 14 Minutes | 2 (3.6%) | 6 (6.6%) |
| 15 to 19 Minutes | 3 (5.4%) | 3 (3.3%) |
| 20 to 24 Minutes | 0 (0.0%) | 17 (18.7%) |
| 25 to 29 Minutes | 3 (5.4%) | 6 (6.6%) |
| 30 to 34 Minutes | 7 (12.7%) | 11 (12.1%) |
| 35 to 39 Minutes | 0 (0.0%) | 0 (0.0%) |
| 40 to 44 Minutes | 0 (0.0%) | 2 (2.2%) |
| 45 to 59 Minutes | 3 (5.4%) | 8 (8.8%) |
| 60 to 89 Minutes | 2 (3.6%) | 11 (12.1%) |
| 90 or more Minutes | 25 (45.5%) | 6 (6.6%) |
Time of Departure to Work by Sex in Nordheim
The most frequent times of departure to work in Nordheim are 5:00 AM to 5:29 AM (21, 38.2%) for males and 7:30 AM to 7:59 AM (32, 35.2%) for females.
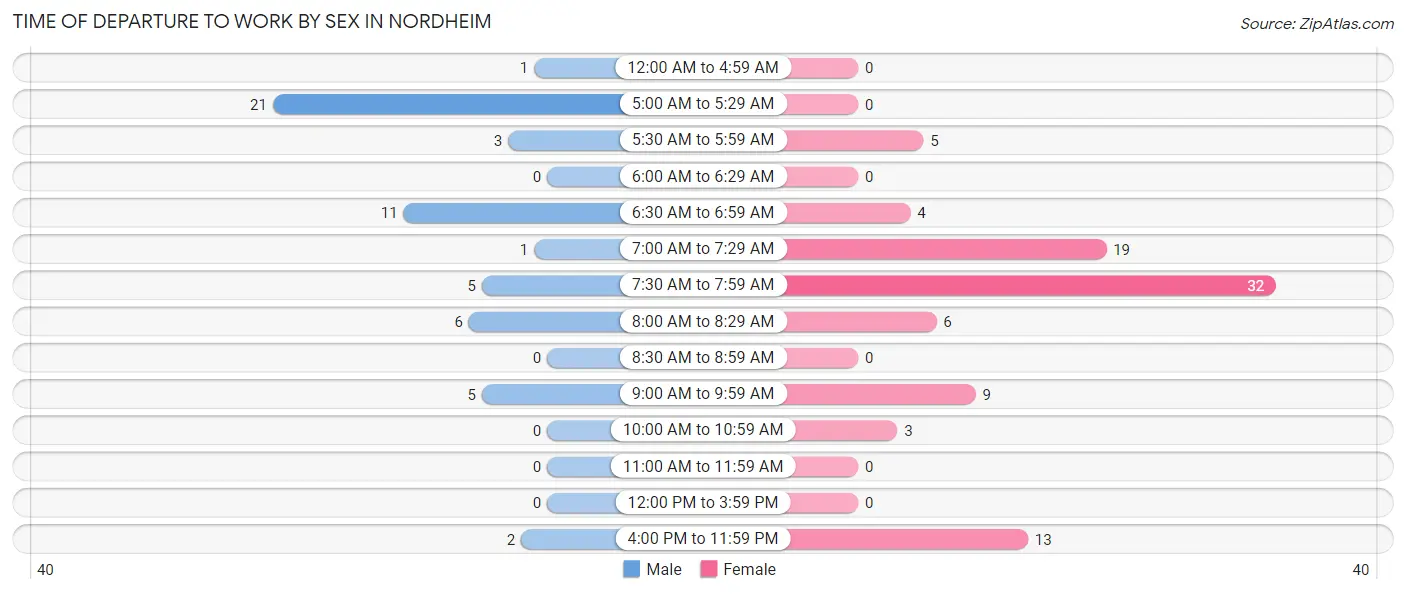
| Time of Departure | Male | Female |
| 12:00 AM to 4:59 AM | 1 (1.8%) | 0 (0.0%) |
| 5:00 AM to 5:29 AM | 21 (38.2%) | 0 (0.0%) |
| 5:30 AM to 5:59 AM | 3 (5.4%) | 5 (5.5%) |
| 6:00 AM to 6:29 AM | 0 (0.0%) | 0 (0.0%) |
| 6:30 AM to 6:59 AM | 11 (20.0%) | 4 (4.4%) |
| 7:00 AM to 7:29 AM | 1 (1.8%) | 19 (20.9%) |
| 7:30 AM to 7:59 AM | 5 (9.1%) | 32 (35.2%) |
| 8:00 AM to 8:29 AM | 6 (10.9%) | 6 (6.6%) |
| 8:30 AM to 8:59 AM | 0 (0.0%) | 0 (0.0%) |
| 9:00 AM to 9:59 AM | 5 (9.1%) | 9 (9.9%) |
| 10:00 AM to 10:59 AM | 0 (0.0%) | 3 (3.3%) |
| 11:00 AM to 11:59 AM | 0 (0.0%) | 0 (0.0%) |
| 12:00 PM to 3:59 PM | 0 (0.0%) | 0 (0.0%) |
| 4:00 PM to 11:59 PM | 2 (3.6%) | 13 (14.3%) |
| Total | 55 (100.0%) | 91 (100.0%) |
Housing Occupancy in Nordheim
Occupancy by Ownership in Nordheim
Of the total 216 dwellings in Nordheim, owner-occupied units account for 176 (81.5%), while renter-occupied units make up 40 (18.5%).
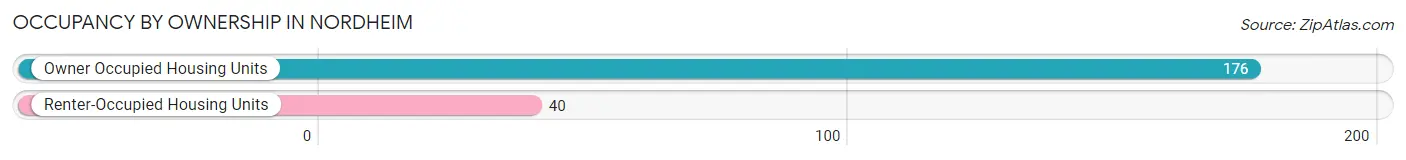
| Occupancy | # Housing Units | % Housing Units |
| Owner Occupied Housing Units | 176 | 81.5% |
| Renter-Occupied Housing Units | 40 | 18.5% |
| Total Occupied Housing Units | 216 | 100.0% |
Occupancy by Household Size in Nordheim
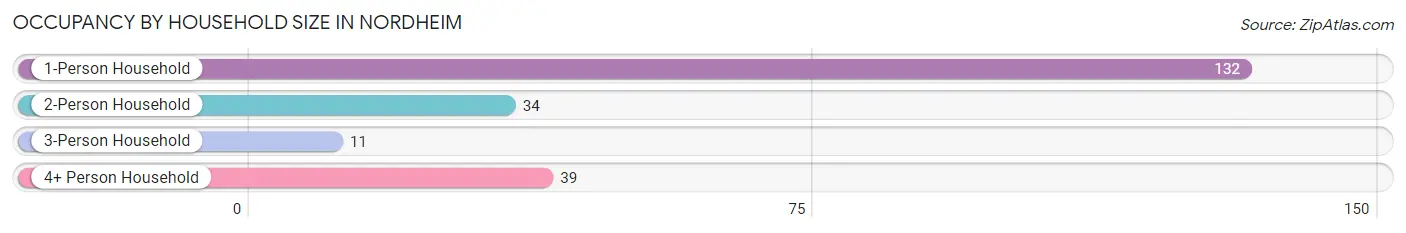
| Household Size | # Housing Units | % Housing Units |
| 1-Person Household | 132 | 61.1% |
| 2-Person Household | 34 | 15.7% |
| 3-Person Household | 11 | 5.1% |
| 4+ Person Household | 39 | 18.1% |
| Total Housing Units | 216 | 100.0% |
Occupancy by Ownership by Household Size in Nordheim
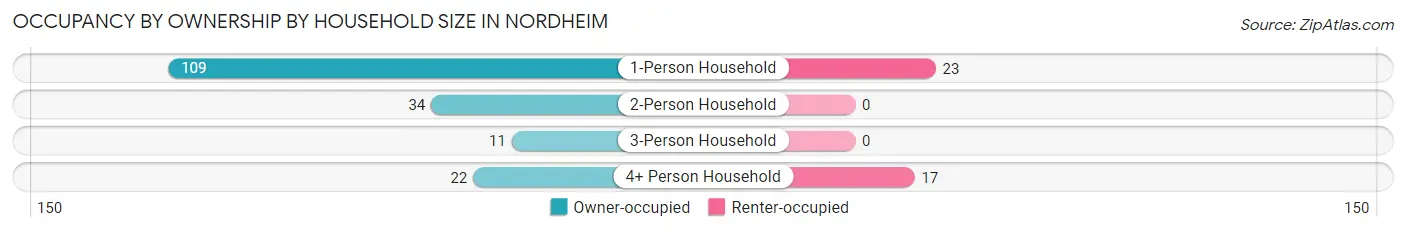
| Household Size | Owner-occupied | Renter-occupied |
| 1-Person Household | 109 (82.6%) | 23 (17.4%) |
| 2-Person Household | 34 (100.0%) | 0 (0.0%) |
| 3-Person Household | 11 (100.0%) | 0 (0.0%) |
| 4+ Person Household | 22 (56.4%) | 17 (43.6%) |
| Total Housing Units | 176 (81.5%) | 40 (18.5%) |
Occupancy by Educational Attainment in Nordheim
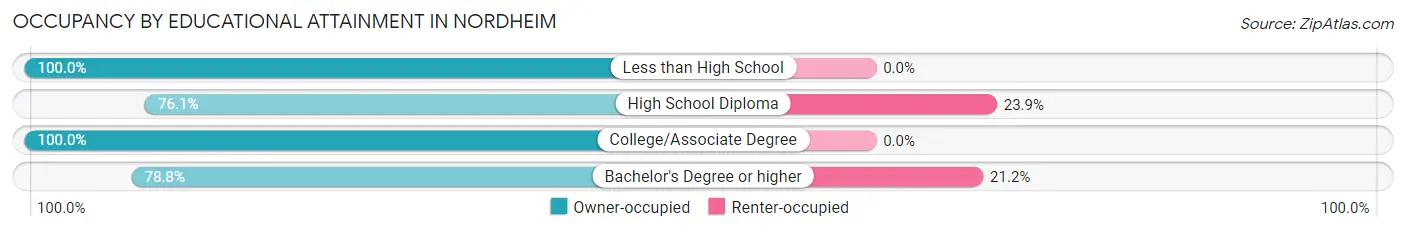
| Household Size | Owner-occupied | Renter-occupied |
| Less than High School | 12 (100.0%) | 0 (0.0%) |
| High School Diploma | 105 (76.1%) | 33 (23.9%) |
| College/Associate Degree | 33 (100.0%) | 0 (0.0%) |
| Bachelor's Degree or higher | 26 (78.8%) | 7 (21.2%) |
Occupancy by Age of Householder in Nordheim
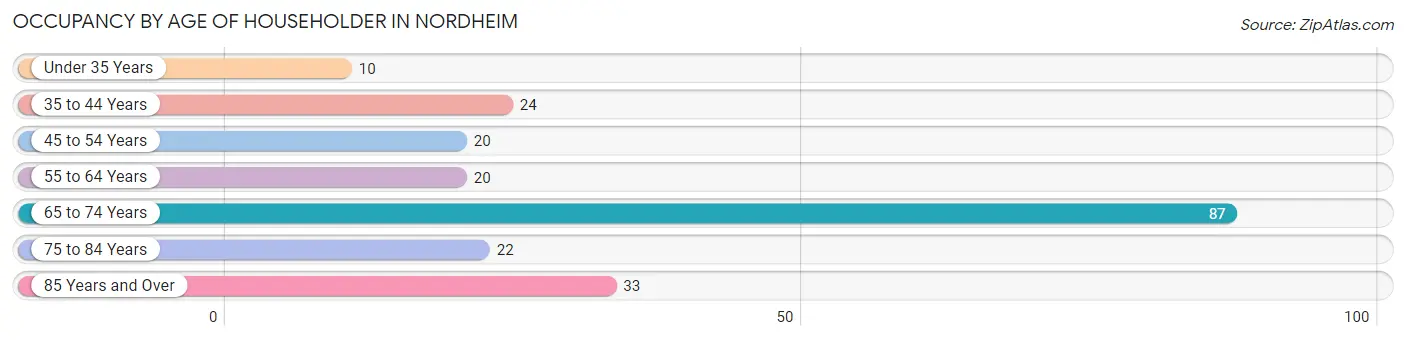
| Age Bracket | # Households | % Households |
| Under 35 Years | 10 | 4.6% |
| 35 to 44 Years | 24 | 11.1% |
| 45 to 54 Years | 20 | 9.3% |
| 55 to 64 Years | 20 | 9.3% |
| 65 to 74 Years | 87 | 40.3% |
| 75 to 84 Years | 22 | 10.2% |
| 85 Years and Over | 33 | 15.3% |
| Total | 216 | 100.0% |
Housing Finances in Nordheim
Median Income by Occupancy in Nordheim
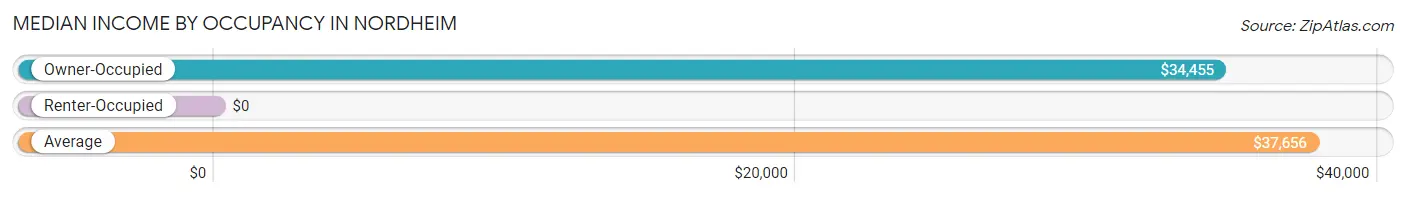
| Occupancy Type | # Households | Median Income |
| Owner-Occupied | 176 (81.5%) | $34,455 |
| Renter-Occupied | 40 (18.5%) | $0 |
| Average | 216 (100.0%) | $37,656 |
Occupancy by Householder Income Bracket in Nordheim
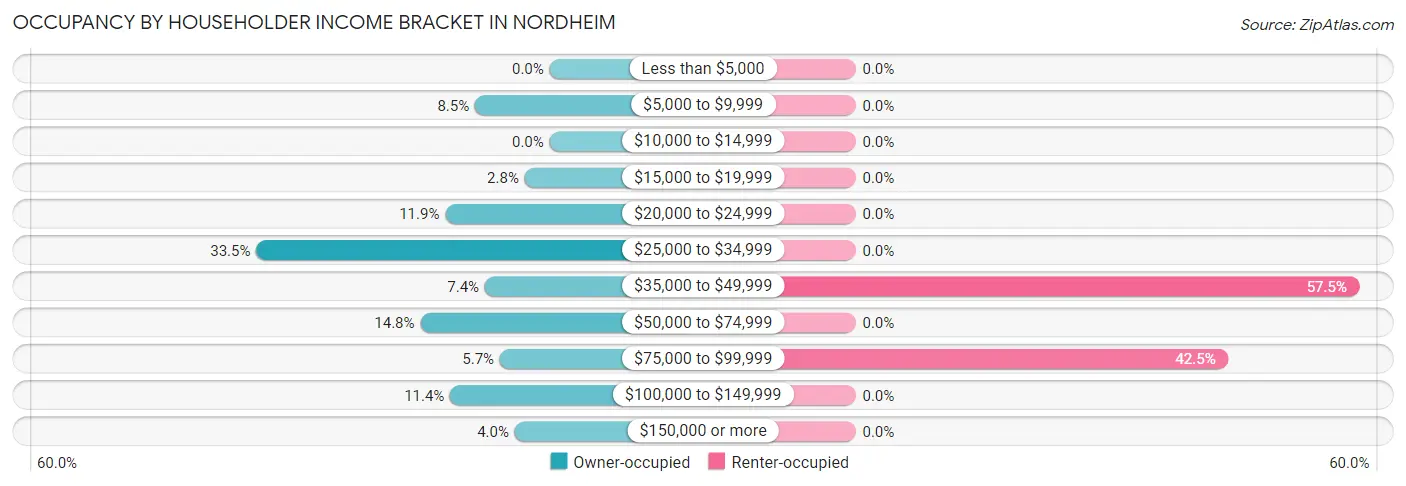
| Income Bracket | Owner-occupied | Renter-occupied |
| Less than $5,000 | 0 (0.0%) | 0 (0.0%) |
| $5,000 to $9,999 | 15 (8.5%) | 0 (0.0%) |
| $10,000 to $14,999 | 0 (0.0%) | 0 (0.0%) |
| $15,000 to $19,999 | 5 (2.8%) | 0 (0.0%) |
| $20,000 to $24,999 | 21 (11.9%) | 0 (0.0%) |
| $25,000 to $34,999 | 59 (33.5%) | 0 (0.0%) |
| $35,000 to $49,999 | 13 (7.4%) | 23 (57.5%) |
| $50,000 to $74,999 | 26 (14.8%) | 0 (0.0%) |
| $75,000 to $99,999 | 10 (5.7%) | 17 (42.5%) |
| $100,000 to $149,999 | 20 (11.4%) | 0 (0.0%) |
| $150,000 or more | 7 (4.0%) | 0 (0.0%) |
| Total | 176 (100.0%) | 40 (100.0%) |
Monthly Housing Cost Tiers in Nordheim
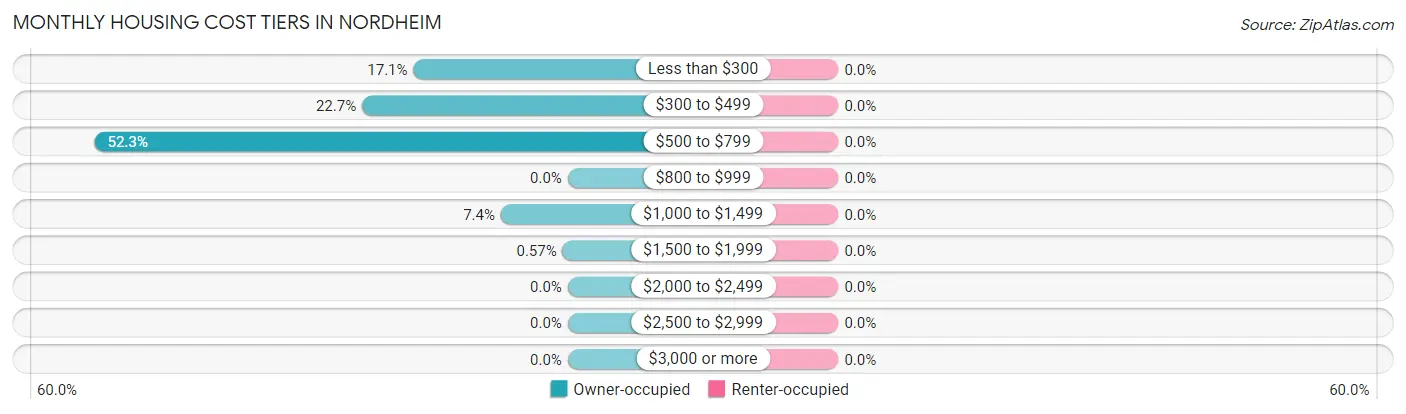
| Monthly Cost | Owner-occupied | Renter-occupied |
| Less than $300 | 30 (17.1%) | 0 (0.0%) |
| $300 to $499 | 40 (22.7%) | 0 (0.0%) |
| $500 to $799 | 92 (52.3%) | 0 (0.0%) |
| $800 to $999 | 0 (0.0%) | 0 (0.0%) |
| $1,000 to $1,499 | 13 (7.4%) | 0 (0.0%) |
| $1,500 to $1,999 | 1 (0.6%) | 0 (0.0%) |
| $2,000 to $2,499 | 0 (0.0%) | 0 (0.0%) |
| $2,500 to $2,999 | 0 (0.0%) | 0 (0.0%) |
| $3,000 or more | 0 (0.0%) | 0 (0.0%) |
| Total | 176 (100.0%) | 40 (100.0%) |
Physical Housing Characteristics in Nordheim
Housing Structures in Nordheim
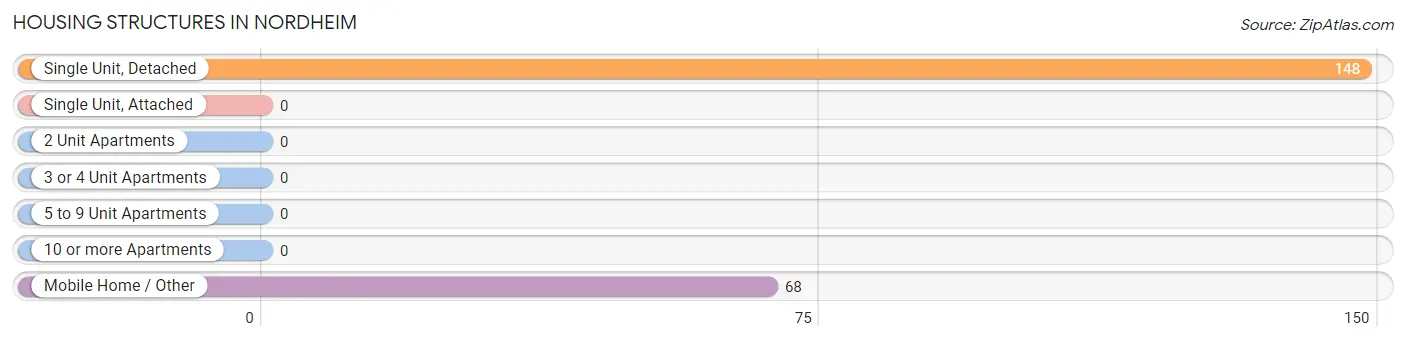
| Structure Type | # Housing Units | % Housing Units |
| Single Unit, Detached | 148 | 68.5% |
| Single Unit, Attached | 0 | 0.0% |
| 2 Unit Apartments | 0 | 0.0% |
| 3 or 4 Unit Apartments | 0 | 0.0% |
| 5 to 9 Unit Apartments | 0 | 0.0% |
| 10 or more Apartments | 0 | 0.0% |
| Mobile Home / Other | 68 | 31.5% |
| Total | 216 | 100.0% |
Housing Structures by Occupancy in Nordheim
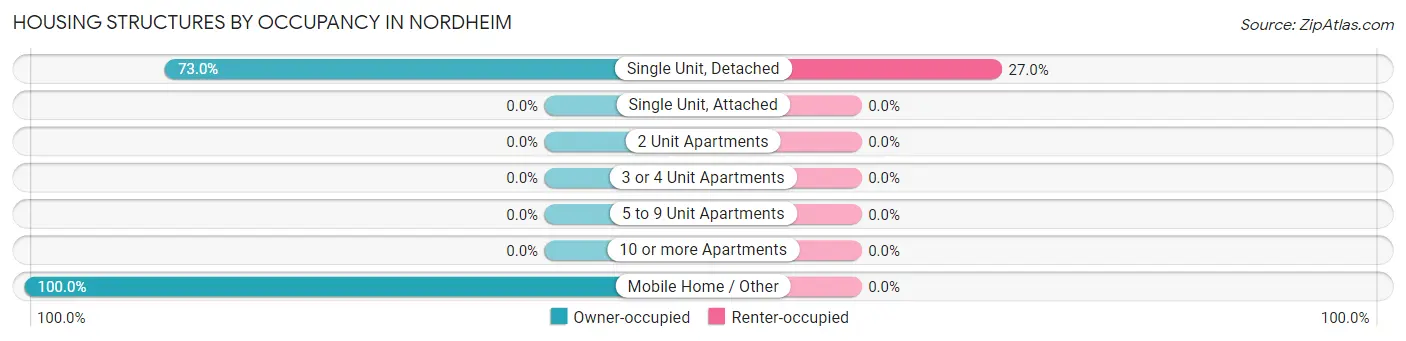
| Structure Type | Owner-occupied | Renter-occupied |
| Single Unit, Detached | 108 (73.0%) | 40 (27.0%) |
| Single Unit, Attached | 0 (0.0%) | 0 (0.0%) |
| 2 Unit Apartments | 0 (0.0%) | 0 (0.0%) |
| 3 or 4 Unit Apartments | 0 (0.0%) | 0 (0.0%) |
| 5 to 9 Unit Apartments | 0 (0.0%) | 0 (0.0%) |
| 10 or more Apartments | 0 (0.0%) | 0 (0.0%) |
| Mobile Home / Other | 68 (100.0%) | 0 (0.0%) |
| Total | 176 (81.5%) | 40 (18.5%) |
Housing Structures by Number of Rooms in Nordheim
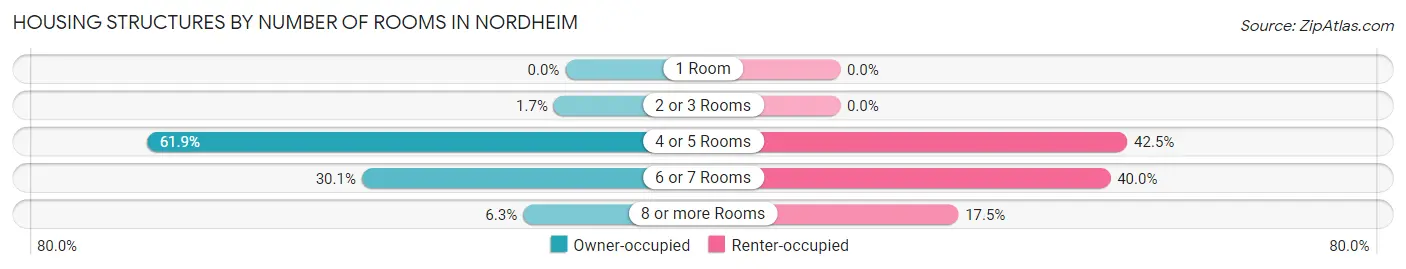
| Number of Rooms | Owner-occupied | Renter-occupied |
| 1 Room | 0 (0.0%) | 0 (0.0%) |
| 2 or 3 Rooms | 3 (1.7%) | 0 (0.0%) |
| 4 or 5 Rooms | 109 (61.9%) | 17 (42.5%) |
| 6 or 7 Rooms | 53 (30.1%) | 16 (40.0%) |
| 8 or more Rooms | 11 (6.2%) | 7 (17.5%) |
| Total | 176 (100.0%) | 40 (100.0%) |
Housing Structure by Heating Type in Nordheim
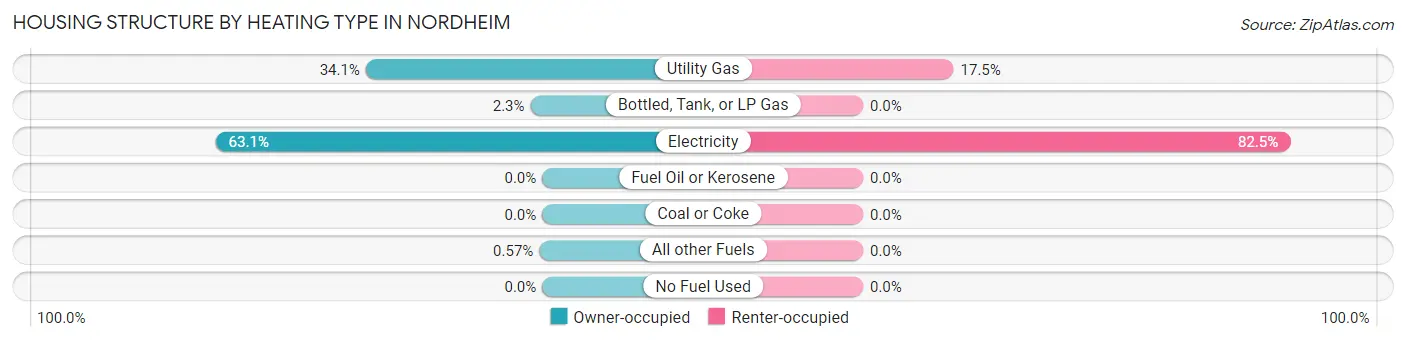
| Heating Type | Owner-occupied | Renter-occupied |
| Utility Gas | 60 (34.1%) | 7 (17.5%) |
| Bottled, Tank, or LP Gas | 4 (2.3%) | 0 (0.0%) |
| Electricity | 111 (63.1%) | 33 (82.5%) |
| Fuel Oil or Kerosene | 0 (0.0%) | 0 (0.0%) |
| Coal or Coke | 0 (0.0%) | 0 (0.0%) |
| All other Fuels | 1 (0.6%) | 0 (0.0%) |
| No Fuel Used | 0 (0.0%) | 0 (0.0%) |
| Total | 176 (100.0%) | 40 (100.0%) |
Household Vehicle Usage in Nordheim
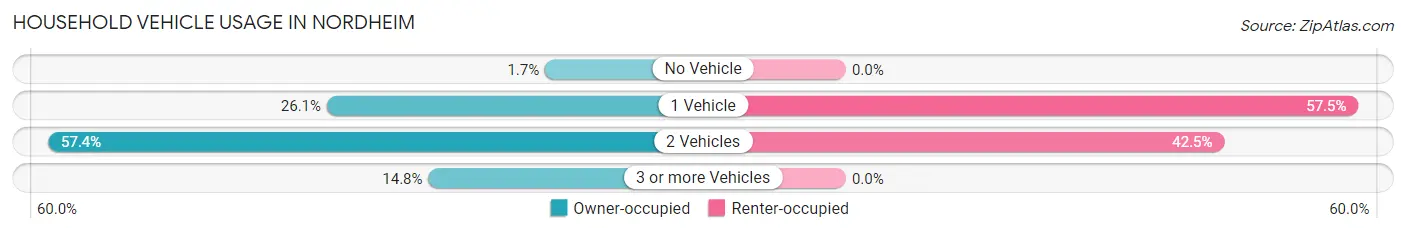
| Vehicles per Household | Owner-occupied | Renter-occupied |
| No Vehicle | 3 (1.7%) | 0 (0.0%) |
| 1 Vehicle | 46 (26.1%) | 23 (57.5%) |
| 2 Vehicles | 101 (57.4%) | 17 (42.5%) |
| 3 or more Vehicles | 26 (14.8%) | 0 (0.0%) |
| Total | 176 (100.0%) | 40 (100.0%) |
Real Estate & Mortgages in Nordheim
Real Estate and Mortgage Overview in Nordheim
| Characteristic | Without Mortgage | With Mortgage |
| Housing Units | 159 | 17 |
| Median Property Value | $52,300 | $128,100 |
| Median Household Income | $34,068 | $0 |
| Monthly Housing Costs | $563 | $0 |
| Real Estate Taxes | - | - |
Property Value by Mortgage Status in Nordheim
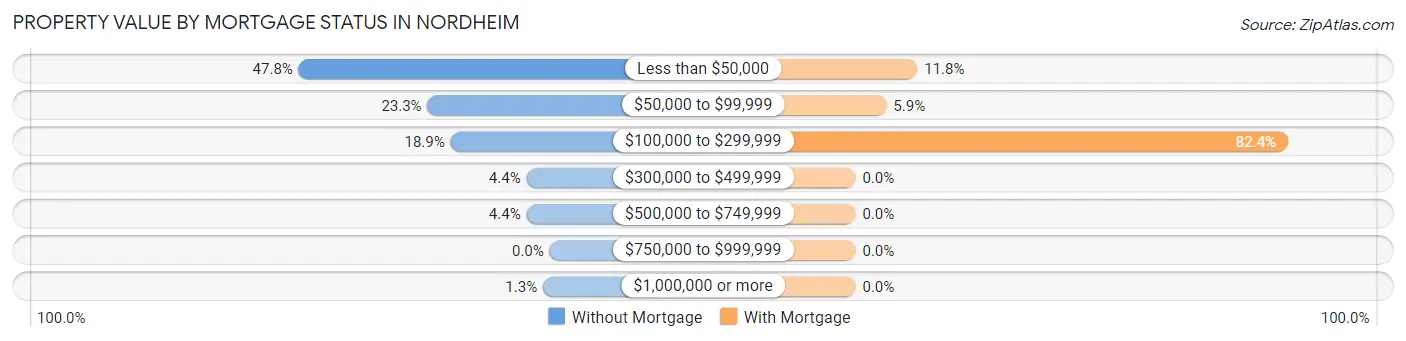
| Property Value | Without Mortgage | With Mortgage |
| Less than $50,000 | 76 (47.8%) | 2 (11.8%) |
| $50,000 to $99,999 | 37 (23.3%) | 1 (5.9%) |
| $100,000 to $299,999 | 30 (18.9%) | 14 (82.4%) |
| $300,000 to $499,999 | 7 (4.4%) | 0 (0.0%) |
| $500,000 to $749,999 | 7 (4.4%) | 0 (0.0%) |
| $750,000 to $999,999 | 0 (0.0%) | 0 (0.0%) |
| $1,000,000 or more | 2 (1.3%) | 0 (0.0%) |
| Total | 159 (100.0%) | 17 (100.0%) |
Household Income by Mortgage Status in Nordheim
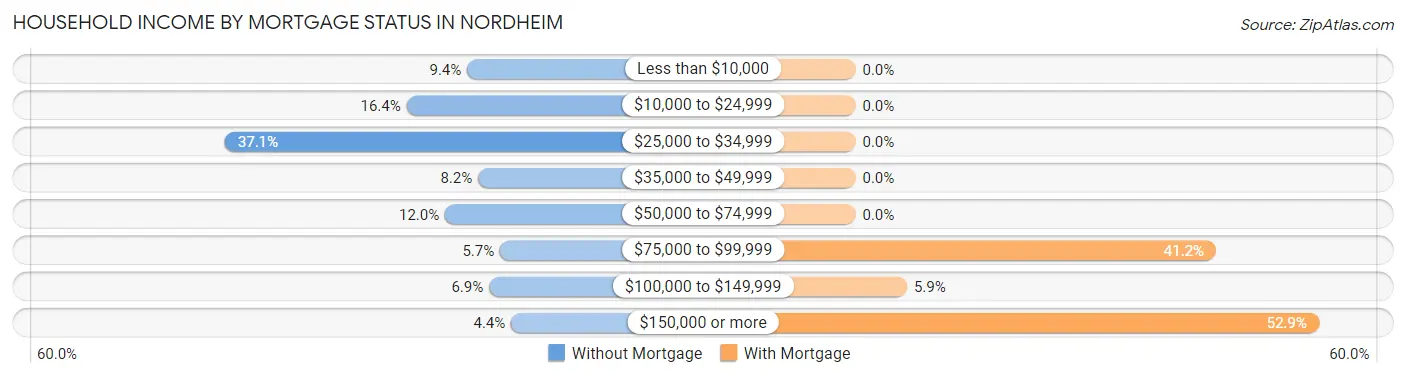
| Household Income | Without Mortgage | With Mortgage |
| Less than $10,000 | 15 (9.4%) | 0 (0.0%) |
| $10,000 to $24,999 | 26 (16.4%) | 0 (0.0%) |
| $25,000 to $34,999 | 59 (37.1%) | 0 (0.0%) |
| $35,000 to $49,999 | 13 (8.2%) | 0 (0.0%) |
| $50,000 to $74,999 | 19 (11.9%) | 0 (0.0%) |
| $75,000 to $99,999 | 9 (5.7%) | 7 (41.2%) |
| $100,000 to $149,999 | 11 (6.9%) | 1 (5.9%) |
| $150,000 or more | 7 (4.4%) | 9 (52.9%) |
| Total | 159 (100.0%) | 17 (100.0%) |
Property Value to Household Income Ratio in Nordheim
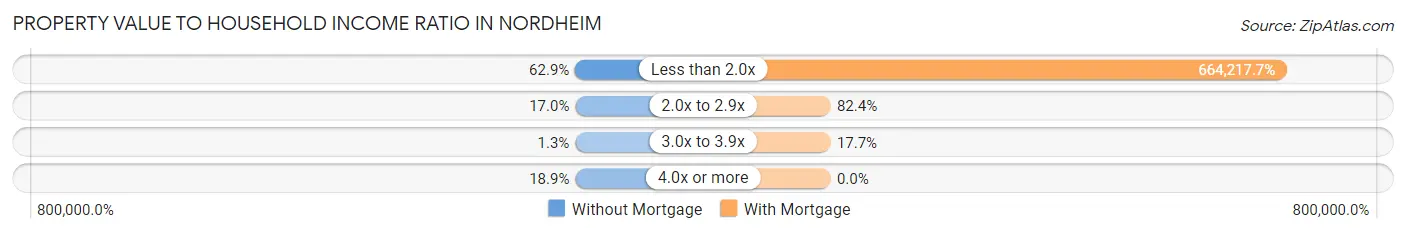
| Value-to-Income Ratio | Without Mortgage | With Mortgage |
| Less than 2.0x | 100 (62.9%) | 112,917 (664,217.6%) |
| 2.0x to 2.9x | 27 (17.0%) | 14 (82.4%) |
| 3.0x to 3.9x | 2 (1.3%) | 3 (17.6%) |
| 4.0x or more | 30 (18.9%) | 0 (0.0%) |
| Total | 159 (100.0%) | 17 (100.0%) |
Real Estate Taxes by Mortgage Status in Nordheim
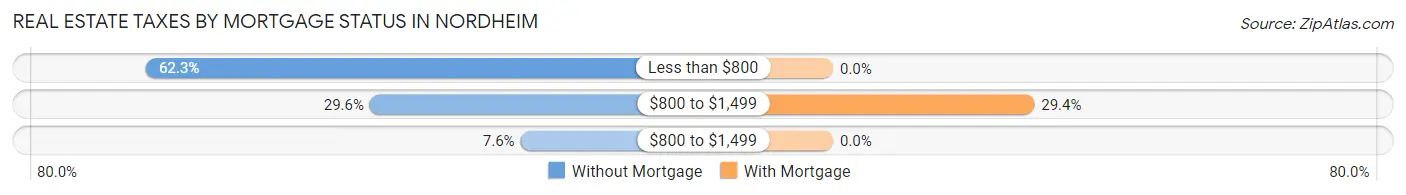
| Property Taxes | Without Mortgage | With Mortgage |
| Less than $800 | 99 (62.3%) | 0 (0.0%) |
| $800 to $1,499 | 47 (29.6%) | 5 (29.4%) |
| $800 to $1,499 | 12 (7.5%) | 0 (0.0%) |
| Total | 159 (100.0%) | 17 (100.0%) |
Health & Disability in Nordheim
Health Insurance Coverage by Age in Nordheim
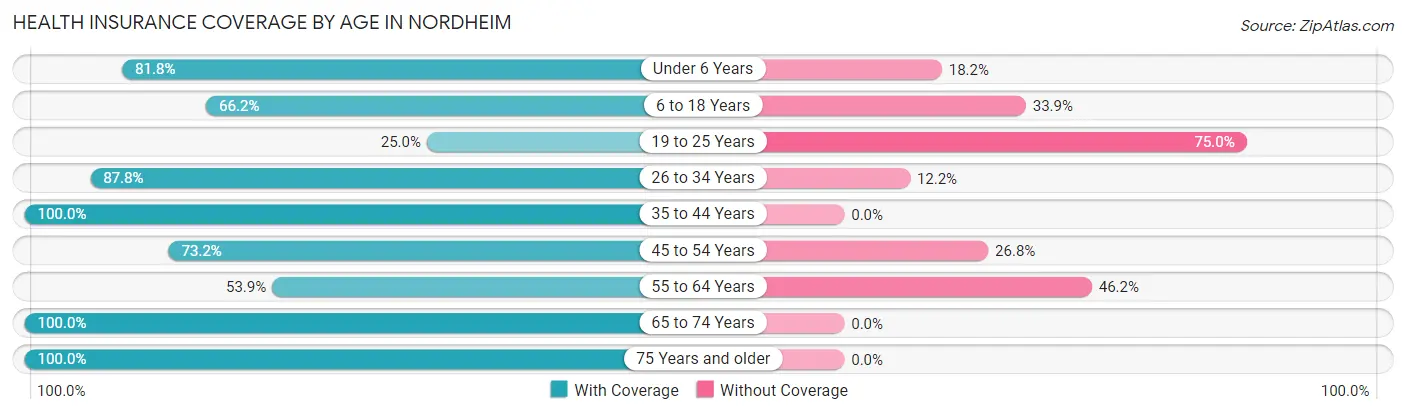
| Age Bracket | With Coverage | Without Coverage |
| Under 6 Years | 9 (81.8%) | 2 (18.2%) |
| 6 to 18 Years | 43 (66.1%) | 22 (33.9%) |
| 19 to 25 Years | 4 (25.0%) | 12 (75.0%) |
| 26 to 34 Years | 43 (87.8%) | 6 (12.2%) |
| 35 to 44 Years | 36 (100.0%) | 0 (0.0%) |
| 45 to 54 Years | 30 (73.2%) | 11 (26.8%) |
| 55 to 64 Years | 28 (53.8%) | 24 (46.2%) |
| 65 to 74 Years | 102 (100.0%) | 0 (0.0%) |
| 75 Years and older | 70 (100.0%) | 0 (0.0%) |
| Total | 365 (82.6%) | 77 (17.4%) |
Health Insurance Coverage by Citizenship Status in Nordheim
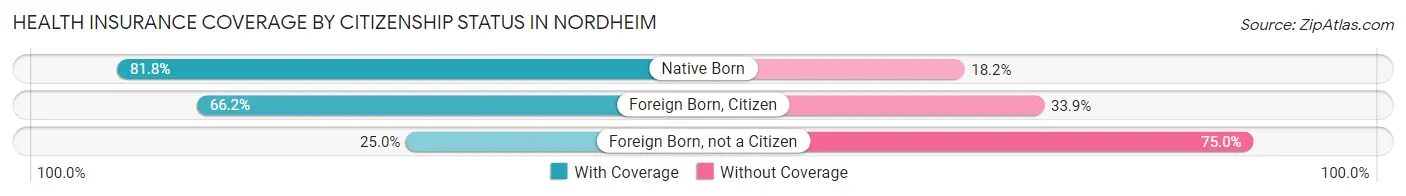
| Citizenship Status | With Coverage | Without Coverage |
| Native Born | 9 (81.8%) | 2 (18.2%) |
| Foreign Born, Citizen | 43 (66.1%) | 22 (33.9%) |
| Foreign Born, not a Citizen | 4 (25.0%) | 12 (75.0%) |
Health Insurance Coverage by Household Income in Nordheim
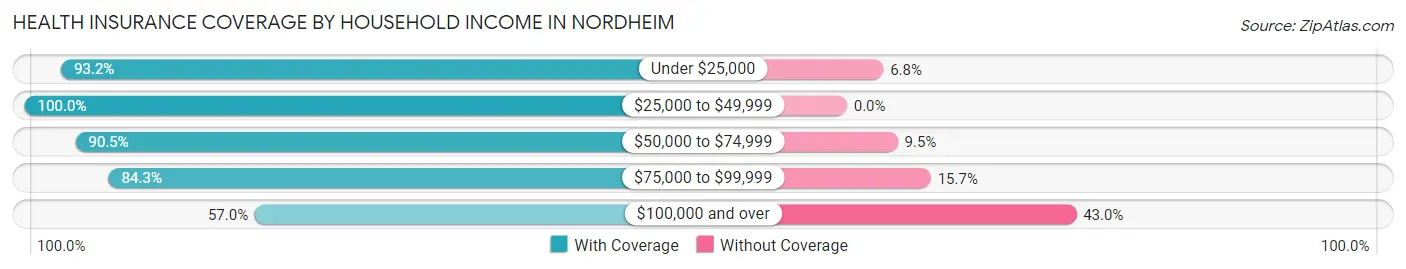
| Household Income | With Coverage | Without Coverage |
| Under $25,000 | 41 (93.2%) | 3 (6.8%) |
| $25,000 to $49,999 | 104 (100.0%) | 0 (0.0%) |
| $50,000 to $74,999 | 76 (90.5%) | 8 (9.5%) |
| $75,000 to $99,999 | 75 (84.3%) | 14 (15.7%) |
| $100,000 and over | 69 (57.0%) | 52 (43.0%) |
Public vs Private Health Insurance Coverage by Age in Nordheim
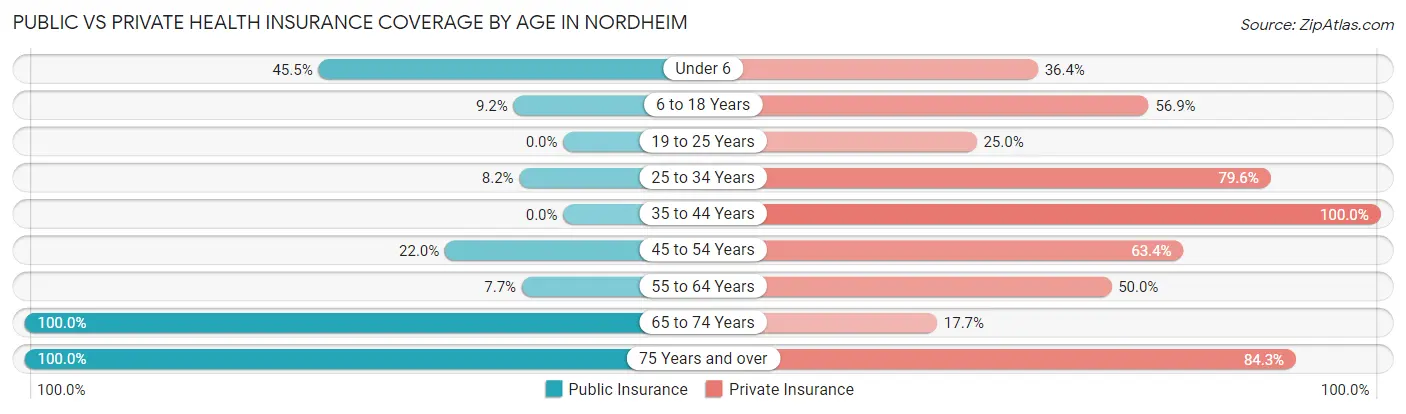
| Age Bracket | Public Insurance | Private Insurance |
| Under 6 | 5 (45.5%) | 4 (36.4%) |
| 6 to 18 Years | 6 (9.2%) | 37 (56.9%) |
| 19 to 25 Years | 0 (0.0%) | 4 (25.0%) |
| 25 to 34 Years | 4 (8.2%) | 39 (79.6%) |
| 35 to 44 Years | 0 (0.0%) | 36 (100.0%) |
| 45 to 54 Years | 9 (22.0%) | 26 (63.4%) |
| 55 to 64 Years | 4 (7.7%) | 26 (50.0%) |
| 65 to 74 Years | 102 (100.0%) | 18 (17.6%) |
| 75 Years and over | 70 (100.0%) | 59 (84.3%) |
| Total | 200 (45.3%) | 249 (56.3%) |
Disability Status by Sex by Age in Nordheim
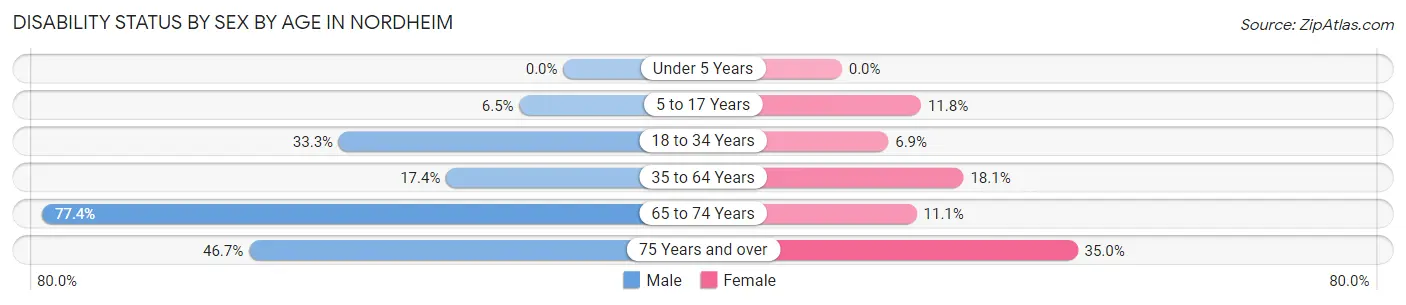
| Age Bracket | Male | Female |
| Under 5 Years | 0 (0.0%) | 0 (0.0%) |
| 5 to 17 Years | 3 (6.5%) | 2 (11.8%) |
| 18 to 34 Years | 3 (33.3%) | 4 (6.9%) |
| 35 to 64 Years | 8 (17.4%) | 15 (18.1%) |
| 65 to 74 Years | 72 (77.4%) | 1 (11.1%) |
| 75 Years and over | 14 (46.7%) | 14 (35.0%) |
Disability Class by Sex by Age in Nordheim
Disability Class: Hearing Difficulty
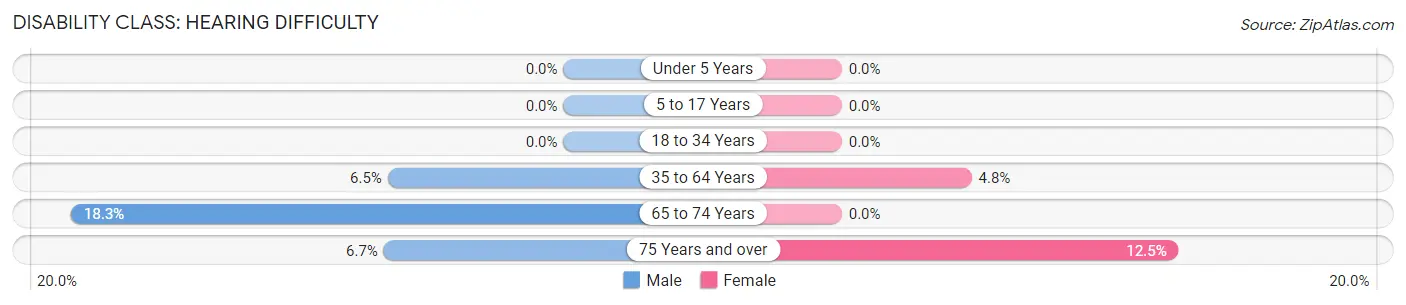
| Age Bracket | Male | Female |
| Under 5 Years | 0 (0.0%) | 0 (0.0%) |
| 5 to 17 Years | 0 (0.0%) | 0 (0.0%) |
| 18 to 34 Years | 0 (0.0%) | 0 (0.0%) |
| 35 to 64 Years | 3 (6.5%) | 4 (4.8%) |
| 65 to 74 Years | 17 (18.3%) | 0 (0.0%) |
| 75 Years and over | 2 (6.7%) | 5 (12.5%) |
Disability Class: Vision Difficulty
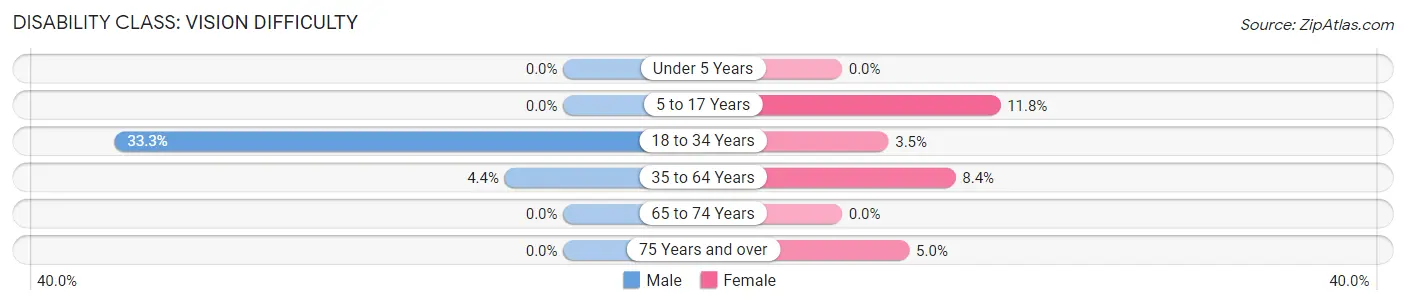
| Age Bracket | Male | Female |
| Under 5 Years | 0 (0.0%) | 0 (0.0%) |
| 5 to 17 Years | 0 (0.0%) | 2 (11.8%) |
| 18 to 34 Years | 3 (33.3%) | 2 (3.5%) |
| 35 to 64 Years | 2 (4.3%) | 7 (8.4%) |
| 65 to 74 Years | 0 (0.0%) | 0 (0.0%) |
| 75 Years and over | 0 (0.0%) | 2 (5.0%) |
Disability Class: Cognitive Difficulty
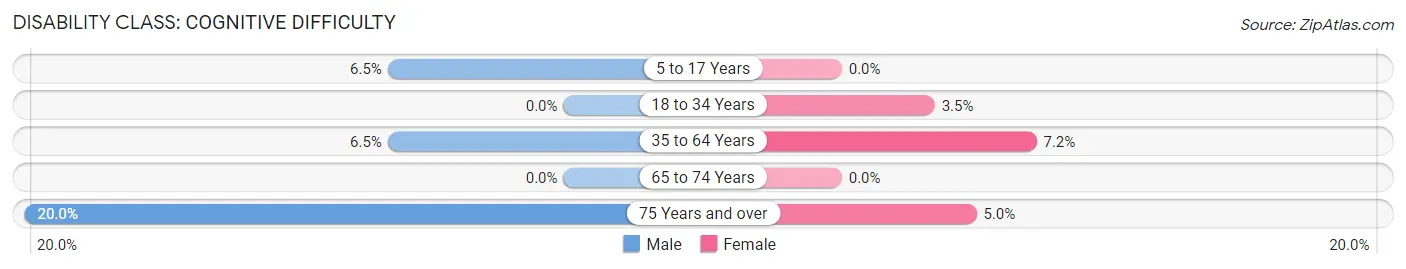
| Age Bracket | Male | Female |
| 5 to 17 Years | 3 (6.5%) | 0 (0.0%) |
| 18 to 34 Years | 0 (0.0%) | 2 (3.5%) |
| 35 to 64 Years | 3 (6.5%) | 6 (7.2%) |
| 65 to 74 Years | 0 (0.0%) | 0 (0.0%) |
| 75 Years and over | 6 (20.0%) | 2 (5.0%) |
Disability Class: Ambulatory Difficulty
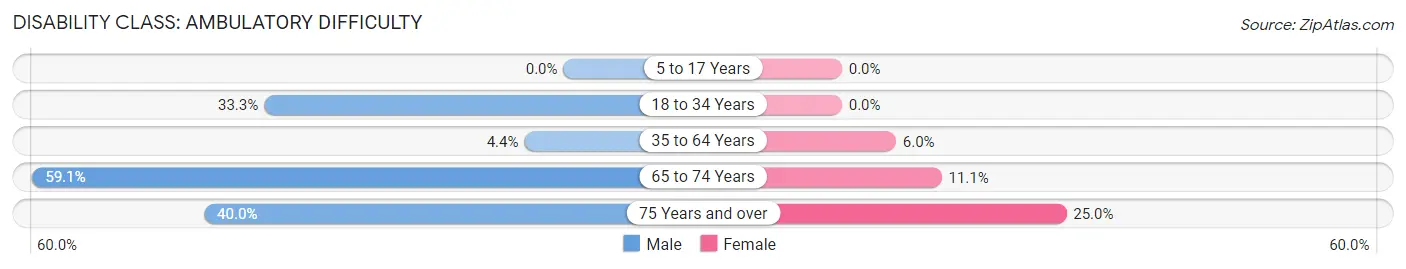
| Age Bracket | Male | Female |
| 5 to 17 Years | 0 (0.0%) | 0 (0.0%) |
| 18 to 34 Years | 3 (33.3%) | 0 (0.0%) |
| 35 to 64 Years | 2 (4.3%) | 5 (6.0%) |
| 65 to 74 Years | 55 (59.1%) | 1 (11.1%) |
| 75 Years and over | 12 (40.0%) | 10 (25.0%) |
Disability Class: Self-Care Difficulty
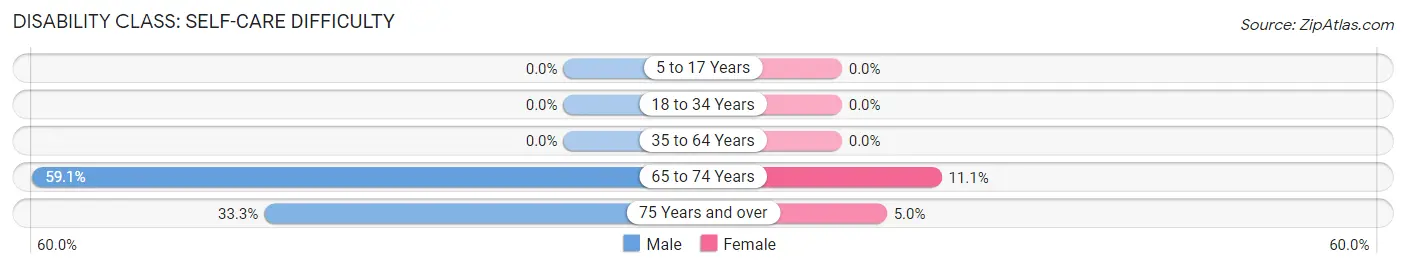
| Age Bracket | Male | Female |
| 5 to 17 Years | 0 (0.0%) | 0 (0.0%) |
| 18 to 34 Years | 0 (0.0%) | 0 (0.0%) |
| 35 to 64 Years | 0 (0.0%) | 0 (0.0%) |
| 65 to 74 Years | 55 (59.1%) | 1 (11.1%) |
| 75 Years and over | 10 (33.3%) | 2 (5.0%) |
Technology Access in Nordheim
Computing Device Access in Nordheim
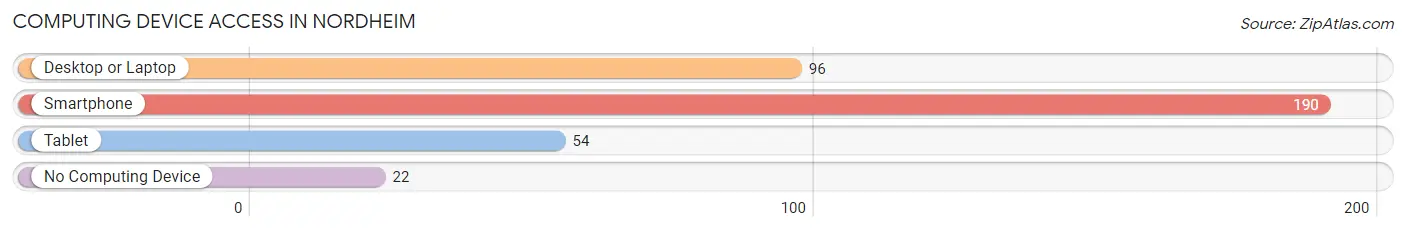
| Device Type | # Households | % Households |
| Desktop or Laptop | 96 | 44.4% |
| Smartphone | 190 | 88.0% |
| Tablet | 54 | 25.0% |
| No Computing Device | 22 | 10.2% |
| Total | 216 | 100.0% |
Internet Access in Nordheim
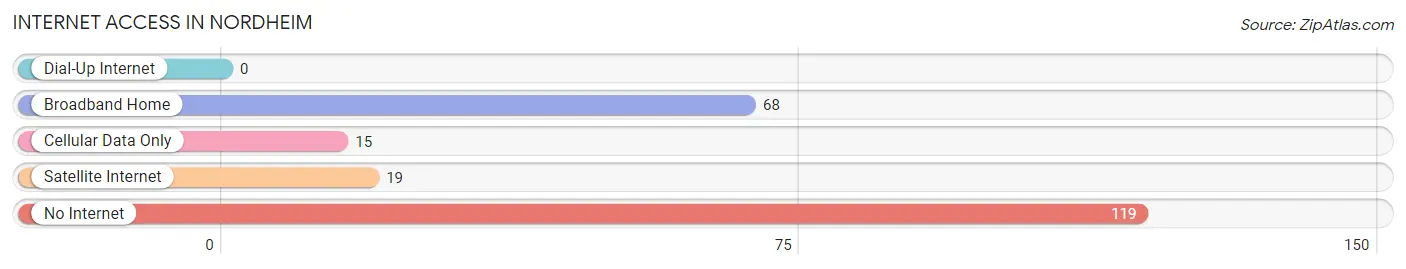
| Internet Type | # Households | % Households |
| Dial-Up Internet | 0 | 0.0% |
| Broadband Home | 68 | 31.5% |
| Cellular Data Only | 15 | 6.9% |
| Satellite Internet | 19 | 8.8% |
| No Internet | 119 | 55.1% |
| Total | 216 | 100.0% |
Nordheim Summary
Nordheim is a small town located in DeWitt County, Texas, United States. It is situated on the banks of the Nueces River, about 25 miles southeast of Cuero. The population was estimated to be around 200 in 2020.
History
Nordheim was founded in 1883 by German immigrants who had settled in the area. The town was named after the German city of Nordheim, which is located in the state of Baden-Württemberg. The town was originally a farming community, but it soon became a center for the oil and gas industry. In the early 1900s, the town was home to several oil refineries and a large number of oil wells.
Geography
Nordheim is located in DeWitt County, Texas, about 25 miles southeast of Cuero. The town is situated on the banks of the Nueces River, which is a major tributary of the Guadalupe River. The town is surrounded by rolling hills and farmland. The climate in Nordheim is generally mild, with temperatures ranging from the mid-50s in the winter to the mid-90s in the summer.
Economy
Nordheim’s economy is largely based on the oil and gas industry. The town is home to several oil refineries and a large number of oil wells. In addition, the town is home to several businesses, including a grocery store, a hardware store, and a few restaurants.
Demographics
As of the 2020 census, the population of Nordheim was estimated to be around 200. The racial makeup of the town was 97.5% White, 0.5% African American, 0.5% Native American, and 1.5% from other races. The median household income in Nordheim was $37,500, and the median home value was $90,000.
Conclusion
Nordheim is a small town located in DeWitt County, Texas, United States. It was founded in 1883 by German immigrants and is now home to several oil refineries and a large number of oil wells. The population of Nordheim was estimated to be around 200 in 2020, and the town’s economy is largely based on the oil and gas industry. The racial makeup of the town was 97.5% White, 0.5% African American, 0.5% Native American, and 1.5% from other races. The median household income in Nordheim was $37,500, and the median home value was $90,000.
Common Questions
What is Per Capita Income in Nordheim?
Per Capita income in Nordheim is $28,807.
What is the Median Family Income in Nordheim?
Median Family Income in Nordheim is $95,221.
What is the Median Household income in Nordheim?
Median Household Income in Nordheim is $37,656.
What is Income or Wage Gap in Nordheim?
Income or Wage Gap in Nordheim is 28.1%.
Women in Nordheim earn 71.9 cents for every dollar earned by a man.
What is Inequality or Gini Index in Nordheim?
Inequality or Gini Index in Nordheim is 0.40.
What is the Total Population of Nordheim?
Total Population of Nordheim is 442.
What is the Total Male Population of Nordheim?
Total Male Population of Nordheim is 229.
What is the Total Female Population of Nordheim?
Total Female Population of Nordheim is 213.
What is the Ratio of Males per 100 Females in Nordheim?
There are 107.51 Males per 100 Females in Nordheim.
What is the Ratio of Females per 100 Males in Nordheim?
There are 93.01 Females per 100 Males in Nordheim.
What is the Median Population Age in Nordheim?
Median Population Age in Nordheim is 56.0 Years.
What is the Average Family Size in Nordheim
Average Family Size in Nordheim is 3.8 People.
What is the Average Household Size in Nordheim
Average Household Size in Nordheim is 2.0 People.
How Large is the Labor Force in Nordheim?
There are 160 People in the Labor Forcein in Nordheim.
What is the Percentage of People in the Labor Force in Nordheim?
40.3% of People are in the Labor Force in Nordheim.
What is the Unemployment Rate in Nordheim?
Unemployment Rate in Nordheim is 6.3%.