Lopezville, TX Map & Demographics
Lopezville Map

Lopezville Overview
$14,339
PER CAPITA INCOME
$36,759
AVG FAMILY INCOME
$36,049
AVG HOUSEHOLD INCOME
73.5%
WAGE / INCOME GAP [ % ]
26.5¢/ $1
WAGE / INCOME GAP [ $ ]
$4,076
FAMILY INCOME DEFICIT
0.32
INEQUALITY / GINI INDEX
1,845
TOTAL POPULATION
1,013
MALE POPULATION
832
FEMALE POPULATION
121.75
MALES / 100 FEMALES
82.13
FEMALES / 100 MALES
58.2
MEDIAN AGE
3.1
AVG FAMILY SIZE
2.8
AVG HOUSEHOLD SIZE
748
LABOR FORCE [ PEOPLE ]
47.2%
PERCENT IN LABOR FORCE
13.5%
UNEMPLOYMENT RATE
Income in Lopezville
Income Overview in Lopezville
Per Capita Income in Lopezville is $14,339, while median incomes of families and households are $36,759 and $36,049 respectively.
| Characteristic | Number | Measure |
| Per Capita Income | 1,845 | $14,339 |
| Median Family Income | 536 | $36,759 |
| Mean Family Income | 536 | $43,057 |
| Median Household Income | 659 | $36,049 |
| Mean Household Income | 659 | $38,246 |
| Income Deficit | 536 | $4,076 |
| Wage / Income Gap (%) | 1,845 | 73.50% |
| Wage / Income Gap ($) | 1,845 | 26.50¢ per $1 |
| Gini / Inequality Index | 1,845 | 0.32 |
Earnings by Sex in Lopezville
Average Earnings in Lopezville are $29,536, $35,540 for men and $9,417 for women, a difference of 73.5%.
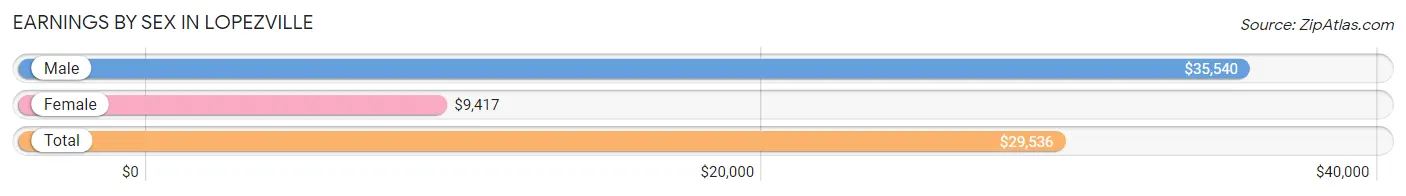
| Sex | Number | Average Earnings |
| Male | 560 (71.6%) | $35,540 |
| Female | 222 (28.4%) | $9,417 |
| Total | 782 (100.0%) | $29,536 |
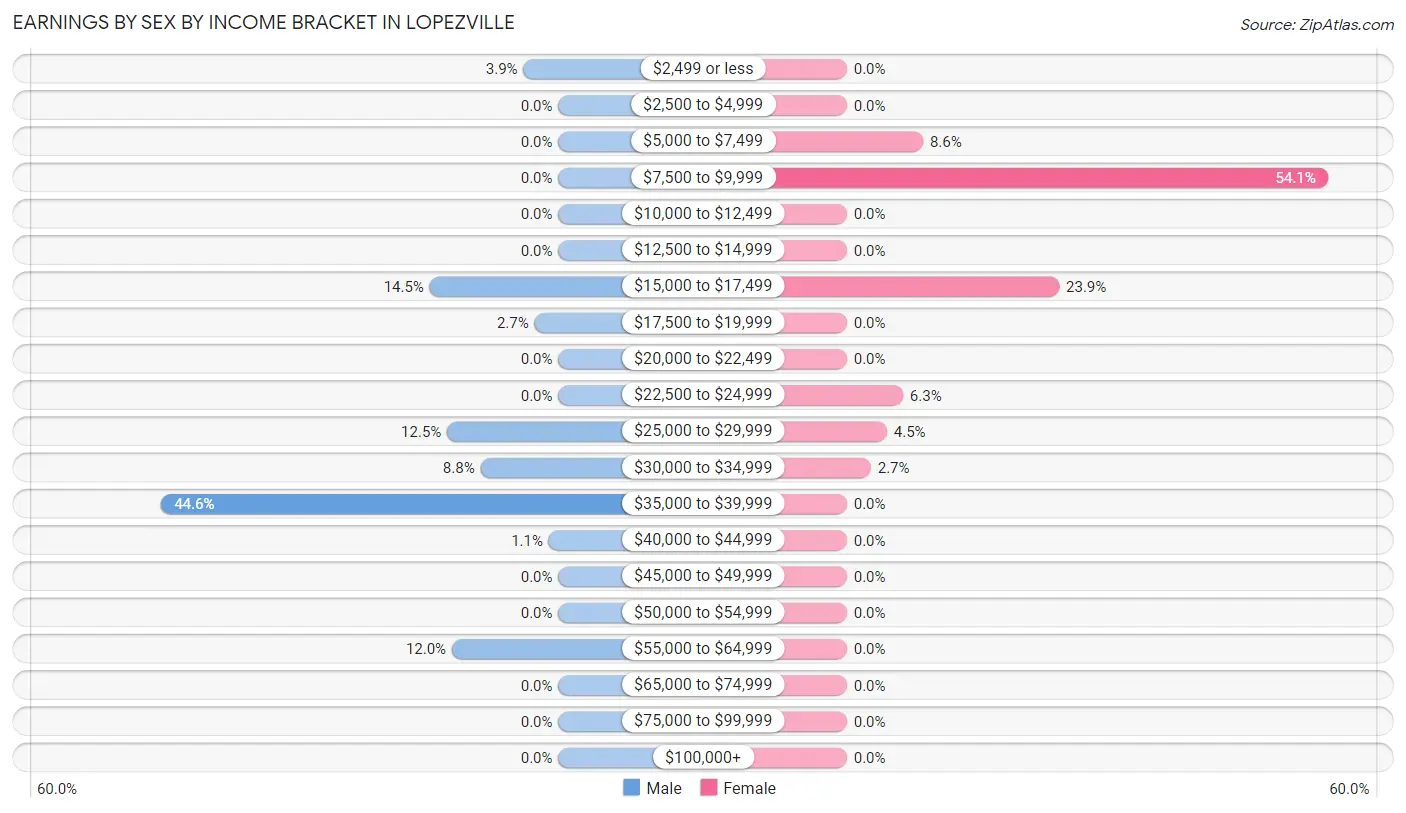
Earnings by Sex by Income Bracket in Lopezville
The most common earnings brackets in Lopezville are $35,000 to $39,999 for men (250 | 44.6%) and $7,500 to $9,999 for women (120 | 54.0%).
| Income | Male | Female |
| $2,499 or less | 22 (3.9%) | 0 (0.0%) |
| $2,500 to $4,999 | 0 (0.0%) | 0 (0.0%) |
| $5,000 to $7,499 | 0 (0.0%) | 19 (8.6%) |
| $7,500 to $9,999 | 0 (0.0%) | 120 (54.0%) |
| $10,000 to $12,499 | 0 (0.0%) | 0 (0.0%) |
| $12,500 to $14,999 | 0 (0.0%) | 0 (0.0%) |
| $15,000 to $17,499 | 81 (14.5%) | 53 (23.9%) |
| $17,500 to $19,999 | 15 (2.7%) | 0 (0.0%) |
| $20,000 to $22,499 | 0 (0.0%) | 0 (0.0%) |
| $22,500 to $24,999 | 0 (0.0%) | 14 (6.3%) |
| $25,000 to $29,999 | 70 (12.5%) | 10 (4.5%) |
| $30,000 to $34,999 | 49 (8.7%) | 6 (2.7%) |
| $35,000 to $39,999 | 250 (44.6%) | 0 (0.0%) |
| $40,000 to $44,999 | 6 (1.1%) | 0 (0.0%) |
| $45,000 to $49,999 | 0 (0.0%) | 0 (0.0%) |
| $50,000 to $54,999 | 0 (0.0%) | 0 (0.0%) |
| $55,000 to $64,999 | 67 (12.0%) | 0 (0.0%) |
| $65,000 to $74,999 | 0 (0.0%) | 0 (0.0%) |
| $75,000 to $99,999 | 0 (0.0%) | 0 (0.0%) |
| $100,000+ | 0 (0.0%) | 0 (0.0%) |
| Total | 560 (100.0%) | 222 (100.0%) |
Earnings by Sex by Educational Attainment in Lopezville
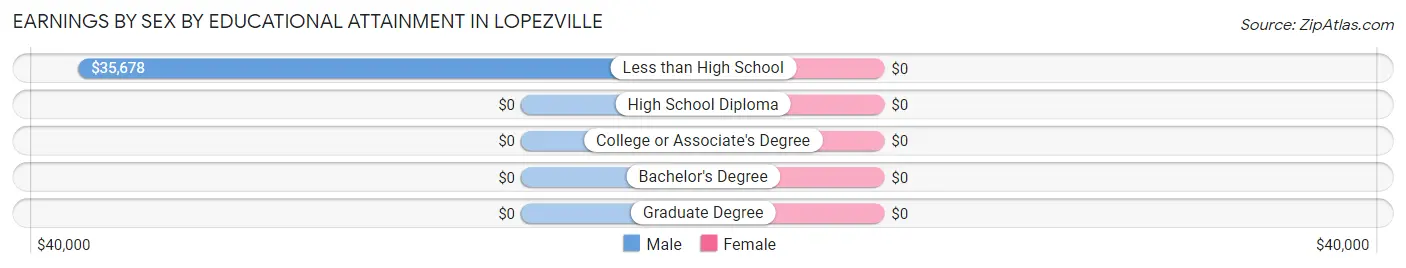
| Educational Attainment | Male Income | Female Income |
| Less than High School | $35,678 | $0 |
| High School Diploma | - | - |
| College or Associate's Degree | - | - |
| Bachelor's Degree | - | - |
| Graduate Degree | - | - |
| Total | $36,018 | $15,259 |
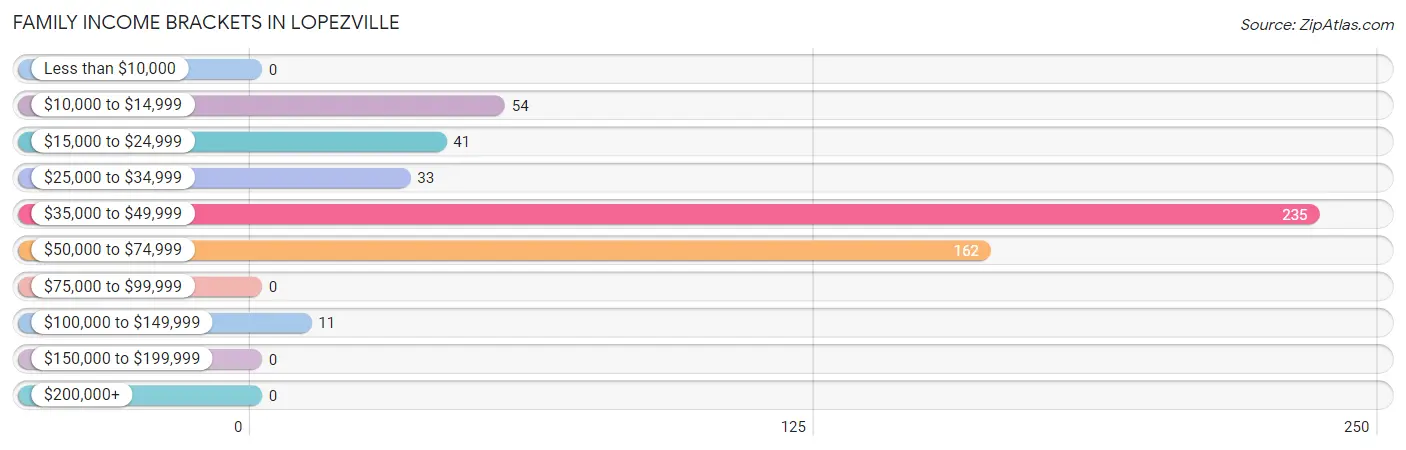
Family Income in Lopezville
Family Income Brackets in Lopezville
According to the Lopezville family income data, there are 235 families falling into the $35,000 to $49,999 income range, which is the most common income bracket and makes up 43.8% of all families.
| Income Bracket | # Families | % Families |
| Less than $10,000 | 0 | 0.0% |
| $10,000 to $14,999 | 54 | 10.1% |
| $15,000 to $24,999 | 41 | 7.6% |
| $25,000 to $34,999 | 33 | 6.2% |
| $35,000 to $49,999 | 235 | 43.8% |
| $50,000 to $74,999 | 162 | 30.2% |
| $75,000 to $99,999 | 0 | 0.0% |
| $100,000 to $149,999 | 11 | 2.1% |
| $150,000 to $199,999 | 0 | 0.0% |
| $200,000+ | 0 | 0.0% |
Family Income by Famaliy Size in Lopezville
4-person families (125 | 23.3%) account for the highest median family income in Lopezville with $66,569 per family, while 2-person families (290 | 54.1%) have the highest median income of $17,879 per family member.
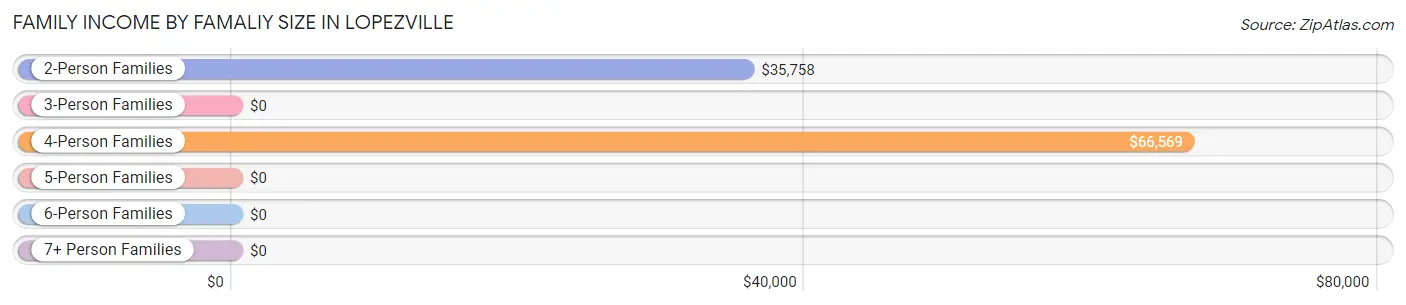
| Income Bracket | # Families | Median Income |
| 2-Person Families | 290 (54.1%) | $35,758 |
| 3-Person Families | 40 (7.5%) | $0 |
| 4-Person Families | 125 (23.3%) | $66,569 |
| 5-Person Families | 11 (2.1%) | $0 |
| 6-Person Families | 70 (13.1%) | $0 |
| 7+ Person Families | 0 (0.0%) | $0 |
| Total | 536 (100.0%) | $36,759 |
Family Income by Number of Earners in Lopezville
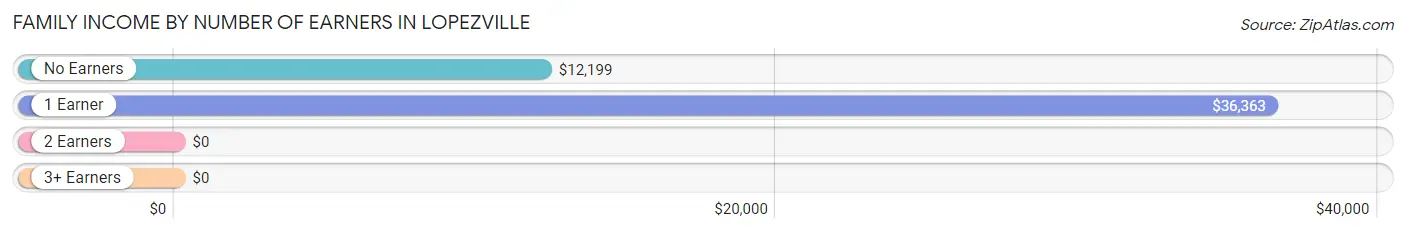
| Number of Earners | # Families | Median Income |
| No Earners | 95 (17.7%) | $12,199 |
| 1 Earner | 283 (52.8%) | $36,363 |
| 2 Earners | 77 (14.4%) | $0 |
| 3+ Earners | 81 (15.1%) | $0 |
| Total | 536 (100.0%) | $36,759 |
Household Income in Lopezville
Household Income Brackets in Lopezville
With 234 households falling in the category, the $35,000 to $49,999 income range is the most frequent in Lopezville, accounting for 35.5% of all households.
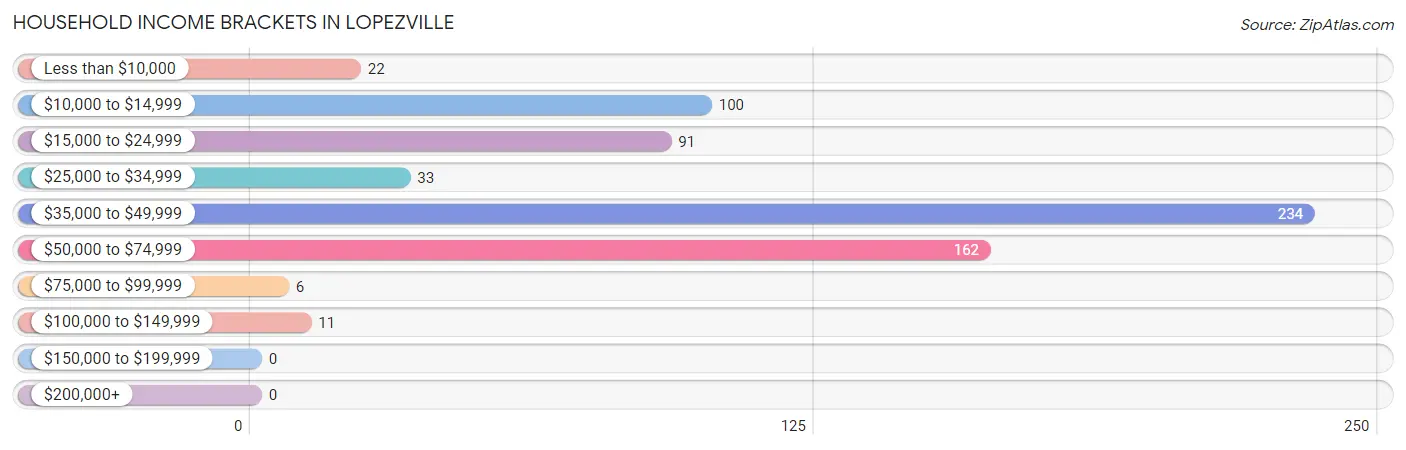
| Income Bracket | # Households | % Households |
| Less than $10,000 | 22 | 3.3% |
| $10,000 to $14,999 | 100 | 15.2% |
| $15,000 to $24,999 | 91 | 13.8% |
| $25,000 to $34,999 | 33 | 5.0% |
| $35,000 to $49,999 | 234 | 35.5% |
| $50,000 to $74,999 | 162 | 24.6% |
| $75,000 to $99,999 | 6 | 0.9% |
| $100,000 to $149,999 | 11 | 1.7% |
| $150,000 to $199,999 | 0 | 0.0% |
| $200,000+ | 0 | 0.0% |
Household Income by Householder Age in Lopezville
The median household income in Lopezville is $36,049, with the highest median household income of $36,815 found in the 45 to 64 years age bracket for the primary householder. A total of 341 households (51.7%) fall into this category.
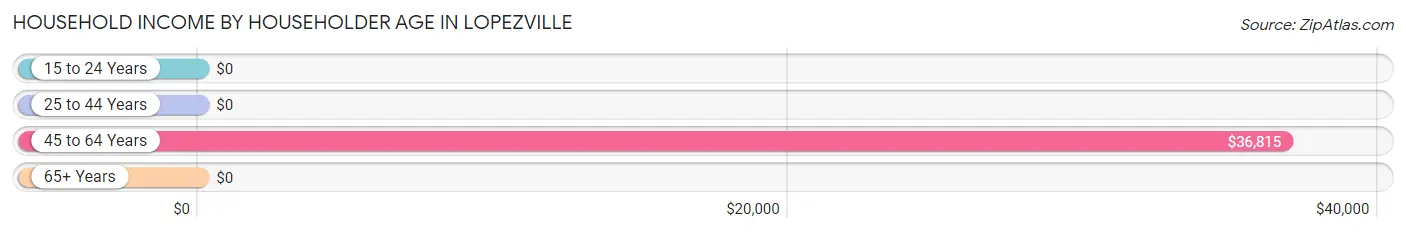
| Income Bracket | # Households | Median Income |
| 15 to 24 Years | 0 (0.0%) | $0 |
| 25 to 44 Years | 61 (9.3%) | $0 |
| 45 to 64 Years | 341 (51.7%) | $36,815 |
| 65+ Years | 257 (39.0%) | $0 |
| Total | 659 (100.0%) | $36,049 |
Poverty in Lopezville
Income Below Poverty by Sex and Age in Lopezville
With 18.4% poverty level for males and 17.0% for females among the residents of Lopezville, 75 year old and over males and 15 year old females are the most vulnerable to poverty, with 83 males (100.0%) and 15 females (100.0%) in their respective age groups living below the poverty level.
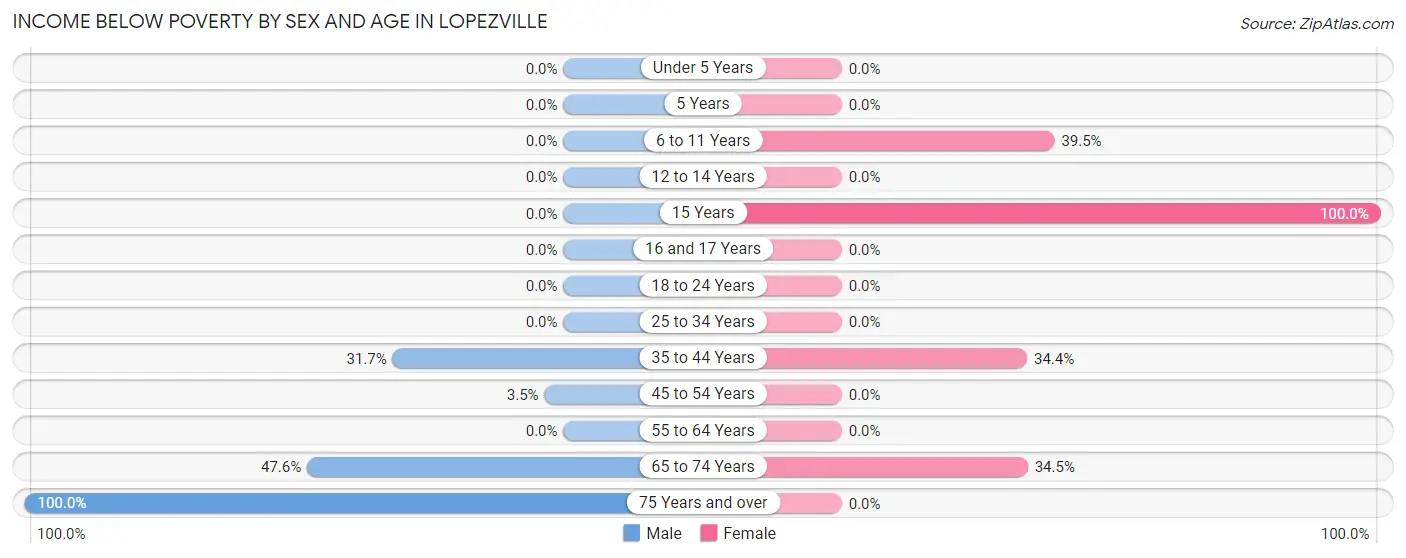
| Age Bracket | Male | Female |
| Under 5 Years | 0 (0.0%) | 0 (0.0%) |
| 5 Years | 0 (0.0%) | 0 (0.0%) |
| 6 to 11 Years | 0 (0.0%) | 15 (39.5%) |
| 12 to 14 Years | 0 (0.0%) | 0 (0.0%) |
| 15 Years | 0 (0.0%) | 15 (100.0%) |
| 16 and 17 Years | 0 (0.0%) | 0 (0.0%) |
| 18 to 24 Years | 0 (0.0%) | 0 (0.0%) |
| 25 to 34 Years | 0 (0.0%) | 0 (0.0%) |
| 35 to 44 Years | 39 (31.7%) | 33 (34.4%) |
| 45 to 54 Years | 5 (3.5%) | 0 (0.0%) |
| 55 to 64 Years | 0 (0.0%) | 0 (0.0%) |
| 65 to 74 Years | 59 (47.6%) | 78 (34.5%) |
| 75 Years and over | 83 (100.0%) | 0 (0.0%) |
| Total | 186 (18.4%) | 141 (17.0%) |
Income Above Poverty by Sex and Age in Lopezville
According to the poverty statistics in Lopezville, males aged 6 to 11 years and females aged under 5 years are the age groups that are most secure financially, with 100.0% of males and 100.0% of females in these age groups living above the poverty line.
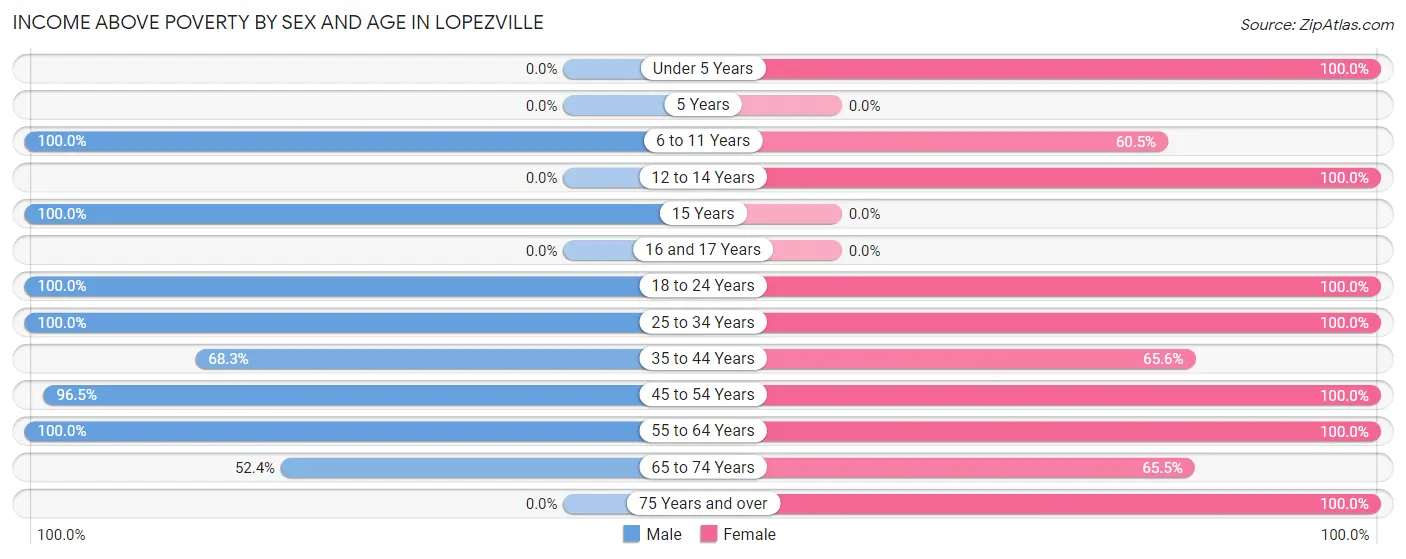
| Age Bracket | Male | Female |
| Under 5 Years | 0 (0.0%) | 84 (100.0%) |
| 5 Years | 0 (0.0%) | 0 (0.0%) |
| 6 to 11 Years | 73 (100.0%) | 23 (60.5%) |
| 12 to 14 Years | 0 (0.0%) | 41 (100.0%) |
| 15 Years | 9 (100.0%) | 0 (0.0%) |
| 16 and 17 Years | 0 (0.0%) | 0 (0.0%) |
| 18 to 24 Years | 106 (100.0%) | 79 (100.0%) |
| 25 to 34 Years | 73 (100.0%) | 17 (100.0%) |
| 35 to 44 Years | 84 (68.3%) | 63 (65.6%) |
| 45 to 54 Years | 137 (96.5%) | 15 (100.0%) |
| 55 to 64 Years | 280 (100.0%) | 131 (100.0%) |
| 65 to 74 Years | 65 (52.4%) | 148 (65.5%) |
| 75 Years and over | 0 (0.0%) | 90 (100.0%) |
| Total | 827 (81.6%) | 691 (83.1%) |
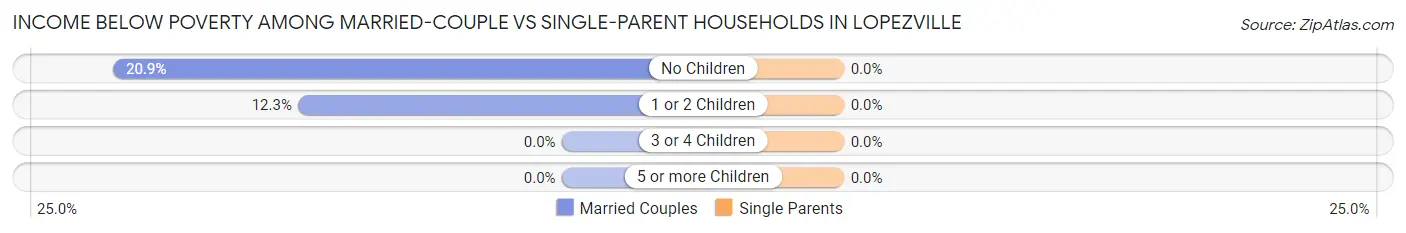
Income Below Poverty Among Married-Couple Families in Lopezville
The poverty statistics for married-couple families in Lopezville show that 18.8% or 90 of the total 478 families live below the poverty line. Families with no children have the highest poverty rate of 20.9%, comprising of 76 families. On the other hand, families with 1 or 2 children have the lowest poverty rate of 12.3%, which includes 14 families.
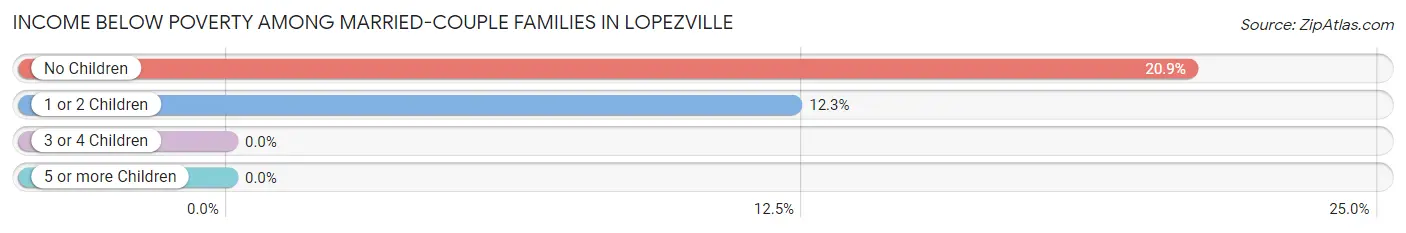
| Children | Above Poverty | Below Poverty |
| No Children | 288 (79.1%) | 76 (20.9%) |
| 1 or 2 Children | 100 (87.7%) | 14 (12.3%) |
| 3 or 4 Children | 0 (0.0%) | 0 (0.0%) |
| 5 or more Children | 0 (0.0%) | 0 (0.0%) |
| Total | 388 (81.2%) | 90 (18.8%) |
Income Below Poverty Among Single-Parent Households in Lopezville
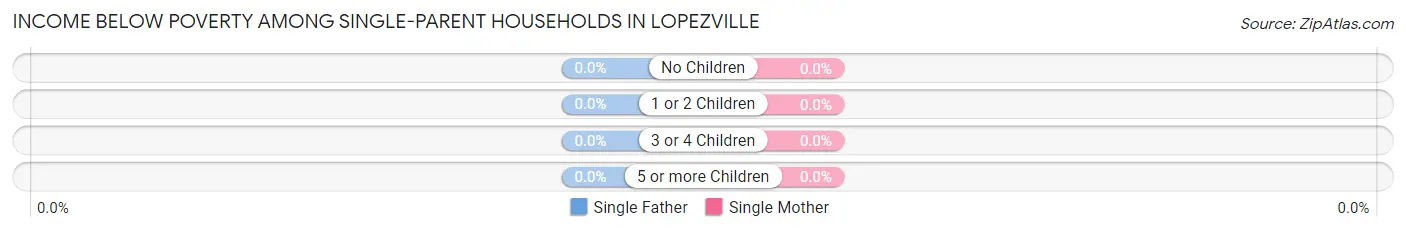
| Children | Single Father | Single Mother |
| No Children | 0 (0.0%) | 0 (0.0%) |
| 1 or 2 Children | 0 (0.0%) | 0 (0.0%) |
| 3 or 4 Children | 0 (0.0%) | 0 (0.0%) |
| 5 or more Children | 0 (0.0%) | 0 (0.0%) |
| Total | 0 (0.0%) | 0 (0.0%) |
Income Below Poverty Among Married-Couple vs Single-Parent Households in Lopezville
| Children | Married-Couple Families | Single-Parent Households |
| No Children | 76 (20.9%) | 0 (0.0%) |
| 1 or 2 Children | 14 (12.3%) | 0 (0.0%) |
| 3 or 4 Children | 0 (0.0%) | 0 (0.0%) |
| 5 or more Children | 0 (0.0%) | 0 (0.0%) |
| Total | 90 (18.8%) | 0 (0.0%) |
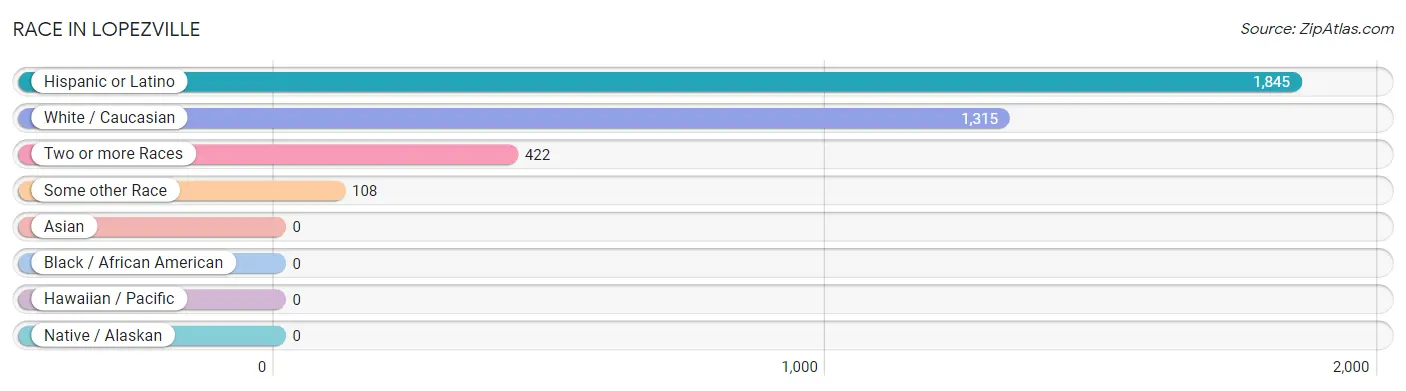
Race in Lopezville
The most populous races in Lopezville are Hispanic or Latino (1,845 | 100.0%), White / Caucasian (1,315 | 71.3%), and Two or more Races (422 | 22.9%).
| Race | # Population | % Population |
| Asian | 0 | 0.0% |
| Black / African American | 0 | 0.0% |
| Hawaiian / Pacific | 0 | 0.0% |
| Hispanic or Latino | 1,845 | 100.0% |
| Native / Alaskan | 0 | 0.0% |
| White / Caucasian | 1,315 | 71.3% |
| Two or more Races | 422 | 22.9% |
| Some other Race | 108 | 5.9% |
| Total | 1,845 | 100.0% |
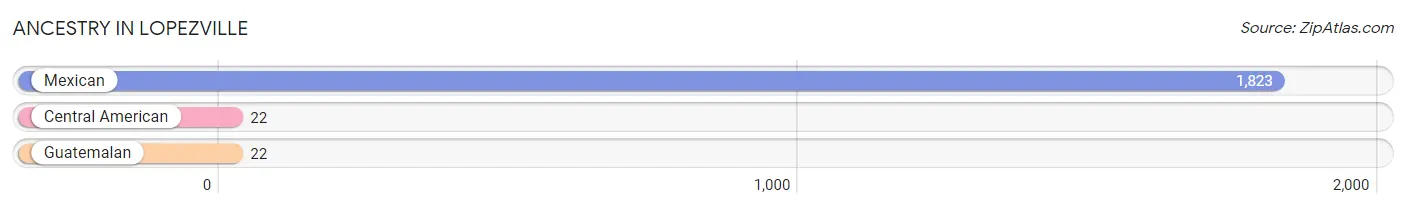
Ancestry in Lopezville
The most populous ancestries reported in Lopezville are Mexican (1,823 | 98.8%), Central American (22 | 1.2%), and Guatemalan (22 | 1.2%), together accounting for 101.2% of all Lopezville residents.
| Ancestry | # Population | % Population |
| Central American | 22 | 1.2% |
| Guatemalan | 22 | 1.2% |
| Mexican | 1,823 | 98.8% | View All 3 Rows |
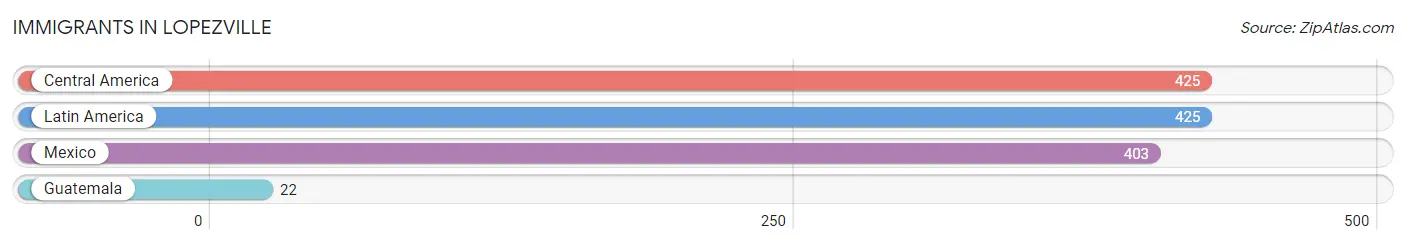
Immigrants in Lopezville
The most numerous immigrant groups reported in Lopezville came from Central America (425 | 23.0%), Latin America (425 | 23.0%), Mexico (403 | 21.8%), and Guatemala (22 | 1.2%), together accounting for 69.1% of all Lopezville residents.
| Immigration Origin | # Population | % Population |
| Central America | 425 | 23.0% |
| Guatemala | 22 | 1.2% |
| Latin America | 425 | 23.0% |
| Mexico | 403 | 21.8% | View All 4 Rows |
Sex and Age in Lopezville
Sex and Age in Lopezville
The most populous age groups in Lopezville are 60 to 64 Years (250 | 24.7%) for men and 65 to 69 Years (148 | 17.8%) for women.
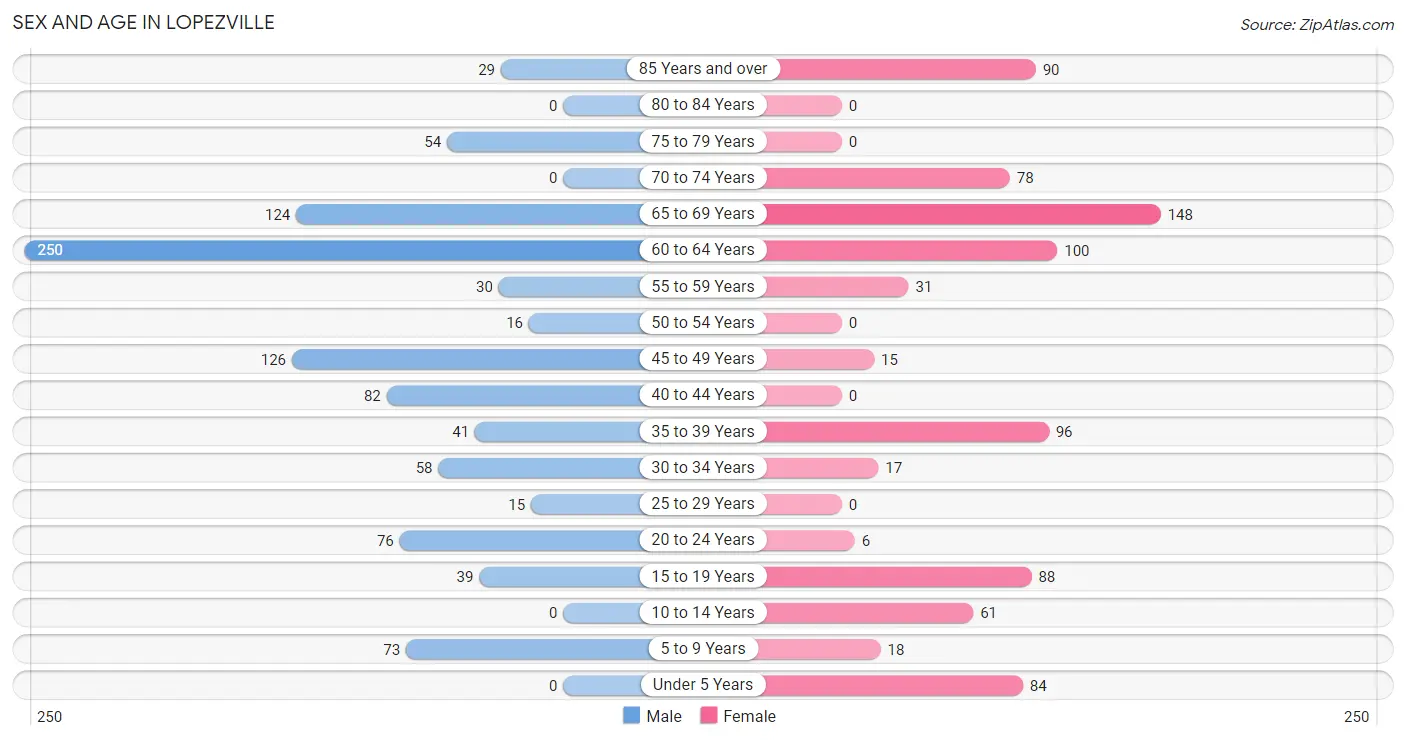
| Age Bracket | Male | Female |
| Under 5 Years | 0 (0.0%) | 84 (10.1%) |
| 5 to 9 Years | 73 (7.2%) | 18 (2.2%) |
| 10 to 14 Years | 0 (0.0%) | 61 (7.3%) |
| 15 to 19 Years | 39 (3.8%) | 88 (10.6%) |
| 20 to 24 Years | 76 (7.5%) | 6 (0.7%) |
| 25 to 29 Years | 15 (1.5%) | 0 (0.0%) |
| 30 to 34 Years | 58 (5.7%) | 17 (2.0%) |
| 35 to 39 Years | 41 (4.1%) | 96 (11.5%) |
| 40 to 44 Years | 82 (8.1%) | 0 (0.0%) |
| 45 to 49 Years | 126 (12.4%) | 15 (1.8%) |
| 50 to 54 Years | 16 (1.6%) | 0 (0.0%) |
| 55 to 59 Years | 30 (3.0%) | 31 (3.7%) |
| 60 to 64 Years | 250 (24.7%) | 100 (12.0%) |
| 65 to 69 Years | 124 (12.2%) | 148 (17.8%) |
| 70 to 74 Years | 0 (0.0%) | 78 (9.4%) |
| 75 to 79 Years | 54 (5.3%) | 0 (0.0%) |
| 80 to 84 Years | 0 (0.0%) | 0 (0.0%) |
| 85 Years and over | 29 (2.9%) | 90 (10.8%) |
| Total | 1,013 (100.0%) | 832 (100.0%) |
Families and Households in Lopezville
Median Family Size in Lopezville
The median family size in Lopezville is 3.08 persons per family, with single female/mother families (52 | 9.7%) accounting for the largest median family size of 4.1 persons per family. On the other hand, single male/father families (6 | 1.1%) represent the smallest median family size with 2.50 persons per family.
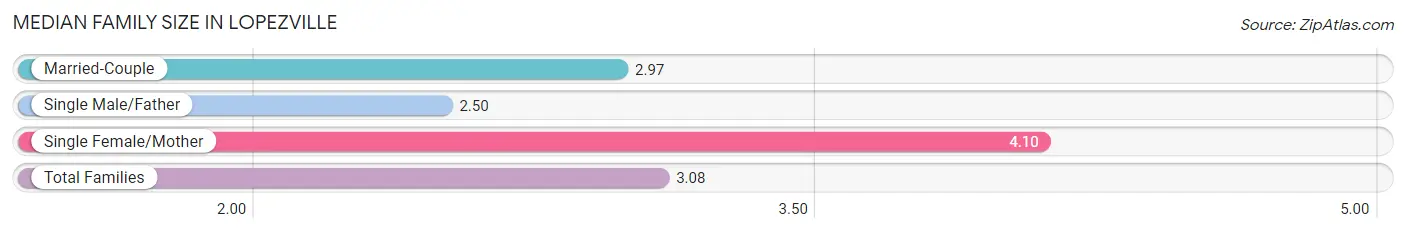
| Family Type | # Families | Family Size |
| Married-Couple | 478 (89.2%) | 2.97 |
| Single Male/Father | 6 (1.1%) | 2.50 |
| Single Female/Mother | 52 (9.7%) | 4.10 |
| Total Families | 536 (100.0%) | 3.08 |
Median Household Size in Lopezville
The median household size in Lopezville is 2.80 persons per household, with single female/mother households (52 | 7.9%) accounting for the largest median household size of 4.19 persons per household. non-family households (123 | 18.7%) represent the smallest median household size with 1.50 persons per household.
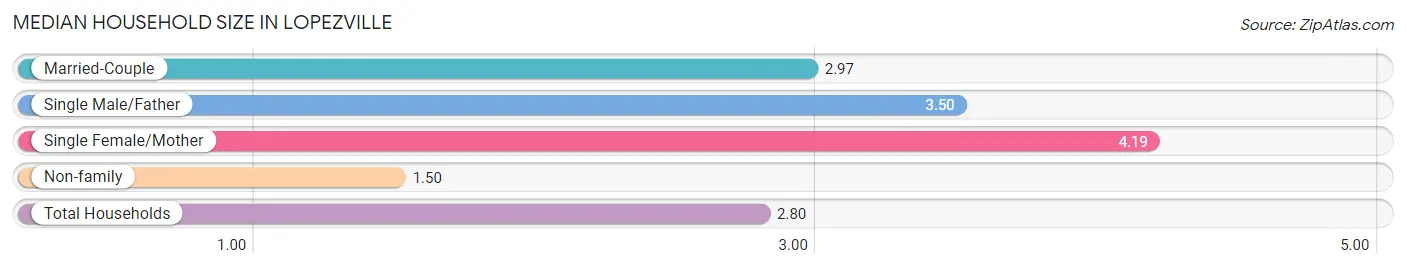
| Household Type | # Households | Household Size |
| Married-Couple | 478 (72.5%) | 2.97 |
| Single Male/Father | 6 (0.9%) | 3.50 |
| Single Female/Mother | 52 (7.9%) | 4.19 |
| Non-family | 123 (18.7%) | 1.50 |
| Total Households | 659 (100.0%) | 2.80 |
Household Size by Marriage Status in Lopezville
Out of a total of 659 households in Lopezville, 536 (81.3%) are family households, while 123 (18.7%) are nonfamily households. The most numerous type of family households are 2-person households, comprising 285, and the most common type of nonfamily households are 1-person households, comprising 72.
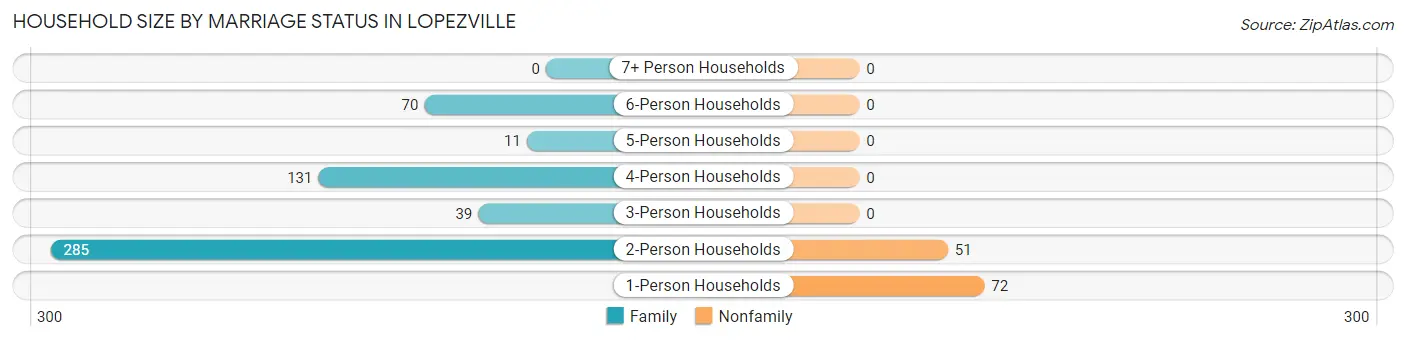
| Household Size | Family Households | Nonfamily Households |
| 1-Person Households | - | 72 (10.9%) |
| 2-Person Households | 285 (43.2%) | 51 (7.7%) |
| 3-Person Households | 39 (5.9%) | 0 (0.0%) |
| 4-Person Households | 131 (19.9%) | 0 (0.0%) |
| 5-Person Households | 11 (1.7%) | 0 (0.0%) |
| 6-Person Households | 70 (10.6%) | 0 (0.0%) |
| 7+ Person Households | 0 (0.0%) | 0 (0.0%) |
| Total | 536 (81.3%) | 123 (18.7%) |
Female Fertility in Lopezville
Fertility by Age in Lopezville
| Age Bracket | Women with Births | Births / 1,000 Women |
| 15 to 19 years | 0 (0.0%) | 0.0 |
| 20 to 34 years | 0 (0.0%) | 0.0 |
| 35 to 50 years | 0 (0.0%) | 0.0 |
| Total | 0 (0.0%) | 0.0 |
Fertility by Age by Marriage Status in Lopezville
| Age Bracket | Married | Unmarried |
| 15 to 19 years | 0 (0.0%) | 0 (0.0%) |
| 20 to 34 years | 0 (0.0%) | 0 (0.0%) |
| 35 to 50 years | 0 (0.0%) | 0 (0.0%) |
| Total | 0 (0.0%) | 0 (0.0%) |
Fertility by Education in Lopezville
| Educational Attainment | Women with Births | Births / 1,000 Women |
| Less than High School | 0 (0.0%) | 0.0 |
| High School Diploma | 0 (0.0%) | 0.0 |
| College or Associate's Degree | 0 (0.0%) | 0.0 |
| Bachelor's Degree | 0 (0.0%) | 0.0 |
| Graduate Degree | 0 (0.0%) | 0.0 |
| Total | 0 (0.0%) | 0.0 |
Fertility by Education by Marriage Status in Lopezville
| Educational Attainment | Married | Unmarried |
| Less than High School | 0 (0.0%) | 0 (0.0%) |
| High School Diploma | 0 (0.0%) | 0 (0.0%) |
| College or Associate's Degree | 0 (0.0%) | 0 (0.0%) |
| Bachelor's Degree | 0 (0.0%) | 0 (0.0%) |
| Graduate Degree | 0 (0.0%) | 0 (0.0%) |
| Total | 0 (0.0%) | 0 (0.0%) |
Employment Characteristics in Lopezville
Employment by Class of Employer in Lopezville
Among the 600 employed individuals in Lopezville, private company employees (489 | 81.5%), local government employees (51 | 8.5%), and self-employed (not incorporated) (33 | 5.5%) make up the most common classes of employment.
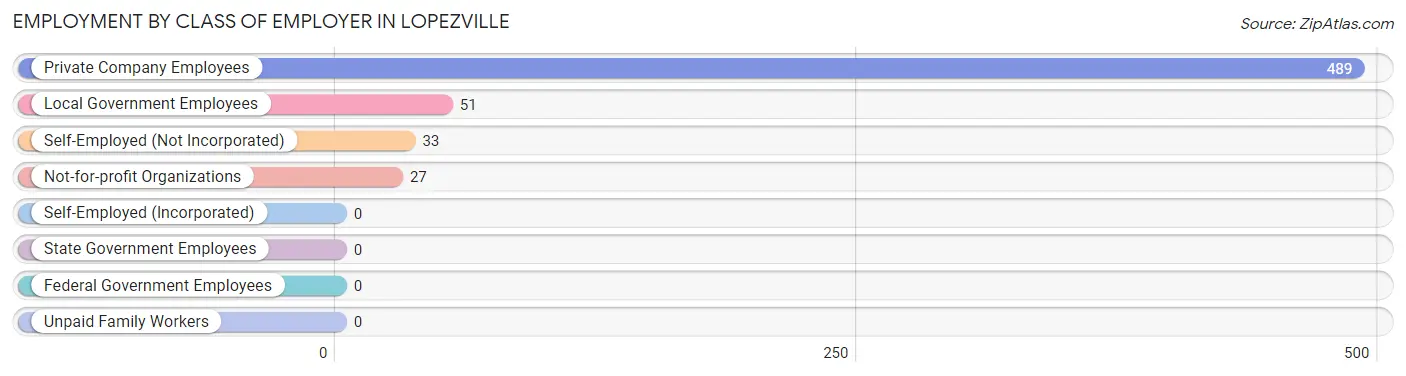
| Employer Class | # Employees | % Employees |
| Private Company Employees | 489 | 81.5% |
| Self-Employed (Incorporated) | 0 | 0.0% |
| Self-Employed (Not Incorporated) | 33 | 5.5% |
| Not-for-profit Organizations | 27 | 4.5% |
| Local Government Employees | 51 | 8.5% |
| State Government Employees | 0 | 0.0% |
| Federal Government Employees | 0 | 0.0% |
| Unpaid Family Workers | 0 | 0.0% |
| Total | 600 | 100.0% |
Employment Status by Age in Lopezville
According to the labor force statistics for Lopezville, out of the total population over 16 years of age (1,585), 47.2% or 748 individuals are in the labor force, with 13.5% or 101 of them unemployed. The age group with the highest labor force participation rate is 20 to 24 years, with 100.0% or 82 individuals in the labor force. Within the labor force, the 30 to 34 years age range has the highest percentage of unemployed individuals, with 100.0% or 58 of them being unemployed.
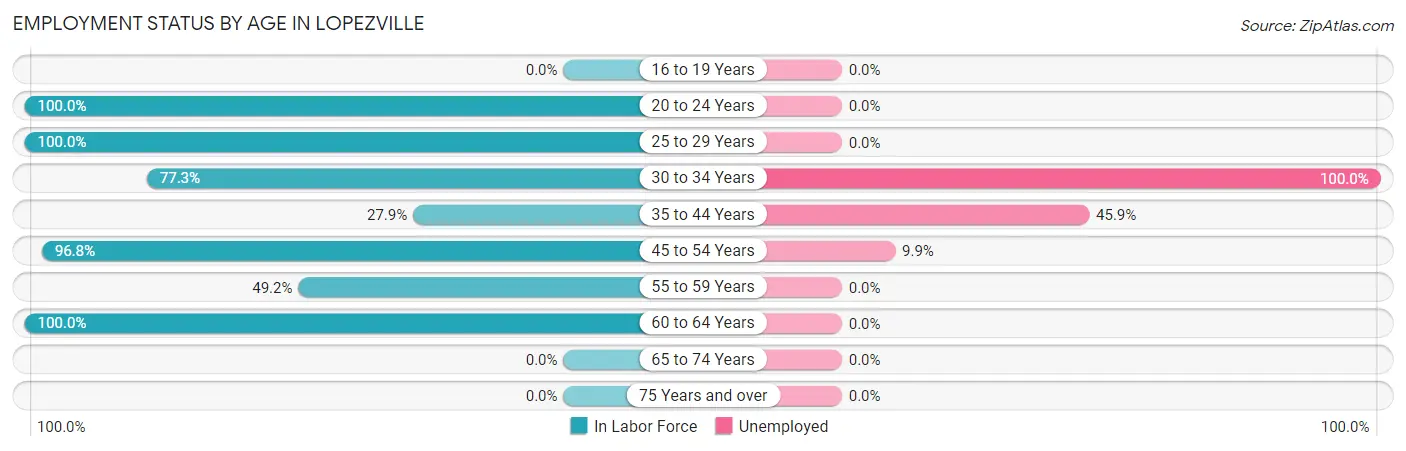
| Age Bracket | In Labor Force | Unemployed |
| 16 to 19 Years | 0 (0.0%) | 0 (0.0%) |
| 20 to 24 Years | 82 (100.0%) | 0 (0.0%) |
| 25 to 29 Years | 15 (100.0%) | 0 (0.0%) |
| 30 to 34 Years | 58 (77.3%) | 58 (100.0%) |
| 35 to 44 Years | 61 (27.9%) | 28 (45.9%) |
| 45 to 54 Years | 152 (96.8%) | 15 (9.9%) |
| 55 to 59 Years | 30 (49.2%) | 0 (0.0%) |
| 60 to 64 Years | 350 (100.0%) | 0 (0.0%) |
| 65 to 74 Years | 0 (0.0%) | 0 (0.0%) |
| 75 Years and over | 0 (0.0%) | 0 (0.0%) |
| Total | 748 (47.2%) | 101 (13.5%) |
Employment Status by Educational Attainment in Lopezville
According to labor force statistics for Lopezville, 75.9% of individuals (666) out of the total population between 25 and 64 years of age (877) are in the labor force, with 15.2% or 101 of them being unemployed. The group with the highest labor force participation rate are those with the educational attainment of bachelor's degree or higher, with 100.0% or 30 individuals in the labor force. Within the labor force, individuals with college / associate degree education have the highest percentage of unemployment, with 37.9% or 58 of them being unemployed.
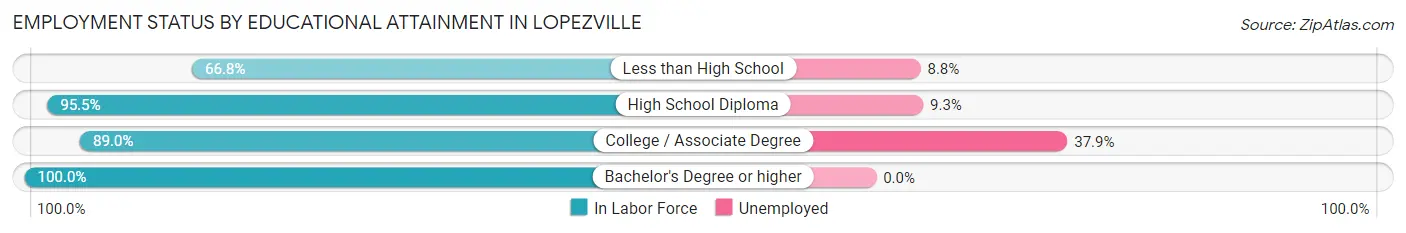
| Educational Attainment | In Labor Force | Unemployed |
| Less than High School | 376 (66.8%) | 50 (8.8%) |
| High School Diploma | 107 (95.5%) | 10 (9.3%) |
| College / Associate Degree | 153 (89.0%) | 65 (37.9%) |
| Bachelor's Degree or higher | 30 (100.0%) | 0 (0.0%) |
| Total | 666 (75.9%) | 133 (15.2%) |
Employment Occupations by Sex in Lopezville
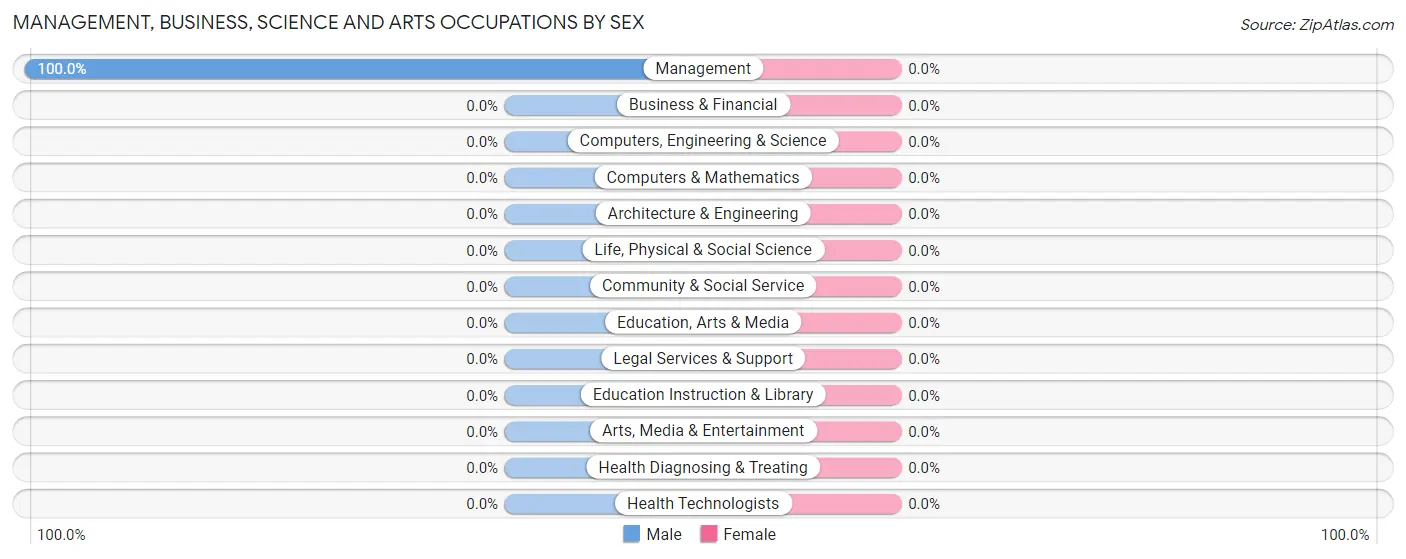
Management, Business, Science and Arts Occupations
The most common Management, Business, Science and Arts occupations in Lopezville are , and Management (11 | 1.7%).
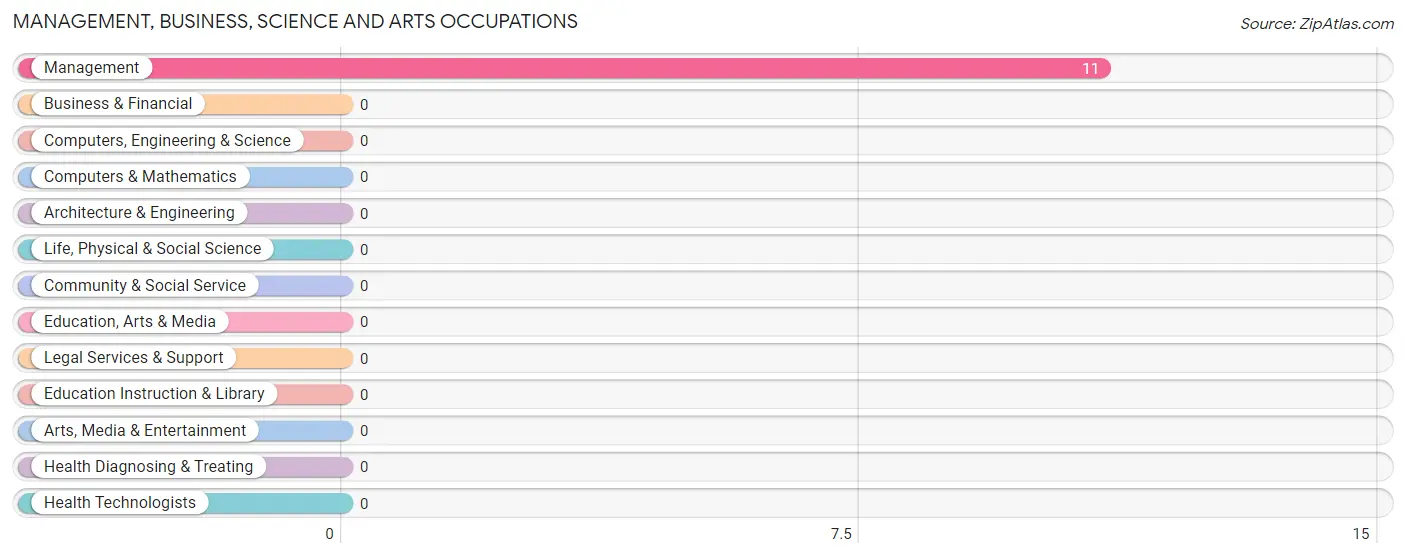
Management, Business, Science and Arts Occupations by Sex
| Occupation | Male | Female |
| Management | 11 (100.0%) | 0 (0.0%) |
| Business & Financial | 0 (0.0%) | 0 (0.0%) |
| Computers, Engineering & Science | 0 (0.0%) | 0 (0.0%) |
| Computers & Mathematics | 0 (0.0%) | 0 (0.0%) |
| Architecture & Engineering | 0 (0.0%) | 0 (0.0%) |
| Life, Physical & Social Science | 0 (0.0%) | 0 (0.0%) |
| Community & Social Service | 0 (0.0%) | 0 (0.0%) |
| Education, Arts & Media | 0 (0.0%) | 0 (0.0%) |
| Legal Services & Support | 0 (0.0%) | 0 (0.0%) |
| Education Instruction & Library | 0 (0.0%) | 0 (0.0%) |
| Arts, Media & Entertainment | 0 (0.0%) | 0 (0.0%) |
| Health Diagnosing & Treating | 0 (0.0%) | 0 (0.0%) |
| Health Technologists | 0 (0.0%) | 0 (0.0%) |
| Total (Category) | 11 (100.0%) | 0 (0.0%) |
| Total (Overall) | 527 (81.5%) | 120 (18.5%) |
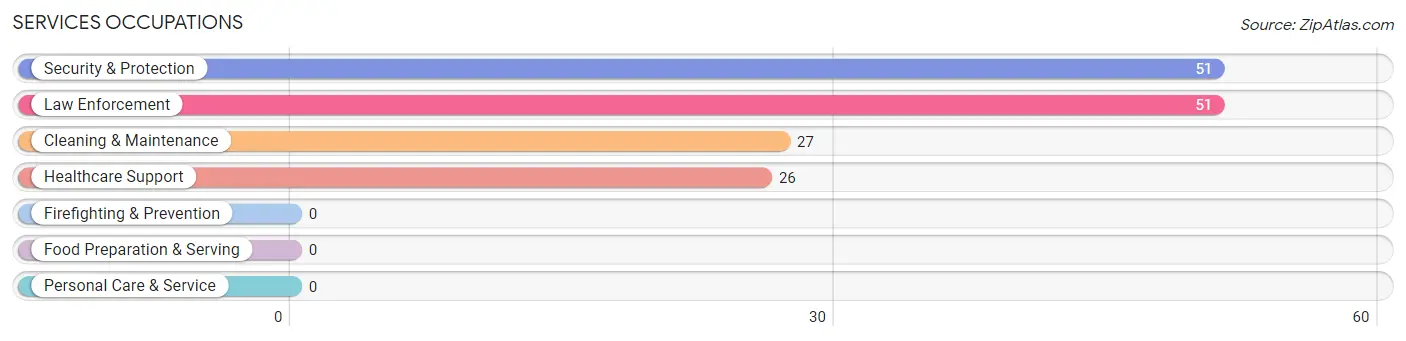
Services Occupations
The most common Services occupations in Lopezville are Security & Protection (51 | 7.9%), Law Enforcement (51 | 7.9%), Cleaning & Maintenance (27 | 4.2%), and Healthcare Support (26 | 4.0%).
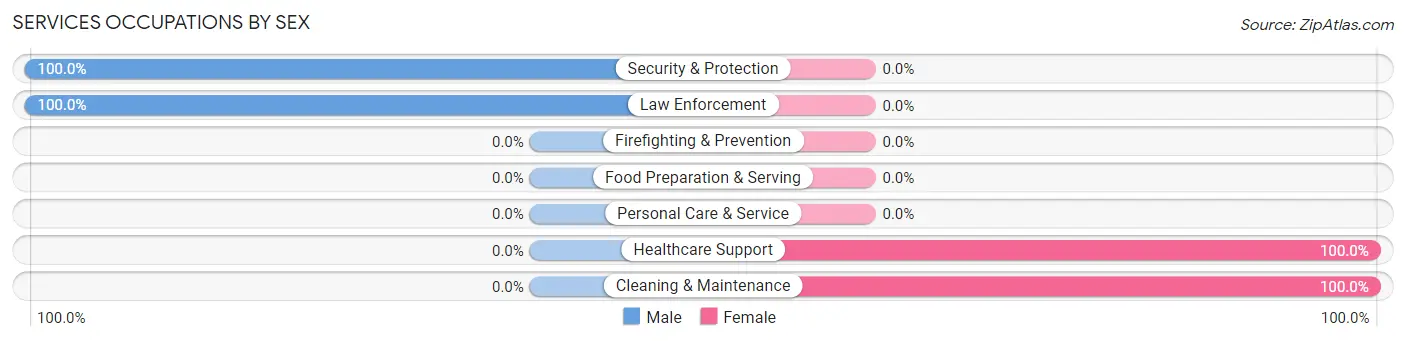
Services Occupations by Sex
Within the Services occupations in Lopezville, the most male-oriented occupations are Security & Protection (100.0%), and Law Enforcement (100.0%), while the most female-oriented occupations are Healthcare Support (100.0%), and Cleaning & Maintenance (100.0%).
| Occupation | Male | Female |
| Healthcare Support | 0 (0.0%) | 26 (100.0%) |
| Security & Protection | 51 (100.0%) | 0 (0.0%) |
| Firefighting & Prevention | 0 (0.0%) | 0 (0.0%) |
| Law Enforcement | 51 (100.0%) | 0 (0.0%) |
| Food Preparation & Serving | 0 (0.0%) | 0 (0.0%) |
| Cleaning & Maintenance | 0 (0.0%) | 27 (100.0%) |
| Personal Care & Service | 0 (0.0%) | 0 (0.0%) |
| Total (Category) | 51 (49.0%) | 53 (51.0%) |
| Total (Overall) | 527 (81.5%) | 120 (18.5%) |
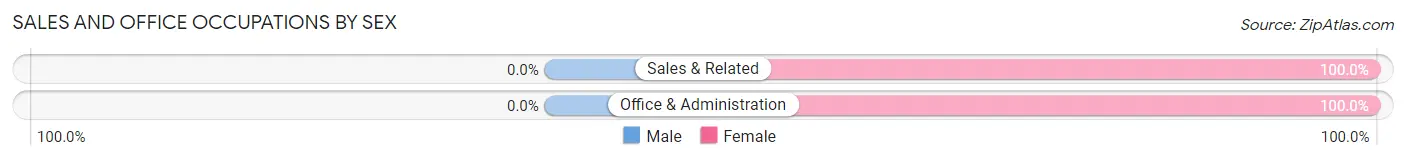
Sales and Office Occupations
The most common Sales and Office occupations in Lopezville are Sales & Related (14 | 2.2%), and Office & Administration (6 | 0.9%).

Sales and Office Occupations by Sex
| Occupation | Male | Female |
| Sales & Related | 0 (0.0%) | 14 (100.0%) |
| Office & Administration | 0 (0.0%) | 6 (100.0%) |
| Total (Category) | 0 (0.0%) | 20 (100.0%) |
| Total (Overall) | 527 (81.5%) | 120 (18.5%) |
Natural Resources, Construction and Maintenance Occupations
The most common Natural Resources, Construction and Maintenance occupations in Lopezville are , and Construction & Extraction (75 | 11.6%).
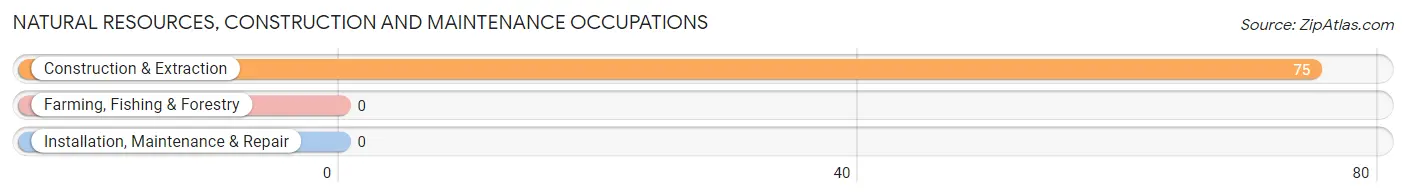
Natural Resources, Construction and Maintenance Occupations by Sex
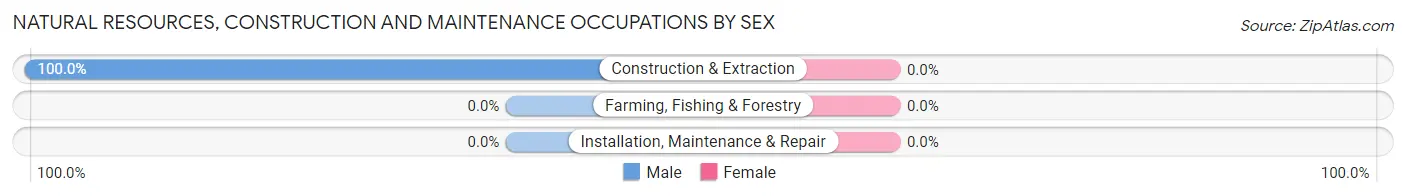
| Occupation | Male | Female |
| Farming, Fishing & Forestry | 0 (0.0%) | 0 (0.0%) |
| Construction & Extraction | 75 (100.0%) | 0 (0.0%) |
| Installation, Maintenance & Repair | 0 (0.0%) | 0 (0.0%) |
| Total (Category) | 75 (100.0%) | 0 (0.0%) |
| Total (Overall) | 527 (81.5%) | 120 (18.5%) |
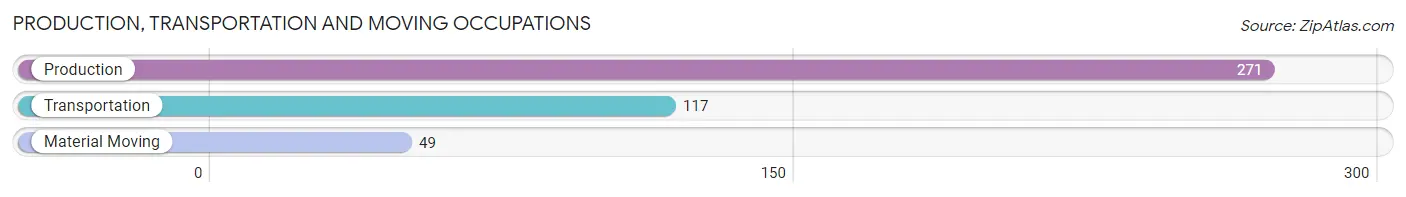
Production, Transportation and Moving Occupations
The most common Production, Transportation and Moving occupations in Lopezville are Production (271 | 41.9%), Transportation (117 | 18.1%), and Material Moving (49 | 7.6%).
Production, Transportation and Moving Occupations by Sex
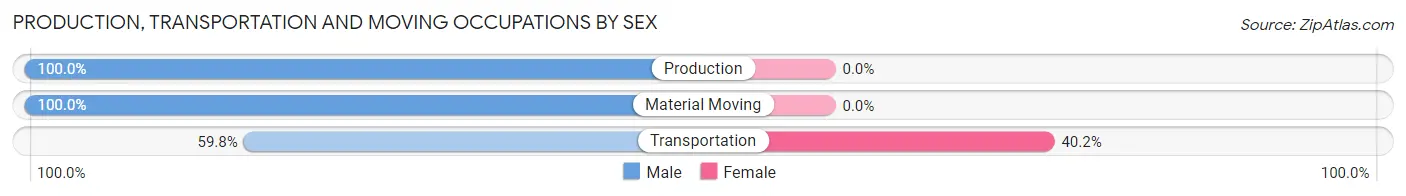
| Occupation | Male | Female |
| Production | 271 (100.0%) | 0 (0.0%) |
| Transportation | 70 (59.8%) | 47 (40.2%) |
| Material Moving | 49 (100.0%) | 0 (0.0%) |
| Total (Category) | 390 (89.2%) | 47 (10.8%) |
| Total (Overall) | 527 (81.5%) | 120 (18.5%) |
Employment Industries by Sex in Lopezville
Employment Industries in Lopezville
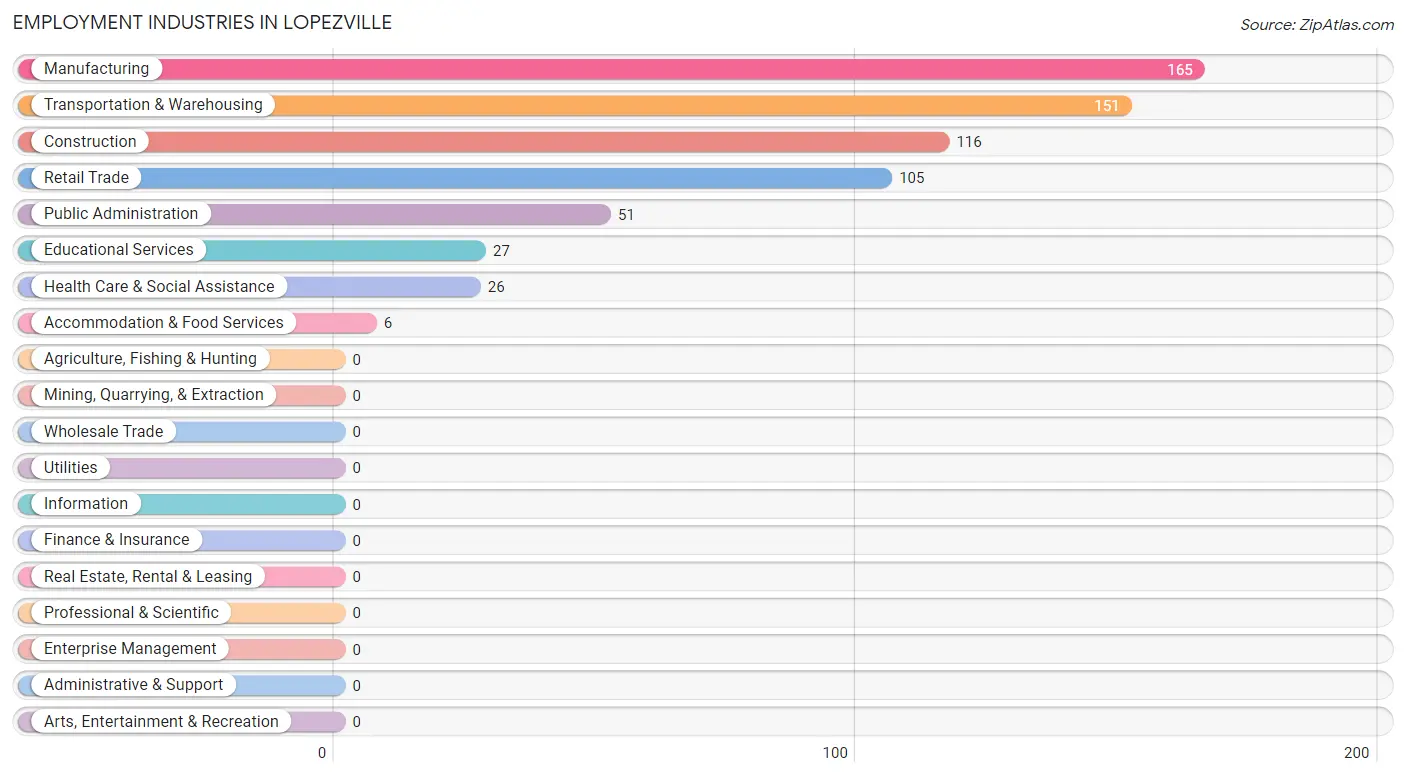
The major employment industries in Lopezville include Manufacturing (165 | 25.5%), Transportation & Warehousing (151 | 23.3%), Construction (116 | 17.9%), Retail Trade (105 | 16.2%), and Public Administration (51 | 7.9%).
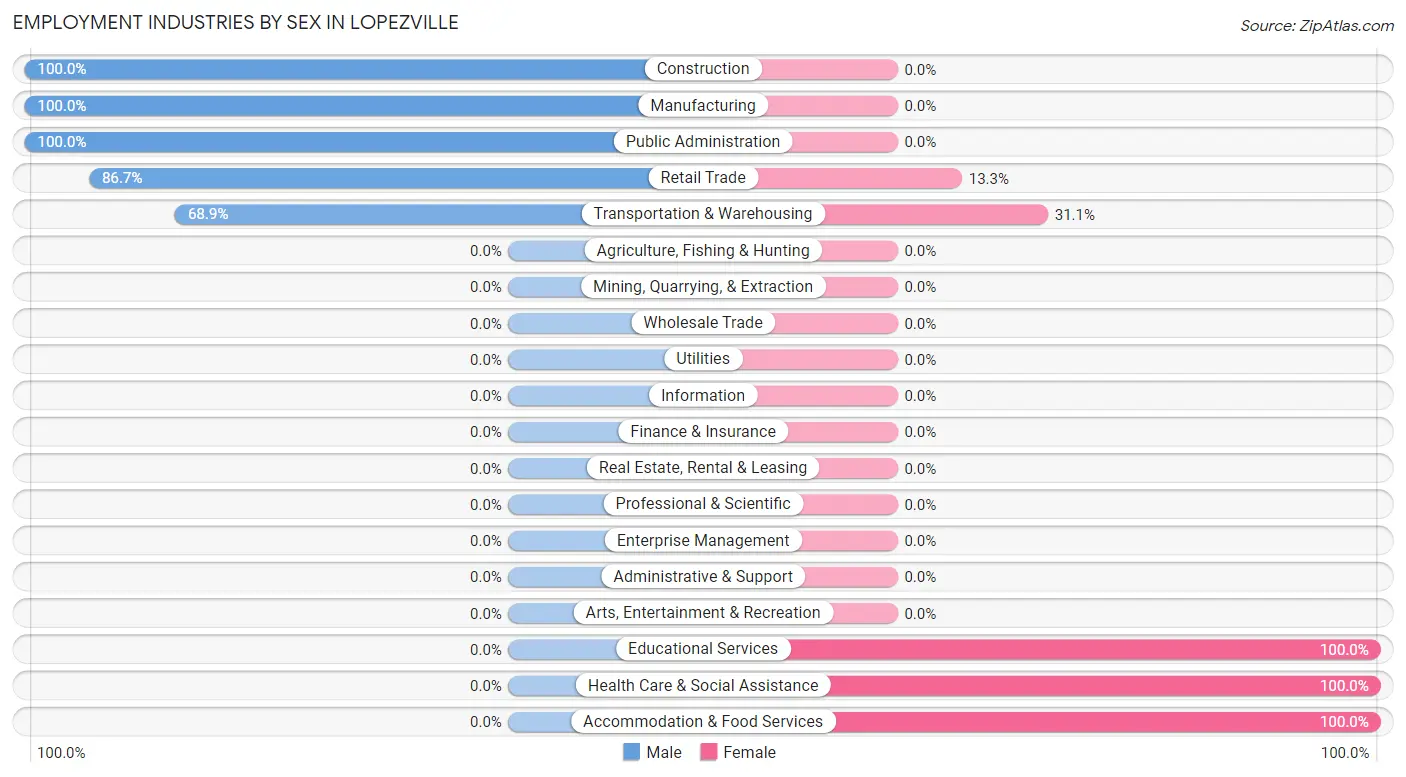
Employment Industries by Sex in Lopezville
The Lopezville industries that see more men than women are Construction (100.0%), Manufacturing (100.0%), and Public Administration (100.0%), whereas the industries that tend to have a higher number of women are Educational Services (100.0%), Health Care & Social Assistance (100.0%), and Accommodation & Food Services (100.0%).
| Industry | Male | Female |
| Agriculture, Fishing & Hunting | 0 (0.0%) | 0 (0.0%) |
| Mining, Quarrying, & Extraction | 0 (0.0%) | 0 (0.0%) |
| Construction | 116 (100.0%) | 0 (0.0%) |
| Manufacturing | 165 (100.0%) | 0 (0.0%) |
| Wholesale Trade | 0 (0.0%) | 0 (0.0%) |
| Retail Trade | 91 (86.7%) | 14 (13.3%) |
| Transportation & Warehousing | 104 (68.9%) | 47 (31.1%) |
| Utilities | 0 (0.0%) | 0 (0.0%) |
| Information | 0 (0.0%) | 0 (0.0%) |
| Finance & Insurance | 0 (0.0%) | 0 (0.0%) |
| Real Estate, Rental & Leasing | 0 (0.0%) | 0 (0.0%) |
| Professional & Scientific | 0 (0.0%) | 0 (0.0%) |
| Enterprise Management | 0 (0.0%) | 0 (0.0%) |
| Administrative & Support | 0 (0.0%) | 0 (0.0%) |
| Educational Services | 0 (0.0%) | 27 (100.0%) |
| Health Care & Social Assistance | 0 (0.0%) | 26 (100.0%) |
| Arts, Entertainment & Recreation | 0 (0.0%) | 0 (0.0%) |
| Accommodation & Food Services | 0 (0.0%) | 6 (100.0%) |
| Public Administration | 51 (100.0%) | 0 (0.0%) |
| Total | 527 (81.5%) | 120 (18.5%) |
Education in Lopezville
School Enrollment in Lopezville
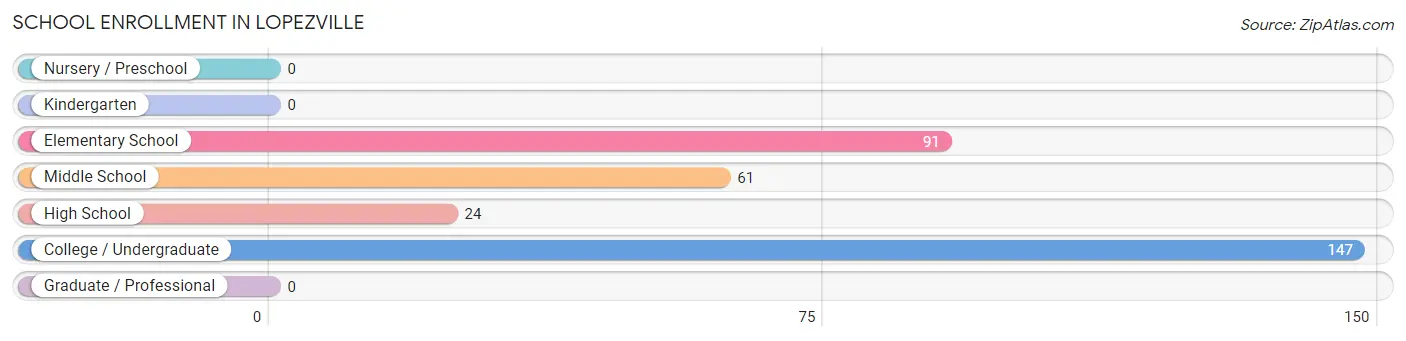
The most common levels of schooling among the 323 students in Lopezville are college / undergraduate (147 | 45.5%), elementary school (91 | 28.2%), and middle school (61 | 18.9%).
| School Level | # Students | % Students |
| Nursery / Preschool | 0 | 0.0% |
| Kindergarten | 0 | 0.0% |
| Elementary School | 91 | 28.2% |
| Middle School | 61 | 18.9% |
| High School | 24 | 7.4% |
| College / Undergraduate | 147 | 45.5% |
| Graduate / Professional | 0 | 0.0% |
| Total | 323 | 100.0% |
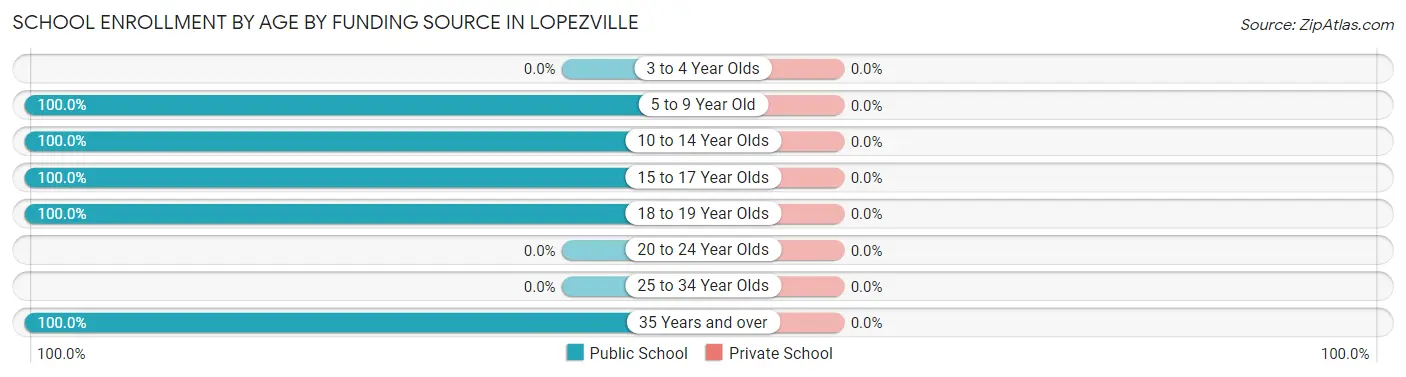
School Enrollment by Age by Funding Source in Lopezville
| Age Bracket | Public School | Private School |
| 3 to 4 Year Olds | 0 (0.0%) | 0 (0.0%) |
| 5 to 9 Year Old | 91 (100.0%) | 0 (0.0%) |
| 10 to 14 Year Olds | 61 (100.0%) | 0 (0.0%) |
| 15 to 17 Year Olds | 24 (100.0%) | 0 (0.0%) |
| 18 to 19 Year Olds | 103 (100.0%) | 0 (0.0%) |
| 20 to 24 Year Olds | 0 (0.0%) | 0 (0.0%) |
| 25 to 34 Year Olds | 0 (0.0%) | 0 (0.0%) |
| 35 Years and over | 44 (100.0%) | 0 (0.0%) |
| Total | 323 (100.0%) | 0 (0.0%) |
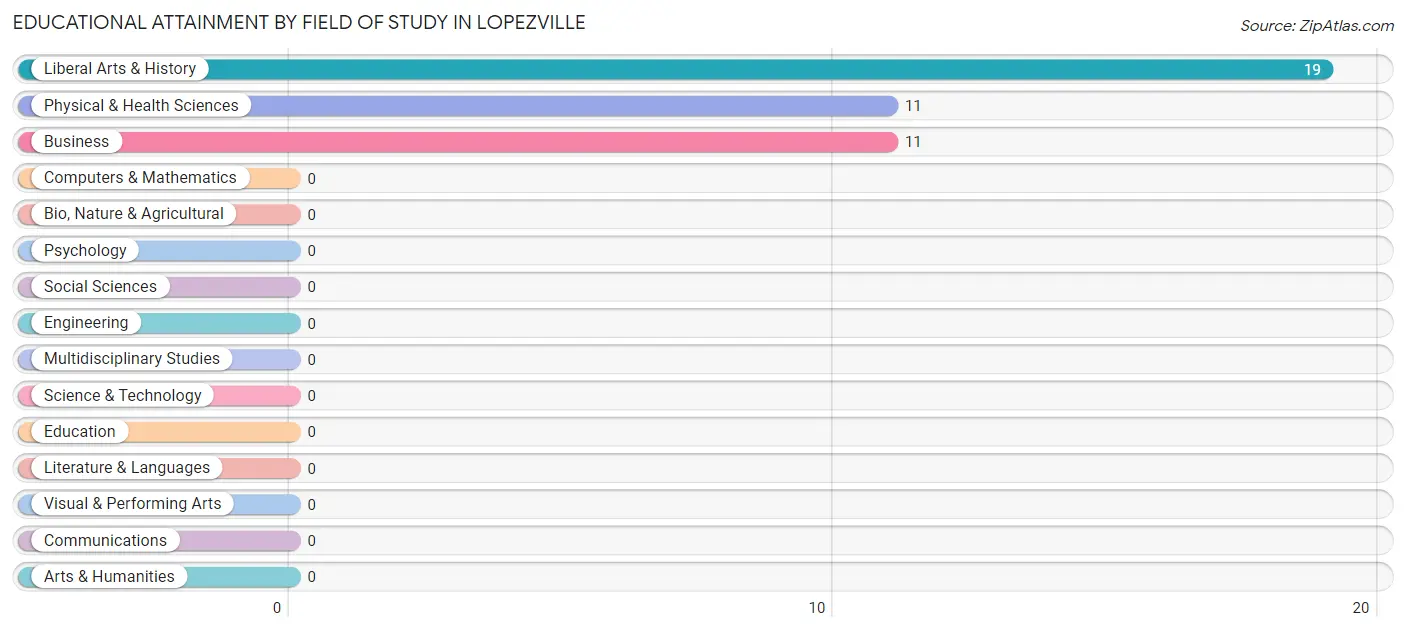
Educational Attainment by Field of Study in Lopezville
Liberal arts & history (19 | 46.3%), physical & health sciences (11 | 26.8%), and business (11 | 26.8%) are the most common fields of study among 41 individuals in Lopezville who have obtained a bachelor's degree or higher.
| Field of Study | # Graduates | % Graduates |
| Computers & Mathematics | 0 | 0.0% |
| Bio, Nature & Agricultural | 0 | 0.0% |
| Physical & Health Sciences | 11 | 26.8% |
| Psychology | 0 | 0.0% |
| Social Sciences | 0 | 0.0% |
| Engineering | 0 | 0.0% |
| Multidisciplinary Studies | 0 | 0.0% |
| Science & Technology | 0 | 0.0% |
| Business | 11 | 26.8% |
| Education | 0 | 0.0% |
| Literature & Languages | 0 | 0.0% |
| Liberal Arts & History | 19 | 46.3% |
| Visual & Performing Arts | 0 | 0.0% |
| Communications | 0 | 0.0% |
| Arts & Humanities | 0 | 0.0% |
| Total | 41 | 100.0% |
Transportation & Commute in Lopezville
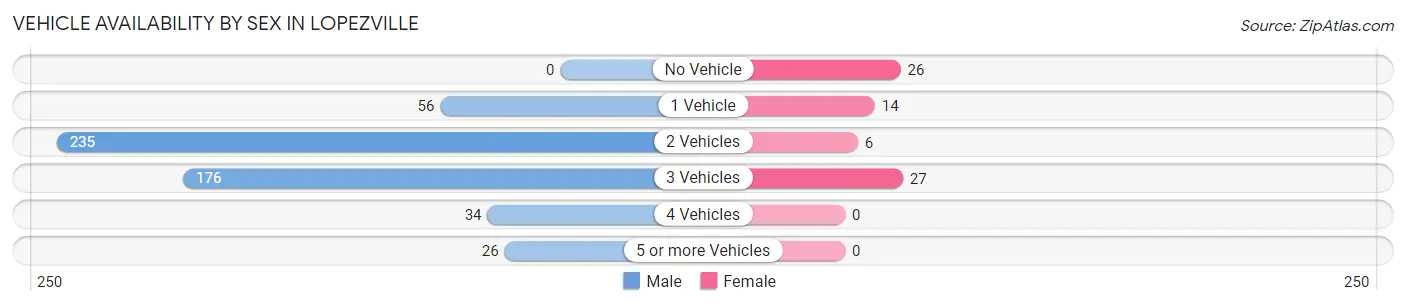
Vehicle Availability by Sex in Lopezville
The most prevalent vehicle ownership categories in Lopezville are males with 2 vehicles (235, accounting for 44.6%) and females with 2 vehicles (6, making up 321.9%).
| Vehicles Available | Male | Female |
| No Vehicle | 0 (0.0%) | 26 (35.6%) |
| 1 Vehicle | 56 (10.6%) | 14 (19.2%) |
| 2 Vehicles | 235 (44.6%) | 6 (8.2%) |
| 3 Vehicles | 176 (33.4%) | 27 (37.0%) |
| 4 Vehicles | 34 (6.5%) | 0 (0.0%) |
| 5 or more Vehicles | 26 (4.9%) | 0 (0.0%) |
| Total | 527 (100.0%) | 73 (100.0%) |
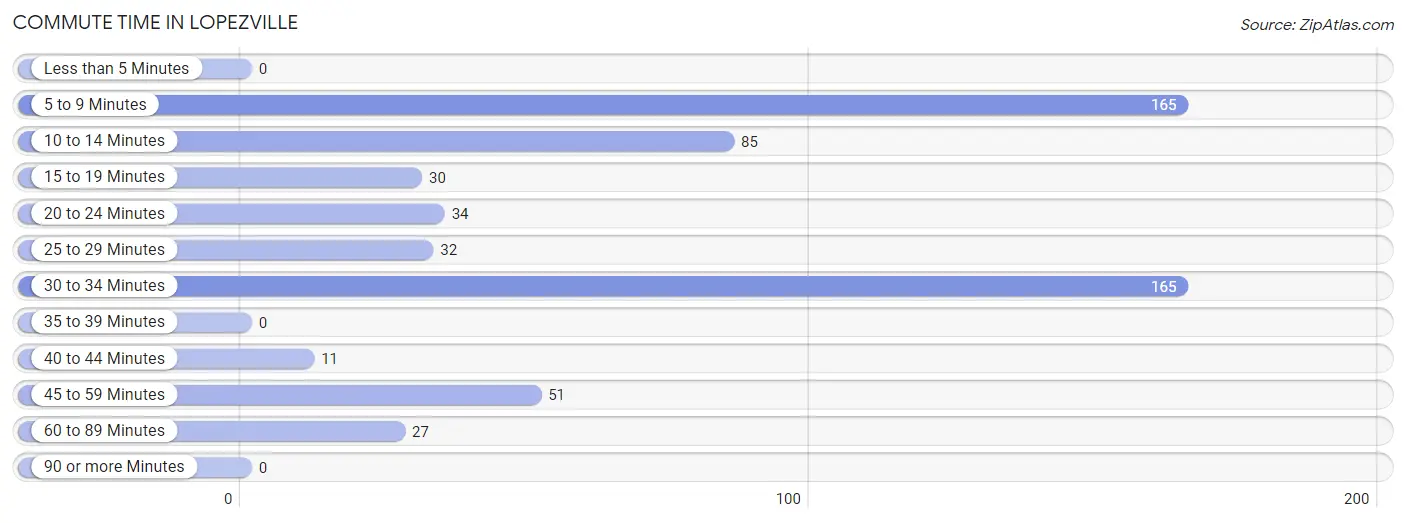
Commute Time in Lopezville
The most frequently occuring commute durations in Lopezville are 5 to 9 minutes (165 commuters, 27.5%), 30 to 34 minutes (165 commuters, 27.5%), and 10 to 14 minutes (85 commuters, 14.2%).
| Commute Time | # Commuters | % Commuters |
| Less than 5 Minutes | 0 | 0.0% |
| 5 to 9 Minutes | 165 | 27.5% |
| 10 to 14 Minutes | 85 | 14.2% |
| 15 to 19 Minutes | 30 | 5.0% |
| 20 to 24 Minutes | 34 | 5.7% |
| 25 to 29 Minutes | 32 | 5.3% |
| 30 to 34 Minutes | 165 | 27.5% |
| 35 to 39 Minutes | 0 | 0.0% |
| 40 to 44 Minutes | 11 | 1.8% |
| 45 to 59 Minutes | 51 | 8.5% |
| 60 to 89 Minutes | 27 | 4.5% |
| 90 or more Minutes | 0 | 0.0% |
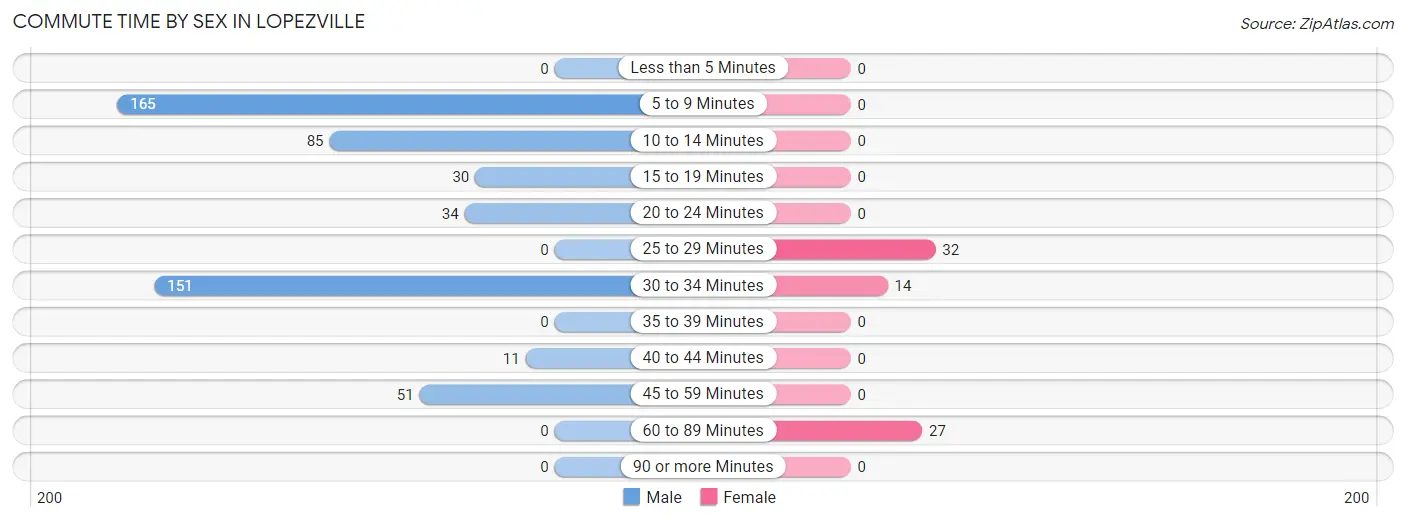
Commute Time by Sex in Lopezville
The most common commute times in Lopezville are 5 to 9 minutes (165 commuters, 31.3%) for males and 25 to 29 minutes (32 commuters, 43.8%) for females.
| Commute Time | Male | Female |
| Less than 5 Minutes | 0 (0.0%) | 0 (0.0%) |
| 5 to 9 Minutes | 165 (31.3%) | 0 (0.0%) |
| 10 to 14 Minutes | 85 (16.1%) | 0 (0.0%) |
| 15 to 19 Minutes | 30 (5.7%) | 0 (0.0%) |
| 20 to 24 Minutes | 34 (6.5%) | 0 (0.0%) |
| 25 to 29 Minutes | 0 (0.0%) | 32 (43.8%) |
| 30 to 34 Minutes | 151 (28.6%) | 14 (19.2%) |
| 35 to 39 Minutes | 0 (0.0%) | 0 (0.0%) |
| 40 to 44 Minutes | 11 (2.1%) | 0 (0.0%) |
| 45 to 59 Minutes | 51 (9.7%) | 0 (0.0%) |
| 60 to 89 Minutes | 0 (0.0%) | 27 (37.0%) |
| 90 or more Minutes | 0 (0.0%) | 0 (0.0%) |
Time of Departure to Work by Sex in Lopezville
The most frequent times of departure to work in Lopezville are 6:00 AM to 6:29 AM (191, 36.2%) for males and 8:00 AM to 8:29 AM (46, 63.0%) for females.
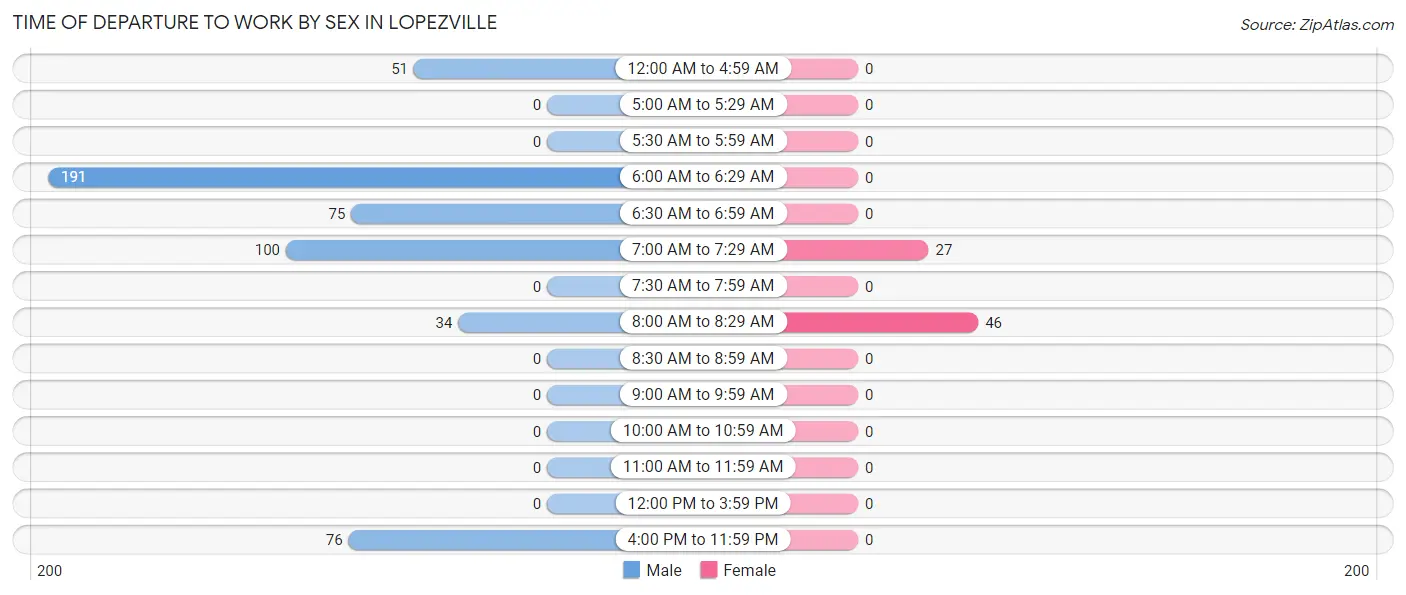
| Time of Departure | Male | Female |
| 12:00 AM to 4:59 AM | 51 (9.7%) | 0 (0.0%) |
| 5:00 AM to 5:29 AM | 0 (0.0%) | 0 (0.0%) |
| 5:30 AM to 5:59 AM | 0 (0.0%) | 0 (0.0%) |
| 6:00 AM to 6:29 AM | 191 (36.2%) | 0 (0.0%) |
| 6:30 AM to 6:59 AM | 75 (14.2%) | 0 (0.0%) |
| 7:00 AM to 7:29 AM | 100 (19.0%) | 27 (37.0%) |
| 7:30 AM to 7:59 AM | 0 (0.0%) | 0 (0.0%) |
| 8:00 AM to 8:29 AM | 34 (6.5%) | 46 (63.0%) |
| 8:30 AM to 8:59 AM | 0 (0.0%) | 0 (0.0%) |
| 9:00 AM to 9:59 AM | 0 (0.0%) | 0 (0.0%) |
| 10:00 AM to 10:59 AM | 0 (0.0%) | 0 (0.0%) |
| 11:00 AM to 11:59 AM | 0 (0.0%) | 0 (0.0%) |
| 12:00 PM to 3:59 PM | 0 (0.0%) | 0 (0.0%) |
| 4:00 PM to 11:59 PM | 76 (14.4%) | 0 (0.0%) |
| Total | 527 (100.0%) | 73 (100.0%) |
Housing Occupancy in Lopezville
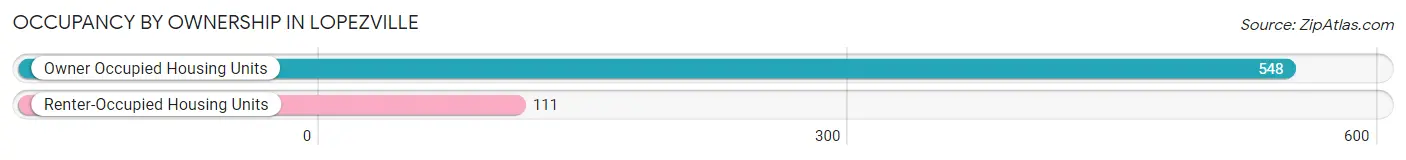
Occupancy by Ownership in Lopezville
Of the total 659 dwellings in Lopezville, owner-occupied units account for 548 (83.2%), while renter-occupied units make up 111 (16.8%).
| Occupancy | # Housing Units | % Housing Units |
| Owner Occupied Housing Units | 548 | 83.2% |
| Renter-Occupied Housing Units | 111 | 16.8% |
| Total Occupied Housing Units | 659 | 100.0% |
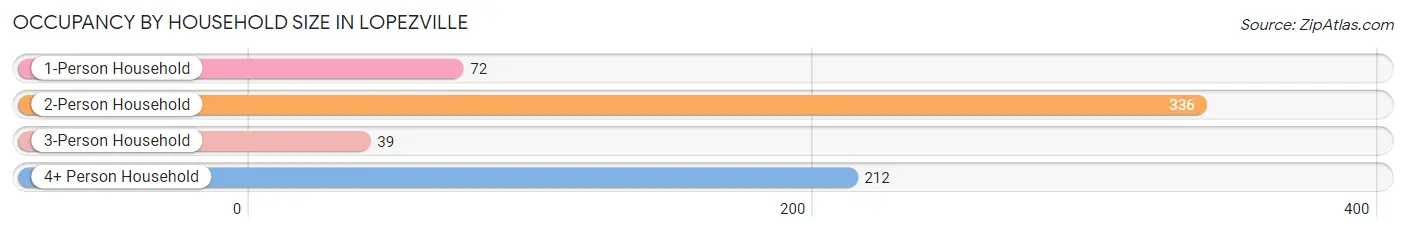
Occupancy by Household Size in Lopezville
| Household Size | # Housing Units | % Housing Units |
| 1-Person Household | 72 | 10.9% |
| 2-Person Household | 336 | 51.0% |
| 3-Person Household | 39 | 5.9% |
| 4+ Person Household | 212 | 32.2% |
| Total Housing Units | 659 | 100.0% |
Occupancy by Ownership by Household Size in Lopezville
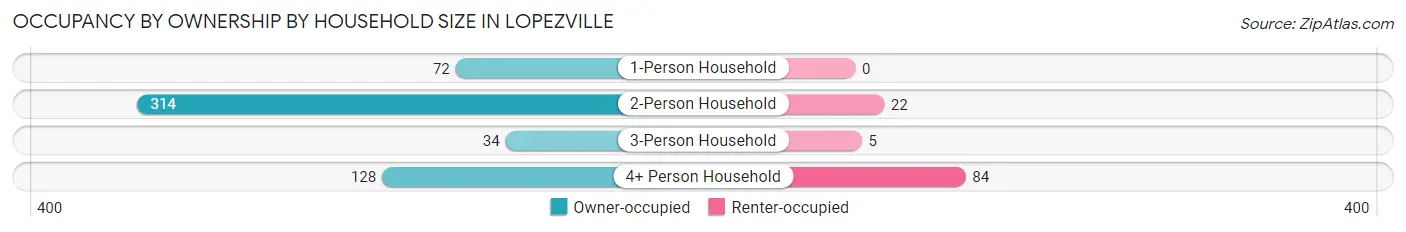
| Household Size | Owner-occupied | Renter-occupied |
| 1-Person Household | 72 (100.0%) | 0 (0.0%) |
| 2-Person Household | 314 (93.4%) | 22 (6.6%) |
| 3-Person Household | 34 (87.2%) | 5 (12.8%) |
| 4+ Person Household | 128 (60.4%) | 84 (39.6%) |
| Total Housing Units | 548 (83.2%) | 111 (16.8%) |
Occupancy by Educational Attainment in Lopezville
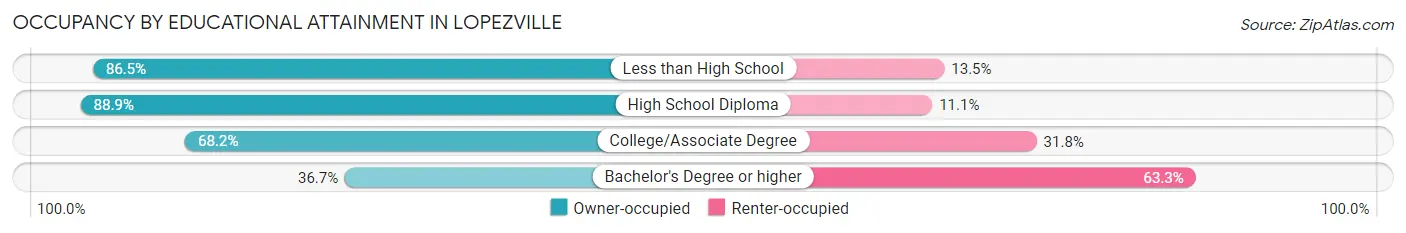
| Household Size | Owner-occupied | Renter-occupied |
| Less than High School | 467 (86.5%) | 73 (13.5%) |
| High School Diploma | 40 (88.9%) | 5 (11.1%) |
| College/Associate Degree | 30 (68.2%) | 14 (31.8%) |
| Bachelor's Degree or higher | 11 (36.7%) | 19 (63.3%) |
Occupancy by Age of Householder in Lopezville
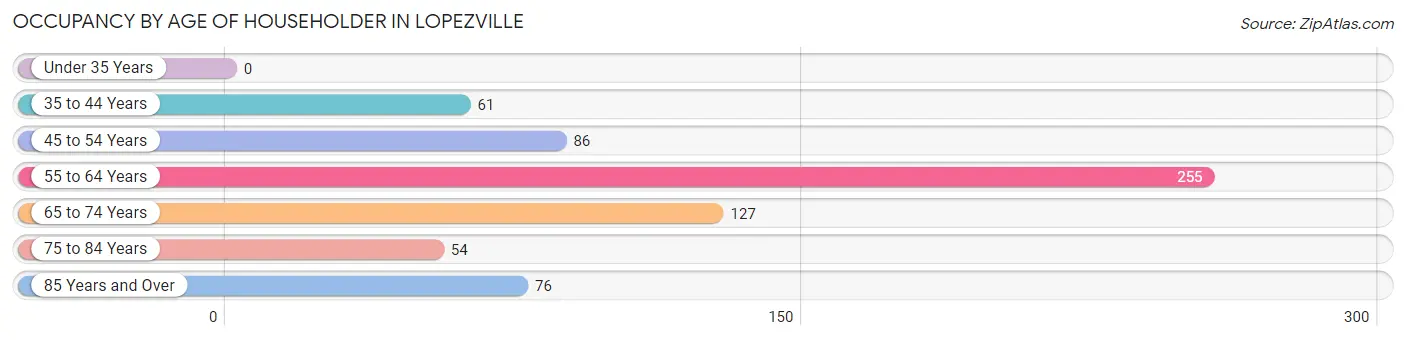
| Age Bracket | # Households | % Households |
| Under 35 Years | 0 | 0.0% |
| 35 to 44 Years | 61 | 9.3% |
| 45 to 54 Years | 86 | 13.1% |
| 55 to 64 Years | 255 | 38.7% |
| 65 to 74 Years | 127 | 19.3% |
| 75 to 84 Years | 54 | 8.2% |
| 85 Years and Over | 76 | 11.5% |
| Total | 659 | 100.0% |
Housing Finances in Lopezville
Median Income by Occupancy in Lopezville
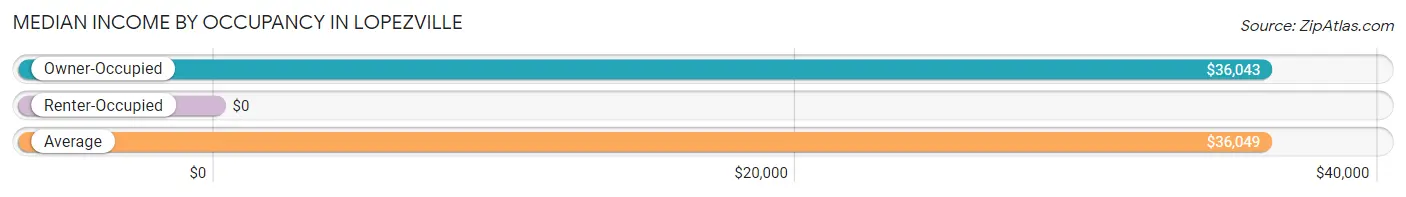
| Occupancy Type | # Households | Median Income |
| Owner-Occupied | 548 (83.2%) | $36,043 |
| Renter-Occupied | 111 (16.8%) | $0 |
| Average | 659 (100.0%) | $36,049 |
Occupancy by Householder Income Bracket in Lopezville
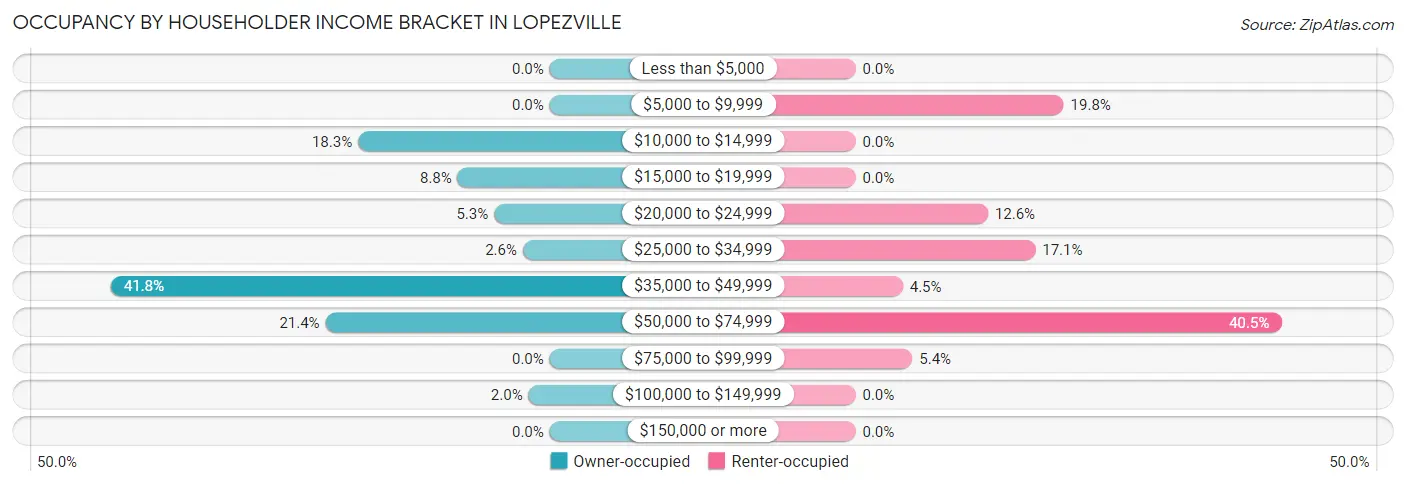
| Income Bracket | Owner-occupied | Renter-occupied |
| Less than $5,000 | 0 (0.0%) | 0 (0.0%) |
| $5,000 to $9,999 | 0 (0.0%) | 22 (19.8%) |
| $10,000 to $14,999 | 100 (18.2%) | 0 (0.0%) |
| $15,000 to $19,999 | 48 (8.8%) | 0 (0.0%) |
| $20,000 to $24,999 | 29 (5.3%) | 14 (12.6%) |
| $25,000 to $34,999 | 14 (2.5%) | 19 (17.1%) |
| $35,000 to $49,999 | 229 (41.8%) | 5 (4.5%) |
| $50,000 to $74,999 | 117 (21.3%) | 45 (40.5%) |
| $75,000 to $99,999 | 0 (0.0%) | 6 (5.4%) |
| $100,000 to $149,999 | 11 (2.0%) | 0 (0.0%) |
| $150,000 or more | 0 (0.0%) | 0 (0.0%) |
| Total | 548 (100.0%) | 111 (100.0%) |
Monthly Housing Cost Tiers in Lopezville
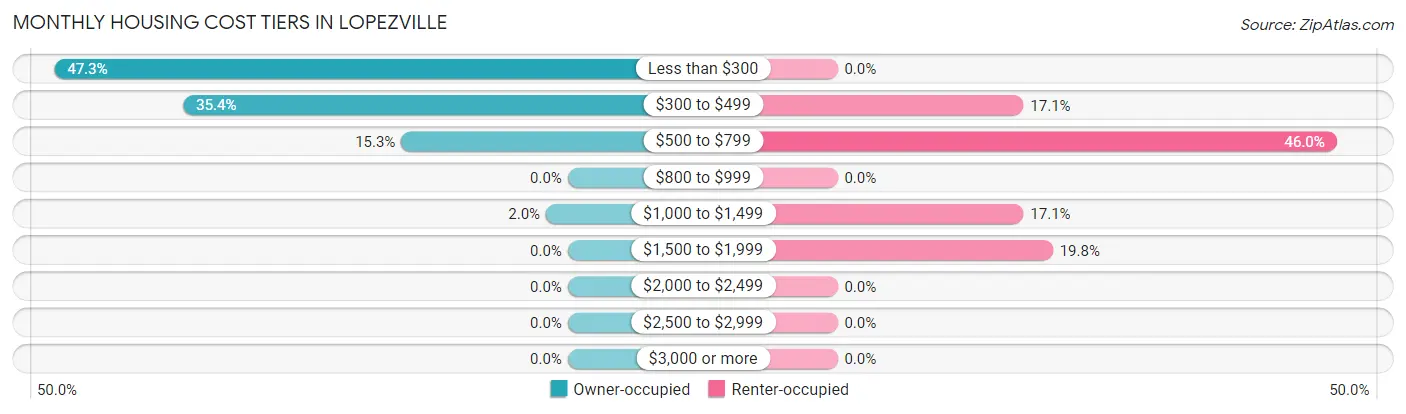
| Monthly Cost | Owner-occupied | Renter-occupied |
| Less than $300 | 259 (47.3%) | 0 (0.0%) |
| $300 to $499 | 194 (35.4%) | 19 (17.1%) |
| $500 to $799 | 84 (15.3%) | 51 (46.0%) |
| $800 to $999 | 0 (0.0%) | 0 (0.0%) |
| $1,000 to $1,499 | 11 (2.0%) | 19 (17.1%) |
| $1,500 to $1,999 | 0 (0.0%) | 22 (19.8%) |
| $2,000 to $2,499 | 0 (0.0%) | 0 (0.0%) |
| $2,500 to $2,999 | 0 (0.0%) | 0 (0.0%) |
| $3,000 or more | 0 (0.0%) | 0 (0.0%) |
| Total | 548 (100.0%) | 111 (100.0%) |
Physical Housing Characteristics in Lopezville
Housing Structures in Lopezville
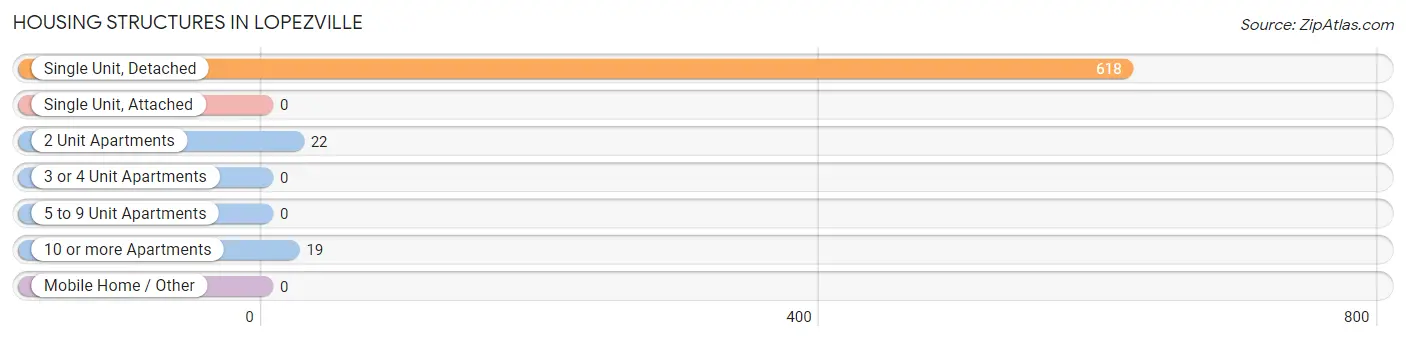
| Structure Type | # Housing Units | % Housing Units |
| Single Unit, Detached | 618 | 93.8% |
| Single Unit, Attached | 0 | 0.0% |
| 2 Unit Apartments | 22 | 3.3% |
| 3 or 4 Unit Apartments | 0 | 0.0% |
| 5 to 9 Unit Apartments | 0 | 0.0% |
| 10 or more Apartments | 19 | 2.9% |
| Mobile Home / Other | 0 | 0.0% |
| Total | 659 | 100.0% |
Housing Structures by Occupancy in Lopezville
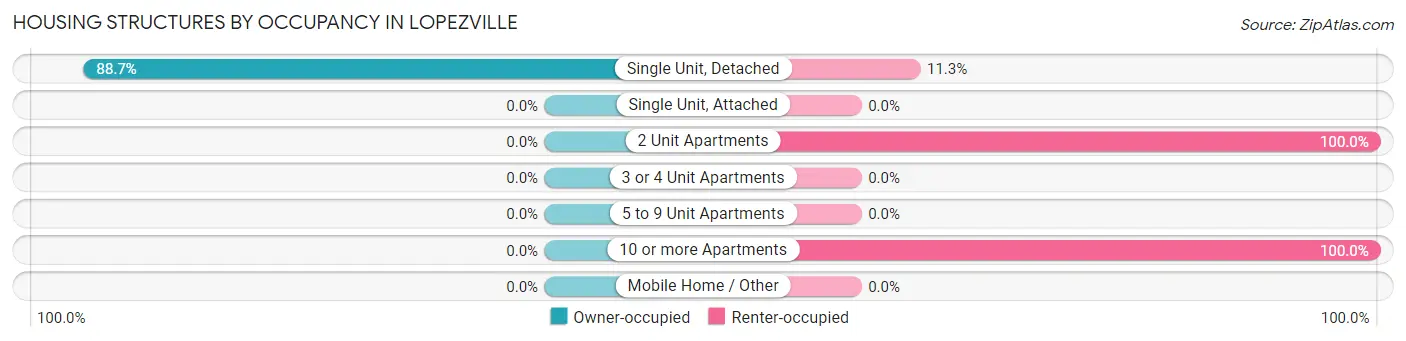
| Structure Type | Owner-occupied | Renter-occupied |
| Single Unit, Detached | 548 (88.7%) | 70 (11.3%) |
| Single Unit, Attached | 0 (0.0%) | 0 (0.0%) |
| 2 Unit Apartments | 0 (0.0%) | 22 (100.0%) |
| 3 or 4 Unit Apartments | 0 (0.0%) | 0 (0.0%) |
| 5 to 9 Unit Apartments | 0 (0.0%) | 0 (0.0%) |
| 10 or more Apartments | 0 (0.0%) | 19 (100.0%) |
| Mobile Home / Other | 0 (0.0%) | 0 (0.0%) |
| Total | 548 (83.2%) | 111 (16.8%) |
Housing Structures by Number of Rooms in Lopezville
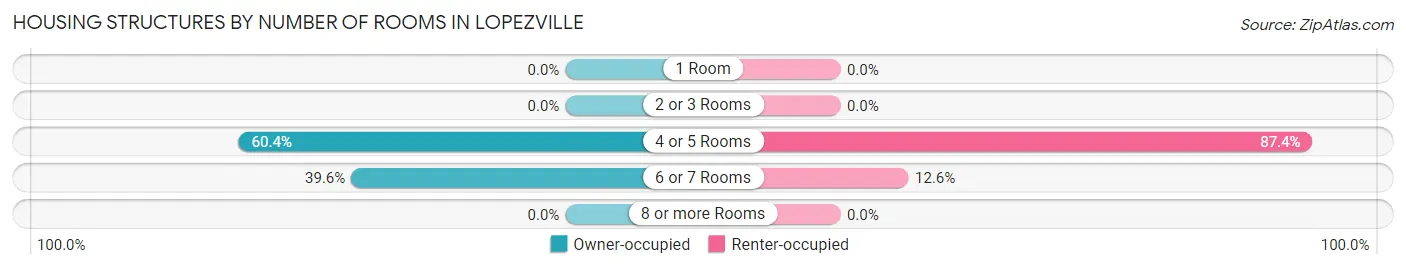
| Number of Rooms | Owner-occupied | Renter-occupied |
| 1 Room | 0 (0.0%) | 0 (0.0%) |
| 2 or 3 Rooms | 0 (0.0%) | 0 (0.0%) |
| 4 or 5 Rooms | 331 (60.4%) | 97 (87.4%) |
| 6 or 7 Rooms | 217 (39.6%) | 14 (12.6%) |
| 8 or more Rooms | 0 (0.0%) | 0 (0.0%) |
| Total | 548 (100.0%) | 111 (100.0%) |
Housing Structure by Heating Type in Lopezville
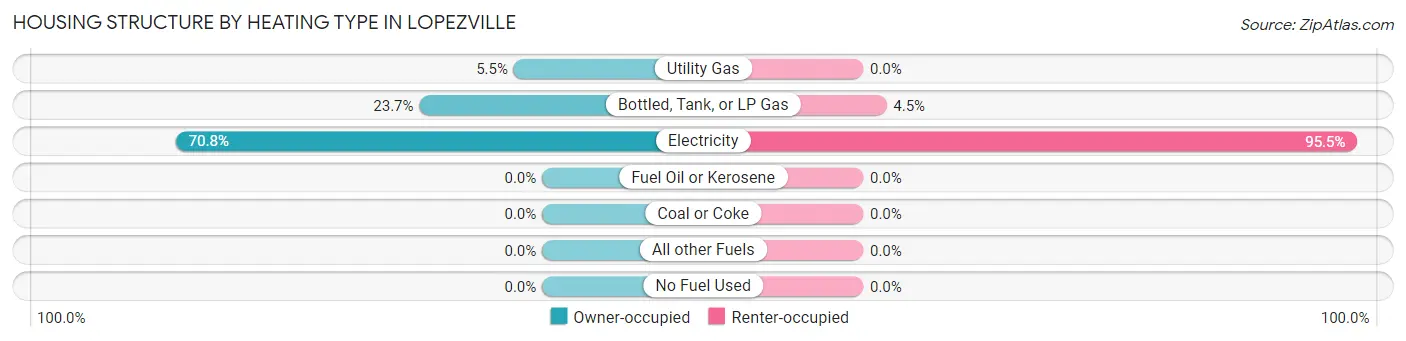
| Heating Type | Owner-occupied | Renter-occupied |
| Utility Gas | 30 (5.5%) | 0 (0.0%) |
| Bottled, Tank, or LP Gas | 130 (23.7%) | 5 (4.5%) |
| Electricity | 388 (70.8%) | 106 (95.5%) |
| Fuel Oil or Kerosene | 0 (0.0%) | 0 (0.0%) |
| Coal or Coke | 0 (0.0%) | 0 (0.0%) |
| All other Fuels | 0 (0.0%) | 0 (0.0%) |
| No Fuel Used | 0 (0.0%) | 0 (0.0%) |
| Total | 548 (100.0%) | 111 (100.0%) |
Household Vehicle Usage in Lopezville
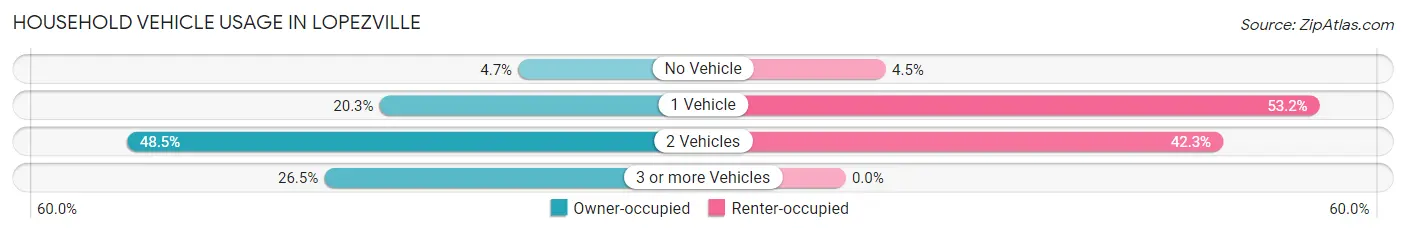
| Vehicles per Household | Owner-occupied | Renter-occupied |
| No Vehicle | 26 (4.7%) | 5 (4.5%) |
| 1 Vehicle | 111 (20.3%) | 59 (53.1%) |
| 2 Vehicles | 266 (48.5%) | 47 (42.3%) |
| 3 or more Vehicles | 145 (26.5%) | 0 (0.0%) |
| Total | 548 (100.0%) | 111 (100.0%) |
Real Estate & Mortgages in Lopezville
Real Estate and Mortgage Overview in Lopezville
| Characteristic | Without Mortgage | With Mortgage |
| Housing Units | 537 | 11 |
| Median Property Value | $65,300 | $0 |
| Median Household Income | $35,974 | $0 |
| Monthly Housing Costs | $303 | $0 |
| Real Estate Taxes | - | - |
Property Value by Mortgage Status in Lopezville
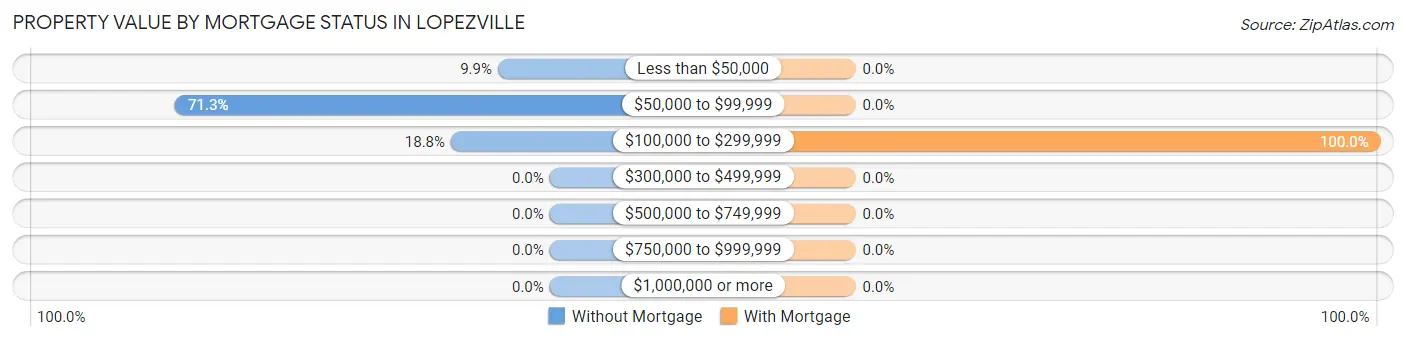
| Property Value | Without Mortgage | With Mortgage |
| Less than $50,000 | 53 (9.9%) | 0 (0.0%) |
| $50,000 to $99,999 | 383 (71.3%) | 0 (0.0%) |
| $100,000 to $299,999 | 101 (18.8%) | 11 (100.0%) |
| $300,000 to $499,999 | 0 (0.0%) | 0 (0.0%) |
| $500,000 to $749,999 | 0 (0.0%) | 0 (0.0%) |
| $750,000 to $999,999 | 0 (0.0%) | 0 (0.0%) |
| $1,000,000 or more | 0 (0.0%) | 0 (0.0%) |
| Total | 537 (100.0%) | 11 (100.0%) |
Household Income by Mortgage Status in Lopezville
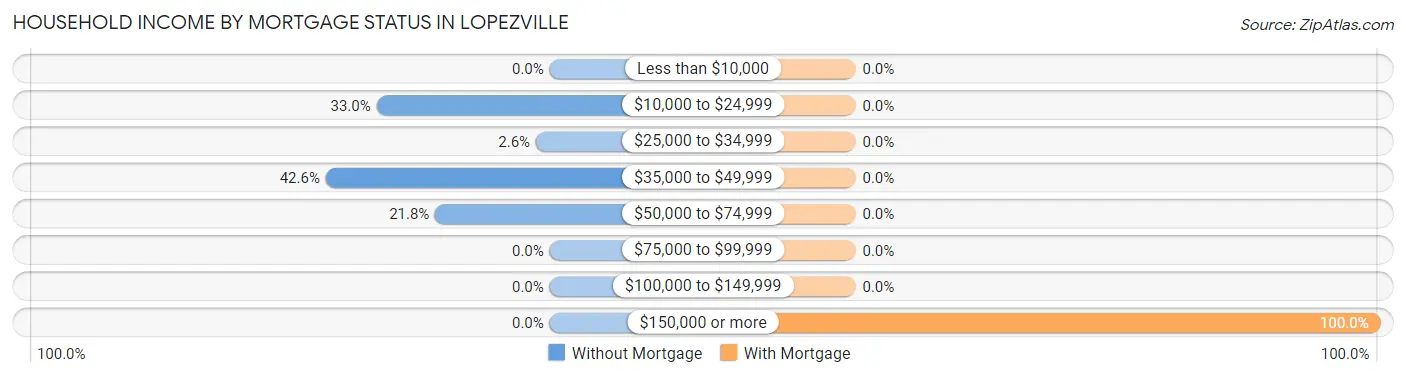
| Household Income | Without Mortgage | With Mortgage |
| Less than $10,000 | 0 (0.0%) | 0 (0.0%) |
| $10,000 to $24,999 | 177 (33.0%) | 0 (0.0%) |
| $25,000 to $34,999 | 14 (2.6%) | 0 (0.0%) |
| $35,000 to $49,999 | 229 (42.6%) | 0 (0.0%) |
| $50,000 to $74,999 | 117 (21.8%) | 0 (0.0%) |
| $75,000 to $99,999 | 0 (0.0%) | 0 (0.0%) |
| $100,000 to $149,999 | 0 (0.0%) | 0 (0.0%) |
| $150,000 or more | 0 (0.0%) | 11 (100.0%) |
| Total | 537 (100.0%) | 11 (100.0%) |
Property Value to Household Income Ratio in Lopezville
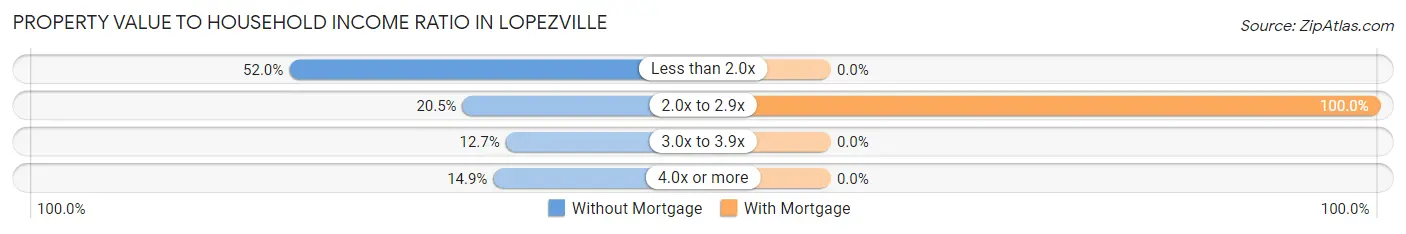
| Value-to-Income Ratio | Without Mortgage | With Mortgage |
| Less than 2.0x | 279 (52.0%) | 0 (0.0%) |
| 2.0x to 2.9x | 110 (20.5%) | 11 (100.0%) |
| 3.0x to 3.9x | 68 (12.7%) | 0 (0.0%) |
| 4.0x or more | 80 (14.9%) | 0 (0.0%) |
| Total | 537 (100.0%) | 11 (100.0%) |
Real Estate Taxes by Mortgage Status in Lopezville
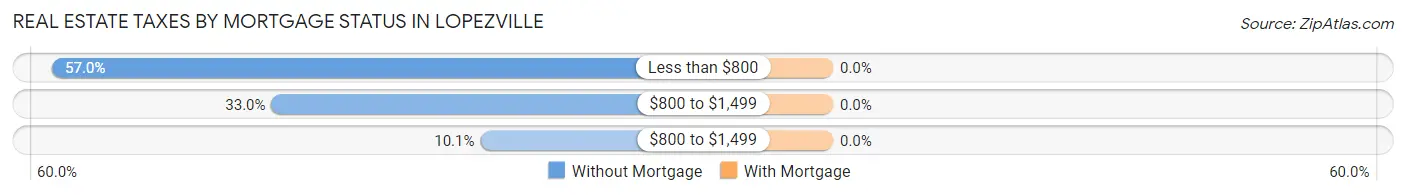
| Property Taxes | Without Mortgage | With Mortgage |
| Less than $800 | 306 (57.0%) | 0 (0.0%) |
| $800 to $1,499 | 177 (33.0%) | 0 (0.0%) |
| $800 to $1,499 | 54 (10.1%) | 0 (0.0%) |
| Total | 537 (100.0%) | 11 (100.0%) |
Health & Disability in Lopezville
Health Insurance Coverage by Age in Lopezville
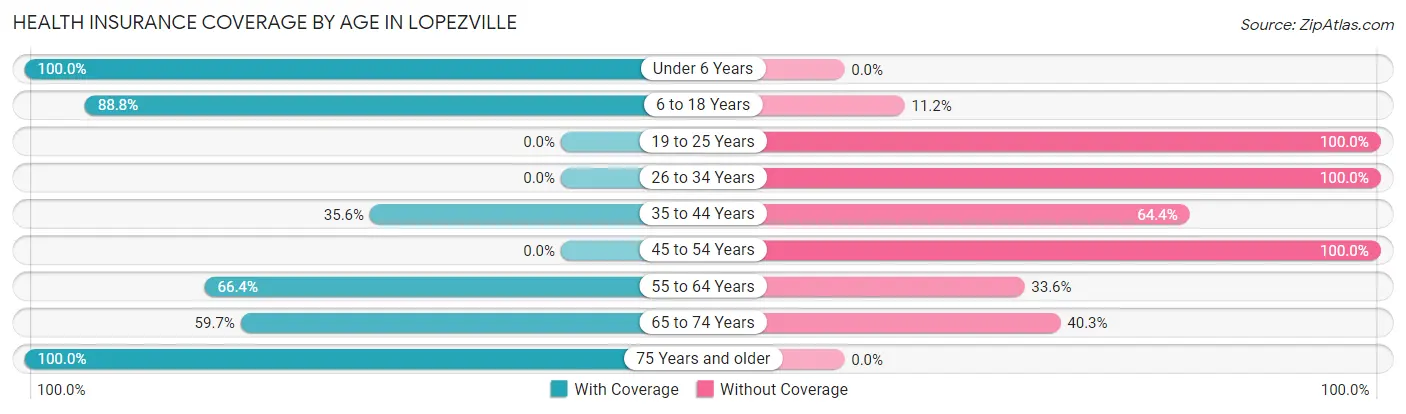
| Age Bracket | With Coverage | Without Coverage |
| Under 6 Years | 84 (100.0%) | 0 (0.0%) |
| 6 to 18 Years | 221 (88.8%) | 28 (11.2%) |
| 19 to 25 Years | 0 (0.0%) | 112 (100.0%) |
| 26 to 34 Years | 0 (0.0%) | 90 (100.0%) |
| 35 to 44 Years | 78 (35.6%) | 141 (64.4%) |
| 45 to 54 Years | 0 (0.0%) | 157 (100.0%) |
| 55 to 64 Years | 273 (66.4%) | 138 (33.6%) |
| 65 to 74 Years | 209 (59.7%) | 141 (40.3%) |
| 75 Years and older | 173 (100.0%) | 0 (0.0%) |
| Total | 1,038 (56.3%) | 807 (43.7%) |
Health Insurance Coverage by Citizenship Status in Lopezville
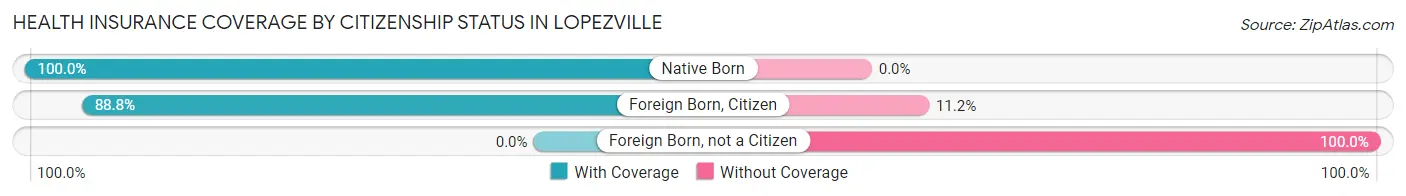
| Citizenship Status | With Coverage | Without Coverage |
| Native Born | 84 (100.0%) | 0 (0.0%) |
| Foreign Born, Citizen | 221 (88.8%) | 28 (11.2%) |
| Foreign Born, not a Citizen | 0 (0.0%) | 112 (100.0%) |
Health Insurance Coverage by Household Income in Lopezville
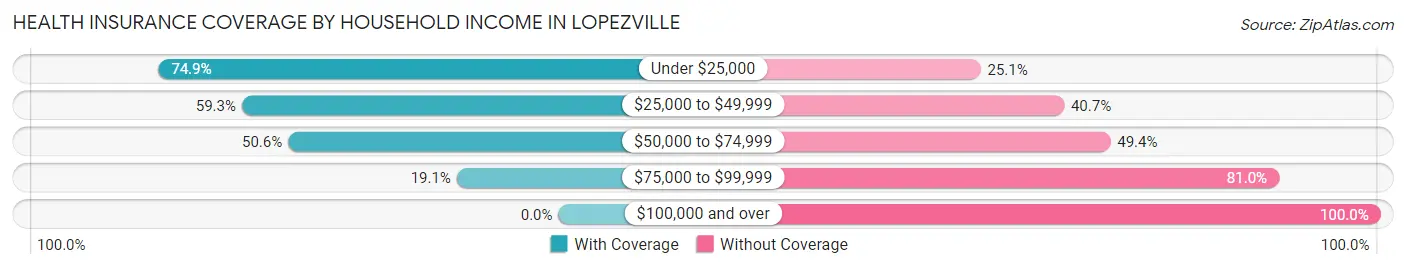
| Household Income | With Coverage | Without Coverage |
| Under $25,000 | 293 (74.9%) | 98 (25.1%) |
| $25,000 to $49,999 | 309 (59.3%) | 212 (40.7%) |
| $50,000 to $74,999 | 432 (50.6%) | 421 (49.4%) |
| $75,000 to $99,999 | 4 (19.1%) | 17 (80.9%) |
| $100,000 and over | 0 (0.0%) | 59 (100.0%) |
Public vs Private Health Insurance Coverage by Age in Lopezville
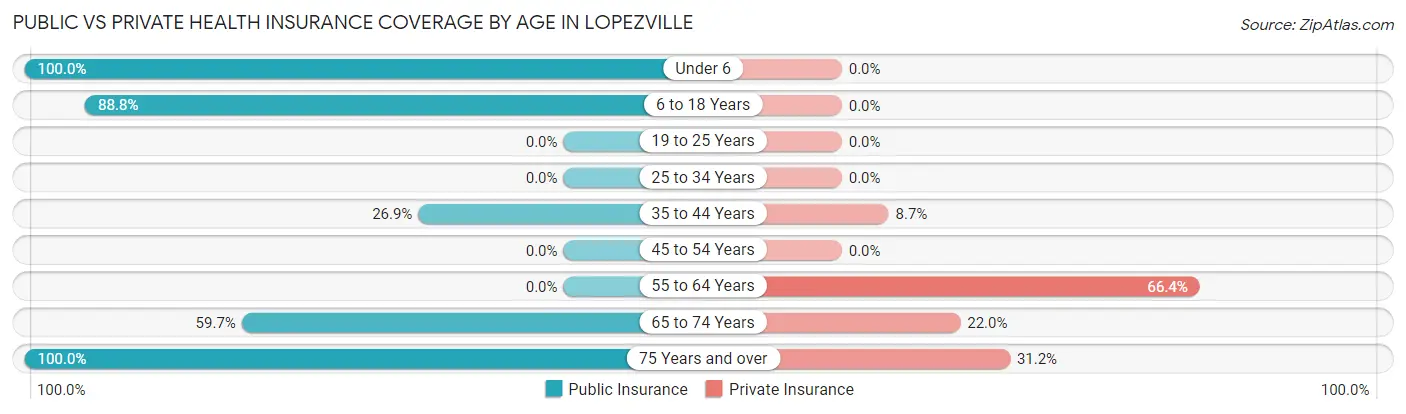
| Age Bracket | Public Insurance | Private Insurance |
| Under 6 | 84 (100.0%) | 0 (0.0%) |
| 6 to 18 Years | 221 (88.8%) | 0 (0.0%) |
| 19 to 25 Years | 0 (0.0%) | 0 (0.0%) |
| 25 to 34 Years | 0 (0.0%) | 0 (0.0%) |
| 35 to 44 Years | 59 (26.9%) | 19 (8.7%) |
| 45 to 54 Years | 0 (0.0%) | 0 (0.0%) |
| 55 to 64 Years | 0 (0.0%) | 273 (66.4%) |
| 65 to 74 Years | 209 (59.7%) | 77 (22.0%) |
| 75 Years and over | 173 (100.0%) | 54 (31.2%) |
| Total | 746 (40.4%) | 423 (22.9%) |
Disability Status by Sex by Age in Lopezville
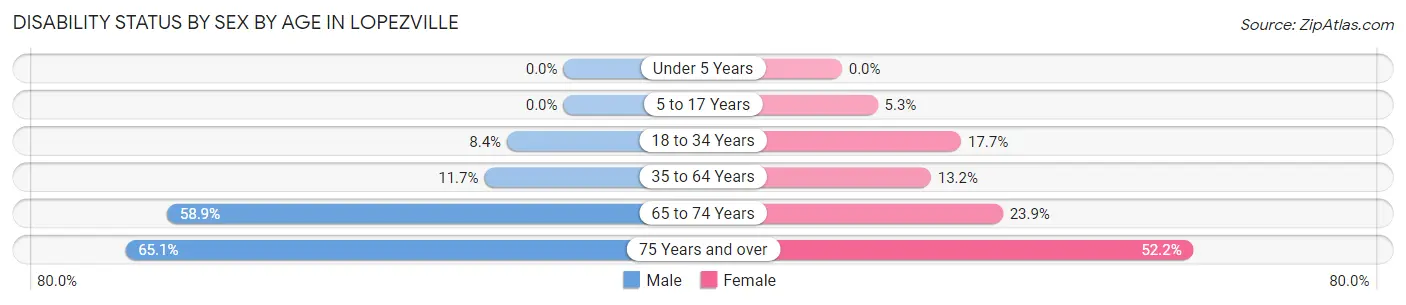
| Age Bracket | Male | Female |
| Under 5 Years | 0 (0.0%) | 0 (0.0%) |
| 5 to 17 Years | 0 (0.0%) | 5 (5.3%) |
| 18 to 34 Years | 15 (8.4%) | 17 (17.7%) |
| 35 to 64 Years | 64 (11.7%) | 32 (13.2%) |
| 65 to 74 Years | 73 (58.9%) | 54 (23.9%) |
| 75 Years and over | 54 (65.1%) | 47 (52.2%) |
Disability Class by Sex by Age in Lopezville
Disability Class: Hearing Difficulty
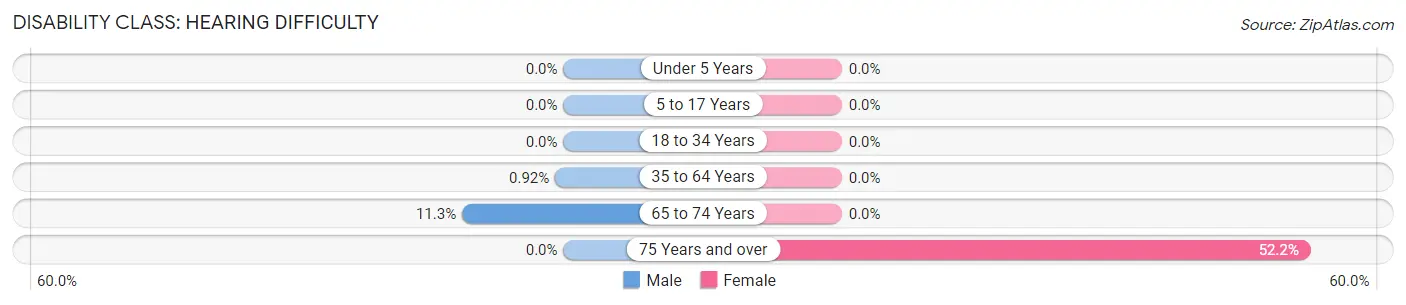
| Age Bracket | Male | Female |
| Under 5 Years | 0 (0.0%) | 0 (0.0%) |
| 5 to 17 Years | 0 (0.0%) | 0 (0.0%) |
| 18 to 34 Years | 0 (0.0%) | 0 (0.0%) |
| 35 to 64 Years | 5 (0.9%) | 0 (0.0%) |
| 65 to 74 Years | 14 (11.3%) | 0 (0.0%) |
| 75 Years and over | 0 (0.0%) | 47 (52.2%) |
Disability Class: Vision Difficulty
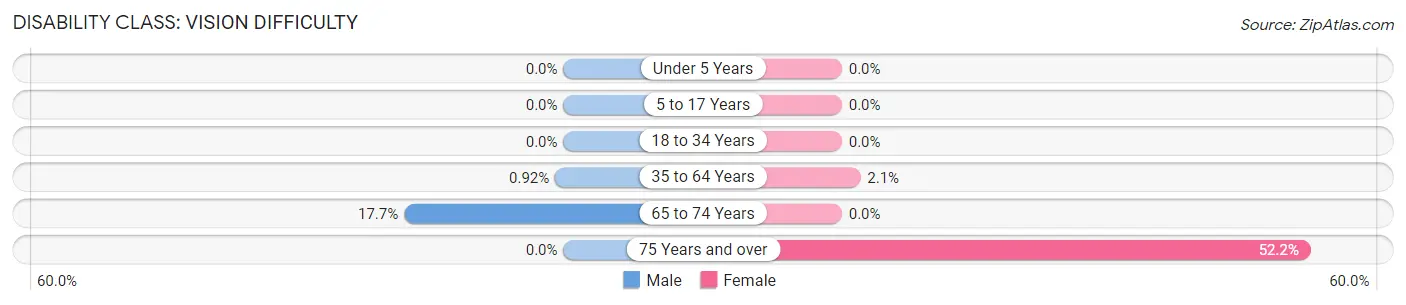
| Age Bracket | Male | Female |
| Under 5 Years | 0 (0.0%) | 0 (0.0%) |
| 5 to 17 Years | 0 (0.0%) | 0 (0.0%) |
| 18 to 34 Years | 0 (0.0%) | 0 (0.0%) |
| 35 to 64 Years | 5 (0.9%) | 5 (2.1%) |
| 65 to 74 Years | 22 (17.7%) | 0 (0.0%) |
| 75 Years and over | 0 (0.0%) | 47 (52.2%) |
Disability Class: Cognitive Difficulty
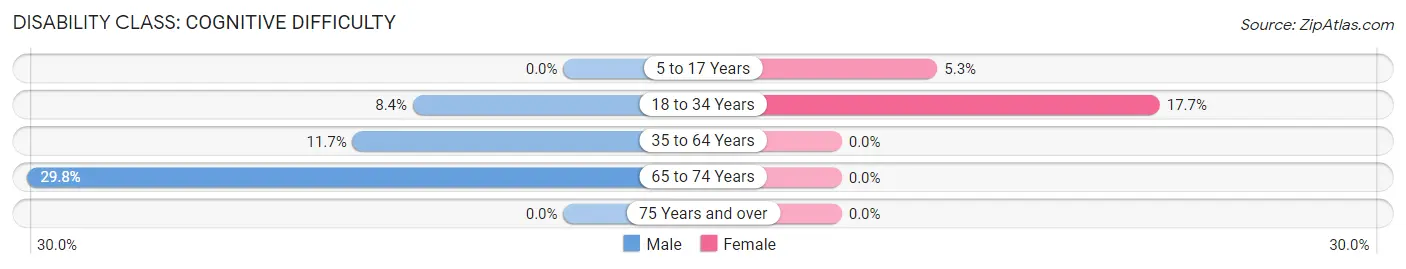
| Age Bracket | Male | Female |
| 5 to 17 Years | 0 (0.0%) | 5 (5.3%) |
| 18 to 34 Years | 15 (8.4%) | 17 (17.7%) |
| 35 to 64 Years | 64 (11.7%) | 0 (0.0%) |
| 65 to 74 Years | 37 (29.8%) | 0 (0.0%) |
| 75 Years and over | 0 (0.0%) | 0 (0.0%) |
Disability Class: Ambulatory Difficulty
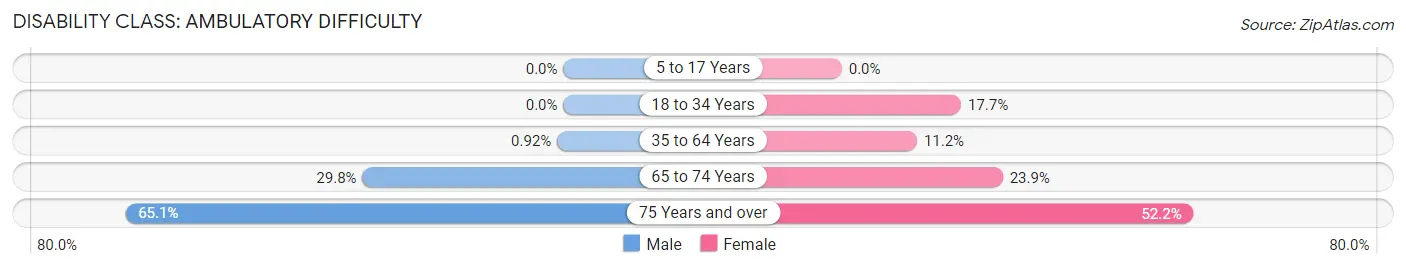
| Age Bracket | Male | Female |
| 5 to 17 Years | 0 (0.0%) | 0 (0.0%) |
| 18 to 34 Years | 0 (0.0%) | 17 (17.7%) |
| 35 to 64 Years | 5 (0.9%) | 27 (11.2%) |
| 65 to 74 Years | 37 (29.8%) | 54 (23.9%) |
| 75 Years and over | 54 (65.1%) | 47 (52.2%) |
Disability Class: Self-Care Difficulty
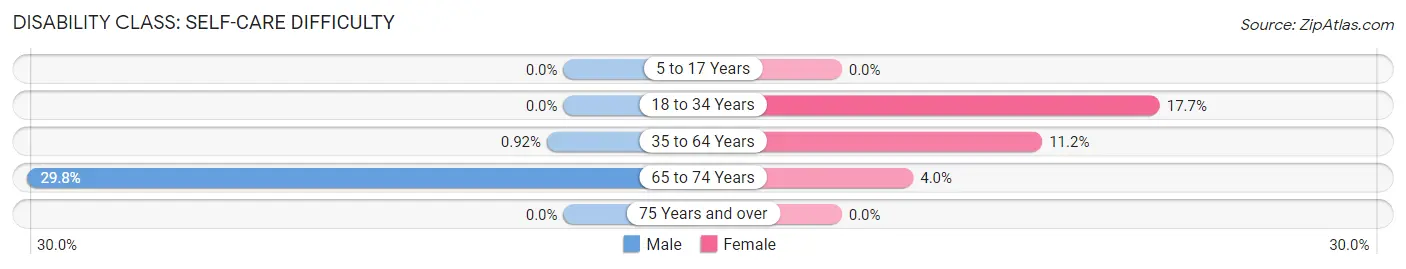
| Age Bracket | Male | Female |
| 5 to 17 Years | 0 (0.0%) | 0 (0.0%) |
| 18 to 34 Years | 0 (0.0%) | 17 (17.7%) |
| 35 to 64 Years | 5 (0.9%) | 27 (11.2%) |
| 65 to 74 Years | 37 (29.8%) | 9 (4.0%) |
| 75 Years and over | 0 (0.0%) | 0 (0.0%) |
Technology Access in Lopezville
Computing Device Access in Lopezville
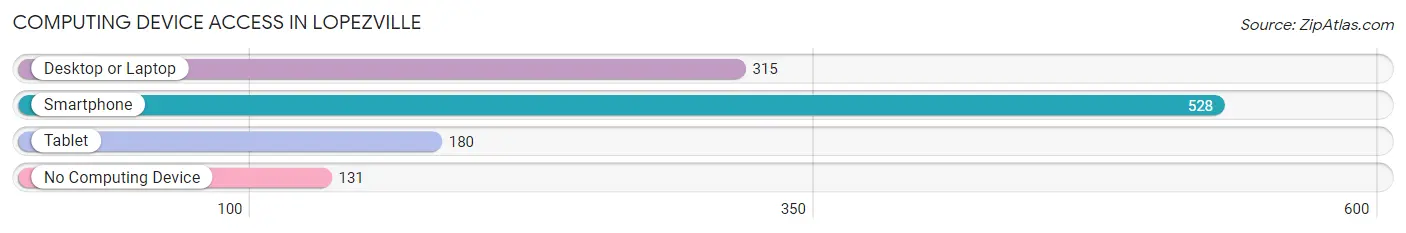
| Device Type | # Households | % Households |
| Desktop or Laptop | 315 | 47.8% |
| Smartphone | 528 | 80.1% |
| Tablet | 180 | 27.3% |
| No Computing Device | 131 | 19.9% |
| Total | 659 | 100.0% |
Internet Access in Lopezville
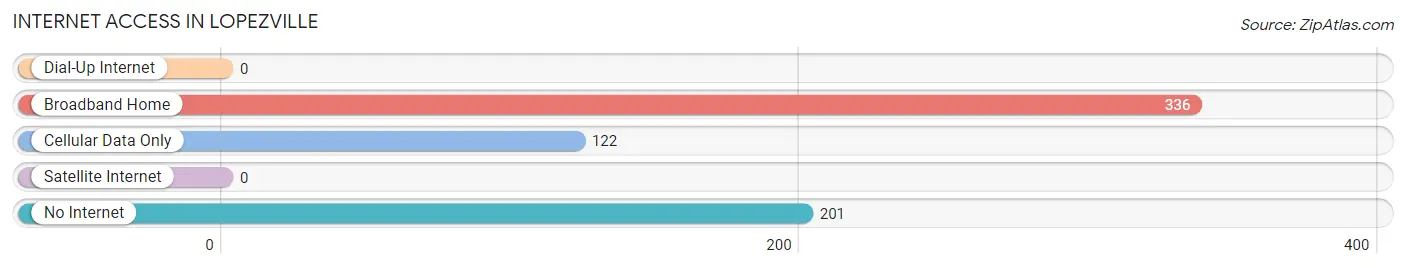
| Internet Type | # Households | % Households |
| Dial-Up Internet | 0 | 0.0% |
| Broadband Home | 336 | 51.0% |
| Cellular Data Only | 122 | 18.5% |
| Satellite Internet | 0 | 0.0% |
| No Internet | 201 | 30.5% |
| Total | 659 | 100.0% |
Lopezville Summary
Lopezville is a small unincorporated community located in Hidalgo County, Texas. It is situated on the banks of the Rio Grande, just south of the city of McAllen. The population of Lopezville was estimated to be around 1,000 in 2020.
History
Lopezville was founded in the late 19th century by a group of Mexican immigrants who had settled in the area. The town was named after the Lopez family, who were among the first settlers. The Lopez family had a large ranch in the area, and the town grew up around it.
In the early 20th century, Lopezville was a thriving agricultural community. The town was home to several large farms, and the local economy was largely based on the production of cotton, corn, and other crops.
In the 1950s, the town began to decline as the local economy shifted away from agriculture. Many of the town's residents moved away in search of better economic opportunities. By the 1970s, Lopezville had become a small, quiet community.
Geography
Lopezville is located in Hidalgo County, Texas, on the banks of the Rio Grande. The town is situated about 10 miles south of the city of McAllen. The terrain in the area is mostly flat, with some rolling hills. The climate is subtropical, with hot summers and mild winters.
Economy
The economy of Lopezville is largely based on agriculture. The town is home to several large farms, which produce cotton, corn, and other crops. The local economy also relies on tourism, as the town is a popular destination for birdwatchers and other nature enthusiasts.
In recent years, Lopezville has seen an increase in economic activity due to the growth of the nearby city of McAllen. The town is home to several small businesses, including restaurants, shops, and other services.
Demographics
As of 2020, the population of Lopezville was estimated to be around 1,000. The town is predominantly Hispanic, with a large majority of the population being of Mexican descent. The median household income in Lopezville is around $30,000, and the poverty rate is around 20%.
Conclusion
Lopezville is a small unincorporated community located in Hidalgo County, Texas. It was founded in the late 19th century by a group of Mexican immigrants, and the town was named after the Lopez family, who were among the first settlers. The local economy is largely based on agriculture, and the town is also a popular destination for birdwatchers and other nature enthusiasts. The population of Lopezville is predominantly Hispanic, with a large majority of the population being of Mexican descent. The median household income in Lopezville is around $30,000, and the poverty rate is around 20%.
Common Questions
What is Per Capita Income in Lopezville?
Per Capita income in Lopezville is $14,339.
What is the Median Family Income in Lopezville?
Median Family Income in Lopezville is $36,759.
What is the Median Household income in Lopezville?
Median Household Income in Lopezville is $36,049.
What is Income or Wage Gap in Lopezville?
Income or Wage Gap in Lopezville is 73.5%.
Women in Lopezville earn 26.5 cents for every dollar earned by a man.
What is Family Income Deficit in Lopezville?
Family Income Deficit in Lopezville is $4,076.
Families that are below poverty line in Lopezville earn $4,076 less on average than the poverty threshold level.
What is Inequality or Gini Index in Lopezville?
Inequality or Gini Index in Lopezville is 0.32.
What is the Total Population of Lopezville?
Total Population of Lopezville is 1,845.
What is the Total Male Population of Lopezville?
Total Male Population of Lopezville is 1,013.
What is the Total Female Population of Lopezville?
Total Female Population of Lopezville is 832.
What is the Ratio of Males per 100 Females in Lopezville?
There are 121.75 Males per 100 Females in Lopezville.
What is the Ratio of Females per 100 Males in Lopezville?
There are 82.13 Females per 100 Males in Lopezville.
What is the Median Population Age in Lopezville?
Median Population Age in Lopezville is 58.2 Years.
What is the Average Family Size in Lopezville
Average Family Size in Lopezville is 3.1 People.
What is the Average Household Size in Lopezville
Average Household Size in Lopezville is 2.8 People.
How Large is the Labor Force in Lopezville?
There are 748 People in the Labor Forcein in Lopezville.
What is the Percentage of People in the Labor Force in Lopezville?
47.2% of People are in the Labor Force in Lopezville.
What is the Unemployment Rate in Lopezville?
Unemployment Rate in Lopezville is 13.5%.